Madison Metropolitan Sewerage District Adaptive Management Plan
|
|
|
- Archibald Chase
- 5 years ago
- Views:
Transcription

1 Madison Metropolitan Sewerage District Adaptive Management Plan December 17, 2015 Draft 1
2 Table of Contents I. Introduction and Background... 6 Meeting DNR Adaptive Management Planning Elements... 9 II. Eligibility for Adaptive Management Watershed Background and Current Conditions...17 Part 1: Watershed Description and Inventory...17 General...17 Municipal Jurisdictions in the Yahara Watershed...19 Phosphorus Source Area Identification...19 Watershed Inventory...28 Part 2: Current Phosphorus Loads and Load Reduction Targets...35 General...36 Point Sources - Current Phosphorus Loads...36 Nonpoint Sources - Current Phosphorus Loads...37 MS4s Current Phosphorus Loads Nonpermitted Urban and Background-Current Phosphorus Loads...39 Summary of Current Phosphorus Loads...39 Phosphorus Load Reductions Required By Sector III. Adaptive Management Strategy Part 1: Cost/Implementation Model Model Inputs Model Outputs Part 2: Identification of Partners Part 3: Phosphorus-Reducing Practices Phosphorus-Reducing Practices - Urban...47 Phosphorus-Reducing Practices - Rural...47 Agricultural Implementation Strategy...49 IV. Water Quality Monitoring...59 Objectives...59 Guidance Considered...59 Monitoring locations...61 Monitoring Parameters and Monitoring Frequency...61 Quality Assurance Protocols...62 V. Communication VI. Financial Security
3 VII. Timeline and Milestones...67 Appendix 1: 2014 Memorandum of Understanding between MMSD and DNR Regarding Adaptive Management...70 Appendix 2: MMSD Laboratory Analytical Methods, Limits, Limits of Detection and Limits of Quantitation for Water Quality Monitoring Conducted by the MMSD Laboratory...76 Appendix 3: Map Showing MMSD Water Quality Monitoring Locations on Badfish Creek...79 Appendix 4: Active Water Quality Monitoring Locations in the Yahara Watershed Appendix 5: Major Soil Groupings in the Yahara Watershed by TMDL Stream Reach...83 Appendix 6: Point Source Phosphorus Loads by Stream Reach Appendix 7: MS4 Phosphorus Loads by TMDL Stream Reach Appendix 8: Detailed Phosphorus Load Reductions by Source and TMDL Reach Appendix 9: Detailed TSS Reductions by Source and TMDL Reach...97 Appendix 10: Draft Intergovernmental Agreement (IGA) for a Full-scale Adaptive Management Project Appendix 11: Representative Letters of Support for Full-scale Adaptive Management Project Appendix 12: Phosphorus Reduction Milestones by Year Appendix 13: Additional Information for Stoughton Wastewater Treatment Plant Requiring Tertiary Treatment to Meet Future Phosphorus Limits List of Figures: Figure 1: Six Mile Creek Pilot Project Area for Yahara WINs... 8 Figure 2: Location of Yahara River Watershed broken into TMDL stream reaches Figure 3: Geographical Distribution of Phosphorus Sources Figure 4: Phosphorus and/or Sediment Impaired Stream Reaches in the Yahara Watershed...22 Figure 5: Location of USGS Gaging Stations Associated with the Adaptive Management Pilot Project Figure 6: Citizen Monitoring Data in Yahara Watershed (Data from the Rock River Coalition)...27 Figure 7: Land Cover in the Yahara Watershed (Dane County LWRD)...32 Figure 8: Historic Cropping Practices by Stream Reach (Dane County LWRD) Figure 9: Mean nonpoint baseline phosphorus loads for the Yahara Watershed using two different precipitation periods. Data derived from the MARS 2014 extended SWAT model and further analysis by John Reimer at Dane County Land and Water Resources Department...38 Figure 10: Relative Distribution of Nonpoint Phosphorus Loads by Stream Reach Figure 11: Relative Distribution of Nonpoint TSS Loads by Stream Reach...53 Figure 12: Door Creek Sub-watershed Prioritization...54 Figure 13: Conservation Planning Process Figure 14: Phosphorus Reduction Calculation Models and/or Methods...58 Figure 15: Active Water Quality Monitoring Locations in the Yahara Watershed. Compiled by Mike Sorge (DNR) and others using data from multiple sources. Map prepared by Dane County LWRD Figure 16: Summary of Communication Strategy prepared by MMSD staff
4 List of Tables: Table 1: TMDL Annual TP Baseline Load (lbs.) in the Yahara Watershed by Source Category with Point Sources at Design Load. Data derived from Rock River TMDL Tables and Excel Spreadsheets containing TMDL data provided by Matt Diebel (DNR)...12 Table 2: TMDL Annual TP Baseline Load (lbs.) in the Yahara Watershed By Source Category with Point Sources at Current Load. Data derived from Rock River TMDL Tables and Excel Spreadsheets containing TMDL data provided by Matt Diebel (DNR)...12 Table 3: Target Effluent Limitations in Evaluated Scenarios (CH2MHill; 2012) Table 4: Anticipated Yahara WINs Partners with WPDES permits...14 Table 5: Summary of MMSD, Oregon and Stoughton Eligibility Table 6: Municipal Jurisdictions in the Yahara Watershed Table 7: MS4s identified in the Rock River TMDL with discharges to the Yahara Watershed and their associated discharge stream reaches Table 8: Impaired for TP and/or TSS River and Stream Segments in Yahara Watershed (DNR Impaired Water search, Rock River TMDL)...23 Table 9: Impaired for TP and/or TSS Lakes in the Yahara Watershed. Applicable TP Criteria provided by DNR Aaron Larson of DNR on 12/14/ Table 10: July 2012-October 2014 Data-Growing Season Median P Concentrations. (Data from Todd Stuntebeck, USGS; Oct 2, 2015)...26 Table 11: July 2012-October 2014 Data-Growing Season Time Integrated Median P concentrations for the 15th of each month (Data from Todd Stuntebeck, USGS; Oct 5, 2015) Table 12: Growing Season (May-Oct) Total P Concentrations at Selected Sampling Locations (Source: MMSD, Raw data, analytical methods and LOD/LOQ information provided in Appendix 2) Table 13: Climatological Information for the Yahara Watershed ( ) - Dane County Airport Location...29 Table 14: Land Cover by TMDL Stream Reach to the nearest acre. (From NASS 2014 with DNR Wetlandscreated 09/11/2015 by Dane County LWRD)...31 Table 15: Annual Phosphorus Loads by Point Source ( Average). Data obtained from personal communication with Theresa Nelson of DNR...37 Table 16: Annual Nonpoint Phosphorus Loads (non-ms4) by TMDL Stream Reach Table 17: Annual MS4 Phosphorus Loads by TMDL Stream Reach. Data compiled by MMSD staff from TMDL spreadsheets provided by Matt Diebel of DNR Table 18: Annual Nonpermitted Urban and Background Phosphorus Loads by TMDL Stream Reach. Data compiled by MMSD staff from information contained in the Rock Rive TMDL Document...39 Table 19: Total Annual Phosphorus Loads by Source and TMDL Stream Reach Table 20: Required Phosphorus Load Reductions (lbs. /year) by TMDL Source Category and TMDL Stream Reach. Data compiled by MMSD staff Table 21: Required Sediment Load Reductions (lbs. /year) by TMDL Source Category and TMDL Stream Reach. Data compiled by MMSD staff using information contained in the Rock River TMDL Table 22: Participating Partners and Associated Roles...46 Table 23: NRCS Conservation Practice Standards...48 Table 24: Water Quality Monitoring Summary...64 Table 25: Pour Point Water Quality Monitoring Summary Table 26: Anticipated Phosphorus Load Reductions (lbs.) by WDPES Permit Term Table 27: Anticipated Phosphorus Reduction Goal as Percentage of Total lbs. by WDPES Permit Term.. 68 Table 28: Required Phosphorus Load Reductions at Current Conditions
5 5
6 I. Introduction and Background In 2010, the Wisconsin Department of Natural Resources (DNR) adopted revisions to administrative rules designed to control phosphorus discharges to waters of the state. These revisions, collectively referred to as the Phosphorus Rule Making Package, included the establishment of numeric water quality criteria for phosphorus. In 2011, USEPA approved a Total Maximum Daily Load (TMDL) for the Rock River Basin to address water quality impairments caused by phosphorus and/or total suspended solids (TSS). The Rock River Basin covers an area of 3,300 square miles and includes the approximately 536-square-mile Yahara River Watershed, located in the west-central portion of the basin. The Rock River TMDL identifies several stream segments in the Yahara Watershed that are impaired by phosphorus and/or TSS. The TMDL establishes allocations for phosphorus and TSS for all major source categories (municipal/industrial wastewater, municipal storm water, and agriculture), which are designed to bring impaired water bodies into compliance with applicable water quality criteria. To meet these allocations, reductions in phosphorus and TSS loads will be required from all source categories. The 2010 Phosphorus Rule Making Package included a provision for a new regulatory compliance strategy for phosphorus called the Watershed Adaptive Management Option (Wis. Admin Code NR ), commonly referred to as adaptive management. Adaptive management is a collaborative, watershed-based approach that allows phosphorus sources to work together to achieve the phosphorus water quality criteria in the most economically efficient manner, taking into consideration the contributions of phosphorus from point and nonpoint sources in a watershed. The authorizing language for adaptive management and its eligibility requirements are contained in Wis. Admin Code NR Per Wisconsin Act 378 and subsequent revisions to Wisconsin State Statutes (Wis. Stat. 283), adaptive management can be used to address both phosphorus and TSS. Madison Metropolitan Sewerage District (MMSD or the District) is a WPDES-permitted point source that discharges the majority of its effluent to Badfish Creek, which is located in the southern part of the Yahara Watershed. A preliminary review of the Rock River TMDL allocation for phosphorus led MMSD staff to conclude that a traditional brick and mortar compliance approach would likely require the use of filtration technology that would be extremely expensive and benefit only the limited portion of the Yahara Watershed located downstream from MMSD s effluent discharge point. The need for filtration technology and the associated high cost was confirmed in an evaluation of nutrient removal technologies and associated costs conducted for the District by the consulting firm CH2MHILL. This evaluation was completed in early A range of potential effluent phosphorus limits were evaluated, including target values of 0.13 and mg/l (values needed for the District to comply with the TMDL and the numeric water quality criterion for Badfish Creek, respectively). The study determined that meeting either of these target values required filtration. The estimated life cycle costs, expressed as Net Present Value costs, ranged from $78 M (to meet 0.13 mg/l) to $124 M (to meet mg/l). In 2011, District staff conducted a preliminary evaluation of adaptive management as an alternative phosphorus compliance strategy. This evaluation concluded that adaptive management could be a cost6
7 effective and environmentally sound approach to addressing phosphorus from all sources within the Yahara Watershed. In late 2011, the MMSD Commission authorized District staff to conduct an adaptive management pilot project in the Yahara Watershed to gain experience with adaptive management on a small scale. In 2012, the District, in collaboration with over 30 municipal partners and other interested stakeholders, began the Yahara WINs adaptive management pilot project, a four-year effort to evaluate adaptive management as a phosphorus compliance strategy. The pilot project was conducted in the Six Mile Creek Watershed, located northwest of Lake Mendota (Figure 1) and was the first effort in Wisconsin to test the adaptive management concept. Pilot project goals included: Evaluating the cost, performance and the ability to implement phosphorus control practices, with a primary focus on agricultural control practices Gaging the level of support for a full-scale project from partners and the community Establishing a baseline water quality monitoring program and evaluating (to the extent practicable) water quality impacts associated with implementing phosphorus control practices Pilot project participants operated under a Memorandum of Understanding (MOU) and provided financial support for this approximately $3 million effort. The pilot project has been a success, demonstrating that point and nonpoint sources of phosphorus can work in a collaborative manner (including pooling financial resources) to advance a shared objective of reducing phosphorus loads needed to meet phosphorus water quality goals in the Yahara Watershed. In 2014, Yahara WINs participants identified the need to build capacity to support a potential transition to a full-scale adaptive management project that would focus on the entire Yahara Watershed. This led to an expansion of phosphorus-reducing practices and water quality monitoring activities targeting areas outside of the pilot project area but within the broader Yahara Watershed. In 2014, District staff also engaged in discussions with DNR that led to the execution of a new MOU (Appendix 1) that addresses several key areas relating to implementation of a full-scale adaptive management project in the Yahara Watershed, including the following: Development of an adaptive management plan Quantifying phosphorus and TSS reductions Measuring interim progress in meeting phosphorus and TSS reduction goals Reduction Credits for State-Funded Nonpoint Reductions Compliance at the end of the adaptive management period In 2015, District staff evaluated estimated costs associated with a range of phosphorus compliance strategies and concluded that adaptive management represents a fiscally and environmentally responsible approach to achieving compliance with phosphorus WPDES permit requirements. 7

8 Figure 1: Six Mile Creek Pilot Project Area for Yahara WINs 8
9 In May 2015, the District Commission formally adopted a resolution directing District staff to: Meet and work with current Yahara WINs pilot project participants and other entities, including the agricultural sector, to determine if there is sufficient interest in participating in the full-scale adaptive management project; Begin work on developing an adaptive management plan consistent with the requirements in Wis. Admin Code NR and DNR guidance; Once the plan has been developed and assuming that there is demonstrated interest on the part of current pilot project participants, submit an adaptive management plan to DNR for review and potential approval; Develop other tools and conduct other activities as deemed necessary to support transition to a full-scale adaptive management project in a timely manner. Based on experience gained through the pilot project and discussions with pilot project participants, District staff has determined that there is sufficient interest on the part of Yahara WINs pilot project participants and other entities in advancing an adaptive management project covering the entire Yahara Watershed. District staff developed an adaptive management plan for this effort in consultation with multiple stakeholders and interested parties. District eligibility for the adaptive management option, background information on the Yahara Watershed, and the proposed adaptive management plan are laid out in the following sections. The Oregon and Stoughton Wastewater Treatment Facilities both participated in the adaptive management pilot project and it is anticipated that they will also participate in a full-scale adaptive management project. Therefore, eligibility for the Oregon and Stoughton Wastewater Treatment Facilities is also addressed in this plan. Per the 2014 Memorandum of Understanding between MMSD and DNR, the adaptive management project will be used by participating entities to meet numeric water quality criteria for phosphorus and reduce TSS to achieve applicable narrative standards. The TMDL outlines anticipated modeled reductions needed to meet phosphorus water quality criteria and narrative TSS standards. The adaptive management plan is being structured to meet both the phosphorus and (TSS) allocations specified in the Rock River TMDL and will be used by participating entities as the TMDL compliance strategy. Meeting DNR Adaptive Management Planning Elements This document contains all of DNR s nine required steps for an adaptive management plan, per the Adaptive Management Technical Handbook-A Guidance Document for Stakeholders (DNR, 2013). However, for purposes of organization and to eliminate redundancies, these elements are presented in a different order than shown in the Technical Handbook. For ease of cross-referencing, DNR elements appear in this document in the following locations: 9
10 DNR Adaptive Management Step Page Number 1. Identify partners Describe the watershed and set load reduction goals Conduct a watershed inventory Identify where reductions will occur Describe management measures Estimate load reductions expected by permit term 7. Measuring success and monitoring 34, Financial security 43, Implementation schedule with milestones 42, 66 10
11 Eligibility for Adaptive Management The authorizing language for adaptive management and the eligibility requirements are contained in Wis. Admin Code NR DNR may approve and authorize a permittee to implement an adaptive management program if the permittee demonstrates and the Department concurs that all of the following have been met: a. The exceedance of the applicable phosphorus criterion in s. NR is caused by phosphorus contributions from both point sources and nonpoint sources. b. Either the sum of the nonpoint sources and the permitted municipal separate storm sewer system contribution of phosphorus to the receiving water is at least 50 percent of a total contribution within the watershed of the receiving water where the applicable phosphorus criterion in s. NR is exceeded; or the permittee demonstrates that the applicable phosphorus criterion cannot be met in the watershed without the control of phosphorus from nonpoint sources. c. Documentation that the proposed water quality based effluent limit in the applicant s permit will require filtration or other equivalent treatment technology to achieve compliance. d. The permittee has submitted an adaptive management plan that identifies specific actions to be implemented that will achieve compliance with the applicable phosphorus criterion in s. NR through verifiable reductions of phosphorus from point and nonpoint sources within the watershed. Each of these eligibility requirements is briefly addressed below. These eligibility requirements must be met by all point sources regulated under NR 217 that are participating in adaptive management. Therefore this section addresses the eligibility of MMSD, as well as the Oregon and Stoughton Wastewater Treatment Facilities. A. Exceedance caused by phosphorus contributions from both point and nonpoint sources The geographic scope for the District s watershed adaptive management option is the entire Yahara Watershed. Per the Rock River TMDL, the Yahara Watershed consists of stream reaches 62 through 69. The Rock River TMDL report provides baseline total phosphorus loads by stream reach for agriculture/non-permitted urban, municipal separate storm sewer systems (MS4s), and point sources, respectively. The TMDL data demonstrates that all stream reaches in the Yahara Watershed are impacted by phosphorus contributions from both point and nonpoint sources, including stream reach 69, in which the District and Oregon Wastewater Treatment Facility is located, and stream reach 68 in which the Stoughton Wastewater Treatment Facility is located. B. Either the sum of the nonpoint sources and the permitted municipal separate storm sewer system contribution of phosphorus to the receiving water is at least 50 percent of the total contribution within the watershed of the receiving water where the applicable phosphorus criterion in s. NR is exceeded; or the permittee demonstrates that the applicable phosphorus criterion cannot be met in the watershed without the control of phosphorus from nonpoint sources. Baseline phosphorus information for stream reaches located in the Yahara Watershed is summarized in Tables 1 and 2. 11
12 Table 1 contains the annual baseline phosphorus loads by source category with point source loads assuming design conditions. Under this load scenario, nonpoint and MS4 sources account for a combined 60% of the phosphorus load in the Yahara Watershed while point sources account for 40% of the phosphorus load. Table 2 contains the annual baseline phosphorus load by source category, but with point source loads set at current conditions. The current condition load is defined as the average load using the most recent five years on record ( ) as obtained from DNR staff. Under these conditions, nonpoint and MS4 sources account for a combined 87% of the phosphorus load in the Yahara Watershed, while point sources account for 13% of the phosphorus load. In both of the above cases, nonpoint and MS4 sources account for more than 50% of the baseline phosphorus load in the Yahara Watershed, demonstrating that this eligibility requirement is met. It should also be noted that early DNR staff presentations regarding the Rock River TMDL indicated that applicable phosphorus water quality criteria could not be met without the control of phosphorus from both point and nonpoint sources. Source Category Agriculture Background Non-permitted urban MS4s Point sources Annual TP Load (lbs.) 184,028 8,966 5,075 49, ,952 Percent of Total 45% 2% 1% 12% 40% Table 1: TMDL Annual TP Baseline Load (lbs.) in the Yahara Watershed by Source Category with Point Sources at Design Load. Data derived from Rock River TMDL Tables and Excel Spreadsheets containing TMDL data provided by Matt Diebel (DNR) Source Category Agriculture Background Non-permitted urban MS4s Point sources Annual TP Load (lbs.) 184,028 8,966 5,075 49,599 37,394 Percent of Total 65% 3% 2% 17% 13% Table 2: TMDL Annual TP Baseline Load (lbs.) in the Yahara Watershed By Source Category with Point Sources at Current Load. Data derived from Rock River TMDL Tables and Excel Spreadsheets containing TMDL data provided by Matt Diebel (DNR) C. Documentation that the proposed water quality based effluent limit in the applicant s permit will require filtration or other equivalent treatment technology to achieve compliance. Madison Metropolitan Sewerage District In 2011 the District engaged the consulting firm CH2MHILL to evaluate the cost of nutrient removal technologies at the District s Nine Springs Wastewater Treatment Plant to meet potential future 12
13 effluent limitations for phosphorus and nitrogen. The results of this evaluation were presented in a report titled Preliminary Nutrient Removal Cost Estimates Study (CH2MHILL; 2012). In summary, the nutrient removal study evaluated nine different scenarios that involved phosphorus treatment alone or in combination with nitrogen treatment. Scenarios were based on potential future effluent limitations for phosphorus and/or nitrogen. Target effluent limitations are shown in Table 3. Scenario Total Phosphorus (mg/l) Total Nitrogen (mg/l) None 1 None 1 None Table 3: Target Effluent Limitations in Evaluated Scenarios (CH2MHill; 2012) 1 Existing ammonia limits apply Monthly average concentrations 3 Annual average concentrations 2 Scenarios 1 through 3 represent a range of potential future effluent phosphorus limitations for the District. Scenario 2 is based on meeting the most limiting monthly phosphorus allocation for the District from the Rock River TMDL. Scenario 3 is based on meeting the water quality criterion for streams in Wis. Admin Code NR102. Per the CH2MHILL report, all three scenarios would require filtration. The CH2MHIILL report is not included as part of this adaptive management plan, but is available upon request. Stoughton and Oregon Wastewater Treatment Facilities Using phosphorus load information from the Rock River TMDL, the most limiting monthly phosphorus allocation would result in phosphorus limits of 0.28 mg/l for the Stoughton facility and 0.13 mg/l for the Oregon facility. The applicable numeric water quality criterion for Badfish Creek, which receives the discharge from the Oregon Wastewater Treatment Facility, is mg/l. Per the Adaptive Management Technical Handbook (DNR, 2013), DNR has concluded that if the calculated WQBEL is 0.40mg/L or less as a monthly average, that limit cannot be achieved without addition of filtration or other equivalent technology. Thus, both the Stoughton and Oregon wastewater treatment facilities meet this eligibility requirement. Stoughton has provided additional information demonstrating that filtration or equivalent technology is required to meet anticipated future phosphorus limits at design conditions. This information is provided in Appendix 13. The April 24, 2015 Economic Impact Analysis presented to DNR and DOA (prepared by ARCADIS, Sycamore Advisors, and UMass) included capital and annual O&M cost estimates for treatment plant process upgrades necessary for achieving future phosphorus limits for each WPDES permitted discharger in Wisconsin. Filtration was the assumed treatment technology in this evaluation. Costs for both the Oregon and Stoughton Wastewater Treatment Facilities are shown below. Also shown 13
14 is the estimated cost for adaptive management as based on cost information derived from the adaptive management cost/implementation model, which is briefly described in Section III of this plan. For both facilities, the annual O&M cost alone is higher than the estimated annual cost for each facility to participate in adaptive management. Facility Oregon Stoughton Capital Cost $ 7.3 M $5.1 M Annual O&M Cost $363,000 $236,000 Estimated Annual AM Cost $80,000 $5,400 D. The permittee has submitted an adaptive management plan that identifies specific actions to be implemented that will achieve compliance with the applicable phosphorus criterion in s. NR through verifiable reductions of phosphorus from point and nonpoint sources within the watershed. The adaptive management plan for the Yahara Watershed is contained in the following sections. The plan is being advanced by the District, but represents a collaborative effort that is anticipated to involve over 30 municipal and other partners working to reduce phosphorus and TSS loads to receiving waters throughout the entire Yahara Watershed. Anticipated WPDES permitted participants in the adaptive management project include those entities shown in Table 4. It should be noted that DNR is currently evaluating compliance strategies and that updated monitoring and/or modeling information may show that some of the entities listed below are already complying with their TMDL allocations. Cities Madison Fitchburg Middleton Villages Cottage Grove Deforest Maple Bluff McFarland Monona Sun Prairie Stoughton Oregon Shorewood Hills Waunakee Towns Blooming Grove Bristol Burke Cottage Grove Dunkirk Dunn Madison Middleton Oregon Pleasant Springs Sun Prairie Westport Windsor MMSD Oregon WWTF Stoughton WWTF DNR-Nevin MG&E Point Sources Others UW-Madison Table 4: Anticipated Yahara WINs Partners with WPDES permits The adaptive management project will be used by participating entities as the compliance strategy to meet phosphorus numeric water quality criteria and TSS reductions required to achieve applicable narrative standards. The TMDL for the Yahara Watershed, contained within the Rock River Basin TMDL, was approved by EPA in September The TMDL outlines anticipated modeled reductions needed to meet phosphorus water quality criteria and narrative TSS standards. 14
15 Per the 2014 Memorandum of Understanding between MMSD and DNR, if one or more of the permitted MS4s or other point sources with a discharge to a stream reach located in the Yahara Watershed decides not to participate in the adaptive management project, it will be assumed that these entities will meet their TMDL requirements independently, and the target reductions for phosphorus and TSS in the adaptive management project will be adjusted accordingly. A collaborative, coordinated and comprehensive approach among all sources in the watershed is essential to meeting water quality goals for both the District and its adaptive management partners in an efficient and cost effective manner. Given the complex nature of the watershed, independent and narrowly focused actions will not result in achieving water quality goals. Consistent with time frames specified in Wisconsin Act 378 and subsequent revisions to Wisconsin State Statutes (Wis. Stat. 283), the adaptive management plan is based on implementation occurring over four permit terms (e.g. a 20-year implementation period). The adaptive management plan is consistent with the requirements in Wis. Admin Code NR , and addresses the nine required steps identified in the Adaptive Management Technical Handbook-A Guidance Document for Stakeholders (DNR, 2013). Table 5 summarizes the eligibility of all three waste water treatment facilities for adaptive management: 15
16 Requirement 1: The exceedance of the applicable phosphorus criterion in s. NR is caused by phosphorus contributions from both point sources and nonpoint sources. The Rock River TMDL identifies both point and nonpoint sources for phosphorus loading in the Yahara River Watershed. Requirement 2: Either the sum of the nonpoint sources and the permitted municipal separate storm sewer system contribution of phosphorus to the receiving water is at least 50 percent of the total contribution within the watershed of the receiving water where the applicable phosphorus criterion in s. NR is exceeded; or the permittee demonstrates that the applicable phosphorus criterion cannot be met in the watershed without the control of phosphorus from nonpoint sources. Nonpoint sources and MS4s account for 60% (point sources at design conditions) to 87% (point sources at current conditions) of the annual TP baseline load to the Yahara River Watershed. Requirement 3: Documentation that the proposed water quality based effluent limit in the applicant s permit will require filtration or other equivalent treatment technology to achieve compliance. CH2MHILL 2012 nutrient evaluation report for MMSD demonstrated that filtration technology is required to achieve water quality standards for phosphorus. For the Oregon and Stoughton WWTF s, TMDL limits based on the most limiting month demonstrate the need for filtration or equivalent treatment technology. Requirement 4: The point source has submitted an adaptive management plan that identifies specific actions to be implemented that will achieve compliance with the applicable phosphorus criterion in s. NR through verifiable reductions of phosphorus from point and nonpoint sources in the watershed. The adaptive management plan is contained in this document. Table 5: Summary of MMSD, Oregon and Stoughton Eligibility 16
17 II. Watershed Background and Current Conditions This section includes information about the Yahara Watershed that helps establish baseline conditions and provides context for later sections of the adaptive management plan. Essentially, this section houses existing information that sets the stage for planned actions. However, this section meets several criteria for DNR s 9 steps for adaptive management, so sections that include related information are indicated as such. This section is divided into two parts: A description of the Yahara Watershed and an inventory of baseline conditions and factors that influence water quality related to phosphorus and TSS. An overview of current phosphorus loads by different sources (i.e., point and nonpoint), the method of calculating needed reductions, and projections of how and when those reductions will be achieved. By establishing the current conditions that contribute to phosphorus pollution in the Yahara Watershed, this section provides rationale for the practices and strategic actions chosen for the adaptive management plan. Part 1: Watershed Description and Inventory DNR 9 Steps 2 3 This section meets DNR Adaptive Management Step 2: Describe the Watershed and Set Load Reduction Goals and Step 3: Conduct a Watershed Inventory General The Yahara River Watershed is an approximately 536-square mile (344,000 acres) watershed located in the west-central portion of the Lower Rock River Basin. The majority of the Yahara Watershed is located in Dane County (299,665 acres), with smaller sections located in Columbia County to the north (17,694 acres) and Rock County to the south (26,115 acres). In the Rock River TMDL, the Yahara Watershed was divided into eight stream reaches, as shown in Figure 2. Much of the watershed is farmed, as the watershed is home to some of the state s most productive agricultural land. The upper portion of the watershed has a high density of dairy farms that have been in the family for generations, while the lower portion of the watershed tends to be dominated by cash crop production. The central part of the watershed includes the Yahara River chain of lakes (Mendota, Monona, Waubesa and Kegonsa) and significant urbanized areas. 17

18 Figure 2: Location of Yahara River Watershed broken into TMDL stream reaches
19 Municipal Jurisdictions in the Yahara Watershed All or parts of 6 cities, 10 villages and 27 towns are located in the Yahara Watershed, as shown in Table 6. Unless otherwise noted, all municipalities are located in Dane County. Municipal jurisdictions shown in bold were specifically identified asms4s in the Rock River TMDL. Cities Towns Madison Fitchburg Middleton Villages C Arlington Brooklyn Cottage Grove Dane DeForest Monona Sun Prairie Stoughton Maple Bluff McFarland Oregon Shorewood Hills Waunakee Table 6: Municipal Jurisdictions in the Yahara Watershed. Madison Middleton Oregon Pleasant Springs R Porter Roxbury Rutland Springfield Sun Prairie R Union Vienna Westport Windsor Albion C Arlington Berry Blooming Grove Bristol Burke R Center Cottage Grove Dane Dunkirk Dunn R Fulton C Leeds Lowville C R Located in Columbia County. Located in Rock County Phosphorus Source Area Identification The Rock River TMDL identifies five main source categories for phosphorus and TSS: Point, Background, Non-permitted Urban, MS4 Urban, and Agriculture. Figure 3 shows the geographical distribution of the five phosphorus source categories in the Yahara Watershed. This figure also shows the location of 7 point sources identified in the TMDL as having surface water discharges to the Yahara Watershed. Of note is that DNR recently determined that the Village of Arlington Wastewater Treatment Plant, located in the far northern part of the watershed, discharges to a waterbody that is not hydrologically connected to the Yahara River Basin and the Rock River. Also, although Middleton Tiedeman Pond was identified as a point source in the TMDL, for implementation purposes Tiedeman Pond is included as part of the City of Middleton MS4 load. Table 7 lists each of the 23 MS4s identified in the Rock River TMDL as having a discharge to the Yahara Watershed, and the TMDL stream reach that each MS4 discharges to. Note that in many cases an MS4 has discharges to multiple stream reaches. 19

20 Figure 3: Geographical Distribution of Phosphorus Sources 20
21 Municipality Stream Reaches Blooming Grove, Town Bristol, Town Burke, Town Cottage Grove, Town Cottage Grove, Village DeForest, Village Dunkirk, Town Dunn, Town Fitchburg, City Madison, City Madison, Town Maple Bluff, Village McFarland, Village Middleton, City Middleton, Town Monona, City Pleasant Springs, Town Shorewood Hills, Village Stoughton, City Sun Prairie, City Waunakee, Village Westport, Town Windsor, Town 64, 65, , , 68, 69 65, 66, 67, 69 64, 65, 66, 69 62, 64, 65, 66 64, , 63, 64 62, 64 64, 65, 66 66, 67, , 67, , 64 62, 63, Table 7: MS4s identified in the Rock River TMDL with discharges to the Yahara Watershed and their associated discharge stream reaches Water Quality The Rock River TMDL identifies a number of stream segments in the Yahara Watershed that are impaired due to phosphorus and/or TSS. Impaired stream reaches are identified in Figure 4 and relevant information for each of these impaired segments is provided in Table 8. The District has access to all water quality monitoring data used in the TMDL development process in spreadsheet form, provided by DNR staff. Figure 4 also shows additional lakes and streams located in the Yahara Watershed that are on the 303(d) list of impaired waters for phosphorus and/or TSS, with Table 9 providing relevant information for the lakes. Actions taken through adaptive management to reduce phosphorus and TSS loads should help address all waters identified as impaired for these parameters. 21

22 Figure 4: Phosphorus and/or Sediment Impaired Stream Reaches in the Yahara Watershed 22
23 TP and TSS Impairments in the Yahara Watershed: Stream and River Segments Name Pheasant Branch Creek Dorn (Spring) Creek Nine Springs Creek Yahara River Badfish Creek Reach , 68, Segment Location Mile and Mile TP,TSS and TP, TSS Low DO, Degraded Habitat and Low DO, Degraded Habitat NR (3)(b) mg/l Mile Mile Mile Mile TSS TP, TSS TP, TSS TP, TSS Elevated Water Temperature Low DO, Elevated Water Temperature Low DO, Degraded Habitat Low DO, Degraded Habitat, Contamination in Soil NR (3)(b) mg/l NR (3)(b) mg/l NR (3)(a) mg/l NR (3)(b) mg/l Status TMDL approved TMDL approved TMDL approved TMDL approved 303 (d) listed Current Use WWSF and LFF LFF-Not Supporting WWFF-Not supporting WWSF-Not Supporting WWSF-Not Supporting Designated Use WWSF and LFF WWSF WWSF WWSF WWSF1 Attainable Use WWSF and LFF WWSF WWSF WWSF WWSF Pollutants Impairments Classification TP Criteria Table 8: Impaired for TP and/or TSS River and Stream Segments in Yahara Watershed (DNR Impaired Water search, Rock River TMDL) (1) The District s Outfall 001 discharge is to Badfish Creek is classified according to chapters NR 102 and NR 104 of the Wisconsin Administrative Code: from Madison MSD outfall to the confluence with Oregon Branch as limited aquatic life (marginal) stream, from there to CTH A bridge as limited forage fish communities (intermediate), and downstream of CTH A bridge to the confluence with the Yahara River near Cooksville, it is classified a warmwater sport fish communities. CTH A to the confluence with the Yahara River is the same stretch (mile ) that is 303 (d) listed for phosphorus and therefore included in Table 8. 23
24 TP and TSS Impairments in the Yahara Watershed: Lakes Name Lake Mendota Lake Monona Lake Wingra Lake Waubesa Lake Kegonsa Reach Location First in Yahara Chain of Lakes Second in Tributary to Yahara Chain of Yahara Chain Lakes of Lakes Third in Yahara Chain of Lakes Fourth in Yahara Chain of Lakes Pollutants TP/ TPP, TSS TSS TP, TSS TP TP Water Quality Use Restrictions, Excess Algal Growth Classification NR (4)(b)2. Two story Eutrophication, Excess Algal Growth Impairment Unknown Excess Algal Growth NR (4)(b)2. Two Story TP Criteria 15 µg P/L 15 µg P/L NR (4)(b)2. Shallow Lowland Lake 40 µg P/L Water Quality Use Restrictions, Excess Algal Growth NR (4)(b)2. Shallow Lowland Lake 40 µg P/L Status TMDL approved 303 (d) listed Full Body Contact Recreation Full Body Contact Recreation TMDL approved Full Body Contact Recreation TMDL approved Current Use TMDL approved Full Body Contact Recreation Designated Use Full Body Contact Recreation Full Body Contact Recreation Full Body Contact Recreation Full Body Contact Recreation Full Body Contact Recreation Attainable Use Full Body Contact Recreation Full Body Contact Recreation Full Body Contact Recreation Full Body Contact Recreation Full Body Contact Recreation Impairments NR (4)(b)2. Shallow Lowland Lake 40 µg P/L Full Body Contact Recreation Table 9: Impaired for TP and/or TSS Lakes in the Yahara Watershed. Applicable TP Criteria provided by DNR Aaron Larson of DNR on 12/14/15. Additional efforts outside of the TMDL development have been undertaken to evaluate water quality in the Yahara Watershed. As part of the adaptive management pilot project, an extensive water quality monitoring network was developed to support the pilot project and the subsequent transition to a fullscale adaptive management project. This network included new USGS gaging stations as well as additional volunteer water quality monitoring sites. Four USGS gaging stations were installed as part of the pilot project, as shown in Figure 5. Three of these stations are located in the pilot project area and one is located just to the north of the pilot project area. 24

25 Water quality sampling at these locations began in mid In 2014, water quality monitoring was added at the USGS Fulton gaging station, which previously was used only for flow/discharge monitoring. Routine monthly samples and storm event-related samples are collected at all five sites. A total of over 1,100 samples have been collected and analyzed since initiation of the pilot project. Figure 5: Location of USGS Gaging Stations Associated with the Adaptive Management Pilot Project Water quality samples collected at the gaging stations during both baseflow conditions and storm events are routinely analyzed for the following parameters: TSS NO3 + NO2 NH3-N TKN TP OP-DRA Chlorophyll A (only analyzed on samples collected May-Oct) All samples are analyzed at the MMSD Laboratory, which is a DNR Certified Laboratory. Analytical methods for the above parameters, limits of detection (LOD), and the limits of quantitation (LOQ) are 25
26 shown in Appendix 2. The complete water quality monitoring dataset associated with these gages is available from MMSD upon request. USGS is responsible for data evaluation, including computation of median phosphorus concentrations and phosphorus loads. Baseflow growing season (May-Oct) median concentrations for both total phosphorus and dissolved phosphorus at each of the four gaging stations installed as part of the pilot project is presented in Table 10 below. Dorn Creek at Hwy Q Dorn Creek at Hwy M Sixmile Creek at Hwy 19 Sixmile Creek at Hwy M Total P (mg/l) Dissolved P (mg/l) Table 10: July 2012-October 2014 Data-Growing Season Median P Concentrations. (Data from Todd Stuntebeck, USGS; Oct 2, 2015) USGS also calculates time integrated daily concentrations based on all sampling results using the Graphical Constituent Loading Analysis System, details of which can be found at For comparison, Table 11 shows the growing season median concentrations using the time integrated concentrations from the fifteenth of each month. Concentrations are slightly higher than those shown in Table 10. Dorn Creek at Hwy Q Dorn Creek at Hwy M Sixmile Creek at Hwy 19 Sixmile Creek at Hwy M Total P (mg/l) Dissolved P (mg/l) Table 11: July 2012-October 2014 Data-Growing Season Time Integrated Median P concentrations for the 15th of each month (Data from Todd Stuntebeck, USGS; Oct 5, 2015) The adaptive management pilot project has funded additional monitoring efforts in the Yahara Watershed through a citizen volunteer monitoring program coordinated by the Rock River Coalition. Monitoring protocols follow those established by the DNR Water Action Volunteer (WAV) Program. The sampling effort began in 2013 with 23 sites, and has expanded to 46 sites in To date, approximately 285 samples have been collected in the watershed by the volunteer monitors. All of the samples are analyzed by the MMSD laboratory. Analytical methods, limits of detection (LOD), limits of quantitation (LOQ) are provided in Appendix 2. The complete dataset is available from MMSD upon request. Data collected to date through the citizen volunteer monitoring program has been entered into the DNR surface water integrated monitoring system database (SWIMS). A review of the data shows that phosphorus concentrations vary with both sample location and by date within a given sample location. Growing season median concentrations often exceed the applicable numeric water quality criterion. Median total phosphorus concentrations for select monitoring locations throughout the Yahara River and Lake Mendota watershed collected during the 2014 growing season (May-Oct) is shown in Figure 6 for illustrative purposes. 26
27 2014 Citizen Monitoring Data For Select Sites (Median Growing Season TP Concentrations) 0.18 Median TP Concentration (mg/l Cherokee Marsh (Reach 64) Nine Spring Creek (Reach 65) Six Mile Creek (Reach 63) Yahara River West Branch (Reach 64) Figure 6: Citizen Monitoring Data in Yahara Watershed (Data from the Rock River Coalition) Water quality monitoring has also been conducted directly by District staff, with monitoring locations generally located in the Badfish Creek Watershed. A map showing all District monitoring locations in the lower portion of the Yahara Watershed is shown in Appendix 3. Monitoring frequency has varied over the period of record ( ). Starting in 2013, monitoring was conducted on a monthly basis during the growing season of May-October. Growing season average and median total phosphorus concentrations at the following four locations for the period of is presented in Table 12: Effluent pipe bridge (upper portion of Badfish Creek-Stream Reach 69) Hwy 59 bridge (lower portion of Badfish Creek-Stream Reach 69) Yahara River (10-Y, upstream of the Badfish Creek/Yahara River confluence-stream Reach 68) Yahara River (9A-y, downstream of the Badfish Creek/Yahara River confluence-stream Reach 69) A review of the data shows phosphorus concentrations in the upper part of Badfish Creek closely match concentrations in the District s effluent concentration. This is not surprising since Badfish Creek is an effluent-dominated stream with minor dilution in the upper portions. Concentrations decrease in the lower part of Badfish Creek due to dilution from other sources. Concentrations in the Yahara River upstream of the Badfish Creek confluence are generally lower than the downstream concentrations. In 2013, both the mean and median growing season phosphorus concentrations in the Yahara River upstream of the Badfish Creek confluence (location 10-Y) were less than the applicable numeric water quality criterion of 0.10 mg/l. The 2014 and 2015 growing season mean and median concentrations at 27
28 this location were approximately equal to the applicable water quality criterion. Growing season mean and median concentrations in the Yahara downstream of the Badfish Creek confluence (location 9A-Y) were slightly higher than the upstream concentrations in 2013 and 2014 and were slightly higher than the applicable numeric water quality criterion of 0.10 mg/l. There was greater disparity between upstream and downstream concentration in BFC BFC Yahara Yahara Pipe Bridge Hwy Y 9A-Y (Reach 69) (Reach 69) (Reach 68) (Reach 69) mg/l (May-Oct) Mean Median 2014 (May-Oct) Mean Median (May-Oct) Mean Median Table 12: Growing Season (May-Oct) Total P Concentrations at Selected Sampling Locations (Source: MMSD, Raw data, analytical methods and LOD/LOQ information provided in Appendix 2) In addition to the above monitoring efforts, DNR and other entities have conducted water quality monitoring activities in the Yahara Watershed. A map showing all known active monitoring locations in the Yahara Watershed is provided in Appendix 4. Active is defined as at least one sample being collected at the location during the past two years. In summary, there is an extensive data set for the Yahara Watershed that demonstrates high variability in baseline phosphorus concentrations between different dates and between different locations throughout the Yahara Watershed. While phosphorus concentrations at some locations are near or below applicable water quality criteria, they more commonly exceed the applicable criterion. The factors that influence phosphorus (and sediment/tss) levels and their variation in the Yahara Watershed are identified and discussed in the following section. Watershed Inventory This section presents an overview of various characteristics of the Yahara Watershed that influence phosphorus and TSS loading. This information is included in part to provide context and rationale for the practices selected to control phosphorus in the adaptive management plan. Climate and Precipitation Climatological information for the Yahara Watershed was obtained from the National Oceanic and Atmospheric Administration. Data from the Dane County Regional Airport is used to generally characterize climate in the Yahara Watershed. Table 13 presents average monthly data for the 30 year reporting period of Average monthly temperatures range from a low of 19 F in January to a high of 71 F in July. The average annual precipitation and snowfall are approximately 35 inches and 51 inches, respectively. Precipitation associated with any given event can vary significantly throughout the watershed and can influence phosphorus and TSS loading at the subwatershed scale. 28
29 Future projections of temperature and precipitation patterns by University of Wisconsin-Madison climate scientists indicate that Wisconsin will likely see warmer temperatures and increased precipitation. Large storm events are also likely to increase in frequency during spring and fall, increasing the chance of significant runoff events. Although climate is an uncontrollable variable in phosphorus and TSS reductions, it will be important to consider climate trends in subsequent modeling work conducted as part of the adaptive management project. As an example, the Rock River TMDL used a ten year precipitation record of for Soil and Water Assessment Tool (SWAT) modeling. The Yahara WINs updated SWAT modeling discussed later in this adaptive management plan looked at two different precipitation periods ( , and ). Modeled phosphorus loads for all eight TMDL stream reaches were higher using the more recent precipitation record. Future modeling of phosphorus and TSS loads as part of the adaptive management project will need to reflect relevant precipitation periods to arrive at more accurate load projections. Month Precip (inches) Snow (inches) Ave Temp (F) Jan Feb Mar Apr May Jun Jul Aug Sep Oct Nov Dec Annual Total Table 13: Climatological Information for the Yahara Watershed ( ) - Dane County Airport Location Soils General soil survey and related information for the watershed is available through multiple sources, including the Natural Resource Conservation Service (NRCS) Soil Survey Geographic Database (SSURGO) and the Dane County Land and Water Resources Data Viewer. Major soil groupings by TMDL stream reach as derived from the National Cooperative Soil Survey (USDA/NRCS) STATSGO2 dataset are shown in Appendix 5, along with brief descriptions of dominant soil series. This information is provided to present a broad overview of soils in the Yahara Watershed. 29
30 This section does not include detailed information about soil types and their distribution because on its own, the soil data does not create much of a picture of watershed conditions. However, soil information is reflected in the process of modeling and selecting management practices. For example, soil type is a data input for calculating the Phosphorus Index (PI) of agricultural lands. SNAP-Plus, Wisconsin s nutrient management planning software, is a tool that will be used extensively in the adaptive management project to calculate PI on a field by field basis. More detailed identification of soil types will be critical when using SNAP-Plus. Links to soil survey and other relevant information are available through SNAP-Plus. Dane County Land and Water Resources Department (LWRD) staff and County Conservation staff from Columbia and Rock Counties will play important roles in working with agricultural producers in the adaptive management project. They are highly skilled in using both SNAP-Plus and soil survey mapping tools. Land Cover Land cover for each TMDL stream reach is shown in Table 14 and was derived from the National Agricultural Statistics Service 2013 Cropland data layer. This information is also visually shown in Figure 7. There are some significant differences between land use/land cover between stream reaches that help inform the suite of phosphorus-reducing practices and opportunities that may be available and/or appropriate for each reach. As an example, Reach 64 has a relatively high percentage of agricultural and grass/pasture land compared to Reach 66. Agricultural Cropping Practices in the Yahara Watershed Data on cropping history for the period of broken down by TMDL stream reach is shown in the graphs in Figure 8. Cropping history is not provided for reach 65 as this reach contains only a small amount of agricultural land. The upper part of the watershed (e.g. reaches 62 and 63) has a high concentration of dairy farms and the crop history reflects dairy rotations. The lower part of the watershed is more reflective of cash crop rotations. County conservation staff knowledge of cropping practices and general farming practices will help inform the appropriate suite of engineering and conservation practices for each TMDL stream reach in the full-scale adaptive management project. 30
31 TMDL Stream Reach Land use Acres Agriculture 4,766 5,430 60,462 Developed/High Intensity 563 Developed/Low Intensity 2,297 Developed/Medium Intensity 1, , ,269 1,142 1,330 Grass/Pasture 2,505 1,318 19, , Water 26 Wetland ,011 1, ,217 2, , , ,256 2,021 1,922 11, ,184 1,573 Other Woodland ,668 2,234 Developed/Open Space LWRD Wetland ,674 6,253 8,264 37,437 8,612 1,719 1,183 5, , , , , ,351 1, ,417 Table 14: Land Cover by TMDL Stream Reach to the nearest acre. (From NASS 2014 with DNR Wetlands-created 09/11/2015 by Dane County LWRD) 31

32 Figure 7: Land Cover in the Yahara Watershed (Dane County LWRD) 32
33 33
 34")
34 Figure 8: Historic Cropping Practices by Stream Reach (Dane County LWRD) 34
35 Animal Agriculture The USDA-National Agricultural Statistics Service (USDA/NASS) provides county by county information on a variety of agricultural statistics, including cattle, milk cows, hogs/pigs and poultry densities. The most recent available report (2012) shows the following for Dane County: Category All cattle Milk cows Hogs and pigs Poultry Number of animals 135,000 52,000 28,000 71,300 Animal density information is not routinely available at a finer resolution (e.g. by TMDL stream reach). However, University of Wisconsin-Madison researchers are attempting to assemble data from a variety of information sources, which, when combined with a GIS overlay of TMDL stream reaches, would allow for a semi-quantitative estimate of animal units by stream reach. If available, this information will be considered in the implementation phase of the adaptive management project to help make adjustments to phosphorus load reductions The Rock River TMDL identified seven concentrated animal feeding operations (CAFOs) in the Yahara Watershed. In addition, the watershed is home to two community manure digesters, one in the Town of Vienna and the other in the Town of Springfield. The accompanying land management practices required of producers using these digesters, coupled with the potential export of products (e.g. cake and/or composted manure) out of the watershed can result in reduced phosphorus and TSS loads. There are also two privately owned manure digesters are located in the Town of Sun Prairie. Wetlands The Yahara Watershed contains significant wetlands and hydric soils. Spatial/locational information is available through both the Dane County Land Information Office Access Dane/DciMap GIS application (Water Resources Layer) and the Wisconsin DNR Surface Water Data Viewer (SWDV) application. Information on potentially restorable wetlands is also available. Wetland restoration is a practice that will be considered as part of the adaptive management implementation strategy, although it is worth noting that wetlands can be both a source and sink of phosphorus. Part 2: Current Phosphorus Loads and Load Reduction Targets DNR 9 Steps 6 This section meets DNR Adaptive Management Step 6: Estimate load reductions expected by permit term. 35
36 General Baseline phosphorus load estimates for the Yahara Watershed by source and TMDL stream reach were made in the Rock River TMDL. The December 2014 MOU between the District and DNR allows for adjustments to the TMDL baseline loads for point sources, nonpoint (agriculture) and MS4s to reflect current conditions. Per the MOU, adjustments are to be made as follows: Current conditions for municipal and industrial point sources at the start of the adaptive management project will be determined based on actual flow and effluent phosphorus concentrations reported to DNR on discharge monitoring reports (DMRs) using the most recent five year average. The difference between the current conditions and the TMDL baseline may be counted toward the reduction goal for the applicable reach. Conditions for nonpoint sources at the start of the adaptive management project will be determined using loads from the original Yahara Clean SWAT model (2010) that was updated in 2014 by extending the SWAT model to include the entire Yahara Watershed. The Yahara Watershed SWAT model should be consistent with methodologies and assumptions used in the EPA-approved TMDL. Revisions to the nonpoint loads generated by the Yahara Watershed SWAT model will be made to reflect the changes in nonpoint loads from both the installation of agricultural best management practices (BMPs) and any increases in loading from changes in agricultural management that have occurred since the time period covered in the Yahara Watershed SWAT model. Analysis for Municipal Separate Storm Sewer Systems (MS4s) will be consistent with DNR s TMDL Guidance for MS4 permits: Planning, Implementation, and Modeling Guidance The following sections summarize the current phosphorus loads in the Yahara Watershed by sector. If adjustments were or will be made to the TMDL baseline levels, these sections indicate the process for making those adjustments. Point Sources - Current Phosphorus Loads Data on current phosphorus loads for each of the 6 identified point sources located the Yahara Watershed was obtained from DNR staff (note that the Rock River TMDL report included Arlington as a point source, but DNR subsequently determined that Arlington does not discharge to a water body that is hydrologically connected to the Yahara River Basin and Rock River). Per the 2014 MOU with DNR, current loads are based on the most recent five year average ( ) flow and effluent phosphorus concentrations and are shown in Table 15. The raw data is provided in Appendix 6. These are the loads being used to determine phosphorus reductions required from point sources in the adaptive management project during the first five years of the adaptive management project (note: these loads will be adjusted every five years at WPDES permit reissuance). While the Middleton-Tiedeman Pond is identified as a point source in the TMDL, the load and allocation has been assigned to the City of Middleton and for TMDL compliance purposes is added to the City of Middleton MS4 load and allocation. 36
37 Point Source MMSD WWTF Oregon WWTF Stoughton WWTF DNR-Nevin Fish Hatchery MG&E Middleton-Tiedeman Pond Stream Reach Flow (MGD) Effluent P Conc (mg/l) P Load (lbs.) 31,841 3,321 2, Table 15: Annual Phosphorus Loads by Point Source ( Average). Data obtained from personal communication with Theresa Nelson of DNR. Nonpoint Sources - Current Phosphorus Loads The 2014 MOU with DNR states that conditions for nonpoint sources at the start of the adaptive management project will be determined using loads from the original Yahara Clean SWAT model (2010) which was updated in 2014 by extending the SWAT model to include the entire Yahara Watershed (Yahara WINs Extended SWAT Model to estimate Baseline Phosphorus Loading to the Yahara Watershed: MARS; 2014). The updated SWAT model used much of the same information and modeling approaches as in the Rock River TMDL, with the exception of updated data sources and a higher resolution spatial scale The extended SWAT model was run using two different precipitation records ( and ). The precipitation record was the precipitation record used in developing the nonpoint baseline phosphorus loads in the Rock River TMDL. When comparing loads between the two precipitation periods, the precipitation period of returned the highest loads for each stream reach, as shown in Figure 9. To be conservative, the precipitation period was used to characterize the extended SWAT modeled nonpoint loads. When comparing 2014 SWAT model nonpoint phosphorus loads to TMDL baseline loads for nonpoint, the 2014 SWAT model showed slightly higher loads for two stream reaches (63 and 66) than the TMDL baseline. Therefore, the higher loads were used for these two reaches to describe current loads. In the remaining stream reaches (62, 64, 65, 67, 68 and 69) the TMDL showed higher baseline loads than the 2014 SWAT modeled loads. For these stream reaches a reasonably conservative approach was used to describe current conditions. Specifically, the difference between the TMDL baseline and the 2014 SWAT modeled load was calculated for each stream reach. Seventy-five percent (75%) of the difference was then added back to the 2014 SWAT modeled load as a conservative estimate of current conditions. The resulting conservatively estimated annual current phosphorus loads by stream reach for nonpoint sources, expressed as annual averages, are shown in Table
38 Figure 9: Mean nonpoint baseline phosphorus loads for the Yahara Watershed using two different precipitation periods. Data derived from the MARS 2014 extended SWAT model and further analysis by John Reimer at Dane County Land and Water Resources Department. Stream Reach Phosphorus load (lbs. /yr.) Total 14,559 4,916 83, ,264 4,364 4,593 25, ,243 Table 16: Annual Nonpoint Phosphorus Loads (non-ms4) by TMDL Stream Reach MS4s Current Phosphorus Loads The 2014 MOU with DNR states that analysis for MS4s will be consistent with the Department s TMDL Guidance for MS4 permits: Planning, Implementation, and Modeling Guidance. If the current conditions discharge value from an MS4 is lower than the TMDL baseline loading condition for the MS4, then the difference may be counted toward the TMDL percent reduction goals in the applicable reach. Most of the MS4s that discharge to the Yahara Watershed have not yet updated their stormwater models consistent with the aforementioned guidance. Based on discussions with pilot project partners, it appears that in most cases, updated modeling should be completed within the next 18 months. Therefore, the TMDL reported baseline loads for MS4s are used as a placeholder to describe current MS4 loads. When the updated modeling is complete, current load information will be substituted for the TMDL baseline loads per the 2014 MOU. Updated modeling could result in either increased or decreased 38
39 MS4 loads. Current annual phosphorus loads for MS4s with discharges to the Yahara Watershed, summarized by stream reach, are shown in Table 17. Detailed information for each MS4 by stream reach is shown in Appendix 7. Loads and load reductions associated with MS4s in all relevant tables assume full participation by all MS4s. Per the 2014 MOU, if an individual MS4 decides not to participate in the full-scale adaptive management project, adjustments to all tables characterizing both current conditions and required reductions for MS4s will be made as appropriate. Stream Reach Total MS4 P load (lbs. /yr.) 3, ,338 3,593 8,998 2, ,599 Table 17: Annual MS4 Phosphorus Loads by TMDL Stream Reach. Data compiled by MMSD staff from TMDL spreadsheets provided by Matt Diebel of DNR. Nonpermitted Urban and Background-Current Phosphorus Loads Nonpermitted urban and background loads are assumed to be consistent with the TMDL baseline loads for those categories and are shown in Table 18. Stream Reach Non-permitted Urban Background , , Total , Total , ,372 3, ,989 Phosphorus Load (lbs. /yr.) 14,041 Table 18: Annual Nonpermitted Urban and Background Phosphorus Loads by TMDL Stream Reach. Data compiled by MMSD staff from information contained in the Rock Rive TMDL Document. Summary of Current Phosphorus Loads Current annual phosphorus loads as previously determined are summarized by stream reach in Table 19. Stream Reach Point Total Phosphorus Load (lbs. /yr.) 419 2,013 35,162 37,934 Nonpoint 14,559 4,916 83, ,264 4,364 4,593 25, ,243 MS4 3, ,338 3,593 8,998 2, ,599 Nonpermitted Urban Background , , , , ,372 8,966 Total 19,233 5, ,028 5,345 35,694 7,122 8,001 62, ,817 Table 19: Total Annual Phosphorus Loads by Source and TMDL Stream Reach 39
40 Phosphorus Load Reductions Required By Sector This section explains the assumptions and calculations used to calculate the phosphorus load reductions required to meet the TMDL load allocations for each sector. When this section refers to current loads, the values from the preceding section apply. Method for calculating required reductions The method for determining the load reductions for each sector are shown below: Point sources The annual phosphorus load reduction is calculated as the current load minus the annual target or allocated load from the TMDL. For wastewater treatment plants with current effluent concentrations above the adaptive management interim effluent limits of 0.6 mg/l and 0.5 mg/l, it was assumed that those reductions will be accomplished by the individual treatment plants and are not included in the load reduction accomplished through the adaptive management project. Nonpoint sources: The annual phosphorus load reduction is calculated as the current load minus the annual target or allocated load from the TMDL. This results in a conservative load reduction estimate since the current nonpoint baseline was updated using conservative assumptions, as explained in the preceding section. MS4 sources: As a placeholder, the annual MS4 load reduction in this adaptive management plan was calculated as the TMDL baseline load minus the TMDL allocation. As MS4s update their stormwater modeling, the placeholder value will be replaced with the annual load reduction determined following the Department s TMDL Guidance for MS4 permits: Planning, Implementation, and Modeling Guidance. Nonpermitted Urban and Background sources: The annual phosphorus load reduction for these two categories was calculated as follows: TMDL Baseline x % reduction = Annual load reduction Required phosphorus reductions by TMDL stream reach Required phosphorus load reductions summarized by source category and stream reach are shown in Table 20. Reductions for the three point sources that are wastewater treatment plants are specifically shown in this table. Corresponding detailed reduction information for all sources is provided in Appendix 8. It is important to point out that these load reductions may not be accomplished entirely through the adaptive management project. For example, an MS4 community may choose to accomplish a portion of their load reduction through projects implemented independently. Those reductions (if any) will be subtracted from the load reductions identified above. An example of an independent project conducted by an MS4 could be chemical treatment of stormwater. The City of Madison currently has a chemical treatment demonstration project at the Arboretum Pond (Glenway and Monroe Street intersection). It is also important to note that loads associated with point sources can vary from year to year as flow and effluent phosphorus concentrations change, and the loads associated with nonpoint can vary with cropping practices and animal density. Thus, the above load reductions are considered as a starting 40
41 point and adjustments (either up or down) will need to be periodically made to reflect changing conditions. Adjustments will be made at the beginning of each WPDES permit term. Stream Reach Point MMSD Oregon Stoughton DNR Phosphorus load Reductions (lbs. /yr.) ,063 10,444 1, Total 12,381 Nonpoint 6,951 1,946 24, , ,403 8,650 54,673 MS4 3, ,843 2,630 5, ,488 Nonpermitted Urban Background , , , , ,522 Total 10,866 2,050 47,707 3,375 17, ,323 22, ,137 Table 20: Required Phosphorus Load Reductions (lbs. /year) by TMDL Source Category and TMDL Stream Reach. Data compiled by MMSD staff. MMSD and the Dane County LWRD developed a comprehensive adaptive management cost/implementation model to guide adaptive management efforts. For this model, it was necessary to select phosphorus-reducing practices and estimate the load reductions and costs associated with those practices; so much of the adaptive management plan naturally reflects this model. The model is explained in more detail later in this document. Model outputs include phosphorus reductions by year and by TMDL stream reach. The model includes a ramp-up period that would result in 50 percent of the necessary load reduction being achieved by the end of the eighth year of the project, and 100 percent of the required load reductions being achieved in all eight stream reaches by the end of the seventeenth year. Required TSS reductions by TMDL stream reach In general, phosphorus reductions can be used as a surrogate for achieving the required TSS reductions. In other words, if the phosphorus reductions required under the adaptive management project are achieved, it is assumed that the sediment reductions will also be achieved. Sediment reductions required to meet the narrative TSS standard are summarized by source and TMDL stream reach are in Table 21. Detailed information about required sediment reductions by stream reach is provided in Appendix 9. Sediment reductions will be tracked throughout the adaptive management project in the same manner that phosphorus reductions will be tracked. 41
42 Stream Reach Point MMSD Oregon Stoughton DNR TSS Load Reductions (tons/yr.) Total Nonpoint 2, , ,270 14,820 MS , ,171 Nonpermitted Urban Background Total 3, , , ,282 18,126 Table 21: Required Sediment Load Reductions (lbs. /year) by TMDL Source Category and TMDL Stream Reach. Data compiled by MMSD staff using information contained in the Rock River TMDL. 42
43 III. Adaptive Management Strategy While the previous section provided background and context for adaptive management in the Yahara Watershed, this section contains the implementation strategy for adaptive management itself. This section is divided into three parts: 1. The cost/implementation model that guides key aspects of the Adaptive Management Plan 2. Identification of partners that will be involved in implementing adaptive management and their associated roles 3. Implementation strategy including a list of phosphorus-reducing practices that will likely be used in adaptive management and a detailed methodology that will be used to identify, incentivize, implement and verify agricultural phosphorus-reducing practices Part 1: Cost/Implementation Model DNR Steps 6 9 This section meets some requirements of the DNR Adaptive Management Step 6: Estimate load reductions expected by permit term; and Step 9: Implementation Schedule with Milestone The adaptive management strategy frequently references information derived from the adaptive management cost/implementation model. This spreadsheet-based model was developed by MMSD and Dane County LWRD to estimate the cost associated with the adaptive management plan. However, model inputs/outputs also help inform key aspects of the adaptive management plan, such as estimated phosphorus reductions due to implemented practices. The cost/implementation model is briefly described below. Model Inputs Model inputs include the following: Phosphorus management practices and associated phosphorus reduction (lbs./year) Practice shelf life Practice cost by unit (e.g. per acre of cover crop) Staff cost by practice for implementation Phosphorus reduction requirement by TMDL stream reach Ramp-up period to achieve phosphorus reductions and interim targets Anticipated staffing efficiencies in delivering phosphorus reduction practices during the life of the adaptive management project Water quality monitoring cost Inflation factor (2.4% annual inflation factor was used in the model) 43
44 Dane County LWRD staff inventoried all conservation practices that were installed in the Yahara Watershed for the period of The list was broken down by TMDL stream reach. Dane County LWRD staff categorized practices by type (Engineering vs. Management), and calculated the estimated phosphorus reduction for each practice. Dane County LWRD staff also estimated the amount of staff time that it typically takes for practice implementation, including landowner contacts, planning, design, and practice implementation. The designed life expectancy of each practice was identified, along with the practice cost and the cost per pound of phosphorus reduced. Where practice cost for a given practice varied, the practice cost used in the model was conservatively set at the highest practice cost. Dane County LWRD staff then used this information to develop a suite of phosphorus-reducing practices by stream reach for the fullscale adaptive management project. The suite of practices used in the cost model is not identical to the historic suite of practices, as some preference was given to practices with longer designed life expectancies. In addition, in some cases it was assumed that the designed life expectancy could be extended through contractual agreements. Model Outputs The model outputs include: Total project cost and annual costs, both with and without inflation The cost per pound of phosphorus reduced Annual phosphorus reduction (pounds) by stream reach based on total project phosphorus reductions and ramp-up periods Staffing needs based on current and anticipated staffing efficiencies for practice implementation Allocation of adaptive management cost for project participants The model designates phosphorus reductions as either new or carry-over pounds of phosphorus. This distinction is needed for accounting and tracking purposes over the 20 year adaptive management period. For example, if a practice has an effective shelf life of ten years and results in an annual phosphorus reduction of 100 lbs./year, the pounds in the first year are considered new while the pounds in the remaining year(s) are considered as carry over. The model contains phosphorus reduction goals by TMDL stream reach and year, and uses a 17-year ramp-up period to accomplish 100% of the phosphorus reductions needed to meet the TMDL allocations for all sources/source categories in the Yahara Watershed. The model also includes funding to support water quality monitoring activities associated with the adaptive management project. Part 2: Identification of Partners DNR 9 Steps 1 8 This section meets DNR Adaptive Management Step 1: Identify Partners; and Step 8: Financial Support 44
45 This adaptive management plan builds off of the existing partnerships formed through the adaptive management pilot project. Partners fall into two broad categories. The first category contains WPDES permit holders specifically identified in the Rock River TMDL as having a discharge to the Yahara Watershed. This category includes traditional point source dischargers such as wastewater treatment plants, and MS4s. The second category includes a diverse group of entities that are not WPDES permit holders, but will likely play important roles in the success of adaptive management. This category includes: County, state and federal agencies (e.g. Dane County LWRD, USGS) Non-profit groups focused on conservation and/or water quality (e.g. Sand County Foundation, Clean Lakes Alliance) Friends groups Agricultural producers (e.g. Yahara Pride Farms) University researchers Others Table 22 identifies current and potential adaptive management partners along with their corresponding roles and responsibilities. It is anticipated that this list will continue to expand as the adaptive management project moves forward. Letters of support from a representative cross section of partners in the second category are included in Appendix 11. Of note is the fact that the Wisconsin DNR has a unique role in the adaptive management project in that it is a permitted entity listed in the TMDL, is engaged in water quality monitoring activities (including water chemistry and biological monitoring) in the Yahara Watershed, and has the responsibility of reviewing and approving the adaptive management plan. 45
46 Partner Point Source WPDES permitted discharges Madison Metropolitan Sewerage District Roles and Responsibilities Plan development/review, project coordination, facilitation, management, measurement/monitoring, I&E, in-kind support, funding, submitting annual reports to DNR, laboratory analytical support Oregon WWTP, Stoughton Utilities, Madison I&E, funding, in-kind support, Gas & Electric, DNR-Fish Hatchery measurement/monitoring Municipal Separate Storm Sewer System (MS4s) Permitted Communities Towns Villages Cities I&E, funding, in-kind support, measurement/monitoring, practice implementation Blooming Grove Cottage Fitchburg Bristol Grove Madison Burke DeForest Middleton Cottage Grove Maple Bluff Monona Dunkirk McFarland Stoughton Dunn Shorewood Sun Prairie Middleton Hills Pleasant Springs Waunakee Westport Windsor Others UW-Madison Other partners Dane County Land and Water Resources Department Columbia County Land and Water Department Rock County Land Conservation Department USGS Clean Lakes Alliance Clean Wisconsin Sand County Foundation Yahara Pride Farms Capital Area Regional Planning Commission Friends Groups-e.g. Friends of Pheasant Branch Conservancy River Alliance of Wisconsin Rock River Coalition USDA/NRCS Wisconsin Department of Agriculture, Trade and Consumer Yahara Lakes Association UW Extension DNR Wisconsin Land and Water Conservation Ass. Plan review, agriculture broker, verification/auditing of practices, measurement/monitoring of phosphorus reductions, I&E, in-kind support, potential targeted funding Water quality monitoring, data evaluation/reporting, and related funding support Private sector funding, technical support, I&E, community engagement Plan review, I&E, in-kind support I&E, possible targeted funding I&E, in-kind support, P reduction practice implementation I&E, in-kind support I&E Plan review, I&E, in-kind support Water quality monitoring, I&E Funding for P reduction practices, I&E Plan review, in-kind support, targeted funding I&E I&E, in-kind support Plan review, measurement/monitoring, I&E, regulatory oversight I&E Table 22: Participating Partners and Associated Roles 46
47 Part 3: Phosphorus-Reducing Practices DNR 9 Steps 4 5 This section meets DNR Adaptive Management Step 4: Identify where reductions will occur; and Step 5: Describe management measures. Phosphorus-Reducing Practices - Urban Control of phosphorus from urban sources will be important in the adaptive management project. At a minimum, MS4s participating in the adaptive management project will need to meet the baseline phosphorus and TSS control levels assumed in the Rock River TMDL independent of adaptive management. These municipal entities may also choose to accomplish some portion of their required phosphorus and TSS reductions (above the baseline) independent of adaptive management. Alternatively, investments in cost-effective urban practices may be part of the adaptive management plan. MS4 partners will likely identify opportunities through their stormwater management plans. Practices resulting in phosphorus or TSS reductions in excess of those required to meet baseline TMDL conditions will be candidates for funding under the adaptive management project. Actual decisions to fund will be based on the cost per pound of phosphorus controlled and other relevant factors. A suite of urban practices have been used or could potentially be used as part of adaptive management. A short list is shown below: Improved leaf collection Rain gardens Street sweeping Construction site erosion control Porous pavement Biofiltration Detention ponds Retention ponds Proprietary devices Stream bank stabilization Chemical treatment Swales/vegetative filter strips Phosphorus-Reducing Practices - Rural Adaptive management partners will support a suite of management measures to reduce agricultural phosphorus runoff in the Yahara Watershed. A list of NRCS National Conservation Practice Standards that will likely (although not exclusively) be used to reduce phosphorus runoff is shown in Table 24. This list was developed by the Dane County LWRD based on a review of practices known to have been implemented in the Yahara Watershed during the period of and additional insights by Dane County LWRD staff. The list in Table 23, along with costs and estimated phosphorus reductions associated with each practice, was used in the development of the adaptive management cost/implementation model described earlier in this document. 47
48 In addition to the NRCS National Conservation Practice Standards, there are two new practices that show promise for use in the watershed based on experience gained in the adaptive management pilot project: low disturbance manure injection (LDMI) and harvestable buffers. For many livestock operations in the Yahara River Watershed, manure incorporation is a standard practice. While traditional incorporation methods move a great deal of soil and increase the potential for soil erosion, low disturbance manure injection (LDMI) is a relatively new farming system that incorporates manure into the soil with minimal soil disturbance. A cost share program for LDMI equipment purchase by farmers is being pilot tested in the Yahara Watershed in 2015, with funding support from Dane County, Yahara WINs and the Clean Lakes Alliance. NRCS National Conservation Practice Standards Code Name 313 Waste Storage Facility Type 328 Conservation Crop Rotation Management 329 Residue and Tillage Management No Till Management 330 Contour Farming Management 332 Contour Buffer Strips Management 340 Cover Crop Management 342 Critical Area Planting Management 362 Diversion 391 Riparian Forest Buffer 393 Filter Strip Engineering 410 Grade Stabilization Structure Engineering 412 Grassed Waterway Engineering 512 Forage and Biomass Planting 558 Roof Runoff Structure Engineering 580 Streambank and Shoreline Protection Engineering 590 Nutrient Management Management 592 Feed Management Management 600 Terrace 612 Tree/Shrub Establishment 629 Waste Treatment Engineering Vegetated Treatment Area Engineering Water and TSS Control Engineering Engineering Engineering Management Management Engineering Management Restoration and Management of Rare and Declining Habitats Wetland Restoration Management Engineering Table 23: NRCS Conservation Practice Standards 48
49 Yahara WINs and Dane County LWRD have also initiated a Harvestable Buffer Program. The value of stream buffers in protecting water quality has long been recognized. However, there has been reluctance on the part of some agricultural producers to install buffers since this takes agricultural land out of production. The Harvestable Buffer Program allows producers to install buffers using vegetation that has agricultural value. Initiated in 2014, the Harvestable Buffer Program has been very successful. Producers are paid per acre plus the cost of seed and agree to maintain the buffers for five to ten years. In 2016 the harvestable buffer program will be expanded to include a 15 year contract option. Other practices are likely to emerge and adaptive management project partners will work to encourage new and/or innovative approaches. Although not a conservation practice per se, removal of in-stream legacy TSS is currently being evaluated as part of the Yahara WINs effort. In addition, Yahara WINs has encouraged new and innovative approaches by administering grant programs. Started in 2013, this program allows Yahara WINs partners with ideas for phosphorus-reducing practices to apply directly for WINs funding. Each proposal is reviewed and ranked based on the lowest cost per pound of phosphorus reduced. Funded projects have ranged from stormwater treatment devices to a dairy heifer grazing initiative. This funding model will likely persist in the full-scale adaptive management project. Agricultural Implementation Strategy The adaptive management implementation strategy focuses primarily on implementation of agricultural phosphorus control practices since these will generally have a lower unit cost per pound of phosphorus control than urban practices. The majority of the Yahara Watershed is located in Dane County. Therefore, this agricultural implementation strategy focuses on the Dane County portion of the Yahara Watershed. Key elements of this strategy will be transferred as appropriate to the portions of the watershed outside of Dane County through coordination between Dane County LWRD and neighboring county conservation departments. The Dane County LWRD played a key role in developing the agricultural implementation strategy. Implementation Plan: To ensure achievement of the overall adaptive management phosphorus reduction goal of roughly 106,000 pounds per year, a three phased approach will be used to prioritize, implement, verify and quantify phosphorus reductions associated with conservation practices. This procedure ensures execution efficiencies while promoting a systems approach that encourages the implementation and management of multiple practices that work together to reduce phosphorus losses. In addition, this approach is similar to existing implementation procedures Dane County LWRD utilizes to implement conservation work throughout Dane County. The following sections provide specific details on each of the three phases. Dane County LWRD intends to use this focused implementation strategy to maximize resource efficiency. However, phosphorusreducing efforts will not be limited to priority areas. Dane County LWRD provides numerous services to landowners throughout Dane County and will continue to work with all county individuals on implementing phosphorus-reducing practices regardless of whether they are located within currently identified priority areas. This is beneficial in that it can help build momentum and support in areas that may, in the future, become priority areas for a variety of implementation programs. Phase 1: Watershed Evaluation, Prioritization and Inventory Phase 1 will involve the following three steps 49
50 1. Conduct an evaluation of the Rock River TMDL and establish load reductions for nonpoint source phosphorus contributing areas-note that this has already been done elsewhere in the adaptive management plan document. 2. Prioritize identified nonpoint source phosphorus contributing areas. 3. Inventory resource concerns based on prioritized source areas. Evaluation The Rock River TMDL serves as the primary source for the quantitative analysis of nonpoint source phosphorus within the Yahara and Badfish Creek Watersheds. The Cadmus Group conducted this analysis for the Wisconsin DNR and U.S. Environmental Protection Agency (EPA). The analysis used the Soil and Water Assessment Tool (SWAT) which incorporated data on land use, land cover, land topography, soils, climate, and other factors to determine the pounds of phosphorus running off and entering surface waters from both nonpoint and point sources. These loadings were based on defined TMDL reaches of which eight (62, 63, 64, 65, 66, 67, 68, and 69) are located within the Yahara and Badfish Creek Watersheds. These TMDL reaches are important in that they serve as the base geographic area for reporting accomplishments and progress towards meeting established adaptive management phosphorus reduction goals. Overall phosphorus reduction goals for adaptive management have been established for each of the eight TMDL stream reaches based on both the load allocations and percent reductions from the TMDL. These reductions will serve as one of the many metrics in monitoring progress and measuring success of the strategic implementation plan. Prioritizing Nonpoint Areas Prioritizing implementation based on nonpoint source loadings from the TMDL is not efficient given the large discrepancy in geographic sizes of these reaches. Even though reach 64 has the largest phosphorus reduction goal, other reaches may have areas contributing more phosphorus on an annual basis but are being masked given their smaller relative size. To ensure a more standardized approach in determining priority areas, LWRD has used data from the Montgomery Associates: Resource Solutions Yahara WINs Extended SWAT Model to create a high level (regional) comparison. The Yahara WINs Extended SWAT Model used much of the same information and modeling approaches as in the Rock River TMDL, with the exception of updated data sources and a higher resolution spatial scale. This finer-scale analysis provides the ability to aggregate the data efficiently producing better and more informed results. Details on the Yahara WINs Extended SWAT Model can be found at 20SWAT%20Model%20Final%20Report%20Revised%20June% pdf Data from the Yahara WINs Extended SWAT Model was aggregated up to the HUC-12 watershed scale to provide a standardized spatial comparison to identify priority areas. Phosphorus and TSS loading rate (pounds/acre) maps were created to assist in identifying priority areas within the Yahara and Badfish Creek Watersheds. Priority has and will continue to be given to those HUC-12 watersheds with the highest loading rates. Figures 10 and 11 show generalized prioritization for phosphorus and TSS respectively. Figure 12 provides an example of how a select watershed (Door Creek Watershed) can be further broken down to the subwatershed level for prioritization purposes. As focused efforts are completed in high priority HUC-12 watersheds, emphasis will shift to lower priority watersheds. However, the adaptive management project will be flexible in advancing phosphorus and TSS reductions in any watershed where there is a resource need, willing landowners and available funds. 50
51 Inventorying Source Areas Once a HUC-12 watershed has been selected as a priority area, a further evaluation will be conducted to identify sub areas (sub-huc-12 s) that are contributing more phosphorus than others. This supports the approach of prioritizing the most critical sites first in order to maximize phosphorus reductions and efficiency. County staff will then use their knowledge of the watershed in conjunction with evaluation tools (air photos, conservation plans, etc.) to identify and inventory known resource concerns. Staff will also identify and contact current landowners to aid in the conservation planning process. Phase 2: Practice Implementation and Quantification Phase 2 will involve the following two steps: 1. Conservation planning and practice implementation. 2. Quantification of phosphorus reductions as a result of conservation plan implementation. Practice Implementation To proceed with implementation, County staff will contact the corresponding landowner(s) of the highest ranked sub-huc-12 areas with identified resource concerns to initiate the conservation planning process. This process consists of the steps shown in Figure 13. A wide range of phosphorus-reducing practices are eligible for producers to select, providing them with flexibility in choosing practices that fit their operations. Practices can be broken down into three main categories; Management Soft Practices: This category includes a variety of agricultural management practices used to address nutrient and TSS loss typically from cropped fields such as nutrient management planning, crop rotations, changes in tillage, and cover crops. Soft practices refer to the fact that these practices are planned and implemented on land with changing management needs or may be limited in timing. Structural Hard Practices: This category includes a variety of agricultural management practices used to address nutrient and TSS loss from cropped fields and production sites. These may include grassed waterways, terraces, manure storage, or barnyard runoff controls. Hard practices refer to the fact that these practices require elements of engineering, design, construction and installation of permanent structures. Innovative Practices: This category can include a variety of new or innovative practices to be used as part of the management of cropped fields or livestock production sites that are not traditionally utilized or do not have technical standards. This may include harvestable buffers, easements, or alternative manure treatment systems. 51

52 Figure 10: Relative Distribution of Nonpoint Phosphorus Loads by Stream Reach 52
53 Figure 11: Relative Distribution of Nonpoint TSS Loads by Stream Reach 53

54 Figure 12: Door Creek Sub-watershed Prioritization 54

55 Figure 13: Conservation Planning Process 55
56 Quantification The District, Dane County LWRD and DNR staff previously agreed on the models and/or methods that will be used to evaluate and verify corresponding phosphorus reductions. These models and/or methods include SNAP Plus, BARNY (barnyard runoff model), P8 (Urban Catchment Model) or use of calculations based on TSS Loss x Phosphorus Concentration (SL x PC). Figure 14 shows the agreed upon models and/or methods. New models or methods may emerge that are appropriate for use in quantifying reductions. Any new models or methods will be discussed with DNR and will be subject to DNR approval before they are used to quantify reductions in the adaptive management project. Phase 3: Verification and Reporting Phase 3 will involve the following steps: Verifying the status of installed phosphorus-reducing practices by conducting follow-up visits with landowners. Address operation and maintenance concerns. Update phosphorus load reduction modeling, when necessary. Developing reports summarizing activities associated with the adaptive management plan. Verification Dane County LWRD will verify the status of the installed and contracted practices that Dane County staff assisted with as part of the adaptive management program. At a minimum, practices will be verified once every four years. Verification includes reviewing all applicable practices associated with an implemented conservation system and may include reviewing the conservation plan, nutrient management plan, operation/maintenance plans, cropland practices, and production site practices. Records and data for the practices, contracts, and phosphorus reductions implemented and managed through county programs associated with the adaptive management project will be recorded and maintained by Dane County LWRD. Dane County LWRD will conduct periodic quality control reviews of entered data to ensure the accuracy of the collected information. Practices will be recorded spatially using Geographic Information System (GIS) software along with LWRD s Conservation Planning System (CPS) software. In order to manage workload between implementing new practices and verifying existing and previously installed conservation practices, Dane County LWRD will apply the following schedule for the verification of practices and conservation systems as part of adaptive management: In a four year rotation, Dane County LWRD will conduct status reviews in the Yahara Watershed by township. This schedule will be incorporated into LWRD s broader (county wide) verification procedures. Year 1: Cottage Grove, Windsor, Burke, Rutland, Oregon Year 2: Middleton, Dunkirk, Blooming Grove, Dunn, Albion, Berry Year 3: Pleasant Springs, Fitchburg, Springfield, Vienna, Roxbury Year 4: Westport, Madison, Dane, Sun Prairie, Bristol Status reviews may result in the need to address maintenance and repair concerns for already installed practices. These situations will be evaluated and addressed as they are discovered. 56
57 While conducting status reviews, new resource concerns, practices, and/or landowners may be identified to participate in adaptive management. These will be added to existing inventory work identified in Phase 1. As part of each status review the following steps will be used to ensure that all associated phosphorus reductions are valid and can continue to be reported and accredited to the adaptive management effort: Conduct follow-up status review Determine BMP status Issue status determination to landowner Take corrective measures as needed Document that required corrective measures (if any) are completed Update tracking system, including modeling, as needed Reporting and Measuring Progress Measuring progress in relation to implementation will consist of assessing a number of different metrics. In addition to measuring yearly progress towards meeting annual phosphorus reduction goals, the following metrics will be captured annually as performance indicators: Number of landowners/operators contacted, Number of cost-share agreements signed, Number of one on one contacts made with landowners in the watershed, Planned and completed conservation practices, Pollutant load reductions and percent of goal planned and achieved, Numbers of verification checks to make sure management plans (nutrient management, grazing management, etc.) are being followed by landowners, Status of nutrient management planning, and easement acquisition and development, Total amount of money on cost-share agreements, and Total amount of landowner reimbursements made Units associated with each metric above will be summarized annually over the life the adaptive management project to monitor for potential trends and provide data to make informed decisions. Given the many unknowns that are associated with implementing conservation practices (e.g. willingness of landowner, commodity prices, weather, land tenure, etc.) this robust approach in measuring progress will ensure that decisions related to modifying the implementation plan will be vetted and appropriately adopted. 57

58 Figure 14: Phosphorus Reduction Calculation Models and/or Methods 58
59 IV. Water Quality Monitoring DNR 9 Steps 7 This section meets DNR Adaptive Management Step 7: Measuring Success Objectives Water quality monitoring is a required element of an adaptive management project and is used to determine progress toward meeting applicable water quality criteria. This water quality monitoring component builds off the water quality monitoring efforts already in place in the Yahara Watershed. Overarching objectives include: Demonstrating interim adaptive management progress toward meeting applicable numeric waters quality criterion and TMDL requirements. Demonstrating ultimate compliance with adaptive management and TMDL requirements. Developing the necessary database to support delisting decisions for those stream segments located in the Yahara Watershed that are identified as impaired per the Rock River TMDL. Demonstrating the progress and effectiveness of BMPs through targeted monitoring. The 2014 MOU states that compliance at the end of the adaptive management period shall be measured based on: Attainment of the phosphorus water quality criteria and TSS narrative standards through water quality monitoring. If phosphorus water quality criteria or TSS narrative standards have not been attained, compliance can be measured using effluent data and watershed modeling that uses similar assumptions as the TMDL to demonstrate that the sum total of the allocations have been achieved for each reach. If some, but not all, reaches are complying with the allocations of the TMDL, only those point sources in the complying reaches will be considered in compliance at the end of the adaptive management period. Point sources will only be deemed in compliance for pollutants for which the allocations have been achieved (i.e. for a specific reach, if allocations are attained for TSS but not phosphorus, the point source in that reach will only be deemed in compliance for TSS). Guidance Considered The following guidance documents were considered in developing the water quality monitoring component of the adaptive management plan: WisCALM-2014 Update Adaptive Management Technical Handbook-January,
60 Guidance for Implementing Water Quality Trading in WPDES Permits-March 2013 Draft Guidance for Implementing Wisconsin s Phosphorus Water Quality Standards for Point Source Discharges-January, 2012 The adaptive management technical handbook and WisCALM guidance indicate that the minimum sampling frequency to demonstrate compliance with numeric water quality criteria is monthly sampling during the growing season (May-October). Discussions with USGS and DNR staff highlighted the importance of analyzing at a greater frequency initially to gain better insight on the temporal variability, particularly during the spring runoff season. The Adaptive Management Technical Handbook states that monitoring by TMDL stream reach is required if the adaptive management action area is within a TMDL area. There are eight TMDL reaches located in the Yahara Watershed (reaches 62-69) as specified in the Rock River TMDL (see Figure 2). NR 217 does not explicitly require stream flow monitoring for the purpose of demonstrating compliance with adaptive management requirements. The adaptive management technical handbook (guidance) states that both concentration and flow measurements should be collected. Since adaptive management as codified in NR 217 requires a demonstration that applicable numeric water quality criterion for phosphorus in NR be met, in-stream monitoring would necessarily need to focus on concentration. This monitoring strategy will focus on water chemistry monitoring, and will be supplemented with flow monitoring at stream locations having existing USGS gaging stations. Flow information may be collected in other areas using portable flow meters. The Rock River TMDL lists several stream segments located in the Yahara Watershed as being impaired. All impaired segments identify TP and TSS as the pollutants, with the exception of Dorn Creek (TSS only). The TMDL document notes that it is reasonable to expect that TMDL implementation actions that reduce TP to acceptable levels will also reduce TSS loads to an extent sufficient to achieve designated fish and other aquatic life uses. As noted above, the applicable numeric water quality criteria for TP in NR 102 are concentration based. Thus, compliance with the TMDL will likely be based on meeting the applicable numeric water quality criterion for TP and demonstrating that habitat issues have been addressed, as evidenced by biological (macroinvertebrate and fish sampling) and habitat monitoring. DO monitoring and temperature will be important at select locations where temperature or DO problems have been documented. The proposed monitoring program reflects these considerations. DNR staff has suggested that the monitoring program should be designed to support the potential transition from adaptive management to water quality trading. DNR recently released two draft guidance documents related to water quality trading for public comment (Guidance for Implementing Water Quality Trading in WPDES Permits; Water Quality Trading How-To Manual, August 2013). Neither document requires water quality monitoring, although both reference the need for effluent quality monitoring. With respect to quantifying phosphorus reductions in a trading program the How To manual states that modeling will likely be used to quantify the current pollution load as well as the reductions made from agricultural and urban management practices. The guidance goes on to identify several applicable models. While water quality monitoring is not a specific requirement for water quality trading, some level of water quality monitoring may be beneficial to support a trading program. It is anticipated that the monitoring approach outlined for adaptive management would be sufficient to support a water quality trading program. 60
61 Monitoring locations Per the adaptive management technical handbook, in-stream TP concentrations will be monitored at or near the bottom of each stream reach in the Yahara Watershed. From a practical standpoint, consideration needs to be given to accessibility and safety considerations when selecting monitoring locations. Figure 15 shows active water quality monitoring locations in the Yahara Watershed, with active being defined as the site having been sampled for water chemistry at least once in the last two years. It is the intent to continue monitoring at these locations as part of the adaptive management project. While there is wide geographic distribution of sampling locations, additional sampling may be needed in a few TMDL stream reaches (e.g. in reaches 64 and 66). Yahara WINs will work with DNR staff to identify additional sampling locations. Stream flow data will be collected at select locations within stream reaches that currently have operating USGS gaging stations. Consideration will be given to establishing new gaging stations (e.g. Nine Springs Creek) or making flow measurement using handheld flow meters where flow information is desirable but the location lacks an established gaging station. Biological monitoring locations will be determined with assistance from DNR biologists. Additional focused/targeted monitoring locations will be identified as work on adaptive management proceeds. This monitoring will be necessary to help determine the effectiveness of management activities, quantify interim water quality improvements, and improve the accuracy of watershed modeling. In addition, edge of field monitoring will be considered at select locations. Monitoring Parameters and Monitoring Frequency Water quality monitoring will focus on both water chemistry and biology. Biological monitoring is not explicitly required for adaptive management, but will be important in the context of the TMDL. The primary focus of the water chemistry sampling will be to characterize TP and TSS concentrations at established locations as identified above, with monthly samples being collected at approximately fixed intervals during the growing season of May through October. Additional water chemistry sampling and analysis may be done at the discretion of Yahara WINs. Additional sampling could occur during nongrowing season months and/or during storm events to more fully characterize stream conditions and pollutant loads. Additional parameters could include analysis for OP-DRA, NH3-N, NO3+NO2, TKN, DO, Temperature and CLFYL-A. In addition, targeted monitoring may occur to document the effectiveness of phosphorus reduction practices. The location and frequency of additional targeted monitoring will be determined on a case-by-case basis and reflect input from DNR, USGS and others. Biological monitoring (macroinvertebrate sampling and fish survey) may be conducted at the discretion of Yahara WINs and would be used to assess stream health. Sampling locations will be determined in consultation with DNR biologists. Macroinvertebrate sampling would occur at select locations, with samples being collected every two years in the fall. Fish surveys will be conducted every four years, with timing determined by DNR biologists. In both cases, locations would be selected in consultation with DNR biologists. 61
62 Quality Assurance Protocols Water chemistry sample collection will be done by a combination of District staff, USGS staff and volunteer citizen monitoring coordinated by the Rock River Coalition. Citizen monitoring coordinated by the Rock River Coalition will follow DNR s citizen-based monitoring assurance protocols established through the Water Action Volunteers (WAV) program. A detailed methodology of WAV can be found here: The MMSD Laboratory will perform all water chemistry analysis. The MMSD laboratory is a state and USGS certified laboratory and follows the quality assurance protocols under Wis. Admin Code NR149. The full NR149 document can be found here: Analytical protocols, limits of detection and limits of quantitation for the water chemistry parameters identified earlier in this section are provided in Appendix 2. 62
63 Figure 15: Active Water Quality Monitoring Locations in the Yahara Watershed. Compiled by Mike Sorge (DNR) and others using data from multiple sources. Map prepared by Dane County LWRD. Optional biological monitoring and fish survey sampling will be coordinated by MMSD staff and may be 63
64 conducted by a combination of District staff and use of contracted services. MMSD has contracted with Underwater Habitat Investigations LLC to assist in previous fish survey work, under the direction of Dave Marshall. MMSD has also contracted with the University of Wisconsin-Stevens Point to sort, identify and enumerate macroinvertebrate samples collected by District staff. This is the same laboratory that DNR uses for macroinvertebrate analysis. Table 24 summarizes required and discretionary water quality monitoring activities. Required parameters and frequencies are shown in bold. As noted previously, minimum sampling frequency shall be monthly at approximately 30 day intervals. Water Chemistry Biology Parameters TP, TSS,CLFYL-A, NH3-N, NO3+NO2, TKN, OP-DRA,, DO, Temperature Macroinvertebrates Fish Frequency Monthly during growing season (May-October) Once every two years in the fall-exact timing per consultation with DNR biologists Once every four yearsexact timing per consultation with DNR biologists Higher frequency in areas where habitat restoration projects occur Higher frequency in areas where habitat restoration projects occur At locations agreed to by DNR biologists At locations agreed to by DNR biologists MMSD, volunteer citizen monitoring program Contract laboratory/ UW Stevens Point MMSD, Underwater Habitat LLC or other consultants/contractors Underwater Habitat LLC or other consultants/contractors Sampling during non-growing season months and event related sampling Location Primary Collection Responsibility Primary Analytical Responsibility At or near the bottom of each stream reach At additional targeted locations to show progress MMSD, USGS,, Rock River Coalition (volunteer citizen monitoring program) MMSD Table 24: Water Quality Monitoring Summary 64
65 Table 25 shows the specific locations of existing and proposed pour point compliance monitoring locations for the TMDL. With one exception (pour point in Reach 66), monitoring is already occurring at these locations. A new monitoring location will be established at the pour point for Reach 66 based on input from DNR and USGS. Stream Reach Pour Point Monitoring Location Pheasant Branch at Parmenter Street Bridge (Monitoring by USGS) Dorn Creek at Hwy M USGS Gage and Six Mile Creek at Hwy M USGS Gage (Monitoring by USGS) Bridge Road off of West Broadway (Monitoring by MMSD) Nine Springs Creek at Moorland Road (Monitoring by MMSD) New site-location to be established based on input from USGS and DNR Door Creek at Hope Road (Monitoring by Rock River Coalition) Yahara River upstream and downstream of confluence with Badfish Creek (Monitoring by MMSD) Yahara River at Fulton USGS Gage Table 25: Pour Point Water Quality Monitoring Summary V. Communication Effective communication is an essential component of the Yahara WINs Adaptive Management Plan. Overarching communication objectives include: Facilitate effective communication across previously existing phosphorus-reducing water quality programs in the Yahara Watershed Target six (6) key groups of stakeholders and/or interested parties Expand on previous successful communication in the Yahara WINs Pilot Project Significant communications related to adaptive management have already occurred, primarily focused on information sharing with adaptive management partners, and engagement with DNR and EPA on regulatory related issues. Information sharing activities have been generally successful and have relied on a variety of approaches. These include use of newsletters, semiannual and annual reports, quarterly Yahara WINs meetings, presentations at meetings sponsored by partnering organizations, maintenance of a Yahara WINs website, and other similar activities. Moving forward, communication efforts will focus on six key groups of stakeholders and/or interested parties. Each of these groups possesses a wide range of capabilities related to outreach, information and education. The Yahara WINs Adaptive Management Plan will leverage these capabilities to increase public awareness and help promote behavioral changes necessary for implementation of phosphorus 65

66 management practices. Figure 16 summarizes the communication approach that will be used for each of the six key groups of stakeholders and/or interested parties. One challenge related to communication is that there are numerous programs underway in the watershed that have similar or complementary goals (e.g. Yahara WINs, Yahara CLEAN implementation, Yahara Pride initiatives, Clean Lakes Alliance initiatives, Mississippi River Basin Initiative/EQIP Program, and initiatives undertaken by the Dane County LWRD). In addition, there are multiple messengers and many messengers wear multiple hats. This may lead to confusion, resulting in potential delays with practice implementation. Specific attention will need to be given to coordinate messaging to minimalize the potential for confusion. Figure 16: Summary of Communication Strategy prepared by MMSD staff VI. Financial Security DNR 9 Steps 8 This section meets DNR Adaptive Management Step 8: Financial security This section refers in part to information generated through the cost/implementation model for the adaptive management project, which was described in Section III of this plan. This spreadsheet-based model was developed by the MMSD and Dane County LWRD to estimate the cost associated with the adaptive management plan. The preliminary cost estimate for the adaptive management project is 66
67 approximately $104 million dollars over the 20-year implementation period. This assumes a conservative estimate of phosphorus load reductions required for nonpoint and MS4s. Updated stormwater modeling conducted consistent with DNR guidance will likely result in a decreased load reduction requirement and a corresponding decrease in overall project cost. Based on output from the cost/implementation model, costs can be generally grouped into three main categories. These categories and the relative distribution of costs between the categories are shown below: Staff/Operational Cost: Practice Costs Water Quality Monitoring 33% 62% 5% An Intergovernmental Agreement (IGA) has been developed for the adaptive management project that addresses a number of organizational issues, including how charges will be assessed to municipal members to support the adaptive management project. A copy of the IGA is included in Appendix 10. Cost allocations in the IGA are determined by multiplying the total adaptive management project cost by the fraction of the total pounds of required project phosphorus reduction needed by each member to meet its TMDL allocation based on current conditions. For example, if the required phosphorus reduction of an individual member is equal to 5 percent of the total pounds of phosphorus reduction from all sources in this adaptive management project, that member is assigned 5 percent of the total project cost. IGA assessments cover approximately $45 million over the 20-year implementation period. Funding from a variety of other sources, including producer cost-share and funding from local, state and federal programs, is conservatively estimated at approximately $59 million dollars over the 20-year implementation period. An estimate for funding from local, state and federal programs was provided by Dane County LWRD staff. Together, this accounts for 96% of the anticipated cost of adaptive management. Many agricultural producers have implemented phosphorus-reducing practices in the absence of cost-share dollars. For example, in 2015, Yahara WINs provided cost-sharing for 1,300 acres of cover crops as part of the Yahara Pride demonstration program, while another 3,400 acres of cover crops were planted without cost-share assistance. The combination of these types of activities, the fact that phosphorus reductions associated with the cost/implementation model are conservatively estimated, as are contributions and in-kind support from groups like the Clean Lakes Alliance and others, provides reasonable assurance regarding the financial security of this adaptive management project. Wastewater treatment plants participating in the adaptive management project are responsible for directly funding their portion of the phosphorus reductions under this adaptive management project. VII. Timeline and Milestones DNR 9 Steps 9 This section meets DNR Adaptive Management Step 9: Implementation schedule with milestones 67
68 Table 26 shows the estimated phosphorus load reductions by TMDL stream reach and WPDES permit term for the full-scale adaptive management project, assuming the project starts in 2017 as planned. These reductions are based on ramp-up periods used in the cost/implementation model, and are consistent with information previously presented in Table 20, with minor differences due to rounding. Load reductions will be adjusted either up or down based on factors previously discussed in this plan. Table 27 expresses the load reductions by TMDL stream reach and WPDES permit term as a percentage of the total required load reduction. The percentages were derived from the ramp-up period used in the cost/implementation model. Appendix 12 provides the detailed annual information used to develop Tables 26 and 27. In practice, variations within a given year and stream reach should be expected. This is because there will be significant use of targeted efforts in this adaptive management project for purposes of efficiently focusing resources. Examples of targeted approaches used previously in the Yahara Watershed include the Lake Mendota Priority Watershed Project and projects funded under the Mississippi River Basin Initiative (MRBI) in the northwest part of the watershed. A current example is work that will be conducted under the Regional Conservation Partnership Project (RCPP) in the Door Creek subwatershed. Reach Total Permit 1 Permit 2 Permit 3 Permit Annual P Reduction (lbs.) ,803 6,520 9,236 10, ,230 1,743 2,050 16,697 28,624 40,551 47,707 1,181 2,025 2,869 3,375 6,184 10,601 15,018 17, ,394 1,975 2,323 7,739 13,267 18,794 22,111 37,148 63,682 90, ,136 Table 26: Anticipated Phosphorus Load Reductions (lbs.) by WDPES Permit Term Reach Total Permit 1 Permit 2 Permit 3 Permit Percent of P Reduction Goal Achieved Table 27: Anticipated Phosphorus Reduction Goal as Percentage of Total lbs. by WDPES Permit Term 68
69 Required phosphorus load reductions associated with MMSD, the Oregon WWTF and the Stoughton WWTF under current conditions are shown in Table 28. These loads would be offset consistent with the percent reduction milestones shown in Table 27. As noted earlier, wastewater treatment plants participating in the adaptive management project are responsible for directly funding their portion of the phosphorus reductions under this adaptive management project. WWTF MMSD Oregon Stoughton Total Required Minimum Phosphorus Load Reduction (lbs.) 10,444 1, ,127 Table 28: Required Phosphorus Load Reductions at Current Conditions 69
70 Appendix 1: 2014 Memorandum of Understanding between MMSD and DNR Regarding Adaptive Management 70
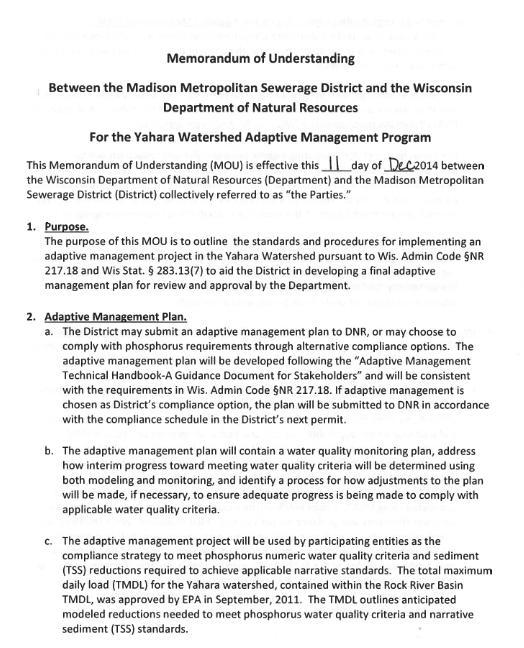
71 71
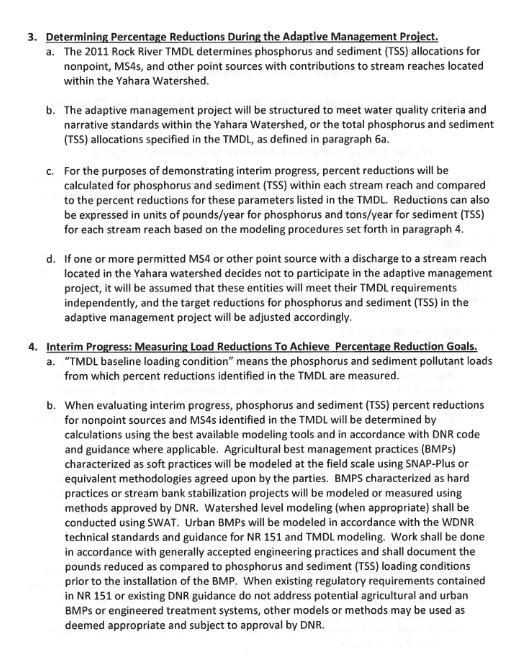
72 72
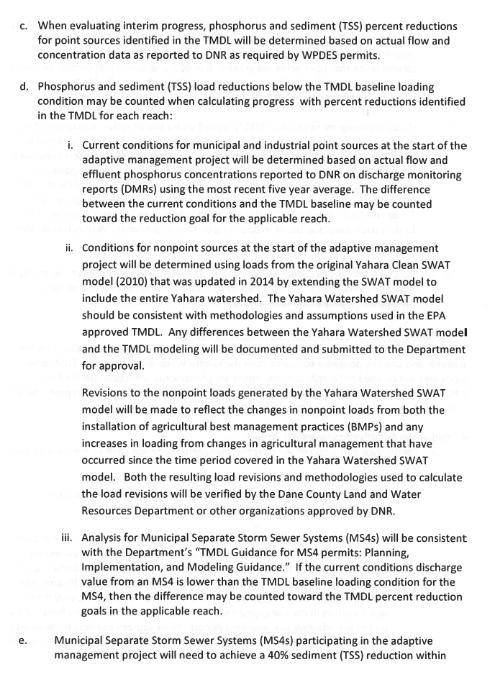
73 73
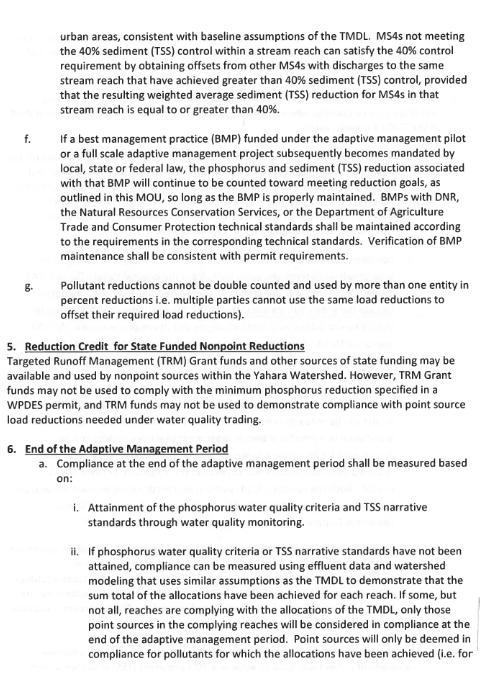
74 74
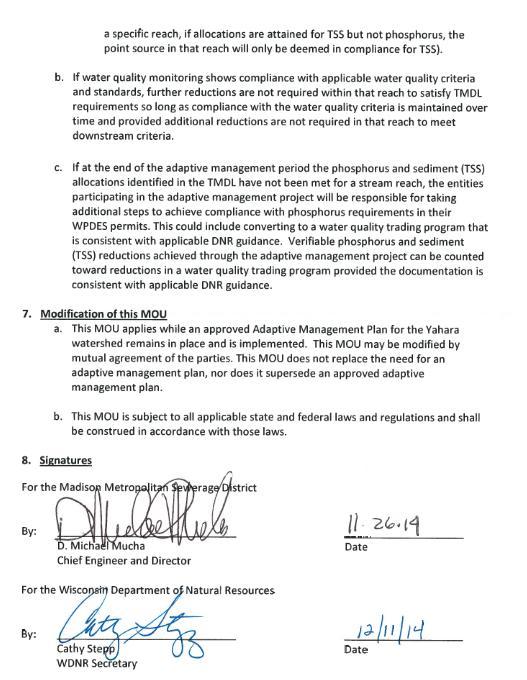
75 75
76 Appendix 2: MMSD Laboratory Analytical Methods, Limits, Limits of Detection and Limits of Quantitation for Water Quality Monitoring Conducted by the MMSD Laboratory 76
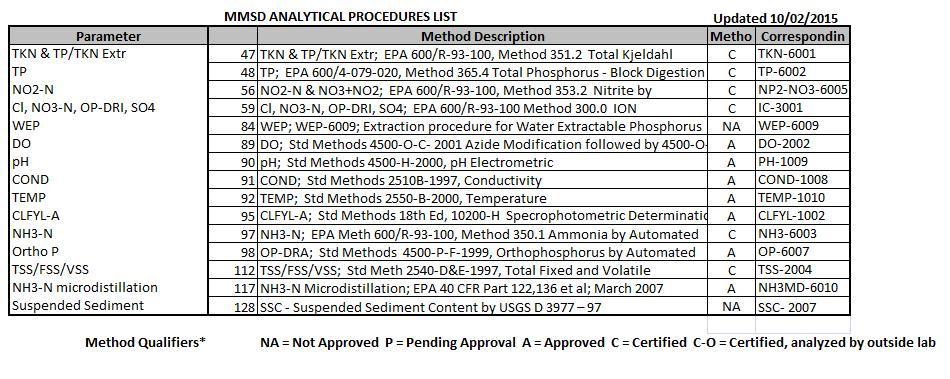
77 77
78 78
79 Appendix 3: Map Showing MMSD Water Quality Monitoring Locations on Badfish Creek 79
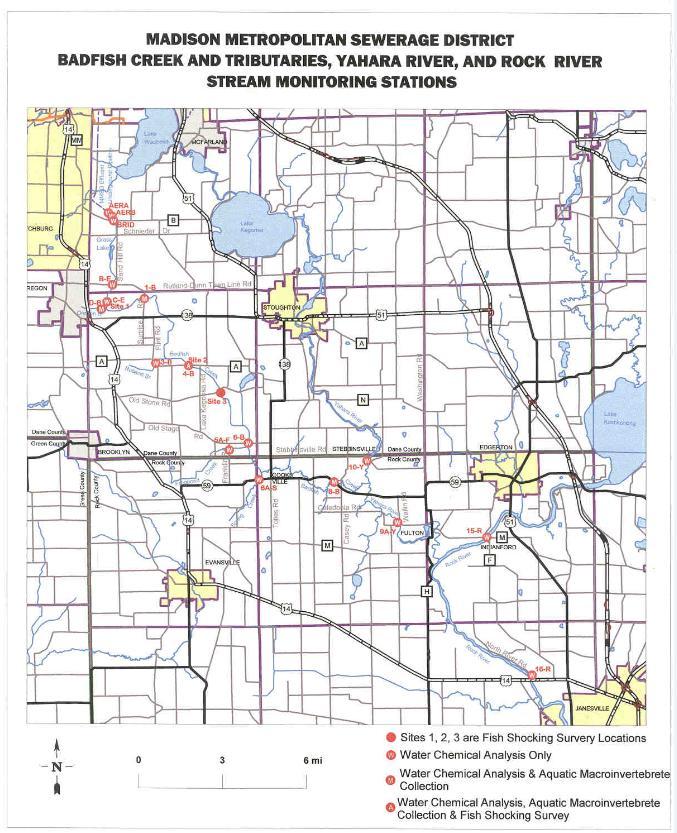
80 80
81 Appendix 4: Active Water Quality Monitoring Locations in the Yahara Watershed 81
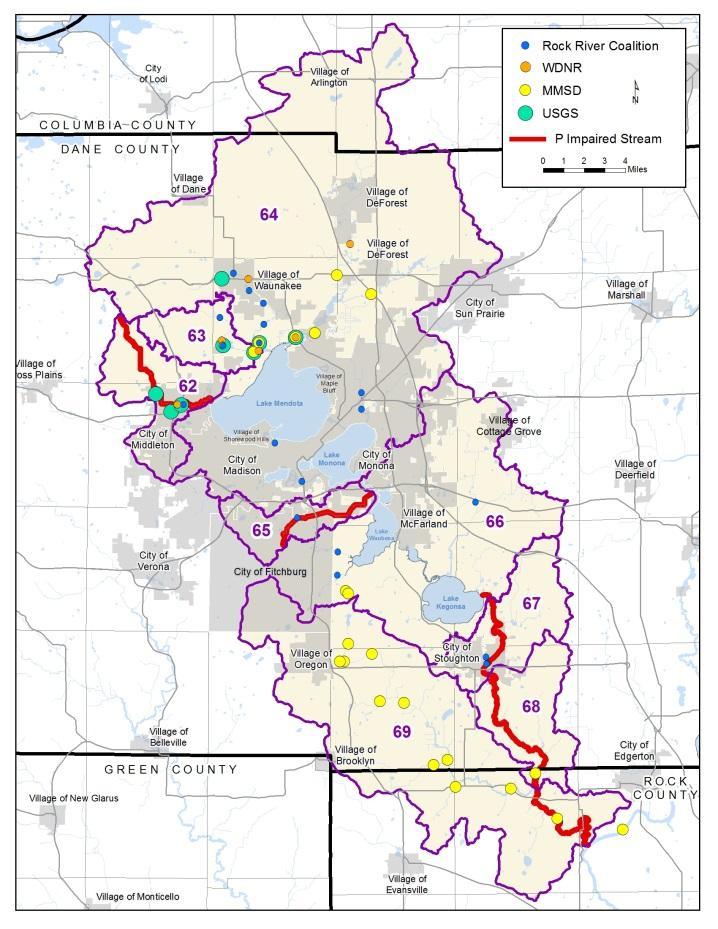
82 82
83 Appendix 5: Major Soil Groupings in the Yahara Watershed by TMDL Stream Reach 83
84 Stream Reach Soil Groupings 62 McHenry-Kidder Ringwood-Plano-Griswold Rodman-Fox-Casco McHenry-Kidder Ringwood-Plano-Griswold Rodman-Fox-Casco McHenry-Kidder Ringwood-Plano-Griswold Rodman-Fox-Casco McHenry-Kidder Ringwood-Plano-Griswold Rodman-Fox-Casco McHenry-Kidder Ringwood-Plano-Griswold Rodman-Fox-Casco McHenry-Kidder Ringwood-Plano-Griswold Rodman-Fox-Casco McHenry-Kidder Ringwood-Plano-Griswold Rodman-Fox-Casco McHenry-Kidder Pecatonica-Flagg Ringwood-Plano-Griswold Rodman-Fox-Casco Warsaw-Lorenzo-Dakota GIS Acres 5, , ,067 2,221 34,022 70,068 38,972 5, ,148 29,226 6,041 20,851 3,657 4,406 6, ,880 10,561 34, ,
85 McHenry series -- very deep, well drained soils formed in loess or other silty material and in the underlying loamy till on moraines and till plains. Slope ranges from 0 to 30 percent. Kidder series -- very deep, well drained soils formed in thin loess and in loamy till or just in loamy till on moraines and drumlins. Slope ranges from 0 to 35 percent. Ringwood series -- very deep, well drained soils formed in loess or other silty material and in the underlying loamy till on till plains. Slope ranges from 0 to 12 percent. Plano series -- very deep, well drained soils on outwash plains, stream terraces, or till plains. These soils formed in loess or other silty material and in the underlying loamy stratified outwash or sandy loam till. Slope ranges from 0 to 12 percent. Griswold series -- very deep, well drained soils formed in calcareous sandy loam till on till plains and moraines. Slope ranges from 0 to 20 percent. Rodman series -- very deep, excessively drained soils that are shallow to calcareous, stratified sandy and gravelly outwash. The Rodman soils formed in sandy and gravelly outwash. They are on kames, eskers, moraines, outwash plains, and valley trains. Slope ranges from 2 to 70 percent. Fox series -- very deep, well drained soils which are moderately deep to stratified calcareous sandy outwash. These soils formed in thin loess and in loamy alluvium or just in loamy alluvium overlying stratified calcareous sandy outwash on outwash plains, stream terraces, valley trains, kames, and glacial moraines. Slopes range from 0 to 35 percent. Casco series -- very deep, somewhat excessively drained soils which are shallow to stratified calcareous sandy outwash. They formed in loamy alluvium underlain by calcareous stratified sandy outwash on outwash plains, outwash terraces, eskers, kames, and moraines. Slopes range from 0 to 70 percent. Pecatonica series--well drained soils on till plains and moraines. They formed in a thin layer of loess or silty material and the underlying reddish paleosol that formed in loamy till. Slope ranges from 0 to 30 percent. Flagg series--very deep, well drained soils on till plains and moraines. These soils formed in loess and late Sangamon paleosols formed in Illinoian till. Slope gradients range from 0 to 20 percent. Warsaw series--well drained soils formed in loamy sediments and in the underlying gravelly outwash on outwash plains, terraces, kames, and valley trains. These are very deep soils that are deep or very deep to calcareous, stratified gravelly or very gravelly coarse sand and sand. Slope ranges from 0 to 15 percent. Lorenzo series-- well drained soils formed in loamy outwash over calcareous sand and gravel. They are on outwash plains, stream terraces, kames, eskers, valley trains, and moraines. Slope ranges from 0 to 45 percent. Dakota series--very deep, well drained soils formed in 50 to 100 centimeters of loamy alluvium and in the underlying sandy outwash. These soils are on outwash plains, stream terraces, and valley trains. Slope ranges from 0 to 18 percent. 85
86 Appendix 6: Point Source Phosphorus Loads by Stream Reach 86
87 87
88 88
89 89
90 Appendix 7: MS4 Phosphorus Loads by TMDL Stream Reach 90
91 91
92 92
93 Appendix 8: Detailed Phosphorus Load Reductions by Source and TMDL Reach 93
94 94
95 95
96 96
97 Appendix 9: Detailed TSS Reductions by Source and TMDL Reach 97
98 98
99 99
100 100
101 Appendix 10: Draft Intergovernmental Agreement (IGA) for a Fullscale Adaptive Management Project
102 INTERGOVERNMENTAL AGREEMENT FOR AN ADAPTIVE MANAGEMENT PLAN FOR THE YAHARA WATERSHED WHEREAS, Wis. Stat , entitled "Intergovernmental cooperation," provides that any municipality (defined as including but not limited to any state agency, city, village, town, county, sanitary district, metropolitan sewerage district or sewer utility district) may contract with other municipalities for the furnishing of services, and the joint exercise of any power or duty required or authorized by law; WHEREAS, the U.S. Environmental Protection Agency (EPA) has approved Total Maximum Daily Loads for Total Phosphorus and Total Suspended Solids (TSS) in the Rock River Basin (the Rock River TMDL or TMDL ), which includes the Yahara Watershed as shown on Exhibit A; WHEREAS, municipalities who own Publicly Owned Treatment Works (POTWs) and/or Municipal Separate Storm Sewer Systems (MS4s) in the Yahara Watershed are required to meet surface water quality standards and/or wasteload allocations for phosphorus and TSS pursuant to the provisions of Wis. Admin Code NR 217 and/or the Rock River TMDL; WHEREAS, Wis. Admin Code NR allows sources holding a Wisconsin Pollutant Discharge Elimination System (WPDES) permit the option known as adaptive management which involves developing an Adaptive Management Plan involving point and nonpoint sources to achieve water quality standards and TMDL allocations; WHEREAS, Wis. Stat (7) allows adaptive management to be used to address TMDL allocations for both phosphorus and TSS over four permit terms; WHEREAS, in 2012 Madison Metropolitan Sewerage District (District) developed an adaptive management pilot project with other interested parties within the Yahara watershed as
103 set forth in a Memorandum of Understanding for an Adaptive Management Pilot Project in the Yahara Watershed; WHEREAS, on December 14, 2014, the District entered into a Memorandum of Understanding with the Wisconsin Department of Natural Resources (DNR) regarding the manner in which a full scale Adaptive Management Plan for the Yahara Watershed would be developed and evaluated; WHEREAS, the District has committed to developing an Adaptive Management Plan to fulfill its phosphorus compliance obligations under its WPDES permit and fulfill the TMDL obligations of other permittees; WHEREAS, the undersigned municipalities within the Yahara Watershed, (Parties) wish to join together to jointly participate in the Adaptive Management Plan; WHEREAS, the Parties desire to create an intergovernmental agreement and form a group known as "The Yahara Watershed Improvement Network (Yahara WINS) Group or simply "the Group"; WHEREAS, the Parties desire to create a commission that will administer such participation, information gathering, projects and activities of the Group all as set forth in this Agreement; WHEREAS, the Parties desire to implement this Agreement in a collaborative, cooperative manner to advance the Adaptive Management Plan; WHEREAS, the Parties to this Agreement also intend to contract and work collaboratively with agricultural producers, non-governmental organizations, county agencies and other entities to advance the Adaptive Management Plan. NOW THEREFORE, in consideration of the mutual covenants herein contained and other good and valuable consideration, the receipt and sufficiency of which are hereby acknowledged,
104 the Parties agree to create this Intergovernmental Agreement for an Adaptive Management Plan for the Yahara Watershed ( Agreement ) as follows: 1. GOALS OF THE GROUP. The Parties hereby agree to cooperate to exercise their municipal powers jointly for: a. Providing review and comments on the Adaptive Management Plan prepared by the District; b. Contracting with consultants, legal counsel, and other parties to further the development, implementation and evaluation of the Adaptive Management Plan; c. Coordinating or contracting with the DNR and other pertinent agencies, units of local government, and non-governmental organizations and entities to achieve the goals of the Adaptive Management Plan; and d. Pooling resources in accordance with the provisions of cost allocations in Exhibit B to achieve the goals of the Adaptive Management Plan. e. Achieving compliance with WPDES permit requirements related to the Rock River TMDL. 2. MEMBERS OF THE GROUP a. In General. The members of the Group ( Members ) created by this Agreement are the Wisconsin municipalities (defined as including but not limited to any state agency, city, village, town, county, sanitary district, metropolitan sewerage district or sewer utility district) who own Publicly Owned Treatment Works (POTWs) and/or Municipal Separate Storm Sewer Systems (MS4s) or municipalities who have land within areas served by the Adaptive Management Plan, and which have duly executed identical counterparts or copies of the
105 Agreement pursuant to Section 3 ( Members collectively and Member individually) on or before April 15, b. Changes in Membership. Additional Wisconsin municipalities may become Members of the Group with the consent of a majority of the Members by becoming Parties to this Agreement on the condition that payments be made to cover their share of costs based on their phosphorus allocation for the years from the date of this Agreement to their membership date. Members may cease to be Members and Parties to this Agreement pursuant to Section 12. c. Representative to the Group. All Group Members shall designate a representative and an alternate representative. A Member may remove or replace its representative to the Group at will, with or without cause, at any time. All designations of representatives, alternatives and replacements shall be made in writing, signed on behalf of the Member and delivered to the Secretary of the Executive Committee. Each Member s representative shall have the authority to act on the Member s behalf at meetings held under Section AUTHORITY OF MEMBERS TO PARTICIPATE. a. This Agreement is entered into pursuant to authority granted under Wis. Stat The authorizing resolution for each Party to this Agreement shall: (1) Agree to the terms and conditions of this Agreement and the establishment of the commission created hereunder; (2) Authorize and direct the appropriate municipal officers of the Member to execute this Agreement on behalf of the Member; and
106 (3) Indicate how each Member shall appoint the Member's representatives to the Group under Section 2c. b. A certified copy of the authorizing resolution and a duly executed copy of this Agreement for each Party to this Agreement shall be maintained on file with the Executive Committee. 4. POWERS OF THE GROUP The Group shall have the following powers: a. To elect the members of the Executive Committee as set forth in Section b. To approve the 5 year and annual budgets under Section 8. c. To approve the bylaws proposed by the Executive Committee. d. To share information and advise the Executive Committee on all matters 6. including elements of the Adaptive Management Plan. 5. MEETINGS OF THE GROUP a. The Group shall meet no less than four times per year. b. A quorum shall be a majority of the members of the Group and must include the representatives from the District and any other member who contributes at least one fifth of the allocated cost under Exhibit B. If a quorum is not present the members present may meet and share information, but no action may be taken. c. Unless otherwise expressly provided by this Agreement, all votes of the Group shall be by a majority of the members of the Group present at a meeting where there is a quorum.
107 d. All meetings shall be open meetings and require public notice in accordance with Wisconsin s open meeting laws. The Group shall encourage the participation of other interested parties including agricultural producers and nongovernmental entities. 6. EXECUTIVE COMMITTEE a. Creation of Executive Committee. The Members also agree that there is created a five member Executive Committee which will be a commission under Wis. Stat (2) and (3), to administer the joint activities of the Yahara WINS Group. This commission shall be formally referred to as THE YAHARA WINS EXECUTIVE COMMITTEE, and referred to in this Agreement as the "Executive Committee." This Executive Committee shall operate as a governmental body under Wis. Stat (1). b. Members of the Executive Committee. The Executive Committee shall be comprised of five Member representatives and two non-member advisors. (1) The Executive Committee members shall include a representative from the Madison Metropolitan Sewerage District and a representative from any Member, other than the District, who contributes at least one fifth of the allocated cost under Exhibit B. Of the remaining members, one must be from a city or village, one from a town, and one will be an at large position. Cities and villages will vote to select their representative to the Executive Committee, towns will vote to select their representative to the Executive Committee, and the group as a whole will vote to select the at large representative. (2) Recognizing the key collaborative roles played by Dane County and members of the agricultural community in the Adaptive Management Pilot Project and their anticipated roles as this Agreement moves forward, Dane County and the Yahara Pride Farm Group may each appoint an advisor to the Executive Committee. The Executive Committee may in
108 its discretion appoint additional advisors. The advisors shall be given notice of all Executive Committee meetings and may participate in such meetings as non-voting members. c. Term. The term of the three elected members of the Executive Committee shall be for staggered five year terms and may be reelected by the Group. d. Purposes and Powers of the Executive Committee. (1) To make, amend and repeal bylaws and rules related to the purpose and operation of the Group subject to approval by the Group. (2) To invest funds not required for immediate disbursement in properties or securities as permitted by state law. (3) To make and execute contracts and other instruments of any name or type necessary or convenient for the exercise of the powers granted herein, including contracts with engineers, legal counsel, administrative staff and other consultants. (4) To accept contributions of capital from Member communities or (5) To do all acts and things necessary or convenient for the conduct third parties. of its business and the general welfare of the Group and the Parties and to carry out the purposes and powers granted to it by this Agreement. (6) To sue, and be sued, complain and defend in all courts, and also, appear in or before applicable governmental agencies administrative tribunals and legislative bodies. e. No Compensation. The members of the Executive Committee shall serve without compensation, provided, however, that the Executive Committee shall have discretion to reimburse members of the Executive Committee for reasonable expenses incurred for special services to the Executive Committee.
109 f. Quorum. A quorum shall be a majority of the members of the Executive Committee and must include the representatives from the District and any Member (other than the District) who contributes at least one fifth of the allocated cost under Exhibit B. No action may be taken in the absence of a quorum. g. Voting. The members of the Executive Committee shall vote upon matters in the following manner: (1) Voting in General. Unless otherwise expressly provided by this Agreement, the bylaws, or some other subsequent action of the Executive Committee, all votes shall be by a majority of the members of the Executive Committee present at a meeting where there is a quorum. (2) Voting on Matters Which May Affect WPDES Permit Compliance. The Executive Committee shall provide written notice to all Members of any proposed or recommended action potentially affecting any Member s WPDES permit, other than the development and implementation of the adaptive management plan. Such actions include the following: (i) the development or implementation of terms and conditions of a WPDES permit; (ii) a violation of a WPDES permit, (iii) a WPDES permit modification or revocation (iv) a change in WPDES permit limits or compliance plan; or (v) any other action that could jeopardize a Member s WPDES permit compliance. Any Member so notified has 30 days from the date of the notice to provide a written objection to the Secretary of the Executive Committee to any such actions that affect its WPDES permit. In such a case, no final action may be taken by the Executive Committee without the further written consent of the objecting member. (h) Meeting. The Executive Committee shall meet no less than quarterly. Additional meetings may be held at the request of any member of the Executive Committee. 7. OFFICERS.
110 a. Officers of the Executive Committee. The Officers of the Executive Committee are a President, a Vice-President, a Secretary, a Treasurer and such other Officers as the Executive Committee may designate. The President shall be the District representative. The Vice-President, Secretary and Treasurer shall be elected by the members of the Executive Committee from among the members of the Executive Committee and shall serve five year terms. b. Dual Signature Required. The signatures of two officers shall be required on all forms of payment, and all legally binding documents executed in the name of the Executive Committee or the Group. c. Duties. Unless otherwise determined by the Executive Committee, the duties of the officers shall include the following: (1) President. The President shall be the principal executive officer of the Executive Committee and shall preside at all meetings of the Executive Committee and set the agenda. (2) Vice-President. In the absence of the President, or in the event of his or her inability or refusal to act, the Vice-President shall perform the duties of the President. (3) Secretary. The Secretary shall keep minutes of the meetings of the Executive Committee in one or more books provided for that purpose; see that all notices are duly given in accordance with this Agreement, or as required by law; and be custodian of the Executive Committee's records. The Secretary shall take such actions as are prudent and necessary to maintain the public records at the offices of the District in accordance with Wisconsin s public records laws. (4) Treasurer. The Treasurer shall have charge and custody of and be responsible for all funds and securities of the Group and shall have charge of the financial records of the Group. The Treasurer will work with District staff to set up a segregated account for the funds of the Group. The Treasurer shall take such actions as are prudent and necessary to
111 maintain the public records at the offices of the District in accordance with Wisconsin s public records laws. d. Removal. An officer other than the President may be removed from office with or without cause upon a majority vote of the members of the Executive Committee. 8. BUDGET The Executive Committee shall prepare budget documents as follows: a. Project Budget. The 20 year adaptive management cost to Members and the associated annual cost are listed in Exhibit B to this Agreement. b. Five Year Budget. The Executive Committee shall break down the 20 year Adaptive Management costs into five year intervals corresponding with the estimated permit terms. The Five Year Budget shall be approved by a majority of the Members present in the meeting of the Group in which action on the Project Budget is taken. The Five Year Budget shall be updated no less than every five years and approved by the Group. Estimated project costs shall be allocated equally over the 20 year Adaptive Management Plan period to the extent practicable. c. Annual Budget. The Executive Committee shall prepare a detailed annual budget of the estimated expenditures associated with the Adaptive Management Plan for the next calendar year, and present the annual budget to the Group for review no later than September 30th of each year. The annual budget shall be consistent with the Five Year Budget approved in Section 8 (b), and shall be approved by October 31st of each year by a majority of the Members of the Group present at the meeting in which action on the annual budget is taken. The Executive Committee shall send invoices to members of the Group consistent with the annual cost shown in Exhibit B, subject to any revision consistent with Section 9 of this Agreement on or before December 15 of each year., The first invoice under this Agreement will be sent to Members on or before December 15, 2016 and will be for the calendar year Invoices will be sent to
112 Members annually thereafter on or before December 15th of each year. Payments based on each annual invoice shall be made in two equal installments. The first installment shall be made on or before February 28th of each year and the second installment shall be made on or before June 30 th of each year. d. Funds for 2016 are based on a continuation of annual payments made by the participants to the Adaptive Management Pilot Project at the same funding level as The Executive Committee shall receive any such payments to further the purposes of this Agreement and subject to the audit and reporting requirements set forth in Section CHARGES TO MEMBERS. a. Costs shall be allocated among Members as shown in Exhibit B, except as otherwise provided in this Section. Cost allocations in Exhibit B are based on phosphorus load reductions and are determined by multiplying the total adaptive management project cost by the fraction of the total pounds of required project phosphorus reduction needed by each Member to meet its TMDL allocation under current conditions. For example, if the required phosphorus reduction of an individual member is equal to 5 percent of the total pounds of phosphorus reduction from all sources in this adaptive management project, that member is assigned 5 percent of the total project cost. For the purpose of Exhibit B, required phosphorus reductions were determined as follows: (1) Point Source Members: For the purpose of this section, Point Source Members are those members who own or operate facilities identified in Appendices P, Q, R and S of the Rock River TMDL. The required phosphorus reduction is determined by subtracting the TMDL allocated phosphorus load from the current condition phosphorus load, with the current condition phosphorus load defined as the most recent five year average load (2010 thru 2014) using data obtained from the DNR. For all Point Source Members, the allocated phosphorus
113 load is consistent with the allocation specified in the TMDL. For Point Source Members that own or operate POTWs, required phosphorus reductions also factor in the need to meet the interim concentration limits specified in Section 14 (b). (2) MS4 Members: For the purpose of this section MS4 Members are those members who own Municipal Separate Storm Sewer Systems as identified in Appendices T, U, and V of the Rock River TMDL, except that the University of Wisconsin-Madison shall also be considered an MS4 Member. The required phosphorus reduction for MS4 Members is determined by subtracting the TMDL allocated phosphorus load from the TMDL baseline phosphorus load. Exhibit B. b. Members shall commit to payment in accordance with the schedule in c. Notwithstanding Exhibit B, it is recognized that MS4 Members may update stormwater modeling consistent with the DNR guidance document titled TMDL Guidance for MS4 Permits: Planning, Implementation and Modeling Guidance (October 20, 2014). If the updated modeling is reviewed and approved by DNR, and shows a required annual phosphorus reduction that is different than what was used to develop the cost allocation in Exhibit B, the cost for that MS4 member in Exhibit B will be adjusted as follows: Exhibit B Cost x Revised phosphorus reduction (lbs/yr) Initial phosphorus reduction (lbs/yr) = Revised Cost If the revised phosphorus reduction information is received on or before September 1 st of any year, the revised cost will be applied to all years going forward. For example, if data is submitted on or before September 1, 2017 that results in a revised cost being calculated, that revised cost will be applied to annual payments beginning in Additionally, a true up will be allowed at
114 the end of every five year WPDES permit term to reflect practices that may have been added during that WPDES permit term that result in a revised phosphorus reduction and therefore a revised cost, provided those reductions are in excess of the baseline reductions in Section 14 (a). Revised costs would be calculated using the above formula and would be applied to annual payments going forward. d. If an MS4 makes an initial payment in 2017 based on Exhibit B and subsequently submits information that results in a revised cost that is less than shown in Exhibit B, the amount of overpayment shall be credited to the MS4 over the next four year period in equal annual installments. If an MS4 makes an initial payment in 2017 based on Exhibit B and subsequently submits information that results in a revised cost that is greater than shown in Exhibit B, the underpayment shall be recovered from the MS4 over the next four year period in equal annual installments. e. Notwithstanding Exhibit B, the costs for Point Source Members will be revised at the end of 2016 using the most recent five year phosphorus load averaging period if it is different than the averaging period used in developing the cost allocations in Exhibit B. The cost will be adjusted as follows: Exhibit B Cost x Revised phosphorus reduction (lbs/yr) Initial phosphorus reduction (lbs/yr) = Revised Cost The revised cost will be applied to the years going forward. Additionally, a recalculation of the phosphorus load will be made at the end of every five year WPDES permit term using the most recent five year average and will be used to calculate a revised cost, which will be applied to annual payments for the years going forward. The revised cost will be calculated using the formula in this section.
115 f. MS4 Members and Point Source Members participating in this agreement may choose to accomplish some of their TMDL required phosphorus reduction independently and therefore purchase only a portion of their required phosphorus reduction through adaptive management. In this case, the Exhibit B cost or the Revised Cost (whichever is applicable) will be adjusted by multiplying it by the fraction of the required phosphorus reduction that is purchased through adaptive management. For example if an MS4 Member or Point Source Member purchases ninety-five percent of its required phosphorus load through adaptive management, the cost would be revised as follows: Exhibit B Cost or Revised cost (whichever is applicable) x 0.95 = Adjusted Cost g. MS4 Members and Point Source Members choosing to purchase only a portion of their required phosphorus reduction through adaptive management agree that they must have a plan in place to accomplish the portion not purchased. The plan should identify significant anticipated milestones. In addition, they agree to provide a summary to the group at a frequency of at least once every two years specifying progress made in achieving the reductions not accomplished through adaptive management. MS4 Members and Point Source Members shall specify at the time they execute this agreement the portion of their required phosphorus reduction, expressed in pounds per year, that they will accomplish independently. The adaptive management project costs will be reviewed at least 360 days prior to the end of a 5 year WPDES permit term for which the Adaptive Management Plan is a permit condition. The costs may be adjusted based on this review and upon approval by a majority of the Members. Adjustments (if any) may result in either a lower or higher charge to members going forward. Adjustments (if any) in the charge to members will be made at the start of the next 5 year WPDES permit term and will be made proportional to the required phosphorus reduction of Members. Adjustments will be reflected in the Five Year Budget under Section 8.
116 10. AUDIT AND REPORTING a. The Executive Committee shall arrange for a financial audit of the Group s financial records on an annual basis by an independent accounting firm using generally accepted accounting practices. b. The Executive Committee shall prepare an annual report and provide it to all Members, and to other government agencies as may be required. In addition to containing financial information, the annual report shall describe activities undertaken and progress made over the preceding year with respect to implementation of the Adaptive Management Plan. The annual report shall review the effectiveness of the measures undertaken as part of the Adaptive Management Plan and to the extent possible document the amount of phosphorus reduced by each of the project elements implemented under this Adaptive Management Plan. The annual report shall be distributed to the Group and published on the Group s website by June 30th of each year. 11. LIABILITY OF THE EXECUTIVE COMMITTEE AND/OR GROUP. a. In the event any costs or expenses are imposed on the Group or the Executive Committee as a result of any judicial or administrative proceeding or settlement thereof, and the liability is not directly attributable to the conduct of a specific Member or Members, the costs and expenses shall be treated as a cost of the Group to be allocated among all Members. b. If any costs or expenses are imposed on the Group or the Executive Committee as a result of any judicial or administrative proceeding or settlement thereof, and the liability is directly attributable to the conduct of a specific Member or Members, the costs and expenses shall be allocated among those Members whose actions caused the imposition of the
117 costs or expenses to the Group or Executive Committee, in proportion to their responsibility as determined by the presiding official of the judicial or administrative proceeding, or if not such determination, by the Executive Committee. Any member of the Executive Committee who represents a Member with an interest in the determination shall recuse themselves from all participation on the Executive Committee as to that issue. Any Member not satisfied with the decision of the Executive Committee can request the issue be resolved through binding mediation. The costs are to be borne equally by each Member to the mediation. 12. TERM OF AGREEMENT AND WITHDRAWAL. a. The term of this Agreement shall begin on April 15, 2016 and will generally coincide with the term of the approved Adaptive Management Plan which is anticipated to be approximately 20 years from approval. b. This Agreement shall terminate upon conclusion of the Adaptive Management Plan or termination of the Adaptive Management Plan if the Adaptive Management Plan is terminated by DNR. This Agreement may also be terminated at a duly noticed Executive Committee meeting upon a two thirds vote by Members of the Group to terminate the Agreement at least 270 days prior to the end of a WPDES permit term for which the Adaptive Management Plan is a permit condition. In no event shall termination become effective prior to the end of a WPDES permit term. c. An individual Member may withdraw from the Agreement by providing notice at least 270 days prior to the end of a 5 year WPDES permit term for which the Adaptive Management Plan is a permit condition, if the member has paid its contribution for the five year WPDES permit period. 13. ADAPTIVE MANAGEMENT ADMINISTRATION
118 a. The Adaptive Management Plan shall be prepared by the District. If this Agreement is in effect prior to the submittal of the Adaptive Management Plan to DNR by the District, then the District shall submit the Adaptive Management Plan to the Group for review and comment at least 60 days prior to District submittal to DNR.. b. Every five years as the WPDES permits come up for renewal, the District will prepare any amendment to the Adaptive Management Plan necessary to achieve the project goals and approval by the DNR. The District shall submit any Adaptive Management Plan amendments to the Group for review and comment at least 90 days prior to District submittal to DNR. c. The District shall be responsible for administration and management of the Adaptive Management Plan and related activities, including contract management. The District will also serve as the primary contract laboratory for analysis of routine parameters (e.g. phosphorus, TSS, and nitrogen) from water samples collected as part of the adaptive management project, and can recover associated analytical costs from the Group. 14. ADAPTIVE MANAGEMENT PERMITTEE PROVISIONS a. All MS4 Members participating in this Agreement are individually responsible for meeting the TMDL baseline conditions for sediment (TSS) and phosphorus control. The baseline condition for MS4 Members is 40% TSS control and 27% phosphorus control. These reductions must be achieved within each stream reach that they discharge to as identified in the TMDL. Trading with another MS4 member located within the same stream reach that has exceeded the baseline condition can be used to meet the baseline condition, but trade agreements are the responsibility of the participating Members and are not addressed directly through this Agreement.
119 b. All POTWs participating in this Agreement are required to meet an annual average effluent phosphorus concentration of 0.6 mg/l by the end of the first full WPDES permit term following implementation of the DNR approved Adaptive Management Plan, and an annual average effluent concentration of 0.5 mg/l by the end of the second full WPDES permit term following implementation of the DNR approved Adaptive Management Plan. c. In the event the Adaptive Management Plan is terminated by DNR prior to the end of the original term of the Adaptive Management Plan, or if at the end of the adaptive management period DNR determines that the phosphorus and sediment (TSS) allocations identified in the TMDL have not been met for a stream reach, Members will be individually responsible for taking any additional steps needed to achieve compliance with phosphorus and sediment (TSS) reduction requirements in their WPDES permits. This could include converting to a water quality trading program that is consistent with applicable DNR guidance. Verifiable phosphorus and sediment (TSS) reductions or credits achieved through the adaptive management project will be distributed to Members proportionate to the Charges to Members under Section 9 of this Agreement, but use in a water quality trading program is subject to applicable DNR guidance. d. In the event municipal boundaries change during the term of this Agreement, as land transfers from one municipality to another the associated phosphorus load reduction and the associated payment responsibility also transfers to the new municipality. e. Upon completion or termination of the adaptive management project, any funds remaining in the segregated account for the Group following payment of all project expenses, shall be returned to members of the Group in direct proportion to the contribution made by each member of the Group.
120 15. NONDISCRIMINATION In the performance of services under this Agreement, the Parties agree not to discriminate against any employee or applicant because of race, religion, marital status, age color, sex handicap, national origin or ancestry, income level or source of income, arrest record or conviction record, less than honorable discharge, physical appearance, sexual orientation, gender identity, political beliefs, or student status. 16. MISCELLANEOUS a. Municipal Liability. Nothing in this Agreement shall constitute a waiver of any limitations on municipal liability that may exist as a matter of law, including but not limited to limitations in Wis. Stat. ch b. Counterparts. This Agreement may be executed in counterparts, and the signatures of each party on separate copies of the Agreement shall be fully effective to bind each of them to the Agreement with any other party that signs any separate copy of the Agreement. c. Entire Agreement. This Agreement supersedes any prior studies, memoranda, letters or oral discussions or understandings about the participation of any of the members in this joint project. This Agreement represents the entire agreement of the Parties as to organization and the goals of the Group. d. Amendment or Modification. No amendment or modification may be made to this Agreement except in writing signed by a two thirds majority of all members. e. Choice of Law. This Agreement shall, in general, be governed by and construed in accordance with the laws of the State of Wisconsin. f. Exclusive Benefit. This Agreement is for the exclusive benefit of the Parties and their successors in interest and shall not be deemed to give any legal or equitable right, remedy or claim to any other entity or person.
121 g. No Joint Venture. This Agreement does not establish or evidence a Joint Venture or partnership between the Parties. No Party is liable for another Party's actions as a result of entering into this Agreement. h. Succession. All the terms, provisions and conditions herein contained shall inure to the benefit of and be binding upon the Parties and their respective successors and assigns, including future governing bodies of the respective member communities. i. Notice. Any notice required or given under this Agreement shall be effective if mailed by U.S. mail, postage prepaid, to the representatives at the addresses set forth after the signatures below, or any substituted address or representative as is filed with the Secretary of the Executive Committee. IN WITNESS WHEREOF, the Parties, by their duly authorized representatives, have executed this Agreement on the dates set forth below. By: Date of Execution (signature) Name Title Address: (typed name)
122 Exhibit A (Map of the Yahara Watershed)
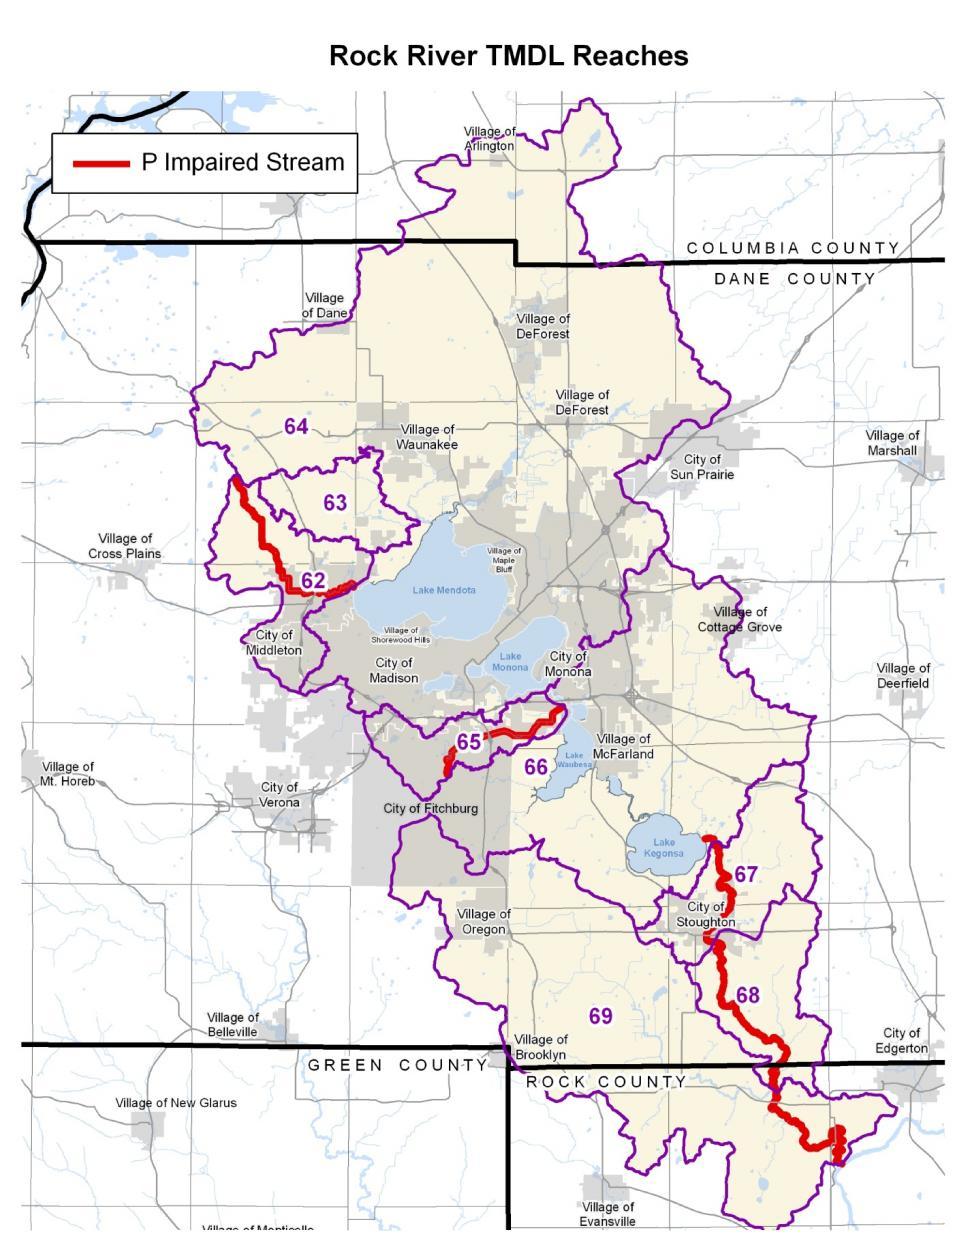
123
124 Exhibit B: Preliminary Cost Allocations (Note: Section 9 outlines how preliminary costs can be adjusted) 124
125 Appendix 11: Representative Letters of Support for Full-scale Adaptive Management Project 125
126 126
Madison Metropolitan Sewerage District Adaptive Management Plan
 Madison Metropolitan Sewerage District Adaptive Management Plan January, 2017 1 Table of Contents I. Introduction and Background... 5 Meeting DNR Adaptive Management Planning Elements... 8 II. Eligibility
Memorandum of Understanding for an Adaptive Management Pilot Project in the Yahara Watershed
 Memorandum of Understanding for an Adaptive Management Pilot Project in the Yahara Watershed 1. Background The Wisconsin Department of Natural Resources (WDNR or the department) has developed numeric water
Badger Mill Creek Phosphorus Compliance
 Project Purpose: Badger Mill Creek is an effluent dominated stream downstream of MMSD s aerator (see map). The applicable phosphorus water quality criterion for Badger Mill Creek is 0.075 mg/l. The Nine
Yahara WINs 2013 Annual Report
 Yahara WINs 2013 Annual Report 1 Yahara WINs Background The Yahara WINs Pilot Project is testing a new, innovative and collaborative compliance approach called watershed adaptive management to meet regulatory
Yahara WINS Group Meeting. September 13, 2017
 Yahara WINS Group Meeting September 13, 2017 Approval of Minutes Review and acceptance of 06/13/2017 meeting summary Updates Consulting Director contract signed Yahara Pride LDMI project moving forward
WWOA Annual Conference October 6, John Kennedy. Green Bay Metropolitan Sewerage District Cleaning Water Today For Tomorrow s Generations
 WWOA Annual Conference October 6, 2011 John Kennedy Green Bay Metropolitan Sewerage District Cleaning Water Today For Tomorrow s Generations Lower Green Bay and Fox River Examples of Water Resource Degradation
Dane County Land and Water Resources Land Conservation Division
 Dane County Land and Water Resources Land Conservation Division 2014 Adaptive Management Phosphorus Reductions Background As part of the 2014 Adaptive Management Pilot Project goals Dane County Land and
Jordan River TMDL Update
 Jordan River TMDL Update 2010 Watershed Symposium August 4 th, 2010 Hilary N. Arens Utah Division of Water Quality Jordan River TMDL Outline What is a TMDL and what is the Jordan impaired for? Evaluation
Memorandum. To: From: Date: July 10, Cc: Re: Introduction. to control. This time. primarily. excavated
 Memorandum To: From: Date: Cc: Dave Taylor, Madison Metropolitan Sewerage District Rob Montgomery July 10, 2012 Kevin Connors, Dane County Peter Hughes, USGS Re: DRAFT description of Alum treatment demonstration
Total Maximum Daily Loads for Total Phosphorus and Total Suspended Solids in the Rock River Basin
 Total Maximum Daily Loads for Total Phosphorus and Total Suspended Solids in the Rock River Basin Columbia, Dane, Dodge, Fond du Lac, Green, Green Lake, Jefferson, Rock, Walworth, Washington, and Waukesha
Wisconsin Wastewater Operators Association. Protecting Our Water Resources: The Future Bill Hafs - NEW Water 10/2014
 Wisconsin Wastewater Operators Association Protecting Our Water Resources: The Future Bill Hafs - NEW Water 10/2014 The Fox River Contributes 1/3 of All Nutrients to Lake Michigan APRIL 15, 2011 Photo
Community Assistance Planning Report No. 330 A RESTORATION PLAN FOR THE OAK CREEK WATERSHED. Chapter 1 INTRODUCTION
 #239219 CAPR-330 (Oak Creek Watershed) Chapter 1 - Text 300-4010 MGH/LKH/JEB/mid 8/28/18, 9/6/18, 9/10/18 Community Assistance Planning Report No. 330 A RESTORATION PLAN FOR THE OAK CREEK WATERSHED Chapter
Phosphorus Rules NR , NR 151 and NR 217 Subchapter III
 Phosphorus Rules NR 102.06, NR 151 and NR 217 Subchapter III Jim Baumann Wisconsin Department of Natural Resources james.baumann@wisconsin.gov 608/266-9277 Phosphorus 3 Rule Changes S. NR 102.06 phosphorus
Watershed Organizations in the. Southeast Handout
 Attachment E: Watershed Organizations in the Southeast Handout E Watershed Organizations in the Southeast Handout Lake Lanier Handout - Alternative Nutrient Strategies Brown and Caldwell Alternative Nutrient
NEW Water: Green Bay Metropolitan Sewerage District
 NEW Water: Green Bay Metropolitan Sewerage District Third largest wastewater treatment facility in Wisconsin Currently treat 38 million gallons a day Two facilities Green Bay Facility (30mgd) De Pere Facility
For the Basin Management Action Plan Adopted by the Florida Department of Environmental Protection. for the. [Name] Basin Addressing [Impairment(s)]
![For the Basin Management Action Plan Adopted by the Florida Department of Environmental Protection. for the. [Name] Basin Addressing [Impairment(s)]](/thumbs/88/114721107.jpg "For the Basin Management Action Plan Adopted by the Florida Department of Environmental Protection. for the. [Name] Basin Addressing [Impairment(s)]") [YEAR] ANNUAL UPDATE For the Basin Management Action Plan Adopted by the Florida Department of Environmental Protection for the [Name] Basin Addressing [Impairment(s)] BMAP Report Year [Year] Developed
[YEAR] ANNUAL UPDATE For the Basin Management Action Plan Adopted by the Florida Department of Environmental Protection for the [Name] Basin Addressing [Impairment(s)] BMAP Report Year [Year] Developed
Healthy Farms Healthy Lakes Task Force Recommendations. Approved on August 1, 2018
 Healthy Farms Healthy Lakes Task Force Approved on August 1, 2018 Introduction The Dane County Board of Supervisors created the Dane County Healthy Farms, Healthy Lakes Task Force in 2017 with a charge
Appendix D Monitoring Program
 Appendix D Monitoring Program [This page left intentionally blank.] Shingle Creek and West Mississippi Watershed Management Commissions Third Generation Watershed Management Plan Monitoring Program Minnesota
MARYLAND TRADING and OFFSET POLICY and GUIDANCE MANUAL CHESAPEAKE BAY WATERSHED
 MARYLAND TRADING and OFFSET POLICY and GUIDANCE MANUAL CHESAPEAKE BAY WATERSHED Marya Levelev Maryland Department of the Environment May 17, 2017 1 Overview of Presentation Background 2017 Trading Manual
Phosphorus Multi- Discharger Variance
 Phosphorus Multi- Discharger Variance (a Plain English Guide) WWOA ANNUAL CONFERENCE OCTOBER 12, 2016 PAT MORROW, PE DISCLAIMER!!! DNR submitted the final MDV package to EPA on March 30, 2016. EPA was
NOTICE OF REGULAR MEETING
 NOTICE OF REGULAR MEETING PLEASE TAKE NOTICE that there will be a regular meeting of the Commission of the Madison Metropolitan Sewerage District at 8:00 a.m., on Thursday, January 30, 2014 in the Commission
Water Resources Management Summer Workshops
 1970 Alternative Solutions for Water Quality Management in Dane County, Dane County To identify and evaluate several alternative institutional frameworks for improving water quality management in Dane
Stakeholder Identification Plan
 Minnesota Pollution Control Agency and Wisconsin Department of Natural Resources Lake St Croix TMDL Excess Nutrients Combined Stakeholder Participation Strategy Stakeholder Participation Water bodies that
WDNR - Using Snap-Plus to Quantify Phosphorus Trading Credits ( )
") WDNR - Using Snap-Plus to Quantify Phosphorus Trading Credits (10-23-) Purpose The purpose of this document is to provide technical assistance for using the P Trade report in SnapPlus to quantify Phosphorus
WDNR - Using Snap-Plus to Quantify Phosphorus Trading Credits (10-23-) Purpose The purpose of this document is to provide technical assistance for using the P Trade report in SnapPlus to quantify Phosphorus
Eric Rortvedt, P.E.
 Eric Rortvedt, P.E. Eric.Rortvedt@wisconsin.gov Has been a long process. The final guidance differs substantially from the originally envisioned approach of using the mass allocation directly from the
City of Madison Engineering Dept. Jim Bachhuber, PH Brown and Caldwell Madison, WI
 Wisconsin League of Municipalities Conference Fall, 2015 Enhanced Phosphorus Removal from Stormwater --One Approach to TMDL Compliance August 4, 2015 Greg Fries, PE City of Madison Engineering Dept. Jim
The City of Tomah s Watershed Adaptive Management Journey. Greg Droessler Town and Country Engineering
 The City of Tomah s Watershed Adaptive Management Journey Greg Droessler Town and Country Engineering Overview What is Watershed Adaptive Management (AM)? Overview of Tomah s WWTP How the City selected
Historical Water Quality Data Analysis, Pearson Creek, Springfield, Missouri
 The Ozarks Environmental and Water Resources Institute (OEWRI) Missouri State University (MSU) Historical Water Quality Data Analysis, Pearson Creek, Springfield, Missouri Prepared by: Marc R. Owen, M.S.,
STRATEGIES FOR PHOSPHORUS COMPLIANCE. James E. Kleinschmidt, P.E. September 10, 2013
 STRATEGIES FOR PHOSPHORUS COMPLIANCE James E. Kleinschmidt, P.E. September 10, 2013 Strategies for Phosphorus Compliance Applicable Statewide Criteria Basis for Rule-Wadeable Streams Basis for Rule-Nonwadeable
2012 Nutrient Regulations Update
 2012 Nutrient Regulations Update OWEA Government Affairs Workshop March 1, 2012 Guy Jamesson, PE, BCEE Malcolm Pirnie, The Water Division of ARCADIS Imagine the result Agenda Nutrient impacts Nutrient
2006 Aliceville Reservoir Report. Rivers and Reservoirs Monitoring Program
 2006 Aliceville Reservoir Report Rivers and Reservoirs Monitoring Program Field Operations Division Environmental Indicators Section Aquatic Assessment Unit May 2011 Rivers and Reservoirs Monitoring Program
Decision Rationale. Total Maximum Daily Load for Phosphorus for the Sassafras River, Cecil and Kent Counties, Maryland 4/1/2002
 Decision Rationale I. Introduction Total Maximum Daily Load for Phosphorus for the Sassafras River, Cecil and Kent Counties, Maryland 4/1/2002 The Clean Water Act (CWA) requires a Total Maximum Daily Load
Bacon Creek Watershed Plan Implementation Chapter 3: Learning More - Monitoring to Secure New Data Draft
 Bacon Creek Watershed Plan Implementation Chapter 3: Learning More - Monitoring to Secure New Data Draft There are two main goals of watershed planning: protect good water quality and improve poor water
2017 Revised Guide for Chesapeake Bay Water Quality Two-year Milestones
 2017 Revised Guide for Chesapeake Bay Water Quality Two-year Milestones Purpose Based upon agreements by the Chesapeake Executive Council beginning in 2008, EPA created an accountability framework that
Evaluation of Leaf Collection Programs as a Means to Reduce Nutrient Loads from Urban Basins in Wisconsin
 Evaluation of Leaf Collection Programs as a Means to Reduce Nutrient Loads from Urban Basins in Wisconsin History of the U.S. Geological Survey Water Resources Division The Water Resources Division is
Appendix 2 Screening of Keewatinoow Construction Camp Waste Water Effluent Discharge to Creek Fourteen
 Appendix 2 Screening of Keewatinoow Construction Camp Waste Water Effluent Discharge to Creek Fourteen Prepared by: North/South Consultants Inc. July 19, 2011 Introduction The following provides a screening
BASELINE ASSESSMENT OF WATER QUALITY IN SUPPORT OF THE ROOT RIVER WATERSHED RESTORATION PLAN
 BASELINE ASSESSMENT OF WATER QUALITY IN SUPPORT OF THE ROOT RIVER WATERSHED RESTORATION PLAN Preliminary Data Report August 3, 2011 August 1, 2012 Sarah Wright, BA Julie Kinzelman, PhD, MT (ASCP) September
Existing Land Use. Proposed
 May 31, 2018 Staff Analysis of a Proposed Amendment to the Dane County Water Quality Plan Revising the Sewer Service Area Boundary in the Waunakee Urban Service Area 1) Existing Conditions a) Land Use
2016 Monitoring Report; Mississippi River Tributaries
 2016 Monitoring Report; Mississippi River Tributaries SWWD s East Mississippi watershed (Map 1) is named after the former East Mississippi Watershed Management Organization which managed the area prior
Lower Boise River Implementation Plan Total Phosphorus
 Lower Boise River Implementation Plan Total Phosphorus Final Lower Boise Watershed Council and the Department of Environmental Quality July 2008 Executive Summary The Idaho Department of Environmental
Sandies Creek Watershed
 SH 97 Sandies Creek Watershed Gonzales De Witt FM 1116 Sandies Creek SH 72 FM 240 FM 466 Sandies Creek Karnes Smiley Elm Creek FM 108 US 87 SH 80 FM 1117 Guadalupe FM 1681 Wilson Nixon 13657 1803B 1803B
July 2009 WATER QUALITY SAMPLING, ANALYSIS AND ANNUAL LOAD DETERMINATIONS FOR THE ILLINOIS RIVER AT ARKANSAS HIGHWAY 59 BRIDGE, 2008
 July 29 WATER QUALITY SAMPLING, ANALYSIS AND ANNUAL LOAD DETERMINATIONS FOR THE ILLINOIS RIVER AT ARKANSAS HIGHWAY 59 BRIDGE, 28 LESLIE B. MASSEY, WADE CASH, AND BRIAN E. HAGGARD Submitted to Arkansas
Water Is Not a Pollutant
 Water Is Not a Pollutant Jeff R. Bowman, MSPH, CHMM Texas A&M Engineering Extension Service September 17, 2013 What is Stormwater Runoff? Texas Definition: Rainfall runoff, snow melt runoff, and surface
Chapter 2: Technology/Indicator Analysis
 2020 Facilities Plan State of the Art Report Chapter 2: Technology/Indicator Analysis 2.1 Introduction To begin the production theory analysis, specific water quality indicators and technologies that address
2018 Monitoring Strategy for the Des Plaines River Watershed. Purpose
 2018 Monitoring Strategy for the Des Plaines River Watershed Purpose This Monitoring Strategy for the Des Plaines River Watershed in Lake County Illinois was developed by the Monitoring Committee of the
Indian River Lagoon (IRL) Basin Management Action Plans (BMAPs) Fact Sheet
 Basin Management Action Plans (BMAPs) Fact Sheet") Indian River Lagoon (IRL) Basin Management Action Plans (BMAPs) Fact Sheet Improving Water Quality and Seagrass Bed Coverage in the Lagoon Overview of Total Maximum Daily Loads A Total Maximum Daily Load
Indian River Lagoon (IRL) Basin Management Action Plans (BMAPs) Fact Sheet Improving Water Quality and Seagrass Bed Coverage in the Lagoon Overview of Total Maximum Daily Loads A Total Maximum Daily Load
APPENDIX A. Nutrient Trading Criteria Specific for the Chesapeake Bay Watershed
 Purpose: APPENDIX A Nutrient Trading Criteria Specific for the Chesapeake Bay Watershed The purpose of Appendix A is to provide additional program specific information regarding the use and incorporation
What is a TMDL? MWEA NPDES Permit Compliance Seminar. December 2, 2009
 What is a TMDL? Total Maximum Daily Load is an estimate of the maximum amount of a pollutant that a water body can receive and still meet water quality standards, and an allocation of that amount to the
What happens if a water body doesn t meet its water quality standard (the numeric nutrient criteria)?
?") Page 1 of 15 Why Does the City of Fort Myers Need a Nutrient Credit Bank? The estuarine portion of the Caloosahatchee River, the part that runs through Fort Myers, is not in compliance with the State s
Page 1 of 15 Why Does the City of Fort Myers Need a Nutrient Credit Bank? The estuarine portion of the Caloosahatchee River, the part that runs through Fort Myers, is not in compliance with the State s
U.S. Environmental Protection Agency s Interim Expectations for the Phase III Watershed Implementation Plans
 U.S. Environmental Protection Agency s Interim Expectations for the Phase III Watershed Implementation Plans The U.S. Environmental Protection Agency (EPA) provided expectations for the Phase I 1 and Phase
Nutrient and Sediment Modeling of the Yahara Lakes Watershed
 Nutrient and Sediment Modeling of the Yahara Lakes Watershed Yahara CLEAN Project Rob Montgomery John Panuska Watershed Remediation Flow Chart - Watershed-scale Analysis - Pheasant Branch Field-scale pilot
July 2009 WATER QUALITY SAMPLING, ANALYSIS AND ANNUAL LOAD DETERMINATIONS FOR NUTRIENTS AND SOLIDS ON
 July 2009 WATER QUALITY SAMPLING, ANALYSIS AND ANNUAL LOAD DETERMINATIONS FOR NUTRIENTS AND SOLIDS ON THE BALLARD CREEK, 2008 LESLIE B. MASSEY, WADE CASH, AND BRIAN E. HAGGARD Submitted to Arkansas Natural
MARYLAND DEPARTMENT OF THE ENVIRONMENT 1800 Washington Boulevard Baltimore MD
 MARYLAND DEPARTMENT OF THE ENVIRONMENT 1800 Washington Boulevard Baltimore MD 21230 410-537-3000 1-800-633-6101 Martin O Malley Governor Anthony G. Brown Lieutenant Governor November 6, 2009 Shari T. Wilson
TMDLs and Phosphorus Compliance: Reconnaissance, Creative Solutions and Partnerships
 TMDLs and Phosphorus Compliance: Reconnaissance, Creative Solutions and Partnerships SEH, Inc. Airports Architecture Bridges Community Development & Project Funding Community Planning Construction Services
Henderson Watershed WRIA 13. Chapter Includes: Tanglewilde Stormwater Outfall Woodard Creek Woodland Creek
 Henderson Watershed WRIA 13 Chapter Includes: Tanglewilde Stormwater Outfall Woodard Creek Woodland Creek 146 Tanglewilde Stormwater Outfall PART OF HENDERSON WATERSHED PRIMARY LAND USES: Urban residential
Final TMDL Implementation Plan. Prepared for Minnesota Pollution Control Agency
 Wirth Lake Final TMDL Implementation Plan Prepared for Minnesota Pollution Control Agency September 2010 4700 West 77 th Street Minneapolis, MN 55435-4803 Phone: (952) 832-2600 Fax: (952) 832-2601 wq-iw11-03c
U.S. EPA Region 6 Review Guide For Watershed-Based Plans
 U.S. EPA Region 6 Review Guide For Watershed-Based Plans Introduction In October, 2003, EPA developed the 2004 319 National Program and Grants Guidelines (2004 Guidelines) established to restore nonpoint
UW-MADISON GREEN INFRASTRUCTURE PLAN
 UW-MADISON GREEN INFRASTRUCTURE PLAN Gary Brown, UW-Madison David Wolmutt, SmithGroupJJR GROWING SUSTAINABLE COMMUNITIES OCTOBER 3, 2017 PRESENTATION AGENDA Project Context Evolution of Campus Green Infrastructure
1.1 MONITORING PROGRAM OBJECTIVES The major objectives of the Monitoring Program outlined in the Municipal Stormwater Permit are to:
 1.1 MONITORING PROGRAM OBJECTIVES The major objectives of the Monitoring Program outlined in the Municipal Stormwater Permit are to: Assess compliance with the Los Angeles County Municipal Stormwater Permit
EXISTING AND READILY AVAILABLE DATA
 EXISTING AND READILY AVAILABLE DATA The Bureau of Clean Water s Water Quality Division is seeking data for consideration in the 2018 303(d) assessment process. Data will be accepted until September 30
City of Fairmont Storm Water Pollution Prevention Plan Annual Public Meeting. June 11, 2018
 City of Fairmont Storm Water Pollution Prevention Plan Annual Public Meeting June 11, 2018 Why is Water Quality Important? Water has always been important to Minnesota and is a key part of our history,
Lake of the Pines. Watershed TMDL. Depressed DO conditions in 3,700 acres of upper reservoir; declining
 Lake O O the Pines Watershed TMDL Presented at: 15 th National NPS Monitoring Workshop August 27, 2007 Vernon D. Rowe, P.E. Pilgrim s Pride Corporation Corporate Environmental Manager Lake of the Pines
(Must be a county, city, township, watershed district, watershed management organization or joint powers organization.)
") 2010 Proposal Form Minnesota Clean Water Partnership (CWP) Resource Investigation Project Implementation Project Doc Type: Proposal Proposal Deadline: 4:30 p.m. Friday, August 13, 2010 Review the 2010
2010 Proposal Form Minnesota Clean Water Partnership (CWP) Resource Investigation Project Implementation Project Doc Type: Proposal Proposal Deadline: 4:30 p.m. Friday, August 13, 2010 Review the 2010
Water Quality Conditions. Introduction Surface Water Quality Conditions Groundwater Quality Conditions
 2 Water Quality Conditions Introduction Surface Water Quality Conditions Groundwater Quality Conditions 9 INTRODUCTION The basic facts and conditions most important in understanding water quality issues
Technical Tasks to Support Revision of the TMDL 1) Update lake models to account for slow decay rate for phosphorus (Anderson) 2) Update Lake
 Update lake models to account for slow decay rate for phosphorus (Anderson) 2) Update Lake") Technical Tasks to Support Revision of the TMDL 1) Update lake models to account for slow decay rate for phosphorus (Anderson) 2) Update Lake Elsinore model to include interaction between zooplankton and
Technical Tasks to Support Revision of the TMDL 1) Update lake models to account for slow decay rate for phosphorus (Anderson) 2) Update Lake Elsinore model to include interaction between zooplankton and
Madison Metropolitan Sewerage District Request for Proposals Chloride Treatment Feasibility Study
 Madison Metropolitan Sewerage District Request for Proposals Chloride Treatment Feasibility Study As part of an overall chloride reduction program, the Madison Metropolitan Sewerage District (District)
Jordan River Total Maximum Daily Load Study. Presented By: James Harris Utah Division of Water Quality
 Jordan River Total Maximum Daily Load Study Presented By: James Harris Utah Division of Water Quality Jordan River Watershed TMDL Study Area No Introduction Necessary A Few Things to Point Out... Lower
Lake Wallenpaupack Watershed Assessment Project
 Submitted to: Pennsylvania Growing Greener Grants Center Submitted by: Lake Wallenpaupack Watershed Management District HC 1 Box 15D Paupack, PA 18451 Table of Contents Title Page Executive Summary...
STATE OF MINNESOTA MINNESOTA POLLUTION CONTROL AGENCY FINDINGS OF FACT FACILITY HISTORY
 STATE OF MINNESOTA MINNESOTA POLLUTION CONTROL AGENCY IN THE MATTER OF THE DECISION ON THE NEED FOR AN ENVIRONMENTAL IMPACT STATEMENT FOR THE PROPOSED HOWARD LAKE WASTEWATER TREATMENT IMPROVEMENTS PROJECT
SAN BERNARD RIVER ABOVE TIDAL - SEGMENT 1302
 SAN BERNARD RIVER ABOVE TIDAL - SEGMENT 1302 SAN BERNARD RIVER ABOVE TIDAL - SEGMENT 1302 LAND COVER BACTERIA DISSOLVED OXYGEN NUTRIENTS Impairment Concern No Impairments or Concerns SAN BERNARD RIVER
Lower Fox River Basin Water Quality Trading Economic Feasibility Assessment
 Lower Fox River Basin Water Quality Trading Economic Feasibility Assessment Project Team: Contact: Mark S. Kieser Kieser & Associates, LLC 536 E. Michigan Ave., Suite 300 Kalamazoo, MI 49007 (269) 344-7117
Environmental Services
 215 Environmental Services River Water Quality Summary for the Twin Cities Metropolitan Area In 215, Metropolitan Council Environmental Services (MCES) river monitoring was conducted at six automated and
Middle Huron Stormwater Plan for Addressing Total Maximum Daily Loads (TMDLs)
") Middle Huron Stormwater Plan for Addressing Total Maximum Daily Loads (TMDLs) The following plan was developed by the Middle Huron Watershed Stormwater Advisory Group (SAG) a collaboration between communities
Middle Huron Stormwater Plan for Addressing Total Maximum Daily Loads (TMDLs) The following plan was developed by the Middle Huron Watershed Stormwater Advisory Group (SAG) a collaboration between communities
Chapter 1: Kinnickinnic River Watershed Restoration Plan Executive Summary
 Chapter 1: Watershed Restoration Plan Executive Summary 1.1 Introduction The primary purpose of this Watershed Restoration Plan (WRP) is to identify specific actions that can be implemented between 2010
STATE OF MINNESOTA MINNESOTA POLLUTION CONTROL AGENCY FINDINGS OF FACT. St. Francis Wastewater Treatment Facility Project Description
 p-ear2-78b STATE OF MINNESOTA MINNESOTA POLLUTION CONTROL AGENCY IN THE MATTER OF THE DECISION ON THE NEED FOR AN ENVIRONMENTAL IMPACT STATEMENT FOR THE PROPOSED ST. FRANCIS WASTEWATER TREATMENT FACILITY
MS4 Assessment Program to Satisfy Part V. Monitoring Requirements
 MS4 Assessment Program to Satisfy Part V. Monitoring Requirements Submitted by City of Boynton Beach MS4 Permit No. FLS000018-004 The purpose of this document is to outline the City of Boynton Beach Stormwater
Adrian Stocks Wisconsin DNR Wastewater Operations Director. Wisconsin s Multi-Discharger Phosphorus Variance
 Adrian Stocks Wisconsin DNR Wastewater Operations Director Wisconsin s Multi-Discharger Phosphorus Variance Photo by: Rhonda Cain Carrell (Petenwell Lake) Protecting Wisconsin s Waters Water Quality Standards
City of Fairmont Storm Water Pollution Prevention Plan (SWPPP) January 23, 2017
 January 23, 2017") City of Fairmont Storm Water Pollution Prevention Plan (SWPPP) January 23, 2017 Why is Water Quality Important? Water has always been important to Minnesota and is a key part of our history, culture, economy
City of Fairmont Storm Water Pollution Prevention Plan (SWPPP) January 23, 2017 Why is Water Quality Important? Water has always been important to Minnesota and is a key part of our history, culture, economy
City of Delray Beach MS4 Assessment Program: Part V. Monitoring Requirements MS4 Permit No. FLS
 City of Delray Beach MS4 Assessment Program: Part V. Monitoring Requirements MS4 Permit No. FLS 000018 004 The purpose of this document is to outline the assessment program for the City of Delray Beach
Cannon River One Watershed, One Plan. POLICY COMMITTEE MEETING January 10, 2018 Rice County Government Center Faribault, MN
 Cannon River One, One Plan POLICY COMMITTEE MEETING January 10, 2018 Rice County Government Center Faribault, MN TASK Task 1. Aggregate Existing Physical & Spatial Data 1A. Create project maps 1B. Meeting
Byllesby Reservoir Phosphorus TMDL Public Meeting & Open House May 13, 2013 Phillippo Scout Reservation
 Byllesby Reservoir Phosphorus TMDL Public Meeting & Open House May 13, 2013 Phillippo Scout Reservation Minnesota Pollution Control Agency Cannon River Watershed Partnership wq-iw9-10n Thank you for your
TMDL and Stormwater Regulations & Policy: Recent Developments and their Implications for MS4 Permit Holders
 14 th Annual EPA Region 6 Stormwater Conference 26 June 2012 TMDL and Stormwater Regulations & Policy: Recent Developments and their Implications for MS4 Permit Holders Michael F. Bloom, PE, CFM, BCEE
Draft Wasteload Allocation Report For Logan County Rural Water District #1
 Draft Wasteload Allocation Report For Logan County Rural Water District #1 Contents 1. Problem Definition... 1 2. Endpoint Identification... 1 3. Source Analysis... 2 3.1. Point Sources... 2 3.2. Non-Point
Peach Creek Watershed
 SH 304 Peach Creek Watershed Bastrop Peach Cree FM 713 Caldwell Peach Creek, Sandy Fork Copperas Creek 1803C Peach Creek Fayette FM 1054 US 90 Waelder US IH US 90 FM 1680 IH 10 Dry Run Gonzales SH 97 Peach
Wisconsin s Multi-Discharger Phosphorus Variance, Individual Variances, and TMDLs
 Wisconsin s Multi-Discharger Phosphorus Variance, Individual Variances, and TMDLs Emma Lorenzen, Matt Claucherty Wisconsin Dept. of Natural Resources ACWA Nutrients Permitting Workshop Nov. 6-8, 2018 Agenda
Evaluation of Leaf Collection as a Means to Reduce Nutrient Loads from Urban Basins
 Evaluation of Leaf Collection as a Means to Reduce Nutrient Loads from Urban Basins Bill Selbig USGS Wisconsin Water Science Center This information is preliminary and is subject to revision. It is being
MIDDLE GRAND RIVER WATERSHED MANAGEMENT PLAN
 MIDDLE GRAND RIVER WATERSHED MANAGEMENT PLAN Michigan Department of Environmental Quality tracking code: #2010-0012 Prepared by: Rachael Loucks Watershed Coordinator Eaton Conservation District 551 Courthouse
Workshop. By: Jim Klang, PE Kieser & Associates. Kalamazoo, MI 49007
 By: Jim Klang, PE Kieser & Associates 536 East Michigan Ave Suite 300 Kalamazoo, MI 49007 Why Trade? TN Reduction Cost Comparisons Minnesota has: Why Trade? Two point-nonpoint p permits One basin overlay
The City of Cocoa (City) is located in east
 is located in east") FWRJ Reclaimed Water and Stormwater: A Perfect Pair to Meet Total Maximum Daily Load Wasteload Allocations? Danielle Honour, James Wittig, John A. Walsh, and Don Stevens Danielle Honour, P.E., D.WRE, and
FWRJ Reclaimed Water and Stormwater: A Perfect Pair to Meet Total Maximum Daily Load Wasteload Allocations? Danielle Honour, James Wittig, John A. Walsh, and Don Stevens Danielle Honour, P.E., D.WRE, and
The 2004 Modeling and Management Program
 The 2004 Modeling and Management Program Dane County Regional Hydrologic Study Prepared by staff to the Dane County Regional Planning Commission in cooperation with the Wisconsin Geological and Natural
Sediment and Bacteria Allocations Addendum to the Lower Boise River TMDL
 Sediment and Bacteria Allocations Addendum to the Lower Boise River TMDL FINAL Lower Boise Watershed Council and the Department of Environmental Quality Table 15 Reserve for Growth revised June 12, 2012
4. CONVEYANCE SYSTEM
 4. CONVEYANCE SYSTEM 4.1. Background... 1 4.2. Existing Conveyance System... 1 4.3. Current Conveyance Deficiencies for Centralized Treatment... 4 4.4. Existing Facility Condition Assessment... 5 CONVEYANCE
Joint Pollutant Reduction Plan
 Paxton Creek Watershed TMDL, Chesapeake Bay PRP, Wildwood Lake PRP, and UNT to Spring Creek PRP August 23, 2017 2018 PAG 13 Regulation NPDES (National Pollutant Discharge Elimination System) Individual
Phosphorus Kyle Minks Land and Water Resources Scientist Land Conservation Division
 Phosphorus Kyle Minks Land and Water Resources Scientist Land Conservation Division Overview Phosphorus 101 Phosphorus transport What is legacy phosphorus How phosphorus is managed to reduce environmental
Estimated Fiscal Impacts on Selected Municipal Separate Storm Sewer System Permittees
 Waters of the United States Regulations Proposed by the US EPA and US ACOE Estimated Fiscal Impacts on Selected Municipal Separate Storm Sewer System Permittees Prepared for: August 29, 2014 Prepared by
Flow-Based Surrogate TMDLs, A Case Study in Ohio
 Lower Grand River TMDL January 2012 This fact sheet describes the characteristics of a good surrogate total maximum daily load (TMDL) and the factors that should be considered when selecting a surrogate
Fiscal Year (FY) 2017 CWA 319(h) Grant DRAFT Scope of Work Summary. Upper San Marcos River Watershed Protection Plan Implementation
 2017 CWA 319(h) Grant DRAFT Scope of Work Summary. Upper San Marcos River Watershed Protection Plan Implementation") Fiscal Year (FY) 2017 CWA 319(h) Grant DRAFT Scope of Work Summary Upper San Marcos River Watershed Protection Plan Implementation Submitted by Texas State University, The Meadows Center for Water and
Fiscal Year (FY) 2017 CWA 319(h) Grant DRAFT Scope of Work Summary Upper San Marcos River Watershed Protection Plan Implementation Submitted by Texas State University, The Meadows Center for Water and
North Dakota s Nutrient Reduction Strategy. Presented to the 2016 ND Water Quality Monitoring Conference March 4, 2016
 North Dakota s Nutrient Reduction Strategy Presented to the 2016 ND Water Quality Monitoring Conference March 4, 2016 Nutrients Nutrients, in appropriate amounts, are essential to the growth and health
Appendix B Wasteload Assimilative Capacity Analysis
 Appendix B Wasteload Assimilative Capacity Analysis WASTELOAD ASSIMILATIVE CAPACITY (WAC) ANALYSIS FOR LEGACY RIDGE 1.0 Introduction The Legacy Ridge development will generate wastewater that will be treated
Status and Trends of Water Quality in Wisconsin s Lakes, Streams, and Rivers
 Status and Trends of Water Quality in Wisconsin s Lakes, Streams, and Rivers Tim Asplund, Matt Diebel, Katie Hein, and Mike Shupryt Water Resources Program, WDNR AWRA Wisconsin Section Annual Meeting March