Improving the Effectiveness of In-Suite Ventilation Systems with Respect to Cross Contamination and Odour Transmission in MURBs
|
|
|
- Heather Gregory
- 5 years ago
- Views:
Transcription
1 Improving the Effectiveness of In-Suite Ventilation Systems with Respect to Cross Contamination and Odour Transmission in MURBs by Caleb Alexander Parker A thesis submitted in conformity with the requirements for the degree of Master of Applied Science Civil Engineering Department University of Toronto Copyright by Caleb Parker, 2012
2 Improving the Effectiveness of In-Suite Ventilation Systems with Respect to Cross Contamination and Odour Transmission in MURBs Caleb Alexander Parker Master of Applied Science Department of Civil Engineering University of Toronto 2012 ABSTRACT As in-suite heat recovery ventilator (HRV) use increases, cases of cross-contamination and odour transmission in MURBs are beginning to appear. To mitigate these issues and maximize HRV benefits, a better design and construction methodology specific to MURBs is required. Previously conducted condition surveys suggest the possibility of the fresh air supply becoming contaminated by the exhaust air stream from adjacent units. It is suggested that the intake and exhaust configuration has a significant influence on the potential for cross contamination. The results show cross contamination is an issue in high-rise condominiums. With a low exhaust vent angle and the right wind direction and speed, contaminants can travel from an exhaust source to a fresh air supply in a significant quantity. The potential impact here is to protect the health and safety of all home owners living in high-rise condominiums that utilize in-suite ventilation systems. ii
3 Acknowledgements I would like to acknowledge several people who have helped me along the way in completing my thesis. I would not be in the position I am today without their everlasting support. First off to my Supervisor Professor Kim Pressnail who has helped me endlessly from beginning to end. I cannot thank you enough for all of the support and encouragement you have provided throughout my Masters. To David DeRose at Halsall for supporting my thesis and helping me get in contact with numerous helpful people. To Gord Cooke and Kevin McCabe at Air Solutions for providing me with Venmar equipment and the best literature review I could ask for. To Renzo Basset, I am genuinely sorry for driving you crazy in the structural laboratory. To Marianne Touchie and Ekaterina Tzekova, thank you for all of your knowledge and help that you have provided along the way. Finally, to my parents Carol and Stephen Parker who not only got me hooked on engineering before grade 9, but have somehow encouraged my curiosity and aspirations to no end. To my siblings Ira, Jaclyn and Soda, you will never know how much your words of insight have helped me in all of my accomplishments. iii
4 Table of Contents 1. INTRODUCTION HISTORY OF VENTILATION SYSTEMS BACKGROUND OBJECTIVE OUTLINE OF THE THESIS LITERATURE REVIEW LABORATORY TESTING COMPUTER MODELING DATA ANALYSIS GUIDELINE DEVELOPMENT BACKGROUND AND CURRENT ISSUES ON VENTILATION SYSTEMS THE NEED TO PROVIDE FRESH AIR RELATIONSHIP BETWEEN MURB VENTILATION AND OCCUPANT HEALTH RELATIONSHIP BETWEEN MURB VENTILATION AND ENERGY SAVINGS RELATIONSHIP BETWEEN MURB VENTILATION AND HUMAN COMFORT EARLY DEVELOPMENT OF VENTILATION SYSTEMS LOW-RISE APPLICATION iv
5 HIGH-RISE APPLICATION CLASSICAL ENVELOPE INFILTRATION METHOD CONTINUOUSLY PRESSURIZED CORRIDOR VENTILATION SYSTEM DIRECT SUPPLY APPROACH IN-SUITE VENTILATION GOVERNING CODES AND GUIDELINES OBC AND NBCC REGULATIONS CAN/CSA CODE ASHRAE STANDARDS VENTILATOR TYPES HEAT RECOVERY VENTILATORS (HRVs) ENERGY RECOVERY VENTILATOR (ERVs) KNOWN ISSUES FOR HEAT AND LATENT RECOVERY DEVICES LABORATORY TESTING FOR CROSS CONTAMINATION BACKGROUND OF LABORATORY TESTING DESIGN AND CONSTRUCTION OF THE MOCKUP EQUIPMENT SETUP ERVs CARBON DIOXIDE REGULATION SENSORS, MONITORING AND SAMPLING v
6 4. COMPUTATIONAL FLUID DYNAMIC MODELING GEOMETRIC MODELING/MESHING MODEL SETUP AND BOUNDARY CONDITIONS FLUENT SOLVER PREFERENCES RESULTS & DISCUSSION EXPERIMENTAL RESULTS TUNING THE ANSYS MODEL RESULTS ALTERNATE COMPUTER MODELS DETERMINING EXHAUST PATHS ANSYS TESTING BASE MODEL RESULTS ANSYS TESTING VENT ANGLE MODEL RESULTS (SIDE VIEW) ANSYS TESTING EXHAUST SPEED MODEL RESULTS ANSYS TESTING WIND (HEAD/SIDE/CROSS/CROSS-MAX) MODEL RESULTS CONVENTIONAL INTAKE AND EXHAUST ARRANGEMENTS IMPLICATIONS OF EXPERIMENTAL & COMPUTER MODELING RESULTS CONVENTIONAL AND ALTERNATE VENTILATION SYSTEM DESIGNS SUGGESTED SOLUTION - 90 DEGREE EXHAUST CONCLUSIONS FURTHER RESEARCH vi
7 1. ON-SITE TESTING OF CROSS CONTAMINATION IN HIGH-RISE CONDOMINIUMS ADVANCED/DETAILED CFD ANALYSIS WIND TUNNEL EXPERIMENTS REFERENCES APPENDIX A TWO STOREY MOCKUP CONSTRUCTION APPENDIX B LABORATORY TEST RESULTS APPENDIX C COMPUTATIONAL FLUID DYNAMIC MODEL SETUP APPENDIX D ANSYS CALIBRATION TO LABORATORY TESTING APPENDIX E ANSYS SOLVER ITERATION CALIBRATION APPENDIX F ANSYS BASE MODEL RESULTS APPENDIX G ANSYS VENT ANGLE RESULTS SUMMARY APPENDIX H ANSYS VENT SPEED RESULTS SUMMARY APPENDIX I ANSYS WIND RESULTS SUMMARY vii
8 List of Tables Table 1 - Two storey condominium dimensions as entered into Ansys Table 2 - Entire 3D model dimensions as entered into Ansys Table 3 - Fresh air supply intake details in Ansys Table 4 - Exhaust air vent details in Ansys Table 5 - Resultant distances from the exhaust vent Table 6 - Cross contamination levels on a wall face at their respective distances from an exhaust vent Table 7 - Intake and exhaust separation distances on four high-rise condominiums in Toronto, Ontario Table 8 - Levels of dilution along the cross wind exhaust plume centerline Table 9 - Laboratory results showing the dilution levels at various sensor tested locations Table 10 - Mesh sizing restraints as entered into ICEM CFD Table 11 Boundary conditions as entered in Ansys viii
9 List of Figures Figure 1 - Matrix of possible supply and exhaust design configurations (Canada Mortgage and Housing Corporation, 2003) Figure 2 - Incidences of suspected health problems due to indoor air quality by air quality rating (Statistics Canada, 2009) Figure 3 Visual representation of a HRV (Natural Resources Canada, 2009) Figure 4 Summer and winter comfort zones (ASHRAE - Fundamentals Handbook, 2009) Figure 5 - Stack effect in a high-rise condominium with central air (Lstiburek, 2006) Figure 6 - Stack effect in a high-rise condominium without central air (Lstiburek, 2006) Figure 7 - Ventilation system setup in a standard condominium(canada Mortgage and Housing Corporation, 2003) Figure 8 - Fixed-plate heat exchanger (ASRHAE - HVAC Systems & Equipment Handbook, 2008) Figure 9 - Rotary wheel (enthalpy wheel) heat/moisture exchanger(asrhae - HVAC Systems & Equipment Handbook, 2008) Figure 10 - Two storey condominium mockup in the structural laboratory Figure 11 - Mockup construction photos in the structural laboratory Figure 12 - Venmar Constructo 1.0 Air Exchanger (Venmar, 2012) Figure 13 - CO 2 regulator providing flow at a maximum speed of 7.1 L/s Figure 14 - CO 2 controller with digital display in the upper suite of the mockup Figure 15 Temp, relative humidity and CO 2 sensors as provided by SMT Research and COZIR Figure 16 - Sensors placed in the exhaust duct behind the vent ix
10 Figure 17 - Sensors used for ambient readings Figure 18 An example of a sensor location in line with the exhaust vent and plume Figure 19 - Geometry of the CFD model as designed in Ansys DesignModeler (isometric view) Figure 20 Quadrilateral meshing along the external faces of the model Figure 21 Interior side of the model showing various mesh elements Figure 22 - Model setup and boundary conditions as shown in Ansys Figure 23 - Location of points monitored during experimental testing with respect to the wall face and floor Figure 24 Expected and modeled exhaust paths plotted against experimental sensor tested locations Figure 25 Experimental and model dilution levels for vent angle of tested locations Figure 26 - A picture of water vapour exhausting from the mockup for the purpose of demonstrating the CO2 exhaust plume's path during experimental testing Figure 27 - Graphical results from Ansys showing a vertical slice through the CO2 exhaust plume (30 nominal vent angle) Figure 28 - Exhaust ventilation ductwork with a sensor inside and the cap off to the left Figure 29 - Photos demonstrating how the concentration of CO 2 slowly fades with each additional interval. These photos are just samples and do not correspond to a given test Figure 30 - Side view of the base model results Figure 31 - Side view of the 30 degree vent angle model results (1.32m/s vent speed) Figure 32 - Side view of the 45 degree vent angle model results (1.32m/s vent speed) Figure 33 - Side view of the 60 degree vent angle model results (1.32m/s vent speed) x
11 Figure 34 - Side view of the 90 degree vent angle model results (1.32m/s vent speed) Figure 35 Model exhaust paths by vent angle Figure 36 - Side view of the increased vent speed model results (1.65m/s vent speed) Figure 37 - Side view of the decreased vent speed model results (0.99m/s vent speed) Figure 38 - Exhaust paths for an increased and decreased exhaust speed in Ansys Figure 39 - Four modeled wind scenarios in Ansys Figure 40-3D view of the contaminant flow in head wind as it appears in Ansys Figure 41 - Side view of the head wind model results Figure 42-3D view of the contaminant flow in a side wind as it appears in Ansys Figure 43 - Side view of the side wind model results Figure 44-3D view of the contaminant flow in a 0.25m/s wind angled at 45 degrees as it appears in Ansys Figure 45 - Side view of the 0.25m/s cross wind model results Figure 46-3D view of the contaminant flow in a 0.35m/s wind angled at 45 degrees as it appears in Ansys Figure 47 - Side view of the 0.35m/s cross wind model results Figure 48 The level of dilution at various distances from the exhaust vent, sorted by wind type and direction Figure 49 - XY cut a few centimeters parallel to the face of the building during a cross wind model scenario Figure 50 - Suggested vent cap design Figure 51 - Four k-frame walls on top of each other during pre-construction in the building science laboratory xi
12 Figure 52 - Additional pre-construction photos from the building science laboratory Figure 53 - Construction photos in the structural laboratory Figure 54 - CO2 tank behind the two storey mockup Figure 55 - Geometry of the CFD model as designed in Ansys DesignModeler (bottom view) Figure 56 - Clear isometric view of the 3D model showing the two storey mockup and the larger body of influence in front Figure 57 - Meshing along a XY slice showing the interior mesh along the condominium s walls and vents Figure 58 - Volume versus vertex based meshing(ansys, 2010) xii
13 List of Abbreviations & Acronyms ASHRAE CSA ERV HRV HVAC ISVS MURB NBCC OBC American Society of Heating, Refrigeration, and Air-Conditioning Engineers Canadian Standards Association Energy Recovery Ventilator Heating Recovery Ventilator Heating, Ventilation and Air Conditioning In-Suite Ventilation Systems Multi-Unit Residential Building National Building Code of Canada Ontario Building Code xiii
14 1. INTRODUCTION 1.1. HISTORY OF VENTILATION SYSTEMS Since the introduction of heat and energy recovery ventilators (HRVs/ERVs) in the mid 1970 s, ventilation systems have seen numerous advancements including the codes governing their installation and operation (Cooke, Gord, 2008). The distance between intake and exhaust vents for standard residential combustion appliances has been a debate for decades (Cooke, Gord, 2008). CAN/CSA, OBC, NBCC and ASHRAE have all outlined codes and guidelines pertaining to the installation and distance between such ducts. Historically, three significant problems exist with air to air exchangers in high-rise residential applications. They include the formation of frost, intake duct blockage and contamination from other house exhausts (Cooke, Gord, 2008). Collectively, these issues have been the focus of ventilation system design and discussion since their introduction in condominiums. To minimize the formation of frost, heat and energy recovery ventilators have experimented with three methods; preheating supply air, reducing the HRV/ERVs effectiveness and airstream bypass (ASRHAE - HVAC Systems & Equipment Handbook, 2008). The effect of frost blockage if not handled correctly creates a pressure drop across the system causing a reduction in air flow and ultimately a reduced effectiveness of the ventilation system (ASRHAE - HVAC Systems & Equipment Handbook, 2008). The outdoor temperature at which frost control should be implemented can be estimated by an equation provided by ASHRAE (ASRHAE - HVAC Systems & Equipment Handbook, 2008). 1
15 The effects of fresh air intake duct blockage by means of dust and other small particle accumulation (also known as fouling) is similar to that of frost formation (ASRHAE - HVAC Systems & Equipment Handbook, 2008). Any type of blockage in a ventilation system will cause a reduction in air flow and ultimately a reduced HRV/ERV effectiveness (ASRHAE - HVAC Systems & Equipment Handbook, 2008). The third issue and primary focus of this thesis pertains to the cross contamination of air flow. There are three common methods for cross contamination to occur in a ventilation system. The first two come as a result of imperfections in the construction of a ventilation system. An ERV contains an enthalpy wheel or fixed plate system to transfer both sensible and latent heat between air streams (ASRHAE - HVAC Systems & Equipment Handbook, 2008). Since ERVs require moisture transfer between inlet and outlet air streams (as opposed to heat transfer only in an HRV), two known deficiencies may occur. The first is cross-flow leakage and refers to the air flow through small gaps or imperfections in the ventilator (ASRHAE - HVAC Systems & Equipment Handbook, 2008). The second is carryover which is the transfer of contaminants between streams by means of a rotating enthalpy wheel (ASRHAE - HVAC Systems & Equipment Handbook, 2008). For HRVs, carryover and cross-leakage are less likely to occur since the exchanger is typically fixed plate. The third method known as cross contamination is the result of exhaust air reaching the fresh air supply on the exterior side of the envelope. It is suggested that outdoor and exhausted contaminants have several methods of delivery to a fresh air supply vent (Halsall Associates Limited, 2010). The exhaust originates from residential appliances that vent to the outdoors, including gas stove range hoods, furnaces, clothes dryer and recovery ventilation exhaust systems (Canada Mortgage and Housing Corporation, 2003). 2
16 Furthermore, if the exhaust system vents are not carefully positioned on the exterior façade the combined effects of wind and buoyancy will allow air flow from exhaust system vents to reach the fresh air supply vents BACKGROUND Recovery ventilators were introduced to maintain an acceptable indoor air quality (ASRHAE - HVAC Systems & Equipment Handbook, 2008). The advantage to these devices is that they not only increase indoor air quality by diluting the interior air with outdoor air, but they also minimize energy consumption and safety concerns (ASRHAE - HVAC Systems & Equipment Handbook, 2008). Starting in the mid 1960 s, high-rise condominiums have attempted to achieve adequate ventilation from either central (roof-mounted) or in-suite ventilation equipment (Condobusiness, 2009). An indication of health problems along with experimental testing shows that previous methods of ventilation have been insufficient (Statistics Canada, 2009). As such it is instinctively known that many ventilation systems require adaptation. Condition surveys have been conducted over the last few years at numerous downtown Toronto condominiums posing questions of air quality (DeRose, 2011). In one such survey, a condominium built in 2009 with in-suite ventilation systems reported several complaints of odours including tobacco and cooking aromas (DeRose, 2011). In the past, these odours have been suspected to be a result of air transfer between suites (Canada Mortgage and Housing Corporation, 1998). Specifically, the effect of air flowing through interior walls and/or the corridors (Canada Mortgage and Housing Corporation, 1998). However, for various reasons new 3
17 construction has led designers to compartmentalize suites as best as possible along with pressurizing corridors preventing a back draft in the event of a fire (Smoke-Free Housing Ontario, 2010). For this reason it is suspected that contaminated air must be entering the suite through the only other possible penetration path allowing air flow in the ventilation system, the HRV inlet. After considering the above mentioned design requirements it is believed the cross contamination is occurring as the result of one owner s suite exhaust reentering another suite s fresh air supply. There are theoretically 36 possible fresh air supply/exhaust ventilation system options that can exist in any high-rise condominium (Canada Mortgage and Housing Corporation, 2003). Figure 1 shows that of these 36, only 21 have the potential to provide adequate indoor air quality (Canada Mortgage and Housing Corporation, 2003). Figure 1 - Matrix of possible supply and exhaust design configurations (Canada Mortgage and Housing Corporation, 2003). 4
18 The mechanical systems constitute the use of a constant flow fan running at either a suite, floor or central level (Canada Mortgage and Housing Corporation, 2003). The passive systems rely on induced pressures typically induced as a result of stack effect (Canada Mortgage and Housing Corporation, 2003). Passive exhaust cannot be implemented on a suite or floor level because the pressures due to stack effect would be insufficient (Canada Mortgage and Housing Corporation, 2003). In addition, the mechanical supply and passive exhaust combination cannot exist for safety reasons (Canada Mortgage and Housing Corporation, 2003). A positively pressurized suite could potentially result in condensation issues especially in a cold climate (Canada Mortgage and Housing Corporation, 2003). The focus of this study pertains to in-suite ventilation systems which on the chart shown above refers to the highlighted box (mechanical supply and exhaust at a suite based level). This combination is being installed in an increasing number of high-rise condominiums as a result of its exceptional ventilation performance and minimal suite space requirement (Canada Mortgage and Housing Corporation, 2003) OBJECTIVE The purpose of this project is to develop an alternative exhaust strategy for new install and retrofitting of in-suite ventilation systems. The guidelines will be created based on the results of computational fluid dynamic modeling, experimental testing and analysis. The design strategies will reference both new and retrofit type construction and will guide designers in positioning intake and exhaust ductwork so as to minimize the risk of cross contamination. 5
19 1.4. OUTLINE OF THE THESIS LITERATURE REVIEW Relevant literature, journal articles and previous research performed on in-suite ventilation systems in multi-unit residential buildings (MURBs) will be collected and synthesized. The literature will include references from codes, guidelines and standards including the OBC, NBCC, CAN/CSA and ASHRAE LABORATORY TESTING A two storey mockup of condominium suites with an active in-suite ventilation system will be designed and constructed. The two suites will be compartmentalized to eliminate the possibility of cross contamination through the walls, floor and ceiling. The top suite is filled with approximately 2500ppm of carbon dioxide and then exhausted at a steady state to the surrounding ambient air environment. Carbon dioxide sensors are placed at various coordinates both in-line with and horizontal of the exhaust plane to determine the level of cross contamination at several locations COMPUTER MODELING Simulations similar to the previous experimental tests will be performed in ANSYS (computational fluid dynamics modeling program). The model is then calibrated to match the experimental results as best as possible. Upon completion of the calibration and normalization of the computer models, further simulations such as alternate winds, exhaust vent angles and more can be tested to determine the effects and levels of cross contamination for various scenarios. 6
20 DATA ANALYSIS Data gathered from experimental testing will be analyzed and compared to the computer model simulation results. Based on these analyses, relationships between in-suite ventilation system design factors and the level of contaminant dilution at given distances from an exhaust vent are developed with a view to assisting designers. It is essential that the results of each test be normalized to the level of dilution downwind of the original exhaust as the carbon dioxide concentration in each of the experimental tests will vary GUIDELINE DEVELOPMENT Guidelines and tools will be drafted for practitioners to use in new construction or retrofit applications. These guidelines will incorporate both design and installation tools for utilizing insuite ventilation systems, and establishing a best practices method for minimizing the risks of cross contamination. 7
21 2. BACKGROUND AND CURRENT ISSUES ON VENTILATION SYSTEMS Historically several types of ventilation system configurations have been used since their introduction to high-rise condominiums (Canada Mortgage and Housing Corporation, 2003). They include exhaust only, pressurized corridors, direct supply and in-suite ventilation systems (Canada Mortgage and Housing Corporation, 2003). Each one of these systems has its advantages and disadvantages related to air quality, energy savings, human comfort and safety (Canada Mortgage and Housing Corporation, 2003). These relationships are discussed in the following sections THE NEED TO PROVIDE FRESH AIR There are several air quality guidelines proposed by Health Canada to ensure the health and safety of condominium residents (Health Canada, 2012). These guidelines are typically in the form of recommended exposure limits (Health Canada, 2008). An exposure limit as defined by the Seton Resource Center is a given concentration of a known contaminant that if not exceeded will not induce potentially dangerous adverse affects on the person being exposed (Tricor Direct, Inc. and IntraWEB, 2008). Everyday indoor pollutant sources such as stoves, furnaces and the CO 2 from human exhalation can potentially put home owners at risk (Health Canada, 2008). Each source may contaminate the indoor air and can contribute towards an unhealthy and potentially dangerous living environment (Health Canada, 2008). The concentrations of odourless contaminants such as carbon monoxide and carbon dioxide can increase significantly before a home owner has any idea that he or she may be at risk (Health Canada, 2008). Since carbon dioxide is produced by nearly every pollutant source and is always in the ambient air, it is commonly used to measure indoor air quality (Canada Mortgage and Housing Corporation, 8
22 1998). Ambient outdoor air contains approximately 0.04% (~ 400 ppm) carbon dioxide, however this number often changes by location and environment (U.S. Department of Commerce, 2012). Health Canada and nearly every other body governing indoor air quality has set some safe and acceptable level of carbon dioxide concentrations in the air (Health Canada, 2008). The concentration of carbon dioxide in the air is often a good indicator of ventilation quality indoors. As such a maximum limit of approximately 1000ppm is considered safe and well within comfort range (Schell & Int-Hout, 2001). Exceeding exposure limits of carbon dioxide can result in people becoming drowsy and experiencing other reversible side effects (Health Canada, 2008). At carbon dioxide levels well beyond the exposure limits (~35,000-50,000ppm), people can be permanently affected (Health Canada, 2008). These levels of carbon dioxide are not particularly an issue in high-rise condominiums. However from experience, indoor levels are commonly found above the suggested 1000ppm guidelines RELATIONSHIP BETWEEN MURB VENTILATION AND OCCUPANT HEALTH A direct correlation can be made between a lack of ventilation in a high-rise condominiums and health problems (Statistics Canada, 2009). Contaminants such as carbon monoxide, carbon dioxide, radon, mould, dust and volatile organic compounds may potentially pose health risks to home owners (Statistics Canada, 2009). Statistics Canada states that five percent of one of their nationwide surveys (~1.7 million people assuming a total population of 34 million) identified someone in their household with a health problem directly related to reduced indoor air quality (Statistics Canada, 2009). As seen in Figure 2, 69 percent of the surveyors previously reported either fair or poor indoor air quality (Statistics Canada, 2009). 9
23 Figure 2 - Incidences of suspected health problems due to indoor air quality by air quality rating (Statistics Canada, 2009). Twenty percent of Canadian home owners reported that they have seen condensation on the inside surface of their windows not including their shower and kitchen areas (Statistics Canada, 2009). An increase in moisture can cause mould, mildew and other health issues. The importance here is that home owners do not have adequate ventilation if they are observing condensation on the interior side of their windows (Statistics Canada, 2009). It is suggested that several of the above noted poor and fair indoor air quality cases are a result of home owners not having a furnace fan or recovery ventilator to provide adequate air circulation or ventilation (Statistics Canada, 2009) RELATIONSHIP BETWEEN MURB VENTILATION AND ENERGY SAVINGS The potential for energy savings increases with MURB ventilation (Canada Mortgage and Housing Corporation, 2003). If condominium owners choose to receive fresh air with a recovery ventilator, the resulting energy consumption of their heating and cooling load will be reduced (Canada Mortgage and Housing Corporation, 2003). A heating or energy recovery ventilator as 10
.")
24 shown in Figure 3 allows fresh air intake and stale air exhaust to exchange heat in order to minimize the load on a furnace or air conditioner (Natural Resources Canada, 2009). Figure 3 Visual representation of a HRV (Natural Resources Canada, 2009). HRVs are capable of being over 80 percent effective in recovering heat from the exhaust stream and exchanging it to the intake stream (Natural Resources Canada, 2009). The two in one process carried out by the HRV allows fresh air into a condominium and reduces the energy load with recovered heat. Similarly, an ERV capable of recovering both heat and moisture can be even more effective depending on the geographical location and outdoor environment RELATIONSHIP BETWEEN MURB VENTILATION AND HUMAN COMFORT Human comfort in any type of building occupancy is directly proportional to both the indoor temperature and humidity levels (ASHRAE - Fundamentals Handbook, 2009). The following diagram (see Figure 4) shows acceptable indoor temperature and humidity levels to provide adequate human comfort. 11

25 Figure 4 Summer and winter comfort zones (ASHRAE - Fundamentals Handbook, 2009). When considering an HRV or ERV it is important for a home owner to determine their typical outdoor environment conditions. A HRV is only capable of recovering sensible heat (ie. controlling the indoor temperature), while an ERV is capable of recovering both sensible and latent heat (ie. controlling the indoor temperature and humidity level) EARLY DEVELOPMENT OF VENTILATION SYSTEMS LOW-RISE APPLICATION Low-rise ventilation systems are similar to that of high-rise applications with a few exceptions. On average, low-rise homes have significantly larger floor spaces than high-rise condominiums (Natural Resources Canada, 2009). As such, additional aspects such as the ventilator s fan power and duct location must be considered. The placement of the ventilator must also be conditional 12
26 upon the home s external surroundings (ie. exhaust vents from neighboring house, large trees or other obstructions). Low-rise homes are not discussed further in this project HIGH-RISE APPLICATION As previously noted, several approaches to high-rise ventilation systems have been attempted since their introduction. These systems have been modified and upgraded as they become ineffective or and/or prohibited by code. The details of a few alternate ventilation methods are outlined below CLASSICAL ENVELOPE INFILTRATION METHOD The first ventilation systems implemented in high-rise condominiums were nothing more than exhaust vents positioned in a few locations within a suite (Canada Mortgage and Housing Corporation, 2003). In an exhaust only system, the ventilation strategy is to exhaust air to the outdoors from contaminant sources including washrooms, kitchen ranges and clothes dryers (Air Solutions, 2005). Make-up air for these high-rise residential suites comes from adjacent suites and through the exterior envelope (Air Solutions, 2005). The exhaust only ventilation system failed because of inadequate fresh air supply to suites. The fresh air being provided to suites in a exhaust only system significantly relies on the outdoor environmental conditions (ie. wind, temperature, etc). In addition, modern buildings are constantly increasing air tightness (compartmentalization), which creates a larger resistance to (if not completely preventing) air flow (Air Solutions, 2005). The solution to this problem is to provide fresh air supply to suites with a pressurized system. 13
27 CONTINUOUSLY PRESSURIZED CORRIDOR VENTILATION SYSTEM Central air ventilation allows for one large mechanical unit to exist on the roof with damper controls on air flow to each floor level (Canada Mortgage and Housing Corporation, 2003). The idea is that air flows through a centralized shaft in the center of the building and is then forced into the corridors and suites (Canada Mortgage and Housing Corporation, 2003). Residents are then required to leave an unobstructed gap at the bottom of their door to allow for fresh air to enter their suite (Cooke, 2011). Problems with this solution include corridor pressure losses due to stairwells, elevators, renovations that remove the gap, moisture issues in pressurized suites, increased stack effect with no compartmentalization, fire code issues and residents covering the gap with a mat (Cooke, 2011) DIRECT SUPPLY APPROACH The second solution presented is a direct supply ventilation system by which pressurized air is supplied directly to each suite. Newer condominium suites are constantly increasing air tightness to reduce energy demands and as such require directly supplied ventilation as opposed to relying on air infiltration through the envelope or under a door (Cooke, 2011). The problem with this solution is more of an operations issue. While a few of the previous issues still exist, it is both costly and energy consuming to leave the entire building s ventilation system running at full capacity. Since building owners do not know when individual suite owners will require ventilation, they are forced to leave the system running at all times. In addition, the level of ventilation provided is typically the minimal amount required by code, which will not help eliminate point source odours (Canada Mortgage and Housing Corporation, 2003). Home owners 14

28 have no control over the level of ventilation supply to their suite. The resolution to this problem is the introduction of in-suite HRV and ERV systems IN-SUITE VENTILATION In-suite ventilation systems change the control of operation from the building manager to individual home owners. Given the proper training to use a ventilation system or an automatically controlled system, home owners can receive proper ventilation on demand as their suite requires it (ASRHAE - HVAC Systems & Equipment Handbook, 2008). There are several advantages to in-suite ventilation systems over and above the energy savings and on-demand controls. In-suite ventilation systems allow condominium owners to ensure they are receiving exceptional indoor air quality (Canada Mortgage and Housing Corporation, 2003). Additional minor benefits include reduced stack effect pressures and increased home space due to a reduction in central air ducts (Canada Mortgage and Housing Corporation, 2003). Figure 5 and Figure 6 provide a visual representation of the benefits. Figure 5 - Stack effect in a high-rise condominium with central air (Lstiburek, 2006). 15
.")
29 Figure 6 - Stack effect in a high-rise condominium without central air (Lstiburek, 2006). Similar to every other ventilation system, there are negative aspects of an in-suite ventilation system (Canada Mortgage and Housing Corporation, 2003). The most significant is the capital cost of purchasing hundreds of in-suite ventilators for one condominium plus the operating cost for maintenance on a yearly basis (Canada Mortgage and Housing Corporation, 2003). Where a typical centralized system requires one large and relatively expensive ventilation unit, a 200 unit apartment building, requires 200 ventilators at a greater cost. That being said, if home owners receive even minimal training they are capable of saving money over a period of several years through reduced operating and energy costs (ASRHAE - HVAC Systems & Equipment Handbook, 2008). The training includes how to clean and replace an HRV/ERV filter once a year, control the system to operate at optimal intervals and knowing when to have a mechanic 16
30 come in for inspection (ASRHAE - HVAC Systems & Equipment Handbook, 2008). Another minor disadvantage is the loss of interior home space due to the requirement of a mechanical closet for the ventilation system (Canada Mortgage and Housing Corporation, 2003) GOVERNING CODES AND GUIDELINES For as long as HRVs and ERVs have been installed in condominiums the question always arises, what separation distance do you need between intake and exhaust ducts (Cooke, Gord, 2008). Gord Cooke of Air Solutions wrote a white paper analyzing the codes and guidelines that exist today with respect to the separation distance between intake and exhaust vents. After 25 years of experience he noted the industry standard as a 1.8m (6 ) separation between the intake and exhaust vents (Cooke, Gord, 2008). Additionally, all vents are required to be 0.46m (18 ) from the ground (Cooke, Gord, 2008). As the installation of HRVs and ERVs increase, so does the need for guidelines on installing and operating the systems (Cooke, Gord, 2008). The Ontario Building Code (OBC), National Building Code of Canada (NBCC), CAN/CSA and ASHRAE have all adopted their own codes, standards and guidelines OBC AND NBCC REGULATIONS Section of the Ontario Building Code, 2006 is referred to as Outdoor Intake and Exhaust Openings (Ontario Building Code, 2006). The subsections are as follows: (1) Separate air intake and exhaust outlet openings, when located on the same wall or roof, shall be installed so as to avoid contamination of the ventilation air by the exhaust air. 17
31 (2) Intake openings shall be located so as to avoid contamination of the ventilation air from other local sources such as automobile exhausts and exhaust from adjacent buildings. (3) The distance from the bottom of an air intake opening to finished ground level or to any nearer and lower permanent horizontal surface shall be not less than 450mm or the depth of expected snow accumulation, whichever is greater. (4) The distance separating air intakes from building envelope penetrations that are potential sources of contaminants, such as gas vents or oil fill pipes, shall be not less than 900mm (~ 3ft.). From the above noted subsections it is apparent that although no clear separation distance between intake and exhaust vents is defined, there is a 900mm (~ 3ft.) separation distance between fresh air supply (intake duct) and gas vents (exhaust duct)(cooke, Gord, 2008) CAN/CSA CODE The CAN/CSA code is quite similar to that of the OBC and NBCC with one significant addition. The addition is outlined in Section 5.6 and states that no more than 15 percent cross contamination may occur between a fresh air supply and an exhaust vent (CSA Group, 2010). CAN/CSA F326 M91 identifies the following relevant subsections: Section leakage from the exhaust air stream to any supply air stream shall not constitute more than 15% of the exhaust airflow provided by the packaged ventilator. Section Separate air intake and exhaust openings, when located on the same wall or roof, shall be installed so as to prevent contamination of the ventilation air by the 18
32 exhaust air. Concentric or immediately adjacent air intake and exhaust openings shall be constructed and installed so as to prevent cross-contamination. Section The distance separating outdoor air intakes from building penetrations that are potential sources of contaminants, such as gas vents or oil fill pipes, shall not be less than 900mm. An excerpt from Section states concentric or immediately adjacent air intake and exhaust openings shall be constructed and installed so as to prevent cross-contamination (CSA Group, 2010). The problem is that CAN/CSA along with the OBC and NBCC do not define cross contamination. It could be assumed that the 15 percent transfer as outlined in Section 5.6 of CAN/CSA F326 M91 is the guideline for the above noted excerpt, but this is not defined anywhere in the CAN/CSA regulations. Furthermore, the OBC and NBCC do not even make reference to a safe level of cross-contamination ASHRAE STANDARDS The ASHRAE standards pertaining to high-rise residential air intake and exhaust vent separation are not entirely clear at this point. There are two standards of significance; ASRHAE 62.1 Ventilation for Acceptable Indoor Air Quality (includes high-rise residential buildings), and 62.2 Ventilation and Acceptable Indoor Air Quality in Low-Rise Residential Buildings. Since ASHRAE 62.1 governs high-rise buildings it is the first to be referred to when looking for a separation distance between vents for a condominium. According to ASHRAE 62.1, only Class 3 and Class 4 exhaust air require separation from fresh air supply vents (ASHRAE, 2010). The standard also identifies high-rise residential exhaust air as Class 1 with the exception of the kitchen range hoods (Class 2) (ASHRAE, 2010). As such, the standard does not require any 19
33 separation distance at this time (ASHRAE, 2010). The confusion lies in ASRHAE 62.2, which deals with the same concepts except related to low-rise residential buildings. In ASRHAE 62.2 a 3.0m (10 ) separation is required between fresh air supply and exhaust terminations (ASHRAE, 2010). Section 6.8 states Air inlets shall be located a minimum of 10 ft (3m) from known sources of contamination such as stack, vent, exhaust hood, or vehicle exhaust (ASHRAE, 2010). This requirement is more conservative than the OBC, NBCC and CAN/CSA F326 M91 standard, however it does not yet apply to ASHRAE s high-rise building guidelines VENTILATOR TYPES Sensible and latent heat recovery ventilators are essential to providing excellent indoor air quality at a low operating cost and minimizing energy consumption (ASRHAE - HVAC Systems & Equipment Handbook, 2008). Every HRV or ERV has a different effectiveness whether it utilizes a plate or rotary system. The effectiveness is calculated based on the heat and moisture exchanged between an airstream of high temperature or high moisture to an airstream of low temperature or low moisture (ASRHAE - HVAC Systems & Equipment Handbook, 2008). An ideal ventilation system would also minimize the cross contamination between the two airstreams (ASRHAE - HVAC Systems & Equipment Handbook, 2008). Below is a typical schematic of how a ventilation system would be installed in a condominium. 20

34 Figure 7 - Ventilation system setup in a standard condominium(canada Mortgage and Housing Corporation, 2003). From the schematic shown above in Figure 7, it is evident the ventilation system only recovers exhaust air from the washroom and general living areas. At this time, ventilation systems are only capable of exhausting range hoods and clothes dryers directly to the outdoors (Canada Mortgage and Housing Corporation, 2003). This is because a dryer creates lint and the range hoods vent oil vapour. Both lint and oil vapour can potentially be flammable if they build up in a ventilation system s ductwork HEAT RECOVERY VENTILATORS (HRVs) Heat recovery ventilators allow sensible heat only to transfer from an airstream of high temperature to an airstream of low temperature (ASRHAE - HVAC Systems & Equipment Handbook, 2008). An HRV can be classified by one of the two common types of exchangers found in the system; fixed-plate or rotary (ASRHAE - HVAC Systems & Equipment Handbook, 2008). 21
35 Figure 8 - Fixed-plate heat exchanger (ASRHAE - HVAC Systems & Equipment Handbook, 2008). A fixed plate rotary system as seen above in Figure 8 allows the air to exchange heat along several highly conductive plates connected together and commonly composed of aluminum (ASRHAE - HVAC Systems & Equipment Handbook, 2008). Figure 9 - Rotary wheel (enthalpy wheel) heat/moisture exchanger (ASRHAE - HVAC Systems & Equipment Handbook, 2008). 22
36 A rotary wheel system has a conductive wheel in between the two airstreams that is constantly rotating (ASRHAE - HVAC Systems & Equipment Handbook, 2008) (see Figure 9). The high temperature airstream heats the one side of the wheel, which in turn rotates and releases the heat to the low temperature airstream (ASRHAE - HVAC Systems & Equipment Handbook, 2008) ENERGY RECOVERY VENTILATOR (ERVs) ERVs are similar to HRVs with one additional component. They are capable of transferring not only sensible heat but latent heat (moisture) as well. The construction can still be either fixedplate or rotary, however the difference is ERV exchangers are coated with a desiccant to absorb and release moisture from the air (ASRHAE - HVAC Systems & Equipment Handbook, 2008). The effectiveness of these systems varies significantly by the type of exchanger, the seals between airstreams, the outdoor temperature and maintenance (ASRHAE - HVAC Systems & Equipment Handbook, 2008). ASHRAE denotes the equation for effectiveness of an HRV or ERV as the following: (ASRHAE - HVAC Systems & Equipment Handbook, 2008) KNOWN ISSUES FOR HEAT AND LATENT RECOVERY DEVICES Several known problems may arise when operating a ventilation device. They include; air leakage, air capacity limits, corrosion, pressure drops, maintenance and filtration (ASRHAE - HVAC Systems & Equipment Handbook, 2008). The deficiency of interest to this project is that 23
37 of air leakage, which can be defined as exhaust air flow reaching the fresh air supply (ASRHAE - HVAC Systems & Equipment Handbook, 2008). Air leakage is identified in Chapter 25 of ASRHAE s HVAC Systems and Equipment Handbook as cross flow between improperly sealed holes in a fixed plate or rotary system along with improperly sealed gaskets around an enthalpy wheel (ASRHAE - HVAC Systems & Equipment Handbook, 2008). Both of these potential deficiencies create minimal problems in comparison to the third air leakage issue, which is not mentioned. The third problem is the contaminated exhaust air flow moving back into the fresh air supply inlet from the exterior side of a building. This process as previously mentioned is known as cross contamination. The methods by which exhausted air reaches the fresh air supply will be discussed in Section 5 and is the main focus of this project. 24

38 3. LABORATORY TESTING FOR CROSS CONTAMINATION 3.1. BACKGROUND OF LABORATORY TESTING A two storey mockup of condominium suites was built in the structural laboratory within Sanford Fleming at the University of Toronto (see Figure 10). Figure 10 - Two storey condominium mockup in the structural laboratory. 25
39 The purpose of the mockup was to be able to exhaust carbon dioxide and measure the resulting concentration at several locations downstream (ie. in front of the mockup). The testing was carried out indoors as opposed to outdoors in an attempt to create calm steady state atmospheric conditions (assuming that the indoor airflow in the lab was minimal). The testing was performed after hours with the doors closed and the ventilation system off. The height of each suite was approximately 2.44m (8 ) plus the height of the headers (approx. 2.59m in total per suite). The depth and width of the mockup was sized to allow enough room for the ventilation and the experimental measuring equipment. In addition to this, the interior volume of each suite had to be large enough that significant pressures would not build up as a result of running the ERV system slightly unbalanced DESIGN AND CONSTRUCTION OF THE MOCKUP The construction of the two storey mockup started with building several wall pieces in the building science laboratory at U of T. Four 3.66m x 2.44m k-frames along with four 1.22m x 2.44m laterally reinforced side walls were constructed, squared and moved into the structural laboratory as seen in Figure 11. Additional pieces such as the floor and ceiling were also preassembled in the building science laboratory (see Figure 51, Figure 52, Figure 53 and Figure 54 in Appendix A). Upon completion of the preassembly and moving the pieces into the structural laboratory, the main construction was carried out. 26
.")

40 MOCKUP CONSTRUCTION PHOTOS TWO STOREY CONSTRUCTION LOWER SUITE INTERIOR SETUP Figure 11 - Mockup construction photos in the structural laboratory. Special care was taken in sealing the interior side of each condominium (see Figure 11). Details are outlined in the next section EQUIPMENT SETUP The following sections outline the specific details involved in installing and operating the ERVs, carbon dioxide regulation and the sensors/monitoring/sampling system. 27
 on low speed and 49.6 L/s (105cfm) on high speed.")
41 ERVs The ERVs used are Venmar Constructo 1.0 Air Exhchangers and are provided by Air Solutions (see Figure 12). The system is both Energy Star and HVI approved and has a capacity of 21.1 L/s (45cfm) on low speed and 49.6 L/s (105cfm) on high speed. The majority of the experimental testing is performed on low ventilation speeds in order to maximize the likelihood of cross contamination. Figure 12 - Venmar Constructo 1.0 Air Exchanger (Venmar, 2012). The fresh air supply and stale air exhaust ports were connected to the outer face of the two storey mockup with five inch insulated ductwork (also provided by Air Solutions) CARBON DIOXIDE REGULATION Carbon dioxide (CO 2 ) is delivered to the upper suite using a tank of CO 2, a standard CO 2 regulator and a CO 2 controller. The tank provides a constant flow of CO 2 and the regulator, as shown in Figure 13, then controls the high pressure of the tank (12,400 kpa or 1800 psi) and allows CO 2 to flow constantly at a slower rate of 7.1 L/s (15cfm). 28


42 Figure 13 - CO 2 regulator providing flow at a maximum speed of 7.1 L/s. The controller, as shown in Figure 14, sits in the upper suite and monitors the concentration of CO 2 in the air. If the concentration of CO 2 falls below the set point level (typically between 2000 and 3000ppm depending on the test) the controller activates an electronic switch and allows the regulator to provide CO 2 flow from the tank and regulator. Figure 14 - CO 2 controller with digital display in the upper suite of the mockup. 29
43 This particular CO 2 controller has the capability of allowing CO 2 into the upper suite at a slower or faster speed as needed to keep the concentration relatively constant. Fans were used in the upper and lower suites to ensure uniform CO 2 distribution. CO 2 is heavier than air and as such would sink to the ground and create unwanted readings by the sensors without the fans SENSORS, MONITORING AND SAMPLING There are two types of sensors that were used for sampling the air at various locations. The first was a combined of a temperature and relative humidity sensor with two additional auxiliary ports. The temperature and relative humidity sensor was a custom product created by SMT Research. The device is capable of wirelessly transmitting all the data back to a computer on demand. The second device monitors carbon dioxide in the air and is connected through the first device. This device is manufactured by COZIR, a company whose sole purpose is creating various CO 2 sensors. Both sensors together can be seen below in Figure 15. The accuracy of the sensor is the larger of +/- 50ppm and +/- 3% of the reading. With the exception of the exhaust vent monitor which was consistently reading approximately 2500ppm, a majority of the readings fell within the +/- 50ppm accuracy range. The sampling rate for all three sensors was set for once every 30 seconds. 30

44 Figure 15 Temp, relative humidity and CO 2 sensors as provided by SMT Research and COZIR. In most experimental testing scenarios, three groups of sensors were used. The first was located inside the exhaust vent to ensure the accuracy of the concentration exiting the upper suite. A visual representation of this can be seen in Figure 16 below. 31

.")
45 Figure 16 - Sensors placed in the exhaust duct behind the vent. The second was located in the laboratory, approximately 30 feet away from the mockup to improve the accuracy ambient CO 2 concentration readings (see Figure 17). Figure 17 - Sensors used for ambient readings. 32

46 The third was constantly moved to test the level of contaminant dilution at various locations in what is considered to be the outdoor air. One example of this can be seen below in Figure 18. Figure 18 An example of a sensor location in line with the exhaust vent and plume. Upon completion of all the experimental testing, the results were compared to the Ansys model results and then calibrated. Details are outlined in the next section. 33
47 4. COMPUTATIONAL FLUID DYNAMIC MODELING The computational fluid dynamic modeling serves as a method of ensuring the accuracy of the experimental results and allowing alternate tests to be completed without performing them in the laboratory. The difficulty in predicting the level of cross-contamination between suites stems from the ability to empirically calculate a solution for 3D air flow problems. Several approaches were analyzed in order to come up with what could be considered even a reasonable estimate. The first was an attempt to use the Gaussian Dispersion Model (GDM) to calculate the transfer of any given contaminant from one source to another. The key problem with the GDM is that it is not intended for micro scale analysis (Beychok, 2005). Specifically, the graphs used to model air turbulence in the GDM are meant for downwind measurements no less than 10m from the source (Beychok, 2005). Other factors include the model s limited ability to precisely calculate such a unique case of contaminant transfer due to winds and other distinctive factors. Other attempts at measuring levels of cross-contamination include simple dilution calculations that can be found in the ASHRAE handbooks (ASHRAE - HVAC Applications Handbook, 2007). The problem with the formulations found in ASHRAE is they are not capable of modeling the levels of cross-contamination between condominium suites. The reason for this is again similar to the issues arising with the GDM, the models and equation cannot incorporate certain factors such as wind. The result of this initial research was that Computational Fluid Dynamics (CFD) would have to be used. For this thesis and the rest of the computer model analysis a CFD analysis program known as Ansys will be used. A condominium setup will be modeled in Ansys in attempt to replicate the physical mockup that will be built for experimental testing. The computer model will be used to determine if cross 34
48 contamination is an issue with in-suite ventilation systems in various scenarios. The first and base model is intended to simulate the mockup construction of two condominium suites that will be built in the University of Toronto (U of T) structural laboratory. Through the calibration and comparison of the computer model and mockup, further analysis on the issue of cross contamination and the potential fixes will be examined and tested. The details pertaining to these models and the CFD analysis setup in Ansys is described moderately below and in detail in Appendix C. The computer modeling is a five step process that includes geometric modeling, applying a mesh to the geometry, setting up boundary conditions, key solver preferences, running the simulation and viewing a graphical representation of the results. All five steps must be done sequentially in the order in which they are described below. This means that the first steps take precedence and requires additional accuracy in order to ensure proper setup and reasonable results GEOMETRIC MODELING/MESHING The initial model rendering can be broken down into three major aspects; the two storey condominium, the surrounding air space and the location of the HVAC intake and exhaust ducts. The 3D model shown below in Figure 20 is used as the basis for all further analysis. In the CFD model, the steady state air flow surrounding the condominium is the only volume of interest. The air flow within the condominium is not important because we are only concerned with the contaminant transfer between an exhaust and fresh air supply vent. As such, the interior volume has been removed from the CFD model. 35

49 Figure 19 - Geometry of the CFD model as designed in Ansys DesignModeler (isometric view). The model above in Figure 19 shows the entire model rendering as created in Ansys DesignModeler. The rectangular outline within the large rectangular volume in grey is a scaled replica of the experimental mockup to be built in the structural laboratory at U of T. The dimensions of the interior condominium are listed below in Table 1. Interior Two Storey Condominium Width 3.66m (~12 ) Depth 1.22m (~4 ) Height 5.18m (~17 ) Vent-Vent Distance 2.44m (~8 ) Table 1 - Two storey condominium dimensions as entered into Ansys. 36
50 In addition, the dimensions of the entire model are listed below in Table 2. Surrounding Air Space (entire model) Width 7.66m (~25.1 ) Depth 11.22m (~36.8 ) Height 7.18m (~23.6 ) Table 2 - Entire 3D model dimensions as entered into Ansys. Upon completion of the geometric modeling in DesignModeler, the second step is to mesh the volume space in Ansys s meshing program, ICEM CFD. Specific sections of the model have an increased mesh density in an attempt to improve accuracy in the results (ie. the volume space in front of the vents). Details are outlined in Appendix C. Meshing was applied using the hex dominant method in ICEM CFD. This particular meshing method is important for increased accuracy as it attempts to maximize the number of quadrilateral elements as opposed to triangular elements (ANSYS, 2010). For visual representation of the meshing, see Figure 20 and Figure 21 below. For additional screenshots and details on the ICEM CFD meshing process see Figure 55, Figure 56, Figure 57 and Figure 58 in Appendix C. 37


51 Figure 20 Quadrilateral meshing along the external faces of the model. Figure 21 Interior side of the model showing various mesh elements. 38
. Figure 22 - Model setup and boundary conditions as shown in Ansys.")
52 4.2. MODEL SETUP AND BOUNDARY CONDITIONS The setup of the computer model is similar to that of a wind tunnel experiment. In nearly every test, the air flow path is parallel to the Z-axis (as seen in Figure 22 below). Figure 22 - Model setup and boundary conditions as shown in Ansys. The double sided arrows represent openings in which air flow is free to exchange with outdoor ambient conditions. The smaller arrows on the remaining sides represent symmetry boundary conditions where environmental conditions are assumed to be the same on both sides. The floor and ceilings are considered to be walls similar to the conditions which would be seen in the structural laboratory at U of T. The most important factor of the model setup is ensuring the atmospheric conditions are similar to that of the conditions tested in the laboratory. Following the external boundary conditions, further details must be applied to the intake and exhaust vent faces on condominium wall within the model (see Table 3 and Table 4). These details outline how the intake and exhaust vents will perform in Ansys. 39
53 Intake Ventilation Conditions Boundary Type Boundary Condition Ventilation Speed Outlet (Air flow out of the model and into the condominium) Normal Speed 1.40m/s Table 3 - Fresh air supply intake details in Ansys. For the fresh air supply (condominium suite intake vent) conditions, a speed of 1.40m/s is used to simulate the same speed that is used during experimental testing in the laboratory. This speed was tested using a fan-blade anemometer. Exhaust Ventilation Conditions Boundary Type Inlet (Exhausting from the condominium into the surrounding outdoor model space air) Boundary Condition CVC U direction CVC V direction CVC W direction Exhausted Air (CO2) Exhausted Air (Air) Cartesian Velocity Components (CVC) 0 m/s m/s 1.01 m/s (2000ppm) (998,000ppm) Table 4 - Exhaust air vent details in Ansys. For the exhausting air, Cartesian velocity components are used to simulate the angle and speed of the exhaust. The above noted Cartesian coordinates produce a 50 degree exhaust vent angle (from the wall) along with an exhaust speed of 1.32m/s (as measured in the lab with the fan- 40
54 blade anemometer). The intake and exhaust speeds are somewhat different due to the slight variations in the upper and lower suite setup of the ERV during experimental testing FLUENT SOLVER PREFERENCES The solver preference used for all simulations presented is known as Ansys Fluent. There are two significant differences between Ansys Fluent and the standard CFD choice, Ansys CFX. The difference is in the transition ratio and the value entered for collision avoidance (ANSYS, 2010). Both of these aspects come into play during the meshing of the geometry. Details are outlined in Appendix C. 41
55 5. RESULTS & DISCUSSION 5.1. EXPERIMENTAL RESULTS The laboratory testing was carried out in order to see whether or not cross contamination was likely to occur under calm air conditions using standard inlet/outlet separation distances. In the first test, the exhaust vent was positioned one floor level directly above the inlet vent (approximately a 2.5m separation). By using CO 2 as the exhaust contaminant from the upper suite and knowing that the path of the plume would be in a downwards direction, it was assumed that this would be the worst case scenario. With a CO 2 sensor in the lower suite, the results showed little to no recognizable cross contamination during this test. These results suggest that the path of the exhausted CO 2 plume may be further from the building face than previously expected. In an attempt to trace the contaminant s path, sensors were placed at multiple locations in front of the exhaust vent in areas that were suspected to be along the exhaust plume centerline (see Table 9 in Appendix B). The locations are identified in Figure 24. The exhaust vent height is labeled and identified with an arrow in Figure 23, Figure 24 and Figure
56 DISTANCE BELOW EXHAUST VENT (m) Exhaust vent height: 3.71m 0.00 LABORATORY TESTING LOCATIONS Laboratory Testing Locations DISTANCE FROM WALL FACE (m) Figure 23 - Location of points monitored during experimental testing with respect to the wall face and floor. Figure 23 shows where the sensors were placed with respect to the building face and floor. The randomly tested locations are chosen in an attempt to follow the highest concentration of the plume as it exhausts from the exterior face of the building. Figure 24 shows the expected exhaust 43
57 DISTANCE BELOW EXHAUST VENT (m) paths from the vent assuming a vent height of 3.71m, a nominal vent angle of 30 degrees from vertical and an approximate discharge velocity of 1.32m/s. Exhaust vent height: 3.71m EXPERIMENTAL EXHAUST PATHS Laboratory Testing Locations Expected Exhaust Path Model Suggested Exhaust Path DISTANCE FROM WALL FACE (m) Figure 24 Expected and modeled exhaust paths overlaid on the experimental tested locations. 44
58 Figure 24 represents a few critical results from both the laboratory and model testing. First off, it can be seen that a majority of the laboratory tested locations fall below the expected nominal 30 degree exhaust path. When comparing the expected nominal 30 degree exhaust path to the modeled exhaust path, it is evident that the exhausted contaminants are falling to the floor much quicker than expected. This is assumed to be the result of acceleration due to gravity overcoming the horizontal exhaust speed of the contaminant. It is important to note that the contaminant being exhaust is CO 2 and has a relatively high molecular weight. The testing locations were chosen by obtaining the dilution level at one point and then systematically attempting to follow the plume. Evidentially, the model suggests the exhaust path varies significantly from the original expected path. Again, this is likely due to the exhaust speed of the ventilation system and the weight of the contaminant. However, varying the exhaust vent angle could impact these results and will be discussed further in the next section of this thesis. In this laboratory test, the nominal exhaust vent angle was 30 degrees. It should be noted that the CO 2 is capable of deflecting back and forth behind the vent cap and releasing at an alternate angle. The resulting angle of contaminant release measured from the wall will be here on referred to as the apparent vent angle. Another significant result is that the exhaust plume did not run from the exhaust vent to the fresh air supply vent as previously expected. This means that under static environmental conditions (no wind or large fluctuations in temperature), cross contamination is not likely to occur. In fact, cross contamination is primarily the result of the vent angle, wind speed and direction. 45
59 DISTANCE BELOW EXHAUST VENT (m) The recorded concentrations at each of the experimentally tested sensor locations are identified in Figure 25. The vent angle, outdoor air conditions and discharge velocity are the same as noted for the previous figure. Exhaust vent height: 3.71m LABORATORY AND MODEL DILUTION LEVELS % 32.2% 64.8% Experimental Dilution Levels Model Exhaust Path 66.8% % % 93.8% 82.7% 78.3% 97.2% 96.9% % 96.3% 86.2% 94.4% 85.7% 85.5% 88.0% 85.0% 98.5% 92.2% 88.4% DISTANCE FROM WALL FACE (m) Figure 25 Experimental and model dilution levels for vent angle of tested locations. 46
60 It is evident that the experimental results vary from the modeled results. The data markers in above shown figure represent percent dilution of the CO 2 source. There are a few differences in the modeling along with potential sources of error that could contribute to this variation. On the modeling side it is very difficult to precisely simulate turbulence. In addition to this, more iterations can always be carried out in an attempt to improve accuracy in the solutions however the simulation time would exponentially increase and would not be feasible for this project. On the laboratory side, the sensors and the conditions in the lab are the two largest sources of error. The sensors are only capable of carbon dioxide readings to an accuracy of +/-50ppm, whereas the computer model does not have this issue. The accuracy of the computer model is solely based on the information provided by the user. In addition, the laboratory may have had a minimal draft from the HVAC system which in turn could potentially impact the results TUNING THE ANSYS MODEL RESULTS One of the first steps taken after the completion of the experimentation was to compare the results. The purpose of the comparison was to reconcile the results so that other variables such as wind, ventilation speed and vent angle could be modeled. During the laboratory experimentation, two sets of tests were performed. The first set involved testing various CO 2 concentrations in the vertical plane of the outlet and exhaust plume. The second set involved testing various concentrations to the side of the exhaust plume. The first set of data were expected to outline the level of dilution of the contaminant as it travels further from the exhaust and the second set was used to determine the width of the plume. Since the focus of this project pertains to the centerline of the plume, the Ansys model results was tuned by changing the vent angle, discharge velocity and turbulence intensity to closely match the first set 47


61 of experimental data (concentration of carbon dioxide in line with the exhaust plume). Figure 26 and Figure 27 are graphical representations of the laboratory experimentation and the modeled results. Since the reader would not be able to see carbon dioxide exhausting from the mockup, a glycol/water vapour mix was used in place of CO 2 for the purpose demonstrating the exhaust plume path. Figure 26 - A picture of water vapour exhausting from the mockup for the purpose of demonstrating the CO2 exhaust plume's path during experimental testing. Figure 27 - Graphical results from Ansys showing a vertical slice through the CO2 exhaust plume (30 nominal vent angle). 48

62 To tune the Ansys model so that the results correspond to the experimental results only certain variables can be altered. These variables include the angle of the exhaust vent cap and the level of exhaust turbulence. Other features such as the height of the exhaust vent and the exhaust speed were both fixed during testing and as such should not be changed. One might argue the exhaust vent angle is fixed and should not be altered. However, it is nearly impossible to determine the angle at which the carbon dioxide is being released since the air is capable of deflecting after reaching the vent cap (see Figure 28). Although the nominal vent angle is 30 degrees, the effective vent angle appeared to be greater. In addition, it is noted that the exhaust ventilation speeds were tested without a vent cap. As such, during the initial stages of calibration, a lower exhaust speed was tested as it was suspected the vent cap may act as a damper to the exhaust flow. Figure 28 - Exhaust ventilation ductwork with a sensor inside and the cap off to the left. 49
63 The following models were tested in order to find which test best matched the experimental results (for detailed results see Appendix D): degree vent 5% turbulence degree vent 5% turbulence and a 10% reduction in exhaust flow degree vent 5% turbulence and a 10% reduction in exhaust flow degree vent 5% turbulence and a 10% reduction in exhaust flow degree vent 5% turbulence and a 5% reduction in exhaust flow degree vent 1% turbulence degree vent 5% turbulence After analyzing the modeling tests, it was determined that the 50 degree vent cap angle with 1% turbulence provided results which were most similar to the 30 degree nominal vent angle results from the lab observations. It should be noted that the turbulence intensity is simplified down to 1% for low turbulence, 5% for mid turbulence and 10% for high turbulence in Ansys. Turbulence intensity can be calculated with the following formula: Where, I = Turbulence intensity Re = Reynolds number for the exhaust vent The second step in the modeling process focused on the number of iterations required to be completed in order to achieve a reasonable average model result. For this project, the goal was to find some level of acceptable convergence on the numbers produced by the Ansys model with 50
64 a 50 degree vent cap at one percent turbulence. This particular model was tested several times, with an increasing number of iterations. The first test was performed with 100 iterations, while each additional test would double the previous amount (ie. 100 iterations, 200, 400, 800, etc). The goal is to achieve results whereby the next simulation with an increased level of iterations produces results all within a 100 percent difference from the previous test. The results being compared are the concentration levels at various points around the laboratory mockup and the computer model. For detailed results, see Appendix E. The results show that the difference between results in the 800 and 1600 iteration simulations were all within 100 percent of each other. As such the 800 iteration solution was identified as the base model. The 1600 iteration model could have been used however the increased simulation time would not be worth the marginal increase in accuracy for these types of tests. The final step of the modeling process involved comparing the results of the laboratory testing to the tuned Ansys base case model. The results from each experimental test were normalized based on their respective exhaust concentrations. For the laboratory testing, the exhaust levels varied by test while the Ansys models had a consistent CO 2 exhausting concentration of 2000ppm ALTERNATE COMPUTER MODELS The base model in Ansys was used to model tests that could not be performed during laboratory testing. These tests include variations of exhaust ventilation cap angles variations in ventilation speeds and various directional winds. All Ansys models from here on out are solved with 800 iterations and were a modification of the original base case. The following simulations were carried out in Ansys: 51
65 1. 30 Vent cap angle (see Figure 31) Vent cap angle (see Figure 32) Vent cap angle (see Figure 33) Vent cap angle (see Figure 34) 5. Increased ventilation speed (1.65m/s) (see Figure 36) 6. Decreased ventilation speed (0.99m/s) (see 7. Figure 37) 8. Head wind (0.25m/s towards the wall) (see Figure 40 and Figure 41) 9. Side wind (0.25m/s from the side) (see Figure 42 and Figure 43) 10. Cross wind (0.25m/s at a 45 angle towards the wall) (see Figure 44 and Figure 45) 11. Cross wind (0.35m/s at a 45 angle towards the wall) (see Figure 46 and Figure 47) Each of the above tests were analyzed based on the direction of the exhaust plume. The plume was cut into 0.5m intervals progressively from the wall face until the CO 2 concentration level was insignificant. The coordinates of the highest concentration point on each interval was recorded for further analysis. Several graphs identifying the relationship between the contaminant distance travelled and the levels of dilution were created for each test. Since the path of the exhaust plume is typically curved, the contaminant distance is broken down into horizontal distance from the wall and vertical distance from the exhaust vent DETERMINING EXHAUST PATHS An important step in analyzing the experimental data is to normalize all the results based on the concentration of CO 2 in the exhaust stream. This process produces a set of results (discussed previously and can be found in the appendices) from both the experimental and computer model 52
66 testing that can be compared to one another. The data from each set of tests was broken down into a relationship between the contaminant distance travelled versus the difference in concentration between the two points (percent dilution of exhaust). The exhaust paths of the plume were also outlined to show the relationship between the ventilation design factors and the level of dilution at a given distance from the exhaust vent. It is important to note that the exhaust paths were plotted based on the highest concentration point at each interval cut made from the Ansys modeling. The dilution calculation in each graph was calculated using the following equation: 5.5. ANSYS TESTING BASE MODEL RESULTS The base model results are the basis of all the additional tests to be completed in Ansys. The model assumes a 50 degree exhaust vent, 1.32m/s exhaust speed and no wind (see Figure 30). The base model was also tuned to match the experimental results more closely. The following series of photos represents the graphical results of each alternate test as simulated by Ansys. The graphical result for each test represents a side view of the exhaust plume. Specifically, the model is cut through the centerline of the plume. Additional cuts parallel to the wall face were produced and can be found in the Appendices. These cuts start at the front face of the building and progress away at intervals of 0.5 meters until the highest point of CO 2 concentration on the next interval is insignificant. An example of these cuts can be found in Figure 29 below. 53

67 SAMPLE: ANSYS MODEL RESULTS Wall Face 0.5m From Wall Face 1.0m From Wall Face 1.5m From Wall Face Figure 29 - Photos demonstrating how the concentration of CO 2 slowly fades with each additional interval. These photos are just samples and do not correspond to a given test. The purpose of these photos is to be able to identify and trace the maximum concentration of CO 2 in the exhaust plume starting at the wall face. Each photo in the series shown above would be tied to a set of data where the highest concentration point can be obtained and then plotted for additional discussion and visual representation. 54

68 BASE MODEL SIDE VIEW: CENTERLINE THROUGH EXHAUST Figure 30 - Side view of the base model results. MODEL DETAILS VENT ANGLE: 50 Degrees VENT SPEED: 1.32m/s WIND ANGLE: None 55
69 5.6. ANSYS TESTING VENT ANGLE MODEL RESULTS (SIDE VIEW) 30 DEGREE NOMINAL VENT ANGLE 45 DEGREE NOMINAL VENT ANGLE Figure 31 - Side view of the 30 degree vent angle model results (1.32m/s vent speed). Figure 32 - Side view of the 45 degree vent angle model results (1.32m/s vent speed). 60 DEGREE NOMINAL VENT ANGLE 90 DEGREE NOMINAL VENT ANGLE Figure 33 - Side view of the 60 degree vent angle model results (1.32m/s vent speed). Figure 34 - Side view of the 90 degree vent angle model results (1.32m/s vent speed). 56
70 It is evident that the trajectory path of the carbon dioxide remains high and furthest from the wall face when the vent angle is increased. After analyzing each of the above shown simulation results, the 90 degree exhaust vent cap angle is the optimal choice for a building. It can be seen in Figure 34 that the exhausted contaminants are travelling the furthest from the face of the wall. The nominal 30 degree vent angle scenario would be considered the worst case as the contaminants remain closest to the wall face. The graphical results shown above were converted to a single graph in an attempt to show all four simulated trajectories in one diagram, Figure
71 DISTANCE BELOW OUTLET (m) Exhaust vent height: 3.71m MODEL EXHAUST PATHS BY VENT ANGLE Degree Exhaust Degree Exhaust Degree Exhaust Degree Exhaust DISTANCE FROM WALL FACE (m) Figure 35 Model exhaust paths by vent angle. Each point on the graph represents the location of the highest concentration at any one of the 0.5m interval cuts in front of the face of the building. For the 90 degree vent angle simulation, the highest concentrations remain the furthest from the face of the building at any given point. It 58
72 should be noted that the height of the exhaust vent is 3.71m. The following graphs depict the relationship between the level of dilution and any given horizontal or vertical distance from the face of the building or exhaust vent, respectively. It should be noted that the further the contaminant travels from the wall face, the less likely the contaminant will be capable of reaching a fresh air supply inlet ANSYS TESTING EXHAUST SPEED MODEL RESULTS The exhaust speed simulation results are displayed similarly to the previous vent angle ones. The only difference is that the vent angle remains at 50 degrees while the exhaust speeds are increased and decreased by 25 percent in each of the tests, respectively. A comparison of the exhaust paths can be found in Figure 38. It is evident that the exhaust speed minimally impacts the path of the contaminants. In addition, it should be noted that the CO 2 concentrations at each of the measured locations varied insignificantly between the exhaust speed tests performed. 59
. Figure 37 - Side view of the decreased vent speed model results (0.")
73 INCREASED VENTILATION SPEED (50 DEGREE VENT ANGLE) DECREASED VENTILATION SPEED (50 DEGREE VENT ANGLE) Figure 36 - Side view of the increased vent speed model results (1.65m/s vent speed). Figure 37 - Side view of the decreased vent speed model results (0.99m/s vent speed). 60
74 DISTANCE BELOW EXHAUST VENT (m) Exhaust vent height: 3.71m 0.00 EXHAUST PATHS BY VENTILATION SPEED Original Vent Speed Plume m/s Increased Vent Speed Plume m/s Decreased Vent Speed Plume m/s DISTANCE FROM WALL FACE (m) Figure 38 - Exhaust paths for an increased and decreased exhaust speed in Ansys. 61

75 5.8. ANSYS TESTING WIND (HEAD/SIDE/CROSS/CROSS-MAX) MODEL RESULTS The wind simulation results are similar to the previous tests with one additional photo. A three dimensional view of the contaminant flow is used to show the exhaust path and concentration of the CO 2. Figure 39 below shows a plan view of the model and all of the wind simulations performed with their respective speed and angle towards the wall. Figure 39 - Four modeled wind scenarios in Ansys. 62
76 HEAD WIND THREE DIMENSIONAL VIEW OF CONTAMINANT FLOW Figure 40-3D view of the contaminant flow in head wind as it appears in Ansys. 63
77 HEAD WIND (continued) SIDE VIEW: CENTERLINE THROUGH EXHAUST Figure 41 - Side view of the head wind model results. MODEL DETAILS VENT ANGLE: 50 Degrees VENT SPEED: 1.32m/s WIND SPEED: 0.25m/s WIND DIRECTION: From the side 64
78 SIDE WIND THREE DIMENSIONAL VIEW OF CONTAMINANT FLOW Figure 42-3D view of the contaminant flow in a side wind as it appears in Ansys. 65
79 SIDE WIND (continued) SIDE VIEW: CENTERLINE THROUGH EXHAUST Figure 43 - Side view of the side wind model results. MODEL DETAILS VENT ANGLE: 50 Degrees VENT SPEED: 1.32m/s WIND SPEED: 0.25m/s WIND DIRECTION: From the front 66
80 CROSS WIND - A THREE DIMENSIONAL VIEW OF CONTAMINANT FLOW Figure 44-3D view of the contaminant flow in a 0.25m/s wind angled at 45 degrees as it appears in Ansys. 67
81 CROSS WIND - A (continued) SIDE VIEW: CENTERLINE THROUGH EXHAUST Figure 45 - Side view of the 0.25m/s cross wind model results. MODEL DETAILS VENT ANGLE: 50 Degrees VENT SPEED: 1.32m/s WIND SPEED: 0.25m/s WIND DIRECTION: 45 Degrees horizontal from the wall face 68
82 CROSS WIND - B THREE DIMENSIONAL VIEW OF CONTAMINANT FLOW Figure 46-3D view of the contaminant flow in a 0.35m/s wind angled at 45 degrees as it appears in Ansys. 69
83 CROSS WIND - B (continued) SIDE VIEW: CENTERLINE THROUGH EXHAUST Figure 47 - Side view of the 0.35m/s cross wind model results. MODEL DETAILS VENT ANGLE: 50 Degrees VENT SPEED: 1.32m/s WIND SPEED: 0.35m/s WIND DIRECTION: 45 Degrees horizontal from the wall face It can be seen from the graphical results that the movement of the exhaust plume varies largely with the speed and direction of the wind. As such, the exhaust plume was again cut into 0.5m slices. The highest concentration and distance travelled from the exhaust vent was recorded and plotted for each interval. The results are shown below in Figure
84 DILUTION (%) Exhaust vent height: 3.71m 0 EXHAUST PLUME DILUTION LEVELS BY WIND TYPE Head Wind Side Wind Cross Wind - B Cross Wind - A y = -2.45x x x x R² = Poly. (Cross Wind - A) DISTANCE FROM EXHAUST VENT (m) Figure 48 The level of dilution at various distances from the exhaust vent, sorted by wind type and direction. It can be seen that the head wind analysis ends at a 1.0m distance from the exhaust vent. This is because the exhaust plume travelled around the side of the building and was deemed irrelevant at this point. In addition, a fourth order polynomial line of best fit was added to the Cross Wind A scenario. When considering cross contamination, this case is considered to be the worst case scenario. As such it is used for calculating the areas of concern or danger zones around an exhaust vent. 71
85 VERTICAL DISTANCE FROM VENT (m) DISTANCE FROM EXHAUST VENT (m) HORIZONTAL DISTANCE FROM VENT (m) VENT N/A N/A N/A N/A N/A N/A Table 5 - Resultant distances from the exhaust vent. Table 5 is a list of resultant distances from an exhaust vent. For example, a point located 2m horizontal and 1.5m below an exhaust vent has a resultant distance of 2.50m. These resultant distances will be used in conjunction with the equation shown in Figure 48 to calculate dilution levels at various locations on any wall face. VERTICAL DISTANCE FROM VENT CROSS CONTAMINATION (%) HORIZONTAL DISTANCE FROM VENT 0.00m 0.50m 1.00m 1.50m 2.00m 2.50m 3.00m 0.00m VENT m m m m N/A 2.50m N/A N/A 3.00m N/A N/A N/A Table 6 - Cross contamination levels on a wall face at their respective distances from an exhaust vent. Table 6 outlines the level of cross contamination on a wall face at various distances from an exhaust vent. These numbers are based on the results from the Cross Wind A model. The cells outlined in red represent a level of cross contamination between 25 and 100 percent. Areas shaded with yellow range between 20 and 25 percent. It is important to note that the CAN/CSA guidelines state that an exhaust and fresh air supply vent should be installed so as to minimize 72
86 the risk of cross contamination and keep it below 15 percent. The data provided from the Cross Wind A wind model only provides contaminant transfer data up to approximately 3.25m from the exhaust vent. At 3.25m from the exhaust vent the cross contamination can still potentially be greater than 15 percent as shown in the table above. It should also be noted that the industry standard is to install fresh air supply and exhaust vents approximately 1.80m from each other. Details to follow in Section CONVENTIONAL INTAKE AND EXHAUST ARRANGEMENTS When referring to conventional intake and exhaust arrangements, the key focus is their separation distance. Several new construction projects located in Toronto, Ontario were examined. Specifically, projects utilizing in-suite ventilation systems are used to determine how high-rise condominiums are being built today. Although the details of the buildings cannot be identified for privacy reasons, the shortest distance between any intake and exhaust vent was measured on four new high-rise condominiums. BUILDING NUMBER INTAKE/EXHAUST SEPARATION m (5-11 ) m (6-0 ) m (7-1 ) m (7-7 ) Table 7 - Intake and exhaust separation distances on four high-rise condominiums in Toronto, Ontario. Table 7 show that a separation distance as short as 1.80m can be expected on any given high-rise building in the Toronto area. By the computer model results from the cross wind scenario (0.25m/s wind at a 45 degree angle to the wall), it can be expected that cross-contamination is an 73
87 issue. For the purpose of discussion and identifying worst case cross contamination scenarios, the exhaust plume from the cross wind model was sliced at 1.80m, 1.83m, 2.15m and 2.30m. The results were as follows: BUILDING NUMBER HORIZONTAL DISTANCE FROM EXHAUST VENT CROSS CONTAMINATION m (5-11 ) 24.2 % m (6-0 ) 24.1 % m (7-1 ) 23.4 % m (7-7 ) 23.0 % Table 8 - Levels of dilution along the cross wind exhaust plume centerline. The values shown above in Table 8 illustrate that more than 23 percent of the original exhausted contaminants can reach a fresh air supply vent 2.30m downwind. Although high concentration results shown above may not be occurring right next to the wall face, the correct wind speed and direction can guide the contaminants anywhere. 74
88 6. IMPLICATIONS OF EXPERIMENTAL & COMPUTER MODELING RESULTS The purpose of the experimental testing and computer modeling is to investigate the rate at which air-born contaminants move from an exhaust vent to a fresh air supply vent. Specifically, the focus is on the level of cross contamination at any given point downwind of an exhaust or contaminant source. Whether the wind is blowing upwards, sideways or downwards, the goal is to determine on average the concentration of a tracer gas at given intervals from the source (0m, 0.5m, 1.0m, etc.). The importance here is twofold; one to determine the potential for cross contamination in existing buildings with in-suite ventilation systems and two to help design future buildings. That being said, standards and guidelines will have to adopt these recommendations in order for them to implemented into building design. The first experimental tests demonstrated that contaminants have the capability of maintaining high concentrations near a building wall after they are exhausted. It was determined that factors such as the wind and the angle of the exhaust vents were key components to the distance from the wall in which contaminants would travel. Since the purpose of this project is to show that a significant level of contaminated air can potentially make it to a fresh air supply vent, various computer models were tested in Ansys. Each type of test examines another potential flaw of existing ventilation systems. The first computer model comparing the angle of the vents showed that a smaller angle will keep the exhausted contaminants near the wall, while a larger angle (ideally 90 degrees) will disperse the contaminant furthest from the wall. The second model has to do with the speed at which the ventilation system exhausts air. The results showed minimal changes from the base model, however a 25 percent increase in speed did disperse the contaminated air slightly more than the 75
89 other two cases with lower speeds. The final set of simulations were completed with varying speeds and directions of wind. The results show that higher speeds will allow the wind to disperse contaminants more quickly, thereby preventing high levels of cross contamination. The wind models also show that the direction of the air flow reaching the building is of great importance to the levels of dilution near the wall. In side winds and headwinds, the carbon dioxide seemed to disperse quickly by flowing past the building or dispersing in every direction. In the final cross wind test with air flowing towards the face of the building at a 45 degree angle horizontal to the wall, cross contamination is potentially a significant issue. Figure 49 is a cut through the model just a few centimeters in front of the face of the building. Figure 49 - XY cut a few centimeters parallel to the face of the building during a cross wind model scenario. 76
90 A point taken 1.8m to the right of the exhaust vent was sampled to determine the potential of cross contamination in a scenario with cross wind. The level of dilution was approximately 92 percent (or 8 percent cross contamination) within 10cm from the wall. However, the level of dilution 30cm from the wall and 1.8m horizontal of the exhaust vent is 76 percent (or 24 percent cross contamination). This means that more than 15 percent of the original contaminants are still near the wall several meters downwind of a vent. Given a low wind speed and a wind direction that would move the air closer to the building face, an exhaust plume is more than capable of flowing directly past an inlet vent with a significant level of contaminant concentration. In addition, if the exhausted contaminants from a home owners suite was unusually high for any particular reason, the risk to another home owner downwind would be increased CONVENTIONAL AND ALTERNATE VENTILATION SYSTEM DESIGNS The following sections outline conventional ventilation system designs as seen in many high-rise condominiums throughout the Province of Ontario. In addition to this, a strategy to minimize cross contamination is discussed SUGGESTED SOLUTION - 90 DEGREE EXHAUST By now it is understood that cross contamination between an exhaust vent and a fresh air supply vent can potentially be an issue depending upon the velocity of the wind. The problem is proportional to the building s geometry, outdoor environmental conditions, the angle of the vent cap and several other factors. Based on the research carried out during this project, it is suggested that the inlet and exhaust vent installation be altered to minimize cross contamination. The recommendation is to provide a 90 degree exhaust vent that extends from the building no less 77

91 than 0.30m. Since rain caps are a necessity on high-rise condominiums, it is suggested that a tip of the exhaust vent be cut backwards and sloped to drain. A graphical representation is shown in Figure 50 below. Figure 50 - Suggested vent cap design. It is recommended that the fresh air supply vent be installed with the same suggested vent cap design as presented for the exhaust vent. The idea of the vent cap design extending from the wall face will help with prevention of cross contamination on both the inlet and outlet vents. For the fresh air supply vent the extension of the vent cap from the face of the wall will help prevent any contaminants forced towards the wall as a result of wind from entering the ducts. 78
92 7. CONCLUSIONS By means of experimental analysis and computer modeling, research related to cross contamination has been carried out and has resulted in the following conclusions. 1. A standard ventilation system running on low (0.0212m 3 /s / 45cfm) or high speed (0.0496m 3 /s / 105cfm) will not create any risk of cross contamination without any additional environmental conditions if the fresh air supply and exhaust vents are separated by a minimum distance of 1.80m (current industry standard). However, this assumes standard construction and heat/energy recovery ventilator installation in highrise condominiums within Toronto, Ontario only. 2. Cross contamination levels were found to be above 21 percent approximately 3.0m from a fresh air supply vent in the model simulating wind angled towards the wall at 45 degrees. Although this concentration was found approximately 15cm from the wall, a slightly alternate angle in the wind or the suction force from a fresh air supply vent may be enough to draw in that contaminated air. This would mean that the CAN/CSA guideline of 15% max cross contamination could be easily broken with an industry standard exhaust to fresh air supply vent separation distance of 1.80m. As such, it is recommended that the separation distance be increased. The exact recommended length is not yet known at this point in time, however a suggestion of a least 3.0m would be recommended. 3. The trajectory path of an exhaust plume given zero wind conditions and no temperature difference between the outdoors and indoors is directly proportional to the exhaust velocity, flow and the angle of the exhaust vent rain cap. Provided that the low and high 79
93 speed settings on most residential recovery ventilators are similar, the exhaust plume is closely related to the angle of the vent cap. Typically exhaust vent cap angles range from about 10 to 90 degrees with respect to the wall face of a condominium. A 90 degree exhaust vent cap will allow the exiting air flow to disperse furthest from the face of the building. The closer a contaminant remains to a wall face, the more likely it is to reach a fresh air supply vent. 4. Outdoor wind conditions have the largest effect on the levels of cross contamination between an exhaust vent and a fresh air supply vent. Both computer modeling and experimental data show that under no wind conditions, the width of the exhaust plume is minimal and would not create cross contamination in a standard condominium in Toronto, Ontario. As such, it is evident that the predominant transportation method of contaminants on the exterior side of a building is wind and buoyancy. The buoyancy will vary based on the molecular weight of the contaminant. The direction and speed of the wind have a significant impact on the dispersion of the exhaust. Higher wind speeds will create more turbulence on the face of the building and disperse the air more quickly. Slower speeds can be lead to cross contamination as they can guide the flow of air in an alternate direction or along the face of the building. As for wind direction, each bearing will have an alternate effect. Wind acting a 90 degree angle to the building face will increase turbulence and disperse contaminants more quickly. Wind flowing across the face of the building from the side may help prevent the fresh air supply from drawing in contaminants depending on the outline of condominium. Wind flowing at an angle to the wall at a slow speed can potentially guide the exhausted air directly towards the fresh air supply vent at high concentrations. The computer model simulating cross wind showed 80
94 the highest levels of cross contamination and should be the largest consideration factor when designing the separation distance between any exhaust and fresh air supply vents. Short of creating some kind of filter that will absorb any smell or contaminant before exhausting, it can be assumed that cross contamination will always be a design consideration for new construction and rehabilitation in the future. The recommended 90 degree and sloped drain exhaust and fresh air supply vent is a good solution because it allows contaminated air to travel furthest from the building while preventing rain from entering the ductwork. 81
95 8. FURTHER RESEARCH There is an opportunity to continue or expand on the research provided within this project. 1. ON-SITE TESTING OF CROSS CONTAMINATION IN HIGH-RISE CONDOMINIUMS For this project, it is recommended that at least five high-rise condominiums be field tested for cross contamination. The idea would be to introduce a constant concentration of a known contaminant and exhaust it through the ventilation system. The concentration of the contaminant would be monitored at several locations along the wall and near other surrounding home owners suites fresh air supply intakes to determine the exhaust paths. Conditions such as indoor temperature, outdoor temperature, wind speed, wind direction and the buoyancy of the contaminant would have to be taken into consideration. The purpose of this project would be to identify the levels of cross contamination in a real life scenario. It is assumed that the effects of a non-smooth wall (varying building shapes) would impact the results differently from previously conducted experimental and computer modeling tests. 2. ADVANCED/DETAILED CFD ANALYSIS Computational fluid dynamics is a very complex subject. As such, there is room for improvement in the accuracy of the CFD models. An entire research project could be devoted to improving the accuracy of the base case model in Ansys. Specifically focusing on the two storey mockup (or larger) with a steady state environment surrounding it. Upon completion, additional models could be created based on slight variances to try and identify potential worst case scenarios for cross contamination. 82
96 3. WIND TUNNEL EXPERIMENTS An alternative to computational fluid dynamics would be to create a miniature version of a scaled high-rise building replica within a wind tunnel. A known level of contaminants could be released from certain locations along the building. The concentration of these contaminants could then be calculated downstream of the exhausting source using flame ionization. This project could also work in conjunction with the advanced CFD model as outlined in the previous section. 83
97 9. REFERENCES BIBLIOGRAPHY Air Solutions. (2005). Assessment of Suite Compartmentalization and Depressurization in New High-rise Residential Buildings. Ottawa: Canada Mortgage and House Corporation. ANSYS. (2010, November). ANSYS Meshing User's Guide. Retrieved July 24, 2012, from ANSYS: ASHRAE - Fundamentals Handbook. (2009). Chapter 9: Thermal Comfort. In ASHRAE, Fundamentals. Atlanta: ASHRAE. ASHRAE - HVAC Applications Handbook. (2007). Chapter 44: Building Air Intake and Exhaust Design. In ASHRAE, HVAC Applications (pp ). Atlanta: ASHRAE. ASHRAE (2010). Table B-1: Comparison of Regulations and Guidelines Pertinent to Indoor Environments. In ASHRAE, Ventilation for Acceptable Indoor Air Quality (p. 28). Atlanta: ASHRAE. ASHRAE. (2010). Standard Ventilation for Acceptable Indoor Air Quality. Standard Ventilation for Acceptable Indoor Air Quality. Atlanta, United States of America: ASHRAE. ASHRAE. (2010). Standard Ventilation and Acceptable Indoor Air Quality in Low-Rise Residential Buildings. Standard Ventilation and Acceptable Indoor Air Quality in Low- Rise Residential Buildings. Atlanta, United States of America: ASHRAE. ASRHAE - HVAC Systems & Equipment Handbook. (2008). Chapter 25: Air-to-Air Energy Recovery. In ASHRAE, HVAC Systems & Equipment. Atlanta: ASHRAE. 84
98 Beychok, M. R. (2005). Fundamentals of Stack Gas Dispersion. Newport Beach: Milton R. Beychok. Canada Mortgage and Housing Corporation. (2003). Field Testing of an Integrated Ventilation Space Conditioning System for Apartments. Ottawa: Canada Mortgage and Housing Corporation. Canada Mortgage and Housing Corporation. (1998). Field Testing to Characterize Suite Ventilation in Recently Constructed Mid- and High-Rise Residential Buildings. Ottawa: Canada Mortgage and Housing Corporation. Canada Mortgage and Housing Corporation. (2003). Ventilation Systems for Multi-Unit Residential Building: Performance Requirements and Alternative Approaches. Vancouver: The Sheltair Group Resource Consultants Inc. Condobusiness. (2009, June). Ventilation options in high-rise condos. Retrieved July 24, 2012, from Condobusiness: Cooke, G. (2011). High-rise Residential Building Ventilation Opportunities. Air Solutions White Paper, pp Cooke, Gord. (2008). Spacing of Exterior Vents for HRVs with respect to Ontario Building Code Compliance. Cambridge: Air Solutions. CSA Group. (2010). CAN/CSA-F326-M91 - Residential Mechanical Ventilation Systems. CAN/CSA-F326-M91 - Residential Mechanical Ventilation Systems. Canada: CSA. DeRose, D. (2011, August). Principal, Halsall Associates. (C. Parker, Interviewer) 85
99 Halsall Associates Limited. (2010). Summary of Occupant Questionnaires. Toronto: Halsall Associates Limited. Health Canada. (2008, July 30). Exposure Guidelines for Residential Indoor Air Quality. Retrieved July 24, 2012, from Health Canada: Environmental and Workplace Health: Health Canada. (2012, March 29). Residential Indoor Air Quality Guidelines. Retrieved July 24, 2012, from Health Canada: Environmental and Workplace Health: Lstiburek, J. (2006, 10 25). BSD-110: HVAC in Multifamily Buildings. Retrieved August 3, 2012, from buildingscience.com: hvac-in-multifamily-buildings/?searchterm=hvac%20in%20multi Natural Resources Canada. (2009, June 26). How a Heat Recovery Ventilator Works. Retrieved July 24, 2012, from Natural Resources Canada: /standard/12014 Natural Resources Canada. (2009). Table 20: Total Hosueholds by Building Type and Principal Heating Energy Source. Retrieved July 24, 2012, from Natura Resources Canada: Comprehensive Energy Use Database Table: Natural Resources Canada. (2009). Table 24: Floor Space by Building Type and Vintage. Retrieved August 3, 2012, from Natural Resources Canada: 86
100 Natural Resources Canada. (2009). Table 45: Apartments Secondary Energy Use and GHG Emissions by Energy Source. Retrieved July 24, 2012, from Natural Resources Canada: Compreshensive Energy Use Database Table: Ontario Building Code. (2006). Ontario Building Code. Schell, M., & Int-Hout, D. (2001). Demand Control Ventilation Using CO2. ASHRAE Journal, Smoke-Free Housing Ontario. (2010). Tenants: Minimize the Problem. Retrieved July 24, 2012, from Smoke-Free Housing Ontario: Statistics Canada. (2009). Chart 2: Incidence of suspected health problems due to indoor air quality by air quality rating, Retrieved August 2, 2012, from Statistics Canada: Statistics Canada. (2009). Chart 3: Use of furnace fans and heat recovery ventilators (HRVs) to improve air circulation by year of construction. Retrieved July 24, 2012, from Statistics Canada: Statistics Canada. (2009). Households and the Environment. Ottawa: Statistics Canada. Statistics Canada. (2009). Table 15: Rating of indoor air quality, by province. Retrieved July 24, 2012, from Statistics Canada: 87
101 Statistics Canada. (2009). Table 16: Methods of improving indoor air quality, by province. Retrieved July 24, 2012, from Statistics Canada: x/ /t056-eng.htm Tricor Direct, Inc. and IntraWEB. (2008). The MSDS Hazard Comminication Library. Retrieved August 3, 2012, from Seton Compliance Resource Center: U.S. Department of Commerce. (2012, July). Trends in Atmospheric Carbon Dioxide. Retrieved August 15, 2012, from Earth System Research Laboratory - Global Monitoring Division: Venmar. (2012). Venmar AVS Constructo 1.0 ERV. Retrieved July 10, 2012, from Venmar: 88
102 APPENDIX A TWO STOREY MOCKUP CONSTRUCTION 89

103 Figure 51 - Four k-frame walls on top of each other during pre-construction in the building science laboratory. Additional photos from the building science laboratory pre-construction phase can be seen below. 90

")


104 PRE-CONSTRUCTION PHOTOS WHEEL CONNECTION SQUARING OF K-FRAME WALLS FLOOR CONSTRUCTION (W/O WHEELS) FLOOR CONSTRUCTION (W/O WHEELS) Figure 52 - Additional pre-construction photos from the building science laboratory. 91


105 LOWER SUITE CONSTRUCTION LOWER SUITE CONSTRUCTION Figure 53 - Construction photos in the structural laboratory. Figure 54 - CO2 tank behind the two storey mockup. 92
106 APPENDIX B LABORATORY TEST RESULTS 93
107 TEST # HEIGHT (m) LABORATORY RESULTS 3.71m- HEIGHT D F W (m) CO2 (%) DILUTION (%) Test Test Test Test Test Test Test Test Test Test Test Test Test Test Test Test Test Test Test Test Test Test Start Table 9 - Laboratory results showing the dilution levels at various sensor tested locations. 94
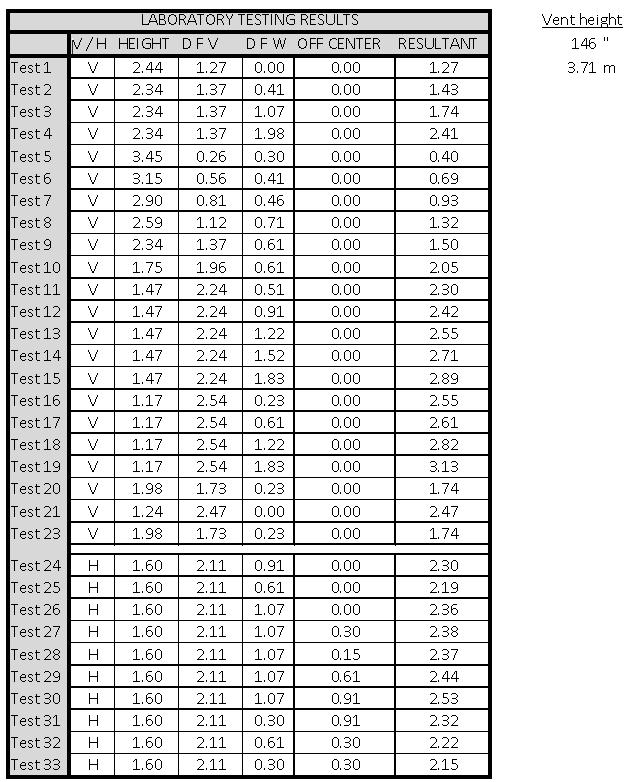
108 95
109 96
110 97
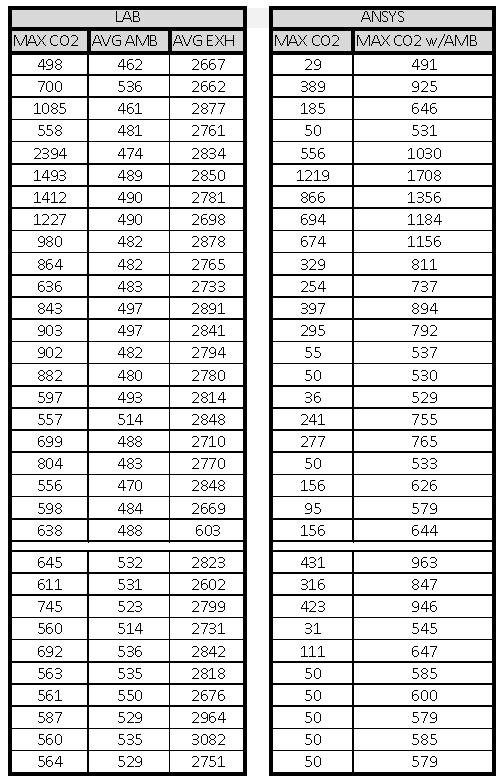
111 98
112 APPENDIX C COMPUTATIONAL FLUID DYNAMIC MODEL SETUP 99

113 GEOMETRIC MODELING/MESHING The entire model volume with the exception of the interior outlined condominium mockup is an air flow space that will be meshed and included in the programs calculations. To clarify, the photo shown below is a picture from the bottom side of the model showing the removal of the two storey mockup from the CFD model. Figure 55 - Geometry of the CFD model as designed in Ansys DesignModeler (bottom view). As stated previously, the rectangular prism was deleted from the total volume so that only the air flow around the condominium would be considered in the computer simulations. The faintly outlined square next to the interior opening is known by Ansys as a body of influence. This area along with volume space above it will have an increased mesh density for additional accuracy of the airflow in front of the intake and exhaust vents. This process helps increase the accuracy of the results in areas of interest. 100
114 Figure 56 - Clear isometric view of the 3D model showing the two storey mockup and the larger body of influence in front. The two rectangular prisms within the volume space represent the removed condominium volume space and the larger body of influence directly in front. The body of influence rectangular prism was extended along the z-axis via trial and error to reach approximately one meter past the furthest point of exhaust from the wall. This ensures that the results pertaining to the air flow from the exhaust lie within the volume of space with increased mesh density for optimal solutions. 101
 Max element size = 0.1m Body Sizing (entire model) Max element size = 0.")
115 Figure 57 - Meshing along a XY slice showing the interior mesh along the condominium s walls and vents. Mesh sizing restraints were placed on various sections of the model for increased accuracy. They are as follows: Mesh Sizing Restraints Body Sizing (body of influence) Max element size = 0.1m Body Sizing (entire model) Max element size = 0.3m Face Sizing (condominium wall face) Max element size = 0.1m Face Sizing (bottom inlet vent face) Max element size = 0.05m Face Sizing (top exhaust vent face) Max element size = 0.05m Table 10 - Mesh sizing restraints as entered into ICEM CFD. 102
116 MODEL SETUP AND BOUNDARY CONDITIONS The boundary conditions are listed in the table below. Model Boundary Conditions Model Face Side faces (parallel to the x-axis) Front and back faces (parallel to the along z-axis) Floor and ceiling (parallel to the y-axis) Boundary Condition Symmetry Opening Wall Table 11 Boundary conditions as entered in Ansys. FLUENT SOLVER PREFERENCES The transition ratio is a method by which the Ansys meshing program can control the rate of growth between the last inflation layer of any given face and the first layer of tetrahedral cells(ansys, 2010). Tetrahedral cells are used by Ansys to fill volume spaces where the program cannot use the ideal quadrilateral cells(ansys, 2010). Ansys starts with a quadrilateral mesh at the outside of the model and works its way to the center one layer at a time (inflation layers)(ansys, 2010). The Fluent transition ratio is approximately three times slower than that of the CFX transition ratio(ansys, 2010). This ensures accuracy by minimizing the possibility of elongated or skewed tetrahedral cells wherever possible(ansys, 2010). This means that as the program begins to mesh towards the center of the model, the size of each additional cell grows or shrinks at a decreased rate. The Fluent solver also utilizes volume based meshing as opposed to vertex based meshing(ansys, 2010). Given that our model is focused on air flow 103
.")
117 and not a mechanical system, we are more concerned with volume based solutions as opposed to vertex based ones. Figure 58 - Volume versus vertex based meshing(ansys, 2010). The collision avoidance feature in Ansys attemptes to minimize the number of skewed triangles that may occur during meshing(ansys, 2010). When all of the inflation layers meet in the center of the model, skewed tetrahedral cells typically become an unwanted result(ansys, 2010). Layer compression is typically best for avoiding these pyramids and is the default method used with the Fluent solver(ansys, 2010). 104
118 APPENDIX D ANSYS CALIBRATION TO LABORATORY TESTING 105
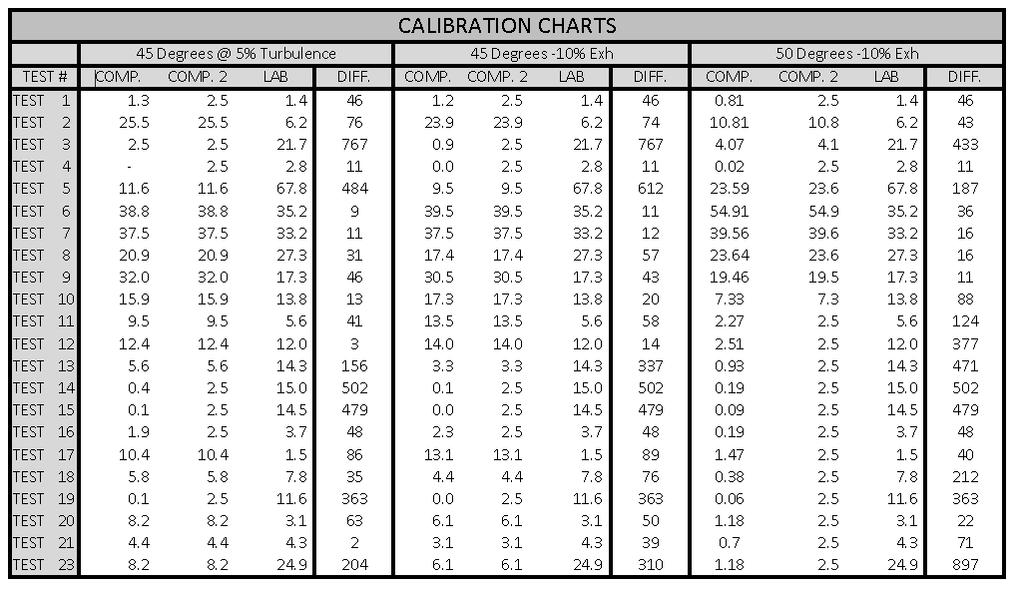
119 106
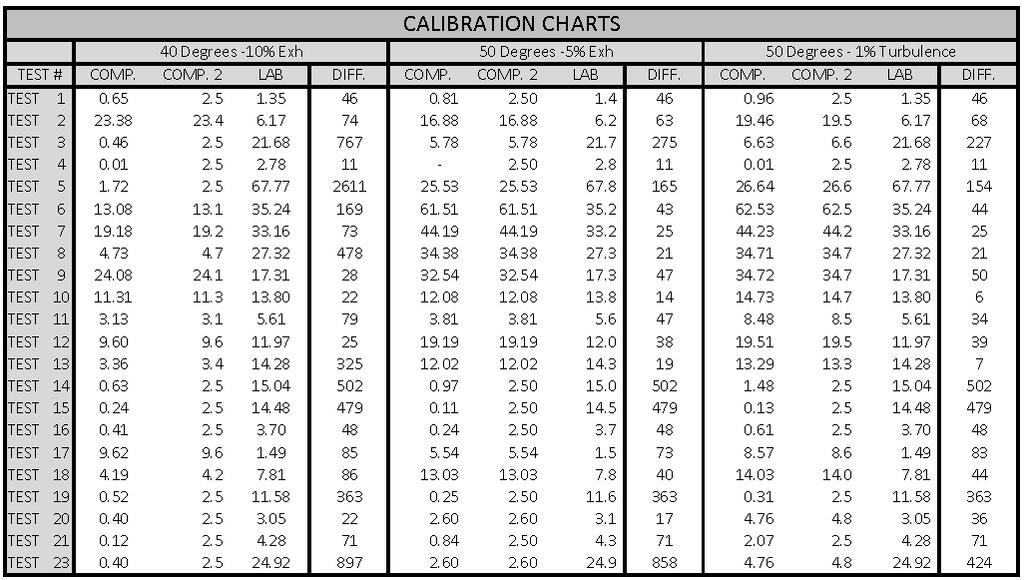
120 107
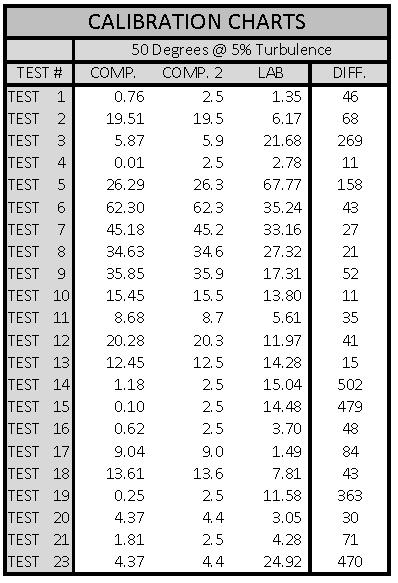
121 108
122 APPENDIX E ANSYS SOLVER ITERATION CALIBRATION 109
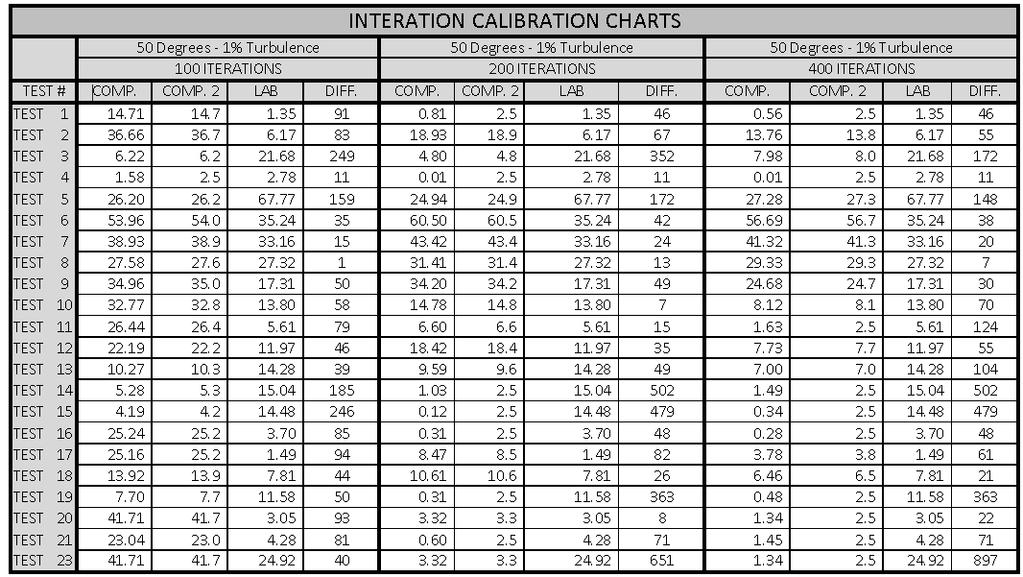
123 110
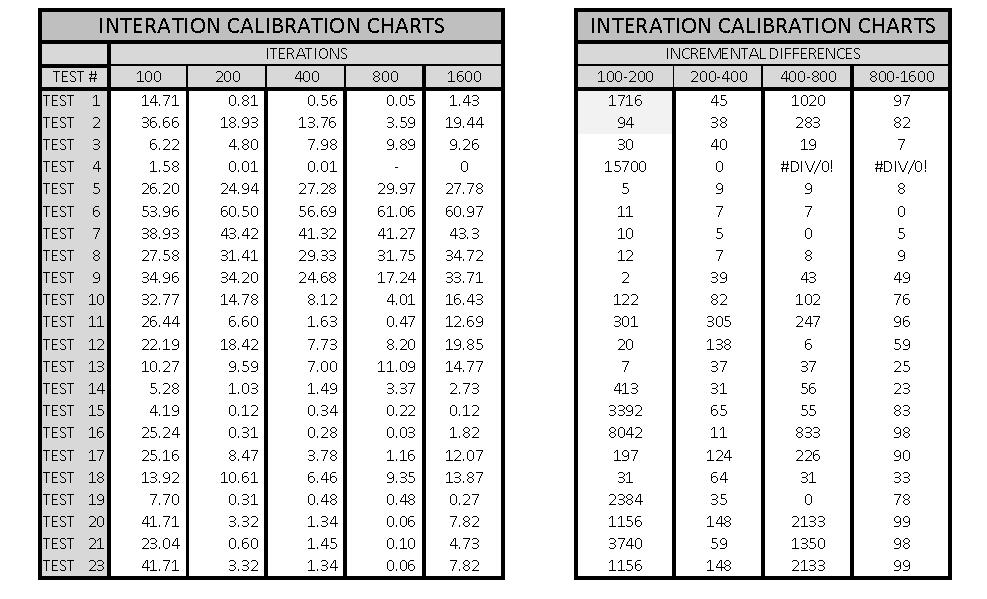
124 111
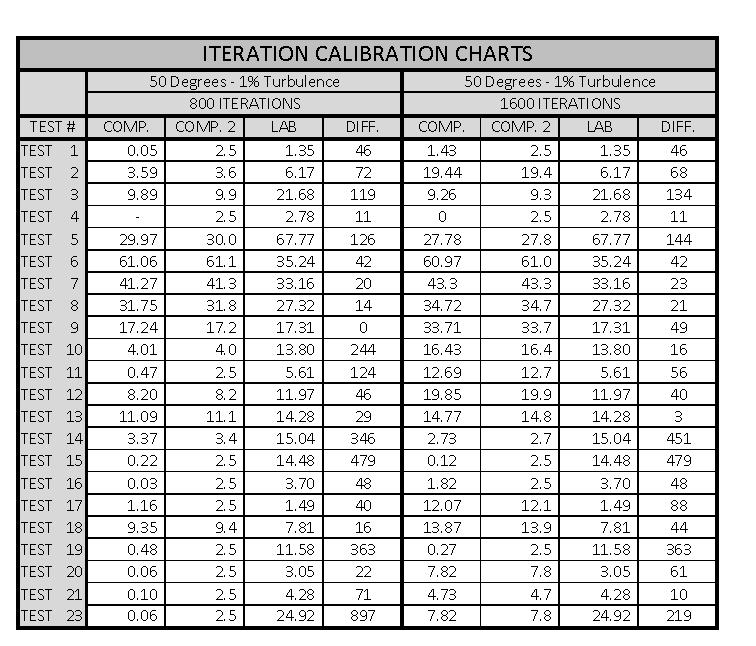
125 112
126 APPENDIX F ANSYS BASE MODEL RESULTS 113

127 XY FACE OF BUILDING BASE MODEL XY 0.5m FROM FACE OF BUILDING XY 1.0m FROM FACE OF BUILDING XY 1.5m FROM FACE OF BUILDING XY 2.0m FROM FACE OF BUILDING 3D VIEW OF EXHAUST PLANE AND CUTS 114
128 APPENDIX G ANSYS VENT ANGLE RESULTS SUMMARY 115
129 116
130 30 DEGREE NOMINAL VENT ANGLE MODEL XY FACE OF BUILDING XY 0.5m FROM FACE OF BUILDING XY 1.0m FROM FACE OF BUILDING XY 1.5m FROM FACE OF BUILDING XY 2.0m FROM FACE OF BUILDING 3D VIEW OF EXHAUST PLANE AND CUTS 117

131 45 DEGREE NOMINAL VENT ANGLE MODEL XY FACE OF BUILDING XY 0.5m FROM FACE OF BUILDING XY 1.0m FROM FACE OF BUILDING XY 1.5m FROM FACE OF BUILDING XY 2.0m FROM FACE OF BUILDING 3D VIEW OF EXHAUST PLANE AND CUTS 118
132 60 DEGREE NOMINAL VENT ANGLE MODEL XY FACE OF BUILDING XY 0.5m FROM FACE OF BUILDING XY 1.0m FROM FACE OF BUILDING XY 1.5m FROM FACE OF BUILDING XY 2.0m FROM FACE OF BUILDING 3D VIEW OF EXHAUST PLANE AND CUTS 119

133 90 DEGREE NOMINAL VENT ANGLE MODEL XY FACE OF BUILDING XY 0.5m FROM FACE OF BUILDING XY 1.0m FROM FACE OF BUILDING XY 1.5m FROM FACE OF BUILDING XY 2.0m FROM FACE OF BUILDING 3D VIEW OF EXHAUST PLANE AND CUTS 120
134 APPENDIX H ANSYS VENT SPEED RESULTS SUMMARY 121
135 122
136 INCREASED VENT SPEED MODEL XY FACE OF BUILDING XY 0.5m FROM FACE OF BUILDING XY 1.0m FROM FACE OF BUILDING XY 1.5m FROM FACE OF BUILDING XY 2.0m FROM FACE OF BUILDING 3D VIEW OF EXHAUST PLANE AND CUTS 123
137 DECREASED VENT SPEED MODEL XY FACE OF BUILDING XY 0.5m FROM FACE OF BUILDING XY 1.0m FROM FACE OF BUILDING XY 1.5m FROM FACE OF BUILDING XY 2.0m FROM FACE OF BUILDING 3D VIEW OF EXHAUST PLANE AND CUTS 124
138 APPENDIX I ANSYS WIND RESULTS SUMMARY 125
139 126

140 YZ 0.5m FROM EXHAUST PLANE HEAD WIND MODEL YZ 1.0m FROM EXHAUST PLANE XY FACE OF THE BUILDING XY 0.5m BEHIND FACE OF BUILDING XY 1.0m BEHIND FACE OF BUILDING 3D VIEW OF EXHAUST PLANE AND CUTS 127


141 YZ 0.5m FROM EXHAUST PLANE SIDE WIND MODEL YZ 1.0m FROM EXHAUST PLANE YZ 1.5m FROM EXHAUST PLANE YZ 2.0m FROM EXHAUST PLANE YZ 2.5m FROM EXHAUST PLANE 3D VIEW OF EXHAUST PLANE AND CUTS 128
142 YZ 0.5m FROM EXHAUST PLANE CROSS WIND 0.35m/s MODEL YZ 1.0m FROM EXHAUST PLANE YZ 1.5m FROM EXHAUST PLANE YZ 2.0m FROM EXHAUST PLANE YZ 2.5m FROM EXHAUST PLANE 3D VIEW OF EXHAUST PLANE AND CUTS 129

143 YZ 0.5m FROM EXHAUST PLANE CROSS WIND 0.25m/s MODEL YZ 1.0m FROM EXHAUST PLANE YZ 1.5m FROM EXHAUST PLANE YZ 2.0m FROM EXHAUST PLANE YZ 2.5m FROM EXHAUST PLANE 3D VIEW OF EXHAUST PLANE AND CUTS 130
A STUDY OF CROSS CONTAMINATION OF IN-SUITE VENTILATION SYSTEMS USED IN MULTI-UNIT RESIDENTIAL BUILDINGS
 A STUDY OF CROSS CONTAMINATION OF IN-SUITE VENTILATION SYSTEMS USED IN MULTI-UNIT RESIDENTIAL BUILDINGS C.A. Parker, K.D. Pressnail, M.F. Touchie, D. DeRose, and S. Dedesko ABSTRACT Complaints of cross
BUILDING CODE BULLETIN
 BUILDING CODE BULLETIN September 2010 06-BCB-007 Page 1 of 5 VENTILATION AIR FOR DWELLING UNITS IN MULTI-UNIT RESIDENTIAL BUILDINGS DISCUSSION This STANDATA has been developed to cover alternative methods
Indoor Air Quality and Mechanical Ventilation (Page 1 of 5)
") Indoor Air Quality and Mechanical Ventilation (Page 1 of 5) Title 24, Part 6, Section 150.0(o) Ventilation for Indoor Air Quality. All dwelling units shall meet the requirements of ANSI/ASHRAE Standard62.2.
Indoor Air Quality and Mechanical Ventilation (Page 1 of 5) Title 24, Part 6, Section 150.0(o) Ventilation for Indoor Air Quality. All dwelling units shall meet the requirements of ANSI/ASHRAE Standard62.2.
Corridor Pressurization System Performance in Multi-Unit Residential Buildings
 Corridor Pressurization System Performance in Multi-Unit Residential Buildings Lorne Ricketts Student Member ASHRAE John Straube, PhD, P.Eng. Associate Member ASHRAE ABSTRACT Corridor pressurization based
Mark Lawton, P.Eng., FEC. Airtightness in Buildings A Canadian History June 2017
 Mark Lawton, P.Eng., FEC Airtightness in Buildings A Canadian History June 2017 History of What? Understanding Measurement Implementation Air in Buildings Carries moisture to cold surfaces where condensation
airflow in to, out of, and within buildings. These airflows are resisted by the airtightness of building elements including the exterior enclosure and
 Airflow in to, out of, and within buildings is a fundamental factor of indoor air quality, comfort, durability, and energy consumption. Multi-unit residential buildings are uniquely complex in this respect
Changes to the Minnesota Commercial Energy Code. Presented by: Andy Thielen, PE
 Changes to the Minnesota Commercial Energy Code Presented by: Andy Thielen, PE Warning! The following is an outline of proposed code changes. There is no guarantee that the final code adopted by the State
Healthy Learning Environment
 Healthy Learning Environment Introduction: A major issue facing the construction industry today is creating a healthy learning environment for school buildings. Healthy learning environments are crucial
2012 Fiscal Impact International Mechanical Code
 2012 Section No. 306.5 Item 2 2012 Code Information - bold text = new text found in 2012 strike out = text deleted and not found in the 2012 Equipment and appliances on roofs or elevated structures: Item
2014 British Columbia Building Code Changes
 2014 British Columbia Building Code Changes A City of Prince George interpretation of the 2014 Building Code Changes for 9.32 & 9.36 The following changes reflect the most notable revisions and staff interpretations.
IN THIS ISSUE INTRODUCTION BACKGROUND. March 2018 High Humidity in Winter: Analysis for Multi-Family Passive House Projects
 Page 1 High Humidity in Winter: Analysis for Multi-Family Passive House Projects IN THIS ISSUE Passive House for multi-family residential applications Analysis of high humidity levels in winter Impact
Can you Believe Energy Savings Forecasts
 Can you Believe Energy Savings Forecasts By: Tony Woods Introduction Yes, says TonyWood. Especially when your project includes an upgrade to the building envelope. The relationship between high performance
According to our research and study most occupant complaints relating to IAQ are attributable to the following factors:
 Report pertaining to the Duct Cleaning of ICU! &ICU2 at Hospital 5 th & 6 th Floor. The IAQ Report documents by Photograph (at random) photo shots of the various ducting systems & AHU Systems for work
A FIELD STUDY OF AIRFLOW IN MID TO HIGH-RISE MULTI-UNIT RESIDENTIAL BUILDINGS
 A FIELD STUDY OF AIRFLOW IN MID TO HIGH-RISE MULTI-UNIT RESIDENTIAL BUILDINGS L. Ricketts and J. Straube ABSTRACT Airflow into, out of, and within buildings is a fundamental factor of building design and
County of Yolo Development Services Building Inspection Division
 County of Yolo Development Services Building Inspection Division 292 W. Beamer Street Woodland, CA. 95695 www.yolocounty.org (530) 666-8775 Mechanical Plan Review Comments Plan Review No. Owners Name Job
Advanced Ventilation for Residential applications FBC Res 2010.
 Advanced Ventilation for Residential applications FBC Res 2010. Course Description Review of the Residential Ventilation requirements in the Florida Building Code, Residential 2010. I. Introduction Dean
ENERGY CONSERVATION STRATEGIES FOR HVAC SYSTEMS
 ENERGY CONSERVATION STRATEGIES FOR HVAC SYSTEMS Heating ventilation and airconditioning systems consumes nearly 50 to 60% of the total power consumption in any building and thus, offers huge potential
YORK UNITIZED ENERGY RECOVERY VENTILATOR (ERV) Superior air-flow 300 6,200 CFM
 Superior air-flow 300 6,200 CFM") YORK UNITIZED ENERGY RECOVERY VENTILATOR (ERV) Superior air-flow 300 6,200 CFM YORK UNITIZED ENERGY RECOVERY VENTILATORS Regardless of building type or rating system, today s building must be as energy
YORK UNITIZED ENERGY RECOVERY VENTILATOR (ERV) Superior air-flow 300 6,200 CFM YORK UNITIZED ENERGY RECOVERY VENTILATORS Regardless of building type or rating system, today s building must be as energy
Attic Access Hatch to have an area not less than 0.32m²/3.4ft² and no dimension less than 500mm with a min R-15 insulation value Crawlspace
 NOTABLE CODE REQUIREMENTS the following list represents important code requirements that shall be implemented into construction while still maintaining full compliance with all other requirements within
A, B, C, D VENTILATION SYSTEMS: COMPARISON
 A, B, C, D VENTILATION SYSTEMS: COMPARISON ATIC-ULg Ventilation day 19/11/2015 Samuel Gendebien University of Liège Table of content Objectives of the presentation Introduction - Key figures Definitions
USE OF MULTI-ZONE AIR FLOW SIMULATIONS TO EVALUATE A HYBRID VENTILATION SYSTEM. Åke Blomsterberg 1, Tomas Johansson 1.
 Ninth International IBPSA Conference Montréal, Canada August 15-18, 25 USE OF MULTI-ZONE AIR FLOW SIMULATIONS TO EVALUATE A HYBRID VENTILATION SYSTEM Åke Blomsterberg 1, Tomas Johansson 1 1 WSP Environmental,
Energy Efficiency Requirements 9.36
 The following information has been obtained from the HPO Illustrated Guide, Energy Efficiency Requirements for Houses in British Columbia, BCBC 9.36 & 9.32, Building Officials Association of British Columbia
INNOVATIONS IN VENTILATION TECHNOLOGY 21ST ANNUAL INTERNATIONAL AIVC CONFERENCE THE HAGUE, NETHERLANDS, SEPTEMBER 2000
 INNOVATIONS IN VENTILATION TECHNOLOGY 21ST ANNUAL INTERNATIONAL AIVC CONFERENCE THE HAGUE, NETHERLANDS, 26-29 SEPTEMBER 2000 Impact of Ventilator Parameters on System Energy Consumption Dipak J. Shah Senior
Experimental comparison of performance between single and dual core energy recovery ventilation systems
 Experimental comparison of performance between single and dual core energy recovery ventilation systems Boualem Ouazia 1, Ganapathy Gnanamurugan 1, Chantal Arsenault 1, Heather Knudsen 1 1 National Research
Date Rater Verified. Rater Verified. Slab / Pre-Drywall / Thermal Inspection
 Slab on Grade & Basements: A capillary break is installed on top of all footings Slab / Pre-Drywall / Thermal Inspection A minimum of 4" of clean or washed gravel (0.5" diameter or greater) is placed over
A Field Study of Airflow in Mid to High-Rise Multi-Unit Residential Buildings
 A Field Study of Airflow in Mid to High-Rise Multi-Unit Residential Buildings Lorne Ricketts, MASc, EIT John Straube, PhD, P.Eng. ABSTRACT Airflow into, out of, and within buildings is a fundamental factor
2012 Ontario Building Code Requirements for New Construction. Bradford West Gwillimbury Building Division March 5, 2012
 2012 Ontario Building Code Requirements for New Construction Bradford West Gwillimbury Building Division March 5, 2012 1 Ontario Building Code changes Applicable to permits applied for after December 31,
Welcome to this continuing education seminar. This is the first of three parts of the Building Enclosure Fundamentals series.
 Welcome to this continuing education seminar. This is the first of three parts of the Building Enclosure Fundamentals series. 1 3 6 7 8 The primary reasons to build airtight buildings are to avoid drafts
About Active Energy Engineering
 About Active Energy Engineering With Active Energy Engineering (AEE) your Energy Audit or Indoor Air Quality (IAQ) testing will be conducted by one of our BPI licensed professionals that are also degreed
ENERGY EFFICIENT RETROFIT MEASURES GUIDE
 ENERGY EFFICIENT RETROFIT MEASURES GUIDE ENERGY EFFICIENCY RETROFIT PROGRAM FOR LOW-INCOME HOUSEHOLDS CO-OP COMPONENT For nonprofit continuing housing cooperatives listed in the Québec Enterprise Register
INTERIOR ENVIRONMENT
 CHAPTER 12 INTERIOR ENVIRONMENT > SECTION 1201 GENERAL 1201.1 Scope. The provisions of this chapter shall govern ventilation, temperature control, lighting, yards and courts, sound transmission, room dimensions,
ASHRAE 62.2: What s New in 2016
 ASHRAE 62.2: What s New in 2016 Rick Karg 2016 Residential Energy Dynamics, LLC What We Will Talk About Overview of mechanics of 62.2-2016. Logic behind the Standard. Sizing local ventilation (exhaust-only).
THERMAL ANALYSIS OF A FACADE-MOUNTED PV ARRAY
 SESCI 23 CONFERENCE Queen's University Kingston, Ontario, Canada August 18 to 2, 23 THERMAL ANALYSIS OF A FACADE-MOUNTED PV ARRAY S. J. Harrison 1, A. Driesse 2, Q. Lin 1 1 Queen's University, Solar Calorimetry
RENOVATION UPGRADE REPORT
 File Number: 79CGD00001 NRCan.gc.ca/myenerguide RENOVATION UPGRADE REPORT 214-620 View St Victoria, BC V8W 1J6 Potential rating Current rating 59 176 GJ/year GJ/year 65GJ/year Uses most energy E 0 GJ/year
PARAMETRIC ANALYSIS OF ENERGY RECOVERY VENTILATION PERFORMANCE IN THE HIGH RISE RESIDENTIAL SECTOR: A TORONTO CASE STUDY.
 PARAMETRIC ANALYSIS OF ENERGY RECOVERY VENTILATION PERFORMANCE IN THE HIGH RISE RESIDENTIAL SECTOR: A TORONTO CASE STUDY By Adam Barker Bachelor of Environmental Sciences University of Guelph, 2007 An
CASE STUDY. Improved Radon Needs More Air
 FOR MORE INFORMATION, VISIT: HTTP://BUILDEQUINOX.COM/BLACKBOX/ CASE STUDY Improved Radon Needs More The subject of this test is a well maintained home occupied by a family of four (two adults and two children).
ANALYSIS AND MITIGATION OF THERMAL EFFECTS ON A LARGE FACADE-MOUNTED PV ARRAY
 ANALYSIS AND MITIGATION OF THERMAL EFFECTS ON A LARGE FACADE-MOUNTED PV ARRAY A. Driesse 1, S. J. Harrison 2, Q. Lin 2 1 Queen's University, Integrated Learning Center, Kingston, ON, Canada; 2 Queen's
ACHIEVING HIGH-PERFORMANCE MULTI-UNIT RESIDENTIAL BUILDINGS: THE OPPORTUNITIES
 ACHIEVING HIGH-PERFORMANCE MULTI-UNIT RESIDENTIAL BUILDINGS: THE OPPORTUNITIES CHALLENGES OF MURB PERFORMANCE Energy intensity of multi-unit residential buildings (MURBs) has been marginally increasing
Supplementary Standard SB-12. Energy Efficiency For Housing
 OBC Excerpt: SB 12 Ministry of Municipal Affairs and Housing Building and Development Branch 2006 Building Code - Supplementary Standards Supplementary Standard SB-12 Energy Efficiency For Housing November
CASE STUDY. Two Dogs and Two Cats Insufficient Air Exchange with High CO2
 FOR MORE INFORMATION, VISIT: HTTP://BUILDEQUINOX.COM/BLACKBOX/ CASE STUDY Two Dogs and Two Cats Insufficient Exchange with High CO2 A Black Box IAQ was placed in the main living area of a pre-1900 home.
Effect of Rotation Speed of a Rotary Thermal Wheel on Ventilation Supply Rates of Wind Tower System
 Available online at www.sciencedirect.com ScienceDirect Energy Procedia 75 (2015 ) 1705 1710 The 7 th International Conference on Applied Energy ICAE2015 Effect of Rotation Speed of a Rotary Thermal Wheel
ANSI/ASHRAE STANDARD , METHODS OF TESTING CHILLED BEAMS
 ANSI/ASHRAE STANDARD 200-2015, METHODS OF TESTING CHILLED BEAMS NEMIC 2017 Agenda 1. Foreword 2. Purpose & Scope 3. Definitions 4. Instrumentation & Facilities 5. Test Methods 6. Reporting 7. Normative
INFORMATION GUIDE SECOND DWELLING UNITS BUILDING CODE BASICS
 INFORMATION GUIDE SECOND DWELLING UNITS BUILDING CODE BASICS November 2018 Contents 1. Introduction... 1 2. Ontario Building Code and Second Dwelling Units... 1 3. How Do I Make My Secondary Dwelling Unit
Proposed Addendum L to Standard , Ventilation for Acceptable Indoor Air Quality
 BSR/ASHRAE Addendum L to ANSI/ASHRAE Standard 62.1-2016 Public Review Draft Proposed Addendum L to Standard 62.1-2016, Ventilation for Acceptable Indoor Air Quality Second Public Review (August 2018) (Draft
Below is a brief description of heat/energy-recovery ventilators and other terms as relevant to ENERGY STAR.
 1 2 3 4 ENERGY STAR Qualifying Criteria for Residential Heat-Recovery Ventilators and Energy-Recovery Ventilators (H/ERVs) 5 6 7 8 9 10 11 12 13 14 15 16 17 18 19 20 21 22 23 24 25 26 27 28 29 30 31 32
National Weatherization Conference. Ventilation Best Practices & airflow verification FIELD RESEARCH. Joe Nagan, Home Building Technology Services
 National Weatherization Conference Ventilation Best Practices & airflow verification Presented by Joe Nagan, Home Building Technology Services Home Building Technology Services 1 Home Building Technology
Case Study Leaky Single Story High Radon
 Case Study Leaky Single Story High Radon How can a home be leaky with a lot of infiltrated air passing through have high radon? The answer lies in the nature of the building leakage. Infiltrated air, what
2001 National Workshop on State Building Energy Codes July th, 2001 Burlington, Vermont
 2001 National Workshop on State Building Energy Codes July 16-19 th, 2001 Burlington, Vermont A Systems Engineering Approach to the Design of Energy and Resource Efficient Homes Presented By: Mark LaLiberte
Passive House Northwest AIA CEU Provider
 Passive House Northwest AIA CEU Provider Multifamily Ventilation Strategies Workshop AIA Course # phnw Matt Groves, Albert Rooks March 11, 2016 Credit(s) earned on completion of this course will be reported
TOWN OF HAGUE GUIDELINES FOR PERMIT APPLICATION
 TOWN OF HAGUE GUIDELINES FOR PERMIT APPLICATION Town of Hague Building Inspector: Dale Wagner Home #: 306-225-2265 Cell #: 306-241-4741 Fill all part of the permit application including the date and signature.
SECTION AIR-TO-AIR ENERGY RECOVERY EQUIPMENT
 SECTION 23 72 00 AIR-TO-AIR ENERGY RECOVERY EQUIPMENT PART 1 - GENERAL 1.01 RELATED DOCUMENTS A. Drawings and general provisions of the Contract, including General and Supplementary Conditions and Division
General Requirements for Mobile Homes
 Mobile homes shall conform in all respects to the CAN/CSA-Z240 MH Series of Standards and shall be complete structurally with the entire plumbing, electrical, and heating services installed. Prior to moving
CFD and Wind Tunnel Study of the Performance of a Multi- Directional Wind Tower with Heat Transfer Devices
 Available online at www.sciencedirect.com ScienceDirect Energy Procedia 75 (2015 ) 1692 1697 The 7 th International Conference on Applied Energy ICAE2015 CFD and Wind Tunnel Study of the Performance of
2010 National Building Code Adoption and Associated Process Changes
 Building Inspection City of Moncton 655 Main Street Moncton, NB E1C 1E8 Phone: (506) 856-4375 Fax: (506) 856-4348 Bulletin No. 14 From: Randy Richard Date: February 9, 2015 Subject: 2010 National Building
KITCHEN REMODELS CITY OF MISSION VIEJO BUILDING SERVICES DIVISON 200 CIVIC CENTER, MISSION VIEJO, CA (949)
") CITY OF MISSION VIEJO BUILDING SERVICES DIVISON 200 CIVIC CENTER, MISSION VIEJO, CA 92691 (949) 470-3054 KITCHEN REMODELS A permit is required for kitchen remodels that include removal and replacement
CITY OF MISSION VIEJO BUILDING SERVICES DIVISON 200 CIVIC CENTER, MISSION VIEJO, CA 92691 (949) 470-3054 KITCHEN REMODELS A permit is required for kitchen remodels that include removal and replacement
Good indoor air quality (IAQ) management has become paramount in the construction industry as study
 management has become paramount in the construction industry as study") Creating and Maintaining Good Indoor Air Quality Good indoor air quality (IAQ) management has become paramount in the construction industry as study after study shows that employee productivity and health
Creating and Maintaining Good Indoor Air Quality Good indoor air quality (IAQ) management has become paramount in the construction industry as study after study shows that employee productivity and health
ENERGY RETROFITTING TORONTO MURBs: AIR-SOURCE HEAT PUMPS OPERATING IN ENCLOSED BALCONIES
 ENERGY RETROFITTING TORONTO MURBs: AIR-SOURCE HEAT PUMPS OPERATING IN ENCLOSED BALCONIES Presented by: Marianne Touchie, Toronto Atmospheric Fund and University of Toronto Contributing Authors: Kim Pressnail,
COMPRESSED AIR SYSTEM DESIGNS BEGIN WITH THE DEMANDS
 COMPRESSED AIR SYSTEM DESIGNS BEGIN WITH THE DEMANDS BY: BILL SCALES, P.E. SCALES INDUSTRIAL TECHNOLOGIES, INC. The purpose of an assessment of an existing compressed air system, or design of a new one,
Revisions to the Residential Standards and ACM Calculations. June 13, 2007 Bruce Wilcox, P.E.
 Revisions to the Residential Standards and ACM Calculations June 13, 2007 Bruce Wilcox, P.E. Topics Refrigerant Charge Fan Watt Draw and Airflow Indoor Air Quality Ventilation New Solar Homes Partnership
ASHRAE 62.2: What s New in 2016
 ASHRAE 62.2: What s New in 2016 Rick Karg 2018 Residential Energy Dynamics, LLC What We Will Talk About Overview of mechanics of 62.2-2016. Logic behind the Standard. Sizing local ventilation (exhaust-only).
ENERGY STAR Qualified Homes National Program Requirements, Version 3.0
 Qualifying Homes The following homes are eligible to earn the ENERGY STAR: Single-family homes; Units in multi-family buildings that are three stories or less; Units in multi-family buildings that are
2009 IECC Chapter 1 Additions, alterations, renovations or repairs.
 2009 IECC Chapter 1 Additions, alterations, renovations or repairs. Additions, alterations, renovations or repairs to an existing building, building system or portion thereof shall conform to the provisions
EFFECTS OF WEATHERS AND INDOOR TEMPERATURES ON PERFORMANCE OF ENERGY RECOVERY VENTILATOR. Yanping Zhou, Jingyi Wu, Ruzhu Wang
 EFFECTS OF WEATHERS AND INDOOR TEMPERATURES ON PERFORMANCE OF ENERGY RECOVERY VENTILATOR Yanping Zhou, Jingyi Wu, Ruzhu Wang (Institute of Refrigeration and Cryogenics, Shanghai Jiaotong University, Shanghai,
INFORMATIONAL HANDOUT FOR FINISHING A BASEMENT
 7100 147 th Street West Telephone (952) 953-2588 Apple Valley, MN 55124-9016 Fax (952) 953-2515 www.cityofapplevalley.org INFORMATIONAL HANDOUT FOR FINISHING A BASEMENT 1. Submit plan showing the proposed
Indoor Air Quality Report
 Indoor Air Quality Report Test Number: Normal Occupancy Name: Equinox Email address: test@buildequinox.com Test Location: Urbana, IL Report Date: 12/20/2012 Overview: This Black Box IAQ report provides
This is an electronic reprint of the original article. This reprint may differ from the original in pagination and typographic detail.
 Powered by TCPDF (www.tcpdf.org) This is an electronic reprint of the original article. This reprint may differ from the original in pagination and typographic detail. Kosonen, Risto; Jokisalo, Juha; Ranta-aho,
CHAPTER 3. BUILDING THERMAL LOAD ESTIMATION
 CHAPTER 3. BUILDING THERMAL LOAD ESTIMATION 3.1 Purpose of Thermal Load Estimation 3.2 Heating Load versus Cooling Load 3.3 Critical Conditions for Design 3.4 Manual versus Computer Calculations 3.5 Heating
CONSTRUCTION REQUIREMENTS
 CONSTRUCTION REQUIREMENTS Note: The buildings on the UCCS campus are divided into two categories: General Fund and Auxiliaries. General Fund Buildings include academic and administrative functions. Auxiliary
Energy-Efficient Passive House using thermal mass to achieve high thermal comfort
 Energy-Efficient Passive House using thermal mass to achieve high thermal comfort Loa Andersson Managing Director RLI Byggdata AB rli@termodeck.com Alexander Engström Technical Director RLI Byggdata AB
Dynamic simulation of buildings: Problems and solutions Università degli Studi di Trento
 Dynamic simulation of buildings: Problems and solutions Università degli Studi di Trento Paolo BAGGIO The basic problem To design (and operate) energy efficient buildings, accurate modeling tools are needed.
APPLICATIONS Air-to-Air Energy Recovery
 APPLICATIONS Air-to-Air Energy Recovery Technical Development Program Technical Development Programs (TDP) are modules of technical training on HVAC theory, system design, equipment selection and application
Form 9: Infection Control Preventive Measures Level 4
 Form 9: Infection Control This form is filled out by the construction planning team or designated person(s) to identify the required preventive measures for the activity described in Form 1 Infection Control
GENERAL MECHANICAL SYSTEM REQUIREMENTS
 CHAPTER 13 GENERAL MECHANICAL SYSTEM REQUIREMENTS SECTION M1301 GENERAL M1301.1 Scope. The provisionsof thischapter shall governthe installation of mechanical systems not specifically covered in other
COMPARISON OF ENERGY USE INDICATORS OF A NON-RESIDENTIAL PASSIVE HOUSE WITH ASHRAE 90.1 BUDGET BUILDING
 COMPARISON OF ENERGY USE INDICATORS OF A NON-RESIDENTIAL PASSIVE HOUSE WITH ASHRAE 90.1 BUDGET BUILDING ABSTRACT F. Bagheri 1, M. Fakoor 1, B. Young 1, C. Cranswick 1 1 BC Building Science Ltd. 611 Bent
A Paradigm Shift in ERV Technology. Paul Ehrlich, PE President Building Intelligence Group PLLC
 A Paradigm Shift in ERV Technology Paul Ehrlich, PE President Building Intelligence Group PLLC August 9, 2013 Existing Buildings and Energy Existing buildings: Floor space: Floor space per building: Energy
Village of Glen Ellyn Basement Remodeling Project Guidelines
 Village of Glen Ellyn Basement Remodeling Project Guidelines Existing unfinished basement space is often remodeled to create more habitable (living, sleeping, eating, dining) space in a home. Building
Airflow in Mid to High-rise Multi-Unit Residential Buildings
 Airflow in Mid to High-rise Multi-Unit Residential Buildings LORNE RICKETTS, MASC RDH BUILDING ENGINEERING LTD. VANCOUVER, BC CO-AUTHORS: GRAHAM FINCH, MASC, P.ENG. RDH BUILDING ENGINEERING LTD. DR. JOHN
ASHRAE and Indoor Air Quality
 ASHRAE 62.2-2013 and Indoor Air Quality Weatherize Ohio Conference October 27 29, 2015 The State of Ohio is an Equal Opportunity Employer and Provider of ADA Services Introduction ASHRAE: Why is it needed?
Section Old G4 February 2014 Amendments to G4
 Dear Customer Please find enclosed Amendment 3, effective 14 February 2014, to the Acceptable Solution and Verification Method for Clause G4 Ventilation of the New Zealand Building Code. The previous amendment
Mechanical Depth. Redesign and Analysis
 Depth Redesign and Analysis 14 Analysis Scope The scope of my mechanical redesign will include the 2 nd and 3 rd floors of the SW hospital wing which includes Semi-Private, Private and Isolations rooms.
A Solar Wall System Utilized in Rural Houses of Northeast China
 A Solar Wall System Utilized in Rural Houses of Northeast China Tiantian Zhang and Yufei Tan in rural buildings, for instance, only 16.4% of the investigated houses employ solar energy to produce hot water
Georgetown University New Science Center
 Georgetown University New Science Center Final Thesis Proposal PENN STATE UNIVERSITY Prepared For: Dr. William P. Bahnfleth Department of Architectural Engineering Prepared By: Kevin M Edstrom Mechanical
Administrative Changes
 Revised 11/29/06 Knox County Residential Building Codes Significant Changes From The 1995 CABO One And Two Family Dwelling Code To The 2006 International Residential Code All one and two family dwellings
City of Omaha Plans and Permits Commercial Alterations and Conversions Building Permit Submittal Checklist
 City of Omaha Plans and Permits Commercial Alterations and Conversions Building Permit Submittal Checklist This checklist contains the standard information required on submittals for commercial construction
Healthier Home Environments Benefit Everyone
 Healthier Home Environments Benefit Everyone ALA Health House Mission To improve the way homes are built, renovated and maintained in America to be: Healthier More energy efficient More resource efficient
Mario D. Gonçalves, Patenaude-Trempe 1 Pierre Gendron, Patenaude-Trempe 2 Tony Colantonio, PWGSC 3. Abstract
 Commissioning of Exterior Building Envelopes of Large Buildings for Air Leakage and Resultant Moisture Accumulation using Infrared Thermography and Other Diagnostic Tools Mario D. Gonçalves, Patenaude-Trempe
Spending Through the Roof: Tall Building Energy Wasted Through Passive Vents. Building Energy 2017 A presentation by: Jamie Kleinberg & Robin Neri
 Spending Through the Roof: Tall Building Energy Wasted Through Passive Vents Building Energy 2017 A presentation by: Jamie Kleinberg & Robin Neri Project Objective: Develop and test methods for estimating
GENERAL MECHANICAL SYSTEM REQUIREMENTS
 CHAPTER 13 GENERAL MECHANICAL SYSTEM REQUIREMENTS SECTION M1301 GENERAL M1301.1 Scope. The provisions of this chapter shall govern the installation of mechanical systems not specifically covered in other
Chapter 2: Foundation
 Chapter 2: Foundation Crawlspace [V502.1.2] [V502.1.2] [V502.1.3] Vents. Vents in the crawlspace help keep floor insulation and floor framing dry. Crawlspace vents also reduce the potential for radon buildup
Senior Design Project for UNO. Design of the International Studies Building: An Environmental Analysis
 Senior Design Project for UNO Design of the International Studies Building: An Environmental Analysis Design Intent Implement Passive & Active design strategies in order to make the building: More Energy
Energy Efficiency: Designing Wood-Frame Buildings for Occupant Comfort
 Please add relevant logo here Energy Efficiency: Designing Wood-Frame Buildings for Occupant Comfort Presented by: Peter J. Arsenault, FAIA, NCARB, LEED-AP Disclaimer: This presentation was developed by
INDOOR AIR QUALITY AND ENERGY EFFICIENCY IN THE DESIGN OF BUILDING SERVICES SYSTEMS FOR SCHOOL CLASSROOMS
 INDOOR AIR QUALITY AND ENERGY EFFICIENCY IN THE DESIGN OF BUILDING SERVICES SYSTEMS FOR SCHOOL CLASSROOMS KL Tam * Architectural Services Department, the Government of Hong Kong Special Administrative
Variable Air Volume (VAV) For Laboratories
 For Laboratories") Variable Air Volume (VAV) For Laboratories by Steven G. Liescheidt, PE, CCS, CCPR Overview: Variable Air Volume (VAV) systems have been used for many years in commercial HVAC systems for a variety of reasons.
Variable Air Volume (VAV) For Laboratories by Steven G. Liescheidt, PE, CCS, CCPR Overview: Variable Air Volume (VAV) systems have been used for many years in commercial HVAC systems for a variety of reasons.
For all those with the ability to influence the design, layout or indoor air quality of buildings
 Natural Selection For all those with the ability to influence the design, layout or indoor air quality of buildings By the end of this presentation you will:- Understand what Natural Ventilation is. Know
IAQ & Energy Impact of Exhaust Air Transfer Ratio
 This article was published in ASHRAE Journal, November 207. Copyright 207 ASHRAE. Posted at www.ashrae.org. This article may not be copied and/or distributed electronically or in paper form without permission
COMMERCIAL TENANT IMPROVEMENT PERMIT APPLICATION
 COMMERCIAL TENANT IMPROVEMENT PERMIT APPLICATION OFFICIAL USE ONLY Date: Permit #: Received by: For Staff Use Only: OFD ELEC Planning SITE LOCATION Site Address: Tax Parcel Number: TYPE OF WORK Building
CHAPTER 1: OVERVIEW OF ENERGY EFFICIENT CONSTRUCTION
 Chapter 1: Overview of Energy Efficient Construction 1 CHAPTER 1: OVERVIEW OF ENERGY EFFICIENT CONSTRUCTION Chapter 1 is a quick reference guide that discusses the key components and features of energy
2018 International Energy Conservation Code Updates
 Providing effective energy strategies for buildings and communities 2018 International Energy Conservation Code Updates 10.25.2018 Who we are We assist buildings and communities in achieving energy efficiency,
Using Air Flow Modelling Software to Predict Airtightness Improvements in a High-Rise Residential Building: A Case Study
 Using Air Flow Modelling Software to Predict Airtightness Improvements in a High-Rise Residential Building: A Case Study By David Stanton, M.A.Sc., RDH Building Science Inc. & Kim Pressnail, Ph.D., LL.B.,