Spokane Area Workforce Roadmaps
|
|
|
- Ethel Sherman
- 6 years ago
- Views:
Transcription


1 Spokane Area Workforce Roadmaps February 2016 Prepared for: Spokane Area Workforce Development Council 2000 N. Greene St., MS 2158 Spokane, WA West Avenue, Suite 303 Saratoga Springs, NY

2 About Camoin Associates Camoin Associates has provided economic development consulting services to municipalities, economic development agencies, and private enterprises since We specialize in real estate market analysis to evaluate the feasibility and impacts of proposed projects. Through the services offered, Camoin Associates has had the opportunity to serve EDOs and local and state governments from Maine to California; corporations and organizations that include Lowes Home Improvement, FedEx, Volvo (Nova Bus) and the New York Islanders; as well as private developers proposing projects in excess of $600 million. Our reputation for detailed, place-specific, and accurate analysis has led to projects in 26 states and garnered attention from national media outlets including Marketplace (NPR), Forbes magazine, and The Wall Street Journal. Additionally, our marketing strategies have helped our clients gain both national and local media coverage for their projects in order to build public support and leverage additional funding. The firm currently has offices in Saratoga Springs, NY; Portland, ME; and Brattleboro, VT. To learn more about our experience and projects in all of our service lines, please visit our website at You can also find us on and on Facebook. The Project Team Robert J. Camoin President & CEO, Project Principal Ian Flatt Economic & Workforce Development Analyst, Project Manager
3 Table of Contents Spokane Area Workforce Roadmaps... 1 About Camoin Associates... 1 The Project Team... 1 Table of Contents... 2 Industry Roadmap Introduction... 5 Target Industry Overview... 5 Historic Changes in Employment, Compared to Idaho and Washington States and the Nation... 7 Changes in Employment (Historic and Projected) Targeted Industries Comparison... 8 Past and Projected Employment, by County... 9 Finance & Insurance Industry Workforce Roadmap Finance & Insurance: Past and Projected Changes in Employment Industry Overview Historic Change in Employment (2005 to 2015) Projected Change in Employment (2015 to 2021) Competitiveness Analysis Employment by County Employment by Age of Worker Economic Impact Finance & Insurance Occupations Insurance Sales Agents Tellers Insurance Claims and Policy Processing Clerks Customer Service Representatives Personal Financial Advisors Finance & Insurance Occupation Overview Projected Annual Openings Labor Supply and Demand Analysis Manufacturing Industry Workforce Roadmap Manufacturing: Past and Projected Changes in Employment Industry Overview Historic Change in Employment (2005 to 2015) Projected Change in Employment (2015 to 2021) Competitiveness Analysis
4 Employment by County Employment by Age of Worker Economic Impact Manufacturing Occupations Key Findings First Line Supervisors of Production and Operating Workers Machinists Inspectors, Testers, Sorters, Samplers, and Weighers Industrial Machinery Mechanics Computer-Controlled Machine Tool Operators, Metal and Plastic Manufacturing Occupation Overview Projected Annual Openings Labor Supply and Demand Analysis Professional, Scientific, and Technical Services Industry Workforce Roadmap Past and Projected Changes in Employment...71 Industry Overview Historic Change in Employment (2005 to 2015) Projected Change in Employment (2015 to 2021) Competitiveness Analysis Employment by County Employment by Age of Worker Economic Impact Professional, Scientific, & Technical Services Occupations Management Analysts Accountants and Auditors Software Developers, Applications Sales Representatives, Services, All Other Computer User Support Specialists Professional, Scientific, & Technical Services Occupation Overview Projected Annual Openings Labor Supply and Demand Analysis Transportation & Warehousing Industry Workforce Roadmap Past and Projected Changes in Employment Industry Overview Historic Change in Employment (2005 to 2015)
5 Projected Change in Employment (2015 to 2021) Competitiveness Analysis Employment by County Employment by Age of Worker Economic Impact Transportation & Warehousing Occupations Heavy and Tractor-Trailer Truck Drivers Labor and Freight, Stock, and Material Movers, Hand Light Truck or Delivery Services Drivers Aircraft Mechanics and Service Technicians Transportation & Warehousing Occupation Overview Projected Annual Openings Labor Supply and Demand Analysis Manufacturing Targeted Sector Analysis Aerospace Product and Parts Manufacturing Pharmaceutical and Medicine Manufacturing Semiconductor and Other Electrical Component Manufacturing Electrical Equipment Manufacturing Finance & Insurance Targeted Sector Analysis Depository Credit Intermediation Agencies, Brokerages, and Other Insurance Related Activities Professional, Scientific, & Technical Services Targeted Sector Analysis Accounting, Tax Preparation, Bookkeeping, and Payroll Services Computer Systems Design and Related Services Management, Scientific, and Technical Consulting Services Transportation & Warehousing Targeted Sector Analysis Rail Transportation General Freight Trucking Support Activities for Air Transportation Warehousing & Storage

6 Industry Roadmap Introduction The four industries examined in this analysis are Manufacturing, Transportation & Warehousing, Finance & Insurance, and Professional, Scientific and Technical Services. These industry groups are among the largest employers in the Spokane Area and have demonstrated strong historic growth. A summary of trends in each industry is provided in the following sections while each industry is examined in more detail in its respective industry The Spokane Area roadmap. For the purposes of this analysis, the Spokane Area is defined as Ferry, Lincoln, Pend Oreille, Spokane, Stevens, and Whitman Counties in Washington State and Kootenai County in Idaho State. This region generally represents the labor shed from which employers in the Spokane Area attract workers. In addition to examining regional trends, changes in employment in each of these counties are also assessed to better understand regional variations in employment in the targeted industries. Throughout this report, employment trends in the Spokane Area are compared to other geographies, specifically Washington and Idaho States (combined) and the United States. These comparisons help provide a context to better understand the employment trends occurring in the Spokane Area. Target Industry Overview Source: EMSI The following table summarizes key statistics for the Manufacturing, Finance & Insurance, Transportation & Warehousing, and Professional, Scientific, and Technical Services industries. Key findings about each industry are provided below. Each industry group is examined in more detailed in subsequent sections of this report. Targeted Industry Overview, 2 Digit NAICS - Spokane Area NAICS Average # % 2015 % of 2015 Location Earnings Per Change in Change in Quotient Worker Manufacturing 25, % $63, % Transportation & Warehousing 8, % $55, % 52 Finance & Insurance 13, % $73, % 54 Prof., Scientific, and Technical Services 15, % $57, , % Total (All Industries) 350,097 $48,170 n/a 22, % Manufacturing The Manufacturing industry accounts for 25,700 jobs, representing 7% of the region s employment. Of the targeted industries, the Manufacturing industry is the largest employer. Since 2005, the industry has grown slightly even as the Manufacturing industry contracted nationally. At $63,000, average earnings per worker in the Manufacturing industry are over 30% higher than earnings per worker in the region overall. 5
7 The Manufacturing industry has a location quotient of 0.92, meaning it is slightly less concentrated in the Spokane Area than in the US overall. Transportation & Warehousing Of the four targeted industries, the Transportation & Warehousing industry is the smallest in terms of employment. As of 2015, the industry accounted for 8,470 jobs, which represents over 2% of jobs in the Spokane Area. The industry has grown significantly since 2005, adding over 600 jobs, an increase of 8%. Average earnings per worker for the Transportation & Warehousing industry are $55,800, 16% higher than the average earnings in the Spokane Area. With a location quotient of 0.74, employment in the Transportation & Warehousing industry is over 25% less concentrated in the Spokane Area than in the nation. Finance & Insurance The Finance & Insurance industry accounts for 13,400 of jobs, representing nearly 4% of employment in the Spokane Area. Employment in this industry has contracted slightly since 2005, shedding nearly 70 jobs. However, employment in the Spokane Area declined at a lower rate than the nation, where the industry contracted by 2%, and Washington and Idaho States, where industry employment contracted by nearly 7%. Average earnings per worker in the Finance & Insurance industry are $73,000, 52% higher than the regional average. These earnings are also significantly higher than average earnings in the other targeted industries. Employment in this industry is nearly as concentrated in the Spokane Area as it is the nation. Professional, Scientific, and Technical Services With nearly 16,000 jobs, employment in the Professional, Scientific, and Technical Services industry is the second highest of the targeted industries and represents 4.6% of employment in the Spokane Area. Employment in the industry has grown significantly since 2005, increasing by nearly 25% even through the recession. This growth mirrors employment growth in Washington and Idaho States and outpaces growth in the US. At $57,800, the average earnings per worker are 20% higher than the average for the region. The industry is nearly 30% less concentrated in the Spokane Area than in the US overall. 6
8 Historic Changes in Employment, Compared to Idaho and Washington States and the Nation The table below summarizes past changes in employment in each of the targeted industries and compares these changes to historic trends in Washington and Idaho States and the nation. Key findings from this analysis are below. Since 2005, the Spokane Area economy has added over 22,000 jobs, an increase of nearly 7%. This outpaces employment growth at the national level, which increased by 5% over the same period. However, it lags the combined employment growth of the states of Idaho and Washington, which grew by over 11%. While employment in the Manufacturing industry contracted by over 13% nationally between 2005 and 2015, employment in this industry grew slightly in the Spokane Area. However, this growth lags behind the nearly 6% increase in Manufacturing employment experienced in Washington and Idaho States. Employment growth in the Transportation & Warehousing industry mirrors the growth experienced by the industry at the national level. However, growth in this industry lags behind the 10% combined growth experienced in Washington and Idaho States. In the Spokane Area, employment in the Finance & Insurance industry decreased slightly, shedding nearly 70 jobs between 2005 and However, the industry contracted at a much lower rate in the Spokane Area than Washington and Idaho States and the nation, where employment contracted by 6.8% and 2.4%, respectively. Nationally, employment in the Professional, Scientific, and Technical (PST) Services industry grew substantially between 2005 and 2015, expanding by 19%. In the Spokane Area and Washington and Idaho States, growth in this industry exceeded the national average, with employment in the PST Services industry in these geographies growing by nearly 25% and 26%, respectively. Targeted Industry Employment Changes, 2 Digit NAICS - State/Nation Comparison NAICS Spokane Area % Change WA/ID States % Change USA % Change Manufacturing 1.0% 5.9% -13.4% Transportation & Warehousing 8.1% 10.4% 8.1% 52 Finance & Insurance -0.5% -6.8% -2.4% 54 Prof., Scientific, and Technical Services 24.8% 25.9% 19.0% Total (All Industries) 6.7% 11.2% 5.0% 7
9 Changes in Employment (Historic and Projected) Targeted Industries Comparison The chart below presents past and projected changes in employment in the Spokane Area s overall economy as well as trends in each of the targeted industries. Key findings from this analysis are below. Due to the recent recession, employment in the Spokane area declined from its 2008 peak of 346,500 jobs to 326,260 jobs in 2011, a contraction of nearly 6%. Since this decline, employment in the region has recovered and exceeded pre-recession employment in Employment in the region is expected to continue to grow over the coming years, increasing by 11% by Of the targeted industries, Manufacturing suffered the most during the recent recession, shedding over 5,000 jobs between its pre-recession peak in 2007 and Since 2010, the industry has recovered some of these losses, although employment has still not reached the pre-recession high. The industry is projected to demonstrate strong growth over the coming decade. The Transportation & Warehousing Industry increased by over 8%, adding 630 jobs between 2005 and With nearly 8,500 jobs in 2015, the industry exceeds its pre-recession employment peak. The industry is projected to increase employment by another 13.5% over the next 10 years. Between 2005 and 2015, the Finance & Insurance industry contracted slightly, shedding nearly 70 jobs, representing a 0.5% employment decrease. As of 2015, employment in the industry had not recovered to its pre-recession peak of 13,900 jobs. Over the next 10 years, employment in the industry is expected grow by 6%. Of the targeted industries, the Professional, Scientific, and Technical Services industry grew at the fastest rate, increasing employment by nearly 25%, or 3,100 jobs. This dramatically outpaces growth of the Spokane Area s economy overall. The industry is projected to grow by another 17% by
10 Past and Projected Employment, by County The chart below presents past and projected changes in employment in each of the Spokane Area s seven counties. Key findings from this analysis is below. Overall, employment growth has favored counties in the Spokane Area with a larger economic base. By 2015, employment in Spokane and Kootenai Counties had recovered to their respective pre-recession peaks. Kootenai County s employment in 2015 actually exceeded its 2007 employment peak of 63,500 jobs. In absolute terms, Spokane County added the most jobs between 2005 and 2015, increasing employment by 14,000 jobs, or 6%. The County is projected to add another 25,800 jobs by Employment in Whitman County grew at the highest rate between 2005 and 2015, increasing employment by 14%. This county s employment did not contract with the recession and has grown significantly since Conversely, employment in the counties with a smaller economic base, specifically Stevens, Pend Oreille, and Lincoln Counties, has not recovered to pre-recession levels. In Ferry County, employment had just recovered to pre-recession levels by For many of these smaller counties, employment declined for a longer period than the larger counties. In Stevens, Pend Oreille, and Lincoln Counties, the lowest employment numbers were recorded in By 2013, other counties in the region had started recovering from the recession. 9
11 Finance & Insurance Industry Workforce Roadmap 10
12 Finance & Insurance: Past and Projected Changes in Employment In the chart below, past and projected changes in the Finance & Insurance industry were analyzed and compared to the Washington and Idaho States and the nation. Changes in the Finance & Insurance industry were also compared to employment trends in the Spokane Area economy overall. Key Findings: In the Spokane Area, pre-recession employment in the Finance & Insurance peaked in 2006 with nearly 14,000 jobs. The peak in the Finance & Insurance industry pre-dates the peak in overall Spokane Area employment by approximately 2 years. Employment in the region s Finance & Insurance industry is expected to recover to its pre-recession peak by While pre-recession employment in all geographies peaked in 2006, employment declined for a longer period in the Spokane Area than in Washington and Idaho States and the US. In the Spokane Area, employment continued to decline through 2012 and began recovering jobs in US Finance & Insurance employment began recovering in 2011 and employment in Washington and Idaho States began recovering in During the recession, Finance & Insurance employment contracted less severely in the Spokane Area than in Washington and Idaho States and the US. Regional employment contracted by 6% while state and US employment contracted by 12% and 8%, respectively. Employment in the Finance & Insurance industry declined more steeply and for a longer period in the recent recession than employment in the Spokane Area overall. Overall employment has also recovered at a faster pace over recent years and is projected to grow at a higher rate in the future. 11
13 Industry Overview Key findings about the sectors that compose the Finance & Insurance industry are below. A detailed table presenting key data about the Finance & Insurance industry in the Spokane Area is on the following page. In 2015, employment in the Finance & Insurance industry reached 13,440 jobs. This accounted for nearly 4% of all employment in the Spokane Area. The Depository Credit Intermediation sector accounts for over a third of employment in the Finance & Insurance industry in the Spokane Area. This sector primarily represents traditional banking operations that receive deposits and loan money to individuals and businesses. The Finance & Insurance sectors with the highest 2015 employment were Depository Credit Intermediation; Agencies, Brokerages, and Other Insurance Related Activities; Insurance Carriers; Nondepository Credit Intermediation; and Securities and Commodity Contracts Intermediation and Brokerage. Employment in these top sectors ranged from 631 to 5,074 jobs. Earnings per Worker Average earnings per worker in the Finance & Insurance industry is $73,200, over 30% higher than the overall average in the Spokane Area. Average earnings per Finance & Insurance industry worker are over 30% lower in the Spokane Area than in the nation overall and 17% lower than earnings in Washington and Idaho States. At $185,468, the Securities and Commodity Contracts Intermediation and Brokerage sector has the highest average earnings per employee. These earnings are over double the average earnings per worker in the Insurance Carriers sector, which has the second highest average earnings. At the other end of the spectrum are the earnings for banking-related sectors and other insurance-related activities. While these earnings are low for the Finance & Insurance industry, they are still much higher than the average earnings per workers for the Spokane Area economy overall. Location Quotient (LQ) With a location quotient of 0.96, regional employment in the industry is slightly less concentrated than employment in the US overall. In Washington and Idaho States, employment in the Finance & Insurance industry is 28% less concentrated than employment in the nation. The employment in the Depository Credit Intermediation sector is over 30% more concentrated in the Spokane Area than the US overall, represented by a location quotient of This is the highest Finance & Insurance location quotient in the Spokane Area. The employment in the Insurance Carriers and Agencies, Brokerages, and Other Insurance Related Activities sectors are also slightly more concentrated than employment in the US. Gross Regional Product (GRP) Overall, the Finance & Insurance industry contributes over $2.3 billion to the Gross Regional Product of the Spokane Area. This represents about 7% of the total GRP for the Spokane Area. The Depository Credit Intermediation sector contributes over $871 million to the region s GRP, accounting for 38% of the total Finance & Insurance industry GRP. This sector also has the highest employment in the Finance & Insurance industry. 12
14 While it only accounts for 4% of Finance & Insurance employment, the Other Financial Investment Activities sector accounts for 12% of Finance & Insurance GRP. The sector is highly efficient, with a GRP per worker of over $600,000. Finance & Insurance Industry Overview, 4 Digit NAICS - Spokane Area NAICS Average 2015 Location % of Gross Regional Earnings Per Quotient Cluster Product Worker 5221 Depository Credit Intermediation 5,074 $63, % $871,756, Nondepository Credit Intermediation 637 $67, % $84,410, Activities Related to Credit Intermediation 362 $74, % $52,359, Securities and Commodity Contracts Intermediation and Brokerage 631 $185, % $155,878, Other Financial Investment Activities 493 $64, % $296,029, Insurance Carriers 2,995 $83, % $594,961, Agencies, Brokerages, and Other Insurance Related Activities 3,250 $60, % $264,848, Total (All Finance and Insurance) 13,444 $73, % $2,377,204,801 Bold designates 5 largest industries For industries with fewer than 10 workers, analyst assumes 5 workers 13
15 Historic Change in Employment (2005 to 2015) The table below summarizes changes in employment in the Spokane Area, Washington and Idaho States (combined), and the United States. Key findings from this analysis are below. A more detailed table presenting changes at the 4-digit NAICS code level is on the following page. Rows with bold text designate the industries with employment growth between 2005 and Finance & Insurance Industry Historic Change Spokane Area WA and ID States United States Change In Employment -0.5% -6.8% -2.4% Key Findings: The Finance & Insurance industry contracted slightly between 2005 and 2015, shedding nearly 70 jobs, a decrease of 0.5%. However, if measured from the employment low of just over 13,000 jobs during the recession, employment growth in the industry has been positive. From its 2012 employment low, the Finance & Insurance industry has added nearly 400 jobs, an increase of 3%. While employment in the Finance & Insurance industry contracted slightly over this period, it fared better than employment in Washington and Idaho States and the US. Finance & Insurance employment in these geographies contracted by nearly 7% and 2.5%, respectively. The Finance & Insurance sectors that added jobs between 2005 and 2015 were Agencies, Brokerages, and Other Insurance Related Activities; Depository Credit Intermediation; and Other Financial Investment Activities. These sectors added between 622 jobs and 60 jobs over this period. Most Finance & Insurance sectors contracted between 2005 and In some cases, the declines were moderate, for example, the Securities and Commodity Contract Intermediation and Brokerage sector shed 19 jobs, contracting by 3%. However, other contractions were more substantial. The Nondepository Credit Intermediation and Activities Related to Credit Intermediation sectors each contracted by 42%, shedding 460 and 260 jobs, respectively. Employment in the Insurance Carriers industry also declined, contracting by 7%, or nearly 240 jobs. Even after this decline, the sector accounted for 22% of Finance & Insurance industry jobs in 2015, the third largest sector. The sector also has the second highest average earnings per worker, at $83,000. The Agencies, Brokerages, and Other Insurance Related Activities sector added the most jobs between 2005 and 2015, increasing employment by nearly 25%, or 600 jobs. This is the second largest sector in the industry, accounting for 24% of Finance & Insurance employment. The sector has the lowest average earnings per worker in the Finance & Insurance industry. The Depository Credit Intermediation sector saw the second highest employment growth between 2005 and 2015, in absolute terms. The sector added 262 jobs over this period, expanding employment by 5%. As of 2015, the Depository Credit Intermediation sector was the largest Finance & Insurance employer, accounting for nearly 40% of industry employment. 14
16 Finance & Insurance Industry Historic Change, 4 Digit NAICS - Spokane Area NAICS # Change % Change 5221 Depository Credit Intermediation 4,812 4,920 5, % 5222 Nondepository Credit Intermediation 1, % 5223 Activities Related to Credit Intermediation % 5231 Securities and Commodity Contracts Intermediation and Brokerage % 5239 Other Financial Investment Activities % 5241 Insurance Carriers 3,234 2,967 2, % 5242 Agencies, Brokerages, and Other Insurance Related Activities 2,628 2,906 3, % 52 Total (All Finance and Insurance) 13,511 13,214 13, % Bold designates industries with positive historic employment growth For industries with fewer than 10 workers, analyst assumes 5 workers 15
17 Projected Change in Employment (2015 to 2021) The table below summarizes changes in employment in the Spokane Area, Washington and Idaho States (combined), and the United States. Key findings from this analysis are below. A more detailed table presenting changes at the 4-digit NAICS code level is on the following page. Rows with bold text designate the industries with projected employment growth between 2015 and Finance & Insurance Industry Projected Change Spokane Area WA and ID States United States Change In Employment 3.9% 2.2% 4.3% Overall, employment in the Finance & Insurance industry is projected to grow by 4%, adding 525 jobs between 2015 and Employment growth in the Spokane Area is expected to outpace growth in Washington and Idaho States. However, growth will lag behind the 4.3% employment growth projected in the US over the same period. The Depository Credit Intermediation sector is projected to add the most jobs, increasing employment by 7%, or 330 jobs. The sector also demonstrated strong growth between 2005 and 2015, adding over 260 jobs during that period. This sector is expected to continue to be the largest in the Finance & Insurance industry. The Agencies, Brokerages, and Other Insurance Related Activities is also projected to grow substantially between 2015 and 2021, expanding employment by 9%, or 280 jobs. The sector also demonstrated strong growth between 2005 and 2015, increasing employment by over 600 jobs. Nondepository Credit Intermediation and Activities Related to Credit Intermediation are expected to continue to shed jobs over the coming years, however at a lower rate than the decline between 2005 and The Nondepository Credit Intermediation sector is expected to lose 79 jobs, contracting by 12% while the Activities Related to Credit Intermediation is projected to lose 93 jobs, contracting by 26%. Several industries that lost jobs between 2005 and 2015 are expected to grow modestly by The Securities and Commodity Contracts Intermediation and Brokerage sector declined by 3% between 2005 and 2015 but is expected to increase employment by 7% by 2021, adding 43 jobs. Similarly, the Insurance Carriers sector, which contracted by 7% between 2005 and 2015, is projected to add 42 jobs by 2021, a 1% increase in employment. 16
18 Finance & Insurance Industry Projected Change, 4 Digit NAICS - Spokane Area NAICS # Change % Change 5221 Depository Credit Intermediation 5,074 5,279 5, % 5222 Nondepository Credit Intermediation % 5223 Activities Related to Credit Intermediation % 5231 Securities and Commodity Contracts Intermediation and Brokerage % 5239 Other Financial Investment Activities % 5241 Insurance Carriers 2,995 3,012 3, % 5242 Agencies, Brokerages, and Other Insurance Related Activities 3,250 3,405 3, % 52 Total (All Finance and Insurance) 13,444 13,714 13, % Bold designates industries with positive projected employment growth For industries with fewer than 10 workers, analyst assumes 5 workers 17
19 Competitiveness Analysis Shift share analysis distinguishes an industry s employment growth in a specific area that is attributable to local competitive advantages from growth that is attributable to national employment trends or overall industry employment trends. The shift share analysis helps to answer the question of Why is employment growing or declining in this industry? Is it simply related to the industry growing nationally or are we more competitive regionally? To do this, shift share analysis splits regional job growth into three components: the national growth effect, industrial mix effect, and regional competitive effect. A shift share analysis is based on four factors: The Industrial Mix Effect The industrial mix effect represents the share of regional industry growth explained by the growth of the specific industry at the national level. To arrive at this number, the national growth rate of the total economy is subtracted from the national growth rate of the specific industry, and this growth percentage is applied to the regional jobs in that industry. The National Growth Effect The national growth effect explains how much of the regional industry s growth is explained by the overall growth of the national economy: if the nation s economy overall is growing, you would generally expect to see some positive change in each industry in your local region (the proverbial rising tide that lifts all boats ). The Expected Change This is simply the rate of growth of the particular industry at the national level. The expected change is the sum of the industrial mix and the national growth effects. The Regional Competitive Effect The regional competitive effect is the most vital in the shift share analysis. It explains how much of the change in a given industry is due to some unique competitive advantage that the region possesses, because the growth cannot be explained by national trends in that industry or the economy as whole. This effect is calculated by taking the total regional growth of the given industry and subtracting the national growth for that same industry. Note that this effect can be positive even as regional employment in the industry declines. This would indicate that regional decline is less than the national decline. Key findings from the Competiveness Analysis are below. A detailed supporting table at the 4-digit NAICS code level is presented on the following page. Employment in the Finance & Insurance industry contracted in the US between 2005 and 2015, even as overall US employment grew. The industry also contracted in the Spokane Area, however, employment contracted at a much lower rate, relative to the national decline. Due to the overall contraction in the industry, nearly 260 jobs are estimated to have been created or retained due to the competitiveness of the Spokane Area s Finance & Insurance industry. The Finance & Insurance sectors with the highest competitive effect in the Spokane Area were Depository Credit Intermediation and Agencies, Brokerages, and Other Insurance Related Activities. Based on national trends, the Depository Credit Intermediation would have been expected to decline by over 200 jobs in the Spokane Area over the past 10 years. Despite this national decline, the sector actually added over 260 jobs in the region. The Agencies, Brokerages, and Other Insurance Related Activities grew at a faster rate than would have been expected considering national industry trends. Therefore, over 100 of the new jobs can be attributed to local competitiveness. Conversely, several sectors lost jobs or added fewer jobs than would have been expected, based on national industry trends. These include Nondepository Credit Intermediation, Insurance Carriers, Activities Related to Credit Intermediation, and Other Financial Investment Activities. While employment growth in the region s Other Financial Investment Activities sector was strong, it lagged employment growth in the nation. 18
20 Finance & Insurance Industry Competitiveness Analysis ( ), 4 Digit NAICS - Spokane Area NAICS Nat'l Ind. Mix Expected Competitive Growth Effect Change Effect Effect 5221 Depository Credit Intermediation Nondepository Credit Intermediation Activities Related to Credit Intermediation Securities and Commodity Contracts Intermediation and Brokerage Other Financial Investment Activities Insurance Carriers Agencies, Brokerages, and Other Insurance Related Activities Total (All Finance and Insurance) -1, Bold designates industries with highest competitive effect For industries with fewer than 10 workers, analyst assumes 5 workers 19
21 Employment by County Employment in the Spokane Area varies by county. The chart below presents 2015 Finance & Insurance employment in each county as well as past and projected changes in employment. Key findings from this analysis are below. Over 75% of Finance & Insurance employment occurs in Spokane County, which accounts for over 10,300 Finance & Insurance jobs. Kootenai County has the second highest Finance & Insurance employment in the region, with 2,500 jobs, or 19% of regional Finance & Insurance employment. While regionally, the Finance & Insurance industry contracted slightly between 2005 and 2015, the industry grew by over 600 jobs in Kootenai County. Kootenai was the only county in the Spokane Area where employment grew over this period. Between 2005 and 2015, Finance & Insurance employment declined in Spokane County, shedding over 400 jobs, a 4% decrease. Employment in Whitman County declined at the highest rate over this period, contracting by over 50%, a decrease of 185 jobs. Over the next 10 years, Kootenai County is expected to account for most of the growth in the Finance & Insurance industry, adding 550 jobs, an increase of 21%. Spokane County is also expected to add a significant number of jobs over the next 10 years. By 2025, the county is expected to have over 10,700 Finance & Insurance jobs, an increase of over 330 jobs. Whitman County is expected to continue to shed jobs over the next 10 years, contracting by 44%, or 75 jobs, by Lincoln and Pend Oreille Counties are also expected to lose Finance & Insurance jobs over this period. 20
22 Employment by Age of Worker The age of workers employed in an industry can factor significantly in demand for new workers. As older workers retire from the workforce, they will need to be replaced by younger workers with the skills and experience to meet employer needs. As the baby boomer generation retires from the workforce, finding the workers to fill vacant positions can present a challenge to employers. The age of workers in the Spokane Area s Finance & Insurance industry were compared to the age of Finance & Insurance workers in Washington and Idaho States and the US. Key findings from this analysis are below. Overall, the age of workers in the Spokane Area s Finance & Insurance industry mirrors age demographics in Washington and Idaho States and the nation. However, in the Spokane Area, employment is more concentrated in workers between the ages of 55 and 64 than the states or nation. These workers may be approaching retirement age. Finance & Insurance employment in the Spokane Area is less concentrated than the states and nation in the age cohort. This cohort accounts for 22.6% of local Finance & Insurance industry, while nationally, it accounts for over 24.4%. In the Spokane Area, Finance & Insurance employment in more concentrated in the age cohort, relative to Washington and Idaho States and the nation. The local industry is also slightly more concentrated in the age cohort. 21
23 Economic Impact To understand the impact the Finance & Insurance industry has on the region s economy, the direct, indirect, and induced effects of the industry were analyzed. Key Findings: For every job in the Finance & Insurance industry, another 1.20 jobs are created throughout the region. 1 The total employment impact of the Finance & Insurance industry is 45,400 jobs, including over 20,500 direct jobs and over 24,500 indirect and induced jobs. For every direct dollar of business revenue generated in the Finance & Insurance industry, another 0.50 dollars are generated throughout the region s economy. The $3.7 billion of Finance & Insurance revenues generated in the Spokane Region grew to over $5.6 billion of business revenues as the funds circulated through the regional economy. For every $1 of direct labor, another 56 cents of earnings cycle through the economy. The $1.35 billion of Finance & Insurance labor income generates another $750 million of indirect and induced earnings, for a total earnings impact of $2.1 billion in the Spokane Region. Key Definitions: Economic Impact, Finance & Insurance - Spokane Area Employment Business Revenues Labor Income Direct Impact 20,647 $3,744,172,970 $1,352,279,421 Indirect Impact 7,776 $323,816,339 $132,268,098 Induced Impact 16,972 $1,534,119,940 $622,481,461 Total Impact 45,395 $5,602,109,248 $2,107,028,979 Source: EMSI *Includes "Extended Proprietor" jobs and income, which is not included in other portions of the industry analysis Economic Multipliers, Finance & Insurance - Spokane Area Total Employment Business Labor Per Million $ Revenues Income of Direct Revenues Economic Multiplier Source: EMSI Direct Impact: represents employment, purchases, and earnings in the Finance & Insurance industry Indirect Impact: represents the economic impacts of suppliers to the Finance & Insurance industry in terms of employment, business revenues, and labor income. For example, in order to supply the Finance & 1 Included in these job counts are self-employed workers, as well as extended proprietors for whom these jobs are not their primary source of income but still represent Finance & Insurance and other economic activity. This could include, for example, those who do freelance work on the side. 22
24 Insurance industry with a product, a business may have to hire workers, pay wages, and purchase inputs from other suppliers. Induced Impact: represents the economic impact of Finance & Insurance workers as they spend their earnings in the local economy Economic Multiplier: represents the total change per change in industry (job, dollar of earnings, dollar of business revenues). For example, an employment multiplier of 3 means that for every new job in an industry, an additional 2 jobs are created elsewhere in the economy. 23
25 Finance & Insurance Occupations in the Finance & Insurance industry are primarily comprised of four main occupational groups: Management Occupations; Business and Financial Operations Occupations; Sales and Related Occupations; and Office and Administrative Occupations. The Office and Administrative Support Occupation group is the largest occupational group in the Finance & Insurance industry, representing over 5,400 jobs. This report analyzes the occupations that make up the Finance & Insurance industry, including current and projected employment, the expected number of annual openings over the coming years, the educational requirements of the occupation, and the number of relevant degrees awarded in the region. Key statistics about each occupational group are presented in the following sections: Key Occupations: an overview of 5 occupations that have a high number of openings and a high proportion of workers with some postsecondary education Overview: including the current and projected number of jobs in the Finance & Insurance industry and median hourly earnings for each occupation Projected Annual Openings: the number of annual openings in each occupation, broken down by new and replacement demand Labor Supply and Demand Analysis: the number of openings in each occupation are compared to the number of related program completions, to produce a completions-to-openings ratio, and the typical level of education required to enter the field Sources: Economic Modeling Specialists, Intl. (EMSI): current employment, projections, wages, openings, and completions data. Bureau of Labor Statistics (BLS): typical entry-level education requirements (national) and the breakdown of occupations by level of education in 2012/2013 (national) 24
26 Insurance Sales Agents Definition: Sell life, property, casualty, health, automotive, or other types of insurance. May refer clients to independent brokers, work as an independent broker, or be employed by an insurance company. (Source: O*NET) Typical Job Titles: Account Executive, Account Manager, Agent, Insurance Agent, Insurance Broker, Insurance Sales Agent, Producer, Sales Agent, Sales Representative, Underwriting Sales Representative (Source: O*NET) Key Statistics: Insurance Sales Agents 2012/2013 Annual 2015 F&I Median Hourly Annual Related % of Workers with % of Workers Openings Employment Wages Completions Postsecondary Age 55 and older (All Industries) Education* 2,285 $ % 26% *Nationally, includes Post-secondary non-degree awards, Associate's, Bachelor's and above Insurance Sales Agents is the largest occupational group in the Finance and Insurance industry, accounting for nearly 2,300 jobs in Between 2005 and 2015, the occupation added nearly 400 jobs, increasing by over 20%. Over the next 10 years, the occupation is expected to continue to add new jobs, expanding by 6%, or 135 jobs. Over the next 10 years, the Insurance Sales Agent occupational group is projected to have 80 openings annually in the Finance & Insurance industry. The vast majority of openings are expected to be created by replacement demand, with just 17% of opening created by new demand. The median hourly wages in this occupation are over $2 lower than the median for the Spokane Area economy overall. However, these wages are higher than the median for occupations that typically require less than a 2-year degree. According to the BLS, only a high school diploma is typically required to enter this occupation. However, over 80% of workers in this occupational group in 2012/2013 had some postsecondary education. Approximately 40% of workers have a Bachelor s degree while another 26% have some college education but no degree. In the Spokane Area, over a quarter of workers in this occupational group over the age of 55 or older. These workers may be planning to retire over the next 5 to 15 years, resulting in vacancies in the occupation. While there are no educational completions specifically related to this occupational group in the region, Washington State University does offer a Bachelor of Finance degree, which awards approximately 140 degrees annually. Through this program, undergraduate students can concentrate their studies in the insurance field. 25
27 Tellers Definition: Receive and pay out money. Keep records of money and negotiable instruments involved in a financial institution's various transactions. (Source: O*NET) Typical Job Titles: Account Representative, Bank Teller, Customer Relationship Specialist, Customer Service Associate (CSA), Customer Service Representative (CSR), Member Services Representative, Personal Banking Representative, Roving Teller, Teller, Teller Coordinator (Source: O*NET) Key Statistics: Tellers 2012/2013 Annual 2015 F&I Median Hourly Annual Related % of Workers with % of Workers Openings Employment Wages Completions Postsecondary Age 55 and older (All Industries) Education* 1,236 $ % 17% *Nationally, includes Post-secondary non-degree awards, Associate's, Bachelor's and above Tellers is the second largest occupational group in the Finance & Insurance industry, representing over 1,200 jobs in However, the group has declined slightly since 2005, shedding approximately 100 jobs. Over the next 10 years, employment in this occupational group is expected to grow by just 20 jobs. Despite the low growth in employment, the Tellers occupational group is expected to have the second highest number of openings in the Finance & Insurance industry group, with nearly 70 openings expected annually. These openings are due almost exclusively to replacement demand. While in some occupations, replacement demand is driven by retirements, it is more likely that replacement demand in the Tellers occupational group is due to non-retirement turnover, specifically workers leaving the occupation for other employment. Median wages for this occupation are $13 per hour, approximately $6 lower than the median for the Spokane Area overall. The BLS categorizes this occupation as one that typically requires a high school diploma or equivalent to enter the field. However, based on a national assessment of employment and education levels, the BLS has determined that nearly two thirds of workers in this field have some form of postsecondary education. This includes approximately 33% of workers who began but did not complete a Bachelor s degree. Compared to the Finance & Insurance industry overall, the Tellers occupational group has fewer older workers approaching retirement age. The largest group of workers in this occupational group is between the ages of 25 and 34, which represents approximately 30% of employment in the Tellers occupation. At this time, educational institutions in the region do not offer degrees or certifications related to this occupational group. However, employers may not require formal education to qualify for this occupation and may prefer applicants with customer service, clerical, and mathematical-related work experience. 26
28 Insurance Claims and Policy Processing Clerks Definition: Process new insurance policies, modifications to existing policies, and claims forms. Obtain information from policyholders to verify the accuracy and completeness of information on claims forms, applications and related documents, and company records. Update existing policies and company records to reflect changes requested by policyholders and insurance company representatives. (Source: O*NET) Typical Job Titles: Call Center Representative, Claim Processing Specialist, Claim Service Representative, Claim Technician, Claims Clerk, Claims Customer Service Representative (Claims CSR), Claims Processor, Claims Representative, Claims Service Representative, Claims Technician, Account Administrator, Account Manager, Administrative Underwriter, Agency Service Representative, Associate Financial Representative, Customer Service Technician, Field Secretary, Insurance Analyst, Premium Representative, Processing Clerk (Source: O*NET) Key Statistics: Insurance Claims and Policy Processing Clerks 2012/2013 Annual 2015 F&I Median Hourly Annual Related % of Workers with % of Workers Openings Employment Wages Completions Postsecondary Age 55 and older (All Industries) Education* 931 $ % 20% *Nationally, includes Post-secondary non-degree awards, Associate's, Bachelor's and above In 2015, the Insurance Claims and Policy Processing Clerks accounted for approximately 930 jobs in the Finance & Insurance industry. The occupational group has grown slightly over the past 10 years, adding over 40 jobs. This growth is expected to continue, with employment in the occupation expanding by another 7% by Over the next 10 years, nearly 40 openings are projected in this occupation annually, most of which are expected to be in the Finance & Insurance industry. Openings in this occupational group are driven by replacement demand, accounting for 80% of the annual openings. Median hourly wages are $17.44 for this occupation, approximately $1.50 less than the median hourly wage for all Spokane Area jobs. However, this median wage is $2.00 higher than the median for all jobs that require less than a 2-year degree. Approximately 1 in 5 workers in this occupational group are approaching retirement age. The wave of retirements expected over the next 10 to 15 years will likely create opportunities for new workers to enter this field, despite the modest employment growth expected. According to the BLS, this occupation typically requires only a high school diploma, however, nearly 75% of workers in this field nationally have some postsecondary education, including over a third who have some college but no degree. In 2014, approximately 60 degrees or certificates related to this occupational group were awarded in the Spokane Area. These degrees were awarded by programs at Spokane Falls Community College, Spokane Community College, and North Idaho College. However, due to competition for graduates with these academic credentials by other occupational groups, only 4 of the 63 awards are expected to enter the Insurance Claims and Policy Processing Clerks occupational group. However, some employers may be hiring workers qualified for this occupation through work experience or on-the-job training and may not require a specialized credential. 27
29 Customer Service Representatives Definition: Interact with customers to provide information in response to inquiries about products and services and to handle and resolve complaints. (Source: O*NET) Typical Job Titles: Account Manager, Account Representative, Call Center Representative, Client Services Representative, Customer Care Representative (CCR), Customer Service Agent, Customer Service Representative (Customer Service Rep), Customer Service Specialist, Member Services Representative, Sales Facilitator (Source: O*NET) Key Statistics: Customer Service Representatives 2012/2013 Annual 2015 F&I Median Hourly Annual Related % of Workers with % of Workers Openings Employment Wages Completions Postsecondary Age 55 and older (All Industries) Education* 1,148 $ % 15% *Nationally, includes Post-secondary non-degree awards, Associate's, Bachelor's and above The Customer Service Representatives occupational group is one of the largest groups in the Finance & Insurance industry, as well as the Spokane Area overall. In the Finance & Insurance industry, the occupational group accounts for nearly 1,150 jobs while economy wide, the group accounts for 6,600 jobs. In the Finance & Insurance industry, the number of Customer Service Representatives jobs has increased modestly over the past 10 years and is expected to expand by another 10% by 2025, adding over 115 jobs. This largely mirrors employment growth in the occupation economy-wide. Economy-wide, over 280 openings are expected in the Customer Service Representatives occupational group, of which, 45 are estimated to be in the Finance & Insurance industry. Openings are primarily being driven by replacement demand, with approximately 74% of the openings attributed to replacement demand and 26% attributed to new demand. The median wage for this occupation is $14.37 per hour, which is slightly lower than the median for occupations that typically require less than a 2-year degree and about $4.50 lower than the overall median wage in the Spokane Area. According to the BLS, the Customer Service Representatives occupational group typically requires a high school diploma to enter the field. However, nationally, nearly 70% of workers in this field have some form of postsecondary education. Approximately a third of workers in this field have some college but no degree while 21% have a Bachelor s degree. The Customer Service Representatives occupational group is young, relative to most other occupational groups. Workers aged 55 and older only account for 15% of the jobs while 46% are under the age of 35. In the Spokane Area, 6 postsecondary non-degree awards related to the Customer Service Representatives occupational group are awarded annually at Spokane Community College. However, due to competition for workers with these credentials, 4 of the 6 graduates would be expected to enter the Customer Service Representatives field. However, employers may not expect formal postsecondary educational credentials to enter this occupation and may prefer applicants with prior related experience. 28
30 Personal Financial Advisors Definition: Advise clients on financial plans using knowledge of tax and investment strategies, securities, insurance, pension plans, and real estate. Duties include assessing clients' assets, liabilities, cash flow, insurance coverage, tax status, and financial objectives. (Source: O*NET) Typical Job Titles: Account Executive, Analyst, Certified Financial Planner (CFP), Financial Advisor, Financial Consultant, Financial Counselor, Financial Planner, Investment Advisor, Portfolio Manager, Registered Representative (Source: O*NET). Key Statistics: Personal Financial Advisors 2012/2013 Annual 2015 F&I Median Hourly Annual Related % of Workers with % of Workers Openings Employment Wages Completions Postsecondary Age 55 and older (All Industries) Education* 562 $ % 28% *Nationally, includes Post-secondary non-degree awards, Associate's, Bachelor's and above In 2015, the Personal Financial Advisors occupational group accounted for over 560 jobs in the Finance & Insurance industry. Employment has grown modestly over the past 10 years and is expected to grow by another 13% over the next 10 years, adding over 70 jobs. Over the next 10 years, 21 openings are projected in this occupation annually, the majority of which are expected to be in the Finance & Insurance industry. Over 60% of openings are due to replacement demand while 39% are due to new demand. The Median hourly wage in this occupation are $40, significantly higher than the overall median for the Spokane Area and most other Finance & Insurance occupations. 28% of workers in this occupation are over the age of 55 and may be planning to retire over the next 5 to 15 years. Retirements in this occupation may create opportunities for new workers to enter the field. According to the BLS, this occupation typically requires a Bachelor s degree and nationally, nearly all workers have some kind of postsecondary education. Over 50% of workers have a Bachelor s degree while another 20% have a Master s degree. Due the number of 4-year colleges and universities in the Spokane Area, there are significantly more academic degrees being awarded annually the Personal Financial Adivsors openings. The largest program related to this occupational group is the Finance Bachelor s degree program offered at Washington State University, with over 140 graduates annually. Eastern Washington University also offers a Finance major, with approximately 70 graduates annually. Graduates from these programs may also enter the Loan Officers, Financial Managers, and Financial Analysts occupational groups. 29
31 Finance & Insurance Occupation Overview Selection Criteria for Occupations Included: At least 100 jobs in the Finance & Insurance industry At least 5 openings annually Data Included: 2015 Percent of in the Finance & Insurance Industry 2015 to 2025 Change (absolute change and percent change) Median Hourly Earnings Key Findings: The largest Finance & Insurance occupational group is Insurance Sales Agents, which accounts for 2,285 jobs, 17% of all the jobs in the Finance & Insurance industry. Employment in this occupational group is nearly twice as high as the next largest occupational group, Tellers. The size of these occupational groups emphasize the dominance of the insurance agencies and retail banking sectors within the Finance & Insurance industry in the Spokane Area. Overall, the Finance & Insurance industry is expected to have modest growth over the next 10 years. Occupations within the industry group as also expected to grow modestly over the next 10 years, with few experiencing double digit growth. The fastest growing occupational groups in the Finance & Insurance industry include Secretaries and Administrative Assistants, Personal Financial Advisors, General and Operations Managers, Business Operations Specialists, and Customers Service Representatives. The occupational groups expected to add the most jobs over the next 10 years are Insurance Sales Agents, Customer Service Representatives, and Personal Financial Advisors. Compared to other industry groups, the Finance & Insurance industry has more jobs with high median hourly earnings. These high wages are concentrated in in the Management and Business & Financial Operations broad occupational groups. However, in the Sales and Related and Office and Administrative Support broad occupational groups, median wages are lower, with most falling between $13 and $16 per hour. Several of the key occupations in the Finance & Insurance industry are shared among many other industry groups. For example, while Customer Service Representatives are the third largest occupational group in the industry, representing nearly 1,150 jobs, the Finance & Insurance industry only accounts for 17% of all Customer Service Representative jobs in the Spokane Area. 30
32 Management and Business & Financial Operations Occupations Overview: Management and Business & Financial Operations Occupations SOC 2015 F&I % of in F&I Industry # Change % Change Median Hourly Earnings (All Industries) Financial Managers % 26 8% $ General and Operations Managers 196 5% 23 12% $ Claims Adjusters, Examiners, and Investigators % 20 5% $ Business Operations Specialists, All Other 102 6% 11 10% $ Accountants and Auditors 127 5% 12 9% $ Financial Analysts % 7 6% $ Personal Financial Advisors % 71 13% $ Insurance Underwriters % -7-4% $ Loan Officers % -6-1% $30.49 Bold designates occupations that added the most jobs in the F&I industry Sales and Related Occupations Overview: Sales and Related Occupations SOC 2015 F&I % of in F&I Industry # Change % Change Median Hourly Earnings (All Industries) Insurance Sales Agents 2,285 99% 135 6% $16.28 Securities, Commodities, and Financial Services Sales Agents % 39 6% $18.18 Bold designates occupations that added the most jobs in the F&I industry 31
33 Office and Administrative Support Occupations Overview: Office and Administrative Support Occupations SOC 2015 F&I % of in F&I Industry # Change % Change Median Hourly Earnings (All Industries) First-Line Supervisors of Office and Administrative Support Workers % 49 9% $ Bill and Account Collectors % -2-2% $ Bookkeeping, Accounting, and Auditing Clerks 285 6% 23 8% $ Tellers 1,236 99% 23 2% $ Brokerage Clerks % 4 3% $ Customer Service Representatives 1,148 17% % $ Loan Interviewers and Clerks % 6 1% $ New Accounts Clerks % -1 0% $17.08 Secretaries and Administrative Assistants, Except Legal, Medical, and Executive 209 3% 32 15% $ Insurance Claims and Policy Processing Clerks % 65 7% $ Office Clerks, General 218 3% 17 8% $13.97 Bold designates occupations that added the most jobs in the F&I industry 32
34 Projected Annual Openings Selection Criteria for Occupations Included: At least 100 jobs in the Finance & Insurance industry At least 5 openings annually Data Included: Annual Openings (All Industries): represents the average number of job openings over the next 10 years due to retirements/turnover (replacement demand) and economic growth (new demand) Estimated Annual Openings (Finance & Insurance): of the annual openings, the number estimated to be in the Finance & Insurance industry. The number of openings is only provided for an occupation, but not the portion of the occupation in a certain industry. To estimate the number of openings specifically in the Finance & Insurance industry, Camoin Associates assessed the number of new jobs expected in the Finance & Insurance industry over the next 10 years and the portion of Finance & Insurance jobs in the occupation overall. New Demand: job openings in an occupation created by new jobs being added to an occupation/industry Replacement Demand: jobs openings in an occupation created by workers retiring or other turnover Key Findings: Due to the relatively low employment growth in the Finance & Insurance industry expected over the next 10 years, openings in the industry are largely driven by replacement demand. In some cases, such as the Loan Officers occupational group, replacement demand accounts for 100% of the openings, due an expected decline in the total number of jobs. Despite the low employment growth projected, several occupational groups are expected to have a high demand for new workers. For example, the Insurance Sales Agents occupational group is expected to have 80 openings annually in the Finance & Insurance industry, despite just 13 new jobs projected annually. 33
35 Management and Business & Financial Operations Occupations Projected Annual Openings: Management and Business & Financial Operations Occupations SOC Annual Openings (All Industries) Est. Annual Openings (F&I) Estimated % New Demand % Replacement Demand Financial Managers % 71% General and Operations Managers % 63% Claims Adjusters, Examiners, and Investigators % 83% Business Operations Specialists, All Other % 58% Accountants and Auditors % 79% Financial Analysts % 83% Personal Financial Advisors % 61% Insurance Underwriters 5 5 0% 100% Loan Officers % 100% Bold designates occupations with the highest number of F&I Annual Openings Sales and Related Occupations Projected Annual Openings: Sales and Related Occupations SOC Annual Openings (All Industries) Est. Annual Openings (F&I) Estimated % New Demand % Replacement Demand Insurance Sales Agents % 83% Securities, Commodities, and Financial Services Sales Agents % 82% Bold designates occupations with the highest number of F&I Annual Openings 34
36 Office and Administrative Support Occupations Projected Annual Openings: Office and Administrative Support Occupations SOC Annual Openings (All Industries) Est. Annual Openings (F&I) Estimated % New Demand % Replacement Demand First-Line Supervisors of Office and Administrative Support Workers % 73% Bill and Account Collectors % 100% Bookkeeping, Accounting, and Auditing Clerks % 56% Tellers % 97% Brokerage Clerks % 89% Customer Service Representatives % 74% Loan Interviewers and Clerks % 89% New Accounts Clerks 6 6 0% 100% Secretaries and Administrative Assistants, Except Legal, Medical, and Executive % 46% Insurance Claims and Policy Processing Clerks % 80% Office Clerks, General % 74% Bold designates occupations with the highest number of F&I Annual Openings 35
37 Labor Supply and Demand Analysis Selection Criteria for Occupations Included: At least 100 jobs in the Finance & Insurance industry At least 5 openings annually Data Included: Annual Openings (All Industries): represents the average number of job openings over the next 10 years due to retirements/turnover (replacement demand) and economic growth (new demand) Annual Related Completions: represents all degrees awarded in educational programs that could funnel workers into the occupation Completions Allocated to Occupation: as most educational programs prepare graduates for multiple occupations, this statistic assesses the number of graduates that would be expected to enter a specific occupational field, based on the amount of competition for those graduates from other occupational groups. Completions to Openings Ratio: compares the number of completions allocated to occupation to the number of annual openings. A ratio of 1 would signify that there are exactly the same number of graduates as openings. If the ratio is less than 1, there are fewer educational awards than the number of annual openings while a ratio greater than 1 would mean there are more educational awards than openings. Typical Level of Education Required: determined by the Bureau of Labor Statistics (BLS), this represents the level of education typically required nationally to enter an occupational field. This may vary widely based on the industry and location. Percent of Workers with Postsecondary Education: determined by the Bureau of Labor Statistics, this number represents the proportion of workers in the occupational group that have some college, a postsecondary non-degree award, an Associate s degree, Bachelor s degree, or more advanced level of education. Key Findings: While many Finance & Insurance occupations do not have any or enough degrees being awarded in related programs, it is possible that employers do not require a formal educational credential or prefer work experience or on-the-job training to train employees. The BLS categorizes many Finance & Insurance industry occupations as requiring only a high school diploma, however, it is much more common for workers in these fields to have some postsecondary education. For many of these occupations, a large portion of the workers nationally completed some college but did not receive a degree. Due to the number of 4-year colleges and universities in the Spokane Area, the occupational groups that typically require a Bachelor s degree have more than enough graduates from regional institutions to fill their employment needs. While these graduates present a potential pool of applicants for these employers, some graduates may not be planning to stay in the region for work. Some educational programs related to the Finance & Insurance industry have many occupations that compete for the same graduates. For example, the Bookkeeping, Accounting, and Auditing Clerks has over 120 related academic awards from regional institutions, however, graduates from those programs may enter the other accounting or clerk-related occupational groups. 36
38 Management and Business & Financial Operations Occupations Labor Supply and Demand Analysis: Management and Business & Financial Operations Occupations SOC Annual Openings (All Industries) Annual Related Completions Completions Allocated to Occupation Completions to Openings Ratio Typical Level of Education Required (Nationally) % of Workers with Postsecondary Education* Financial Managers Bachelor's degree 88% General and Operations Managers Bachelor's degree 83% Claims Adjusters, Examiners, and Investigators High school diploma or equivalent 83% Business Operations Specialists, All Other High school diploma or equivalent 88% Accountants and Auditors Bachelor's degree 96% Financial Analysts Bachelor's degree 97% Personal Financial Advisors Bachelor's degree 96% Insurance Underwriters Bachelor's degree 85% Loan Officers Bachelor's degree 86% *Nationally, includes Post-secondary non-degree awards, Associate's, Bachelor's and above Sales and Related Occupations Labor Supply and Demand Analysis: Sales and Related Occupations SOC Annual Openings (All Industries) Annual Related Completions Completions Allocated to Occupation Completions to Openings Ratio Typical Level of Education Required (Nationally) % of Workers with Postsecondary Education Insurance Sales Agents High school diploma or equivalent 84% Securities, Commodities, and Financial Services Sales Agents Bachelor's degree 92% *Nationally, includes Post-secondary non-degree awards, Associate's, Bachelor's and above 37
39 Office and Administrative Support Occupations Labor Supply and Demand Analysis: Office and Administrative Support Occupations SOC Annual Openings (All Industries) Annual Related Completions Completions Allocated to Occupation Completions to Openings Ratio Typical Level of Education Required (Nationally) % of Workers with Postsecondary Education First-Line Supervisors of Office and Administrative Support Workers High school diploma or equivalent 75% Bill and Account Collectors High school diploma or equivalent 68% Bookkeeping, Accounting, and Auditing Clerks High school diploma or equivalent 69% Tellers High school diploma or equivalent 64% Brokerage Clerks High school diploma or equivalent 75% Customer Service Representatives High school diploma or equivalent 69% Loan Interviewers and Clerks High school diploma or equivalent 72% New Accounts Clerks High school diploma or equivalent 73% Secretaries and Administrative Assistants, Except Legal, Medical, and Executive High school diploma or equivalent 69% Insurance Claims and Policy Processing Clerks High school diploma or equivalent 73% Office Clerks, General High school diploma or equivalent 67% *Nationally, includes Post-secondary non-degree awards, Associate's, Bachelor's and above 38
40 Manufacturing Industry Workforce Roadmap 39
41 Manufacturing: Past and Projected Changes in Employment In the chart below, past and projected changes in the Manufacturing industry were analyzed and compared to the Washington and Idaho States and the nation. Changes in the Manufacturing industry were also compared to employment trends in the Spokane Area economy overall. Key Findings: Compared to the Spokane Area economy overall, employment in Spokane s Manufacturing industry declined more steeply between 2005 and However, employment in the Manufacturing industry is projected to grow at a higher rate over the next 10 years. Between 2010 and 2015, the industry staged a rapid recovery, surpassing 2005 employment levels by 1%. The industry has not yet reached its pre-recession employment peak of 27,000 jobs. Growth in the industry is projected to continue through In the Spokane Area, the Manufacturing industry declined less steeply and for fewer years than in the US. The Spokane Manufacturing industry has also expanded employment more quickly than US Manufacturing since Despite slow growth at the national level, the Spokane Manufacturing industry is projected to grow rapidly over the next 10 years. The Spokane Manufacturing industry grew at a similar rate as the Washington and Idaho State s industry between 2005 and However, after the 2007 peak in employment, the Spokane Area Manufacturing industry declined more steeply than employment in the two states. The industry has recovered quickly at both the regional and state level. 40
42 Industry Overview Key findings about the 30 largest sectors in the Manufacturing industry are below. A detailed table presenting key data about the Manufacturing industry in the Spokane Area is on the following page. In 2015, employment in the Manufacturing industry reached 25,700 jobs. This accounted for approximately 7% of all employment in the Greater Spokane region. The Manufacturing industry in the region is diverse, with no one sector accounting for more than 10% of employment. The largest sector, Electrical Equipment Manufacturing, accounts for 9% of employment. The Manufacturing sectors with the highest 2015 employment were Electrical Equipment, Plastics Product, Architectural and Structural Metals, Household and Institutional Furniture and Kitchen Cabinet, and Aerospace Product and Parts Manufacturing. Employment in these top sectors ranged from 988 to 2,208 jobs. Earnings per Worker Average earnings per worker in the Manufacturing industry is over 30% higher than the overall average in the Spokane Area. Average earnings per Manufacturing worker are 19% lower in the Spokane Area than in the nation overall. The average earnings per worker in the Spokane Area are 28% lower than earnings in Washington and Idaho States. At $107,000, Navigational, Manufacturing, Electromedical, and Control Instruments has the highest average earnings per employee. This is followed closely by the average earnings recorded in the Alumina and Aluminum Production and Processing sector. Conversely, the Other Wood Product Manufacturing industry has the lowest earnings per worker ($36,336). This is followed by the Household and Institutional Furniture and Kitchen Cabinet Manufacturing. Location Quotient (LQ) With a location quotient of 0.92, the industry is slightly less concentrated than employment in the US overall. In Washington and Idaho States, employment in the Manufacturing industry is slightly more concentrated than employment in the nation. The Electrical Equipment Manufacturing sector has the highest location quotient in the Spokane Area, at 6.80, meaning employment in this industry is nearly 7 times more concentrated in the Spokane Area than in the US overall. The second most concentrated industry is the Alumina and Aluminum Production and Processing sector, with a LQ of These sectors are also among the largest industries in the region. Gross Regional Product (GRP) Overall, the Manufacturing industry contributes nearly $3 billion to the Gross Regional Product of the Spokane Area. This represents about 9% of the total GRP for the Greater Spokane Region. The Pharmaceutical and Medicine Manufacturing sector contributes over $315 million to the region s GRP, 11% of the total Manufacturing industry GRP. In addition to being the largest contributor to the Manufacturing industry s GRP, this industry is highly efficient with a GRP per job of $373,000, over three times the Manufacturing industry s average. This is the highest GRP per job of sectors in the Manufacturing industry. Electrical Equipment Manufacturing is the second highest contributor to GRP in the Manufacturing industry, with a GRP of over $190 million. However, the GRP per job is 26% lower than the industry s average. 41
43 Manufacturing Industry Overview, 4 Digit NAICS - Spokane Area (30 Largest Sectors) NAICS Average 2015 Location % of Gross Regional Earnings Per Quotient Cluster Product Worker 3118 Bakeries and Tortilla Manufacturing 585 $48, % $49,862, Beverage Manufacturing 454 $51, % $128,129, Sawmills and Wood Preservation 814 $61, % $72,935, Veneer, Plywood, and Engineered Wood Product Manufacturing 406 $58, % $31,521, Other Wood Product Manufacturing 487 $36, % $21,100, Pulp, Paper, and Paperboard Mills 338 $95, % $60,803, Printing and Related Support Activities 606 $40, % $40,780, Pharmaceutical and Medicine Manufacturing 851 $82, % $317,416, Plastics Product Manufacturing 1,440 $51, % $105,490, Cement and Concrete Product Manufacturing 731 $65, % $53,646, Steel Product Manufacturing from Purchased Steel 402 $54, % $27,938, Alumina and Aluminum Production and Processing 799 $104, % $99,726, Nonferrous Metal (except Aluminum) Production and Processing 542 $56, % $111,391, Foundries 889 $65, % $68,807, Cutlery and Handtool Manufacturing 295 $45, % $13,049, Architectural and Structural Metals Manufacturing 1,343 $52, % $85,796, Machine Shops; Turned Product; and Screw, Nut, and Bolt Manufacturing 740 $54, % $50,247, Agriculture, Construction, and Mining Machinery Manufacturing 294 $61, % $27,854, Industrial Machinery Manufacturing 289 $73, % $25,246, Ventilation, Heating, Air-Conditioning, and Commercial Refrigeration Equipment Manufacturing 396 $45, % $30,618, Metalworking Machinery Manufacturing 581 $78, % $55,191, Other General Purpose Machinery Manufacturing 291 $68, % $35,833, Computer and Peripheral Equipment Manufacturing 348 $66, % $31,385, Semiconductor and Other Electronic Component Manufacturing 481 $51, % $51,660, Navigational, Measuring, Electromedical, and Control Instruments Manufacturing 768 $107, % $154,868, Electrical Equipment Manufacturing 2,208 $84, % $190,916, Aerospace Product and Parts Manufacturing 988 $82, % $161,369, Household and Institutional Furniture and Kitchen Cabinet Manufacturing 1,103 $37, % $38,297, Office Furniture (including Fixtures) Manufacturing 429 $53, % $79,024, Other Miscellaneous Manufacturing 486 $49, % $42,277, Total (All Manufacturing) 25,702 $63, % $2,804,141,993 Bold designates 10 largest industries For industries with fewer than 10 workers, analyst assumes 5 workers 42
44 Historic Change in Employment (2005 to 2015) The table below summarizes changes in employment in the Spokane Area, Washington and Idaho States (combined), and the United States. Key findings from this analysis are below. A more detailed table presenting changes at the 4-digit NAICS code level is on the following page. Rows with bold text designate the industries with the highest employment growth between 2005 and Manufacturing Industry Historic Change Spokane Area WA and ID States United States Change In Employment 1.0% 5.9% -13.4% Key Findings: Overall, the Manufacturing industry grew only modestly between 2005 and 2015, adding 258 jobs, an increase of 1%. However, the growth in the industry was much more substantial if measured from From an employment low of just under 22,000 jobs in 2010, the Manufacturing industry has added nearly 4,000 jobs, an increase of 17%. The Manufacturing sectors that added the most jobs between 2005 and 2015 were Electrical Equipment; Aerospace Product and Parts; Pharmaceutical and Medicine; Steel Product Manufacturing from Purchased Steel; and, Foundries Manufacturing sectors. These sectors added between 258 jobs and 1,358 jobs over this period. The Manufacturing sectors that shed the most jobs between 2005 and 2015 were Other Wood Product; Printing and Related Support Activities; Navigational, Measuring, Electromedical, and Control Instruments; Computer and Peripheral Equipment; and Sawmills and Wood Preservation Manufacturing. Generally, Manufacturing industry sectors related to the forestry and wood products contracted over this period, with the exception of Pulp, Paper, and Paperboard Mills, which grew by 18%. The Electrical Equipment Manufacturing sector experienced the most employment growth in absolute terms, increasing by 160% from 850 jobs in 2005 to 2,208 jobs in This sector represents nearly 9% of employment in the Spokane Area and has average earnings per workers of over $84,000. The Steel Product Manufacturing from Purchased Steel sector grew at the fastest rate, adding nearly 400 jobs between 2005 and In 2015, employment in this sector was nearly three times more concentrated in the Spokane Area than in the US overall. The Aerospace Product and Parts Manufacturing sector grew substantially between 2005 and 2015, adding over 500 jobs, an increase of 106%. Earnings per worker in this industry are also significantly higher than the average earnings in the Manufacturing industry overall. 43
45 Manufacturing Industry Historic Change, 4 Digit NAICS - Spokane Area (30 Largest Sectors) NAICS # Change % Change 3118 Bakeries and Tortilla Manufacturing % 3121 Beverage Manufacturing % 3211 Sawmills and Wood Preservation 1, % 3212 Veneer, Plywood, and Engineered Wood Product Manufacturing % 3219 Other Wood Product Manufacturing % 3221 Pulp, Paper, and Paperboard Mills % 3231 Printing and Related Support Activities % 3254 Pharmaceutical and Medicine Manufacturing % 3261 Plastics Product Manufacturing 1,403 1,251 1, % 3273 Cement and Concrete Product Manufacturing 1, % 3312 Steel Product Manufacturing from Purchased Steel % 3313 Alumina and Aluminum Production and Processing % 3314 Nonferrous Metal (except Aluminum) Production and Processing % 3315 Foundries % 3322 Cutlery and Handtool Manufacturing % 3323 Architectural and Structural Metals Manufacturing 1,201 1,111 1, % 3327 Machine Shops; Turned Product; and Screw, Nut, and Bolt Manufacturing % 3331 Agriculture, Construction, and Mining Machinery Manufacturing % 3332 Industrial Machinery Manufacturing % 3334 Ventilation, Heating, Air-Conditioning, and Commercial Refrigeration Equipment Manufacturing % 3335 Metalworking Machinery Manufacturing % 3339 Other General Purpose Machinery Manufacturing % 3341 Computer and Peripheral Equipment Manufacturing % 3344 Semiconductor and Other Electronic Component Manufacturing % 3345 Navigational, Measuring, Electromedical, and Control Instruments Manufacturing 1, % 3353 Electrical Equipment Manufacturing 850 1,517 2,208 1, % 3364 Aerospace Product and Parts Manufacturing % 3371 Household and Institutional Furniture and Kitchen Cabinet Manufacturing 1, , % 3372 Office Furniture (including Fixtures) Manufacturing % 3399 Other Miscellaneous Manufacturing % 31 Total (All Manufacturing) 25,444 21,851 25, % Bold designates 5 industries with highest historic employment growth For industries with fewer than 10 workers, analyst assumes 5 workers 44
46 45
47 Projected Change in Employment (2015 to 2021) The table below summarizes changes in employment in the Spokane Area, Washington and Idaho States (combined), and the United States. Key findings from this analysis is below. A more detailed table presenting changes at the 4-digit NAICS code level is on the following page. Rows with bold text designate the industries with the highest projected employment growth between 2015 and Manufacturing Industry Projected Change Spokane Area WA and ID States United States Change In Employment 9.3% 5.0% -2.9% Overall, employment in the Manufacturing industry is projected to grow by 9%, adding over 2,300 jobs between 2015 and Employment growth in the Spokane Area is expected to outpace growth in Washington and Idaho States and the US. The Electrical Equipment; Architectural and Structural Metals; Pharmaceutical and Medicine; Semiconductor and Other Electronic Component; and, Metalworking Machinery Manufacturing industry sectors are projected to add the most jobs between 2015 and Growth in these sectors is projected to range from 166 to 707 jobs. The Navigational, Measuring, Electromedical, and Control Instruments; Office Furniture (including Fixtures); Cement and Concrete Product; Other Miscellaneous; and Other Wood Product Manufacturing sectors are projected to shed the most jobs over the coming years. Employment in these sectors also declined between 2005 and The Electrical Equipment Manufacturing sector is projected to add the most jobs, increasing employment by over 700 jobs, or 32%. This sector also added the most jobs between 2005 and The Semiconductor and Other Electronic Component Manufacturing industry sector is projected to increase employment at the fastest rate, adding over 200 jobs, an increase of 43%. The Navigational, Measuring, Electromedical, and Control Instruments Manufacturing sector is projected to shed over 130 jobs between 2015 and This is the largest decrease of any Manufacturing sector. This sector also lost 30% of jobs between 2005 and The employment growth in the Pharmaceutical and Medicine Manufacturing sector that occurred between 2005 and 2015 is projected to continue through 2021, but at a lower rate. The sector is expected to add another 200 jobs by 2021, an increase of 25%. Average earnings per worker in this sector are nearly $82,500, 30% higher than the Manufacturing industry s average for the region. 46
48 Manufacturing Industry Projected Change, 4 Digit NAICS - Spokane Area (30 Largest Sectors) NAICS # Change % Change 3118 Bakeries and Tortilla Manufacturing % 3121 Beverage Manufacturing % 3211 Sawmills and Wood Preservation % 3212 Veneer, Plywood, and Engineered Wood Product Manufacturing % 3219 Other Wood Product Manufacturing % 3221 Pulp, Paper, and Paperboard Mills % 3231 Printing and Related Support Activities % 3254 Pharmaceutical and Medicine Manufacturing , % 3261 Plastics Product Manufacturing 1,440 1,481 1, % 3273 Cement and Concrete Product Manufacturing % 3312 Steel Product Manufacturing from Purchased Steel % 3313 Alumina and Aluminum Production and Processing % 3314 Nonferrous Metal (except Aluminum) Production and Processing % 3315 Foundries % 3322 Cutlery and Handtool Manufacturing % 3323 Architectural and Structural Metals Manufacturing 1,343 1,520 1, % 3327 Machine Shops; Turned Product; and Screw, Nut, and Bolt Manufacturing % 3331 Agriculture, Construction, and Mining Machinery Manufacturing % 3332 Industrial Machinery Manufacturing % 3334 Ventilation, Heating, Air-Conditioning, and Commercial Refrigeration Equipment Manufacturing % 3335 Metalworking Machinery Manufacturing % 3339 Other General Purpose Machinery Manufacturing % 3341 Computer and Peripheral Equipment Manufacturing % 3344 Semiconductor and Other Electronic Component Manufacturing % 3345 Navigational, Measuring, Electromedical, and Control Instruments Manufacturing % 3353 Electrical Equipment Manufacturing 2,208 2,630 2, % 3364 Aerospace Product and Parts Manufacturing 988 1,093 1, % 3371 Household and Institutional Furniture and Kitchen Cabinet Manufacturing 1,103 1,104 1, % 3372 Office Furniture (including Fixtures) Manufacturing % 3399 Other Miscellaneous Manufacturing % 31 Total (All Manufacturing) 25,702 26,773 28,084 2,383 9% Bold designates 5 industries with highest projected employment growth For industries with fewer than 10 workers, analyst assumes 5 workers 47
49 48
50 Competitiveness Analysis Shift share analysis distinguishes an industry s employment growth in a specific area that is attributable to local competitive advantages from growth that is attributable to national employment trends or overall industry employment trends. The shift share analysis helps to answer the question of Why is employment growing or declining in this industry? Is it simply related to the industry growing nationally or are we more competitive regionally? To do this, shift share analysis splits regional job growth into three components: the national growth effect, industrial mix effect, and regional competitive effect. A shift share analysis is based on four factors: The Industrial Mix Effect The industrial mix effect represents the share of regional industry growth explained by the growth of the specific industry at the national level. To arrive at this number, the national growth rate of the total economy is subtracted from the national growth rate of the specific industry, and this growth percentage is applied to the regional jobs in that industry. The National Growth Effect The national growth effect explains how much of the regional industry s growth is explained by the overall growth of the national economy: if the nation s economy overall is growing, you would generally expect to see some positive change in each industry in your local region (the proverbial rising tide that lifts all boats ). The Expected Change This is simply the rate of growth of the particular industry at the national level. The expected change is the sum of the industrial mix and the national growth effects. The Regional Competitive Effect The regional competitive effect is the most vital in the shift share analysis. It explains how much of the change in a given industry is due to some unique competitive advantage that the region possesses, because the growth cannot be explained by national trends in that industry or the economy as whole. This effect is calculated by taking the total regional growth of the given industry and subtracting the national growth for that same industry. Note that this effect can be positive even as regional employment in the industry declines. This would indicate that regional decline is less than the national decline. Key findings from the Competiveness Analysis is below. A detailed supporting table at the 4-digit NAICS code level is presented on the following page. Employment in the Manufacturing industry contracted in the US between 2005 and 2015, even as overall employment grew. Despite this contraction, the Manufacturing industry in the Spokane Area managed to grow slightly, adding 258 jobs. Due to the overall contraction in the industry, over 3,600 jobs are estimated to have been created or retained due to the competitiveness of the Spokane Area s Manufacturing industry. The most competitive (highest number of jobs attributed to characteristics of the region) Manufacturing sectors in the Spokane Area were Electrical Equipment,; Pharmaceutical and Medical; Aerospace Product and Parts; Foundries; and, Steel Product from Purchased Steel Manufacturing industries. The industries that were less competitive than the nation in terms of employment growth (meaning they either lost jobs at a higher rate or added jobs at a lower rate than would have been expected based on national industry trends) were Navigational, Measuring, Electromedical, and Control Instruments; Computer and Peripheral Equipment; Other Wood Product; Industrial Machinery; and Other General Purpose Machinery Manufacturing. 49
51 Manufacturing Industry Competitiveness Analysis ( ), 4 Digit NAICS - Spokane Area (30 Largest Sectors) NAICS Ind. Mix Effect Nat'l Growth Effect Expected Change Competitive 3118 Bakeries and Tortilla Manufacturing Beverage Manufacturing Sawmills and Wood Preservation Veneer, Plywood, and Engineered Wood Product Manufacturing Effect Other Wood Product Manufacturing Pulp, Paper, and Paperboard Mills Printing and Related Support Activities Pharmaceutical and Medicine Manufacturing Plastics Product Manufacturing Cement and Concrete Product Manufacturing Steel Product Manufacturing from Purchased Steel Alumina and Aluminum Production and Processing Nonferrous Metal (except Aluminum) Production and Processing Foundries Cutlery and Handtool Manufacturing Architectural and Structural Metals Manufacturing Machine Shops; Turned Product; and Screw, Nut, and Bolt Manufacturing Agriculture, Construction, and Mining Machinery Manufacturing Industrial Machinery Manufacturing Ventilation, Heating, Air-Conditioning, and Commercial Refrigeration Equipment Manufacturing Metalworking Machinery Manufacturing Other General Purpose Machinery Manufacturing Computer and Peripheral Equipment Manufacturing Semiconductor and Other Electronic Component Manufacturing Navigational, Measuring, Electromedical, and Control Instruments Manufacturing Electrical Equipment Manufacturing , Aerospace Product and Parts Manufacturing Household and Institutional Furniture and Kitchen Cabinet Manufacturing Office Furniture (including Fixtures) Manufacturing Other Miscellaneous Manufacturing Total (All Manufacturing) -4,688 1,274-3,414 3,671 Bold designates 5 industries with highest competitive effect For industries with fewer than 10 workers, analyst assumes 5 workers 50
52 Employment by County Employment in the Spokane Area varies by county. The chart below presents 2015 Manufacturing employment in each county as well as past and projected changes in employment. Key findings from this analysis are below. Over 60% of Manufacturing employment occurs in Spokane County, which accounts for nearly 16,000 Manufacturing jobs. Kootenai County has the second highest Manufacturing employment in the region, with 5,200 jobs, or 20% of regional Manufacturing employment. While regionally, the Manufacturing industry had slow employment growth between 2005 and 2015, the industry declined in Spokane County. Manufacturing employment contracted by 10% in the county, shedding over 1,700 jobs. However, the industry is expected to add over 2,200 jobs in the county over the next 10 years, an increase of 14%. The Manufacturing industry grew at the fastest rate in Ferry County, which added over 200 jobs between 2005 and Manufacturing employment in this county is projected to continue to grow over the next 10 years, expanding by another nearly 120%. In terms of absolute growth, Whitman County added the most Manufacturing jobs, increasing employment by over 1,700 jobs. Employment in the industry is projected to continue to grow over the next 10 years, expanding employment by another 48%. 51
53 Employment by Age of Worker The age of workers employed in an industry can factor significantly in demand for new workers. As older workers retire from the workforce, they will need to be replaced by younger workers with the skills and experience to meet employer needs. As the baby boomer generation retires from the workforce, finding the workers to fill vacant positions can present a challenge to employers. The age of workers in the Spokane Area s Manufacturing were compared to the age of Manufacturing workers in Washington and Idaho States and the US. Key findings from this analysis are below. Overall, the Manufacturing employment in the Spokane area is less concentrated in older age cohorts than the industry in Washington and Idaho State and the US. Conversely, a larger portion of Manufacturing workers in the Spokane Area are between the ages of 19 and 34. Manufacturing employment in the three geographies is most concentrated in the age cohort. This group represents between 26% to 28% of all workers in the Manufacturing industry. Compared to Washington and Idaho States and the nation, the Manufacturing employment in the Spokane Area is less concentrated in this age cohort. 52
54 Economic Impact To understand the impact the Manufacturing industry has on the region s economy, the direct, indirect, and induced effects of the industry were analyzed. Key Findings: For every job in the Manufacturing industry, another 1.17 jobs are created throughout the region. 2 The total employment impact of the Manufacturing industry is 56,200 jobs, including nearly 26,000 direct jobs and over 30,000 indirect and induced jobs. For every direct dollar of business revenue generated in the Manufacturing industry, another 0.40 dollars are generated throughout the region s economy. The nearly $8 billion of Manufacturing revenues generated in the Spokane Region grew to over $11 billion of business revenues as the funds circulated through the regional economy. For every $1 of direct labor, another 78 cents of earnings cycle through the economy. The nearly $1.6 billion of Manufacturing labor income generates another $1.24 billion of indirect and induced earnings, for a total earnings impact of $2.8 billion in the Spokane Region. Key Definitions: Economic Impact, Manufacturing - Spokane Area Employment Business Revenues Labor Income Direct Impact 25,942 $7,999,772,963 $1,596,103,053 Indirect Impact 9,534 $1,201,872,430 $433,177,420 Induced Impact 20,785 $1,961,733,255 $807,549,239 Total Impact 56,261 $11,163,378,648 $2,836,829,711 Source: EMSI *Includes "Extended Proprietor" jobs and income, which is not included in other portions of the industry analysis Economic Multipliers, Manufacturing - Spokane Area Total Employment Business Labor Per Million $ Revenues Income of Direct Revenues Economic Multiplier Source: EMSI Direct Impact: represents employment, purchases, and earnings in the Manufacturing industry Indirect Impact: represents the economic impacts of suppliers to the Manufacturing industry in terms of employment, business revenues, and labor income. For example, in order to supply the Manufacturing 2 Included in these job counts are self-employed workers, as well as extended proprietors for whom these jobs are not their primary source of income but still represent Manufacturing and other economic activity. This could include, for example, those who do freelance work on the side. 53
55 industry with a product, a business may have to hire workers, pay wages, and purchase inputs from other suppliers. Induced Impact: represents the economic impact of Manufacturing workers as they spend their earnings in the local economy Economic Multiplier: represents the total change per change in industry (job, dollar of earnings, dollar of business revenues). For example, an employment multiplier of 3 means that for every new job in an industry, an additional 2 jobs are created elsewhere in the economy. 54
56 Manufacturing Occupations in the Manufacturing industry are primarily comprised of four main occupational groups: Production Occupations; Installation, Maintenance, and Repair Occupations; Architecture and Engineering Occupations; and Management and Business and Financial Operations Occupations. The Production Occupation group is the largest occupational group in the Manufacturing industry, representing over 13,000 jobs. This report analyzes the occupations that make up the Manufacturing industry, including current and projected employment, the expected number of annual openings over the coming years, the educational requirements of the occupation, and the number of relevant degrees awarded in the region. Key statistics about each occupational group are presented in the following sections: Key Occupations: an overview of 5 occupations that have a high number of openings and a high proportion of workers with some postsecondary education Overview: including the current and projected number of jobs in the Manufacturing industry and median hourly earnings for each occupation Projected Annual Openings: the number of annual openings in each occupation, broken down by new and replacement demand Labor Supply and Demand Analysis: the number of openings in occupation are compared to the number of related program completions, to produce a completions-to-openings ratio, and the typical level of education required to enter the field Key Findings According to the Bureau of Labor Statistics, most production occupations require only a postsecondary non-degree award (generally, a certificate) or less to enter the occupation. The median wage for occupations with this level of educational requirement in the Spokane Area is $ However, in the Manufacturing industry, over 5,000 jobs with a similar level of education exceed this wage. Manufacturing occupations in the region were connected to related educational programs using the National Center for Education Statistics (NCES) SOC to CIP Crosswalk. Based on this analysis, the Spokane Area does not offer programs for several of the larger Manufacturing occupations. This may be due in part to the needs of employers in the region, who may not require a formal credential to qualify for a position or who may prefer work experience or on-the-job training to formal education. However, many of these occupations have a significant portion of workers with some postsecondary education. This will be investigated further in the Key Occupations and Labor Supply and Demand Analysis sections. Sources: Economic Modeling Specialists, Intl. (EMSI): current employment, projections, wages, openings, and completions data. Bureau of Labor Statistics (BLS): typical entry-level education requirements (national) and the breakdown of occupations by level of education (national) 55
57 First Line Supervisors of Production and Operating Workers Definition: Directly supervise and coordinate the activities of production and operating workers, such as inspectors, precision workers, machine setters and operators, assemblers, fabricators, and plant and system operators. (Source: O*NET) Typical Job Titles: Assembly Supervisor, Department Manager, Manufacturing Supervisor, Molding Supervisor, Plant Manager, Production Manager, Production Supervisor, Shift Supervisor, Supervisor, Team Leader (Source: O*NET) Key Statistics: First Line Supervisors of Production and Operating Workers 2012/ Annual Median Hourly Annual Related % of Workers with % of Workers Age Manufacturing Openings Wages Completions Postsecondary 55 and older Employment (All Industries) Education* 1,033 $ % 23% *Nationally, includes Post-secondary non-degree awards, Associate's, Bachelor's and above First Line Supervisors of Production and Operation Workers is one of the largest Production Occupation groups in the Manufacturing industry, with over 1,000 jobs. The occupation is projected to grow by 17% over the next 10 years, adding over 170 jobs. Over the next 10 years, this occupational group is expected to have over 40 openings annually, with most of those openings in the Manufacturing industry. Openings are expected to be created equally from new and replacement demand. 23% of workers in this occupational group are aged 55 and older. While this may present an opportunity for new workers to enter the field, employers may face a challenge replacing retirees with equally skilled and experienced new workers. With median wages of nearly $24 per hour, this occupational group has higher wages than Spokane Area overall and has one of the highest median wages of all Production occupations. According to the BLS, a postsecondary non-degree award is typically required to enter this occupation, however, nationally, over half of workers in this industry have some kind of postsecondary degree, one of the highest portions of degreed workers in the Production Occupations group. In the Spokane Area, there are nearly 140 completions annually at Washington State University in the Operations Management and Supervision program, which is associated with this occupation. However, several other occupations are also associated with this program, some of which have higher wages than those offered by the First Line Supervisors occupation. For this reason, just 27 of the 137 related completions are assumed to enter this occupation, for a Completions-to-Openings ratio of This means that for every 10 openings, there are 6.5 workers graduating with a related degree. However, some employers may accept applicants without formal credentials for these positions. 56
58 Machinists Definition: Set up and operate a variety of machine tools to produce precision parts and instruments. Includes precision instrument makers who fabricate, modify, or repair mechanical instruments. May also fabricate and modify parts to make or repair machine tools or maintain industrial machines, applying knowledge of mechanics, mathematics, metal properties, layout, and machining procedures. (Source: O*NET) Typical Job Titles: Gear Machinist, Journeyman Machinist, Machine Operator, Machine Repair Person, Machinist, Maintenance Machinist, Maintenance Specialist, Production Machinist, Set-Up Machinist, Tool Room Machinist (Source: O*NET) Key Statistics: Machinists 2012/ Annual Median Hourly Annual Related % of Workers with % of Workers Age Manufacturing Openings Wages Completions Postsecondary 55 and older Employment (All Industries) Education* 799 $ % 25% *Nationally, includes Post-secondary non-degree awards, Associate's, Bachelor's and above The Machinists occupational group is the third largest in the Manufacturing industry, representing nearly 800 jobs in The occupational group is expected to grow by nearly 250 jobs over the next ten years, an increase of over 30%. This is the second largest increase in jobs of all Manufacturing occupations. Over the next ten years, the Machinist occupational group is expected to have over 50 openings annually, with most of those openings in the Manufacturing industry. Job openings in this occupation are created almost evenly by new demand and replacement demand. A quarter of workers in this industry group are age 55 and older. These workers may be planning to retire over the next decade, resulting in a large number of vacancies in the occupation that employers may struggle to fill. Median wages for this occupation are over $17 per hour, $2 below the median wage for all Spokane Area workers but higher than the median for occupations that typically require less than a 2 year degree. According to the BLS, the Machinist occupation typically requires a high school diploma to enter the field and long-term on-the-job training. However, nationally, 43% of workers in the Machinist occupation have some postsecondary education. In 2014, there were nearly 40 certificates awarded in the Machine Tool Technology/Machinist course at Spokane Community College and North Idaho College. As graduates of this program may go into multiple occupations, 21 of these graduates are assumed to enter the Machinist occupation, leading to a Completions-to-Openings Ratio of 0.37, or nearly 4 graduates for every 10 openings. However, some employers may be hiring workers qualified for this occupation through work experience or on-the-job training and may not require a specialized credential. 57
59 Inspectors, Testers, Sorters, Samplers, and Weighers Definition: Inspect, test, sort, sample, or weigh nonagricultural raw materials or processed, machined, fabricated, or assembled parts or products for defects, wear, and deviations from specifications. May use precision measuring instruments and complex test equipment. (Source: O*NET) Typical Job Titles: Inspector, Picker / Packer, Quality Assurance Auditor, Quality Assurance Inspector, Quality Assurance Technician, Quality Auditor, Quality Control Inspector, Quality Control Technician, Quality Inspector, Quality Technician (Source: O*NET) Key Statistics: Inspectors, Testers, Sorters, Samplers, and Weighers 2012/ Annual Median Hourly Annual Related % of Workers with % of Workers Age Manufacturing Openings Wages Completions Postsecondary 55 and older Employment (All Industries) Education* 479 $ % 25% *Nationally, includes Post-secondary non-degree awards, Associate's, Bachelor's and above In 2015, the Inspectors, Testers, Sorters, Samplers, and Weighers occupation accounts for nearly 500 jobs in the Manufacturing industry and over 700 jobs overall in the Spokane Area. The number of jobs in this occupation is expected to grow by over 30% over the next 10 years in the Manufacturing industry alone, increasing by 150 jobs. Over the next 10 years, nearly 40 openings are expected in this occupation annually, with approximately 27 in the Manufacturing industry. Of these openings, 55% are being created by new demand and 45% by replacement demand. This occupational group may experience a wave of retirements over the next 10 years. In 2015, 1 in 4 workers in this occupational group were aged 55 and older. Median hourly earnings are $19 for this occupation. This is similar to the overall median hourly wage for all jobs in the Spokane Area and nearly $4 higher than the median for occupations that typically require a postsecondary non-degree award or less. According to the BLS, this occupation typically requires only a high school diploma, however, over half of workers in this field nationally have some postsecondary education. At this point, there are no programs in the Spokane Area producing graduates related to this occupation. However, some employers may be hiring workers qualified for this occupation through work experience or on-the-job training and may not require a specialized credential. 58
60 Industrial Machinery Mechanics Definition: Repair, install, adjust, or maintain industrial production and processing machinery or refinery and pipeline distribution systems. (Source: O*NET) Typical Job Titles: Fixer, Industrial Machinery Mechanic, Industrial Mechanic, Loom Fixer, Machine Adjuster, Maintenance Mechanic, Maintenance Technician, Master Mechanic, Mechanic, Overhauler (Source: O*NET) Key Statistics: Industrial Machinery Mechanics 2012/ Annual Median Hourly Annual Related % of Workers with % of Workers Age Manufacturing Openings Wages Completions Postsecondary 55 and older Employment (All Industries) Education* 463 $ % 26% *Nationally, includes Post-secondary non-degree awards, Associate's, Bachelor's and above The Industrial Machinery Mechanics occupation includes nearly 900 jobs in the Spokane Area, including over 460 jobs in the Manufacturing industry. In the Manufacturing industry alone, the occupation is expected to increase by over 130 jobs, growing by 29%. Nearly 60 openings in this occupation are expected annually over the coming years; approximately 29 of which are estimated to be in the Manufacturing industry. Of these openings, 54% are being created by replacement demand. The median wage for this occupation is $21.70, over $2 more than the region s overall median wage and significantly higher than the median wage for jobs that typically require a postsecondary non-degree award or less. Over a quarter of workers in the Industrial Machinery Mechanics occupational group are age 55 or older. These workers may be planning to retire over the next decade, resulting in vacancies in the occupation. According to the BLS, the Industrial Machinery Mechanics occupation typically requires a high school diploma. However, nearly half of workers in the occupation have some postsecondary education. In the Spokane Area, 14 degrees are awarded annually in the Industrial Mechanics and Maintenance Technology program at North Idaho College and Spokane Community College, a program related to this occupation. Due to competition for these graduates, 7 could be allocated to the Industrial Machinery Mechanics occupation, for a Completions-to-Openings ratio of This means that for every 10 openings, there is 1 worker graduating with a related degree. However, some employers may accept applicants without formal credentials for these positions. 59
61 Computer-Controlled Machine Tool Operators, Metal and Plastic Definition: Operate computer-controlled machines or robots to perform one or more machine functions on metal or plastic work pieces. Typical Job Titles: Brake Press Operator; Computer Numerical Control Lathe Operator (CNC Lathe Operator); Computer Numerical Control Machine Operator (CNC Machine Operator); Computer Numerical Control Machinist (CNC Machinist); Computer Numerical Control Mill Operator (CNC Mill Operator); Computer Numerical Control Operator (CNC Operator); Computer Numerical Control Set-Up and Operator (CNC Set-Up and Operator); Machine Operator; Machine Set-Up, Operator; Machinist Key Statistics: Computer-Controlled Machine Tool Operators, Metal and Plastic 2012/ Annual Median Hourly Annual Related % of Workers with % of Workers Age Manufacturing Openings Wages Completions Postsecondary 55 and older Employment (All Industries) Education* 352 $ % 17% *Nationally, includes Post-secondary non-degree awards, Associate's, Bachelor's and above In 2015, the Computer-Controlled Machine Tool Operators occupation group accounted for over 350 jobs in the Manufacturing industry. This number is expected to increase by over 140 jobs by 2025, an increase of 40%. This is one of the highest rates of growth in the Manufacturing industry. Over the next 10 years, nearly 30 openings are expected in this occupation annually, with 54% of these openings created by new demand. Relative to other Manufacturing occupational groups, the Computer-Controlled Machine Tool Operators (Metal and Plastic) occupational group is relatively young. Just 17% of workers in this field are nearing retirement. Median hourly earnings in this occupation are over $18. This is slightly below the overall median hourly earnings for the Spokane Area but approximately $3 higher than the median for jobs that typically require a postsecondary non-degree award or less. According to the BLS, this occupation typically requires only a high school diploma. However, over half of workers in this occupation nationally have some postsecondary education. At this point, there are no programs in the Spokane Area producing graduates related to this occupation but employers may accept applicants without formal credentials for these positions. 60
62 Manufacturing Occupation Overview Selection Criteria for Occupations Included: At least 100 jobs in the Manufacturing industry At least 5 openings annually Employment growth projected over the next 10 years Data Included: 2015 Percent of in the Manufacturing Industry 2015 to 2025 Change (absolute change and percent change) Median Hourly Earnings Key Findings: The largest Manufacturing Production occupation is Team Assemblers. This occupational group accounts for over 1,600 jobs in the Manufacturing industry. The occupational group is expected to add over 250 jobs over the next 10 years, a 15% increase in employment. The second largest occupational group is First Line Supervisors of Production and Operating Workers and is expected to add over 170 jobs by 2025, increasing by 17%. This occupation also has the median hourly wages of nearly $24, the second highest of Production Occupations analyzed. Computer-Controlled Machine Tool Operators are projected to have one of the highest rates of growth over the next 10 years, increasing by over 140 jobs, or 40%. This occupational group is closely associated with advanced manufacturing and shifts to automated manufacturing practices. 61
63 Production Occupations Overview: Manufacturing Production Occupations SOC % of in Median Hourly # % Manufacturing Earnings Mfg. Change Change Industry (All Industries) First-Line Supervisors of Production and Operating Workers 1,033 73% % $23.94 Aircraft Structure, Surfaces, Rigging, and Systems Assemblers % 32 19% $ Coil Winders, Tapers, and Finishers % 57 41% $ Electrical and Electronic Equipment Assemblers % % $ Structural Metal Fabricators and Fitters % 53 38% $ Team Assemblers 1,666 76% % $ Assemblers and Fabricators, All Other % 36 24% $11.21 Computer-Controlled Machine Tool Operators, Metal and Plastic % % $18.16 Cutting, Punching, and Press Machine Setters, Operators, and Tenders, Metal and Plastic % 43 8% $14.10 Grinding, Lapping, Polishing, and Buffing Machine Tool Setters, Operators, and Tenders, Metal and Plastic % 26 10% $ Machinists % % $17.09 Molding, Coremaking, and Casting Machine Setters, Operators, and Tenders, Metal and Plastic % 26 9% $16.33 Multiple Machine Tool Setters, Operators, and Tenders, Metal and Plastic % 25 11% $ Welders, Cutters, Solderers, and Brazers % % $ Sewing Machine Operators % 36 14% $ Cabinetmakers and Bench Carpenters % 60 15% $16.14 Woodworking Machine Setters, Operators, and Tenders, Except Sawing % 34 15% $13.85 Separating, Filtering, Clarifying, Precipitating, and Still Machine Setters, Operators, and Tenders % 17 14% $ Inspectors, Testers, Sorters, Samplers, and Weighers % % $ Packaging and Filling Machine Operators and Tenders % 50 16% $12.27 Coating, Painting, and Spraying Machine Setters, Operators, and Tenders % 57 15% $ Helpers--Production Workers % 91 27% $ Production Workers, All Other % 34 23% $13.78 Bold designates occupations that added the most jobs in the Manufacturing industry 62
64 Installation, Maintenance, and Repair Operations Overview: Installation, Maintenance, and Repair Occupations SOC % of in Median Hourly # % Manufacturing Earnings Mfg. Change Change Industry (All Industries) First-Line Supervisors of Mechanics, Installers, and Repairers % 18 16% $ Industrial Machinery Mechanics % % $ Maintenance and Repair Workers, General % 72 18% $17.47 Architecture & Engineering Occupations Overview: Architecture & Engineering Occupations SOC % of in 2015 Manufacturing Mfg. Industry # Change % Change Median Hourly Earnings (All Industries) Electrical Engineers % 55 27% $ Industrial Engineers % 75 31% $ Mechanical Engineers % 72 25% $ Electrical and Electronics Engineering Technicians % 29 23% $30.56 Management and Business & Financial Operations Occupations Overview: Management and Business & Financial Operations Occupations SOC % of in Median Hourly # % Manufacturing Earnings Mfg. Change Change Industry (All Industries) Industrial Production Managers % 53 23% $ Architectural and Engineering Managers % 29 26% $ General and Operations Managers % 90 21% $38.12 Purchasing Agents, Except Wholesale, Retail, and Farm Products % 39 17% $ Accountants and Auditors 150 6% 32 21% $
65 Projected Annual Openings Selection Criteria for Occupations Included: At least 100 jobs in the Manufacturing industry At least 5 openings annually Employment growth projected over the next 10 years Data Included: Annual Openings (All Industries): represents the average number of job openings over the next 10 years due to retirements/turnover (replacement demand) and economic growth (new demand) Estimated Annual Openings (Manufacturing): of the annual openings, the number estimated to be in the Manufacturing industry. The number of openings is only provided for an occupation, but not the portion of the occupation in a certain industry. To estimate the number of openings specifically in the Manufacturing industry, Camoin Associates assessed the number of new jobs expected in the Manufacturing industry over the next 10 years and the portion of Manufacturing jobs in the occupation overall. New Demand: job openings in an occupation created by new jobs being added to an occupation/industry Replacement Demand: jobs openings in an occupation created by workers retiring or other turnover 64
66 Production Occupations Projected Annual Openings: Manufacturing Production Occupations SOC Annual Openings (All Industries) Est. Annual Openings (Manufacturing) Estimated % New Demand % Replacement Demand First-Line Supervisors of Production and Operating Workers % 49% Aircraft Structure, Surfaces, Rigging, and Systems Assemblers % 48% Coil Winders, Tapers, and Finishers % 26% Electrical and Electronic Equipment Assemblers % 38% Structural Metal Fabricators and Fitters % 56% Team Assemblers % 54% Assemblers and Fabricators, All Other % 44% Computer-Controlled Machine Tool Operators, Metal and Plastic % 46% Cutting, Punching, and Press Machine Setters, Operators, and Tenders, Metal and Plastic % 55% Grinding, Lapping, Polishing, and Buffing Machine Tool Setters, Operators, and Tenders, Metal and Plastic % 70% Machinists % 47% Molding, Coremaking, and Casting Machine Setters, Operators, and Tenders, Metal and Plastic % 59% Multiple Machine Tool Setters, Operators, and Tenders, Metal and Plastic % 64% Welders, Cutters, Solderers, and Brazers % 51% Sewing Machine Operators % 45% Cabinetmakers and Bench Carpenters % 54% Woodworking Machine Setters, Operators, and Tenders, Except Sawing % 43% Separating, Filtering, Clarifying, Precipitating, and Still Machine Setters, Operators, and Tenders % 73% Inspectors, Testers, Sorters, Samplers, and Weighers % 45% Packaging and Filling Machine Operators and Tenders % 61% Coating, Painting, and Spraying Machine Setters, Operators, and Tenders % 57% Helpers--Production Workers % 42% Production Workers, All Other % 57% Bold designates occupations with the highest number of Manufacturing Annual Openings 65
67 Installation, Maintenance, and Repair Operations Projected Annual Openings: Installation, Maintenance, and Repair Occupations SOC Annual Openings (All Industries) Est. Annual Openings (Manufacturing) % New Demand % Replacement Demand First-Line Supervisors of Mechanics, Installers, and Repairers % 64% Industrial Machinery Mechanics % 54% Maintenance and Repair Workers, General % 53% Architecture & Engineering Occupations Projected Annual Openings: Architecture & Engineering Occupations SOC Annual Openings (All Industries) Est. Annual Openings (Manufacturing) % New Demand % Replacement Demand Electrical Engineers % 48% Industrial Engineers % 53% Mechanical Engineers % 61% Electrical and Electronics Engineering Technicians % 50% Management and Business & Financial Operations Occupations Projected Annual Openings: Management and Business & Financial Operations Occupations SOC Annual Openings (All Industries) Est. Annual Openings (Manufacturing) % New Demand % Replacement Demand Industrial Production Managers % 47% Architectural and Engineering Managers % 51% General and Operations Managers % 49% Purchasing Agents, Except Wholesale, Retail, and Farm Products % 53% Accountants and Auditors % 61% 66
68 Labor Supply and Demand Analysis Selection Criteria for Occupations Included: At least 100 jobs in the Manufacturing industry At least 5 openings annually Employment growth projected over the next 10 years Data Included: Annual Openings (All Industries): represents the average number of job openings over the next 10 years due to retirements/turnover (replacement demand) and economic growth (new demand) Annual Related Completions: represents all degrees awarded in educational programs that could funnel workers into the occupation Completions Allocated to Occupation: as most educational programs prepare graduates for multiple occupations, this statistic assesses the number of graduates that would be expected to enter a specific occupational field, based on the amount of competition for those graduates from other occupational groups. Completions to Openings Ratio: compares the number of completions allocated to occupation to the number of annual openings. A ratio of 1 would signify that there are exactly the same number of graduates as openings. If the ratio is less than 1, there are fewer educational awards than the number of annual openings while a ratio greater than 1 would mean there are more educational awards than openings. Typical Level of Education Required: determined by the Bureau of Labor Statistics (BLS), this represents the level of education typically required nationally to enter an occupational field. This may vary widely based on the industry and location. Percent of Workers with Postsecondary Education: determined by the Bureau of Labor Statistics, this number represents the proportion of workers in the occupational group that have some college, a postsecondary non-degree award, an Associate s degree, Bachelor s degree, or more advanced level of education. Key Findings: While many production occupations do not have degrees being awarded in related programs, it is possible that employers do not require a formal educational credential or prefer work experience or on-the-job training to train employees. However, in some Production Occupations, nearly half of workers have some postsecondary education nationally, which many signify that employers are more and more frequently requiring advanced education to qualify for these positions and new programs may need to be developed in the Spokane Area to keep up with this demand. For non-production Occupations, there are typically a much higher number of educational awards than openings in the Spokane Area. This is largely due to the higher educational requirements of these occupations (typically a Bachelor s degree or higher) and the presence of large, four year universities in the region. However, many of the graduates of these institutions may be planning to leave the region after graduation and therefore, may not be filling local openings. 67
69 Production Occupations Labor Supply and Demand Analysis: Manufacturing Production Occupations SOC First-Line Supervisors of Production and Operating Workers Aircraft Structure, Surfaces, Rigging, and Systems Assemblers Annual Openings (All Industries) Annual Related Completions Completions Allocated to Occupation Completions to Openings Ratio Typical Level of Education Required % of Workers with Postsecondary Education Postsecondary non-degree award 52% High school diploma or equivalent 50% Coil Winders, Tapers, and Finishers High school diploma or equivalent 37% Electrical and Electronic Equipment Assemblers High school diploma or equivalent 37% Structural Metal Fabricators and Fitters High school diploma or equivalent 38% Team Assemblers High school diploma or equivalent 35% Assemblers and Fabricators, All Other High school diploma or equivalent 35% Computer-Controlled Machine Tool Operators, Metal and Plastic Cutting, Punching, and Press Machine Setters, Operators, and Tenders, Metal and Plastic Grinding, Lapping, Polishing, and Buffing Machine Tool Setters, Operators, and Tenders, Metal and Plastic High school diploma or equivalent 51% High school diploma or equivalent 28% High school diploma or equivalent 28% Machinists High school diploma or equivalent 43% Molding, Coremaking, and Casting Machine Setters, Operators, and Tenders, Metal and Plastic Multiple Machine Tool Setters, Operators, and Tenders, Metal and Plastic High school diploma or equivalent 33% High school diploma or equivalent 30% Welders, Cutters, Solderers, and Brazers High school diploma or equivalent 31% Sewing Machine Operators Less than high school 20% Cabinetmakers and Bench Carpenters High school diploma or equivalent 33% Woodworking Machine Setters, Operators, and Tenders, Except Sawing Separating, Filtering, Clarifying, Precipitating, and Still Machine Setters, Operators, and Tenders High school diploma or equivalent 27% High school diploma or equivalent 58% Inspectors, Testers, Sorters, Samplers, and Weighers High school diploma or equivalent 54% Packaging and Filling Machine Operators and Tenders High school diploma or equivalent 23% Coating, Painting, and Spraying Machine Setters, Operators, and Tenders High school diploma or equivalent 31% Helpers--Production Workers Less than high school 28% Production Workers, All Other High school diploma or equivalent 33% 68
70 Installation, Maintenance, and Repair Operations Labor Supply and Demand Analysis: Installation, Maintenance, and Repair Occupations SOC % of Workers Completions Annual Openings Annual Related Completions to with Allocated to Typical Level of Education Required (All Industries) Completions Openings Ratio Postsecondary Occupation Education First-Line Supervisors of Mechanics, Installers, and Repairers High school diploma or equivalent 58% Industrial Machinery Mechanics High school diploma or equivalent 48% Maintenance and Repair Workers, General High school diploma or equivalent 45% Architecture & Engineering Occupations Labor Supply and Demand Analysis: Architecture & Engineering Occupations SOC Annual Openings (All Industries) Annual Related Completions Completions Allocated to Occupation Completions to Openings Ratio Typical Level of Education Required % of Workers with Postsecondary Education Electrical Engineers Bachelor's degree 97% Industrial Engineers Bachelor's degree 94% Mechanical Engineers Bachelor's degree 96% Electrical and Electronics Engineering Technicians Associate's degree 73% Management and Business & Financial Operations Occupations Labor Supply and Demand Analysis: Management and Business & Financial Operations Occupations SOC Annual Openings (All Industries) Annual Related Completions Completions Allocated to Occupation Completions to Openings Ratio Typical Level of Education Required % of Workers with Postsecondary Education Industrial Production Managers Bachelor's degree 78% Architectural and Engineering Managers Bachelor's degree 96% General and Operations Managers Bachelor's degree 83% Purchasing Agents, Except Wholesale, Retail, and Farm Products High school diploma or equivalent 80% Accountants and Auditors Bachelor's degree 96% 69
71 Professional, Scientific, and Technical Services Industry Workforce Roadmap 70
72 Past and Projected Changes in Employment In the chart below, past and projected changes in the Professional, Scientific, and Technical (PST) Services industry were analyzed and compared to the Washington and Idaho States and the nation. Changes in the PST Services industry were also compared to employment trends in the Spokane Area economy overall. Key Findings: Between 2005 and 2015, employment in the PST Services industry grew more rapidly than employment in the Spokane Area economy overall. This rapid growth is expected to continue over the next 10 years, with the PST Services industry increasing employment by 17% while overall regional employment grows by 12%. Pre-recession employment peaked in 2008, with over 14,880 jobs in the PST Services industry. By 2010, the industry reached its employment low of just under 14,000 workers, a decline of 6% from Since 2010, employment has recovered rapidly, although not steadily. By 2015, employment in the Spokane Area PST Services industry exceeded the pre-recession peak by over 1,000 jobs. During the recent recession, employment in the PST Services industry in the Spokane Area declined more steeply and had a less consistent recovery than the industry in the US and Washington and Idaho States. Overall, the PST Services industry in the Spokane Area outpaced industry growth in the US and slightly lagged growth in Washington and Idaho States between 2005 and Between 2015 and 2025, the industry is expected to continue to grow at a high rate in the three geographies. In the Spokane Area, the industry is projected to add over 3,000 jobs, expanding employment by 17%. This growth rate is slightly lower than projected growth in Washington and Idaho States and the nation. 71
73 Industry Overview Key findings about the Professional, Scientific, and Technical (PST) Services industry are below. A detailed table presenting key data about the industry in the Spokane Area is on the following page. In 2015, employment in the PST Services industry reached nearly 16,000 jobs. This accounted for 4.5% of all employment in the Spokane Area. The PST Services industry in the region has a broad base of employment. The largest sector, Computer Systems Design and Related Services, accounts for nearly 2,900 jobs, or 18% of industry employment. The PST Services sectors with the highest 2015 employment were the Computer Systems Design and Related; Accounting, Tax Preparation, Bookkeeping, and Payroll; Architectural, Engineering, and Related; Legal; and Management, Scientific, and Technical Consulting Services sectors. Employment in these sectors ranged from 2,880 to 2,000 jobs. Earnings per Worker Average earnings per worker in the PST Services industry is 20% higher than the overall average in the Spokane Area. Average earnings per PST Services worker are nearly 38% lower in the Spokane Area than in the nation overall. The average earnings per worker in the Spokane Area are 32% lower than earnings in Washington and Idaho States. At $85,000, the Computer Systems Design and Related Services sector has the highest average earnings per worker, 47% higher than the average earnings for the PST Services industry overall. This is also the largest sector in the PST Services industry. Conversely, the Specialized Design Services sector has average earnings per worker of $19,000, the lowest average earnings in the industry. This sector represents 2% of PST Services employment. Location Quotient (LQ) With a location quotient of 0.72, employment in the industry is over 25% less concentrated in the Spokane Area than in the US overall. In Washington and Idaho States, employment in the PST Services industry is nearly as concentrated as employment in the nation. The Other Professional, Scientific, and Technical Services sector has a location quotient of 1.08, the highest PST Services location quotient in the Spokane Area. The second most concentrated industry is the Accounting, Tax Preparation, Bookkeeping, and Payroll Services. This is also the second largest sector in the industry. Gross Regional Product (GRP) Overall, the PST Services industry contributes over $1.1 billion to the Gross Regional Product of the Spokane Area. This represents about 4% of the total GRP for the Spokane Area. The average GRP per job in the PST Services industry is just over $70,000. The Computer Systems Design and Related Service sector contributes over $235 million to the region s GRP, 21% of the total PST Services industry GRP. The sector is also the largest PST Services sector in the region. At $89,000, the Legal Services industry has the highest GRP per worker. This is over 25% higher than the overall average GRP per worker for the PST Services industry. 72
74 Professional, Scientific, & Technical Services Industry Overview, 4 Digit NAICS - Spokane Area NAICS Average 2015 Location % of Gross Regional Earnings Per Quotient Cluster Product Worker 5411 Legal Services 2,141 $57, % $191,066, Accounting, Tax Preparation, Bookkeeping, and Payroll Services 2,765 $52, % $159,918, Architectural, Engineering, and Related Services 2,630 $65, % $180,894, Specialized Design Services 393 $18, % $12,536, Computer Systems Design and Related Services 2,883 $85, % $235,117, Management, Scientific, and Technical Consulting Services 2,024 $52, % $125,025, Scientific Research and Development Services 119 $70, % $9,746, Advertising, Public Relations, and Related Services 1,090 $55, % $93,142, Other Professional, Scientific, and Technical Services 1,896 $27, % $112,195, Total (All PST Services) 15,941 $57, % $1,119,643,380 Bold designates 5 largest industries For industries with fewer than 10 workers, analyst assumes 5 workers 73
75 Historic Change in Employment (2005 to 2015) The table below summarizes changes in employment in the Spokane Area, Washington and Idaho States (combined), and the United States. Key findings from this analysis are below. A more detailed table presenting changes at the 4-digit NAICS code level is on the following page. Rows with bold text designate the industries with the highest employment growth between 2005 and PST Services Industry Historic Change Spokane Area WA and ID States United States Change In Employment 24.8% 25.9% 19.0% Key Findings: The PST Services industry grew rapidly between 2005 and 2015, adding over 3,100 jobs, an increase of nearly 25%. This the third highest rate of growth of all industries in the Spokane Area. The PST Services sectors that added the most jobs between 2005 and 2015 were Computer Systems Design and Related; Management, Scientific, and Technical Consulting; Accounting, Tax Preparation, Bookkeeping, and Payroll; Architectural, Engineering, and Related; Other Professional, Scientific, and Technical Services sectors. These sectors added between 1,060 jobs and 195 jobs over this period. The PST Services sectors that shed jobs between 2005 and 2015 were Advertising, Public Relations, and Related; Legal; and Scientific Research and Development Services sectors. While the Scientific Research and Development Services industry lost a significant number of jobs between 2005 and 2011, declining from 143 to 85 jobs, it started recovering some of those losses in In absolute terms, Computer Systems Design and Related Services experienced the most growth, adding over 1,000 jobs, a 58% increase in employment. By 2015, this sector was the largest in the PST Services industry, accounting for nearly 2,900 jobs, or 18% of PST Services employment. This sector also has the highest earnings per worker in the PST Services industry. The Management, Scientific, and Technical Consulting Services sector grew at the fastest rate, adding over 1,000 jobs between 2005 and 2015, doubling employment in the sector. Despite this growth, employment in the sector is still only 57% as concentrated in the Spokane Area as in the US overall. The Accounting, Tax Preparation, Bookkeeping and Payroll Services sector also grew substantially between 2005 and 2015, adding over 600 jobs, an increase of 30%. This is the second largest PST Services sector, with employment slightly more concentrated than employment in the US overall. 74
76 Professional, Scientific, & Technical Services Industry Historic Change, 4 Digit NAICS - Spokane Area NAICS # Change % Change 5411 Legal Services 2,195 2,252 2, % 5412 Accounting, Tax Preparation, Bookkeeping, and Payroll Services 2,127 2,549 2, % 5413 Architectural, Engineering, and Related Services 2,136 2,340 2, % 5414 Specialized Design Services % 5415 Computer Systems Design and Related Services 1,823 2,196 2,883 1,060 58% 5416 Management, Scientific, and Technical Consulting Services 994 1,218 2,024 1, % 5417 Scientific Research and Development Services % 5418 Advertising, Public Relations, and Related Services 1,313 1,139 1, % 5419 Other Professional, Scientific, and Technical Services 1,700 1,895 1, % 54 Total (All PST Services) 12,777 13,985 15,941 3,164 25% Bold designates 5 industries with highest historic employment growth For industries with fewer than 10 workers, analyst assumes 5 workers 75
77 Projected Change in Employment (2015 to 2021) The table below summarizes changes in employment in the Spokane Area, Washington and Idaho States (combined), and the United States. Key findings from this analysis are below. A more detailed table presenting changes at the 4-digit NAICS code level is on the following page. Rows with bold text designate the industries with the highest projected employment growth between 2015 and PST Services Industry Projected Change Spokane Area WA and ID States United States Change In Employment 10.0% 12.8% 12.0% Overall, employment in the PST Services industry is projected to grow by 10%, adding nearly 1,600 jobs between 2015 and Employment growth in the Spokane Area is expected to lag growth in Washington and Idaho States and the US slightly. Growth in the PST Services industry is projected to outpace employment growth in the Spokane Area economy overall. The Computer Systems Design and Related; Management, Scientific, and Technical Consulting; Accounting, Tax Preparation, Bookkeeping, and Payroll; Architectural, Engineering, and Related; and Other Professional, Scientific, and Technical Services sectors are projected to add the most jobs between 2015 and Growth in these sectors is projected to range from 720 to 85 jobs. The Advertising, Public Relations and Related and Scientific Research and Development Services sector are the only PST Services sectors projected to lose jobs over by The Advertising, Public Relations, and Related Services sector is expected to shed 135 jobs while the Scientific Research and Development Services sector is projected to lose 21 jobs. These sectors also lost employment between 2005 and The Computer Systems Design and Related Services sector is projected to add the most jobs between 2015 and 2021, increasing employment by over 700 jobs, or 25%. This sector also added the most jobs between 2005 and The Management, Scientific, and Technical Consulting Services sector, which doubled employment between 2005 and 2015, is expected to continue to grow at a high rate. Between 2015 and 2021, the sector is projected to add nearly 500 more jobs, expanding employment by 24%. Employment growth in the Accounting, Tax Preparation, Bookkeeping, and Payroll Services sector is projected to continue, but at a lower rate than the growth experienced between 2005 and Between 2015 and 2021, the sector is expected to grow by over 200 jobs, expanding employment by 8%. Between 2005 and 2015, the sector added nearly 640 jobs, increasing employment by 30%. 76
78 Professional, Scientific, & Technical Services Industry Projected Change, 4 Digit NAICS - Spokane Area NAICS # Change % Change 5411 Legal Services 2,141 2,129 2, % 5412 Accounting, Tax Preparation, Bookkeeping, and Payroll Services 2,765 2,888 2, % 5413 Architectural, Engineering, and Related Services 2,630 2,696 2, % 5414 Specialized Design Services % 5415 Computer Systems Design and Related Services 2,883 3,286 3, % 5416 Management, Scientific, and Technical Consulting Services 2,024 2,295 2, % 5417 Scientific Research and Development Services % 5418 Advertising, Public Relations, and Related Services 1, % 5419 Other Professional, Scientific, and Technical Services 1,896 1,935 1, % 54 Total (All PST Services) 15,941 16,746 17,531 1,590 10% Bold designates 5 industries with highest projected employment growth For industries with fewer than 10 workers, analyst assumes 5 workers 77
79 Competitiveness Analysis Shift share analysis distinguishes an industry s employment growth in a specific area that is attributable to local competitive advantages from growth that is attributable to national employment trends or overall industry employment trends. The shift share analysis helps to answer the question of Why is employment growing or declining in this industry? Is it simply related to the industry growing nationally or are we more competitive regionally? To do this, shift share analysis splits regional job growth into three components: the national growth effect, industrial mix effect, and regional competitive effect. A shift share analysis is based on four factors: The Industrial Mix Effect The industrial mix effect represents the share of regional industry growth explained by the growth of the specific industry at the national level. To arrive at this number, the national growth rate of the total economy is subtracted from the national growth rate of the specific industry, and this growth percentage is applied to the regional jobs in that industry. The National Growth Effect The national growth effect explains how much of the regional industry s growth is explained by the overall growth of the national economy: if the nation s economy overall is growing, you would generally expect to see some positive change in each industry in your local region (the proverbial rising tide that lifts all boats ). The Expected Change This is simply the rate of growth of the particular industry at the national level. The expected change is the sum of the industrial mix and the national growth effects. The Regional Competitive Effect The regional competitive effect is the most vital in the shift share analysis. It explains how much of the change in a given industry is due to some unique competitive advantage that the region possesses, because the growth cannot be explained by national trends in that industry or the economy as whole. This effect is calculated by taking the total regional growth of the given industry and subtracting the national growth for that same industry. Note that this effect can be positive even as regional employment in the industry declines. This would indicate that regional decline is less than the national decline. Key findings from the Competiveness Analysis are below. A detailed supporting table at the 4-digit NAICS code level is presented on the following page. Employment in the PST Services industry grew at a high rate in the US, outpacing overall employment growth in the nation between 2005 and Based on these national industry trends, the PST Services industry in the Spokane Area was expected to add 2,400 jobs. However, regionally, the industry added over added over 3,100 jobs, increasing employment by 25%. Of these 3,100 jobs, over 700 can be attributed to the competitiveness of the industry locally. The PST Services sectors with the highest competitive effect in the Spokane Area were Management, Scientific, and Technical Consulting; Architectural, Engineering, and Related; and Accounting, Tax Preparation, Bookkeeping and Payroll Services sectors. The sectors that were less competitive than the nation in terms of employment growth (meaning they either lost jobs at a higher rate or added jobs at a lower rate than would have been expected based on national industry trends) were Advertising, Public Relations, and Related; Other Professional, Scientific, and Technical; and Scientific Research and Development Services sectors. 78
80 Professional, Scientific, & Technical Services Industry Competitiveness Analysis ( ), 4 Digit NAICS - Spokane Area NAICS Ind. Mix Effect Nat'l Growth Effect Expected Change Competitive 5411 Legal Services Accounting, Tax Preparation, Bookkeeping, and Payroll Services Effect Architectural, Engineering, and Related Services Specialized Design Services Computer Systems Design and Related Services Management, Scientific, and Technical Consulting Services Scientific Research and Development Services Advertising, Public Relations, and Related Services Other Professional, Scientific, and Technical Services Total (All PST Services) 1, , Bold designates industries with highest competitive effect For industries with fewer than 10 workers, analyst assumes 5 workers 79
81 Employment by County Employment in the Spokane Area varies by county. The chart below presents 2015 PST Services employment in each county as well as past and projected changes in employment. Key findings from this analysis are below. 75% of PST Services employment occurs in Spokane County, which accounts for over 12,000 PST Services jobs. Kootenai County has the second highest PST Services employment in the region, with 2,800 jobs, or nearly 18% of regional PST Services employment. Between 2005 and 2015, employment in the PST Services industry grew in all Spokane Area counties except Ferry County, where the industry contracted slightly. The industry is projected to add jobs in all 7 counties. The PST Services industry in Spokane County added the most jobs between 2005 and 2015, increasing employment by 2,700 jobs, or 29%. This growth is projected to continue through 2025, with nearly 2,200 more jobs expected to be added in the county. Pend Oreille County grew at the highest rate, increasing PST Services employment by 32 jobs, or 46%. The PST Services industry in the county is expected to add another 23 jobs by In Kootenai County, the industry is expected to grow at a higher rate between 2015 and 2025 than it did between 2005 and 2015, even as regional growth in the industry slows over this period. 80

82 Employment by Age of Worker The age of workers employed in an industry can factor significantly in demand for new workers. As older workers retire from the workforce, they will need to be replaced by younger workers with the skills and experience to meet employer needs. As the baby boomer generation retires from the workforce, finding the workers to fill vacant positions can present a challenge to employers. The age of workers in the Spokane Area s PST Services industry was compared to the age of PST Services workers in Washington and Idaho States and the US. Key findings from this analysis are below. The PST Services industry is slightly more concentrated in the 65+ age cohort than the industry s workforce in Washington and Idaho states. In the age cohort, the Spokane Area industry is more concentrated than both the states and nation. The regional industry has a smaller portion of workers in the age cohort. The PST Services industry in the Spokane Area is also more concentrated in the age cohort than employment in this industry nationally and Washington and Idaho states. The higher than average concentration in this age cohort may reflect employment of college or university students in this field. 81
83 Economic Impact To understand the impact the PST Services industry has on the region s economy, the direct, indirect, and induced effects of the industry were analyzed. Key Findings: For every job in the PST Services industry, another 0.59 jobs are created throughout the region. 3 The total employment impact of the PST Services industry is 32,200 jobs, including 20,000 direct jobs and nearly 12,000 indirect and induced jobs. For every direct dollar of business revenue generated in the PST Services industry, another 0.67 dollars are generated throughout the region s economy. The $1.7 billion of PST Services revenues generated in the Spokane Area grew to nearly $2.9 billion of business revenues as the funds circulated through the regional economy. For every $1 of direct labor, another 47 cents of earnings cycle through the economy. The nearly $950 million of PST Services labor income generates another $440 million of indirect and induced earnings, for a total earnings impact of nearly $1.4 billion in the Spokane Region. Key Definitions: Economic Impact, PST Services - Spokane Area Employment Business Revenues Labor Income Direct Impact 20,342 $1,717,485,665 $949,314,453 Indirect Impact 3,212 $309,620,889 $111,221,210 Induced Impact 8,692 $843,693,071 $332,659,302 Total Impact 32,246 $2,870,799,625 $1,393,194,965 Source: EMSI *Includes "Extended Proprietor" jobs and income, which is not included in other portions of the industry analysis Economic Multipliers, PST Services - Spokane Area Total Employment Business Labor Per Million $ Revenues Income of Direct Revenues Economic Multiplier Source: EMSI Direct Impact: represents employment, purchases, and earnings in the PST Services industry Indirect Impact: represents the economic impacts of suppliers to the PST Services industry in terms of employment, business revenues, and labor income. For example, in order to supply the PST Services 3 Included in these job counts are self-employed workers, as well as extended proprietors for whom these jobs are not their primary source of income but still represent PST Services and other economic activity. This could include, for example, those who do freelance work on the side. 82
84 industry with a product, a business may have to hire workers, pay wages, and purchase inputs from other suppliers. Induced Impact: represents the economic impact of PST Services workers as they spend their earnings in the local economy Economic Multiplier: represents the total change per change in industry (job, dollar of earnings, dollar of business revenues). For example, an employment multiplier of 3 means that for every new job in an industry, an additional 2 jobs are created elsewhere in the economy. 83
85 Professional, Scientific, & Technical Services Occupations in the PST Services industry are spread over a wide range of occupational groups, including Legal Occupations; Art, Design, Entertainment, and Sports Occupations; Architecture & Engineering Occupations; Management Occupations; Business and Financial Operations Occupations; Sales and Related Occupations; and Office and Administrative Occupations. This report analyzes the occupations that make up the PST Services industry, including current and projected employment, the expected number of annual openings over the coming years, the educational requirements of the occupation, and the number of relevant degrees awarded in the region. Key statistics about each occupational group are presented in the following sections: Key Occupations: an overview of 5 occupations that have a high number of openings and a high proportion of workers with some postsecondary education Overview: including the current and projected number of jobs in the PST Services industry and median hourly earnings for each occupation Projected Annual Openings: the number of annual openings in each occupation, broken down by new and replacement demand Labor Supply and Demand Analysis: the number of openings in each occupation are compared to the number of related program completions, to produce a completions-to-openings ratio, and the typical level of education required to enter the field Sources: Economic Modeling Specialists, Intl. (EMSI): current employment, projections, wages, openings, and completions data. Bureau of Labor Statistics (BLS): typical entry-level education requirements (national) and the breakdown of occupations by level of education in 2012/2013 (national) 84
86 Management Analysts Definition: Conduct organizational studies and evaluations, design systems and procedures, conduct work simplification and measurement studies, and prepare operations and procedures manuals to assist management in operating more efficiently and effectively. Includes program analysts and management consultants. (Source: O*NET) Typical Job Titles: Administrative Analyst, Business Analyst, Employment Programs Analyst, Management Analyst, Program Management Analyst, Quality Control Analyst (Source: O*NET) Key Statistics: Management Analysts 2012/ PST Annual Median Hourly Annual Related % of Workers with % of Workers Services Openings Wages Completions Postsecondary Age 55 and older Employment (All Industries) Education* 484 $ % 35% *Nationally, includes Post-secondary non-degree awards, Associate's, Bachelor's and above The Management Analysts occupational group is one of the fastest growing occupational groups in the PST Services industry. Since 2005, employment in the occupational group has increased by 20%, adding 80 jobs. This growth is expected to continue, with the occupation adding another 100 jobs over the next 10 years, an increase of 22%. Over the next 10 years, the Management Analysts occupational group is projected to have over 30 openings annually, of which nearly 20 are expected to be in the PST Services industry. Approximately 55% of these openings will be due to the employment growth in the occupational group, the remainder due to turnover and retirements. At $31.87, median hourly earnings in this occupational group are significantly higher than the overall median for all Spokane Area jobs. These wages are among the highest in the industry group. According to the BLS, a Bachelor s degree is typically required to enter this occupational group. This requirement is validated by the high portion of workers in this field nationally who have some postsecondary education, which accounts for 95% of Management Analysts. In 2012/2013, over 40% of Management Analysts had a Bachelor s degree, 28% had a Master s, and 7% had a doctoral or professional degree. In the Spokane Area, over a third of workers in this occupational group are aged 55 or older. Due to this high portion of workers nearing retirement age, there may be significant opportunities for new workers to enter this field, especially coupled with the relatively high rate of employment growth projected over the next 10 years. However, many workers enter this field after retirement and may, therefore, be willing to work past the traditional age of retirement. Over 1,000 degrees are awarded annually related to this occupational group in the Spokane Area. These degrees are primarily in the undergraduate and graduate Business Administration and Management programs and the Organizational Leadership graduate program. However, graduates with these credentials may enter a range of different occupational groups resulting in just 100 of these completions being allocated to the Management Analysts occupation. This is still significantly higher than the number of annual openings in the occupation, however, some of these graduates may not pursue employment locally. 85
87 Accountants and Auditors Definition: Examine, analyze, and interpret accounting records to prepare financial statements, give advice, or audit and evaluate statements prepared by others. Install or advise on systems of recording costs or other financial and budgetary data. (Source: O*NET) Typical Job Titles: Accountant, Accounting Manager, Accounting Officer, Accounting Supervisor, Business Analyst, Certified Public Accountant (CPA), Cost Accountant, Financial Reporting Accountant, General Accountant, Staff Accountant, Assurance Manager, Assurance Senior, Audit Manager, Audit Partner, Auditor, Auditor-in-Charge, Deputy for Audit, Financial Auditor, Internal Audit Director, Internal Auditor (Source: O*NET) Key Statistics: Accountants and Auditors 2012/ PST Annual Median Hourly Annual Related % of Workers with % of Workers Services Openings Wages Completions Postsecondary Age 55 and older Employment (All Industries) Education* 1,031 $ % 24% *Nationally, includes Post-secondary non-degree awards, Associate's, Bachelor's and above Accountants and Auditors is the largest occupational group in the PST Services industry, representing over 1,000 jobs in This occupational group has grown rapidly over the past 10 years, adding over 200 jobs, an increase of 25%. This growth is projected to continue, expanding employment by another 18%, an increase of nearly 200 jobs. Approximately 57% of Accountant and Auditor jobs are outside of the PST Services industry, for a total regional employment of over 2,200 jobs. Due in part to the high rate of growth, the Accountants and Auditors occupational group is expected to have over 120 openings economy-wide, with over 50 of those expected to be in the PST Services industry. This is the highest number of annual openings in the industry. Despite rapid growth, employment demand is still driven by replacement demand, which accounts for 65% of openings. Median wages for this occupation are over $27 per hour, significantly higher than the median for the Spokane Area overall. According to the BLS, workers typically need a Bachelor s degree to enter the Accountants and Auditors occupation. This is validated by the high portion of workers nationally with a Bachelor s degree or higher, which accounted for 78% of Accountant and Auditor workers in 2012/2013. Workers over the age of 55 account for nearly a quarter of all workers in this field. These workers may be planning to retire over the next decade, creating additional opportunities for new workers to enter the field and a challenge for employers. Due to the number of 4-year colleges and universities in the Spokane Area, the region is producing a significant number of graduates with the credentials to enter the Accountants and Auditors occupational group. However, some of these graduates may leave the region to pursue opportunities elsewhere. 86
88 Software Developers, Applications Definition: Develop, create, and modify general computer applications software or specialized utility programs. Analyze user needs and develop software solutions. Design software or customize software for client use with the aim of optimizing operational efficiency. May analyze and design databases within an application area, working individually or coordinating database development as part of a team. May supervise computer programmers. (Source: O*NET) Typical Job Titles: Application Integration Engineer, Applications Developer, Business Systems Analyst, Computer Consultant, Programmer Analyst, Software Architect, Software Developer, Software Development Engineer, Software Engineer, Technical Consultant (Source: O*NET) Key Statistics: Software Developers, Applications 2012/ PST Annual Median Hourly Annual Related % of Workers with % of Workers Services Openings Wages Completions Postsecondary Age 55 and older Employment (All Industries) Education* 356 $ % 11% *Nationally, includes Post-secondary non-degree awards, Associate's, Bachelor's and above In 2015, the Software Developers (Applications) occupational group accounted for over 350 jobs. While this does not make the occupational group the largest in the industry, it is one of the fastest growing. Between 2005 and 2015, the occupational group added 140 jobs, increasing by 67%. This growth is expected to continue into 2025, with 48% employment growth, or 170 additional jobs, projected. Over the next 10 years, nearly 40 openings are expected in this occupation annually, of which over half are expected to be in the PST Services industry. Openings in this occupational group are driven by new demand, which accounts for 76% of the annual openings. Median hourly wages are over $36 for this occupation, significantly higher than the overall median for the Spokane Area and among the highest hourly wages in the PST Services industry. The Software Developers (Applications) workforce is relatively young. Workers over the age of 55 account for just 11% of workers while over 60% of workers are between the ages of 25 and 44. According to the BLS, employers typically require that workers have a Bachelor s degree to enter this field. This requirement is validated by the portion of workers with some postsecondary education in this occupational group nationally. According to a 2012/2013 BLS report, 50% of workers in this field had a Bachelor s degree while another 30% had a Master s degree, In 2014, over 170 degrees or certificates were awarded related to the Software Developers (Applications) occupational group. Due to competition for these graduates, approximately 54 have been allocated to this occupational group. While this exceeds the number of openings by over 10, some of these graduates may not stay in the Spokane Area after graduating. 87
89 Sales Representatives, Services, All Other Definition: Represents a broad range of sales personnel, for example. In the Spokane Area, most workers in this industry group are employed in the information technology and electronics fields. (Source: Camoin Associates) Typical Job Titles: Sales Representatives, IT Specialists (Source: Camoin Associates) Key Statistics: Sales Representatives, Services, All Other 2012/ PST Annual Median Hourly Annual Related % of Workers with % of Workers Services Openings Wages Completions Postsecondary Age 55 and older Employment (All Industries) Education* 434 $ % 20% *Nationally, includes Post-secondary non-degree awards, Associate's, Bachelor's and above The Sales Representatives (Services All Other) occupational group accounts for over 430 jobs in the PST Services industry cluster. In the Spokane Area, these workers are involved primarily in the computer, information technology, and marketing research related industry sectors. The occupational group declined slightly between 2005 and 2015 but is projected to increase by over 25% by 2025, adding over 120 jobs. This growth will primarily be in the computer and IT-related industry sectors. Economy-wide, over 80 openings are projected in the Sales Representatives (Services All Other) occupational group, of which, 25 are estimated to be in the PST Services industry. Openings are expected to be driven nearly equally by new and replacement demand. The median wage for this occupation is $21.48 per hour, which is approximately $2 higher than the median for all jobs in the Spokane Area. Relative to other PST Services occupations, this wage is on the lower end. According to the BLS, the Sales Representatives (Services All Other) occupational group typically requires a high school diploma to enter the field. However, nationally, over 80% of workers in this field have some form of postsecondary education. Approximately a quarter have some college education but no degree while 40% have a Bachelor s degree. The occupational group is older, with approximately one fifth of Sales Representatives (Services All Other) workers in the Spokane Area over the age of 55. These workers may be planning to retire over the next decade, creating opportunities for new workers to enter the field. However, the large number of retirements may negatively impact employers. In the Spokane Area, 7 certificates related to this occupational group were awarded in 2014 through Washington State University. Due to competition with other occupations, 1 of these awards is estimated to enter the Sales Representatives (Services All Other) field. However, employers may not require a formal educational credential to enter the field and may prefer workers with specific experience or offer their own on the job training. 88
90 Computer User Support Specialists Definition: Provide technical assistance to computer users. Answer questions or resolve computer problems for clients in person, or via telephone or electronically. May provide assistance concerning the use of computer hardware and software, including printing, installation, word processing, electronic mail, and operating systems. (Source: O*NET) Typical Job Titles: Computer Specialist, Computer Support Specialist, Computer Technician, Electronic Data Processing Auditor (EDP Auditor), Help Desk Analyst, Information Technology Specialist (IT Specialist), Network Support Specialist, Network Technician, Support Specialist, Technical Support Specialist (Source: O*NET) Key Statistics: Computer User Support Specialists 2012/ PST Annual Median Hourly Annual Related % of Workers with % of Workers Services Openings Wages Completions Postsecondary Age 55 and older Employment (All Industries) Education* 278 $ % 14% *Nationally, includes Post-secondary non-degree awards, Associate's, Bachelor's and above In 2015, the Computer User Support Specialists occupational group accounted for nearly 280 jobs in the PST Services industry, while an additional 1,000 workers in this occupational group work in other industries in the Spokane Area. The occupational group has grown dramatically over the past 10 years in the PST Services industry, increasing employment by nearly 90%, or 129 jobs. This growth is expected to continue, with another 117 jobs added by Over the next 10 years, 48 openings are projected in this occupation annually, 17 of which are expected to be in the PST Services industry. Over 70% of openings are due to new demand while 29% will be due to replacement demand. The median hourly wage in this occupation are $21, approximately $2 higher than the overall median for the Spokane Area. Compared to other PST Services industry occupational groups, the median hourly wage for Computer User Support Specialist is on the lower end. The occupational group is relatively young, with just 14% of the worker over the age of 55. Approximately 55% of workers are between the ages of 25 and 44. According to the BLS, this occupation typically requires some college but not a degree. While workers with some college but no degree do account for 28% of workers in this occupational group, nearly a third have a Bachelor s degree. Due the number of 4-year colleges and universities in the Spokane Area, there are significantly more academic degrees being awarded annually this field than openings. Most of these awards are for a Bachelor s degree in Computer Science or for an industry certification that requires less than a year of schooling. The number of awards for programs related to this occupation have been growing recently, with most of the increases in Associate s degree and certificate programs. 89
91 Professional, Scientific, & Technical Services Occupation Overview Selection Criteria for Occupations Included: At least 100 jobs in the PST Services industry At least 5 openings annually Data Included: 2015 Percent of in the Professional, Scientific, & Technical Services Industry 2015 to 2025 Change (absolute change and percent change) Median Hourly Earnings Key Findings: The PST Services industry represents a diverse group of industry sectors, ranging from scientific research and development to legal and accounting offices. For this reason, the occupations included in this industry group are also very diverse and include scientists, veterinarians, lawyers, engineers, software developers, and graphic designers. The largest occupation in the industry is Accountants and Auditors, which accounts for over 1,000 jobs in the PST Services industry, or 6.5% of the industry employment. This occupational group has also grown substantially over the last 10 years, adding over 200 jobs. Between 2015 and 2025, the occupational group is expected to add 190 jobs in the PST Services industry alone. Overall, the PST Services industry is expected to grow rapidly over the next 10 years, in both the Spokane Area and nationally. The occupations expected to grow at the fastest rates are related to the computer, software, and IT industries. While the industry overall is expected to grow rapidly over the coming years, some PST Services occupations are expected to show low or negative growth. For example, the second largest occupational group in the industry, Lawyers, is projected to add only 20 jobs over the next 10 years, an increase of 3%. Employment in the Legal Secretaries occupational group is expected to contract slightly over the same period, shedding 14 jobs. The median hourly wages range widely in the PST Services industry, from $12 for Veterinarian Assistants to nearly $46 for Computer and Information System Managers. Generally, the highest wages are associated with business, finance, and technology-related occupational groups, while the lowest wages are associated with creative (Graphic Designer, Photographers) and administrative and support occupations. 90
92 Legal Occupations Overview: Legal Occupations SOC 2015 PST Services % of in PST Services Industry # Change % Change Median Hourly Earnings (All Industries) Lawyers % 22 3% $ Paralegals and Legal Assistants % 53 13% $20.95 Bold designates occupations that added the most jobs in the PST Services industry Arts, Design, Entertainment, Sports, and Media Occupations Overview: Arts, Design, Entertainment, Sports, and Media Occupations SOC 2015 PST Services % of in PST Services Industry # Change % Change Median Hourly Earnings (All Industries) Graphic Designers % 26 10% $ Interior Designers % 16 13% $ Photographers % 71 25% $12.32 Bold designates occupations that added the most jobs in the PST Services industry Architecture & Engineering Occupations Overview: Architecture & Engineering Occupations SOC 2015 PST Services % of in PST Services Industry # Change % Change Median Hourly Earnings (All Industries) Architects, Except Landscape and Naval % -14-8% $ Civil Engineers % 56 18% $ Mechanical Engineers % 24 19% $34.27 Bold designates occupations that added the most jobs in the PST Services industry 91
93 Management and Business & Financial Operations Occupations Overview: Management and Business & Financial Operations Occupations SOC 2015 PST Services % of in PST Services Industry # Change % Change Median Hourly Earnings (All Industries) Computer and Information Systems Managers % 47 38% $ Managers, All Other % 24 13% $ General and Operations Managers 301 7% 70 23% $ Management Analysts % % $ Market Research Analysts and Marketing Specialists % 80 29% $ Business Operations Specialists, All Other 128 7% 41 32% $ Accountants and Auditors 1,031 43% % $ Tax Preparers % 26 10% $15.15 Bold designates occupations that added the most jobs in the PST Services industry Computer and Mathematical Occupations Overview: Computer and Mathematical Occupations SOC 2015 PST Services % of in PST Services Industry # Change % Change Median Hourly Earnings (All Industries) Computer Systems Analysts % % $ Computer Programmers % 58 28% $ Software Developers, Applications % % $ Web Developers % 63 38% $ Network and Computer Systems Administrators % 36 30% $ Computer User Support Specialists % % $20.99 Bold designates occupations that added the most jobs in the PST Services industry Healthcare Practitioners and Technical & Healthcare Support Occupations Overview: Healthcare Practitioners and Technical & Healthcare Support Occupations SOC 2015 PST Services % of in PST Services Industry # Change % Change Median Hourly Earnings (All Industries) Veterinarians % 8 4% $ Veterinary Technologists and Technicians % 49 30% $ Veterinary Assistants and Laboratory Animal Caretakers % 17 8% $12.16 Bold designates occupations that added the most jobs in the PST Services industry 92
94 Sales and Related Occupations Overview: Sales and Related Occupations SOC 2015 PST Services % of in PST Services Industry # Change % Change Median Hourly Earnings (All Industries) Advertising Sales Agents % % $ Sales Representatives, Services, All Other % % $21.48 Bold designates occupations that added the most jobs in the PST Services industry Office and Administrative Support Occupations Overview: Office and Administrative Support Occupations SOC 2015 PST Services % of in PST Services Industry # Change % Change Median Hourly Earnings (All Industries) First-Line Supervisors of Office and Administrative Support Workers 178 5% 28 16% $ Billing and Posting Clerks % 27 11% $ Bookkeeping, Accounting, and Auditing Clerks % 69 11% $ Customer Service Representatives 303 5% 63 21% $ Receptionists and Information Clerks 229 9% 13 6% $ Legal Secretaries % -14-4% $ Secretaries and Administrative Assistants, Except Legal, Medical, and Executive 411 7% 72 17% $ Office Clerks, General 398 6% 53 13% $13.97 Bold designates occupations that added the most jobs in the PST Services industry 93
95 Projected Annual Openings Selection Criteria for Occupations Included: At least 100 jobs in the PST Services industry At least 5 openings annually Data Included: Annual Openings (All Industries): represents the average number of job openings over the next 10 years due to retirements/turnover (replacement demand) and economic growth (new demand) Estimated Annual Openings (PST Services): of the annual openings, the number estimated to be in the PST Services industry. The number of openings is only provided for an occupation, but not the portion of the occupation in a certain industry. To estimate the number of openings specifically in the PST Services industry, Camoin Associates assessed the number of new jobs expected in the PST Services industry over the next 10 years and the portion of PST Services jobs in the occupation overall. New Demand: job openings in an occupation created by new jobs being added to an occupation/industry Replacement Demand: jobs openings in an occupation created by workers retiring or other turnover Key Findings: Due to the rapid employment growth expected in the PST Services industry, openings in many occupations are being driven by new demand. This is especially true of technology-related occupational groups, where the workforce is younger and retirement is a smaller factor in demand for new workers. The Accountants and Auditors occupational group has the most annual openings projected in the industry. While this group is expected to add nearly 200 new jobs over the next 10 years, this employment growth only accounts for 35% of expected employment demand, with retirements and other turnover contributing the remaining 65%. 94
96 Legal Occupations Projected Annual Openings: Legal Occupations SOC Annual Openings (All Industries) Est. Annual Openings (PST Services) Estimated % New Demand % Replacement Demand Lawyers % 87% Paralegals and Legal Assistants % 57% Bold designates occupations with the highest number of PST Services Annual Openings Arts, Design, Entertainment, Sports, and Media Occupations Projected Annual Openings: Arts, Design, Entertainment, Sports, and Media Occupations SOC Annual Openings (All Industries) Est. Annual Openings (PST Services) Estimated % New Demand % Replacement Demand Graphic Designers % 75% Interior Designers % 69% Photographers % 38% Bold designates occupations with the highest number of PST Services Annual Openings Architecture & Engineering Occupations Projected Annual Openings: Architecture & Engineering Occupations SOC Annual Openings (All Industries) Est. Annual Openings (PST Services) Estimated % New Demand % Replacement Demand Architects, Except Landscape and Naval 6 5 0% 100% Civil Engineers % 61% Mechanical Engineers % 67% Bold designates occupations with the highest number of PST Services Annual Openings 95
97 Management and Business & Financial Operations Occupations Projected Annual Openings: Management and Business & Financial Operations Occupations SOC Annual Openings (All Industries) Est. Annual Openings (PST Services) Estimated % New Demand % Replacement Demand Computer and Information Systems Managers % 29% Managers, All Other % 68% General and Operations Managers % 47% Management Analysts % 45% Market Research Analysts and Marketing Specialists % 35% Business Operations Specialists, All Other % 31% Accountants and Auditors % 65% Tax Preparers % 70% Bold designates occupations with the highest number of PST Services Annual Openings Computer and Mathematical Occupations Projected Annual Openings: Computer and Mathematical Occupations SOC Annual Openings (All Industries) Est. Annual Openings (PST Services) Estimated % New Demand % Replacement Demand Computer Systems Analysts % 31% Computer Programmers % 51% Software Developers, Applications % 24% Web Developers % 32% Network and Computer Systems Administrators % 38% Computer User Support Specialists % 29% Bold designates occupations with the highest number of PST Services Annual Openings Healthcare Practitioners and Technical & Healthcare Support Occupations Projected Annual Openings: Healthcare Practitioners and Technical & Healthcare Support Occupations SOC Annual Openings (All Industries) Est. Annual Openings (PST Services) Estimated % New Demand % Replacement Demand Veterinarians 9 8 9% 91% Veterinary Technologists and Technicians % 28% Veterinary Assistants and Laboratory Animal Caretakers % 73% Bold designates occupations with the highest number of PST Services Annual Openings 96
98 Sales and Related Occupations Projected Annual Openings: Sales and Related Occupations SOC Annual Openings (All Industries) Est. Annual Openings (PST Services) Estimated % New Demand % Replacement Demand Advertising Sales Agents % 100% Sales Representatives, Services, All Other % 52% Bold designates occupations with the highest number of PST Services Annual Openings Office and Administrative Support Occupations Projected Annual Openings: Office and Administrative Support Occupations SOC Annual Openings (All Industries) Est. Annual Openings (PST Services) Estimated % New Demand % Replacement Demand First-Line Supervisors of Office and Administrative Support Workers % 62% Billing and Posting Clerks % 64% Bookkeeping, Accounting, and Auditing Clerks % 48% Customer Service Representatives % 58% Receptionists and Information Clerks % 83% Legal Secretaries 6 5 0% 100% Secretaries and Administrative Assistants, Except Legal, Medical, and Executive % 43% Office Clerks, General % 62% Bold designates occupations with the highest number of PST Services Annual Openings 97
99 Labor Supply and Demand Analysis Selection Criteria for Occupations Included: At least 100 jobs in the PST Services industry At least 5 openings annually Data Included: Annual Openings (All Industries): represents the average number of job openings over the next 10 years due to retirements/turnover (replacement demand) and economic growth (new demand) Annual Related Completions: represents all degrees awarded in educational programs that could funnel workers into the occupation Completions Allocated to Occupation: as most educational programs prepare graduates for multiple occupations, this statistic assesses the number of graduates that would be expected to enter a specific occupational field, based on the amount of competition for those graduates from other occupational groups. Completions to Openings Ratio: compares the number of completions allocated to occupation to the number of annual openings. A ratio of 1 would signify that there are exactly the same number of graduates as openings. If the ratio is less than 1, there are fewer educational awards than the number of annual openings while a ratio greater than 1 would mean there are more educational awards than openings. Typical Level of Education Required: determined by the Bureau of Labor Statistics (BLS), this represents the level of education typically required nationally to enter an occupational field. This may vary widely based on the industry and location. Percent of Workers with Postsecondary Education: determined by the Bureau of Labor Statistics, this number represents the proportion of workers in the occupational group that have some college, a postsecondary non-degree award, an Associate s degree, Bachelor s degree, or more advanced level of education. Key Findings: While some PST Services occupations do not have any or enough degrees being awarded in related programs, it is possible that employers do not require a formal educational credential or prefer work experience or on-the-job training to train employees. The BLS categorizes many PST Services industry occupations as requiring only a high school diploma, however, it is much more common for workers in these fields to have some postsecondary education. In some cases, as many as 88% of workers in the occupation nationally have some postsecondary education, despite the BLS classification. The majority of PST Services occupational groups require some postsecondary education, typically a Bachelor s degree, to enter the fields, according to the BLS. These jobs also typically pay a higher wage than those that require less than a 4-year degree. This educational requirement limits the pool of applicants for these positions and prevents less educated workers from accessing higher wages. Due to the number of 4-year colleges and universities in the Spokane Area, the occupational groups that typically require a Bachelor s degree typically have more than enough graduates from regional institutions to fill their employment needs. While these graduates present a potential pool of applicants for these employers, some graduates may not be planning to stay in the region for work. 98
100 Legal Occupations Labor Supply and Demand Analysis: Legal Occupations SOC % of Workers Completions Annual Openings Annual Related Completions to Typical Level of Education Required with Allocated to (All Industries) Completions Openings Ratio (Nationally) Postsecondary Occupation Education* Lawyers Doctoral or professional degree 100% Paralegals and Legal Assistants Associate's degree 88% *Nationally, includes Post-secondary non-degree awards, Associate's, Bachelor's and above Arts, Design, Entertainment, Sports, and Media Occupations Labor Supply and Demand Analysis: Arts, Design, Entertainment, Sports, and Media Occupations SOC % of Workers Completions Annual Openings Annual Related Completions to Typical Level of Education Required with Allocated to (All Industries) Completions Openings Ratio (Nationally) Postsecondary Occupation Education* Graphic Designers Bachelor's degree 88% Interior Designers Bachelor's degree 88% Photographers High school diploma or equivalent 86% *Nationally, includes Post-secondary non-degree awards, Associate's, Bachelor's and above Architecture & Engineering Occupations Labor Supply and Demand Analysis: Architecture & Engineering Occupations SOC % of Workers Completions Annual Openings Annual Related Completions to Typical Level of Education Required with Allocated to (All Industries) Completions Openings Ratio (Nationally) Postsecondary Occupation Education* Architects, Except Landscape and Naval Bachelor's degree 99% Civil Engineers Bachelor's degree 98% Mechanical Engineers Bachelor's degree 96% *Nationally, includes Post-secondary non-degree awards, Associate's, Bachelor's and above 99
101 Management and Business & Financial Operations Occupations Labor Supply and Demand Analysis: Management and Business & Financial Operations Occupations SOC % of Workers Completions Annual Openings Annual Related Completions to Typical Level of Education Required with Allocated to (All Industries) Completions Openings Ratio (Nationally) Postsecondary Occupation Education* Computer and Information Systems Managers Bachelor's degree 96% Managers, All Other High school diploma or equivalent 83% General and Operations Managers Bachelor's degree 83% Management Analysts 34 1, Bachelor's degree 95% Market Research Analysts and Marketing Specialists Bachelor's degree 96% Business Operations Specialists, All Other High school diploma or equivalent 88% Accountants and Auditors Bachelor's degree 96% Tax Preparers High school diploma or equivalent 85% *Nationally, includes Post-secondary non-degree awards, Associate's, Bachelor's and above Computer and Mathematical Occupations Labor Supply and Demand Analysis: Computer and Mathematical Occupations SOC % of Workers Completions Annual Openings Annual Related Completions to with Allocated to Typical Level of Education Required (All Industries) Completions Openings Ratio Postsecondary Occupation Education Computer Systems Analysts Bachelor's degree 95% Computer Programmers Bachelor's degree 95% Software Developers, Applications Bachelor's degree 98% Web Developers Associate's degree 95% Network and Computer Systems Administrators Bachelor's degree 92% Computer User Support Specialists Some college, no degree 88% *Nationally, includes Post-secondary non-degree awards, Associate's, Bachelor's and above 100
102 Healthcare Practitioners and Technical & Healthcare Support Occupations Labor Supply and Demand Analysis: Healthcare Practitioners and Technical & Healthcare Support Occupations SOC % of Workers Completions Annual Openings Annual Related Completions to with Allocated to Typical Level of Education Required (All Industries) Completions Openings Ratio Postsecondary Occupation Education* Veterinarians Doctoral or professional degree 100% Veterinary Technologists and Technicians Associate's degree 75% Veterinary Assistants and Laboratory Animal Caretakers High school diploma or equivalent 69% *Nationally, includes Post-secondary non-degree awards, Associate's, Bachelor's and above Sales and Related Occupations Labor Supply and Demand Analysis: Sales and Related Occupations SOC % of Workers Completions Annual Openings Annual Related Completions to with Allocated to Typical Level of Education Required (All Industries) Completions Openings Ratio Postsecondary Occupation Education* Advertising Sales Agents High school diploma or equivalent 87% Sales Representatives, Services, All Other High school diploma or equivalent 82% *Nationally, includes Post-secondary non-degree awards, Associate's, Bachelor's and above Office and Administrative Support Occupations Labor Supply and Demand Analysis: Office and Administrative Support Occupations SOC % of Workers Completions Annual Openings Annual Related Completions to with Allocated to Typical Level of Education Required (All Industries) Completions Openings Ratio Postsecondary Occupation Education* First-Line Supervisors of Office and Administrative Support Workers High school diploma or equivalent 75% Billing and Posting Clerks High school diploma or equivalent 67% Bookkeeping, Accounting, and Auditing Clerks High school diploma or equivalent 69% Customer Service Representatives High school diploma or equivalent 69% Receptionists and Information Clerks High school diploma or equivalent 63% Legal Secretaries High school diploma or equivalent 69% Secretaries and Administrative Assistants, Except Legal, Medical, and Executive High school diploma or equivalent 69% Office Clerks, General High school diploma or equivalent 67% *Nationally, includes Post-secondary non-degree awards, Associate's, Bachelor's and above 101
103 Transportation & Warehousing Industry Workforce Roadmap 102
104 Past and Projected Changes in Employment In the chart below, past and projected changes in the Transportation & Warehousing (T&W) industry were analyzed and compared to Washington and Idaho States and the nation. Changes in the T&W industry were also compared to employment trends in the Spokane Area economy overall. Key Findings: Compared to the Spokane Area economy overall, employment in Spokane s T&W industry declined more steeply between 2005 and However, employment in the industry recovered more rapidly and is projected to grow at a higher rate over the next 10 years than employment in the Spokane Area overall. From a pre-recession employment peak of nearly 8,300 jobs in 2007, employment in the T&W industry declined to an employment low of just under 7,600 jobs in Since 2010, the industry has recovered rapidly, surpassing pre-recession employment by the year In 2015, the industry accounted for nearly 8,500 jobs. The industry is projected to grow by another 13.5% by In the Spokane Area, the T&W industry declined more steeply than the industry in Washington and Idaho States between 2007 and The Spokane Area T&W industry has also recovered employment at a lower rate than Washington and Idaho states. Employment in the Spokane Area T&W industry mirrored the decline of the industry nationally. However, in the Spokane Area, the T&W industry has recovered more rapidly and is projected to grow at a higher rate than the industry nationally over the next 10 years. 103
105 Industry Overview Key findings about the sectors that comprise the Transportation & Warehousing (T&W) industry are below. A detailed table presenting key data about the T&W industry in the Spokane Area is on the following page. In 2015, employment in the T&W industry reached 8,470 jobs. This accounted for approximately 2% of all employment in the Greater Spokane region. The largest T&W industry sector, General Freight Trucking, accounts for 28% of T&W employment. This sector is twice the size of the next largest sector, Courier and Express Delivery Services. Earnings per Worker At $55,800, the average earnings per worker in the T&W industry is 16% higher than the overall average in the Spokane Area. Average earnings per T&W worker are 6% lower in the Spokane Area than in the nation overall and 9% lower than earnings in Washington and Idaho States. The Pipeline Transportation of Natural Gas sector has the highest earnings per worker in the T&W industry, over 3 times the average for the industry. This sector is relatively small, in terms of employment, accounting for just 35 jobs. The Rail Transportation sector has the second highest average earnings per worker, $93,700. This is nearly 70% higher than the industry average. This sector accounts for over 950 jobs, 11% of T&W employment. Location Quotient (LQ) With a location quotient of 0.74, employment in the T&W the industry is over 25% less concentrated than employment in the US overall. In Washington and Idaho States, employment in the T&W industry is about 15% less concentrated than employment in the nation. Employment in the Support Activities for Air Transportation sector is over twice as concentrated in the Spokane Area than in the US overall. This is also one of the largest T&W sectors in the region, accounting for nearly 900 jobs. The Rail Transportation sector is over 75% more concentrated than employment in the sector nationally. This sector is also among the largest in the industry and has the second highest average earnings per worker. Gross Regional Product (GRP) Overall, the T&W industry contributes nearly $750 million to the Gross Regional Product of the Spokane Area. This represents about 2% of the total GRP for the Spokane Area. The General Freight Trucking sector is the largest contributor to the T&W industry s GRP, accounting for nearly $175 million of GRP, or 23% of the industry total. This is also the T&W largest employer in the region. After the General Freight Trucking sector, the Rail Transportation sector has the second highest GRP, contributing over $165 million to the T&W industry s total GRP. This industry is highly efficient, with a GRP per job of nearly $174,000, the third highest of all T&W sectors. This is nearly double the average GRP per job for the industry overall. While they account for few jobs, the sectors related to oil and natural gas pipeline transportation have high average GRP per job. 104
106 Transportation & Warehousing Industry Overview, 4 Digit NAICS - Spokane Area NAICS Average 2015 Location % of Gross Regional Earnings Per Quotient Cluster Product Worker 4811 Scheduled Air Transportation 361 $55, % $28,920, Nonscheduled Air Transportation 74 $81, % $11,684, Rail Transportation 954 $93, % $165,855, General Freight Trucking 2,384 $54, % $174,789, Specialized Freight Trucking 747 $48, % $42,864, Interurban and Rural Bus Transportation 49 $20, % $3,265, Taxi and Limousine Service 57 $18, % $3,827, School and Employee Bus Transportation 396 $18, % $7,663, Charter Bus Industry 42 $22, % $1,350, Other Transit and Ground Passenger Transportation 70 $24, % $2,756, Pipeline Transportation of Natural Gas 35 $184, % $9,090, Other Pipeline Transportation 14 $93, % $2,352, Scenic and Sightseeing Transportation, Water 32 $12, % $590, Scenic and Sightseeing Transportation, Other 18 $18, % $623, Support Activities for Air Transportation 883 $64, % $88,986, Support Activities for Rail Transportation 38 $34, % $1,172, Support Activities for Water Transportation 17 $40, % $1,354, Support Activities for Road Transportation 241 $30, % $8,956, Freight Transportation Arrangement 243 $69, % $20,874, Other Support Activities for Transportation 11 $19, % $345, Couriers and Express Delivery Services 1,043 $51, % $87,963, Local Messengers and Local Delivery 236 $29, % $16,595, Warehousing and Storage 522 $49, % $64,018, Total (All Transporation & Warehousing) 8,472 $55, % $746,466,409 Bold designates 5 largest industries For industries with fewer than 10 workers, analyst assumes 5 workers 105
107 Historic Change in Employment (2005 to 2015) The table below summarizes changes in employment in the Spokane Area, Washington and Idaho States (combined), and the United States. Key findings from this analysis are below. A more detailed table presenting changes at the 4-digit NAICS code level is on the following page. Rows with bold text designate the industries with the highest employment growth between 2005 and Transportation & Warehousing Industry Historic Change Spokane Area WA and ID States United States Change In Employment 8.1% 10.4% 8.1% Key Findings: Overall, the Transportation & Warehousing industry grew quickly between 2005 and 2015, adding 630 jobs, an increase of 8%. However, growth in the industry is more substantial if measured from From an employment low of just under 7,600 jobs in 2010, the T&W industry has added nearly 900 jobs, an increase of 12%. The T&W sectors that added the most jobs between 2005 and 2015 were the Support Activities for Air Transportation, Warehousing and Storage, General Freight Trucking, Freight Transportation Arrangement, and Scheduled Air Transportation sectors. These sectors added between 300 jobs and 100 jobs over this period. The Specialized Freight Trucking industry shed the most jobs between 2005 and 2015, declining by over 140 jobs, or 16%. While overall, employment in this sector declined from 2005, the industry has been growing since In 2010, the sector accounted for just over 700 jobs. By 2015, the sector accounted for nearly 750 jobs, an increase of nearly 40 jobs. The Warehousing and Storage sector added 260 jobs between 2005 and 2015, nearly doubling 2005 employment. Most of this growth occurred between 2010 and Even with this strong growth over the past 10 years, employment in this sector is only 30% as concentrated in the Spokane Area as it is nationally. The Support Activities for Air Transportation sector increased employment by over 50%, adding 300 jobs between 2005 and This is among the largest sectors in the T&W industry and has above average earnings, relative to the T&W industry overall. By 2015, employment in this industry was over twice as concentrated as employment nationally. The Freight Transportation Arrangement sector also grew rapidly between 2005 and 2015, adding 100 jobs, a 73% increase. Average earnings per worker in this sector are 24% higher than average earnings for the industry overall. Despite the rapid growth over the past 10 years, employment in this sector is only 50% as concentrated in the Spokane Area as employment nationally. 106
108 Transportation & Warehousing Industry Historic Change, 4 Digit NAICS - Spokane Area NAICS # Change % Change 4811 Scheduled Air Transportation % 4812 Nonscheduled Air Transportation % 4821 Rail Transportation % 4841 General Freight Trucking 2,244 2,097 2, % 4842 Specialized Freight Trucking % 4852 Interurban and Rural Bus Transportation % 4853 Taxi and Limousine Service % 4854 School and Employee Bus Transportation % 4855 Charter Bus Industry % 4859 Other Transit and Ground Passenger Transportation % 4862 Pipeline Transportation of Natural Gas % 4869 Other Pipeline Transportation % 4872 Scenic and Sightseeing Transportation, Water % 4879 Scenic and Sightseeing Transportation, Other % 4881 Support Activities for Air Transportation % 4882 Support Activities for Rail Transportation % 4883 Support Activities for Water Transportation % 4884 Support Activities for Road Transportation % 4885 Freight Transportation Arrangement % 4889 Other Support Activities for Transportation % 4921 Couriers and Express Delivery Services 1, , % 4922 Local Messengers and Local Delivery % 4931 Warehousing and Storage % Total (All Transporation & Warehousing) 7,840 7,583 8, % Bold designates 5 industries with highest historic employment growth For industries with fewer than 10 workers, analyst assumes 5 workers 107
109 Projected Change in Employment (2015 to 2021) The table below summarizes changes in employment in the Spokane Area, Washington and Idaho States (combined), and the United States. Key findings from this analysis are below. A more detailed table presenting changes at the 4-digit NAICS code level is on the following page. Rows with bold text designate the industries with the highest projected employment growth between 2015 and Transportation & Warehousing Industry Projected Change Spokane Area WA and ID States United States Change In Employment 8.7% 8.0% 5.5% Overall, employment in the Transportation & Warehousing industry is projected to grow by 9%, adding over 730 jobs between 2015 and Employment growth in the Spokane Area is expected to outpace growth in Washington and Idaho States and the US. The Support Activities for Air Transportation, General Freight Trucking, Warehousing and Storage, Rail Transportation, and Freight Transportation sectors are projected to add the most jobs between 2015 and Growth in these sectors is expected to range from 270 to 63 jobs. The Support Activities for Air Transportation sector is expected to add the most jobs between 2015 and 2021, increasing employment by 270 jobs, or 31%. This sector also added the most jobs between 2005 and 2015, increasing employment by over 300 jobs. By 2021, this sector is expected to be the second largest in the T&W industry. The Warehousing and Storage sector is projected to continue to grow between 2015 and 2021, but at a lower rate than the growth experienced over the past 10 years. By 2021, the sector is expected to add 144 jobs, an increase of nearly 30%. The General Freight Trucking sector is projected to grow at a slightly higher rate between 2015 and 2021 than it did over the past 10 years. The sector is expected to add nearly 190 jobs, an 8% increase in employment. This is the largest T&W sector in the Spokane Area. Between 2015 and 2021, the Rail Transportation sector is expected to grow by 8%, adding nearly 80 jobs. Projected growth in this sector will exceed the 5% employment growth experienced over the past 10 years. In 2015, employment in this sector was over 75% more concentrated in the Spokane Area than in the nation overall and accounted for 22% of the industry s GRP, despite employing only 11% of industry workforce. 108
110 Transportation & Warehousing Industry Projected Change, 4 Digit NAICS - Spokane Area NAICS # Change % Change 4811 Scheduled Air Transportation % 4812 Nonscheduled Air Transportation % 4821 Rail Transportation , % 4841 General Freight Trucking 2,384 2,485 2, % 4842 Specialized Freight Trucking % 4852 Interurban and Rural Bus Transportation % 4853 Taxi and Limousine Service % 4854 School and Employee Bus Transportation % 4855 Charter Bus Industry % 4859 Other Transit and Ground Passenger Transportation % 4862 Pipeline Transportation of Natural Gas % 4869 Other Pipeline Transportation % 4872 Scenic and Sightseeing Transportation, Water % 4879 Scenic and Sightseeing Transportation, Other % 4881 Support Activities for Air Transportation 883 1,051 1, % 4882 Support Activities for Rail Transportation % 4883 Support Activities for Water Transportation % 4884 Support Activities for Road Transportation % 4885 Freight Transportation Arrangement % 4889 Other Support Activities for Transportation % 4921 Couriers and Express Delivery Services 1,043 1,035 1, % 4922 Local Messengers and Local Delivery % 4931 Warehousing and Storage % Total (All Transporation & Warehousing) 8,472 8,886 9, % Bold designates 5 industries with highest projected employment growth For industries with fewer than 10 workers, analyst assumes 5 workers 109
111 Competitiveness Analysis Shift share analysis distinguishes an industry s employment growth in a specific area that is attributable to local competitive advantages from growth that is attributable to national employment trends or overall industry employment trends. The shift share analysis helps to answer the question of Why is employment growing or declining in this industry? Is it simply related to the industry growing nationally or are we more competitive regionally? To do this, shift share analysis splits regional job growth into three components: the national growth effect, industrial mix effect, and regional competitive effect. A shift share analysis is based on four factors: The Industrial Mix Effect The industrial mix effect represents the share of regional industry growth explained by the growth of the specific industry at the national level. To arrive at this number, the national growth rate of the total economy is subtracted from the national growth rate of the specific industry, and this growth percentage is applied to the regional jobs in that industry. The National Growth Effect The national growth effect explains how much of the regional industry s growth is explained by the overall growth of the national economy: if the nation s economy overall is growing, you would generally expect to see some positive change in each industry in your local region (the proverbial rising tide that lifts all boats ). The Expected Change This is simply the rate of growth of the particular industry at the national level. The expected change is the sum of the industrial mix and the national growth effects. The Regional Competitive Effect The regional competitive effect is the most vital in the shift share analysis. It explains how much of the change in a given industry is due to some unique competitive advantage that the region possesses, because the growth cannot be explained by national trends in that industry or the economy as whole. This effect is calculated by taking the total regional growth of the given industry and subtracting the national growth for that same industry. Note that this effect can be positive even as regional employment in the industry declines. This would indicate that regional decline is less than the national decline. Key findings from the Competiveness Analysis are below. A detailed supporting table at the 4-digit NAICS code level is presented on the following page. Nationally, employment in the T&W industry grew by over 8% between 2005 and Based on these national industry-wide trends, the T&W industry in the Spokane Area would have been expected to add 637 jobs over this period. The industry generally met this expectation, adding 632 jobs. While overall, the T&W industry slightly underperformed expectations, some sectors added jobs at a higher rate than would have been expected based on national industry trends. The sectors with the highest competitive effect in the Spokane Area were General Freight Trucking, Support Activities for Air Transportation, Warehousing and Storage, Scheduled Air Transportation, and Freight Transportation Arrangement sectors. The largest T&W industry sector, General Freight Trucking, grew in the Spokane Area even as employment in the industry contracted nationally. The Scheduled Air Transportation sector also grew in the region, despite a national employment contraction in this sector. The Specialized Freight Trucking sector lost jobs in the Spokane Area, even as the sector grew nationally. Based on national industry trends, the sector would have been expected to add 85 jobs in the Spokane Area, however, the sector lost over 140 jobs between 2005 and
112 Transportation & Warehousing Industry Competitiveness Analysis ( ), 4 Digit NAICS - Spokane Area NAICS Ind. Mix Effect Nat'l Growth Effect Expected Change Competitive 4811 Scheduled Air Transportation Nonscheduled Air Transportation Rail Transportation General Freight Trucking Specialized Freight Trucking Interurban and Rural Bus Transportation Taxi and Limousine Service School and Employee Bus Transportation Charter Bus Industry Other Transit and Ground Passenger Transportation Pipeline Transportation of Natural Gas Other Pipeline Transportation Scenic and Sightseeing Transportation, Water Scenic and Sightseeing Transportation, Other Support Activities for Air Transportation Support Activities for Rail Transportation Support Activities for Water Transportation Support Activities for Road Transportation Freight Transportation Arrangement Other Support Activities for Transportation Couriers and Express Delivery Services Local Messengers and Local Delivery Warehousing and Storage Total (All Transporation & Warehousing) Bold designates 5 industries with highest competitive effect For industries with fewer than 10 workers, analyst assumes 5 workers Effect 111
113 Employment by County Employment in the Spokane Area varies by county. The chart below presents 2015 Transportation & Warehousing employment in each county as well as past and projected changes in employment. Key findings from this analysis are below. Nearly 80% of T&W employment occurs in Spokane County, which accounts for 6,700 T&W jobs. Kootenai County has the second highest T&W employment in the region, with nearly 1,100 jobs, or 13% of regional T&W employment. The T&W industry grew at the highest rate Spokane County, where the industry added over 700 jobs, an increase of 12%. This outpaces overall T&W employment growth in the region. T&W employment in the county is projected to grow by another 14% by 2025, adding 950 jobs. Most counties in the Spokane Area saw T&W employment decrease between 2005 and Whitman County declined the most, shedding 82 jobs, a 25% contraction. However, every county is expected to add jobs in the T&W industry over the next 10 years. 112
114 Employment by Age of Worker The age of workers employed in an industry can factor significantly in demand for new workers. As older workers retire from the workforce, they will need to be replaced by younger workers with the skills and experience to meet employer needs. As the baby boomer generation retires from the workforce, finding the workers to fill vacant positions can present a challenge to employers. The age of workers in the Spokane Area s T&W industry were compared to the age of T&W workers in Washington and Idaho States and the US. Key findings from this analysis are below. Overall, the age of workers in the T&W industry in the Spokane Area largely mirrors the age of workers in the industry nationally and in Washington and Idaho States. Spokane Area industry employment is slightly more concentrated than the nation in the age cohort while it is less concentrated than the nation in the and age cohorts. A slightly higher portion of T&W employment in the Spokane Area is between the ages of 25 and 34 than the states or nation. 113
115 Economic Impact To understand the impact the Transportation & Warehousing industry has on the region s economy, the direct, indirect, and induced effects of the industry were analyzed. Key Findings: For every job in the T&W industry, another 0.81 jobs are created throughout the region. 4 The total employment impact of the T&W industry is 18,230 jobs, including over 10,000 direct jobs and 8,175 indirect and induced jobs. For every direct dollar of business revenue generated in the T&W industry, another 0.57 dollars are generated throughout the region s economy. The $1.5 billion of T&W revenues generated in the Spokane Area grew to $2.4 billion of business revenues as the funds circulated through the regional economy. For every $1 of direct labor, another 63 cents of earnings cycle through the economy. The nearly $520 million of T&W labor income generates another $330 million of indirect and induced earnings, for a total earnings impact of $850 million in the Spokane Region. Key Definitions: Economic Impact, Trans. & Warehousing - Spokane Area Employment Business Revenues Labor Income Direct Impact 10,055 $1,537,694,353 $523,272,683 Indirect Impact 2,320 $313,294,172 $101,866,833 Induced Impact 5,855 $567,109,003 $227,520,178 Total Impact 18,230 $2,418,097,527 $852,659,694 Source: EMSI *Includes "Extended Proprietor" jobs and income, which is not included in other portions of the industry analysis Economic Multipliers, Trans. & Warehousing - Spokane Area Total Employment Business Labor Per Million $ Revenues Income of Direct Revenues Economic Multiplier Source: EMSI Direct Impact: represents employment, purchases, and earnings in the T&W industry Indirect Impact: represents the economic impacts of suppliers to the T&W industry in terms of employment, business revenues, and labor income. For example, in order to supply the T&W industry with a product, a business may have to hire workers, pay wages, and purchase inputs from other suppliers. 4 Included in these job counts are self-employed workers, as well as extended proprietors for whom these jobs are not their primary source of income but still represent Transportation & Warehousing and other economic activity. This could include, for example, those who do freelance work on the side. 114
116 Induced Impact: represents the economic impact of T&W workers as they spend their earnings in the local economy Economic Multiplier: represents the total change per change in industry (job, dollar of earnings, dollar of business revenues). For example, an employment multiplier of 3 means that for every new job in an industry, an additional 2 jobs are created elsewhere in the economy. 115
117 Transportation & Warehousing Occupations in the Transportation & Warehousing industry are primarily comprised of three main occupational groups: Transportation and Material Moving Occupations; Installation, Maintenance, and Repair Occupations; and Office and Administrative Occupations. The Transportation & Material Moving Occupation group is the largest occupational group in the T&W industry, representing over 4,600 jobs. This report analyzes the occupations that make up the Transportation & Warehousing industry, including current and projected employment, the expected number of annual openings over the coming years, the educational requirements of the occupation, and the number of relevant degrees awarded in the region. Key statistics about each occupational group are presented in the following sections: Key Occupations: an overview of 4 occupations that have a high number of openings and a high proportion of workers with some postsecondary education Overview: including the current and projected number of jobs in the Transportation & Warehousing industry and median hourly earnings for each occupation Projected Annual Openings: the number of annual openings in each occupation, broken down by new and replacement demand Labor Supply and Demand Analysis: the number of openings in each occupation are compared to the number of related program completions, to produce a completions-to-openings ratio, and the typical level of education required to enter the field Sources: Economic Modeling Specialists, Intl. (EMSI): current employment, projections, wages, openings, and completions data. Bureau of Labor Statistics (BLS): typical entry-level education requirements (national) and the breakdown of occupations by level of education in 2012/2013 (national) 116
118 Heavy and Tractor-Trailer Truck Drivers Definition: Drive a tractor-trailer combination or a truck with a capacity of at least 26,000 pounds Gross Vehicle Weight (GVW). May be required to unload truck. Requires commercial drivers' license. (Source: O*NET) Typical Job Titles: Delivery Driver, Driver, Line Haul Driver, Log Truck Driver, Over the Road Driver (OTR Driver), Production Truck Driver, Road Driver, Semi Truck Driver, Tractor Trailer Operator, Truck Driver (Source: O*NET) Key Statistics: Heavy and Tractor-Trailer Truck Drivers 2012/2013 Annual 2015 T&W Median Hourly Annual Related % of Workers with % of Workers Age Openings Employment Wages Completions Postsecondary 55 and older (All Industries) Education* 2,365 $ % 28% *Includes Post-secondary non-degree awards, Associate's, Bachelor's and above The Heavy and Tractor-Trailer Truck Drivers is by the far the largest occupational group in the T&W industry group, representing over 2,300 jobs, a quarter of all jobs in the industry. The occupational group is also a significant employer in other industries, such as Manufacturing. While the occupational group only grew modestly between 2005 and 2015, it is projected to have more significant growth over the next 10 years, adding early 230 jobs, a 10% increase in employment. Over the next 10 years, the Heavy and Tractor-Trailer Truck Drivers occupational group is expected to have nearly 120 openings annually, of which over half are expected to be in the T&W industry. These openings will be driven primarily by replacement demand, which accounts for 65% of openings, while new demand accounts for 35% of openings. In the Spokane Area, 28% of workers in this occupational group are aged 55 or older. As these workers may be planning to retire over the next 10 years, this presents an opportunity for new workers to enter the field. However, it also poses a challenge to employers, who will need to replace many experienced workers over a relatively short period of time. At $18.57, the Median Hourly Wages in this occupational group are slightly below the median for all jobs in the Spokane Area, however, they are approximately $3 higher than the median for jobs that require less than a 2-year degree. According to the BLS, a postsecondary non-degree award is typically required to enter this occupational group. In this case, this designation reflects that a commercial driver s license (CDL) is typically required of workers in this occupational group. According to the National Center of Education Statistics, there were no certificates awarded associated with this occupational group in the Spokane Area. However, Spokane Community College offers a Professional Truck Driver Training that prepares students to receive their CDL. As the CDL is a requirement of workers in this field, it is critical that the pipeline of workers is sufficient to fill the 119 Heavy and Tractor-Trailer Truck Drivers openings expected annually. 117
119 Labor and Freight, Stock, and Material Movers, Hand Definition: Manually move freight, stock, or other materials or perform other general labor. Includes all manual laborers not elsewhere classified. (Source: O*NET) Typical Job Titles: Dock Worker, Laborer, Line Tender, Loader, Material Handler, Merchandise Pickup/Receiving Associate, Receiver, Receiving Associate, Shipping and Receiving Materials Handler, Warehouse Worker (Source: O*NET) Key Statistics: Laborers and Freight, Stock, and Material Movers, Hand 2012/2013 Annual 2015 T&W Median Hourly Annual Related % of Workers with % of Workers Age Openings Employment Wages Completions Postsecondary 55 and older (All Industries) Education* 858 $ % 15% *Nationally, includes Post-secondary non-degree awards, Associate's, Bachelor's and above The Laborers and Freight, Stock, and Material Movers (Hand) accounts for 10% of employment in the T&W industry. In 2015, this occupational group represented over 850 jobs, having increased employment by 100 jobs since 2005, a 13% increase. This growth is expected to continue, with employment expanding by another 15% by 2025, adding over 130 jobs. The T&W industry only represents 20% of total employment in this occupational group. The Manufacturing industry is also a major employer of these workers. The Laborers and Freight, Stock, and Material Movers (Hand) occupational group is projected to have over 200 openings annually over the next 10 years, of which, over 40 are expected to be in the T&W industry. The relatively high number of openings is due in part to the size of the industry, the strong employment growth expected, and non-retirement turnover in the occupational group. Replacement demand is expected to be responsible for nearly 70% of openings while new demand accounts for approximately 30%. Overall, workers in this occupational group are young, with workers over the age of 55 accounting for just 15% of employment. Coupled with the low wages and the high rate of turnover, this suggests that this occupation is entry-level workers may begin in this occupational group, gain experience, and then move into different fields in the T&W or other industries. At $12.25, the median hourly wages in this industry are low relative to the median for all Spokane jobs. Within the T&W industry, these wages are also on the lower end. Low wages may contribute in part to the high turnover in this occupational group. According to the BLS, the typical entry level education required of workers in this occupational group is less than a high school diploma. Nationally, just a third of workers in this field have a postsecondary credential or degree. In the Spokane Area, no credentials or degrees related to this occupational group were awarded in However, with the high turnover rate and low typical education requirements, it is unlikely that employers require a postsecondary credential to enter the field. However, a postsecondary credential may be required to move from this occupational group into a higher paying occupations in the T&W industry. 118
120 Light Truck or Delivery Services Drivers Definition: Drive a light vehicle, such as a truck or van, with a capacity of less than 26,000 pounds Gross Vehicle Weight (GVW), primarily to deliver or pick up merchandise or to deliver packages. May load and unload vehicle. (Source: O*NET) Typical Job Titles: Bulk Delivery Driver, Delivery Driver, Driver, Driver/Merchandiser, Package Car Driver, Package Delivery Driver, Route Driver, Route Supervisor, Service Provider, Truck Driver (Source: O*NET) Key Statistics: Light Truck or Delivery Services Drivers 2012/2013 Annual 2015 T&W Median Hourly Annual Related % of Workers with % of Workers Age Openings Employment Wages Completions Postsecondary 55 and older (All Industries) Education* 551 $ % 23% *Nationally, includes Post-secondary non-degree awards, Associate's, Bachelor's and above In 2015, the Light Truck or Delivery Services Drivers occupational group accounted for over 550 jobs in the T&W industry, accounting for 6.5% of all T&W jobs. Employment growth in this occupational group has been modest over the past 10 years. This low growth is expected to continue between 2015 and 2025, with the occupational group projected to add just 17 jobs, a 3% increase in employment. The Light Truck of Delivery Services Drivers occupational group also has significant employment in other industries, including Retail Trade, Wholesale Trade, and Manufacturing. Over the next 10 years, 34 annual openings are projected in this occupational group, of which, 11 are expected to be in the T&W industry group. Openings in this industry group are primarily driven by replacement demand, which accounts for 85% of openings. New demand accounts for 15%. Nearly a quarter of workers in this occupational group are aged 55 or older. Over the next decade, these employees may be planning to retire, creating a demand for new workers. While this presents an opportunity for workers interested in entering the field, it may pose a challenge to employers. Median hourly wages are nearly $15 for this occupation in the Spokane Area, $4 lower than the median for all jobs in the region and similar, but slightly lower, than the median wage for jobs that require less than a 2-year degree. According to the BLS, employers typically require that workers have a high school diploma or equivalent to enter this field. Nationally, only a third of workers in this occupational group have a postsecondary degree or credential. In 2014, there were no degrees or credentials awarded in the Spokane Area related to this occupational group. However, employers in the area may not require formal postsecondary education to qualify for jobs in this occupational group and may prefer applicants with relevant experience or to conduct their own onthe-job training. 119
121 Aircraft Mechanics and Service Technicians Definition: Diagnose, adjust, repair, or overhaul aircraft engines and assemblies, such as hydraulic and pneumatic systems. Includes helicopter and aircraft engine specialists. (Source: O*NET) Typical Job Titles: Aircraft Maintenance Director, Aircraft Maintenance Supervisor, Aircraft Maintenance Technician (Aircraft Maintenance Tech), Aircraft Mechanic, Aircraft Restorer, Aircraft Technician, Airframe and Powerplant Mechanic (A and P Mechanic), Aviation Maintenance Technician (AMT), Aviation Mechanic, Helicopter Mechanic (Source: O*NET) Key Statistics: Aircraft Mechanics and Service Technicians 2012/2013 Annual 2015 T&W Median Hourly Annual Related % of Workers with % of Workers Age Openings Employment Wages Completions Postsecondary 55 and older (All Industries) Education* 291 $ % 20% *Nationally, includes Post-secondary non-degree awards, Associate's, Bachelor's and above The Aircraft Mechanics and Service Technicians occupational group accounts for over 400 jobs in the Spokane Area, of which, nearly 300 jobs are in the T&W industry. Aircraft Mechanics and Service Technicians are also employed in the Manufacturing industry, due to the presence of the aerospace manufacturing firms. In the T&W industry, these workers are generally associated with the growth in air transportation. The occupational group has grown rapidly in the T&W industry, increasing employment by over 90 workers between 2005 and 2015, a 47% increase. This growth is expected to continue over the next 10 years, with employment projected to grow by another 90 workers, a 30% expansion in employment. Over the next 10 years, 23 annual openings are projected for this occupational group, of which, 18 openings are expected to be in this T&W industry. Openings are expected to be driven nearly equally by new and replacement demand. Workers in this occupational group are aging, with approximately 20% of Aircraft Mechanics and Service Technicians aged 55 or older. These workers may be planning to retire over the next 10 years, creating demand for workers to fill open positions. Given the specialized training required for this occupational group and the rapid growth in employment, these retirements may pose a serious challenge to the region s employers. The median wage for this occupation is $26.62 per hour, which is significantly higher than the median wage for all Spokane Area jobs. Wages in this occupational group are among the highest in the T&W industry group. According to the BLS, the Aircraft Mechanics and Service Technicians occupational group typically requires a postsecondary non-degree award to enter the field. Nationally, 70% of workers in this field have some postsecondary education. In the Spokane Area, no certificates or degrees were awarded related to this occupational group. However, there are over 300 degrees and certificates awarded annually in other mechanic/repair/technician-related programs. It is possible that some of these programs may adequately prepare workers for employment in the Aircraft Mechanics and Service Technicians occupational group. 120
122 Transportation & Warehousing Occupation Overview Selection Criteria for Occupations Included: At least 100 jobs in the Transportation & Warehousing industry At least 5 openings annually Data Included: 2015 Percent of in the Transportation & Warehousing Industry 2015 to 2025 Change (absolute change and percent change) Median Hourly Earnings Key Findings: Employment in the T&W industry is relatively concentrated in few large occupational groups, specifically Heavy and Tractor-Trailer Truck Drivers, Laborers and Freight, Stock, and Material Movers (Hand), and Light Truck or Delivery Drivers. Combined, these three occupational groups account for 45% of all T&W employment. While overall, the industry is expected to experience relatively low growth, certain occupational groups within the industry are expected to grow rapidly. The Heavy and Tractor-Trailer Truck Drivers, Laborers and Freight, Stock, and Material Movers (Hand), and Bus Drivers occupational groups are expected to experience over 10% employment growth while the Aircraft Mechanics and Service Technicians occupational group is projected to expand by over 30%. Some of the largest occupational group in the T&W industry have significant employment in other industry clusters as well. Specifically, occupations related to packing and shipping are also closely tied to the Manufacturing industry. The Aircraft Mechanics and Service Technicians occupational group is also employed by the Manufacturing industry due to the presence of aerospace manufacturing firms. For the largest occupational groups, median hourly wages range from around $12 to over $27. Overall, the industry is dominated by lower wage jobs. However, the jobs that typically require some postsecondary credential are typically associated with higher wages. Overall, educational requirements are also very low in the T&W industry most occupational group require a high school diploma and very few require a Bachelor s or Associate s degree. 121
123 Transportation and Material Moving Occupations Overview: Transportation and Material Moving Occupations SOC 2015 T&W % of in T&W Industry # Change % Change Median Hourly Earnings (All Industries) First-Line Supervisors of Transportation and Material-Moving Machine and Vehicle Operators % 16 10% $ Bus Drivers, School or Special Client % 46 13% $ Heavy and Tractor-Trailer Truck Drivers 2,365 56% % $ Light Truck or Delivery Services Drivers % 17 3% $ Locomotive Engineers % 21 13% $ Railroad Conductors and Yardmasters % 22 13% $ Laborers and Freight, Stock, and Material Movers, Hand % % $12.25 Bold designates occupations that added the most jobs in the Transportation & Warehousing industry Installation, Maintenance, and Repair Occupations Overview: Installation, Maintenance, and Repair Occupations SOC 2015 T&W % of in T&W Industry # Change % Change Median Hourly Earnings (All Industries) Aircraft Mechanics and Service Technicians % 90 31% $ Bus and Truck Mechanics and Diesel Engine Specialists % 13 9% $18.58 Bold designates occupations that added the most jobs in the Transportation & Warehousing industry Office and Administrative Support Occupations Overview: Office and Administrative Support Occupations SOC 2015 T&W % of in T&W Industry # Change % Change Median Hourly Earnings (All Industries) Customer Service Representatives 133 2% 26 20% $ Dispatchers, Except Police, Fire, and Ambulance % 17 11% $ Office Clerks, General 113 2% 13 11% $13.97 Bold designates occupations that added the most jobs in the Transportation & Warehousing industry 122
124 Projected Annual Openings Selection Criteria for Occupations Included: At least 100 jobs in the Transportation & Warehousing industry At least 5 openings annually Data Included: Annual Openings (All Industries): represents the average number of job openings over the next 10 years due to retirements/turnover (replacement demand) and economic growth (new demand) Estimated Annual Openings (Transportation & Warehousing): of the annual openings, the number estimated to be in the T&W industry. The number of openings is only provided for an occupation, but not the portion of the occupation in a certain industry. To estimate the number of openings specifically in the T&W industry, Camoin Associates assessed the number of new jobs expected in the T&W industry over the next 10 years and the portion of T&W jobs in the occupation overall. New Demand: job openings in an occupation created by new jobs being added to an occupation/industry Replacement Demand: jobs openings in an occupation created by workers retiring or other turnover Key Findings: Due to the slow employment growth projected in the T&W industry overall, openings for most occupations are primarily driven by replacement demand. However, openings in the Aircraft Mechanics and Service Technicians occupational group is nearly equally driven by new and replacement demand. Most openings are in packing and shipping-related occupational groups, such as Heavy and Tractor-Trailer Truck Drivers and Laborers and Freight, Stock, and Material Movers (Hand). Replacement demand accounts for 65% and 69% of openings in these occupational groups, respectively. The Customer Service Representatives and Office Clerks (general) occupational groups have more significant employment in other industry groups. Overall, these occupational groups are projected to have over 280 and 220 openings annually, respectively. Of these openings, fewer than 10 are expected to be in the T&W industry. 123
125 Transportation and Material Moving Occupations Projected Annual Openings: Transportation and Material Moving Occupations SOC Annual Openings (All Industries) Est. Annual Openings (T&W) Estimated % New Demand % Replacement Demand First-Line Supervisors of Transportation and Material-Moving Machine and Vehicle Operators % 74% Bus Drivers, School or Special Client % 59% Heavy and Tractor-Trailer Truck Drivers % 65% Light Truck or Delivery Services Drivers % 85% Locomotive Engineers % 71% Railroad Conductors and Yardmasters % 72% Laborers and Freight, Stock, and Material Movers, Hand % 69% Bold designates occupations with the highest number of Transportation & Warehousing Annual Openings Installation, Maintenance, and Repair Occupations Projected Annual Openings: Installation, Maintenance, and Repair Occupations SOC Annual Openings (All Industries) Est. Annual Openings (T&W) Estimated % New Demand % Replacement Demand Aircraft Mechanics and Service Technicians % 51% Bus and Truck Mechanics and Diesel Engine Specialists % 71% Bold designates occupations with the highest number of Transportation & Warehousing Annual Openings Office and Administrative Support Occupations Projected Annual Openings: Office and Administrative Support Occupations SOC Annual Openings (All Industries) Est. Annual Openings (T&W) Estimated % New Demand % Replacement Demand Customer Service Representatives % 60% Dispatchers, Except Police, Fire, and Ambulance % 74% Office Clerks, General % 67% Bold designates occupations with the highest number of Transportation & Warehousing Annual Openings 124
126 Labor Supply and Demand Analysis Selection Criteria for Occupations Included: At least 100 jobs in the Transportation & Warehousing industry At least 5 openings annually Data Included: Annual Openings (All Industries): represents the average number of job openings over the next 10 years due to retirements/turnover (replacement demand) and economic growth (new demand) Annual Related Completions: represents all degrees awarded in educational programs that could funnel workers into the occupation Completions Allocated to Occupation: as most educational programs prepare graduates for multiple occupations, this statistic assesses the number of graduates that would be expected to enter a specific occupational field, based on the amount of competition for those graduates from other occupational groups. Completions to Openings Ratio: compares the number of completions allocated to occupation to the number of annual openings. A ratio of 1 would signify that there are exactly the same number of graduates as openings. If the ratio is less than 1, there are fewer educational awards than the number of annual openings while a ratio greater than 1 would mean there are more educational awards than openings. Typical Level of Education Required: determined by the Bureau of Labor Statistics (BLS), this represents the level of education typically required nationally to enter an occupational field. This may vary widely based on the industry and location. Percent of Workers with Postsecondary Education: determined by the Bureau of Labor Statistics, this number represents the proportion of workers in the occupational group that have some college, a postsecondary non-degree award, an Associate s degree, Bachelor s degree, or more advanced level of education. Key Findings: Based on this analysis, there are few educational programs related to occupations in the T&W industry in the Spokane Area. However, many occupations in this industry group typically require just a high school diploma to enter the field. Employers hiring workers for these positions may prefer some prior work experience or to conduct their own on-the-job training to hiring workers with a formal postsecondary credential. For the Heavy and Tractor-Trailer Truck Drivers occupational group, a commercial driver s license (CDL) is typically required. While there are nearly 120 annual openings projected in this occupational group (both in the T&W industry and in other industries), there are not an adequate number of programs training workers for this occupation in the Spokane Area, according to the National Center for Education Statistics. While there are no certifications awarded in the region specifically related to the Aircraft Mechanics and Service Technicians occupational group, educational institutions in the region do have other mechanic and technician-related programs. For example, there were over 60 credentials awarded related to the Bus and Truck Mechanics and Diesel Engine Specialists occupational group in 2014, while there are just 19 openings projected in this field annually. 125
127 Transportation and Material Moving Occupations Labor Supply and Demand Analysis: Transportation and Material Moving Occupations SOC % of Workers Completions Annual Openings Annual Related Completions to with Allocated to Typical Level of Education Required (All Industries) Completions Openings Ratio Postsecondary Occupation Education* First-Line Supervisors of Transportation and Material-Moving Machine and Vehicle Operators High school diploma or equivalent 57% Bus Drivers, School or Special Client High school diploma or equivalent 45% Heavy and Tractor-Trailer Truck Drivers Postsecondary non-degree award 34% Light Truck or Delivery Services Drivers High school diploma or equivalent 34% Locomotive Engineers High school diploma or equivalent 63% Railroad Conductors and Yardmasters High school diploma or equivalent 63% Laborers and Freight, Stock, and Material Movers, Hand Less than high school 32% *Nationally, includes Post-secondary non-degree awards, Associate's, Bachelor's and above Installation, Maintenance, and Repair Occupations Labor Supply and Demand Analysis: Installation, Maintenance, and Repair Occupations SOC % of Workers Completions Annual Openings Annual Related Completions to with Allocated to Typical Level of Education Required (All Industries) Completions Openings Ratio Postsecondary Occupation Education* Aircraft Mechanics and Service Technicians Postsecondary non-degree award 70% Bus and Truck Mechanics and Diesel Engine Specialists High school diploma or equivalent 39% *Nationally, includes Post-secondary non-degree awards, Associate's, Bachelor's and above Office and Administrative Support Occupations Labor Supply and Demand Analysis: Office and Administrative Support Occupations SOC % of Workers Completions Annual Openings Annual Related Completions to with Allocated to Typical Level of Education Required (All Industries) Completions Openings Ratio Postsecondary Occupation Education* Customer Service Representatives High school diploma or equivalent 69% Dispatchers, Except Police, Fire, and Ambulance High school diploma or equivalent 63% Office Clerks, General High school diploma or equivalent 67% *Nationally, includes Post-secondary non-degree awards, Associate's, Bachelor's and above 126
128 Manufacturing Targeted Sector Analysis 127
129 Aerospace Product and Parts Manufacturing Industry Definition Source: IBISWorld Companies in this industry manufacture and overhaul complete aircraft, develop prototypes and convert aircraft. The industry also includes the manufacture, conversion and overhaul of aircraft engines and propulsion systems. Additionally, the industry makes related parts and auxiliary equipment. National Perspective Source: IBISWorld The Aerospace Product and Parts Manufacturing industry experienced strong revenue growth between 2010 and This growth was largely driven by pent up demand due to low spending on new aircraft by airlines during the recent recession. As the economy has recovered and airline traffic has increased, airlines have begun replacing aging aircraft and increasing the size of their fleet, driving growth in the aerospace manufacturing industry. Additionally, growth in the industry has been driven by growing defense spending and airline traffic in the developing world. While nationally, the Aerospace Product and Parts Manufacturing industry has experienced strong revenue growth between 2010 and 2015, it continues to face a range of challenges and obstacles. Recent decreases to the federal defense spending as well as spending shifting from large aircraft to new technologies, such as drones, threaten future revenue growth. While exports have been strong for the industry, accounting for approximately 50% of revenues, this market may also be under threat. Growth in the developing world is slowing and the US dollar is increasing in value, relative to rival currencies, making US exports more expensive. Additionally, the domestic industry faces competition from foreign imports, especially as the dollar strengthens. The industry also has a range of opportunities. Due to the decline in fuel prices, some airlines may have budget surpluses that may be allocated to purchasing new aircraft and equipment. The industry also has opportunities for innovation, particularly to develop more fuel efficient aircraft. Finally, growing defense spending on drone technology offers new opportunities for startups and innovative businesses in the cluster. Industry Overview Employment in the Aerospace Product and Parts Manufacturing industry sector is most concentrated in the Aircraft Parts and Auxiliary Equipment Manufacturing sector, which accounts for nearly 90% of employment in the industry. The Aircraft Manufacturing sector is much smaller, representing just over 100 jobs in Both industry sectors have higher than average earnings per worker, especially the Aircraft Manufacturing sector, the earnings of which exceed $100,000 per worker. Overall, earnings per worker in this cluster are nearly $20,000 higher than the overall average for the Manufacturing industry. Employment in the Aerospace Product and Parts Manufacturing industry sector is over 3.5 times more concentrated in the Spokane Area than in the US overall. Aerospace Product & Parts Manufacturing Industry Overview, 4 Digit NAICS - Spokane Area NAICS Average 2015 Location % of Gross Regional Earnings Per Quotient Cluster Product Worker Aircraft Manufacturing 112 $108, % $20,289,521 Other Aircraft Parts and Auxiliary Equipment Manufacturing 859 $79, % $138,884, Aerospace Product and Parts Manufacturing 988 $82, % $161,369,
130 Historic Change in Employment The industry has grown rapidly since 2005, adding over 500 jobs. This growth was driven by the manufacturing of aircraft parts and equipment, rather than the manufacturing of aircraft themselves. The Aircraft Manufacturing sector actually shed nearly 20 jobs over this period, while the Other Aircraft Parts and Auxiliary Equipment Manufacturing sector added over 500 jobs, an increase of nearly 180%. Aerospace Product & Parts Manufacturing Industry Historic Change, 4 Digit NAICS - Spokane Area NAICS # Change % Change Aircraft Manufacturing % Other Aircraft Parts and Auxiliary Equipment Manufacturing % 3364 Aerospace Product and Parts Manufacturing % Projected Change in Employment Over the next 10 years, these trends are expected to continue, although the rate of growth will slow substantially. Overall, the cluster is expected to add over 130 jobs, expanding employment by 14%. Employment in the Aircraft Manufacturing industry is expected to continue to decline, shedding 11 jobs by However, over the same period, the Other Aircraft Parts and Auxiliary Equipment Manufacturing is expected to add over 150 jobs, increasing by 18%. By 2021, the Aerospace Product & Parts Industry is expected to account for well over 1,100 jobs. Aerospace Product & Parts Manufacturing Industry Projected Change, 4 Digit NAICS - Spokane Area NAICS # Change % Change Aircraft Manufacturing % Other Aircraft Parts and Auxiliary Equipment Manufacturing , % 3364 Aerospace Product and Parts Manufacturing 988 1,093 1, % Employment Demographics The distribution of workers in the Aerospace Product & Parts Manufacturing Industry largely mirrors the state and the nation. Nearly 30% of workers in region s industry are aged 55 or older while just 16% are between the ages of 25 to 34 and 17% are between the ages of 35 and 44. Another 34% of workers are between the ages of 45 and 54. With such a high proportion of workers nearing the age of retirement, the industry may face challenges developing a pipeline of workers to replace these experienced workers. 129
131 130
132 Pharmaceutical and Medicine Manufacturing National Perspective Source: IBISWorld The Pharmaceutical and Medicine Manufacturing industry is dominated by two primary groups: brand name drug manufacturers and generic drug manufacturers. Over the past 5 years, the two groups have experienced different trajectories in terms of revenue. For brand name pharmaceutical manufacturers, revenue has declined over the past 5 years while revenue for generic drug manufacturers has grown by $11 billion. This divergence is due in large part to the expiration of patents for blockbuster drugs, such as Lipitor, that has allowed generic pharmaceutical manufacturers to chip away at the sales of brand name manufacturers. Both groups are expected to experience revenue growth over the next 5 years. Revenue in the industry is driven largely by demographics, federal regulation, and R&D investment. As the population ages, demand for the industry s products is expected to grow. Additionally, the Affordable Care Act (ACA) and the expansion of Medicaid in many states provides access to pharmaceutical products to millions of Americans who were previously un- or under-insured. However, even as the number of customers for pharmaceutical products grow, revenue growth may be dampened by government regulation and insurers negotiating lower prices or restricting the use of pharmaceutical products. Additionally, investment in research and development may decrease as the budget of the National Institute of Health declines. Employment trends for brand name pharmaceutical manufacturers also differs from their generic counterparts. Over the past 5 years, employment at brand name pharmaceutical manufacturers has declined as R&D activities have been outsourced to Contract Research Organizations (CROs) and as manufacturers have merged and consolidated, eliminating duplicative plants and personnel. Generic manufacturers are expected to increase employment over the coming years as more patents expire and as the number of individuals with healthcare continues to expand. While traditional prescription drug manufacturing is considered a mature industry and the identification of new drug compounds has slowed, the market for biologic drugs is growing and is a strong opportunity for actors in the industry. Biologics includes a range of products, including vaccines, blood and blood components, allergenics, somatic cells, gene therapy, tissues, and recombinant therapeutic proteins. The Biological Product Manufacturing sector, which includes the production of biologics, is one of the largest and fastest growing sectors Pharmaceutical and Medicine Manufacturing Industry sectors in the Spokane Area. Like other manufacturers, businesses in the Pharmaceutical and Medicine Manufacturing industry face competition from foreign imports. The amount of drugs imported into the US over has grown steadily over the past 10 years and is projected to continue to grow. The strength of the dollar, relative to other global currencies, may result in additional import substitution while making pharmaceutical products exported from the US more expensive to foreign customers, further dampening demand. Additionally, increased competition domestically within the industry, coupled with the capital intensive nature of pharmaceutical production, may drive some actors out of the industry or result in further consolidation and streamlining of companies, leading to layoffs. Industry Overview In the Spokane Area, the Pharmaceutical and Medicine Manufacturing Industry accounted for 850 jobs. Overall, employment in the industry is slightly more concentrated than the US, with a location quotient of However, the Biological Product Manufacturing sector is extremely concentrated in the region, with a LQ of This sector is also the largest in the Pharmaceutical and Medicine Manufacturing industry, accounting for over 680 jobs, or 80% of employment in the industry. Average earnings per worker in the Pharmaceutical and Medicine Manufacturing industry are high, at $82,467, nearly $20,000 higher than the overall average for the manufacturing industry. 131
133 Pharmaceutical and Medicine Manufacturing Industry Overview, 4 Digit NAICS - Spokane Area NAICS Average 2015 Location % of Gross Regional Earnings Per Quotient Cluster Product Worker Pharmaceutical Preparation Manufacturing 134 $85, % $33,027, In-Vitro Diagnostic Substance Manufacturing 35 $110, % $9,583, Biological Product (except Diagnostic) Manufacturing 683 $80, % $274,499, Pharmaceutical and Medicine Manufacturing 851 $82, % $317,416,219 Historic Change in Employment The Pharmaceutical and Medicine Manufacturing industry has grown rapidly since 2005, adding over 470 jobs, an expansion of 125%. While all sectors in this industry experienced some growth, it was largely driven by the Biological Product Manufacturing sector, which added over 330 jobs. The Pharmaceutical Preparation Manufacturing and In- Vitro Diagnostic Substance Manufacturing sectors grew rapidly, expanding from very low employment numbers in Pharmaceutical and Medicine Manufacturing Historic Change, 4 Digit NAICS - Spokane Area NAICS # Change % Change Pharmaceutical Preparation Manufacturing % In-Vitro Diagnostic Substance Manufacturing % Biological Product (except Diagnostic) Manufacturing % 3254 Pharmaceutical and Medicine Manufacturing % Projected Change in Employment Growth in the Pharmaceutical and Medicine Manufacturing industry is expected to continue to grow over the coming years, but at a lower rate. Between 2015 and 2021, the industry is projected to add over 210 jobs, an expansion of 25%. The Biological Product Manufacturing industry will again drive employment growth in the industry, adding over 200 jobs. The Pharmaceutical Preparation Manufacturing sector is projected to contract slightly, shedding 9 jobs between 2015 and Pharmaceutical and Medicine Manufacturing Industry Projected Change, 4 Digit NAICS - Spokane Area NAICS # Change % Change Pharmaceutical Preparation Manufacturing % In-Vitro Diagnostic Substance Manufacturing % Biological Product (except Diagnostic) Manufacturing % 3254 Pharmaceutical and Medicine Manufacturing , % Employment Demographics Relative to the Manufacturing industry overall, employment in the Pharmaceutical and Medicine Manufacturing industry is more concentrated in younger age brackets. Additionally, the industry in the Spokane Area is more concentrated in 25 to 34 age cohort than the same industry in Washington and Idaho States and the US. The high 132
134 proportion of younger workers is likely due to the industry s recent rapid growth, which required it to quickly hire more workers. Due to the overall youth of the industry s workforce in the Spokane Area, the industry may require fewer workers due to retirements. However, even with the high concentration in the 25 to 34 age cohort, 17% of workers in the industry are over the age of 55 and another 29% are between the ages of 45 and 54. Many of these workers will likely be retiring over the next 10 to 15 years. 133
135 Semiconductor and Other Electrical Component Manufacturing Industry Definition Source: IBISWorld This industry includes companies that manufacture semiconductors and electronic components. Products in this industry include integrated circuits, memory chips, microprocessors, diodes, transistors and other optoelectronic devices, printed circuits, circuit boards, transformers, and connectors. National Perspective Source: IBISWorld The Semiconductor and Other Electronic Component Manufacturing industry primarily sells its products to the appliance manufacturing and consumer electronics industries. These industries both suffered during the recent recession, as building construction and consumer spending shrank. Even as demand from these sectors has grown, the industry has faced negative revenue growth over the past 5 years. While the industry is projected to show positive revenue growth over the coming years, the industry s growth is still expected to lag behind growth in the nation s overall GDP. The industry s sluggish growth, even as the economy overall has recovered, can largely be attributed to import substitution and some domestic companies moving operations offshore to areas with lower labor costs. In addition to lower labor costs, foreign competitors have benefitted from the stronger dollar, which makes imports cheaper and US exports more expensive. Imports of this industry s products into the US increased at a rate of 1.4% annually between 2010 and Over the same period, industry exports from the US have declined at an annual rate of 4.1%. This trend is expected to continue. Foreign competitors are forcing US producers to sell goods for less, depressing revenue in the industry. Even in this mature industry, there are a range of new opportunities for growth and innovation. As the consumer electronics industry continues to grow, demand for industry products are expected to grow as well. Smartphones are an especially important market for this industry, especially as consumers demand more sophisticated phones and other electronic devices that require more advanced electronic components. Additionally, there are opportunities to incorporate the industry s products into cars with more electronic and automatic safety features. Finally, the desire to create more energy efficient products could lead to innovation in the industry and the opportunity to create more valuable products. Even as revenue begins growing again, employment in the industry is expected to remain stagnant over the coming years, largely due to automation and technological improvements in the manufacturing processes. Additionally, as the number of industry establishments in the US shrinks, the number of workers has correspondingly declined. Industry Overview The Semiconductor and Other Electrical Component Manufacturing industry accounts for nearly 500 jobs in the Spokane Area. The industry in the region is made up of a diverse group of sectors. The largest sector, Printed Circuit Assembly (Electronic Assembly) Manufacturing, accounts for nearly 250 jobs, or approximately 50% of employment in the industry. Overall, employment in the industry is approximately half as concentrated in the Spokane Area as the US overall, with an LQ of However, Printed Circuit Assembly (Electronic Assembly) Manufacturing, the largest sector in the industry, is nearly twice as concentrated in the Spokane Area. With average earnings per worker of $51,000, the Semiconductor and Other Electronic Component Manufacturing industry has lower earnings than the overall average for the Manufacturing industry. The Printed Circuit Assembly (Electronic Assembly) Manufacturing industry, which represents the largest number of jobs, has the lowest average 134
136 earnings in the industry. Other Electronic Component Manufacturing, which is the second largest sector, has average earnings much higher than the overall Manufacturing industry average. Semiconductor and Other Electronic Component Manufacturing Industry Overview, 4 Digit NAICS - Spokane Area NAICS Average 2015 Location % of Gross Regional Earnings Per Quotient Cluster Product Worker Semiconductor and Related Device Manufacturing 66 $40, % $2,736, Electronic Connector Manufacturing 57 $66, % $6,852,078 Printed Circuit Assembly (Electronic Assembly) Manufacturing 243 $35, % $26,851, Other Electronic Component Manufacturing 113 $86, % $15,090, Semiconductor and Other Electronic Component Manufacturing 481 $51, % $51,660,701 Historic Change in Employment The industry has grown rapidly, increasing from approximately 300 jobs in 2005 to 480 jobs in 2015, an increase of 184 jobs, or 62%. Growth in the industry was driven by the Printed Circuit Assembly Manufacturing sector, which added nearly 200 jobs. The Semiconductor and Related Device Manufacturing and Electronic Connector Manufacturing, which represented very few jobs in 2005, added 60 jobs and 50 jobs, respectively. Other Electronic Component Manufacturing, which was the largest sector in this industry in 2005, contracted by nearly 50% over the past 10 years, shedding over 100 jobs. Semiconductor and Other Electronic Component Manufacturing Industry Historic Change, 4 Digit NAICS - Spokane Area NAICS # Change % Change Semiconductor and Related Device Manufacturing % Electronic Connector Manufacturing % Printed Circuit Assembly (Electronic Assembly) Manufacturing % Other Electronic Component Manufacturing % 3344 Semiconductor and Other Electronic Component Manufacturing % Projected Change in Employment Growth in the industry is expected to continue over the next 10 years, with employment increasing by over 200 jobs, an expansion of over 40%. Growth in the industry will again be driven by the Printed Circuit Assembly (Electronic Assembly) Manufacturing industry, which is projected to expand employment by 66%, adding 160 jobs. The Semiconductor and Related Device Manufacturing and Electronic Connector Manufacturing sectors are also expected to expand employment. The Other Electronic Component Manufacturing industry sector is expected to continue to shed jobs, but at a much lower rate. The industry is projected to lose 18 jobs, decreasing employment by 16%. 135
137 Semiconductor and Other Electronic Component Manufacturing Industry Projected Change, 4 Digit NAICS - Spokane Area NAICS # Change % Change Semiconductor and Related Device Manufacturing % Electronic Connector Manufacturing % Printed Circuit Assembly (Electronic Assembly) Manufacturing % Other Electronic Component Manufacturing % 3344 Semiconductor and Other Electronic Component Manufacturing % Employment Demographics Employment in the Semiconductor and Other Component Manufacturing industry is more concentrated in the 55 to 64 and 65+ age cohorts than WA/ID States and the nation. Workers in these age cohort account for nearly 30% of employment in the region s industry while they account for 17% in Washington and Idaho States and 21% in the US overall. Conversely, the industry is less concentrated in lower age brackets, with just 11% of workers aged 25 to 34. With such a high proportion of workers over the age of 55, the Semiconductor and Other Component Manufacturing industry may have large numbers of workers retiring over the coming years. 136
138 Electrical Equipment Manufacturing Industry Definition Source: IBISWorld This industry manufactures power, distribution and specialty transformers; electric motors, generators and motorgenerator sets; switchgear and switchboard apparatus; relays; and industrial controls. Electrical equipment manufacturers sell their products to other manufacturing industries, wholesalers and the construction sector. National Perspective Source: IBISWorld The Electrical Equipment Manufacturing industry suffered during the recent recession, but has begun to recover. Between 2010 and 2015, revenue grew by just 0.3% annually. As new construction begins to increase over the coming years, it is expected that revenue in the industry will also grow, rising to an annual growth rate of 1.4% over the next 5 years. However, this growth still lags behind the projected growth in GDP. In addition to the effects of the recession, the industry faces increasing competition from imports to the US and lower demand for its products abroad. Foreign products in this industry benefit from lower wages and the improving strength of the dollar relative to other currencies, which makes US exports more expensive. In 2015, imports met nearly 54% of domestic demand, in increase from nearly 46% in Slow revenue growth and increased foreign competition have led to plant closures and consolidation in the industry. Overall, the number of US establishments in the industry has been decreasing, reflecting the more consolidated nature of the industry. Many domestic industries are also capitalizing on the lower wages elsewhere by moving some production offshore. These changes are also impacting the industry s workforce. Some companies are retaining only highly skilled positions in the US while lower skilled production work is moved offshore. Others are replacing low skilled work with automation. Overall, the revenue per employee is increasing in the industry, due to technological advances, and the average earnings per employee is also increasing, reflecting the higher skilled nature of the work. Industry Overview The Electrical Equipment Manufacturing industry is one of the largest sub-clusters in the Spokane Area s Manufacturing industry, representing over 2,200 jobs. In the Spokane Area, the industry is comprised of two sectors: Switchgear and Switchboard Apparatus Manufacturing, which accounted for just 2% of jobs in the industry, and Relay and Industrial Control Manufacturing, which represents 2,160 jobs, or 98% of industry employment. Employment in the Relay and Industrial Control Manufacturing industry is also highly concentrated in the Spokane Area, with a location quotient of 20. Overall, employment in the Electrical Equipment Manufacturing industry is nearly 7 times more concentrated in the Spokane Area than in the US. Average earnings per worker in the industry are approximately $20,000 higher in the Electrical Equipment Manufacturing industry than in the Manufacturing industry overall. Electrical Equipment Manufacturing Industry Overview, 4 Digit NAICS - Spokane Area NAICS Average 2015 Location % of Gross Regional Earnings Per Quotient Cluster Product Worker Switchgear and Switchboard Apparatus Manufacturing 47 $55, % $3,398, Relay and Industrial Control Manufacturing 2,160 $84, % $169,446, Electrical Equipment Manufacturing 2,208 $84, % $190,916,
139 Historic Change in Employment The Electrical Equipment Manufacturing industry has grown rapidly in the Spokane Area since Over the past 10 years, the industry has added over 1,350 jobs, an increase of 160%. The large increase in employment was primarily driven by the Relay and Industrial Control Manufacturing industry, which added over 1,400 jobs, expanding from 730 jobs in 2005 to 2,160 jobs in The Switchgear and Switchboard Apparatus Manufacturing industry cluster also added jobs over this period. Over the same period, two sectors in the Electrical Equipment Manufacturing industry contracted significantly and likely closed. The Power, Distribution, and Specialty Transformer and Motor and Generator Manufacturing sectors lost 89 and 29 jobs, respectively. Electrical Equipment Manufacturing Industry Historic Change, 4 Digit NAICS - Spokane Area NAICS # Change % Change Power, Distribution, and Specialty Transformer Manufacturing % Motor and Generator Manufacturing % Switchgear and Switchboard Apparatus Manufacturing % Relay and Industrial Control Manufacturing 731 1,287 2,160 1, % 3353 Electrical Equipment Manufacturing 850 1,517 2,208 1, % Projected Change in Employment Growth in the Electrical Equipment Manufacturing industry is projected to continue over the coming years, though at lower rate. Between 2015 and 2021, the industry is expected to add over 700 jobs, increasing employment by 32%. This growth will again be driven by the Relay and Industrial Control Manufacturing sector, which is projected to add nearly 700 jobs, expanding employment by 32%. By 2021, the Electrical Equipment Manufacturing Industry is projected to account for over 2,900 jobs. Electrical Equipment Manufacturing Industry Projected Change, 4 Digit NAICS - Spokane Area NAICS # Change % Change Switchgear and Switchboard Apparatus Manufacturing % Relay and Industrial Control Manufacturing 2,160 2,575 2, % 3353 Electrical Equipment Manufacturing 2,208 2,630 2, % Employment Demographics Relative to the US, employment in the Electrical Equipment Manufacturing industry is much more concentrated in lower age brackets. Workers under the age of 35 account for nearly 50% of industry workers in the Spokane Area while this same group accounts for just 23% of industry workers in the US. Conversely, the industry is less concentrated in workers over the age of 55, which accounts for just 9% of industry workers in the Spokane Area. The relative youth of the industry s workforce in the Spokane Area is likely due to the recent rapid employment growth in the industry. 138
140 139
141 Finance & Insurance Targeted Sector Analysis 140
142 Depository Credit Intermediation Industry Definition Source: IBISWorld This industry comprises banks that provide financial services to retail and business clients in the form of commercial, industrial and consumer loans. Banks accept deposits from customers, which are used as sources of funding for loans. This industry includes products like savings accounts and certificates of deposit (CDs). Businesses in this industry are regulated by the Office of the Comptroller of the Currency. This also includes member-owner credit unions that provide deposit taking and lending services. National Perspective Source: IBISWorld The Depository Credit Intermediation industry is primarily comprised of the Commercial Banking, Savings Institutions, and Credit Unions sectors. Revenue in these industry sectors is primarily driven by the housing market, including the number of sales and home prices, credit markets, stock market performance, consumer spending, and interest rates. The Commercial Banking industry sector was heavily impacted by the recent recession and revenue has declined every year since In 2015, industry revenue began to recover and it is expected to increase at a 4% annual rate over the next 5 years. However, even as industry revenues have declined, the industry s profit margins have increased, due in large part to industry consolidation and growth in the stock market. The number of individual banks and banking establishments is expected to decline steadily over the coming years. Government revenue is expected to reign in profits over the coming years and impose additional constraints on the banking industry. Additionally, technology is changing the business model of the industry and may result in a diminished role for retail banking establishments and industry employment. Many of the new jobs that are created by the industry are expected to be in the technology and related aspects of the industry, with fewer loan processing and banking clerk positions. As the skills and education demanded of these new workers increases, wages are also expected to increase. The Savings Institutions industry sector was similarly affected by the recent recession. Recovery for this industry has been slow as it has ceded market share to commercial banks. The industry faces intense competition both due to the number of businesses within the sector and businesses operating in other sectors offering similar services. Additionally, regulation for the industry is expected to grow in response to the 2008 financial crisis. These regulations will limit the industry s ability to increase revenue while also requiring the industry to retain a higher proportion of deposits. The Credit Unions industry sector also faced declining revenue due to the financial crisis and subsequent recession. Revenue continued to decline through 2015, due to low interest rates, high capital requirements, and a slow housing market. The industry may face even more regulatory constraints and higher capital requirements over the coming years. However, businesses in the Credit Unions sectors have seen the number of members and value of deposits increase over the past 5 years. This is due, in part, to the negative public perception of large, national banks. Similar to the Savings Institution sector, the Credit Unions sector faces intense competition from businesses outside of the industry sector, particularly the Commercial Banking sector. This sector is able to leverage name recognition and economies of scale to attract new customers. Additionally, the Commercial Banking sector offers a range of services, in addition to traditional depository and lending services, that businesses in the Credit Unions and Savings Institutions sectors are not able to offer. Finally, the Commercial Banking sector is able to offer online banking 141
143 services demanded by younger consumers that smaller competitors in the Savings Institutions and Credit Unions sectors may not be able to offer. Industry Overview The Depository Credit Intermediation industry is one of the largest employers in the Spokane Area. The industry accounts for over 5,000 jobs and nearly $900 million of the region s Gross Regional Product. Employment in the industry is primarily concentrated in the Commercial Banking and Credit Unions sectors, with a significant employment presence of the Savings Institutions sector as well. At over $63,000, average earnings per worker are higher than the regional average but low for the Finance & Insurance industry group. Employment in the Depository Credit Intermediation industry is approximately a third more concentrated in the Spokane Area than in the US overall. Employment in Credit Unions, is significantly more concentrated in the Spokane Area than the nation, with a location quotient of over 2.6. Depository Credit Intermediation Industry Overview, 4 Digit NAICS - Spokane Area NAICS Average 2015 Location % of Gross Regional Earnings Per Quotient Cluster Product Worker Commercial Banking 2,962 $63, % $550,288, Savings Institutions 643 $71, % $98,230, Credit Unions 1,469 $59, % $222,939, Depository Credit Intermediation 5,074 $63, % $871,756,700 Historic Change in Employment Between 2005 and 2015, the Depository Credit Intermediation industry added over 260 jobs, expanding employment by 5%. However, this growth was not evenly distributed across all industry sectors. The Commercial Banking sector, which accounts for the greatest number of jobs in the industry group, contracted by 10% over this period, shedding nearly 330 jobs. Conversely, Credit Unions experienced strong employment growth, adding 450 jobs, an increase of 44%. The Savings Institutions sectors also grew rapidly, adding nearly 140 jobs, an increase of 28%. Depository Credit Intermediation Industry Historic Change, 4 Digit NAICS - Spokane Area NAICS # Change % Change Commercial Banking 3,290 3,287 2, % Savings Institutions % Credit Unions 1,018 1,165 1, % 5221 Depository Credit Intermediation 4,812 4,920 5, % Projected Change in Employment Growth is expected to continue in the industry over the coming years. Between 2015 and 2021, the industry is expected to add over 330 jobs, expanding employment by 7%. Employment in Commercial Banking is expected to rebound somewhat over this period, adding over 100 jobs, increasing 2015 employment by 4%. Again, the Credit Unions sector is expected to drive industry growth, adding over 330 jobs, an increase of 23%. Over the same period, Savings Institutions are expected to shed over 100 jobs, contracting by 16%. 142
144 Depository Credit Intermediation Industry Projected Change, 4 Digit NAICS - Spokane Area NAICS # Change % Change Commercial Banking 2,962 3,017 3, % Savings Institutions % Credit Unions 1,469 1,664 1, % 5221 Depository Credit Intermediation 5,074 5,279 5, % Employment Demographics Employment in the Depository Credit Intermediation industry in the Spokane Area largely mirrors the demographics of the industry in Washington and Idaho States. The industry s workforce is young, with 40% of workers under the age of 35 in the Spokane Area. This is similar to Washington and Idaho States and the US, although the local industry is slightly more concentrated in these age cohorts than the US overall. Locally, approximately one fifth of workers are between the age of 45 and 54 and another 18% are over the age of 55. While this industry is less concentrated in these age cohorts than others, it may still face waves of retirements over the coming years. 143
145 Agencies, Brokerages, and Other Insurance Related Activities Industry Definition Source: IBISWorld This industry includes two major groups: individuals and businesses that primarily act as agents or brokers in selling insurance policies and annuities and operators that investigate, appraise and settle insurance claims; provide thirdparty administration services of insurance and pension funds; and offer insurance advisory and ratemaking services. National Perspective Source: IBISWorld The Agencies, Brokerage, and Other Insurance Related Activities is composed of a variety of smaller industry sectors, including the Insurance Brokers and Agencies (the largest sector in this industry in the Spokane Area), Third Party Administration of Insurance and Pension Funds, and Claims adjusting sectors. The Insurance Brokers and Agencies sector is primarily composed of independent insurance brokers that facilitate industry purchases. Most industry revenue is derived from commissions. For this reason, revenue is driven by three factors: policy pricing, demand for insurance, and the popularity of using brokers to purchase insurance. Industry revenue has grown steadily over the past 5 years, increasing by 2.6% annually. This trend is projected to continue over the next 5 years, despite growing competition from insurance companies and underwriters providing sales services directly to customers, rather than using insurance brokers. Even as revenue grows, these competitive pressures may reduce the industry s profitability. In order to more effectively compete with direct sales from insurance companies, brokers are focusing on offering more value by acting as insurance consultants advising clients on risk management. To effectively make this transition, brokers are focusing on hiring more highly skilled and experienced workers, which is expected to result in an increase to the average wages paid in the industry. Internet sales and new technology have helped insurance brokerages grow revenue at a faster pace than employment growth. Insurance brokers are also responding to external and internal competition through mergers and acquisitions. Consolidation in the industry offers firms the opportunity to build economies of scale, offer more services, and enter niche markets. The Third-Party Administrators and Insurance Claims Adjusters industry plays a critical role in the insurance and retirement markets by enabling businesses to outsource claims processing, administrative services and risk management. Revenue for this industry has grown rapidly over the past 5 years, increasing by 4.5% annually. Revenue growth has been driven by the strengthening economy, increasing demand for insurance products, the implementation of the Affordable Care Act (ACA), and growing pension funds as the unemployment rate has decreased and workers have felt more confident saving. Revenue growth is expected to continue over the next 5 years at a similar rate. The industry is highly competitive. Many of the operators are small, with the majority existing as sole proprietorships with no employees. Downstream demand and new markets has created the opportunity for some firms to grow and benefit from economies of scale. However, the competitiveness of the industry is expected to reduce its profitability over the coming years. Consolidation and scale has also allowed some operators to invest in information technology upgrades, which has expanded the types of employees the industry employs to include IT professionals. Despite this, the number of employees has grown at a much lower rate than revenue, due to productivity gains. 144
146 Industry Overview The Agencies, Brokerages, and Other Insurance Related Activities group is one of the largest Finance & Insurance industries. The industry accounts for 3,250 jobs in the Spokane Area. Industry employment is dominated by the Insurance Agencies and Brokerages sector, which accounts for nearly 2,600 jobs, or 80% of industry employment. The Third Party Administration of Insurance and Pension Funds is also a large employer in this industry, accounting for nearly 500 jobs. This sector also has the highest average earnings per worker in the industry group. Agencies, Brokerages, and Other Insurance Related Activities Industry Overview, 4 Digit NAICS - Spokane Area NAICS Average 2015 Location % of Gross Regional Earnings Per Quotient Cluster Product Worker Insurance Agencies and Brokerages 2,591 $58, % $222,035, Claims Adjusting 75 $50, % $10,221,728 Third Party Administration of Insurance and Pension Funds 487 $70, % $21,514, All Other Insurance Related Activities 97 $56, % $11,076, Agencies, Brokerages, and Other Insurance Related Activities 3,250 $60, % $264,848,533 Historic Change in Employment The Agencies, Brokerages, and Other Insurance Related Activities industry has grown rapidly over the past 10 years, increasing employment by over 620 jobs, or 24%. Growth was driven by the industry s two largest sectors: Insurance Agencies and Brokerages and Third Party Administration of Insurance and Pension Funds, which added 412 and 215 jobs, respectively. Over the same period, the Claims Adjusting sector contracted by 34%, shedding nearly 40 jobs. Agencies, Brokerages, and Other Insurance Related Activities Industry Historic Change, 4 Digit NAICS - Spokane Area NAICS # Change % Change Insurance Agencies and Brokerages 2,179 2,475 2, % Claims Adjusting % Third Party Administration of Insurance and Pension Funds % All Other Insurance Related Activities % 5242 Agencies, Brokerages, and Other Insurance Related Activities 2,628 2,906 3, % Projected Change in Employment Employment growth is projected to continue, but at a lower rate. Between 2015 and 2021, the industry is expected to add nearly 280 jobs, increasing employment by 9%. Employment growth will again be driven by the Insurance Agencies and Brokerages sector, which is expected to add over 230 jobs, and the Third Party Administration of Insurance and Pension Funds sector, which is expected to add 60 jobs. 145
147 The Claims Adjusting sector is expected to continue to contract, shedding over 20 jobs, or 28% of employment. Agencies, Brokerages, and Other Insurance Related Activities Industry Projected Change, 4 Digit NAICS - Spokane Area NAICS # Change % Change Insurance Agencies and Brokerages 2,591 2,725 2, % Claims Adjusting % Third Party Administration of Insurance and Pension Funds % All Other Insurance Related Activities % 5242 Agencies, Brokerages, and Other Insurance Related Activities 3,250 3,405 3, % Employment Demographics Age demographics of workers in the Agencies, Brokerages, and Other Insurance Related Activities industry in the Spokane Area are similar to those in Washington and Idaho States and the US. In the US, the industry is slightly more concentrated in older age brackets than the Spokane Area, where just 18% of workers are over the age of 55. The Spokane Area is also more concentrated in the 25 to 34 age cohort, which accounts for 23% of local industry employment, than the US, where this cohort accounts for 20%. 146
148 Professional, Scientific, & Technical Services Targeted Sector Analysis 147
149 Accounting, Tax Preparation, Bookkeeping, and Payroll Services Industry Definition Source: IBISWorld Firms in this industry are certified to audit the accounting records of public and private organizations and to demonstrate compliance to generally accepted accounting practices. Certified public accountants (CPAs), included in this industry, provide a variety of accounting services, including auditing accounting records, designing accounting systems, preparing financial statements, developing budgets and providing advice on matters related to accounting. Tax Preparation Services are also an important sector of this industry. Firms in this industry sector provide tax return preparation services to individuals but do not offer accounting, bookkeeping, billing or payroll process services. National Perspective Source: IBISWorld The Accounting, Tax Preparation, Bookkeeping, and Payroll Services industry group is primarily comprised of two industry sub groups: Accounting Services and Tax Preparation Services. The Accounting Services industry has grown rapidly over the past 5 years, with revenue increasing at an annualized rate of 4.7%. In addition to revenue growth, the industry has also become increasingly profitable. Profitability has been driven by consolidation, with the major players acquiring small firms to increase market share and services, economic growth leading to demand for accounting services, and automation of some services, helping control the costs of labor. The industry does face increasing competition in the consumer market, especially as tax preparation and other accounting services become more widely adopted. However, losses to these new entrants are expected to be offset by growth in other service lines, such as growing number of US businesses, dynamic capital markets and initial public offerings, and advisory/consulting services. The Tax Preparation Services industry has also grown rapidly over the past 5 years, with revenue increasing annually by over 4%. This revenue growth is projected to continue over the next 5 years but at a slightly lower rate. Growth has been driven largely by the economic recovery, which has led to more employed workers who need support filing taxes. Strong revenue growth has occurred despite increased competition from online tax service providers, such as TurboTax. Traditional tax preparation service providers have attempted to adapt to this challenge offering lower prices, online services, and tax advisement and other add-on services, in addition to tax preparation services. Revenue from online, rather than in-person, tax preparation services is expected to continue to grow over the coming years. The number of establishments and employees are expected to grow only modestly over the coming years, compared to growth in revenue. This is in part a result of the growth in online services, reducing the need for brick and mortar establishments and labor intensive in-person services. Further, as the industry focuses more on online services, skilled IT professionals will be essential. Additionally, the workers providing in-person services will require advanced tax preparation skills in order to offer the more sophisticated add-on services. Industry Overview The Accounting, Tax Preparation, Bookkeeping, and Payroll Services industry accounts for over 2,760 jobs in the Spokane Area. Other Accounting Services, which includes accountant, bookkeeping, and billing offices, but does not include offices of CPAs, in the largest sector in this industry group, accounting for nearly 1,600 jobs, or 58% of industry employment. Employment in this industry is also highly concentrated, relative to the nation. Offices of CPAs and Tax Preparation Services are also large sectors, accounting for nearly 780 and over 300 jobs, respectively. 148
150 Overall, average earnings per worker in this industry are higher than the overall average for the Spokane Area and slightly lower than the average in the PST Services industry. Accounting, Tax Preparation, Bookkeeping, and Payroll Services Industry Overview, 4 Digit NAICS - Spokane Area NAICS Average 2015 Location % of Gross Regional Earnings Per Quotient Cluster Product Worker Offices of Certified Public Accountants 779 $59, % $58,970, Tax Preparation Services 314 $27, % $11,931, Payroll Services 79 $36, % $4,008, Other Accounting Services 1,592 $54, % $85,008, Accounting, Tax Preparation, Bookkeeping, and Payroll Services 2,765 $52, % $159,918,407 Historic Change in Employment Overall, the Accounting, Tax Preparation, Bookkeeping, and Payroll Services industry has grown rapidly since Over the past 10 years, the industry has added nearly 640 jobs, expanding employment by 30%. Growth in this industry has been driven by the Other Accounting Services sector, which has added 540 jobs. Tax Preparation services, the third largest sector in the industry, also demonstrated strong growth over the past 10 years, adding nearly 90 jobs, an increase of 39%. The Offices of Certified Public Accountants has struggled to recover from the recession, with the number of jobs essentially unchanged since Accounting, Tax Preparation, Bookkeeping, and Payroll Services Industry Historic Change, 4 Digit NAICS - Spokane Area NAICS # Change % Change Offices of Certified Public Accountants % Tax Preparation Services % Payroll Services % Other Accounting Services 1,052 1,419 1, % 5412 Accounting, Tax Preparation, Bookkeeping, and Payroll Services 2,127 2,549 2, % Projected Change in Employment Growth in the industry is expected to continue over the coming years, but at a lower rate. By 2021, the industry is expected to account for nearly 3,000 jobs, an increase of 230 jobs, or 8%. Other Accounting Services will again drive employment growth, adding nearly 170 over this period. Offices of CPAs and Payroll Services are expected to have stagnant employment growth over this period. 149

151 Accounting, Tax Preparation, Bookkeeping, and Payroll Services Industry Projected Change, 4 Digit NAICS - Spokane Area NAICS # Change % Change Offices of Certified Public Accountants % Tax Preparation Services % Payroll Services % Other Accounting Services 1,592 1,685 1, % 5412 Accounting, Tax Preparation, Bookkeeping, and Payroll Services 2,765 2,888 2, % Employment Demographics The workforce demographics of the Accounting, Tax Preparation, Bookkeeping, and Payroll Services industry largely mirror Washington and Idaho States and the US. Across all three geographies, the workforce is concentrated in workers over the age of 55. This cohort accounts for over a quarter of workers. The Spokane Area also has a high concentration of younger workers, with the 25 to 34 age cohort accounting for nearly 25% of industry workers. 150
152 Computer Systems Design and Related Services Industry Definition Source: IBISWorld The IT Consulting industry includes firms that provide the following services to client companies: writing, testing and supporting custom software; planning and designing integrated hardware, software and communication infrastructure; and on-site management of computer systems and data processing facilities. National Perspective Source: IBISWorld The Computer Systems Design and Related Services industry sector has grown steadily over the past 5 years, with revenue increasing by over 2% annually. This trend is expected to continue over the coming years. Revenue growth can be explained in part by overall growth in the US economy. However, the increasingly central role technology plays in nearly every sector in the economy and businesses of all sizes has also contributed to revenue growth. The market for these consulting services is steadily growing as firms increasingly invest in IT systems, cloud computing, big data analysis, and online and mobile customer interfaces. Both large and small firms play a large role in the industry. Major, national consulting firms, such as IBM and Accenture, also provide IT consulting services to clients However, small firms continue to play a large role in the industry, providing services to small clients as well as servicing smaller geographic areas outside of the typical market for larger firms. The industry is highly competitive with larger, established consulting firms entering the field or devoting additional resources to capitalizing on this market even as smaller firms begin operations. Though technology-driven, the industry is not immune to technological disruptions. For example, as cloud computing services (such as Sharepoint and Dropbox) increasingly replace local servers, IT services such as local server design and maintenance have suffered. At the same time, new products and services continue to be developed or grow in importance, such as mobile app development. Employment grew rapidly over the past 5 years, increasing at an average annual rate of 4.2%. Employment growth was concentrated among the national IT consulting firms. As demand for workers grows, the average industry wages are also expected to grow. The industry requires highly skilled workers with advanced education and credentials in IT and software development. Competition among employers for this pool of workers is expected to drive up wages. Additionally, IT consulting firms are also competing with many other industry sectors for these workers. The skills of these workers will need to be regularly updated to keep up with product and service innovations. Industry Overview The Computer Systems Design and Related Services industry is one of the largest sectors in the Spokane Area s PST Services industry, accounting for nearly 2,900 jobs. Employment in the group is most heavily concentrated in the Custom Computer Programming Services and Computer System Design Services sectors, which account for over 1,330 and nearly 1,300 jobs, respectively. Combined, these sectors account for over 90% of workers. While the Computer Systems Design and Related Services industry is large, it is approximately 40% less concentrated in the Spokane Area than in the US overall. Each sector present in the region is also between 33% and 56% less concentrated in the Spokane Area than in the US. This relatively low concentration of employment may signify that there are opportunities for additional industry employment growth in the region. Average earnings per worker in the industry are high, nearly double the average for the region overall and approximately $30,000 higher than the PST Services industry. Computer Systems Design Services, the second largest sector, has the highest average earnings per worker in the industry. 151
153 Computer Systems Design and Related Services Industry Overview, 4 Digit NAICS - Spokane Area NAICS Average 2015 Location % of Gross Regional Earnings Per Quotient Cluster Product Worker Custom Computer Programming Services 1,332 $78, % $96,987, Computer Systems Design Services 1,287 $97, % $117,031, Computer Facilities Management Services 78 $54, % $6,585, Other Computer Related Services 187 $58, % $14,512, Computer Systems Design and Related Services 2,883 $85, % $235,117,312 Historic Change in Employment The Computer Systems Design and Related Services industry has grown rapidly over the past decade. Between 2005 and 2015, the industry added 1,060 jobs, expanding employment by nearly 60%. The industry s largest sectors, Custom Computer Programming Services and Computer Systems Design Services, added the most jobs, increasing employment by approximately 600 and 550 jobs, respectively. Computer Facilities Management Services grew at the highest rate, increasing employment by nearly 170% over this period. While most sectors shared in the employment growth, the Other Computer Related Services sector contracted over this period, shedding nearly 150 jobs, or 44% of employment. Computer Systems Design and Related Services Industry Historic Change, 4 Digit NAICS - Spokane Area NAICS # Change % Change Custom Computer Programming Services 729 1,006 1, % Computer Systems Design Services , % Computer Facilities Management Services % Other Computer Related Services % 5415 Computer Systems Design and Related Services 1,823 2,196 2,883 1,060 58% Projected Change in Employment Employment growth in the Computer Systems Design and Related Services industry is expected to continue, but at a lower rate. Between 2015 and 2021, the industry is projected to expand employment by 25%, adding over 720 jobs. Growth will again be driven by the two largest sectors, Custom Computer Programming and Computer Systems Design Services, which are projected to add approximately 250 jobs, combined. The Other Computer Related Services sector is expected to continue to contract, shedding nearly 50 jobs. 152
154 Computer Systems Design and Related Services Industry Projected Change, 4 Digit NAICS - Spokane Area NAICS # Change % Change Custom Computer Programming Services 1,332 1,545 1, % Computer Systems Design Services 1,287 1,503 1, % Computer Facilities Management Services % Other Computer Related Services % 5415 Computer Systems Design and Related Services 2,883 3,286 3, % Employment Demographics The workforce of the Computer Systems Design and Related Services industry is young with 35% of workers under the age of 35 in the Spokane Area and just 14% of workers over 55. These demographics are similar in Washington and Idaho States and the US, however, the nation s Computer Systems workforce is slightly older. These employment demographics emphasize the recent growth in this industry group and the requirement that workers are in touch with new technological innovations and requirements. 153
155 Management, Scientific, and Technical Consulting Services Industry Definition Source: IBISWorld This industry provides a range of consulting services to businesses, nonprofits and public-sector agencies. National Perspective Source: IBISWorld The Management, Scientific, and Technical Consulting Services industry group has been growing rapidly nationally over the past 5 years. The industry is comprised of a range of sectors, from management consulting services to engineering services. Management Consulting Services has grown rapidly. Between 2010 and 2015, industry revenue increased by over 5% annually, dramatically outpacing growth in the economy overall. This trend is expected to continue over the coming years, though at a lower annual rate of 3.6%. The industry has benefitted from overall economic growth in the US and increasing corporate profits, which allowed business to budget funds for consulting services. Additionally, the economic disruption of the recent recession has also increased demand for consulting services, as businesses have attempted to mitigate risks by developing a stronger understanding of future economic trends and planning accordingly. Additionally, businesses began to outsource services to consulting firms that were formerly provided in-house. The industry has a mix of large, national consulting firms and smaller firms that generally serve local or niche markets. Consolidation has been a key trend over the past 5 years, with national firms acquiring smaller consulting firms to increase market share or develop niche services. However, with low barriers to entry, the number of firms in the industry is expected to increase rapidly. Another important sector in this industry is Environmental Consulting Services, which provides environmental assessments, site remediation planning, waste management, and natural resources management services primarily to construction, engineering, manufacturing, and government sectors. The industry was severely impacted by the recession, as governments at all levels cut funding for environmental assessments, causing revenue to decline consecutively from 2012 to However, as the economy has recovered, there has been a renewed investment by governments and corporations in reducing human impact on the environment. Additionally, as construction activity increases, environmental consulting firms will be necessary to help new construction meet new environmental standards. Generally, this industry has high wages due to the advanced education and skills required to work in the field. Finally, the Scientific and Economic Consulting sector has also experienced rapid growth over the past 5 years, with revenue increasing at an average annual rate of over 5%. This trend is expected to continue over the next 5 years, with revenue growing by over 4% annually. Demand for the services of the sector is driven primarily by government and corporate spending, research & development investment, and natural resource mining and exploration activity. Like other consulting industry sectors, many firms in this sector are sole proprietorships with few, if any, employees. The sector s low barriers to entry allow new firms to enter the field when demand for services and profitability is high. However, over the coming years, it is expected that larger, established firms will acquire smaller firms to increase market share and economies of scale. Generally, workers in this field are highly educated and experienced, commanding high wages in exchange of their specialized skills and advising services. Industry Overview The Management, Scientific, and Technical Consulting Services industry accounts for over 2,000 jobs in the Spokane Area. The industry group is diverse, with no one sector accounting for over 50% of employment. The largest sector, 154
156 Administrative Management and General Management Consulting Services, accounts for nearly 930 jobs, or 46% of employment. Marketing Consulting Services is the second largest sector, accounting for over 400 jobs and 20% of employment in the cluster. Employment in this this industry group is less concentrated than employment in the US overall, with a Location Quotient of just Employment in the industry s sectors are also less concentrated than employment in the US. Management, Scientific, and Technical Consulting Services Industry Overview, 4 Digit NAICS - Spokane Area NAICS Average 2015 Location % of Gross Regional Earnings Per Quotient Cluster Product Worker Administrative Management and General Management Consulting Services 928 $51, % $56,300, Human Resources Consulting Services 156 $52, % $11,349, Marketing Consulting Services 404 $48, % $27,402,622 Process, Physical Distribution, and Logistics Consulting Services 38 $38, % $1,684, Other Management Consulting Services 44 $60, % $2,703, Environmental Consulting Services 116 $41, % $6,043, Other Scientific and Technical Consulting Services 338 $64, % $19,541, Management, Scientific, and Technical Consulting Services 2,024 $52, % $125,025,680 Historic Change in Employment Employment in the industry doubled between 2005 and 2015 adding over 1,030 jobs. The Administrative Management and General Management Consulting Services added the most jobs, increasing employment by 540 jobs, a 141% increase. Marketing Consulting Services and Other Scientific and Technical Consulting Services also exhibited strong growth, adding nearly 300 and nearly 150 jobs, respectively. Other sectors experienced slow or no growth over this period. 155
157 Management, Scientific, and Technical Consulting Services Industry Historic Change, 4 Digit NAICS - Spokane Area NAICS # Change % Change Administrative Management and General Management Consulting Services % Human Resources Consulting Services % Marketing Consulting Services % Process, Physical Distribution, and Logistics Consulting Services % Other Management Consulting Services % Environmental Consulting Services % Other Scientific and Technical Consulting Services % 5416 Management, Scientific, and Technical Consulting Services 994 1,218 2,024 1, % Projected Change in Employment Employment growth is expected to continue over the coming years, but at a lower rate. The Management, Scientific, and Technical Consulting Services industry is projected to add nearly 500 jobs by 2021, expanding employment by 24%. The Administrative Management and General Management, Marketing, and Other Scientific and Technical Consulting Services are again expected to drive growth over this period. Management, Scientific, and Technical Consulting Services Industry Projected Change, 4 Digit NAICS - Spokane Area NAICS # Change % Change Administrative Management and General Management Consulting Services 928 1,074 1, % Human Resources Consulting Services % Marketing Consulting Services % Process, Physical Distribution, and Logistics Consulting Services % Other Management Consulting Services % Environmental Consulting Services % Other Scientific and Technical Consulting Services % 5416 Management, Scientific, and Technical Consulting Services 2,024 2,295 2, % Employment Demographics The Management, Scientific, and Technical Consulting Services industry is concentrated among older age cohorts, especially in the Spokane Area. In the Spokane Area, workers over the age of 55 account for 27% of workers, while these cohorts are slightly less concentrated in the US and Washington and Idaho States. Conversely, these other geographies are slightly more concentrated is lower age brackets. 156
158 The age of this workforce reflects the industry s requirement that workers are highly educated and experienced. Additionally, many workers enter this field late in their career or after retirement, increasing the concentration in the higher age brackets. 157
159 Transportation & Warehousing Targeted Sector Analysis 158
160 Rail Transportation Industry Definition Source: IBISWorld The Rail Transportation industry comprises companies that operate railroads across the United States. This includes large railroads (Class 1 railroads) and regional and local line-haul railroads that carry freight and passengers. National Perspective Source: IBISWorld The Rail Transportation industry has experienced slow revenue growth over the past 5 years, despite some positive changes in the market. As demand for rail services from US oil producers has increased, coal production has declined, tempering the potential revenue growth. The outlook for Rail Transportation is a little brighter industry revenue is expected to grow at an average annual rate of nearly 3% over the next 5 years. Further, based on Department of Transportation projections, the tonnage transported by rail could increase by 88% from 2002 levels by The Rail Transportation industry primarily competes with the trucking industry for business. The Rail Transportation sectors offers cost effectiveness, fuel efficiency, an extensive network, and the ability to transport large volumes of product. The trucking industry, however, is able to offer unmatched flexibility with correspondingly higher costs. With the current low fuel prices, the trucking industry may compete more effectively on price with the Rail Transportation sector, luring business away. While the Rail Transportation industry does not directly import or export its services, it is heavily impacted by US trade activity. It is estimated that approximately 40% of industry revenue is generated by industries highly affected by global trade, including coal, agriculture, and chemicals. The rail network transports cargo from ports into the interior of the US and to the east coast. When the Panama Canal expansion officially opens, cross-country rail transport may decline as merchant ships can more easily ship directly to ports in the Gulf of Mexico and east coast. Like other transportation and distribution related industries, the Rail Transportation industry is focused on introducing new technology to automate processes and reduce reliance on unskilled labor. Employment has been stagnant over the past 5 years as the productivity, or revenue per employee, has risen due to new technology and infrastructure. The industry is highly concentrated with over 85% of revenue concentrated among the 4 largest players. The industry has high barriers to entry and low profit margins, deterring new entrants. Mergers in the 1980s and 1990s also contributed to concentration in the industry. The transportation industry is moving to a model of door-to-door service coordinating truck service with rail service to bring cargo from the rail station to its final destination. Industry Overview The Rail Transportation industry is among the largest clusters in the Transportation and Warehousing industry, accounting for over 950 employees. The industry is highly productive, with average earnings per worker exceeding $90,000, nearly $40,000 higher than the Transportation and Warehousing industry average. Relative to the nation, employment in the industry is also over 75% more concentrated in the Spokane Area than in the US overall. This concentration reflects the region s role as a nexus of transportation and distribution infrastructure. 159
161 Rail Transportation Industry Overview, 4 Digit NAICS - Spokane Area Average 2015 Location % of Gross Regional NAICS Earnings Per Quotient Cluster Product Worker Rail transportation 954 $93, % $165,855, Rail Transportation 954 $93, % $165,855,505 Historic Change in Employment The industry suffered during the recession, losing approximately 90 jobs between its pre-recession peak in 2006 and its employment low in However, employment began recovering in 2010 and climbed to over 950 jobs by 2015, exceeding pre-recession employment. Overall, the industry has grown by 45 jobs over the past 10 years, an increase of 5%. Rail Transportation Historic Industry Change, 4 Digit NAICS - Spokane Area NAICS # Change % Change Rail transportation % 4821 Rail Transportation % Projected Change in Employment Growth is expected to continue over the coming years, with industry employment increasing by 8%, or nearly 80 jobs. This outpaces projected growth in the US, where industry employment is expected to be stagnant, increasing by just 1% over the coming years. Rail Transportation Industry Projected Change, 4 Digit NAICS - Spokane Area NAICS # Change % Change Rail transportation , % 4821 Rail Transportation , % Employment Demographics Employment demographics in the industry largely mirrors the US and Washington and Idaho States. The Spokane Area, however, is slightly more concentrated in the and 65+ age cohorts, with 31% of industry workers over the age of 55. The US is slightly more concentrated than the region and state in the 45 to 54 age cohort. 160
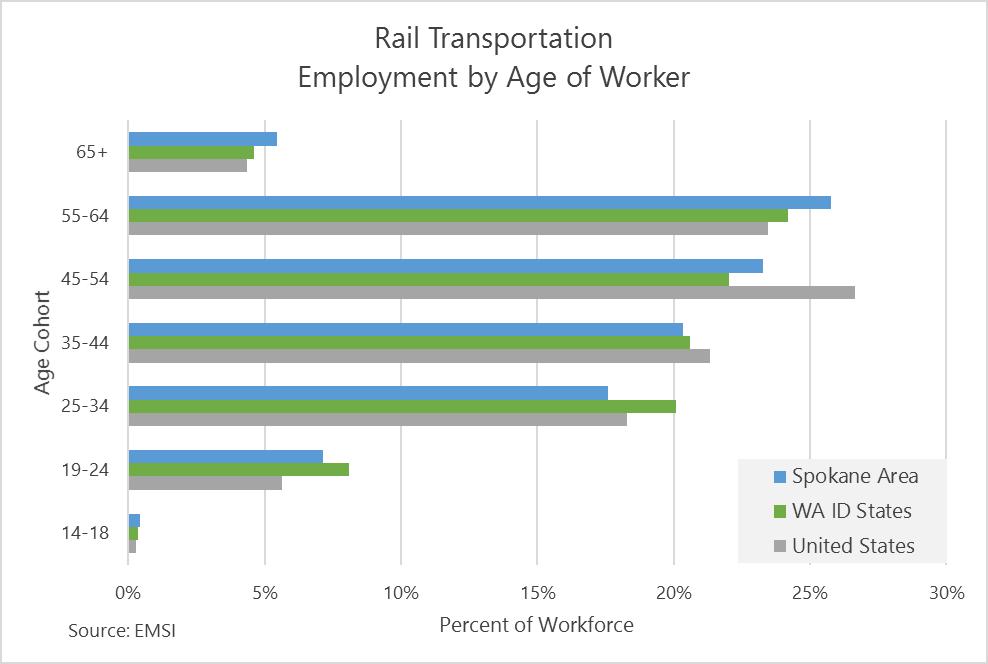
162 161
163 General Freight Trucking Industry Definition Source: IBISWorld The General Freight Trucking industry is primarily composed of two groups: Local Freight Trucking and Long- Distance Trucking. Operators in the Local Freight Trucking industry provide general freight trucking services over short distances. General freight companies handle a variety of commodities, which are usually palletized and transported in a container or van trailer. Local general freight trucking companies commonly provide trucking within a metropolitan area that may cross state lines, and the trips are typically same-day return. Operators in the Long-Distance Freight Trucking industry handle various commodities, usually palletized and transported in containers or van trailers. Establishments typically provide trucking between metropolitan areas and regions that may cross North American country borders. The industry includes establishments operating as truckload or less-than-truckload carriers. National Perspective Source: IBISWorld The Local Freight Trucking industry is largely driven by consumer demand and activity in the Manufacturing industry. The industry contracted steeply during the recent recession and struggled to recover, only recovering to pre-recession revenue levels in 2014, as consumer confidence and spending began to increase. Since 2011, revenue has grown by 2% annually. This growth is projected to continue, with revenue increasing by an average of 2.4% over the next 5 years. While consumer spending is projected to continue to grow, driving growth in the industry, the Manufacturing industry is showing weakness, which may temper future growth. The industry is experiencing increased demand for Just-in-Time (JIT) inventory management delivery services. These services are growing in popularity due to the desire of retailers, wholesalers, and manufacturers to keep inventories low and respond more effectively to consumer demands. The industry s profitability has also grown over the past 5 years, as revenues have increased and fuel costs have declined. Over the same period, employment and the number of establishments has grown as well, however, the figures have not recovered to pre-recession peaks. The Long Distance Trucking industry sector is experiencing revenue trends similar to the Local Freight Trucking sector. Over the past 5 years, revenues have increased at an average annual rate of 2.4% and are projected to continue to grow by just over 2% annually over the next 5 years. Industry growth has been driven by increases in consumer spending, industrial production, and international trade. Industry profit has also grown over this period, due both to growing revenue and to the drop in fuel prices. While the industry does not directly import or export its services, industry revenue is closely tied to trade. Approximately 60% of goods traded among North American countries is transported by freight trucks. Therefore, as the volume of goods traded among these countries and shipped to and from coastal ports increases, demand for trucking services will also grow. As the industry has recovered from the recession, competition for truck drivers has grown. This has led to increasing average wages in the industry, as firms attempt to attract and retain workers. Despite increasing wages, the industry has struggled to attract the commercial drivers needed to fuel growth and replace older truck drivers. 162
164 The number of operators in the industry has been growing, attracted by growing revenue as the economy has recovered. The industry is largely made up of small businesses, with nearly 90% of Long Distance Trucking firms being owner-operators. Industry Overview The General Freight Trucking industry is the largest Transportation and Warehousing employer in the Spokane Area, accounting for nearly 2,400 jobs. Long Distance trucking accounts for the most jobs in the industry cluster, representing over 80% of industry employment. Earnings in the General Freight Trucking industry mirror the industry average. The lowest earnings are in the Local General Freight Trucking sector, while the average earnings per worker for long-distance trucking is much higher. Employment in this industry is slightly less concentrate in the Spokane Area than in the US overall, with a Location Quotient of General Freight Trucking Industry Overview, 4 Digit NAICS - Spokane Area NAICS Average 2015 Location % of Gross Regional Earnings Per Quotient Cluster Product Worker General Freight Trucking, Local 430 $44, % $24,346, General Freight Trucking, Long-Distance, Truckload 1,638 $55, % $126,386,592 General Freight Trucking, Long-Distance, Less Than Truckload 316 $62, % $24,056, General Freight Trucking 2,384 $54, % $174,789,560 Historic Change in Employment Employment in the industry has grown over the past 10 years, increasing by 140 jobs, or 6%, since Growth was driven by the General Freight Trucking (Long-Distance, Less Than a Truckload) sector, which added over 100 jobs since 2005, increasing employment by over 50%. The Local General Freight Trucking industry also grew rapidly, increasing employment by 24%. However, even with this growth, the sector has not reached its pre-recession employment peak of over 530 jobs. The General Freight Trucking (Long-Distance, Less Than a Truckload) sector also suffered during the recession and has struggled to regain pre-recession employment levels. Since its employment low in 2010, the industry has added over 180 jobs but is still short of the 1,700 jobs in the industry in General Freight Trucking Industry Historic Change, 4 Digit NAICS - Spokane Area NAICS # Change % Change General Freight Trucking, Local % General Freight Trucking, Long-Distance, Truckload 1,689 1,451 1, % General Freight Trucking, Long-Distance, Less Than Truckload % 4841 General Freight Trucking 2,244 2,097 2, % 163
165 Projected Change in Employment Over the coming years, employment in the industry is expected to continue to grow, adding over 180 jobs, an increase of 8%. Growth is expected across all sectors but will be driven by the Long Distance Trucking industry. General Freight Trucking Industry Projected Change, 4 Digit NAICS - Spokane Area NAICS # Change % Change General Freight Trucking, Local % General Freight Trucking, Long-Distance, Truckload 1,638 1,673 1, % General Freight Trucking, Long-Distance, Less Than Truckload % 4841 General Freight Trucking 2,384 2,485 2, % Employment Demographics Age demographics in the General Freight Trucking industry largely mirrors demographics in the US and Washington and Idaho States. The Spokane Area is slightly less concentrated in younger age brackets (44 and younger) than the states and nation. Correspondingly, the local industry is more concentrated in workers aged 55 and up, with 31% of workers in these age cohorts. 164
166 Support Activities for Air Transportation Industry Definition Source: IBISWorld Support Activities for Air Transportation is primarily divided into two sectors: Airport Operations and Aircraft Maintenance, Repair, and Overhaul. Airport Operations includes businesses that operate international, national or civil airports or public flying fields. It also includes operators that support airports, offering aircraft refueling, aircraft parking, hangar space rental, air traffic control services, cargo handling services and others. Companies in the Aircraft Maintenance, Repair, and Overhaul industry provide support services to air transportation operators, such as aircraft inspection and testing; ferrying aircraft between departure gates and taxiways; aircraft maintenance and repair; and aircraft and parts overhaul. The main industry services are commonly referred to as maintenance, repair and overhaul (MRO). National Perspective Source: IBISWorld The Airport Operations industry has experienced strong growth, as airline travel has grown since the recent recession. As the number of passengers declined during the recession, revenue for the Airport Operations industry also steeply contracted. However, over the past 5 years, the industry has recovered strongly, with revenues increasing by 3.4% annually. Revenue growth has been driven in part by the improving economy, enabling businesses and individuals to travel, and the growing number of international visitors to the US, which has led international airlines to establish locations at US airports. Over the next 5 years, revenue is projected to continue to grow, but at a lower rate. Industry growth is expected to be constrained by limited capacity for increasing services at airports. The federal government is planning to invest approximately $3 billion annually to improve airport infrastructure, which may increase airport capacity. International travel to the US is also expected to grow, especially as the middle class grows in emerging economies, such as China. Even as revenue grows, employment is in the industry is expected to decline by 2020, due largely to investments in infrastructure which reduce the need for unskilled labor. The Aircraft Maintenance, Repair, and Overhaul industry has also recovered some losses experienced during the recession. However, revenue growth in the industry has been low, increasing by just 1.5% annually. Growth has been tempered by a shrinking US aircraft fleet and the replacement of old aircrafts with new planes, which require less maintenance. The industry has also been impacted by changes to defense budgets, which have transitioned from focusing large aircraft to smaller drones. Revenue is expected to grow at a similar rate over the next 5 years, increasing by approximately 1.7% annually. Growth will be driven by growing domestic and international airline passenger traffic, increasing the wear and tear on aircraft. However, slow growth in the business and general aviation market and the shrinking number of aircraft in regional commercial fleets will dampen demand for industry services. Additionally, airlines are expected to continue to replace older aircraft with newer planes. Competition in the industry is also expected to continue, putting more pressure on profit margins. Additionally, some airlines are servicing planes in lower-cost countries during international flights. While employment has grown over the past 5 years, the industry has also begun investing in labor-saving equipment and technology to automate some processes. This may result in fewer workers required to support the industry, even as it continues to grow. Worker managing new advanced equipment will need to be more skilled and will likely command higher wages. 165
167 Industry Overview The Support Activities for Air Transportation Industry is comprised of two industries in the Spokane Area: Other Airport Operations, which primarily includes administrative staff, and Other Support Activities for Air Transportation, which primarily includes aircraft mechanics, freight transporters, avionics technicians, and other administrative and janitorial personnel. The Support Activities for Air Transportation industry accounts for over 880 jobs. Employment in the industry is over 2 times as concentrated in the Spokane Area as employment in the US overall and has average earnings per workers nearly $10,000 higher than the Transportation and Warehousing industry average. The Other Support Activities for Air Transportation is the dominant sector in this industry group in the Spokane Area with nearly 750 jobs, or 84% of industry employment. With a location quotient of over 3, the industry is much more concentrated in the Spokane Area than in the US overall. This sector also has high average earnings of $70,000, over twice the average earnings of the industry s other sector, Other Airport Operations. Support Activities for Air Transportation Industry Overview, 4 Digit NAICS - Spokane Area NAICS Average 2015 Location % of Gross Regional Earnings Per Quotient Cluster Product Worker Other Airport Operations 130 $32, % $11,460, Other Support Activities for Air Transportation 745 $70, % $76,048, Support Activities for Air Transportation 883 $64, % $88,986,842 Historic Change in Employment The Support Activities for Air Transportation industry has grown rapidly since 2005, adding 300 jobs, an employment expansion of over 50%. This growth was almost entirely driven by the Other Support Activities for Air Transportation sector, which added nearly 300 jobs, increasing employment by over 65%. Support Activities for Air Transportation Industry Historic Change, 4 Digit NAICS - Spokane Area NAICS # Change % Change Other Airport Operations % Other Support Activities for Air Transportation % 4881 Support Activities for Air Transportation % Projected Change in Employment Industry employment is expected to continue to grow over the coming years, but at a slightly lower rate. Between 2015 and 2021, the Support Activities for Air Transportation industry is expected to add 270 jobs, increasing employment by over 30%. The Other Support Activities industry is expected to drive this growth, increasing employment by 250 jobs. The Other Airport Operations sector is expected to add 20 jobs. 166

168 Support Activities for Air Transportation Industry Projected Change, 4 Digit NAICS - Spokane Area NAICS # Change % Change Other Airport Operations % Other Support Activities for Air Transportation % 4881 Support Activities for Air Transportation 883 1,051 1, % Employment Demographics Employment in the Support Activities for Air Transportation industry is younger than other targeted sectors, with just 19% of workers aged 55 or older. Compared to the US and Washington and Idaho States, the Spokane Area industry is less concentrated in the 65+ age and age cohorts. In the Spokane Area, industry employment is considerably less concentrated in younger age cohorts than Washington and Idaho States. While workers under the age of 35 account for 43% of industry employment in the WA/ID States, these cohorts account for 35% of employment in the Spokane Area. 167
169 Warehousing & Storage Industry Definition Source: IBISWorld Industry operators provide third-party storage warehousing and storage services to the manufacturing, wholesale and retail sectors. Operators generally use equipment such as forklifts, pallets and racks to handle goods in containers such as boxes, barrels and drums. This industry also includes establishments that operate refrigerated warehousing and storage facilities. National Perspective Source: IBISWorld The Public Storage and Warehousing industry has grown steadily over the past 5 years, with revenue increasing by 2.5% annually. This growth was driven largely by growing demand from the retail sector as consumer spending increases and greater manufacturing output. Revenue is expected to grow more rapidly over the coming years, increasing by an average of 4.7% annually. This growth will be driven by increasing consumer spending and international trade. The e-commerce industry will also continue to play a large role in industry growth. The growth of online retailing has affected the industry s business model. The industry has largely benefitted from e-commerce growth, as e-commerce companies increase the number of distribution centers to be closer to customers and meet consumer demand more quickly. However, e-commerce has also presented a challenge to the industry s business model. Traditional retailers typically require storage and shipment of a large volume of goods in pallets while e-commerce generally ships a small number of items to individual customers. This individualized service requires more labor and space. Due to growing demand and the labor-intensity of servicing the e-commerce sector, employment in the industry has grown rapidly over the past 5 years and this trend is expected to continue. The industry has been incorporating sophisticated technology and supply chain and inventory management systems into its operations, increasing the level of skill and education required of some employees. However, processing and packaging the small, individualized orders associated with the e-commerce industry generally requires more labor than preparing large bulk shipments for the traditional retail industry. The Refrigerated Storage industry sector has experienced more volatile revenue growth over the past 5 years than the Public Storage and Warehousing industry, with industry revenue declining at an average annual rate of -0.1%. However, this trend is expected to reverse over the coming years, with industry revenue expected to grow by over 3% annually. This growth is expected to be driven by growing consumer spending, international trade, and frozen food and pharmaceutical manufacturing. Like the Public Storage and Warehousing industry, the Refrigerated Storage industry sector has adopted new technologies to more efficiently manage inventories and supply chains. The operation of these systems requires more skilled employees and has led to an increase in the average wages paid by the industry. However, the automation of processes has also decreased the labor-intensity of the industry, which has led to a contracting national workforce, as unskilled labor is replaced by new technology. The number of workers is expected to grow, but at a lower rate than revenue as fewer workers are required to fuel the industry s growth. Industry Overview While the Warehousing and Storage sector is not the largest in the Transportation and Warehousing industry, it has grown rapidly over the past 10 years and is an important part of the overall distribution ecosystem in the area. The industry accounts for over 520 jobs in the Spokane Area. 168
170 The largest Warehousing and Storage sector in the Spokane Area is General Warehousing and Storage, which accounts for over 350 jobs, nearly 70% of employment in the cluster. Refrigerated Warehousing and Storage is also a significant employer in the region, accounting for over 70 jobs. Average earnings per worker in the industry are low, generally at or slightly below the average earnings for the Transportation and Warehousing industry overall. Warehousing & Storage Industry Overview, 4 Digit NAICS - Spokane Area NAICS Average 2015 Location % of Gross Regional Earnings Per Quotient Cluster Product Worker General Warehousing and Storage 352 $51, % $44,377, Refrigerated Warehousing and Storage 73 $38, % $4,811, Farm Product Warehousing and Storage 43 $56, % $5,155, Other Warehousing and Storage 55 $48, % $9,674, Warehousing and Storage 522 $49, % $64,018,992 Historic Change in Employment The Warehousing and Storage industry has grown rapidly since 2005, increasing employment by 260 jobs, or 99%. The General Warehousing and Storage sector drove that growth, adding over 200 jobs. The Refrigerated Warehousing and Storage industry also grew rapidly, increasing employment from approximately 30 jobs in 2005 to over 70 jobs in Despite this growth, the Refrigerated Warehousing and Storage sector has not recovered to its pre-recession employment peak. Warehousing & Storage Industry Historic Change, 4 Digit NAICS - Spokane Area NAICS # Change % Change General Warehousing and Storage % Refrigerated Warehousing and Storage % Farm Product Warehousing and Storage % Other Warehousing and Storage % 4931 Warehousing and Storage % Projected Change in Employment Employment in the industry is expected to continue to grow over the coming years, but at a lower rate. Between 2015 and 2021, the industry is expected to add over 140 jobs, increasing employment by 28%. Again, the General Warehousing and Storage industry is expected to drive this growth, increasing employment by nearly 40%, adding 138 jobs. Refrigerated Warehousing and Storage is also expected to continue to grow, increasing employment by 14 jobs, or 19%. 169
171 Warehousing & Storage Industry Projected Change, 4 Digit NAICS - Spokane Area NAICS # Change % Change General Warehousing and Storage % Refrigerated Warehousing and Storage % Farm Product Warehousing and Storage % Other Warehousing and Storage % 4931 Warehousing and Storage % Employment Demographics Age demographics in this industry in the Spokane Area largely mirror the US and Washington and Idaho States. Relative to other blue collar industries, the Warehousing and Storage industry is less concentrated in workers aged 55 and older. In the Spokane Area, these workers account for just 18% of workers, similar to the concentration in Washington and Idaho States and the US. However, over 20% of workers are between the ages of 45 and 54 in the Spokane Area, slightly higher than the concentration in Washington and Idaho States and the US. 170


172 Camoin Associates, Inc. 120 West Avenue, Suite 303 Saratoga Springs, NY
Community Colleges of Spokane
 Community Colleges of Spokane 501 N Riverpoint Blvd Spokane, Washington 99217 Occupation Report CCS Employment Area - Max Economic Modeling Specialists International www.economicmodeling.com Page 1/9 Report
TECHNOLOGY Industry Cluster
 New Jersey s TECHNOLOGY Industry Cluster Prepared by: New Jersey Department of Labor & Workforce Development Office of Research & Information Bureau of Labor Market Information Fall 2017 THE GOAL OF THIS
REGIONAL WORKFORCE PROFILE
 REGIONAL WORKFORCE PROFILE Lake of the Ozarks Regional Economic Development Council Camden County Miller County Morgan County NOVEMBER 2016 Table of Contents Topic Page Purpose 2 Executive Summary 3 Overview
MANUFACTURING. April Manufacturing INDUSTRY PROFILE. Colorado WIOA Central Planning Region. P Colorado Central Planning Region
 MANUFACTURING April 2018 INDUSTRY PROFILE Colorado WIOA Central Planning Region cr P Colorado Central Planning Region MANUFACTURING Background Geography in this profile is Colorado s Front Range. It includes
Florida Logistics Industry. Labor Market Industry Profile 2018 EDITION
 2018 EDITION Labor Market Industry Profile Florida Logistics Industry Prepared by the Florida Department of Economic Opportunity, Bureau of Workforce Statistics and Economic Research Florida Logistics
Occupation Report for Computer User Support Specialists Workforce Solutions Northeast Texas
 Occupation Report for Computer User Support Specialists Workforce Solutions Northeast Texas DEFINITION OF COMPUTER USER SUPPORT SPECIALISTS, SOC 15-1151...3 OCCUPATION SNAPSHOT...3 GEOGRAPHIC DISTRIBUTION...4
Michigan Lightweight Technology Workforce
 Michigan Lightweight Technology Workforce Supply-Demand Annual Update ABOUT THIS REPORT Lightweight Innovations for Tomorrow (LIFT) is a public-private partnership that develops and deploys advanced lightweight
Job,Connector Toolkit
 , - - --4--- Job,Connector Toolkit Move people to in-demand jobs in Rey industries in Baltimore County, Maryland Transportation, Distribution & Logistics Baltimore County Executive Don Mohler and the Baltimore
Industry Profiles Wood, Wood Products & Publishing
 Industry Profiles Wood, Wood Products & Publishing The Wood, Wood Products & Publishing cluster incorporates a supply line from raw material to finished product. It includes logging and lumber production,
Occupational Insights Report Hartford County. Third Quarter, 2016
 Occupational Insights Report Hartford County Third Quarter, 2016 Occupational Insights Report Contents Jobs Growth and Online Postings in Hartford County... 3 U.S. Help Wanted Online Trend... 3 Highlights
TRANSPORTATION, DISTRIBUTION, & LOGISTICS OCCUPATION GROUP
 Q1 2017 January -March TRANSPORTATION, DISTRIBUTION, & LOGISTICS OCCUPATION GROUP Southeast Michigan Transportation, Distribution, and Logistics (TDL) Introduction Online Job Postings Transportation, distribution,
Manufacturing Overview
 Manufacturing Overview Region: Seattle MSA Timeframe: 2006-2008; 2006-2011 Prepared for: Shoreline Community College April 21, 2009 Economic Modeling Specialists Inc. 1187 Alturas Dr., Moscow, ID 83843
Occupational Insights Report Hartford County. First Quarter, 2017
 Occupational Insights Report Hartford County First Quarter, 2017 Occupational Insights Report Contents Jobs Growth and Online Postings in Hartford County... 3 U.S. Help Wanted Online Trend... 3 Highlights
Occupation Report for Software Developers Salt Lake County, Utah SAMPLE
 Occupation Report for Software Developers Salt Lake County, Utah DEFINITION OF SOFTWARE DEVELOPERS, APPLICATIONS, SOC 15-1132...3 OCCUPATION SNAPSHOT...3 GEOGRAPHIC DISTRIBUTION...4 EMPLOYMENT BY INDUSTRY...5
Manufacturing Sector Profile for Monroe RLMA
 Manufacturing Sector Profile for Monroe RLMA The Labor Market information (LMI) division of Research and Statistics helps provide information on various sectors in the regional economy. Reports and tables
Manufacturing Overview
 Manufacturing Overview Region: San Antonio MSA Timeframe: 2006-2008; 2006-2011 Prepared for: Alamo Community College District April 21, 2009 Economic Modeling Specialists Inc. 1187 Alturas Dr., Moscow,
Oklahoma Department of Career and Technology Education
 Oklahoma Department of Career and Technology Education Information Commons September 2016 Oklahoma Office and Administrative Support Occupations Parameters Occupations Code Description 43-0000 Office and
Yolo County Workforce Innovation Board Industry Clusters of Opportunity
 This report was prepared by the Labor Market Information Division (LMID) of the California Development Department to provide the Workforce Innovation Board () a resource for workforce development and planning.
2013 Annual Ohio Shale Report
 2013 Annual Ohio Shale Report Table of Contents A Message from Director Dungey... 2 Introduction... 3 Core Shale-Related Industry Employment... 3 Business Establishments in Core Industries... 4 Ancillary
IT Sector TENCO WIA Maysville CTC
 15% 13% IT Sector Computer User Support Specialists 8% 5% 3% Computer Network Support Specialists -3% $0 $5,000 $10,000 $15,000 $20,000 $25,000 $30,000 $35,000 $40,000 $45,000 $50,000 Available Available
Talent for Tomorrow Conceptual Framework Opportunity Clusters 6 Cluster Summary 11 Regional Profiles Central 13 Kansas City Region 20 Northeast 27
 Labor Market Needs Table of Contents Talent for Tomorrow Conceptual 3 Framework Opportunity Clusters 6 Cluster Summary 11 Regional Profiles Central 13 Kansas City Region 20 Northeast 27 Northwest 34 Ozark
MANUFACTURING. January Manufacturing INDUSTRY PROFILE. for Arapahoe & Douglas Counties Colorado WIOA Central Planning Region
 January 2017 INDUSTRY PROFILE for Arapahoe & Douglas Counties Colorado WIOA Central Planning Region Background is vital to a strong Colorado economy, and has great growth potential. Colorado manufacturers
OPPORTUNITIES FOR CAREER EDUCATION TO CLOSE THE MIDDLE-SKILL JOBS GAP
 June 2018 SUMMARY OPPORTUNITIES FOR CAREER EDUCATION TO CLOSE THE MIDDLE-SKILL JOBS GAP SAN DIEGO COUNTY CENTERS OF EXCELLENCE Inform Connect Advance THE MIDDLE-SKILL JOB MARKET IN SAN DIEGO COUNTY This
Employment and Wage Trends 3 rd Quarter 2015 for the Mining Sector by Parish
 Mining Sector Profile for Houma RLMA Parishes The Labor Market information (LMI) division of Research and Statistics helps provide information on various sectors in the regional economy. Reports and tables
RETAIL TRADE Workforce Demographics
 RETAIL TRADE Workforce Demographics Maryland Department of Labor, Licensing and Regulation Division of Workforce Development Office of Workforce Information and Performance 1100 N. Eutaw Street, Room 316
New Jersey s Technology Cluster. Prepared Winter
 New Jersey s Technology Cluster Prepared Winter 2012 2013 Produced by the Office of Labor Planning and Analysis of the New Jersey Department of Labor and Workforce Development Winter 2012 2013 Technology
Manufacturing Overview
 Manufacturing Overview Region: Cleveland MSA Timeframe: 2006-2008; 2006-2011 April 21, 2009 Economic Modeling Specialists Inc. 1187 Alturas Dr., Moscow, ID 83843 866.999.3674 www.economicmodeling.com Introduction
A Look Behind the Numbers
 A Look Behind the Numbers Vol. 7, issue 1 January 22, 2016 Published by the Federal Reserve Bank of Cleveland Opportunity Occupations in Ohio: Identification, Online Postings, and Employer Education Preferences
Kansas Automotive Manufacturing and Services
 2008 Kansas Automotive Manufacturing and Services Center for Economic Development and Business Research W. Frank Barton School of Business Wichita State University September 2008 1 Kansas Automotive Manufacturing
MANUFACTURING. January Manufacturing INDUSTRY PROFILE. for Arapahoe & Douglas Counties Colorado WIOA Central Planning Region
 January 2016 Manufacturing INDUSTRY PROFILE for Arapahoe & Douglas Counties Colorado WIOA Central Planning Region Background Manufacturing is vital to a strong Colorado economy, and has great growth potential.
Regional Competitive Industry Analysis
 Regional Competitive Industry Analysis Jackson and Josephine Counties October 2016 Josephine Jackson Michael Meyers, Economist (503) 229-6179 michael.meyers@oregon.gov Jill Cuyler, Research Analyst (503)
Regional Data Snapshot
 Regional Data Snapshot Target Industry Clusters SET Session 2 Bootheel Synergy, Missouri Table of contents 01 Overview 02 03 Target Industry Clusters Industry Cluster Comparison Dunklin County, MO 01 overview
Employment and Wage Trends 3 rd Quarter 2015 for the Construction Sector by Parish
 Construction Sector Profile for New Orleans RLMA The Labor Market information (LMI) division of Research and Statistics helps provide information on various sectors in the regional economy. Reports and
Skilled Jobs in Pierce County: Gaps & Opportunities
 Skilled Jobs in Pierce County: Gaps & Opportunities at a Glance Winter 2018 Partnering in pursuit of GREATER ECONOMIC VITALITY FOR ALL. Table of Contents Overview... 3 What are Skilled Jobs?... 4 The State
Gap Analysis. Regional Overview. Economic Modeling Specialists, Inc. CCbenefits, Inc. Prepared for: Gavilan Community College
 Economic Modeling Specialists, Inc. CCbenefits, Inc. Gap Analysis Regional Overview Regional Demographics, Educational Attainment, and Top Industry & Occupation Analysis Prepared for: Gavilan Community
Occupation Report for Bus and Truck Mechanics and Diesel Engine Specialists Workforce Solutions Northeast Texas
 Occupation Report for Bus and Truck Mechanics and Diesel Engine Specialists Workforce Solutions Northeast Texas DEFINITION OF BUS AND TRUCK MECHANICS AND DIESEL ENGINE SPECIALISTS, SOC 49-3031...3 OCCUPATION
state of the sector Transportation & Logistics 2018
 state of the sector Transportation & Logistics 2018 Greater New Orleans has long been a world leader in the transportation and logistics sector. In fact, New Orleans was founded, at the mouth of the most
Structural and cyclical economic forces have had
 5. Are Green Jobs the Future? Structural and cyclical economic forces have had a devastating effect on the labor force across the entire economy and the auto sector especially. The tri-state region lost
Management / Leadership
 Management / Leadership Regional Program Demand Report Santa Monica College, LA MSA Economic Modeling Specialists Inc. Introduction and Contents Contents Executive Summary Job Outlook Summary Inverse Staffing
Professional, Scientific, and Technical Services Sector Profile for the Monroe Region
 Professional, Scientific, and Technical Services Sector Profile for the Monroe Region The Labor Market information (LMI) division of Research and Statistics helps provide information on various sectors
Colorado Central Planning Region's Regional Plan for Execution of Workforce Development Activities
 Colorado Central Planning Region's Regional Plan for Execution of Workforce Development Activities Developed in accordance with the Workforce Innovation and Opportunity Act May 2, 2016 Modified April 11,
Occupation Report for Computer- Controlled Machine Tool Operators, Metal and Plastic Workforce Solutions Northeast Texas
 Occupation Report for Computer- Controlled Machine Tool Operators, Metal and Plastic Workforce Solutions Northeast Texas DEFINITION OF COMPUTER-CONTROLLED MACHINE TOOL OPERATORS, METAL AND PLASTIC, SOC
Transportation & Logistics
 January 2013 Metro Economic Growth Alliance of Chicago Transportation & Logistics Industry Cluster Profile I Metropolitan Chicago Region Overview This report 1 provides key data for the Transportation
FINAL REPORT. Survey of Omaha Businesses about Skill and Training Requirements. A Bureau of Business Research Report From the UNL College of Business
 A Bureau of Business Research Report From the UNL College of Business FINAL REPORT Survey of Omaha Businesses about Skill and Training Requirements Prepared for The Nebraska Department of Labor Prepared
IT Sector South Central WIA Southcentral KY CTC
 2 IT Sector Computer User Support Specialists 1 Computer Network Support Specialists $0 $5,000 $10,000 $15,000 $20,000 $25,000 $30,000 $35,000 $40,000 $45,000 Southcentral KY CYC Non- 5 5 4 Healthcare
Business Information Worker Occupations
 Business Information Worker Occupations Riverside-San Bernardino-Ontario MSA (Riverside and San Bernardino County combined) Please see page 6 of this document for business information worker occupation
Supporting our Wealth Driving Sectors: Demand for Technical Talent in Central Indiana
 Supporting our Wealth Driving Sectors: Demand for Technical Talent in Central Indiana Executive summary Hire UP Indy is a collaborative effort to align Central Indiana s education resources with the talent
SOC Code Occupation Title Social and Community Service Managers
 SOC Code Occupation Title 11-9151 Social and Community Service Managers 13-1031 Claims Adjusters, Examiners, and Investigators 13-1041 Compliance Officers 13-1051 Cost Estimators 13-1071 Human Resources
Targeted Occupations List Overview
 2017-2018 Targeted Occupations List Overview The Targeted Occupations List identifies occupations which have been determined to be in-demand, show strong potential for growth, and are considered high-wage
AMEREN S AREA MANUFACTURERS ASSESSMENT
 AMEREN S AREA MANUFACTURERS ASSESSMENT AND FRANKLIN COUNTY, MISSOURI ASSESSMENT OF LABOR MARKET QUALITY Research Conducted and Prepared by: THE GROWTH SERVICES GROUP P.O. Box 105093 Jefferson City, MO
Texas Workforce Commission. Report on Texas Growth Occupations
 Texas Workforce Commission Report on Texas Occupations - 2017 LMCI 1-5- I. Executive Summary Texas Labor Code Section 302.019 requires the Texas Workforce Commission (TWC) to gather and study information
Regional Prosperity Initiative: Labor Market Information Supplement
 Regional Prosperity Initiative: Labor Market Information Supplement Prepared For: (Region 1) (Alger, Baraga, Chippewa, Delta, Dickinson, Gogebic, Houghton, Iron, Keweenaw, Luce, Mackinac, Marquette, Menominee,
Economic and Workforce Information Analysis
 Economic and Workforce Information Analysis April 2013 2725 JEFFERSON STREET, SUITE 13, CARLSBAD CA 92008 50 MILL POND DRIVE, WRENTHAM, MA 02093 T (760) 730-9325 F (888) 457-9598 bwresearch.com twitter.com/bw_research
A Hannah News Service Publication. The Character of Ohio s Employment Growth
 ON THE MONEY A Hannah News Service Publication Vol. 132, No. 35 By Bill LaFayette, PhD, owner, Regionomics LLC June 8, 2018 The Character of Ohio s Employment Growth Employment has now been increasing
Broward County Classification and Compensation Study Executive Briefing October 2015
 Page 1 of 9 Broward County Classification and Compensation Study Executive Briefing October 2015 Recently, an employee classification and compensation study was completed for all staff positions under
OPPORTUNITIES FOR CAREER EDUCATION TO CLOSE THE MIDDLE-SKILL JOBS GAP
 June 2018 SUMMARY OPPORTUNITIES FOR CAREER EDUCATION TO CLOSE THE MIDDLE-SKILL JOBS GAP IMPERIAL COUNTY CENTERS OF EXCELLENCE Inform Connect Advance THE MIDDLE-SKILL JOB MARKET IN IMPERIAL COUNTY This
Grundy County LABOR MARKET ANALYSIS
 3 Grundy County LABOR MARKET ANALYSIS Contents 3 Wages by Industry / 4 Occupations / 5 11 COMMUTING PATTERNS 12 LABOR AVAILABILITY 14 LABOR SHED ANALYSIS 18 INDUSTRY CLUSTER ANALYSIS Location Quotients
Occupations Report For the Agriculture/Farming Sector
 Occupations Report For the Agriculture/Farming Sector Prepared for the Monterey County Workforce Development Board Data Source: JobsEQ May 2017 Monterey County Workforce Development Board Special Projects
Occupation Report for Automotive Service Technicians and Mechanics Workforce Solutions Northeast Texas
 Occupation Report for Automotive Service Technicians and Mechanics Workforce Solutions Northeast Texas DEFINITION OF AUTOMOTIVE SERVICE TECHNICIANS AND MECHANICS, SOC 49-3023...3 OCCUPATION SNAPSHOT...3
czech workforce: report 3 Prague employment and average wage by occupation for the period key findings
 report 3 czech workforce: Prague employment and average wage by for the period 2011-2015 key findings Over the next months, the AmCham advocacy team, in cooperation with expert members, will present a
Highest Ranked Occupations Top 10 Occupations (5-Digit) in Johns Creek Zip Codes Final Jan 2016
 in Johns Creek Zip Codes Final Jan 2016") Highest Ranked Occupations Top 10 Occupations (5-Digit) in Johns Creek Zip Codes Final Jan 2016 EMSI Q3 2015 Data Set January 2016 Georgia Power 75 Fifth Street NW Suite 175 Atlanta, Georgia 30308 404.506.2226
Highest Ranked Occupations Top 10 Occupations (5-Digit) in Johns Creek Zip Codes Final Jan 2016 EMSI Q3 2015 Data Set January 2016 Georgia Power 75 Fifth Street NW Suite 175 Atlanta, Georgia 30308 404.506.2226
Regional Prosperity Initiative: Labor Market Information Supplement
 Regional Prosperity Initiative: Labor Market Information Supplement Prepared For: (Region 8) (Berrien, Branch, Calhoun, Cass, Kalamazoo, St. Joseph, and Van Buren) Prepared By: State of Michigan Department
Exhibit 1 Relationship among mechatronics disciplines
 M E C H A T R O N I C S C A R E E R S in t h e C E N T R A L V A L L E Y / M O T H E R L O D E R E G I O N & S O U T H C E N T R A L V A L L E Y S U B - R E G I O N A l a b o r m a r k e t p r o f i l
Q ua r t er ly S n a p sho t
 Q ua r t er ly S n a p sho t Spring City Phoenixville Downingtown Coatesville Malvern Parkesburg West Chester Kennett Square Oxford West Grove Major Advanced Materials & Diversified Manufacturing Employers
Oklahoma Department of Career and Technology Education
 Oklahoma Department of Career and Technology Education Information Commons September 2016 Oklahoma Business and Financial Operations Occupations Parameters Occupations Code Description 13-0000 Business
John M. Belk Endowment Workforce Relevance Planning Grant Best Practices Conference
 Charlotte Regional Collaboration for a Global Economy Community Colleges Providing Leadership for Global Commerce John M. Belk Endowment Workforce Relevance Planning Grant Best Practices Conference Spartanburg
The State of Workforce In The Finger Lakes
 The State of Workforce In The Finger Lakes A comprehensive report on current and future workforce trends in Ontario, Seneca, Yates and Wayne counties April 2018 Finger Lakes Workforce Investment Board,
Kankakee County LABOR MARKET ANALYSIS
 2 Kankakee County LABOR MARKET ANALYSIS Contents 3 Wages by Industry / 4 Occupations / 5 11 COMMUTING PATTERNS 12 LABOR AVAILABILITY 14 LABOR SHED ANALYSIS 18 INDUSTRY CLUSTER ANALYSIS Location Quotients
ADVANCED MANUFACTURING LABOR MARKET REPORT THE COLUMBIA-WILLAMETTE WORKFORCE COLLABORATIVE. Working together to support and develop regional talent.
 ADVANCED MANUFACTURING LABOR MARKET REPORT 2018 THE COLUMBIA-WILLAMETTE WORKFORCE COLLABORATIVE Working together to support and develop regional talent. In 2016, the Columbia-Willamette Workforce Collaborative
Business: Management - Supervision. March 2012 Needs Assessment
 Business: Management - Supervision March 2012 Needs Assessment Prepared by Elisa Lewis Date: March 21, 2012 Business: Management - Supervision 1 Scope Data compiled in this report covers San Bernardino,
WORKFORCE SKILLS ANALYSIS: SOUTHWEST VIRGINIA WORKFORCE INVESTMENT BOARD AREA ONE. Prepared by: Virginia Tech Office of Economic Development
 WORKFORCE SKILLS ANALYSIS: SOUTHWEST VIRGINIA WORKFORCE INVESTMENT BOARD AREA ONE Prepared by: Virginia Tech Office of Economic Development Acknowledgements This report was prepared by the Virginia Tech
Economic Composition of North Central Minnesota: Industries and Performance
 EXTENSION CENTER FOR COMMUNITY VITALITY Economic Composition of North Central Minnesota: Industries and Performance Authored by Brigid Tuck with assistance from Merritt Bussiere Economic Composition of
Appendix
 89 Appendix occupation definitions 90 Appendix A This report groups the claims into four main occupation type categories by Standard al Class 2000 (2000 SOC). Driver 2000 SOC Description 435021 Couriers
2020 Jobs Outlook. A regional indicators report. sponsored
 2020 Jobs Outlook A regional indicators report As one of the region s largest employers, much of our success depends on our ability to attract, retain and develop talent. The Jobs Outlook report gives
Occupational Insights Report Hartford County. February, 2015
 Occupational Insights Report Hartford County February, 2015 Occupational Insights Report (1) Contents and Online Postings in Hartford County... 3 Highlights Hartford County... 3 Industry Overview... 4
In-Demand Occupations
 Approved April 25, 2017 Existing and Emerging In-Demand Occupations In Central Oklahoma April, 2017 Purpose. The purpose of this item is to make a determination of the occupations that have a substantial
Diesel and Heavy Equipment Technician Occupation Overview
 Diesel and Heavy Equipment Technician Occupation Overview Emsi Q1 2018 Data Set March 2018 Western Technical College 400 Seventh Street La Crosse, Wisconsin 54601 608.785.9200 Emsi Q1 2018 Data Set www.economicmodeling.com
For more information about this regional profile, please contact: Stephen Lynch, Jobs for the Future,
 Jobs for the Future (JFF) and National Wildlife Federation (NWF) are partners in the Greenforce Initiative, an effort to strengthen the capacity of community colleges to green the skills of our modern
FINAL REPORT. Survey of Scottsbluff Area Businesses about Skill and Training Requirements
 A Bureau of Business Research Report From the UNL College of Business FINAL REPORT Survey of Scottsbluff Area Businesses about Skill and Training Requirements Prepared for The Nebraska Department of Labor
Economic Impact of Agriculture and Agribusiness in Miami-Dade County, Florida
 Economic Impact of Agriculture and Agribusiness in Miami-Dade County, Florida Florida Agricultural Marketing Research Center, Industry Report 2000-1 October, 2000 by Robert Degner Tom Stevens David Mulkey
Occupation Report for Industrial Machinery Mechanics. Workforce Solutions Northeast Texas
 Occupation Report for Industrial Machinery Mechanics Workforce Solutions Northeast Texas February 1, 2019 DEFINITION OF INDUSTRIAL MACHINERY MECHANICS, SOC 49-9041... 3 OCCUPATION SNAPSHOT... 4 GEOGRAPHIC
Occupation Report for Pharmacy Technicians Workforce Solutions Northeast Texas
 Occupation Report for Pharmacy Technicians Workforce Solutions Northeast Texas DEFINITION OF PHARMACY TECHNICIANS, SOC 29-2052...3 OCCUPATION SNAPSHOT...3 GEOGRAPHIC DISTRIBUTION...4 EMPLOYMENT BY INDUSTRY...5
Economic Composition of the West Central Region of Minnesota: Industries and Performance
 EXTENSION CENTER FOR COMMUNITY VITALITY Economic Composition of the West Central Region of Minnesota: Industries and Performance Authored by Brigid Tuck with assistance from Ryan Pesch Presented in partnership
Computer Cluster Collaborative Labor Market Research
 Parent District Survey Executive Summary Carlsbad Unified School District Orange County Workforce Investment Board Linking Business & People Computer Cluster Collaborative Labor Market Research REPORT
IT Sector West Kentucky WIA Madisonville CC
 4 Web Developers 3 IT Sector 2 Computer User Support Specialists - Computer Network Support Specialists -2 $0 $10,000 $20,000 $30,000 $40,000 $50,000 $60,000 5/5/2016 Available Available Hopkinsville CC
Pattern Industry Insights Brief Information Technology Services
 Pattern Industry Insights Brief Information Technology Services 1 Information Technology (IT) Services describes companies that are primarily engaged in the production or management of information technologies.
Regional Competitive Industry Analysis
 Regional Competitive Industry Analysis Baker, Union, and Wallowa Counties October 2017 Union Wallowa Baker Michael Meyers, Economist (503) 229-6179 michael.meyers@oregon.gov Jill Cuyler, Research Analyst
Workforce Innovation and Opportunity Act (WIOA) Regional Plan
 Regional Plan") ! Workforce Innovation and Opportunity Act (WIOA) Regional Plan Kansas Local Area I and IV! 1 PY16 Regional Plan Signature Page Local Area I and V Four Year Regional Plan Agreement July 1, 2017 Pursuant
! Workforce Innovation and Opportunity Act (WIOA) Regional Plan Kansas Local Area I and IV! 1 PY16 Regional Plan Signature Page Local Area I and V Four Year Regional Plan Agreement July 1, 2017 Pursuant
Kansas Advanced Manufacturing
 2008 Kansas Advanced Manufacturing Center for Economic Development and Business Research W. Frank Barton School of Business Wichita State University August 2008 1 Kansas Advanced Manufacturing Summary
Western Technical College
 Western Technical College 400 Seventh Street La Crosse, Wisconsin 54601 608.785.9200 Administrative Professional Occupation Report Western Technical College District Economic Modeling Specialists International
LABOR MARKET NEEDS DESCRIPTION OF DATA PRESENTED ON NEXT TWO PAGES
 Industry & Labor Market Needs DESCRIPTION OF DATA PRESENTED ON NEXT TWO PAGES The tables presented below identify the job positions with the greatest demand or/and growth anticipated between 2014 and 2024.
LABOR MARKET ANALYSIS
 OCTOBER 2018 LABOR MARKET ANALYSIS Mechanized Agriculture Prepared by the Central Valley/Mother Lode Center of Excellence TABLE OF CONTENTS SUMMARY... 3 INTRODUCTION... 4 OCCUPATIONAL DEMAND... 7 WAGES...
Social Media Occupational Group
 Social Media Occupational Group California and the Riverside-San Bernardino-Ontario Metropolitan Statistical Area (Riverside and San Bernardino counties combined) Job Opportunities In 2016, there were
Occupation Report for Construction Managers Workforce Solutions Northeast Texas
 Occupation Report for Construction Managers Workforce Solutions Northeast Texas DEFINITION OF CONSTRUCTION MANAGERS, SOC 11-9021...3 OCCUPATION SNAPSHOT...3 GEOGRAPHIC DISTRIBUTION...4 EMPLOYMENT BY INDUSTRY...5
Economic Composition of the South Central Region of Minnesota: Industries and Performance
 EXTENSION CENTER FOR COMMUNITY VITALITY Economic Composition of the South Central Region of Minnesota: Industries and Performance Authored by Brigid Tuck with assistance from Adeel Ahmed, Neil Linscheid,
Occupation Report for Multiple Machine Tool Setters, Operators, and Tenders, Metal and Plastic Workforce Solutions Northeast Texas.
 Occupation Report for Multiple Machine Tool Setters, Operators, and Tenders, Metal and Plastic Workforce Solutions Northeast Texas July 5, 2017 DEFINITION OF MULTIPLE MACHINE TOOL SETTERS, OPERATORS, AND
WORKFORCE CHARACTERISTICS REPORT
 Pennsylvania s WORKFORCE CHARACTERISTICS REPORT A Briefing Paper A report for Pennsylvania s State System of Higher Education 2016 CONTENTS 3 Background 5 The Labor Market Landscape 6 Top Indicators on
Electricity, gas, water and waste services
 Electricity, gas, water and waste services covers the electricity supply sector, the gas supply sector, water supply, sewerage and drainage services and waste collection, haulage, treatment and disposal
EMPLOYMENT PROJECTIONS
 For release 10:00 a.m. (EST) Thursday, December 10, 2009 USDL-09-1503 Technical information: (202) 691-5700 ep-info@bls.gov www.bls.gov/emp Media contact: (202) 691-5902 PressOffice@bls.gov NOTE: This
Fashion Merchandising
 Fashion Merchandising February 2016 Needs Assessment Prepared by Danielle Pearson Date: February 10, 2016 Fashion Merchandising Fashion Merchandising Needs Assessment Page 1 Scope Data compiled in this