Determining Effective Data Display with Charts
|
|
|
- Antony Bates
- 6 years ago
- Views:
Transcription
1 Determining Effective Data Display with Charts 1 Column Line Pie Stock XY (Scatter) Area Bubble Chart Types Covered 2 1

2 Visualizing Data 3 Data Graphics Principles 4 2
3 Data Graphics Principles Above all else show the data Reminder not to clutter a chart by adding unneeded illustration or decoration. 5 Maximize the data-ink ratio Refers to the portion of ink that is devoted to displaying the data vs. the portion of graphic that can be removed without losing the data. Erase non-data-ink Data Graphics Principles Non-data-ink is a part of the chart that decorates more than informs. 6 Erase redundant data ink Redundant data ink is ink that repeats information. Revise and edit Revise and edit charts like you would a piece of writing. 3
4 Data Graphics Principles 7 Effective Charting in Excel Creating Chart in Excel Select data to display Click Insert tab on Ribbon Click a button in Charts group or dialog box launcher 8 4

5 Chart Types 9 Understanding Line and Column Charts 10 Line chart- displays trends over time or by category. Column chart- compares values across categories in a vertical orientation. 5

6 Understanding Line and Column Charts 11 Comparing Line and XY (Scatter) Charts 12 XY (Scatter) charts plot numeric values on both the X- and Y- axes based on the value of the data. Whereas a line chart plots numeric values on one axis and category labels equidistantly on the other axis. 6
 Charts")

7 Comparing Line and XY (Scatter) Charts 13 Changing the Chart Source Data 14 7

8 Results of Changing Source Data 15 Specifying Chart Layout Options 16 Click chart to display Chart Tools contextual tabs Chart Tools Layout Tab Options grouped by Labels, Axes, and Background 8

9 Specifying Chart Options 17 Specifying Chart Options 18 9

10 Chart Options 19 Area chart- combines the features of a line chart with a bar or column chart by filling in the area below the line, and displaying the trend values over time or categories. Pie chart- displays the percentage contribution that each category makes to a whole or 100%. Column Charts and Area Charts 20 10


11 Selecting Pie Chart Source Data 21 Pie Charts 22 11


12 Formatting Data Labels 23 Working with 3-D Charts 24 2-D Line chart 3-D Line chart 2-D Column chart 3-D Column chart 12
13 Summary 1 Using charts to illustrate quantitative information adds visual analysis to problem solving How choice of chart type can influence viewer s perception of information presented Differences between main chart types Different interpretation of data can result from use of different chart type 25 Objectives: Evaluating Chart Sub-Types Examine the effectiveness of different chart subtypes Evaluate the stacked and 100% stacked sub-types Explore the Pie of Pie and Bar of Pie sub-types Create various stock charts to display financial data Clarify data with trendlines and moving averages 26 13
 contribution for each category as a percentage Available for line, bar, column, area charts Combines features of a pie chart with features of line,")
14 Examining Sub-types for Various Chart Types 27 Stacked charts Summing to 100% (100% stacked sub-type) Illustrate cumulative effects of data in categories Available for line, bar, column, area charts Illustrate cumulative (rather than individual) contribution for each category as a percentage Available for line, bar, column, area charts Combines features of a pie chart with features of line, column, or area charts Similar to pie except pieces are in a column instead of a circle Adding Things Up: Stacked Chart Options 28 Original area chart Stacked area chart Stacked column chart Stacked line chart 14

15 Summing to 100%: Alternatives to Pie Charts 29 Original area chart 100% stacked area chart 100% stacked column chart 100% stacked line chart Summing to 100%: Alternatives to Pie Charts Showing the cumulative contribution for each category as a percentage can reduce confusion over whether the line on the chart represents the individual or cumulative contribution to the whole

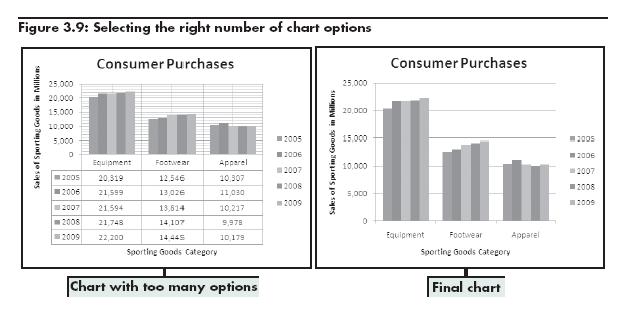
16 Slicing the Pie Too Thin: Summarizing Too Much Detail in Pie Charts 31 An excessive number of pie slices makes the chart cluttered and confusing. Pie of Pie and Bar of Pie Chart Sub-Types Decrease number of pie segments to improve visual display of data Use Format Data Series dialog box to select options for splitting data series Position Value Percent Value Custom 32 16
17 Pie of Pie Sub-Type 33 Using Format Data Series to Change the Format 34 17

18 Applied Formatting Changes 35 Doughnut Charts 36 Show individual percentages contained in a pie chart for more than one series 18

19 Doughnut Charts 37 Monitoring a Business with Stock Charts Excel stock reporting charts are somewhat based on the candlestick plot format Stock chart sub-types High-Low-Close Open-High-Low-Close Volume-High-Low-Close 38 Volume-Open-High-Low-Close 19


20 Sample High-Low-Close Chart 39 Sample Open-High-Low-Close Chart 40 20

21 Sample Volume-High-Low-Close Chart 41 Sample Volume-Open-High-Low-Close Chart 42 21

22 Trendlines Adding Trendlines and Moving Averages Graphically illustrate trends in data using a statistical technique known as regression Moving average line 43 Used to smooth out the data, making it easier to spot trends Adding Trendlines and Moving Averages 44 22

23 Summary 2 Chart sub-types for line, column, and area charts (stacked and 100% stacked) Pie of Pie and Bar of Pie chart sub-types Sub-types of stock charts Clarifying data in stock charts using trendlines and moving averages 45 Chart Summary 46 23
24 47 24
Excel 2011 Charts - Introduction Excel 2011 Series The University of Akron. Table of Contents COURSE OVERVIEW... 2
 Table of Contents COURSE OVERVIEW... 2 DISCUSSION... 2 OBJECTIVES... 2 COURSE TOPICS... 2 LESSON 1: CREATE A CHART QUICK AND EASY... 3 DISCUSSION... 3 CREATE THE CHART... 4 Task A Create the Chart... 4
Exploring Microsoft Office Excel 2007
 Exploring Microsoft Office Excel 2007 Chapter 3: Charts: Delivering a Message Robert Grauer, Keith Mulbery, Judy Scheeren Committed to Shaping the Next Generation of IT Experts. Copyright 2008 Prentice-Hall.
New Perspectives on Microsoft Excel Module 4: Analyzing and Charting Financial Data
 New Perspectives on Microsoft Excel 2016 Module 4: Analyzing and Charting Financial Data Objectives, Part 1 Use the PMT function to calculate a loan payment Create an embedded pie chart Apply styles to
DIGITAL VERSION. Microsoft EXCEL Level 2 TRAINER APPROVED
 DIGITAL VERSION Microsoft EXCEL 2013 Level 2 TRAINER APPROVED Module 4 Displaying Data Graphically Module Objectives Creating Charts and Graphs Modifying and Formatting Charts Advanced Charting Features
1 BASIC CHARTING. 1.1 Introduction
 1 BASIC CHARTING 1.1 Introduction This section covers the basic principles of how to create and modify a chart in Excel. With Excel 2016, the charting process is user-friendly and offers many ways to amplify
Excel 2016: Charts - Full Page
 Excel 2016: Charts - Full Page gcflearnfree.org/excel2016/charts/1/ Introduction It can be difficult to interpret Excel workbooks that contain a lot of data. Charts allow you to illustrate your workbook
1. Manipulating Charts
 1. Manipulating Charts Charting or graphing of data makes it easier to understand a trend about presentation of data. Many of us need to create such graphs, charts or visual chars like pi-chart etc at
1. Manipulating Charts
 1. Manipulating Charts Charting or graphing of data makes it easier to understand a trend about presentation of data. Many of us need to create such graphs, charts or visual chars like pi-chart etc at
Data Visualization. Prof.Sushila Aghav-Palwe
 Data Visualization By Prof.Sushila Aghav-Palwe Importance of Graphs in BI Business intelligence or BI is a technology-driven process that aims at collecting data and analyze it to extract actionable insights
Exploring Microsoft Office Excel 2010 Comprehensive Grauer Poatsy Mulbery Hogan First Edition
 Exploring Microsoft Office Excel 2010 Comprehensive Grauer Poatsy Mulbery Hogan First Edition Pearson Education Limited Edinburgh Gate Harlow Essex CM20 2JE England and Associated Companies throughout
Use the interactive below to view examples of some of the types of charts that are available in Excel.
 Excel 2010 Working with Charts Introduction Page 1 A chart is a tool you can use in Excel to communicate your data graphically. Charts allow your audience to see the meaning behind the numbers, and they
Microsoft Office: Excel 2013
 Microsoft Office: Excel 2013 Intro to Charts University Information Technology Services Training, Outreach and Learning Technologies Copyright 2014 KSU Department of University Information Technology Services
Business Statistics: A Decision-Making Approach 7 th Edition
 Business Statistics: A Decision-Making Approach 7 th Edition Chapter 2 Graphs, Charts, and Tables Describing Your Data Business Statistics: A Decision-Making Approach, 7e 2008 Prentice-Hall, Inc. Chap
points in a line over time.
 Chart types Published: 2018-07-07 Dashboard charts in the ExtraHop system offer multiple ways to visualize metric data, which can help you answer questions about your network behavior. You select a chart
Creating Simple Report from Excel
 Creating Simple Report from Excel 1.1 Connect to Excel workbook 1. Select Connect Microsoft Excel. In the Open File dialog box, select the 2015 Sales.xlsx file. 2. The file will be loaded to Tableau, and
Which Chart or Graph is Right for you?
 Which Chart or Graph is Right for you? You know that data can answer your business questions, but how do you visualize your data to answer those questions in a way that is easily understandable? Choosing
P6 Analytics Reference Manual
 P6 Analytics Reference Manual Release 3.2 December 2013 Contents Getting Started... 7 About P6 Analytics... 7 Prerequisites to Use Analytics... 8 About Analyses... 9 About... 9 About Dashboards... 10
The Complete Guide To Using Excel For PPC
 The Complete Guide To Using Excel For PPC By: Jacob Brown, Account Manager Rachael Law, Account Analyst Excel is a crucial tool for any PPC marketer s daily workflow. From building campaigns and writing
Contents Getting Started... 7 Sample Dashboards... 12
 P6 Analytics Reference Manual Release 3.4 September 2014 Contents Getting Started... 7 About P6 Analytics... 7 Prerequisites to Use Analytics... 8 About Analyses... 9 About... 9 About Dashboards... 10
I214 Repor ting quantitative data
 I214 Repor ting quantitative data November 4, 2008 (with thanks to Gary Kass and Edward Tufte) Why graphs? Ex: The Harris Poll #100, Oct 15, 2007 American adults have their choice of many different cuisines
Quantitative Methods. Presenting Data in Tables and Charts. Basic Business Statistics, 10e 2006 Prentice-Hall, Inc. Chap 2-1
 Quantitative Methods Presenting Data in Tables and Charts Basic Business Statistics, 10e 2006 Prentice-Hall, Inc. Chap 2-1 Learning Objectives In this chapter you learn: To develop tables and charts for
An ordered array is an arrangement of data in either ascending or descending order.
 2.1 Ordered Array An ordered array is an arrangement of data in either ascending or descending order. Example 1 People across Hong Kong participate in various walks to raise funds for charity. Recently,
STA Module 2A Organizing Data and Comparing Distributions (Part I)
") STA 2023 Module 2A Organizing Data and Comparing Distributions (Part I) 1 Learning Objectives Upon completing this module, you should be able to: 1. Classify variables and data as either qualitative or
STA 2023 Module 2A Organizing Data and Comparing Distributions (Part I) 1 Learning Objectives Upon completing this module, you should be able to: 1. Classify variables and data as either qualitative or
GRACE: Tracking Water from Space. Groundwater Storage Changes in California s Central Valley Data Analysis Protocol for Excel: PC
 Groundwater Storage Changes in California s Central Valley Data Analysis Protocol for Excel: PC 2007-10 Before GRACE it was very difficult to estimate how the total volumes of groundwater are changing.
STA Rev. F Learning Objectives. Learning Objectives (Cont.) Module 2 Organizing Data
 Module 2 Organizing Data") STA 2023 Module 2 Organizing Data Rev.F08 1 Learning Objectives Upon completing this module, you should be able to: 1. Classify variables and data as either qualitative or quantitative. 2. Distinguish
STA 2023 Module 2 Organizing Data Rev.F08 1 Learning Objectives Upon completing this module, you should be able to: 1. Classify variables and data as either qualitative or quantitative. 2. Distinguish
MAS187/AEF258. University of Newcastle upon Tyne
 MAS187/AEF258 University of Newcastle upon Tyne 2005-6 Contents 1 Collecting and Presenting Data 5 1.1 Introduction...................................... 5 1.1.1 Examples...................................
Chart styles in Snap Survey Software. A summary of standard chart styles and advanced analysis options
 Chart styles in Snap Survey Software A summary of standard chart styles and advanced analysis options Table of Contents 3. About this report 4. How to view the charts used within this report 5. Bar Charts
Total Cost of Materials:
 Worksheet 1: Cost Inventors have to do more than just come up with brilliant ideas. They then need to take those ideas and implement them using available money, resources, and time. Now that you have created
Microsoft Office Project 2010 Basic Course 01: Getting Started
 Microsoft Office Project 2010 Basic Course 01: Getting Started Slide 1 Topic A Project Management Concepts Slide 2 Project Constraints Slide 3 Phases of Project Management The initial Phase Initiating
Finding patterns in data: charts and tables
 4 Finding patterns in data: charts and tables Prerequisites Some understanding of sampling methods (Chapter 3: Collecting data: surveys and samples) would be useful but is not essential. Objectives To
Variables and data types
 Variables and data types (*) Data comes from observations. (*) Each observation yields values for one or more variables. (*) Qualitative variables: The characteristic is categorical. E.g., gender, ethnicity,
THE GANTT CHART WHAT IS USED FOR HOW TO MAKE IT WITH EXCEL
 Disegno, Progettazione e Organizzazione Industriale English lesson 5BMEC Prof. Massimiliano Usai THE GANTT CHART WHAT IS USED FOR HOW TO MAKE IT WITH EXCEL WHAT IS USED FOR: The Gantt chart is mainly used
AudienceView Product Update
 AudienceView Product Update Version 1.1.0-10 th February 2016 Please be informed that AudienceView has been updated on 10 th February 2016 to version 1.1.0. Along with important bug fixes and some minor
QuickBooks Online Edition. Usability Test Results. April 2007
 QuickBooks Online Edition Pay Liabilities Workflow Usability Test Results April 2007 Study goals Determine which of two Setup Liabilities flows is preferred by existing QBOE users Gather the 2nd round
Excel Chapter 3 What-If Analysis, Charting and Large Worksheets
 Excel Chapter 3 What-If Analysis, Charting and Large Worksheets 1. What is a fill series? 2. There are two ways to make a fill series. What are they? 3. What does the ######## error mean? 4. What does
Designing Impactful Data Visualization By Thomas Portolano
 Designing Impactful Data Visualization By Thomas Portolano 1 Workshop agenda A picture is worth a thousand words 3 But not any picture 12 Our ambition 12 Key design elements 20 Dataviz grammar 33 Wrap
Data Visualization. Non-Programming approach to Visualize Data
 Data Visualization Non-Programming approach to Visualize Data Dr. Omer Ayoub Senior Data Scientist, House of Mathematical and Statistical Sciences, King Abdul Aziz Univerrsity, Jeddah, Saudi Arabia Dr.
Module #1 Engr 124 Excel, F18
 Module #1 Engr 124 Excel, F18 Name: Objective: To create and use spreadsheets in Microsoft Excel, including: basic mathematical operations (adding/subtracting/multiplying, etc.); plotting graphs (scatter
Become a PowerPoint Guru [Sample Chapters]
![Become a PowerPoint Guru [Sample Chapters]](/thumbs/73/68573509.jpg "Become a PowerPoint Guru [Sample Chapters]") Become a PowerPoint Guru [Sample Chapters] Learn How to Create Effective Presentations By Dave Tracy dave@learnppt.com Thank you for your interest in my ebook. This PDF includes a sampling of content from
Become a PowerPoint Guru [Sample Chapters] Learn How to Create Effective Presentations By Dave Tracy dave@learnppt.com Thank you for your interest in my ebook. This PDF includes a sampling of content from
Data Visualization In Oracle Business Intelligence 11g
 Data Visualization In Oracle Business Intelligence 11g Heartland OUG October 20, 2011 Dan Vlamis and Tim Vlamis Vlamis Software Solutions 816-781-2880 http://www.vlamis.com Copyright 2011, Vlamis Software
Section 9: Presenting and describing quantitative data
 Section 9: Presenting and describing quantitative data Australian Catholic University 2014 ALL RIGHTS RESERVED. No part of this work covered by the copyright herein may be reproduced or used in any form
Econ 3790: Business and Economics Statistics. Instructor: Yogesh Uppal
 Econ 3790: Business and Economics Statistics Instructor: Yogesh Uppal Email: yuppal@ysu.edu Chapter 2 Summarizing Qualitative Data Frequency distribution Relative frequency distribution Bar graph Pie chart
opensap Getting Started with Data Science
 opensap Getting Started with Data Science Exercise Week 1 Unit 6 Initial Data Analysis & Exploratory Data Analysis opensap TABLE OF CONTENTS INTRODUCTION... 3 EXERCISE INSTRUCTIONS... 4 Acquire Data...
SAS Enterprise Guide: Point, Click and Run is all that takes
 ABSTRACT SAS Enterprise Guide: Point, Click and Run is all that takes Aruna Buddana, TiVo Inc, Alviso, CA The Audience Research and Measurement team at TiVo constantly collects and processes anonymous
DOWNLOAD PDF MANUAL ON PRESENTATION OF DATA AND CONTROL CHART ANALYSIS
 Chapter 1 : ASTM manual on presentation of data and control chart analysis ( edition) Open Library tis Atmh s Manual on Presentation of Data and Control Chart Analysis is the ninth edition of the Astm
Observations from the Winners of the 2013 Statistics Poster Competition Praise and Future Improvements
 Observations from the Winners of the 2013 Statistics Poster Competition Praise and Future Improvements Jürgen Symanzik*, Utah State University, Department of Mathematics and Statistics, Logan, UT 84322-3900,
Best Practices in Dashboard Design
 Best Practices in Dashboard Design Dan Bulos bulos@symcorp.com Agenda What is a Dashboard? Dashboard Best Practices Dashboard Components Navigation Metaphors Go Only So Far Monitors a Continuous Process
CHAPTER 10. Graphs, Good and Bad
 CHAPTER 10 Graphs, Good and Bad DISPLAYING DATA The first part of this course dealt with the production of data, through random sampling and randomized comparative experiments. This particular unit focuses
CS130 Software Tools. Fall 2010 Regression and Excel
 Software Tools Regression and Excel 1 Regression Analysis (Part 1) Regression Analysis The statistical crystal ball Regression analysis is a form of statistical analysis used for forecasting. We are going
How do you know which chart to use?
 How do you know which chart to use? In this PowerPoint, each chart will be defined and described with an example of the data it is most appropriately suited to represent. How are charts used in other classes?
Aug 1 9:38 AM. 1. Be able to determine the appropriate display for categorical variables.
 Chapter 3 Displaying and Describing Categorical Data Objectives: Students will: 1. Be able to determine the appropriate display for categorical variables. 2. Be able to summarize the distribution of a
CAREER PATHWAY PERFORMANCE MANAGEMENT SYSTEM EMPLOYEE USER GUIDE
 CAREER PATHWAY PERFORMANCE MANAGEMENT SYSTEM EMPLOYEE USER GUIDE TABLE OF CONTENTS Process and System Information... 2 Performance Management Process... 2 Accessing Career Pathway... 2 Goals, Competencies,
Oracle Revenue Management and Billing Product Manager s Workbench. User Guide. Version Revision 1.1. E December, 2018
 Oracle Revenue Management and Billing Product Manager s Workbench Version 2.7.0.0.0 User Guide Revision 1.1 E88591-01 December, 2018 Copyright 2017, Oracle and/or its affiliates. All rights reserved. 1
DATA MANAGEMENT BASICS. July 19, 2017 September 8, 2017
 DATA MANAGEMENT BASICS July 19, 2017 September 8, 2017 OBJECTIVES Enthuse evaluative thinking Encourage performance measurement Build knowledge of concepts related to: o Data collection o Data analysis
Data Visualization Best Practices. Tim Vlamis Friday, March 10, 2017 NCOAUG Winter Training
 Data Visualization Best Practices Tim Vlamis Friday, March 10, 2017 NCOAUG Winter Training Day @VlamisSoftware Vlamis Software Solutions Vlamis Software founded in 1992 in Kansas City, Missouri Developed
Business Quantitative Analysis [QU1] Examination Blueprint
![Business Quantitative Analysis [QU1] Examination Blueprint](/thumbs/94/121308410.jpg "Business Quantitative Analysis [QU1] Examination Blueprint") Business Quantitative Analysis [QU1] Examination Blueprint 2014-2015 Purpose The Business Quantitative Analysis [QU1] examination has been constructed using an examination blueprint. The blueprint, also
Business Quantitative Analysis [QU1] Examination Blueprint 2014-2015 Purpose The Business Quantitative Analysis [QU1] examination has been constructed using an examination blueprint. The blueprint, also
SAS Human Capital Management 5.2
 SAS Human Capital Management 5.2 User s Guide SAS Documentation The correct bibliographic citation for this manual is as follows: SAS Institute Inc. 2010. SAS Human Capital Management 5.2: User s Guide.
8 Pro Marketing Charts your CEO wants to see
 8 Pro Marketing Charts your CEO wants to see and how you can create them in Excel Tell your company s marketing story through stunning charts Marketing has evolved from being an art to being a scientifically
[EPUB] SHOW AN EXCEL TABLE ON A USERS MANUAL EBOOK
![[EPUB] SHOW AN EXCEL TABLE ON A USERS MANUAL EBOOK](/thumbs/77/75948336.jpg "[EPUB] SHOW AN EXCEL TABLE ON A USERS MANUAL EBOOK") 23 April, 2018 [EPUB] SHOW AN EXCEL TABLE ON A USERS MANUAL EBOOK Document Filetype: PDF 506.64 KB 0 [EPUB] SHOW AN EXCEL TABLE ON A USERS MANUAL EBOOK And we want one chart that shows them both together
23 April, 2018 [EPUB] SHOW AN EXCEL TABLE ON A USERS MANUAL EBOOK Document Filetype: PDF 506.64 KB 0 [EPUB] SHOW AN EXCEL TABLE ON A USERS MANUAL EBOOK And we want one chart that shows them both together
If you want to flag a question for later review, select the "Mark for review" button.
 Exam Number: 584002RR Lesson Name: Microsoft Excel 2016 Exam Guidelines: This exam is now available only in the online assessment system. If your study guide still contains an exam, that exam is no longer
Tutorial #7: LC Segmentation with Ratings-based Conjoint Data
 Tutorial #7: LC Segmentation with Ratings-based Conjoint Data This tutorial shows how to use the Latent GOLD Choice program when the scale type of the dependent variable corresponds to a Rating as opposed
QuEST Forum Advanced Performance Data Graphical Reports
 QuEST Forum Advanced Performance Data Graphical Reports QuEST Forum - Advanced Performance Data Graphical Reports 1 1. Introduction 1.1 Scope Develop a new dashboard for QuEST Forum members to view advanced
V4 SQL Dashboard Features
 V4 SQL Dashboard Features 2000-2016 NECS, Inc. All Rights Reserved. I entrée V4 SQL System Guide Table of Contents Chapter I Contact NECS 1 Chapter II Using Dashboards 2 1 Dashboard... Features 2 2 Inventory...
CE 115 Introduction to Civil Engineering Graphics and Data Presentation Application in CE Materials
 CE 115 Introduction to Civil Engineering Graphics and Data Presentation Application in CE Materials Dr. Fouad M. Bayomy, PE Professor of Civil Engineering University of Idaho Moscow, ID 83844-1022 Graphics
Reference Guide for Employees: Halogen eappraisal
 Reference Guide for Employees: Halogen eappraisal Purpose of the Evaluation Process: eappraisal was designed for managers to evaluate employee performance and achievement for the past year, as well as
Sage ERP MAS 90 and Intelligence Release Notes
 Sage ERP MAS 90 and 200 4.50 Intelligence Release Notes Table of Contents 1 New Reporting Trees... 2 1.1 Reporting Tree Example... 2 1.2 Reporting Trees... 2 1.3 Linking Reporting Tree Units to Distribution
Adobe Experience Cloud Ad Hoc Analysis Project Converter
 Adobe Experience Cloud Ad Hoc Analysis Project Converter Contents Ad Hoc Analysis Project Converter...3 Convert Your Projects in Ad Hoc Analysis...4 View Converted Projects in Analysis Workspace...6 Project
Oracle. SCM Cloud Using Demand Management. Release 13 (update 17D)
") Oracle SCM Cloud Release 13 (update 17D) Release 13 (update 17D) Part Number E89175-01 Copyright 2011-2017, Oracle and/or its affiliates. All rights reserved. Author: Nithin Premkumar This software and
Oracle SCM Cloud Release 13 (update 17D) Release 13 (update 17D) Part Number E89175-01 Copyright 2011-2017, Oracle and/or its affiliates. All rights reserved. Author: Nithin Premkumar This software and
Topic 1: Descriptive Statistics
 Topic 1: Descriptive Statistics Econ 245_Topic 1 page1 Reference: N.C &T.: Chapter 1 Objectives: Basic Statistical Definitions Methods of Displaying Data Definitions: S : a numerical piece of information
RiskyProject Lite 7. User s Guide. Intaver Institute Inc. Project Risk Management Software.
 RiskyProject Lite 7 Project Risk Management Software User s Guide Intaver Institute Inc. www.intaver.com email: info@intaver.com 2 COPYRIGHT Copyright 2017 Intaver Institute. All rights reserved. The information
Billing 94. Billing. Under this tab, bills are automatically created according to your specifications. YouWinLaw Manual. Copyright WinYou Law Inc.
 Billing Under this tab, bills are automatically created according to your specifications. Billing 94 - Billing Billing 95 Draft Final Billing Template: This is the default template for the selected project.
empower charts Complex charts. Effortlessly created.
 empower charts Complex charts. Effortlessly created. Visualize complexity Gantt and waterfall: our dream team for clear visualization Use empower charts for the planning and reporting of projects: Gantt
Right click on the influent element and select name. Type Influent in the box. This should change the name of your element to influent.
 CE 521 WASTEWATER ENGINEERING - BIOWIN DESIGN PROJECT IN CLASS ASSIGNMENT TUTORIAL (adapted from assignments by Professor Chris Schmit SDSU http://learn.sdstate.edu/christopher%5fschmit/) Start BioWin
INSTRUCTOR: Detailed WPM Report
 INSTRUCTOR: Detailed WPM Report Arlene Zimmerly, Coauthor Gregg College Keyboarding & Document Processing, 11e Note: This presentation is intended for instructor use only. You will learn about Course Manager
Thought Question 2: Here is a plot that has some problems. Give two reasons why this is not a good plot.
 Lecture 7 Graphs Thought Question 1: Suppose you have been keeping track of your living expenses and find that you spend 50% of your money on rent, 25% on food, and 25% on other expenses. Draw a pie chart
UV254 Go! Measurement and Calibration of BOD against the BOD five day test
 1 st October 18 UV254 Go! Measurement and Calibration of BOD against the BOD five day test Tools Needed Photonic Measurements UV254 Go! Quartz Cuvettes Distilled water BOD 5day testing system such as BODTrak
Chapter 1 Data and Descriptive Statistics
 1.1 Introduction Chapter 1 Data and Descriptive Statistics Statistics is the art and science of collecting, summarizing, analyzing and interpreting data. The field of statistics can be broadly divided
Microsoft Dynamics CRM 2016 Customization and Configuration
 Microsoft Dynamics CRM 2016 Customization and Configuration Microsoft MB2-712 Dumps Available Here at: /microsoft-exam/mb2-712-dumps.html Enrolling now you will get access to 90 questions in a unique set
A Guide To Socialbakers Analytics and its Enhanced Facebook Insights
 A Guide To Socialbakers Analytics and its Enhanced Facebook Insights 2 Introduction To make accessing and understanding your metrics easier and more useful, we ve enhanced Socialbakers Analytics with tighter
SCENARIO: We are interested in studying the relationship between the amount of corruption in a country and the quality of their economy.
 Introduction to SPSS Center for Teaching, Research and Learning Research Support Group American University, Washington, D.C. Hurst Hall 203 rsg@american.edu (202) 885-3862 This workshop is designed to
Why Learn Statistics?
 Why Learn Statistics? So you are able to make better sense of the ubiquitous use of numbers: Business memos Business research Technical reports Technical journals Newspaper articles Magazine articles Basic
Using SPSS for Linear Regression
 Using SPSS for Linear Regression This tutorial will show you how to use SPSS version 12.0 to perform linear regression. You will use SPSS to determine the linear regression equation. This tutorial assumes
Level 2 ICT. Developing, Presenting and Communicating Information
 Level 2 ICT Developing, Presenting and Communicating Information Spreadsheets L2.7a, c Based on Microsoft Office 2010 At this Level 2 learners should be able to: Use appropriate software to meet the requirements
New A Level Economics. Labour Markets SAMPLE. Resources for Courses
 New A Level Economics Labour Markets Digging a Hole Teacher Instructions This resource (including the Powerpoint game file) is used to introduce the concept of marginal physical product and marginal revenue
Guidelines for Collecting Data via Excel Templates
 Guidelines for Collecting Data via Excel Templates We aim to make your studies significant Table of Contents 1.0 Introduction --------------------------------------------------------------------------------------------------------------------------
DPMX Trial User Guide. A Cloud-based, On-demand Portfolio Analytics System
 DPMX Trial User Guide A Cloud-based, On-demand Portfolio Analytics System DPMX Trial User Guide Accessing your DPMX Trial To access your DPMX trial: Open a web browser and go to: dpmxtrial.syncopation.com
Physics 141 Plotting on a Spreadsheet
 Physics 141 Plotting on a Spreadsheet Version: Fall 2018 Matthew J. Moelter (edited by Jonathan Fernsler and Jodi L. Christiansen) Department of Physics California Polytechnic State University San Luis
Oracle Hyperion Planning for the Power User
 Oracle Hyperion Financial Planning for the Power User Oracle Hyperion Financial Planning for the Power User Course Description Course Name: Course Number: Duration: Oracle Hyperion Planning for the Power
Attrition Predictor Analysis
 Delivering Public Service for the Future Attrition Predictor Analysis Overview Attrition Predictor What to Do, What to Say (WTD, WTS) Background The Attrition Predictor enables proactive attrition management
Statistics: Data Analysis and Presentation. Fr Clinic II
 Statistics: Data Analysis and Presentation Fr Clinic II Overview Tables and Graphs Populations and Samples Mean, Median, and Standard Deviation Standard Error & 95% Confidence Interval (CI) Error Bars
Lightning Experience Reports & Dashboards
 Lightning Experience Reports & Dashboards Visualize key business metrics in real-time using Lightning Experience. UNIT I - Getting Started with Reports and Dashboards in Lightning Experience Introduction
1Z Oracle 1Z0-567 Primavera P6 Enterprise Project Portfolio Management 8 Essentials Version: 4.9
 Oracle Primavera P6 Enterprise Project Portfolio Management 8 Essentials Version: 4.9 1 QUESTION: 1 You are a portfolio manager, and a filter has been set to identity and assign projects to your portfolio.
Sage Intelligence Reporting Trees
 Sage Intelligence Reporting Trees Reporting Trees... 3 Introducing Reporting Trees... 3 Reporting Unit Structures... 4 Parent Child Relationships... 7 Account Filters... 7 Managing Reporting Trees... 11
RiskyProject Lite 7. Getting Started Guide. Intaver Institute Inc. Project Risk Management Software.
 RiskyProject Lite 7 Project Risk Management Software Getting Started Guide Intaver Institute Inc. www.intaver.com email: info@intaver.com Chapter 1: Introduction to RiskyProject 3 What is RiskyProject?
Guideline for Performing Cost Benefit and Sustainability Analysis of Remedial Alternatives. Instructions for the Excel based Tool (Version 2.
 Guideline for Performing Cost Benefit and Sustainability Analysis of Remedial Alternatives Instructions for the Excel based Tool (Version 2.0) 1 Documentation Contents 1. Purpose and Background 2. Structure
Chapter 2: Using Multiple Worksheets in a Model
 Chapter 2: Using Multiple Worksheets in a Model Objectives This chapter is intended to expand on the features of Excel introduced in the demonstration models of Chapter 1. As the title implies, a general
Ordered Array (nib) Frequency Distribution. Chapter 2 Descriptive Statistics: Tabular and Graphical Methods
 Frequency Distribution. Chapter 2 Descriptive Statistics: Tabular and Graphical Methods") Chapter Descriptive Statistics: Tabular and Graphical Methods Ordered Array (nib) Organizes a data set by sorting it in either ascending or descending order Advantages & Disadvantages Useful in preparing
Chapter Descriptive Statistics: Tabular and Graphical Methods Ordered Array (nib) Organizes a data set by sorting it in either ascending or descending order Advantages & Disadvantages Useful in preparing
Guide to Weak-Story Tool
 Appendix A Guide to Weak-Story Tool A.1 Introduction The Guidelines introduce topics that may be unfamiliar to some engineers. Though the calculations required in Chapters 4 and 5 are not conceptually
Performance Measure 73: State/Territory Quality Assessment
 Performance Measure 73: State/Territory Quality Assessment The numbers needed for the Performance Measure 73 EHB entries have been calculated, but you may want to do some quality assessment to better understand
Runs of Homozygosity Analysis Tutorial
 Runs of Homozygosity Analysis Tutorial Release 8.7.0 Golden Helix, Inc. March 22, 2017 Contents 1. Overview of the Project 2 2. Identify Runs of Homozygosity 6 Illustrative Example...............................................