Denver Regional Integrated Traveler Information Display Map Guidelines
|
|
|
- Eustace Patrick
- 6 years ago
- Views:
Transcription


1 Denver Regional Integrated Traveler Information Display Map Guidelines March 2012 EXPECT DELAYS ON I-25 Prepared by: Colorado Department of Transportation in cooperation with Denver Regional Council of Governments
2 Denver Regional Integrated Traveler Information Display Map Guidelines Revision History Date Version Description March 31, Initial document released
3 ACRONYMS AND ABBREVIATIONS AVI.. Automated Vehicle Identification AWAM.Anonymous Wireless Address Matching CADD...Computer Aided Dispatch System CCTM...City and County Traffic Management CDOT.... Colorado Department of Transportation COTRIP Colorado Highway Traveler Information Website CTMS Colorado Traffic Management System DOT...Department of Transportation DRCOG...Denver Regional Council of Governments FHWA......Federal Highway Administration GIS Geographic Information Systems H...High ITS.. Intelligent Transportation Systems L.....Low MPO......Metropolitan Planning Organization MOE Measures of Effectiveness MSA....Metropolitan Statistical Area P....Point i
4 P2P..Point-to-Point PTI..Planning Time Index PTZ.....Pan Tilt Zoom TMC. Traffic Messaging Channel TOD.....Time of Day T.T.I..... Toll Tag Indicator TTI...Travel Time Index VMS... Variable Message Sign WSDOT.Washington Department of Transportation XML...Extensible Markup Language ii
5 TABLE OF CONTENTS 1. Introduction BACKGROUND AND PROBLEM DEFINITION PROJECT GOALS REPORT OUTLINE GUIDELINES DEVELOPMENT PROCESS AND ORGANIZATION Existing Applications and Best Practices EXISTING APPLICATIONS IN COLORADO City and County of Denver City of Fort Collins Douglas County EXISTING APPLICATIONS OUTSIDE OF COLORADO City of Bellevue, WA City of Seattle, WA City of Los Angeles, CA City of Tallahassee, FL City of Houston, TX ARTERIAL CONDITIONS APPLICATIONS MATRIX PRIVATE ISPS AND VENDORS INRIX Google iii
6 2.4.3 Bing Trafficcast NAVTEQ RECOMMENDED BEST PRACTICE APPROACHES Arterial Travel Condition Information Planning and Coordination Determining Coverage Area for Arterial Travel Condition Implementation Travel Condition parameters Travel Condition Data Collection Technologies Travel Condition Data Process Travel Condition Data Validation Travel Condition Information Dissemination Users of the Arterial Condition Information Technical Development of Application Base Map Archiving Data Use of Private Entities Color Coding and Legend Guidelines for the Denver Region USE OF ARTERIAL TRAVEL CONDITION INFORMATION GEOGRAPHICAL COVERAGE FOR ARTERIAL TRAVEL CONDITIONS PLANNING AND COORDINATION iv
7 3.4 TRAVEL CONDITION DATA PARAMETERS Travel Time Travel Time Measurement Segment Definition Sample Size Placement of the Devices to Measure Travel Time Density of the Devices Data Collection Timeliness Travel Time Data Processing Travel Time Index (TTI) Processing Planning Time Index (PTI) Processing Real-Time Travel Time Algorithm and Graphical Display Output Real-Time Travel Time Tabular Display Travel Time Calculation and Validation Accepting Travel Time Data from Private ISPs and Vendors Providing Travel Time Data to Private ISPs Travel Time Measures of Effectiveness (MOEs) and Reporting Congestion Duration Usefulness of MOEs to Operators Usefulness of MOEs to Others Traffic Incident Information Types of Traffic Incidents v
8 Traffic Incident Detection Traffic Incident Verification Incident Information Validation Traffic Camera Placement Traffic Incident Response and Reporting Traffic Incident Information Display Output Traffic Incident Clearance Data Timeliness Accepting Incident Information from Private ISPs Providing Data to Private ISPs Incident Information MOEs Usefulness of MOEs to Operators Usefulness of MOEs for Others Weather Related Road Condition Information Types of Weather Road Condition Information Segmentation for Weather Related Road Condition Information Detection of Weather Related Road Conditions Road Conditions Graphical Display Output Tabular Display of Weather Related Road Conditions Information Data Timeliness Weather Related Road Condition Information Validation Weather Related Road Condition MOEs vi
9 Usefulness of MOEs to Operators Usefulness of MOEs to Others Construction and Maintenance Operations Information Types of Construction and Maintenance Operations Collection of Construction and Maintenance Operations Information Graphical and Tabular Display of Construction and Maintenance Operations Information Data Timeliness Construction and Maintenance Operations Information Validation Construction and Maintenance Operations Information MOEs Usefulness of MOEs for Operators Usefulness of MOEs for Others Traffic Video Event Information Event Information Validation Parking Information for Events Speed Device Type, Segmentation, Placement and Time Intervals for Data Collection Speed Graphical and Tabular Display Output Accepting Data from Private ISPs Speed MOEs and Reporting Usefulness of MOEs to Operators Usefulness of MOEs to Others vii
10 3.4.8 Queues Queue Presence and Queue Length Device Type to Collect Queue Data Applicability Placement of Device Data Collection Timeliness Density of the Devices Time Intervals for Processing and Display Queue Data Processing Graphical and Tabular Display Output Queue Data Validation Providing or Accepting Queue Data to Private ISPS Usefulness of MOES to Operators Volume Device Type to Collect Volume Data Device placement and Density Data Collection Timeliness Time Intervals for Processing and Display Graphical and Tabular Display Output Volume Data Validation Private ISPs MOEs and Reporting viii
11 Usefulness of MOEs to Operators Usefulness of MOEs to Others Occupancy DATA QUALITY PARAMETERS Accuracy Availability Timeliness DATA DISSEMINATION CoTrip Website GOV Delivery VMS HAR CCTM COGNOS CCTV Application on Google BASE MAP FOR DISPLAYING ARTERIAL TRAVEL CONDITION INFORMATION BASE MAP FOR DISPLAYING ARTERIAL TRAVEL CONDITION INFORMATION FOR LOCAL AGENCIES TRANSMITTING AND ARCHIVING DATA Transmitting Data to CDOT Data Storage ix
12 3.9.3 Data Archival ALARMS PERFORMANCE MEASURES REPORT CARD TYPICAL DAY SCENARIO FOR AN OPERATOR REPORTING Conclusions and Next Steps IMPLICATIONS OF THE GUIDELINES Commitment and Resources Field Infrastructure CTMS CoTrip CCTM COGNOS Marketing of Travel Condition Data Parameters NEXT STEPS x
13 LIST OF TABLES Table 1: Arterial Conditions Application Matrix Table 2: FHWA Rule on Real Time Traveler Information Systems Table 3: Arterial Color Codes and Existing Legend Table 4: Color Coding Thresholds and Legends Table 5: Color Code and Weather Related to Road Conditions Table 6: Recommended Color Code and Weather Related Road Conditions Table 7: Travel Condition Data Parameters and Accuracy Guidelines Table 8: Travel Condition Data Parameters and Availability Guidelines Table 9: Travel Condition Data Parameters and Timeliness Guidelines Table 10: Data Dissemination Options Table 11: Time Intervals for the current data storage Table 12: Storage Format of Older Data xi
14 LIST OF FIGURES Figure 1: Denver Arterial Travel Conditions on COTRIP website... 8 Figure 2: FCtrip Web-based Application used by Fort Collins... 9 Figure 3: Proposed Douglas County Application using VMS Figure 4: City of Bellevue Web-based Application Figure 5: WSDOT Web-based Application for Bellevue Area Figure 6: City of Seattle Web-based Application Figure 7: WSDOT Web-based Application for Seattle Area Figure 8: City of Los Angeles Web-based Application Figure 9: City of Tallahassee Web-based Application Figure 10: Bluetooth Concept on the roadside Figure 11: West Houston Arterial Grid for Travel Time Monitoring Figure 12: INRIX Traffic Application Map Figure 13: New Mexico State Travel Conditions Map Figure 14: Google Travel Conditions Map Figure 14: Bing Travel Conditions Map Figure 16: Trafficcast Travel Conditions Map Figure 17: NAVTEQ Travel Conditions Map Figure 18: Major Regional and Principal Arterials within the Denver Region Figure 19: Travel Time Data Flow and Potential Time Intervals xii
15 Figure 20: Tabular Display of Arterial Corridor information on CoTrip Figure 21: CoTrip Current Construction And Maintenance Operations Display Figure 22: Construction Information for the I-25 and Santa Fe Project as shown on CoTrip Figure 23: CoTrip Tabular Display for Maintenance Operations for I-70 though the Eisenhower Tunnel Figure 24: Proposed High Level Architecture xiii
16 LIST OF APPENDICES Appendix A: Prioritization of Process for Travel Condition Data Parameters... A-1 Appendix B: Implementation and Considerations... B-1 Appendix C: Denver Region Guidelines Summary Matrix... C-1 xiv
17 1. Introduction 1.1 Background and Problem Definition Over the past few years, significant resources have been invested by State Departments of Transportation in providing real-time travel conditions on Interstates. This information is being provided on the roadway, traveler information websites, and traveler information phone systems. These applications are generally at a mature and advanced state of development. More recently, several local agencies (Cities and Counties) across the United States have begun providing realtime travel condition information on the highway and arterial networks. These applications are at a relatively new stage of development. With only two local development applications in the Denver Metropolitan Area - the City and County of Denver application and the Douglas County application, it is evident that the data collection, processing and dissemination of road condition information can be accomplished in different ways. The review of few other applications across the United States reveals a similar trend. i.e., there is not much consistency and standardization in how data is being collected, processed and disseminated. Furthermore, it is not clear how the information is intended to be used. Additionally, there is lack of clarity on the purpose of such applications, and the intended audience. Within the Region, it was not clear if the purpose of such applications is for travelling public or the operators. The problem is further compounded when the arterial condition information needs to be integrated with neighboring jurisdictions and the State DOT. From a travelling public perspective, the traveler information is expected to be consistent, reliable and timely regardless of jurisdictional boundaries. Additionally, FHWA Rule Title 23 Part 511 Subpart C- Federal Register Volume 75, Number 215, pages , effective December 23, 2010 mandates that state and local agencies provide real-time traveler information systems on Interstates and Routes of Significance. There 1
18 are specific requirements on implementation date and data quality parameters. This mandate will lead to more implementation across the Denver region, Colorado and the United States. Therefore, CDOT, DRCOG and local agency stakeholders have decided to undertake this project to proactively address the above concerns and lay a solid foundation that will develop consistent, understandable and meaningful information to the public and operators on arterial road conditions. The project will provide guidelines for display and use of arterial travel conditions. The absence of such guidelines could lead to inconsistency in how data is collected and, processed, displayed, reported and stored. 1.2 Project Goals The goals of the project are to: Investigate how speed and/or travel time data is currently being displayed within Regional stakeholder jurisdictions and rational/basis that was used for displaying it in such manner, and research two to three other large urbanized areas in the continental United States to determine similarities and differences in order to identify best practices. Develop inter-agency consensus on the elements such as: protocols, methodologies, data elements and parameters needed in order to have a common map display and database. Conduct stakeholder working group meetings and identify specific information obtained during investigation and research and how this pertains to maps and how to display it to achieve a common look and feel for these displays on all agency websites. Develop a Report that documents all findings and recommends a preferred approach regarding displaying local jurisdiction speeds and/or travel times on local and regional maps. 2
19 The overall intent of the project is to provide a reasonable first step toward development of consistent map display, which uses the same data and generates the same information for all local jurisdictions in the DRCOG region. This consistency is imperative to provide the traveling public with understandable and meaningful information regarding local arterial travel times, speeds and road conditions. 1.3 Report Outline In addition to Section 1 Introduction, this guidelines report contains three other sections as follows: Section 2 Existing Applications and Best Practices: Presents the current technologies and practices being used in the Denver area and also in areas outside of the State. Section 3 Guidelines for the Denver Region: This section provides guidelines for displaying arterial conditions in the Denver Region. Section 4 Conclusions and Next Steps: This section discusses the implications of the guidelines, marketing the usage of the data to other non-traffic departments or agencies and identifies the immediate next steps. 1.4 Guidelines Development Process and Organization As part of the guidelines development process, the project stakeholders reviewed existing traveler information applications in Colorado and across United States. The detailed review included criteria and technology used, device placement, density, color coding schemes, web display and other relevant information. Based on this in-depth review and evaluation, the stakeholders in the Denver Region identified and agreed upon the following travel condition data parameters, which are listed in priority order. Travel time Traffic incident information Weather related road condition information Construction and maintenance operations information 3
20 Traffic video (image and full motion) Event information and parking information for events Speed Queues Volume Occupancy Appendix A shows the implementation factors associated with travel data condition parameters and the Regional priority ranking for each travel condition data parameter. The Guidelines for the Denver Region begin in Section 3 and are organized as shown below: Section addresses who will use the arterial travel condition information. Section addresses on which roadways the arterial travel condition information should be provided. Section identifies how operators need to work together to implement the guidelines. Section provides guidelines for each travel condition data parameter as follows: Type of device for data collection Placement of the devices Data collection, processing and display Time intervals Measures of Effectiveness (MOE) Usefulness to the operators and others Others that apply Sections provide guidelines regarding the following regional level issues: Data quality Data dissemination Base map Archiving Alarms 4
21 Performance measures report card Typical scenario for operator Reporting 5
22 2. Existing Applications and Best Practices This section provides a summary on each of the local and out-of-state applications that were examined for the project. The information presented in this section was collected through discussions with the local agency operators and review of existing documentation. The discussion and review covered the following: Selection of particular type of detection equipment to understand if certain types of equipment are well suited for arterial conditions applications Data collection device placement to understand agency operator s experience regarding the placement of the data collection devices and ability to get accurate information Data collection device density to understand impact of device density on accuracy Selection of arterials for implementation to understand the selection of arterials for implementation Overall arterial conditions analysis and display logic to see how the data is collected, processed and displayed Validation- to understand how agencies verified the information Data update intervals to understand acceptable update intervals General costs to understand general costs associated with implementation 2.1 Existing Applications in Colorado In Colorado, three local jurisdictions are providing arterial travel condition information. The jurisdictions include City and County of Denver, City of Fort Collins and Douglas County City and County of Denver Currently, Denver provides travel condition information on Colfax Avenue and Speer Boulevard. Denver will be expanding the application to Colorado Boulevard by end of These implementations projects are funded by Denver Regional Council of Governments (DRCOG) through the ITS Pool Project Program. The selection of the corridors was based on available 6
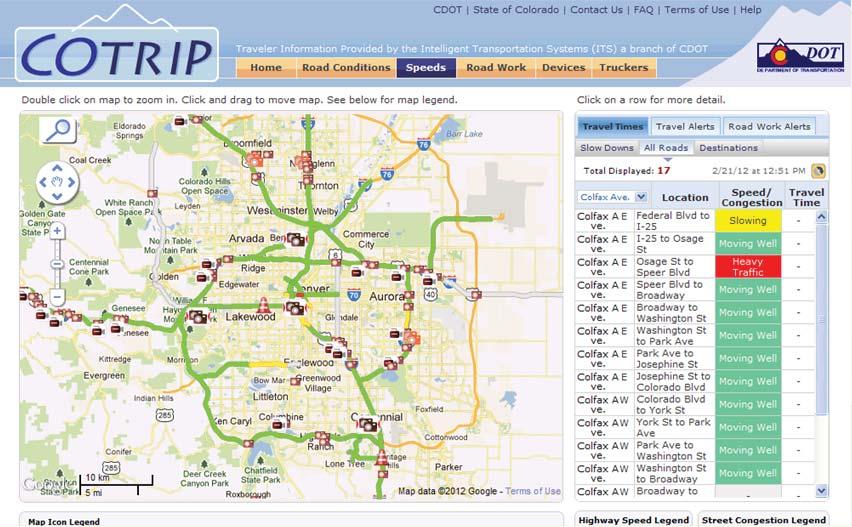
23 data collection equipment and proximity to Interstates. The proximity to the Interstates serves as an extension of travel condition information as the COTRIP website has Interstate real-time and travel condition information. The cost for data collection for each arterial segment was around $20,000 and the software configuration for the corridor is around $50,000. The City intentionally uses different data collection technologies for collecting travel condition information including video detection, radar, etc. This allows the City to evaluate the different technologies. Typically, the data collection device placement captures slightly beyond the normal queue backup of the approach. The detection placement is also dependent on the availability of power and communication. Denver s algorithm uses Point speed and occupancy as the primary measures to report segment conditions. Congestion thresholds are set based on specific arterial segment and what are considered to be its normal operations. Each corridor is divided into segments and each segment is typically from 0.25 mile to one mile. Typically, there are at least two data collection devices in each segment. The signal system server is being used to collect the data from video detection and a software patch was developed to export the data to CDOT s Colorado Traffic Management System (CTMS) server for processing of data. For all other data collection devices, the data is directly collected by the CTMS server for processing. The processed data is then posted to the COTRIP website. The refresh rate is two minutes. However, the total time for point data collected in the field, collected by the server, processed and posted on website could be a maximum of six minutes. The travel condition information is available on the COTRIP website and cell phone application. This allows Interstates and arterial condition information to be displayed on the same website and cell phone application. There is a link from the City s website to the COTRIP site. CDOT uses the Google map base to show travel conditions and the users have the ability to use zoom in/out. The City intends to post the travel condition information on Variable Message Signs (VMS) in the future. The travel conditions on the arterials are shown using the same color coding scheme used to show travel conditions on Interstates as shown in Figure 1. The travel conditions on Interstates are primarily Point speed but some segments include Point to Point speed data. The legend 7

24 for the color coding scheme for travel conditions on arterials is descriptive i.e., moving well, slowing, heavy traffic, very congested and no data. No incident, construction and event information is included with travel condition information on arterials. For Colorado Boulevard, the City will be using Toll Tag Indicators (TTI) to collect Point-to- Point travel time. This will be supplemented with Point speed and occupancy data. This corridor will be implemented in late The City plans to collect travel time information along the corridors on all future implementations. Figure 1: Denver Arterial Travel Conditions on COTRIP website City of Fort Collins The City was displaying arterial travel condition information on all major arterials using a webbased application. The project was funded through the North Front Range Metropolitan Planning Organization, and cost approximately $400,000 to implement the application. The majority of data for the travel condition information was collected by pucks imbedded in the roadway. The primary reason for using the pucks was the lower cost as it allowed for wireless communications. Typically, these data collection devices were placed about 500 feet to 800 feet from the signalized intersection. The City also used video detection for data collection and they were typically closer to the signalized intersection. Segments were about 1 mile long. The data was collected at the server (not signal system server), then processed and posted to the City website. 8

25 The City used Point volume and occupancy as a measure of congestion. The data was collected in five minute intervals and website was refreshed every five minutes. The travel condition information was available on the City s website. Travel condition information available on Interstates was not considered for inclusion. The City used a custom map for the application, which did not have zoom capability. The travel conditions on the arterials followed a three color coding scheme as shown in Figure 2. The legend for the color coding scheme for travel conditions described congestion as low, moderate or high. The City posted known construction and incident information manually. The website showed cameras along the arterials and displayed camera images. Recently, the City decided to temporarily suspend the travel condition application due to staff s concern that the information may not be reliable. The city continues to post construction and maintenance information on the website. It also allows access to camera images via the website. Figure 2: FCtrip Web-based Application used by Fort Collins Douglas County Currently, Douglas County has implemented the arterial conditions application for two major arterials; Lincoln Avenue and Quebec Street. The project is being funded by DRCOG through the ITS Pool Project Program. The selection of the corridors was based on available data 9
26 collection equipment and proximity to Interstates and Interstates. The cost to implement the application will be available shortly. For data collection, the County primarily uses TTIs and supplements with a radar unit. The County provides travel condition and travel time information along the corridors. The TTIs collects Point to Point travel time data and the radar unit collects Point speed and occupancy data. The placements of the TTIs were selected based on known travel patterns along the corridors. The data is being collected by the CTMS server, processed and then posted to the COTRIP website. The refresh rate for the website is about two minutes. The travel condition information is available on the COTRIP website. This would allow Interstates and arterial condition information to be displayed on the same website. There will be a link from the County s website to the COTRIP site. CDOT uses Google map base to show travel conditions and the users have the ability to use zoom in/out. The County will use VMS to post travel time information to major access points. No incident, construction and event information is included with travel condition information on arterials. Initially, the County planned to display travel time information with color coded text to convey travel condition information as shown in Figure 3. However, the County has decided to use the color coded text for the next phase of the project. At this time, the VMS will only display travel time. For the next phase of the project, Douglas County would like to use Bluetooth technology for detection and expansion to other corridors. 10

27 Figure 3: Proposed Douglas County Application using VMS 2.2 Existing Applications Outside of Colorado City of Bellevue, WA: City of Bellevue provides travel condition information for all major arterials. The project was funded by the City. Most of the signals in Bellevue are actuated and have advanced system detection loops installed between 80 feet to 140 feet from the signal. The City uses occupancy as a measure for representing congestion. Currently, the data is collected every cycle and sent to the signal system server. The server then sends out the data every two minutes to the Geographic Information Systems (GIS) for processing and posting to the website. The travel condition information is displayed using GIS maps developed by the City as shown in Figure 4. Future developments for the web application include using the Google map base for the background and providing incident and construction information. The City is also planning an iphone application. It is not clear how the data collection process will work with the City s two different signal systems an adaptive signal system for downtown and a new signal system for the remainder of the signals. 11

28 Figure 4: City of Bellevue Web-based Application Washington DOT (WSDOT) provides Interstates traffic condition information within the City of Bellevue as shown in Figure 5. Neither agency s information is directly displayed on other agency website. However, there is link from WSDOT traffic map to Bellevue Traffic condition map. Additionally, both the agencies display information on different base maps and using different color coding. 12

29 Figure 5: WSDOT Web-based Application for Bellevue Area City of Seattle, WA: Seattle provides travel condition information for select State highways. The corridors were implemented by Traffic.com using radars they placed themselves. The City receives data from the vendor, which is processed for posting on the City s website. The data collection and processing portion of the project was funded by Seattle. Seattle uses occupancy as a measure for representing congestion and displays it on its website using Bing maps. Future developments for the web application include expansion of the conditions to other major arterials and development of an iphone application. The City is also planning to implement traffic conditions information using license plate readers and display the information using Variable Message Signs (VMS). 13

30 Figure 6: City of Seattle Web-based Application WSDOT also provides traffic conditions for the Interstates within the City of Seattle as shown in Figure 7. Neither agency s information is directly displayed on other agency website. However, there is link from WSDOT traffic map to Seattle Traffic condition map. Additionally, both the agencies display information on different base maps and using different color coding. 14

31 Figure 7: WSDOT Web-based Application for Seattle Area Given some of the above challenges, the Puget Sound Regional MPO (that includes Bellevue and Seattle) is in the processing of developing a Regional standard for representing arterial conditions and traffic conditions. At this time, there are no funds available to implement the regional application City of Los Angeles, CA City of Los Angeles uses a web based application to show traffic conditions on all major arterials as shown in Figure 8. The City uses travel speed to measure congestion. GIS maps are used to display congestion and there are zones within the map for specific regions. 15


32 Figure 8: City of Los Angeles Web-based Application City of Tallahassee, FL: Tallahassee uses a web based application to show traffic conditions on all major arterials as shown in Figure 9. The City uses travel speed to measure congestion and GIS maps to display congestion. Figure 9: City of Tallahassee Web-based Application 16

33 Apart from the agencies listed above, the cities of Dallas and San Diego were also contacted to discuss any existing arterial conditions applications. It was observed that City of Dallas has an application that has not been developed completely and it display incidents and lane closure information on Bing map. The City of San Diego does not have any web applications for displaying arterial/interstates conditions maps City of Houston, TX Houston has implemented Bluetooth technology to provide travel time information for the users. Traffic sensors use Anonymous Wireless Address Matching (AWAM) to evaluate speeds and travel times along roadways. Bluetooth readers beside the roadways recognize the Mac address of the each bluetooth device, location and the time of the day the bluetooth device used. These addresses are then matched at the different intersections or points and used to calculate the travel time by central host software and posted on website using XML feeds. Figure 10 shows the concept used in the Bluetooth technology implementation in Houston Figure 10: Bluetooth Concept on the roadside Source: Bluetooth -Based Travel Time/Speed Measuring Systems Development by Darryl D. Puckett and Michael J. Vickich 17

34 Bluetooth technology was implemented in the west Houston within a 160 square kilometer area bounded by IH-10 on the north, IH-610 on the east, the Westpark Toll way on the south and up to and including SH-6 on the west. Figure 11 shows the implemented arterial network in the west Houston. Figure 11: West Houston Arterial Grid for Travel Time Monitoring 2.3 Arterial Conditions Applications Matrix Table 1 shows the Arterial Conditions Applications between agencies. Some highlights include: Type of Data collection technologies used by agencies is quite varied and included video detection, wavetronix, loops, toll tag, pucks etc. Placement of data collection devices varied from back of the queue to 800 from the intersection. The data collection device density was mostly based on segment. Refreshing rates are typically around 120 seconds Not all of the agencies provide incident, construction and video streaming on the web based application. Typically, agencies used 4-7 colors for representing the arterial conditions. 18
35 The base maps used for representing the arterial conditions were either agency developed GIS maps or private providers such as Google or Bing. The deployment of the application was either network or select corridors. Most of the selected corridors were in close proximity to the Interstates. All arterial condition information is available through website and/or cell phone application. No VMS devices are being used to display congestion on arterials. However, two agencies are in the process of using VMS s for providing arterial condition information None of the agencies that were examined provide travel time information on the arterial corridors. However, two agencies are in the process of using travel time data for arterial condition information Most agencies expressed their satisfaction with their applications although some sorts of enhancements are being planned. These included iphone applications, change of base map, additional data collection, etc. 19
36 Denver Regional Integrated Traveler Information Display Map Criteria Data Collection Technologies Data Collection Device Placement Table 1: Arterial Conditions Application Matrix Agency/Source Denver Douglas County Fort Collins Bellevue Seattle Los Angeles Tallahassee Video, Wavetronix, Canoga Loops and toll tags Back of the normal queue Toll tag, Bluetooth Areas where major travel patterns and queues Video and Pucks form signal Loop detection 140 /300 from intersection Traffic.com, System Detection Unknown Information not available Information not available 0.25 to 1.0 Mile Every 1- Data Collection segment and 2 One device per Information 2 devices per segment mile/one device Every Signal Device Density devices per segment not available per segment segment Data Parameters Speed and Travel Time, speed and Volume and Considered occupancy occupancy occupancy Occupancy Occupancy Speed Speed Refresh Rate 120 Seconds 120 seconds 300 Seconds 120 Seconds 120 seconds 60 Seconds Color Coding Dark Green N/A N/A N/A N/A N/A N/A Green/Light Green Moving Well Moving Well Low Light Light 20+MPH Yellow Slowing Slowing Moderate Moderate Red Heavy Traffic Heavy Traffic High Heavy Used but not described Used but not described Blue N/A N/A N/A Closed N/A N/A Information not available Information not available Information not available % of Speed limit 61-80% of Speed limit MPH Disabled 0-10 MPH Gray No Data No Data Unavailable No Data N/A No Data N/A Black Very Congested Very Congested N/A Severe Heavy N/A N/A White N/A N/A N/A N/A No Data No Data N/A Pink N/A N/A N/A N/A N/A N/A 1-20% of Speed limit 41-60% of Speed limit 21-40% of Speed limit Pale Green N/A N/A N/A N/A N/A N/A Disabled Base Map Google Google GIS GIS Bing/GIS GIS No 20
37 Denver Regional Integrated Traveler Information Display Map Criteria Arterial Types Information Provided Agency/Source Denver Douglas County Fort Collins Bellevue Seattle Los Angeles Tallahassee Information Major arterial close to Interstates Cotrip Major arterial close to Interstates Cotrip/VMS Every major corridor Website - Disabled service Every major corridor Agency Website Select major corridor Agency Website Every major corridor Agency Website Every major corridor Agency Website Additional Information Construction No No Yes-Manually No No No No Incidents No No Yes- Manually No No No No Road Closures No No Yes No No No No Camera Image No No Yes Yes Yes No No Video Streaming No No No No No No No 21

38 Denver Regional Integrated Traveler Information Display Map 2.4 Private ISPs and Vendors INRIX INRIX provides Interstates and major arterial traffic conditions through an application for cell phone users. For operating agencies, it can provide processed data or color coded map of the geographical area. INRIX collects its data from in-vehicle navigation systems, cell phones, probe vehicles, traffic cameras and road sensors. INRIX uses Google Maps to show travel conditions using color coding with four different colors to represent SLOW to FAST as shown in Figure 12. INRIX can customize the color codes for agencies. Figure 12: INRIX Traffic Application Map The INRIX application includes the capability to provide travel time information for user specified origins and destinations. It also provides construction, lane closures, events and incident information, as well as allowing users to report incident/event information. INRIX provides forecast traffic conditions based on historical data and allows users to select their time of travel and provides updates with any incidents or delays. Typically data is updated every two minutes. 22
, etc. INRIX provides the traveler information for New Mexico DOT on the state developed map.")
39 Denver Regional Integrated Traveler Information Display Map Around 750 operating agencies use the travel time data from INRIX which includes Alabama DOT, New Mexico DOT, Virginia DOR, Texas DOT, Texas Transportation Institute, Atlanta Regional Council (MPO), etc. INRIX provides the traveler information for New Mexico DOT on the state developed map. Figure 13 shows the travel conditions for New Mexico. Figure 13: New Mexico State Travel Conditions Map Google Google provides Interstate and major arterial traffic conditions information through the Google Maps web based application and cell phone applications. Google uses data from cell phones and navigation systems. Unlike the web based application, the Google cell phone application does not provide construction and lane closures information at this time. The web based and cell phone applications do not provide incident or event information at this time. Both use color coding to represent travel conditions with four different colors from SLOW to FAST. The Google web application provides travel time information for user specified origins and destinations. They provide forecast traffic conditions based on historical data and allow users to select day and time of travel. It is not clear how much time is elapsed between collection of data 23

40 Denver Regional Integrated Traveler Information Display Map from various sources, processed and posted on website or cell phone. Figure 14 shows the Google Traffic web based application. Figure 14: Google Travel Conditions Map Bing Bing provides Interstates and arterial travel condition information through a web based application. They use data from cell phones and navigation systems, and do not provide any incident or event information. It uses color coding with four different colors to represent congestion from SLOW to FAST as shown in Figure 15. Bing provides travel time information for user specified origins and destinations. 24


41 Denver Regional Integrated Traveler Information Display Map Figure 14: Bing Travel Conditions Map Trafficcast TrafficCast uses Bluetooth detection devices to provide travel condition information on Interstatess and arterials. TrafficCast Bluetooth devices can collect speeds, travel times, etc. DynaFlow is the application developed by TrafficCast to process the data collected from the Bluetooth devices and to represent the travel condition on the map. Dynaflow uses Bing maps to display the information, and uses color coding with three different colors to represent congestion from CONGESTED to FAST conditions as shown in Figure 16. DynaFlow also provides incident information and uses color coding based on the impact of the incident. Figure 16: Trafficcast Travel Conditions Map Operating agencies can use the vendor software to process and display the information. Alternatively, the processed data can be provided via XML feed for agencies. 25
42 Denver Regional Integrated Traveler Information Display Map NAVTEQ NAVTEQ provides Interstates and arterial traffic conditions information through a web based application. Data comes from their own system detectors, some public agencies system detectors, cell phones and navigation systems. NAVTEQ uses color coding to represent travel conditions with three different colors as shown in Figure 17. NAVTEQ provides travel time information on Interstates and for user specified origins and destinations on arterials. The application provides two maps, Area Traffic Maps and User Traffic Maps. Area Maps show traffic conditions for the entire area, while User Maps show the user s route choices. Users can set up an account and identify specific route to receive information and notifications. Traffic.com will send alerts through , phone or text in case of incidents/lane closures/events, and also provides alternate route information to registered users. 26

43 Denver Regional Integrated Traveler Information Display Map Figure 17: NAVTEQ Travel Conditions Map 2.5 Recommended Best Practice Approaches Based on the information presented, this Section discusses specific areas that apply to arterial travel conditions implementations that should be considered by the implementing agency, and provide a recommended best practice approach. These best practices will be applied in the development of guidelines Arterial Travel Condition Information Typically, for most state and regional (MPO s) agencies the primary focus was, and continues to be, to provide real-time traveler information for Interstates. Obviously, the local agencies focus is more on the arterials. Until recently, the technology and technical know-how for providing arterial condition information was at a very nascent stage of development. Given the current state of the existing and developing applications, it is clear that more and more agencies are striving to provide arterial travel condition information. It is also clear that most of the applications are at a stage where they can no longer be considered test beds or emerging technology projects. Most users and operators report positive feedback regarding their experience with arterial conditions applications. In the near future, with advancement of mobile 27
44 Denver Regional Integrated Traveler Information Display Map applications and technology, it is anticipated that there will be more demand for such applications. Best Practice: Agencies interested in implementing arterial conditions applications should consider the following: Consider implementation from a traveler s (Regional) perspective Work and partner with stakeholders in the Region Involve and evaluate existing applications by users if possible Identify coverage area, information to provide and communications with devices/infrastructure Determine cost including deployment, operations and maintenance Planning and Coordination Typically, the arterial conditions applications are being driven by the local City or County. These agencies invest significant resources in planning, implementing and customizing the application for their needs. However, the lack of planning and coordination at the Regional and State DOT level many times leads to issues including the following: Lack of consistency in how the information is displayed to the users. This could be from differences in color coding or terminology related to arterial travel conditions, to fundamental differences in the basis for calculating arterial travel conditions, i.e., use of occupancy, speed, travel time, etc. Backward integration at a regional level becomes difficult. The user should not be required to look at several sources of information. It is essential that the information, regardless of jurisdictional boundaries, be available at one location There is a risk that without a concerted and coordinated effort, only certain segments of a corridor could get implemented. This problem could be magnified if the corridor crosses multiple agencies. There might be gaps in information which could alienate the user. 28
45 Denver Regional Integrated Traveler Information Display Map Initially, these applications require significant resources to calibrate the application. Also, once the application is calibrated, the system is heavily dependent on detection, i.e., adequate resources need to be devoted to make sure the equipment is operational. Best Practice: Regional and/or state agencies to consider taking on an oversight role to ensure consistency, standardization of any arterial travel condition applications within their jurisdiction. The specifics of what needs to be consistent and standardized should be discussed at a regional and/or state level Determining Coverage Area for Arterial Travel Condition Implementation Most arterial travel condition applications are either corridor specific or the complete arterial network. In general, most corridors were selected by operating agencies based on factors such as proximity to Interstates, perceived demand and existing instrumentation. With implementation across a network, it is important to ensure there are sufficient resources available for data collection, communications, infrastructure, calibration and maintenance. There is also possibility of information overload for the user; including zooming in, or the network being broken into zones for clarity. Best Practice: With implementation on a corridor level, there should be priority scheme for implementation. As users notice and take advantage of the implementation, their expectations for more coverage may increase. Local agencies should consider coordination with other operating agencies if the corridor crosses multiple jurisdictions. Arterials that are close to Interstates or parallel to Interstates are better candidates for implementation as they assist users in making travel decisions Travel Condition parameters Most of the arterial condition applications use Point data. There are a couple of applications in the development stage that will be using Point-to-Point information. Point data is collected at one location and the data that is collected is representative of that location. Point-to-Point 29
46 Denver Regional Integrated Traveler Information Display Map data is collected between two locations and the data that is collected is representative of what occurs between the two locations. Most of the devices that can collect point data are capable of collecting Volume, Occupancy and Speed. Speed and/or Occupancy are data parameters that are more prevalent. Occupancy appears to be most reliable of the measures whereas volume is the least reliable. Devices such as Toll tag readers, license plate readers and Bluetooth readers can collect point to point data and are capable of collecting travel time. Best Practice: Use point-to-point data for arterial travel conditions and use point data for validation and supplement the information Travel Condition Data Collection Technologies There are several reliable data collection technology options for collecting point data including loops, radars, video detection, dopplers, etc. Typically, local agencies have a comfort level for a particular type of technology. The use of different technologies for evaluation can be sound practice. However, for large scale implementations, it might be cumbersome for maintenance staff to be responsible for several types of detection technologies. There are a few data collection technology options for collecting point to point data including Toll tag readers, license plate readers and Bluetooth readers. These options have proven reliable for Interstates travel condition application. The reliability of such technologies for arterials is not proven. Best Practice: For Point data, the type of technology used does not matter. However, for large scale implementation, it is better to use one type of technology as it is easier for maintenance. For Point-to-Point data, toll tag readers and Bluetooth readers appear as a likely choice Travel Condition Data Process Typical data process includes data being collected in the field, sent to server (dedicated for the device or to the signal system); data is extracted and/or processed and lastly posted to 30
47 Denver Regional Integrated Traveler Information Display Map dissemination tool such as website. The process builds in a latency issue i.e., there is time delay between the time data is collected to when it is posted. Several factors such as number and location of data sources, extraction methods-frequency and process, etc can impact latency. Typically, a latency of 2-6 minutes is common. The latency on the private sector applications is not clear. Best Practice: Data collection devices that directly provide information to a server that allows for quicker processing tend to provide more reliable information Travel Condition Data Validation Most applications should have built-in validation processes and these can include use of additional source for data collection. In addition, staff validating the data either in the field or observing the application against normal conditions and using available camera coverage to check travel conditions. For private sector applications, it is not clear what validation techniques are used. Best Practice: Using cameras (wherever available) and staff resources to assist in calibration and validation leads to better results Travel Condition Information Dissemination Most applications are web based and some also provide mobile applications and traveler information phone systems. Travel conditions can also be provided through VMS signs. A couple of agencies are considering providing arterial travel time information on VMS. None of the agencies are using 511 systems to provide arterial condition information. Some agencies reported using general demographic information in selecting a medium for distributing information. Web and mobile applications for providing arterial conditions have become the most common medium for public/private agencies applications. They can include live streaming video or pictures of traffic flow, incidents, events and construction information. Most of the private agencies provide their arterial traffic conditions to their users as a web application and a cell 31
48 Denver Regional Integrated Traveler Information Display Map phone application. Cell phone applications can send the information to the users faster and the travelers who are already in the traffic can also access the information and make routing decisions. VMS signs can be used to provide the arterial conditions, incidents and construction information. VMS signs can be connected to detection systems and can provide travel times along the arterial corridors. Douglas County is the only agency that provides arterial travel time and congestion levels on the VMS. Best Practice: Web and mobile applications are a better way to provide information for users. VMS should be used selectively to supplement web and mobile applications Users of the Arterial Condition Information Most of the applications are typically geared towards local travelling public, especially commuters. Several agencies use the application to monitor their arterials. It does not appear the media (TV and Radio) is using the information other than to report events i.e., incidents, lane closures, etc. Also, it does not appear that other internal staff particularly Public Information office is using the information. This is understandable since media and public information office typically focus on exceptions to normal operations i.e., incidents, events, lane closures, signal malfunctions, etc. However, most agencies are providing this information. There are also differences in how these exceptions are depicted on the map i.e., no consistency, etc. Best Practice: Agencies should also focus to provide incident, events, lane closures, etc, information to its users Technical Development of Application Quality and Reliability of arterial travel condition information is dependent on several key factors such as Placement of the data collection devices Regardless of point or point-to-point data, the placement of the devices is absolutely critical. Key considerations are normal queue 32
49 Denver Regional Integrated Traveler Information Display Map lengths, lane utilization and change of travel patterns. Sometimes the focus appears to be on the availability of power and communications. Density of the data collectors segment size, spacing of the detectors is also critical. Key considerations are lane utilization and change of travel patterns Proper calibration The success of the application is dependent on calibration of each individual corridor based on the field data and adjusting the thresholds to accurately reflect specific corridor conditions. Proper maintenance The applications are very dependent on proper working of data collection devices. Best Practice: Proper consideration of the factors and the resources to support calibration and maintenance leads to better results Base Map Most website and cell phone applications are using Google or GIS maps. As more travel condition applications are implemented across larger geographical areas, it is important to make easier for the user to quickly access the information. On some applications it is hard to distinguish Interstates and arterials. This may lead users who are not familiar with the area to make improper travel decisions Best Practice: Regardless of the type of base map, it important to have the following features Ability to zoom in/out Ability to differentiate Interstates and arterials Archiving Data Most applications are archiving the data. However, it is not clear how the data is used, the frequency it is used or for what purpose. Private sector applications seem to be doing a better job of using the data for forecasting. Best Practice: Archived data can be useful in understanding traffic patterns and forecasting normal operations 33
50 Denver Regional Integrated Traveler Information Display Map Use of Private Entities Most applications use data collected within the agency. Only agency is using private entity. There appears to be lot of uncertainty and concern primarily related to data usage, restrictions, accountability, contracts, etc. However, some of the private sector applications have enormous access to mobile data (cell phone, blue tooth, fleet probe vehicle, in-vehicle navigation systems, etc). The mobile the data sources are expected to increase substantially in the next few years. Best Practice: Private sector entities can be significant resource in implementing the applications. At the least, agencies should consider the innovation techniques being pursued by private sector Color Coding and Legend Most agency applications use 4 to 8 colors to represent traffic conditions on arterials. All most all private sector applications use 4 colors to represent traffic conditions. The legend to describe the traffic conditions is more varied on agency applications. Private sector applications use one word to describe the condition. Best Practice: It is important that agencies within a geographical area to subscribe to one color coding and legend scheme. 34
51 Denver Regional Integrated Traveler Information Display Map 3. Guidelines for the Denver Region The purpose of this section is to clearly define a consistent approach for displaying arterial travel condition information across the Denver Region. The approach reflects input from stakeholders at project workshops and what they determined to be best suited for the Denver Region. The following describes how Sections 3 and 4 are organized. Section addresses who will use the arterial travel condition information. Section addresses on which roadways the arterial travel condition information should be provided. Section identifies how operators need to work together to implement the guidelines. Section provides guidelines for each travel condition data parameter as follows: Type of device for data collection Placement of the devices Data collection, processing and display Time intervals Measures of Effectiveness (MOE) Usefulness to the operators and others Others that apply Sections provide guidelines regarding the following regional level issues: Data quality Data dissemination Base map Archiving Alarms Performance measures report card Typical scenario for operator Reporting 35
52 Denver Regional Integrated Traveler Information Display Map Section 4 discusses the implications of guidelines on the existing field infrastructure, systems and practices. It also identifies the next steps. 3.1 Use of Arterial Travel Condition Information The primary reason for collecting arterial condition information is so operators are able to better manage the transportation network. There are several inadequacies that hinder the operators ability to monitor the roadway network and better utilize the network capacity including: Data is only collected on as-needed basis generally during peak periods. Data is not real-time. Operational problems go undetected and unresolved. There is not enough data for incidents, weather, construction and maintenance activities for operators to develop mitigation strategies. If local agencies do not collect arterial condition information traffic conditions on the roadway network will worsen and resources may not be used properly. There are two other groups in addition to the operators that would benefit from arterial travel condition information: the traveling public and other public agencies and departments. In 2000, Washington DOT conducted a web based survey for travelers seeking their opinions on arterial traffic condition measures. The following measures rated from highest to lowest benefit: Locations of possible incidents Level of congestion Speed of traffic and travel time Camera snapshots and live video of the roadway By providing the travelling public information they are able to make informed decisions regarding their travel choices and options. Other public agencies and departments including planning, research, TDM, transit, emergency and public safety, parks, GIS etc. are often not typically aware of the arterial travel condition 36
53 Denver Regional Integrated Traveler Information Display Map information both from a real-time and historical perspective. Arterial travel condition information can be very useful as it relates to their work activities and projects. 3.2 Geographical Coverage for Arterial Travel Conditions As the Denver Region determines which highways will be implemented with the real-time travel time application, it must now apply provisions from a recently adopted FHWA Rule regarding real-time system management information. In essence, FHWA Rule Title 23 Part 511 Subpart C- Federal Register Volume 75, Number 215, pages , effective December 23, 2010 states the following: Interstate Highways within Metropolitan Statistical Area (MSA) must report traffic and travel conditions (Construction & maintenance, Roadway or lane blocking, Roadway weather observations and travel time or speed information) by November 8, Interstate Highways outside of MSA must report traffic and travel conditions (Construction & maintenance, Roadway or lane blocking and Roadway weather observations) by November 8, No travel time or speed information is required for Interstate highways outside of MSA. Routes of Significance within MSA must report traffic and travel conditions (Construction & maintenance, Roadway or lane blocking, Roadway weather observations and travel time or speed information) by November 8, Routes of significance are defined as non-interstate roadways in the MSA that are designated by the State as meriting collection and provision of information related to traffic and travel conditions. Within Colorado, the Denver-Aurora-Broomfield MSA is identified and consists of the following ten counties: Denver, Arapahoe, Jefferson, Adams, Douglas, Broomfield, Elbert, Park, Clear Creek and Gilpin. Although Boulder County is not included within the MSA, CDOT has determined that Boulder County will be included within this area for real-time purposes. Table 2 provides a summary of the FHWA rule including the data quality parameters prescribed in the rule. In March 2012 CDOT anticipates to begin the process to designate the Routes of 37
54 Denver Regional Integrated Traveler Information Display Map Significance in the Denver Region in collaboration with regional stakeholders. CDOT will also prioritize the routes and develop capital operational and maintenance costs associated with implementation for the Routes of Significance.. 38
55 Denver Regional Integrated Traveler Information Display Map Table 2: FHWA Rule on Real Time Traveler Information Systems Interstate highways outside Metropolitan Statistical Area Interstate highways within Metropolitan Statistical Area Metropolitan Statistical Area roadways Routes of Significance 1 Implementation Date November 8, 2014 November 8, 2014 November 8, 2016 Traffic and Travel Conditions Construction & maintenance activities Roadway or lane blocking Roadway weather observations Reported within 20 minutes or less from the time of the closure or reopening of roadway 2. Reported within 20 minutes or less from the time the incident is verified. Reported about hazardous driving conditions and roadway or lane closures or blockages because of adverse weather conditions within 20 minutes from the time hazardous conditions, blockage or closure is observed. Reported within 10 minutes or less from the time of the closure or reopening of roadway 2. Reported within 10 minutes or less from the time the incident is verified. Reported about hazardous driving conditions and roadway or lane closures or blockages because of adverse weather conditions within 20 minutes from the time hazardous conditions, blockage or closure is observed. Travel time or speed information Not required Reported on limited access roadways that experience recurring congestion within 10 minutes from the time that the travel time or speed calculation is completed. Data Quality Parameters 3 Reported within 10 minutes or less from the time of the closure or reopening of roadway 2. Reported within 10 minutes or less from the time the incident is verified. Reported about hazardous driving conditions and roadway or lane closures or blockages because of adverse weather conditions within 20 minutes from the time hazardous conditions, blockage or closure is observed. Reported on limited access roadways that experience recurring congestion within 10 minutes from the time that the travel time or speed calculation is completed. Accuracy Shall be 85% accurate at a minimum, or have a maximum error rate of 15%. Availability Shall be 90% available at a minimum. Shall be 85% accurate at a minimum, or have a maximum error rate of 15%. Shall be 90% available at a minimum. Shall be 85% accurate at a minimum, or have a maximum error rate of 15%. Shall be 90% available at a minimum. Timeliness Values must be provided at the time Values must be provided at the time Values must be provided at the time required required or specified. required or specified. or specified. Regional ITS Architecture 4 Evaluate Architecture to determine Evaluate Architecture to determine Evaluate Architecture to determine whether 39
56 Denver Regional Integrated Traveler Information Display Map Interstate highways outside Metropolitan Statistical Area Interstate highways within Metropolitan Statistical Area Metropolitan Statistical Area roadways Routes of Significance 1 whether Architecture explicitly addresses real-time highway and transit information needs and methods to meet such needs. Traffic and travel conditions monitoring needs for all Interstate system highways hall be considered. If necessary, Architecture shall be updated and shall feature the components and functionality of the real-time information program. whether Architecture explicitly addresses real-time highway and transit information needs and methods to meet such needs. Traffic and travel conditions monitoring needs for all Interstate system highways hall be considered. If necessary, Architecture shall be updated and shall feature the components and functionality of the real-time information program. Architecture explicitly addresses real-time highway and transit information needs and methods to meet such needs. Traffic and travel conditions monitoring needs for all Interstate system highways hall be considered. If necessary, Architecture shall be updated and shall feature the components and functionality of the real-time information program. 1 The MSA is identified as the Denver-Aurora- Broomfield, and consists of the following ten counties: Denver, Arapahoe, Jefferson, Adams, Douglas, Broomfield, Elbert, Park, Clear Creek and Gilpin. Routes of significance are defined as non-interstate roadways in the MSA that are designated by the State as meriting collection and provision of information related to traffic and travel conditions. Factors to be considered include: crash rates, environmental events, evacuation/diversion routes, severity and frequency of congestion, and economic activity. All public roadways including arterials, toll facilities and other facilities that apply end user pricing mechanism shall be considered when designating routes of significance. In identifying these routes, States shall apply collaborative practices and procedures. 2 Short term or intermittent lane closures of limited duration that are less than the required reporting times are not included as a minimum requirement. 3 State shall develop the methods by which data quality can be ensured. The criteria for defining the validity of traffic and travel conditions made from real-time informant programs shall be established by the State in collaboration with their partners for establishing the programs. State shall receive FHWA concurrence that the selected methods provide reasonable checks of the quality of the information made available by the real-time information program. In requesting FHWA s concurrence, the State shall demonstrate to FHWA how the selected methods gauge the accuracy and availability of the real-time information and the remedial actions if the information quality falls below the levels described. 4 Although no date is provided as to when the Regional ITS Architecture must be updated, if applicable, it is assumed that is it the implementation date. Although the Rule only identifies that traffic and travel conditions shall be considered for all Interstate highways, it is logical to assume that the update would also include MSA Routes of Significance, if applicable. 40
57 Denver Regional Integrated Traveler Information Display Map 3.3 Planning and Coordination To implement the guidelines there needs to be a clear understanding of the agency roles and responsibilities. The implications of these guidelines are discussed later in the report (Section 4.1). These implications can have significant impact on agency resources. This section provides a high-level overview of the roles and responsibilities of Operators, DRCOG and CDOT ITS Branch with the recognition that these roles and responsibilities may change and/or need to defined in greater detail at a later time. Roles & responsibilities of the Operator Implement in accordance with the guidelines (regardless of funding source) Complete the System Engineering Analysis (SEA) if federal funds are used for implementation. If no federal funds are used for implementation, SEA is strongly encouraged, although not required. Maintain field devices Validate field data (configuration, adjustment of thresholds, etc, determine needs and ensure the travel condition information is being reflected accurately) Demonstrate to CDOT that the arterial travel condition information meets the guidelines defined in this document Roles & responsibilities of DRCOG Coordinate with operators to promote guidelines and assist with implementation Review SEA documentation provided by Operators for implementations that use federal funds administered by DRCOG. Roles & responsibilities of CDOT ITS Branch Maintain COTRIP website and add arterial travel condition information as arterials are implemented provided that the operator demonstrates that the guidelines are being met Maintain the CTMS application and the device drivers that CDOT has developed 41
58 Denver Regional Integrated Traveler Information Display Map Maintain CCTM Support reporting functions through COGNOS Provide SEA technical assistance and support to Operators for implementations on State Highways The Guidelines document should be periodically updated by CDOT and the stakeholders in the Denver Region. Given the changes in technology and increased deployment in the near term, it is recommended that the guidelines are updated once a year. 3.4 Travel Condition Data Parameters The stakeholders in the Denver Region identified and agreed upon the following travel condition data parameters, which are listed in priority order. Travel time Traffic incident information Weather related road condition information Construction and maintenance operations information Traffic video (image and full motion) Event information and parking information for events Speed Queues Volume Occupancy Appendix A shows the travel condition parameters with the associated implementation factors and the Regional priority ranking for each travel condition data parameter. 42
59 3.4.1 Travel Time In the Denver Region travel time is the highest ranked travel condition data parameter used by operators to manage their transportation network Travel Time Measurement Point devices measure speed at a particular point on the designated segment. Point devices also can be used to estimate the travel time; however data quality and reliability are less than optimal. Point-to-Point devices are able to measure or calculate the travel times based on when the vehicles are entering and leaving the designated segment. Guideline(s) Point-to-Point devices should only be used to collect travel time. Point devices should not be used to determine the travel times. However, Point devices can be used to validate travel speeds along the segment if deemed necessary by the operator Segment Definition Private ISPs use Traffic Messaging Channel (TMC) location codes to identify the segments by direction. TMC location codes are applicable to both Interstate Highways and arterials. TMC segmentation is an unofficial standard that has been adopted by mapping companies and private ISPs. Mapping companies make updates to TMC location codes only once a year. Arterial TMC segmentation is not fully developed and there are arterial segments that have one TMC code for both directions. TMC segment length varies depending on the area, i.e., urban or rural. In urban areas, TMC segment length on Interstate Highways is from on-ramp to on-ramp while on arterials it is from 43
60 major intersection to major intersection. For rural areas the segment length is usually between towns. Example of TMC Segmentation on Interstate Highways and Arterials Interstate Highways On I-25 between University Boulevard and Colorado Boulevard the TMC code is 116P04173 in the northbound direction and 116N04172 in the southbound direction. The first digit in the code represents country, the next two digits represent state, P (North or West) and N (South or East) represent directions and the last five digits identify the location ID. Arterials On University Boulevard from Evans Avenue to Buchtel Boulevard there is one TMC code for both directions 116N CDOT and other local operators do not use TMC segmentation in the Denver Region for Interstate Highways or arterials. For the arterials, the current segmentation is based on the following: Major intersections Major decision points of travel Major changes in traffic patterns, i.e., heavy turning traffic In general, TMC segmentation from major intersection to major intersection is fundamentally sound. However, there needs to be more clarity on what constitutes a major intersection in the Denver Region. DRCOG 2035 Regional Transportation Plan identifies major regional and principal arterials within the Denver Region as shown in Figure 18. Using the DRCOG major regional and principal arterials as a basis, a major intersection can be defined as follows: Signalized intersection of two major regional arterials Signalized intersection of major regional arterial and a principal arterial Signalized intersection of two principal arterials Signalized or unsignalized Interstate on and off ramps along the arterial 44

61 Figure 18: Major Regional and Principal Arterials within the Denver Region 45
62 Additionally, segmentation can be challenging if jurisdictional boundaries exists on a segment between two major intersections as it may require instrumentation in the adjoining jurisdiction. Guideline(s) Segment is defined from one major intersection to another major intersection. Figure 18 provides an example of the potential segments on a corridor. However, operators should also exercise engineering judgment based on travel patterns and current operational characteristics in defining the segments. If there is no major change in traffic patterns between two major intersections, the Operator can extend the segment to the next major intersection. If there is a major change in traffic patterns between two major intersections, the Operator can shorten the segment in order to capture the change in travel patterns. If a jurisdictional boundary exists between two major intersections and one agency does not have the interest or resources to operate and maintain the P2P device in their jurisdiction, the segment should end at the nearest signal prior to entering the adjoining jurisdictional boundary Sample Size Regardless of the technology used to collect travel time, the number of good matching samples is critical. In the Denver Region, a sample size of at least three good matching samples every two minutes is considered valid for reporting. This is based on CDOT s travel time algorithm and experience with Interstate Highways using toll tag technology. However, there is no study or documentation that identifies what constitutes the optimum sample size. In Houston, average sample size of 16 every 15 minutes is being used to report arterial condition data. CDOT uses a standard reporting cycle of two minutes for travel time. A good matching sample is defined as within the acceptable deviation from a typical travel time and comparable to the range of travel times with other samples during the same period. 46
63 It should be noted, there is a concern that the sample size that is being used at present in the Denver Region for both Interstate Highways and arterials may not be adequate for arterials due to the differences in operational characteristics and increased accessibility. Regardless of the type of technology, or use of data from private ISPs, there may be certain times of the day where it is not possible to obtain three good matching samples every two minutes. This could possibly happen during late nights or when there are low numbers of vehicles on the segment. Currently, in the Denver Region, if the good matching sample number drops below three for a two-minute period, no data is reported on the segment for three cycles or six minutes. Guideline(s) A sample size of at least three good matching samples every two minutes is recommended for the Denver Region regardless of technology or the use of private ISP vendors. However, if it is determined during the validation process that the current sample size of three good matching samples is not adequate, the Denver Region should consider reevaluating the matching sample size for every two minutes. The samples collected should be recent and within the last 12 consecutive months prior to implementation. If the number of good matching samples falls below three for a two-minute period, the segment should not report any data and the color display for the segment should be gray until the number of good matching samples reaches at least three for a two-minute period Placement of the Devices to Measure Travel Time The placement of the devices along a segment will impact the ability to meet the data accuracy requirements. Appendix B provides the considerations for placement of devices measuring travel time. 47
64 Guideline(s) P2P devices should be placed at the far-side of the intersection from the signal pole to within 100 feet of the traffic signal. This will allow easy access to power and communications to the device. If any P2P device is installed on the mast arm of a signal, it should be placed on the back side of the mast arm to avoid visual clutter and interference with signal heads. Operators should use engineering judgment to determine proper placement of the device. P2P device placement at mid-block and near-side of the intersection is not recommended Density of the Devices Density is the number of devices used to measure the travel time in one single segment. It should be noted that the type of technology used and placement of devices can have an impact on the number of devices. Typically, one device per direction at each end of the segment should be enough to capture accurate travel time provided there are three good matching samples every two minutes. Guideline(s) At least two P2P devices should be used for each segment in each direction. It is possible, depending on the placement of the device and technology; one device may cover both directions. If there are not enough matching samples in the segment, the operator should consider. Shortening the size of the segment Use a different technology Data Collection Timeliness Within the Denver Region, data are collected from CDOT or the operator owned field device by CTMS every two minutes or less. FHWA Rule (Section 3.2, Table 2) states that travel time should be reported within ten minutes or sooner from the time the travel time calculation is completed. At present, the Denver Region reports travel time on the CoTrip website within two 48
65 minutes or less from the time it is calculated. Figure 19 shows the travel time data flow and its potential time intervals. Figure 19: Travel Time Data Flow and Potential Time Interval Guideline(s) Regardless of which agency is processing the data, i.e., CTMS or the vendor software, data from the field device should be collected every two minutes or less. Travel time information should continue to be reported within two minutes or less after processing regardless of the type of technology or if the data are being processed by CTMS or the vendor software Travel Time Data Processing Depending on the type of technology used for travel time data collection, there are two primary ways to process the data. They are: 49
66 Within the Denver Region, the CTMS software application has been used for generating arterial travel condition information. CTMS has a toll tag software driver for toll tag technology that is being used in the Region to collect travel time information. Device vendors have proprietary software and algorithms that can process the data and provide output via XML feed to allow CTMS to post the information on CoTrip. Regardless of how the data is processed, data must flow through CTMS in order to be posted on the CoTrip website. Guideline(s) The Denver Region should continue using the CTMS application for travel time processing with regard to toll tag technology. If new P2P technologies are considered on arterials, software drivers should be written by the agency implementing the technology. If private ISPs or vendors are used, processed travel time data in a XML feed every two minutes must be provided to CTMS in order to post the information on CoTrip Travel Time Index (TTI) Processing Travel Time Index is the ratio of peak period travel time to free-flow travel time. TTI= Travel Time in minutes / Free-Flow Travel Time in minutes Example of TTI Calculation If the free-flow travel time is 15 minutes for a segment and the actual travel time during a two minute interval in the AM peak period is 18 minutes, then the TTI is 1.2 (18/15). This means that the actual travel time is 20% greater than the free-flow travel time. Free-flow travel time can be obtained using one of the following three methods Use distance and the posted speed limit to calculate the free-flow travel time. Conduct travel runs during the off-peak period (11AM-1PM). Conduct travel runs during the late-night period (10PM-5AM). 50
67 Texas Transportation Institute uses late-night period (10PM-5AM) to determine free-flow travel time. In the CDOT DTD Statewide Travel Time and Analysis Project, the free-flow travel time was based on the off-peak period (11AM-1PM). Guideline(s) It is recommended that free-flow travel time obtained by conducting travel runs during late-night period (10PM-5AM), which will be consistent with Texas Transportation Institute s measurement of free-flow travel time. Also, this will be consistent with other mobility measures Texas Transportation Institute publishes annually for major cities. It is recommended that at least six travel delay studies be conducted for each direction. There should not be any travel time studies conducted during construction, bad weather or any other conditions that impact free-flow travel Planning Time Index (PTI) Processing The PTI is the ratio of the near-worst case travel time to a travel time in free-flow traffic conditions. PTI can be based on a percentile for the reporting period. There is no specific guidance in traffic engineering studies or manuals regarding which percentile should be used to calculate PTI. Texas Transportation Institute computed PTI using 95th percentile travel time divided by the free-flow travel time. The free-flow travel time used in the calculation of TTI will be useful in calculating the PTI. PTI = 95 th percentile travel time in minutes / free-flow travel time in minutes. Example of PTI Calculation If the 95 th percentile travel time on a corridor in the identified reporting period is 24 minutes and free-flow travel time is 15 minutes. PTI for this corridor is 24/15=
68 Guideline(s) The 95 th percentile travel time should be used for PTI calculation in the Denver Region, which will be consistent with the Texas Transportation Institute Real-Time Travel Time Algorithm and Graphical Display Output Using CTMS, CDOT provides travel time information on a color coded map on the CoTrip website for both Interstate Highways and arterials. The color codes for Interstate Highways and arterials are similar. However, Interstate Highway color codes are based on speeds, while the color codes for arterials are based on a combination of occupancy and speed. Depending on the arterial segment, a different weightage can be applied to speed and occupancy parameters based on operational characteristics, location, etc. For the recent travel time implementation in Douglas County on Quebec Street and Lincoln Avenue corridors, P2P devices were used. Subsequently, the color codes focused primarily on speed obtained from travel time since no occupancy data were available. As shown in Table 3, the column Existing Legend appears to be a mix of how traffic is flowing or level of congestion as it relates to the arterial color. Table 3: Arterial Color Codes and Existing Legend Color Green Yellow Red Black Gray Existing Legend Moving Well Slowing Heavy Traffic Very Congested No Data The color codes can be based on travel time or speed, TTI (Section ) or PTI (Section ). Travel time by itself does not lend well for color coding purposes. For example, a 52
69 travel time of 10 minutes does not indicate much about traffic conditions or congestion. Travel time needs to be compared against another condition for it to be more meaningful. Using color codes based on speeds may not be useful. In the Denver Region, speed limits on arterials vary from 30mph to 55mph. A speed of 20mph on a corridor with a speed limit of 35mph may indicate a different level of congestion than on a corridor with a speed limit of 55mph. PTI only considers the 95 th percentile travel time instead of current conditions, and therefore is more of a planning measure. TTI compares current travel time to free-flow travel time. TTI provides a more accurate and representative indication of the congestion condition on a corridor regardless of the speed limit. Analysis of three years data collected for the CDOT DTD Statewide Travel Time and Analysis Project for more than 70 corridors provided a basis for establishing the TTI ranges associated with the arterial color codes. The project provided TTI for morning and evening peak periods by direction. Guideline(s) The Denver Region should follow the same color codes that currently exist on CoTrip for arterial conditions. However, the color codes for the segment should be based on TTI. Table 4 shows the recommended TTI ranges for each existing color code. In addition, the legend associated with the each of the colors should be changed to reflect a level of congestion. The recommended legend is also included in Table 4. Table 4: Color Coding Thresholds and Legends Color Code TTI Value Roadway Congestion Legend Green <1.2 Light or No Congestion Yellow Moderate Congestion Red Heavy Congestion Black >1.81 Severe Congestion Gray No data No data Real-Time Travel Time Tabular Display Presently on the CoTrip website, arterial condition information can be viewed in a tabular format that includes the following: 53

70 Arterial and Direction Segment (From & To) Travel condition legend and the associated color Current travel time When the segment is selected, a pop-up window for the segment which is shown in Figure 20 displays the following: Current speed Travel condition legend and the associated color Current travel time Normal travel time Volume Occupancy Segment Length Figure 20: Tabular Display of Arterial Corridor information on CoTrip As more arterials and more segments are added to the CoTrip website, the tabular display may become too cumbersome to use. It is not clear how the travelling public or private ISPs use this information. If the tabular display allowed for rubber banding a group of segments to get an aggregated origin/destination travel time, it might be beneficial. 54
71 Guideline(s) Tabular display for arterial conditions should be made available only for the operators on the CCTM. Also, operators should have the capability to select a segment, which would pop up a window that displays the following information: Current travel time Current travel speed Current Travel Time Index and associated color codes Free flow travel time Segment limits (From/To) Segment length In addition, operators should have the ability to rubber band a group of segments to obtain an aggregate origin and destination current travel times Travel Time Calculation and Validation In general, the validation process for travel time is dependent on the operator and availability of agency resources. The validation process typically begins after the segments are instrumented with the devices. Guideline(s) The validation process should begin from the conceptual stage to design through implementation and continue with periodic monitoring. During the conceptual stage, the validation process should include the following: Regardless of the technology used, it should be confirmed that there are at least three good matching samples every two minutes during morning peak hour (7-8AM) and evening peak hour (4:30 to 5:30PM). If the matching sample size requirements are not being met, the operator should consider modifying segments, placement of P2P devices and possibly using a different technology. 55
72 After the project is implemented, the validation process should include following: Compare reported real-time travel time against measured travel time information for the three peak periods. Travel time studies should be conducted during morning peak (7-8AM), Noon peak (12-1PM) and evening peak (4:30 to 5:30PM). It is recommended that at lease 4 runs be completed each direction for each period. Typically, deviations in travel time of less than 15% can be considered acceptable. If deviations greater than 15% are observed for a particular segment, the process should be repeated the next day for the same period. If deviations greater than 15% persist, conduct travel time studies again for the segment and validate the data being reported on the segment. Operators should also review a report that shows the number of matching samples every two minutes for a 24 hour period on a weekday and weekend to understand the quality and reliability of data. After the initial year, the validation process should include the following: o Local agency operators should conduct travel time studies during one of the peak periods and compare it to real-time travel time for the same peak period. This should be done on an annual basis. o The operator should confirm that reported/measured travel times did not deviate more than 15 percent. The free-flow travel time should be re-collected if the following major changes have occurred along the corridor: o Signals added or removed o Major lane or geometric changes 56
73 Accepting Travel Time Data from Private ISPs and Vendors As mentioned earlier, private ISPs are capable of providing travel time data every two minutes or less on arterial corridors using TMC segmentation. At present, there are a couple of issues with TMC segmentation. It is an unofficial standard and TMC segments are only updated once every year. Some arterial segments have only one TMC segmentation code for both directions. Private ISPs are working on providing travel time data for customized segments. Device vendors (Blue Tooth & others) are also willing to provide travel time data to local agencies and are not tied to TMC segmentation. The data collection and processing are done by custom and proprietary software algorithms developed by the vendor. Guideline(s) Travel time data from private ISPs are acceptable as long as the following requirements are met: Travel time data are provided via XML feed every two minutes. Segmentation is clear by direction and meets the requirements of the local agency. No restrictions on the use of data for real time or historical purposes. Sample size requirements are being met, i.e., minimum of three good matching samples every two minutes. Data are measured travel-time data and not speed data that are extrapolated to calculate travel time Providing Travel Time Data to Private ISPs As local agencies collect travel time data, it should be made available to private ISPs as they are looking to add more data sources. This will allow the private ISPs to customize and pre-package the information to their individual subscribers or commercial clients. In discussions with private ISPs, it is evident that data are being purchased from other private vendors such as, cell phone providers, trucking companies, etc. It also appears that data from 57
74 public agencies are being provided to private ISPs at no cost. There are a couple of issues that operators should consider Data are being provided to a for-profit entity that is reselling the data to its paid subscribers. There are additional responsibilities that are being incurred by the operator in terms of maintaining the XML feed, trouble shooting issues, pursuing and monitoring agreements, etc. These responsibilities result in taking time and resources away from normal operations. Operators may need to consider the possibility of selling the data to private ISPs in order to recover cost associated with collection, processing, storing and dissemination of the data. Guideline(s) Travel time data should be made available to private ISPs. Interested ISPs should poll the data in time intervals no greater than every two minutes. Shorter polling times of less than every two minutes can slow down the available communication channels. Agencies should be given the discretion to charge private ISPs for their data Travel Time Measures of Effectiveness (MOEs) and Reporting The following MOEs are available Travel Time Travel Time Index (TTI) Section Planning Time Index (PTI) Section Congestion Duration Historical data and reports should be made available through the previous day. 58
75 Congestion Duration The duration of congestion is a helpful measure for operators to determine how much time the corridor is congested for a specified time period. Congestion occurs when the volume of traffic is greater than the available roadway capacity. CDOT DTD uses V/C (volume divided by capacity) ratio 0.85 to define congestion. This is based on available historical data and data measures at specific points along the corridor. Although, it is hard to determine if the congestion data were impacted due to traffic incidents, etc. TTI forms a good basis for addressing congestion as it reflects how traffic operates in relation to free-flow conditions. Guideline(s) Congestion duration must be determined based on the time period where a segment experiences a TTI of 1.2. Additionally, operators should also consider determining congestion severity by identifying time periods of heavy (TTI between ) and or severe (TTI > 1.81) congestion Usefulness of MOEs to Operators Typically, travel time studies are manually conducted by operators on an as-needed basis and usually associated with signal retiming efforts. These studies primarily focus on travel time and stopped delay. At present, TTI, PTI and congestion duration are not part of the operator s tool box. Operators do not have a baseline for travel time information, which is necessary to perform a comparison with historical data. Operators are not able to determine the impacts on travel time in conjunction with the following conditions: During incidents During construction or maintenance activity 59
76 During weekends Holidays During bad weather During events Signal malfunctions Signal retiming New development or redevelopment The ability to understand the impacts of these conditions on travel time allows the operators to perform the following actions: Examine the restrictions on construction maintenance activity along an arterial. At present, these restrictions are not based on impacts on travel time. Determine the needs for weekend timing plans. Currently, most operators use week day plans on weekends. Implement special timing plans with extended yellow and all red intervals for bad weather and events to increase safety. Identify the costs of malfunctioning signals to the travelling public and improving the reliability of equipment. Determine the benefits of signal retiming efforts. Guideline(s) The first year of travel time implementation forms the baseline for all MOEs. This establishes a solid foundation for comparison and trend analysis. After the first year, the operator should be able to compare current data in the following ways: o Time of Day (TOD) comparisons o Day of Week (DOW) comparisons o Weekly comparisons 60
77 o Monthly comparisons o Yearly comparisons Usefulness of MOEs to Others Operators are focused on real-time information and historical data as it pertains to operations. There are others agencies that are able to use historical travel time MOEs. Potential uses for the historical information include: Determining needs for capital improvements along the corridor based on the severity of the problem. Creatively using TDM strategies along an arterial and measuring the impacts of these strategies. Calibrating planning models. Incident management and impacts on alternate routes. Impacts of development and land use Traffic Incident Information Traffic incident information is the second highest ranked travel condition data parameter in the Denver Region. It can assist operators in understanding and/or managing the impacts of the incidents. Information about incidents on arterials is also helpful to the travelling public in making travel decisions Types of Traffic Incidents An incident is an unexpected occurrence or an event that results in traffic delays and an increase in congestion on the corridor. Incidents can also impede traffic by blocking lane(s) or the roadway. Incidents can be classified by type depending on the level of granularity desired. CDOT s Courtesy Patrol Program that operates within the Denver Region classifies incidents by 61
78 more than 10 different types. This level of granularity may be too much, and therefore may not be useful or necessary for the arterials. Guideline(s) Incidents on arterials should be classified into the following five types: Accident (Primary or Secondary) Stalled Vehicle Spill load (non HAZMAT) HAZMAT Spill Other ( Vehicle fire, etc) The NIMS traffic incident classification should be used and they are defined below: Minor - traffic incidents with disabled vehicles and minor crashes that result in no lane closure or lane closures of less than 30 minutes. Intermediate - traffic incidents that affect travel lanes for 30 minutes to 2 hours and usually require traffic control at the scene to divert road users past the blockage. Full roadway closures may be necessary for short periods during traffic incident clearance to allow incident responders to accomplish their tasks. Major Typically, traffic incidents involving hazardous materials, fatal traffic crashes involving numerous vehicles, and other natural or man-made disasters. These traffic incidents typically involve closing all or part of a roadway facility for a period exceeding 2 hours Traffic Incident Detection Traffic incidents along the roadways can be detected by the operator in the following ways: Incident detection algorithms based on instrumentation using P and/or P2P devices. Public Safety receives the incident information from the public and the information is made available to the operator via interface to CSP or local law enforcement Computer 62
79 Aided Dispatch System (CADD). In some instances, the operator monitors the public safety radio channels to find out about traffic incidents. Depending on the type of incident, operators may receive phone calls from Public Safety or emergency providers requesting support for incidents. Observed on the traffic camera by TMC operator. There may be other sources for incident detection such as maintenance personnel, phone calls to the TMC, etc. Incident detection algorithms for Interstate Highways are at a more advanced stage of development than for arterials. The operational characteristics of arterials make it difficult to develop a reliable incident detection algorithm. CDOT has an interface into CSP CADD that allows CDOT to know about traffic related incidents. The practice of monitoring Public Safety radio channels may not be the most effective way to find out about incidents. Traffic cameras are useful for incident detection. The cameras can be Pan Tilt Zoom (PTZ), presence detection cameras at signalized intersections or queue detection cameras at selected locations. All of these cameras require that an operator monitor the camera images to detect an incident. Guideline(s) Deployment of an incident detection algorithm for arterials is not recommended at this time. Local CTMS client interface to the CSP or local law enforcement CADD system is recommended as this will allow the operator to monitor traffic incidents. Operators should use traffic cameras to monitor traffic flow and detect incidents during morning and evening week day peak periods. 63
80 Traffic Incident Verification Incident verification is the critical function of a traffic incident management effort. The incident will not be reported to the travelling public on the CoTrip website if it has not been verified. If the incident information is available via the CSP or local law enforcement CADD interface, it can be considered very reliable. However, traffic incident information from other sources should be verified before the incident is reported to the travelling public. Guideline(s) Incidents should be verified using traffic cameras before being reported to travelling public via CoTrip website. If the incident cannot be verified due to lack of video coverage, the incident should not be reported to the travelling public unless it is confirmed by a reliable source. Acceptable forms of verification include CSP or local law enforcement CADD interface, on-scene public safety personnel, on-scene operators and maintenance personnel Incident Information Validation The validation process needs to occur throughout the duration of the incident, i.e., detection, verification, response, reporting and clearance. Once the incident is verified and reported, the operator should continue to monitor any changes to: Roadway or lane closure Duration of the incident If video coverage is not available, the operator is responsible for coordinating with the incident commander to update any changes. 64
81 Guideline(s) The operator is responsible for updating any changes to the following: o Roadway or lane closures o Duration of the incident o Clearance of the incident Traffic Camera Placement Traffic cameras are one of the primary ways to detect and verify incidents on an arterial. Camera images of an arterial can be available from queue cameras, presence detection and PTZ cameras. The placement of queue presence and queue detection cameras is dictated by other factors since their primary purpose is not to provide camera images. Also, these are fixed cameras, i.e., they do not have PTZ capability and their field of view is calibrated to assist in detection of vehicles and queues. However, cameras with PTZ capability should be considered at critical locations. Guideline(s) Cameras with PTZ capability are recommended at major intersections. Major intersection is defined in Section (Segment Definition). To the greatest extent possible, the camera should be placed to allow visibility on both intersecting corridors. However, operators should also exercise judgment based on operational characteristics along the corridor. In some instances, cameras may be required at non-major intersections Traffic Incident Response and Reporting Within the Denver Region, CDOT reports incidents on Interstate Highways and other highways; however, incidents that occur on the arterials are not being reported. After the incident is detected and verified, the operator has to make the following decisions: 65
82 Determine the potential duration of the incident - Incident duration includes the time from when the incident is detected to the time when the incidents is cleared. Determining the duration of the incident can be difficult. Incidents are managed on scene by CSP or local law enforcement Personnel. The operator has to rely on visual images and/or obtain potential duration information from the incident commander. Implement any mitigation strategies These include temporarily adjusting signal timing and posting incident information on VMS and CoTrip to alert the travelling public. Guideline(s) Operators should consider mitigation strategies only if the potential incident duration is expected to last more than 30 minutes. If the incident duration is expected to be more than 30 minutes i.e., intermediate or major incidents, operators should use the local CTMS to report the incident and include location, direction, duration, roadway or lane closure and reporting source. Additionally, the operator working with CSP or local law enforcement personnel can implement any temporary changes in signal timing to alleviate the traffic backups in the incident area Traffic Incident Information Display Output CDOT provides incident information for Interstate Highways and other highways on the CoTrip website. The symbol for an incident is shown as. CDOT also uses to show when the incident is cleared. When the incident symbol is selected, it displays text providing information about the incident. Guideline(s) The same symbols used on CoTrip regarding incidents should be used for arterials to provide consistency. 66
83 When the symbol is selected, it will display the following information: o Location o Direction o Type of Incident o Roadway or Lane closure o Potential Duration o Information Reporting Source It is also recommended that the cleared incident symbol should be timed to stay on for 10 minutes after the incident has been cleared Traffic Incident Clearance Typically, the incident is considered cleared when it is no longer impeding traffic flow on the roadway. When incidents with greater than 30 minutes of duration are cleared, the operator needs to: Clear the incident on reporting and if signal timing was temporarily adjusted it should be returned to normal operations. Guideline(s) Operators should confirm that an incident has been cleared before reporting it on CoTrip. Operators should confirm return to normal signal operations Data Timeliness As per the FHWA Rule, information for incidents pertains to roadway closures or lane blocking on Interstate Highways and on Routes of Significance within the MSA area should be reported within 10 minutes from the time the incident is verified. Guideline(s) 67
84 Denver Region should follow the FHWA Rule regarding reporting incidents that cause roadway closures or lane blocking on arterial corridors within 10 minutes from the time the incident is verified provided that the incident is projected to exceed 30 minutes in duration Accepting Incident Information from Private ISPs Private ISPs can provide incident information by collecting the data from many sources, including incidents reported by subscribers. It is not clear how incidents are verified and cleared. Presently, no private ISP has access to CSP or local law enforcement CADD systems. Guideline(s) Incident information from private ISPs is acceptable as long as the operator has the ability to verify the incident, as defined in Section (Incident Verification), before any mitigation strategies are implemented Providing Data to Private ISPs When incident data are collected for arterials, it should be shared with private ISPs. This will further allow the private ISPs to customize and pre-package the information to their individual subscribers and/or their commercial clients. Guideline(s) Incident data should be made available to private ISPs Incident Information MOEs The following MOEs that relate to incident information are recommended for the Denver Region: Number of incidents over a specified period. Type of incidents over a specified period. Travel time during incidents. 68
85 Incident duration Number of secondary incidents. Crash rate (Crashes per million miles travelled) by specified roadway length Usefulness of MOEs to Operators At the moment, operators are mostly unaware of incidents that happen on the arterials as incidents are handled by CSP or local law enforcement personnel. Operators do not have a baseline of incident information. With the interface to CSP or local law enforcement CADD systems, operators will be aware of traffic incidents. Also, depending on the availability of cameras, operators will be able to verify the incident and implement mitigation strategies Guideline(s) The first year of incident information forms the baseline for all MOEs. Following the initial year, the MOEs can be expanded to include the operators response to incidents. Case studies should also be selectively performed to understand the benefits of mitigation strategies Usefulness of MOEs for Others Operators should share the MOEs with Public Safety and Emergency Management providers. Potential uses for this information may include: Traffic incident management plans for specific arterials including agency roles and responsibilities identified in the plans. Identification of alternative routes. Protocols on handling traffic issues during incidents. 69
86 3.4.3 Weather Related Road Condition Information Weather related road conditions are provided on the CoTrip website for most Interstate Highways, State and US Highways primarily outside of the Denver Region. This information is used by the travelling public during bad weather. It is also used by public and private entities, trucking companies, visitor centers, etc. to assist in their daily operations Types of Weather Road Condition Information Weather information can be typically classified into two categories: weather forecasts and weather related road conditions. Weather forecasts are available from a variety of mediums such as television, radio, etc. However, weather related road condition information is more difficult to obtain without instrumentation along the roadway. Weather related road condition information can be classified in numerous types like blowing snow, snow, icy spots, wet/rain, etc. CDOT uses nine types of weather related road condition information for its highways. This level of granularity may not be useful or necessary for arterials given the geographic location and terrain within the Denver Region. Guideline(s) Denver Region should provide the following weather related road conditions information: o Icy Spots o Snow o Wet/Rain o Poor Visibility/Fog o Adverse Conditions o No Data (only when no data is available from the device) 70
87 Operators should provide weather related road condition information during adverse conditions, which result in roadway or lane blockage. The following weather related road conditions information is not recommended for arterials in the Denver Region: o Blowing Snow o Dry o High Wind Typically blowing snow and high wind is local to few specific spots in the Region. In addition, providing dry and no data conditions may cause more visual clutter and do not add any value to the information Segmentation for Weather Related Road Condition Information Weather related road condition information would be determined and updated based on the corridor segmentation. Most of the time weather related road conditions would be the same on the entire arterial corridor or at least for a few miles of the corridor. If corridor segmentation follows the guidelines for travel time, the weather related road conditions data will be too detailed, which may be confusing for the users. Guideline(s) Segmentation to display the weather related road information should follow these guidelines: Combine segments to include at least three major intersections or consider minimum segment lengths of five miles. If a jurisdictional boundary exists between two major intersections, it is recommended to consider the segment end at the nearest signal prior to entering the adjoining jurisdictional boundary Detection of Weather Related Road Conditions Within the Denver Region, the following devices are being used to monitor weather conditions: 71
88 Weather stations and road sensors. Traffic Cameras. Snow plow vehicles equipped with AVL (some vehicles may also include a camera and/or data input device). Fog Visibility Systems. CDOT uses Maintenance Decision Support System (MDSS), which is tied to various forecasting services, weather stations, sensors, etc. MDSS is capable of collecting surface and pavement condition information from weather stations and providing weather forecasting and roadway treatments based on road condition information. This is an annual paid service to an MDSS vendor based on number of roadway miles covered. Most CDOT weather stations include a fixed camera that can transmit road condition images at periodic intervals. Roadway sensors provide information regarding weather related pavement conditions such as icy spots, snow or rain accumulation, wind, etc. Traffic cameras allow operators to visually monitor pavement and visibility conditions. Also, traffic cameras serve other purposes such as monitoring traffic flow and assisting in incident management. Snow plow vehicles equipped with cameras and/or data input devices provide snap shots of pavement conditions. Also, the snow plow operator can input road conditions if a data input device is available in the vehicle. The fog visibility system includes sensors that detect fog and display warning messages on Variable Message Signs at the approximate location. Guideline(s) Traffic cameras are the best possible devices to obtain weather related road conditions during bad weather. Camera images are also the most popular item accessed on the CoTrip website during bad weather. Traffic cameras are recommended to be used at major intersections. Major intersections are defined in Section Weather Stations and road sensor locations can be determined by operators. The implementation of weather station and road sensors should be left to the discretion of the 72
89 operator in conjunction with the agency s needs. If they are installed, the data should be available in CTMS via XML feed. Local agencies should decide if they want to implement the MDSS system and/or equip snow plows with AVL capabilities including camera and/or input devices in the vehicle. Operators should consider using the MDSS system instead of implementing a stand alone system. This will increase the benefits through better forecasting, reduced costs and all the data being available on the same system Road Conditions Graphical Display Output CDOT provides weather related road conditions for Interstate Highways, State and US highways on the CoTrip website with a color-coded map. The majority of these highways are outside of the Denver Region. The color-coded legend that is used on the CoTrip website is shown in Table 5. CoTrip does not include weather related road condition information for the majority of arterials in the Denver Region. Table 5: Color Code and Weather Related to Road Conditions Color Code Dark Blue Light Blue Sky blue Green Light green Black Purple Light Gray Dark Gray Weather Related Road Condition Blowing Snow Icy Spots Snow Wet/Rain Dry Adverse High Wind No Data Poor Visibility/ Fog 73
90 Guideline(s) Color codes should be as shown in the Table 6 for the arterials in the Denver Region. This is consistent with the color codes currently used on CoTrip. Table 6: Recommended Color Code and Weather Related Road Conditions Color Code Light Blue Sky blue Green Dark Gray Black Weather Related Road Condition Icy Spots Snow Wet/Rain Poor Visibility/ Fog Adverse Tabular Display of Weather Related Road Conditions Information On the CoTrip website weather related road condition information for Interstate Highways, State and US highways can be viewed in a tabular format that includes the following: Segment (From & To) Road condition When the segment is selected, a pop-up window for the segment displays the following: Segment Road Condition Length Comments Updated time As more arterials and more segments are added to the CoTrip website, the tabular display may become too cumbersome to use. If the tabular display allowed for rubber banding a group of segments to get an overall weather related road condition information, it might be beneficial. 74
91 Guideline(s) Tabular display for weather related road conditions should be made available on CoTrip and CCTM for the Denver Region. Also, when the segment is selected a pop up a window should display the following information: Segment Road condition Roadway or lane blockages Updated time Information Reporting Source Data Timeliness As per the FHWA Rule, hazardous driving conditions and roadway or lane closures or blockages because of adverse weather conditions on the Interstate Highways and Routes of Significance should be reported within 20 minutes from the time hazardous weather related road conditions, blockages or closures is observed. Guideline(s) Denver Region should follow the FHWA Rule and report hazardous driving conditions and roadway or lane closures or blockages within 20 minutes of when they are observed. However, other conditions such as icy spots, snow, wet/rain and poor visibility/fog can be reported within 30 minutes or when conditions change during the morning or afternoon weekday peak periods Weather Related Road Condition Information Validation The validation process needs to occur throughout the duration of bad weather conditions, i.e., detection, verification, reporting and clearance. 75
92 Once the weather related road condition is verified and reported, the operator should continue to monitor any changes to: Roadway or lane closures Roadway condition If video coverage is not available, the operator is responsible for coordinating with maintenance personnel to update any changes. Guidelines The operator should update changes to the following information: o Roadway or lane closures o Road conditions Weather Related Road Condition MOEs As with incidents, operators within the Denver Region do not have a clear understanding of the impacts of weather on arterial operations. As a result, operators are unclear regarding potential mitigation strategies that could be used, such as extended yellow, all red clearance intervals or longer cycle lengths. The following MOEs that relate to weather related road condition information are recommended for the Denver Region: Number of adverse conditions observed. Travel time during different road conditions particularly during snow conditions. Number of observed incidents due to adverse weather conditions. 76
93 Usefulness of MOEs to Operators Through use of these MOEs, operators will be able to understand and make informed decisions when weather related road conditions occur. Understanding how travel is impacted during different conditions will allow operators to determine different strategies that may include: Adjusting signal timing to reduce accidents. Advising alternative routes for traveler. Guideline(s) Operators should study the effect on travel time during the weather related road conditions. Operators should consider implementing signal timing changes and determine the impacts from such changes on travel time and safety Usefulness of MOEs to Others While operators are focused on real time information and historical data as it pertains to operations, there are other agencies that are able to use these MOEs. Potential uses of the historical information include: Evaluation of existing roadway condition and impact due to weather. Emergency vehicle routes during bad weather. Identification of future roadway capital improvements to improve safety and operations during bad weather Construction and Maintenance Operations Information Typically, construction projects on Interstate Highways, State Highways, US Highways and arterials may take several weeks to complete and some may take a year. In the Denver Region, construction information is one of the second highest ranked travel condition data parameters. Construction can result in roadway changes, i.e., lane closures and detours. Although 77
94 construction activity can have significant impacts on roadway traffic conditions, in most instances, operators have minimal to no control over the construction project as the agency project managers work with the construction contractor. Maintenance operations in the Denver Region involve both planned and emergency operations. Much like roadway construction, maintenance operations can result in lane closures or road blockages causing inconvenience to the travelling public. Stakeholders agreed that from a travelling public perspective, the distinction between construction and maintenance may not be significantly different. It was also agreed that the travelling public should be informed about both construction and maintenance activities so that they can make informed decisions on their travel. However, there would be distinction drawn between Planned and on-going activities Types of Construction and Maintenance Operations Construction and maintenance operations on an arterial can be classified into several different types. From a travelling public perspective, it is not clear how much difference it would make to know the type of activity on an arterial. Guideline(s) Construction and maintenance operations within the Denver Region should be classified into one of the five following types: Bridge Construction Road Construction including above ground and underground utilities (water, sewer and communications) Signal Installation/Upgrade Paving operations Roadway maintenance operations 78
95 Collection of Construction and Maintenance Operations Information Collecting information on construction projects and maintenance operations can be done through a variety of methods. This could range from one consolidated clearing house for all construction projects and maintenance operations in the Denver Region to each local agency being responsible to provide construction and maintenance operations information within their jurisdictional boundaries. Guideline(s) Construction project and maintenance operations information should be provided and updated by the operator within each local agency using local CTMS. The operator is responsible to keep the construction and maintenance operations information current and work closely with the agency project manager, construction contractor or agency maintenance supervisor Graphical and Tabular Display of Construction and Maintenance Operations Information CoTrip displays construction and maintenance operations on Interstate Highways and State Highways, US Highways in two ways. The first is by graphically showing a road traffic cone on the map at each construction and maintenance operations location. The tabular display is also available when the road traffic cone is selected. The construction and maintenance operations display is shown in Figure

96 Figure 21: CoTrip Current Construction And Maintenance Operations Display CDOT includes the following information on each construction project both in graphical and tabular format: Roadway Direction Location and Mile marker Hours/Days of construction Description of Closures and Detours Last Updated, i.e., a date and time stamp Expected project completion (month, year) Figure 22 provides a sample of the type of construction information that is provided when the road traffic cone is selected. 80

97 Figure 22: Construction Information for the I-25 and Santa Fe Project as shown on CoTrip Additionally, CoTrip provides a tabular display of each maintenance operation that includes the location, the time of day operations will occur, and any lane closures, delays, or roadway changes. Figure 23 shows the sample of tabular display of maintenance operations on the CoTrip website. 81

98 Figure 23: CoTrip Tabular Display for Maintenance Operations for I-70 though the Eisenhower Tunnel Typically, this information seems sufficient for construction and maintenance operations on arterials. The one issue that is worth noting is that the current format may not be intuitive to a user and may be cumbersome to read. Guideline(s) The cone symbol should be used for graphically displaying construction and maintenance operations for both Interstate Highways and arterials. This avoids any confusion for users. Planned construction and maintenance operations should only be reported within 30 days of commencement of the work. Only maintenance operations including emergency operations that are expected to be 30 minutes or more in duration should be reported to the travelling public. Tabular information should be accessible by clicking on the symbol on the graphical representation. 82
EVALUATION OF THIRD-PARTY TRAVEL TIME DATA IN TALLAHASSEE, FL
 EVALUATION OF THIRD-PARTY TRAVEL TIME DATA IN TALLAHASSEE, FL Charles R. Lattimer, PE, PMP Group Manager, Atkins North America 482 S. Keller Rd. Orlando FL 32810 (407) 806-4287, charles.lattimer@atkinsglobal.com
Puget Sound Regional ITS Architecture Update. Why does the region need an ITS Architecture?
 IBI GROUP 801 Second Avenue Suite 1400 Seattle WA 98104 USA tel 206 521 9091 fax 206 521 9095 ibigroup.com Memorandum To/Attention Puget Sound Regional Council Date May 26, 2015 (PSRC) From IBI Group Project
Chicago s Transportation Infrastructure: Integrating and Managing Transportation and Emergency Services
 Chicago s Transportation Infrastructure: Integrating and Managing Transportation and Emergency Services David Zavattero City of Chicago OEMC UIC IGERT Seminar May 21, 2009 /daz1d/present/uic-igert-data_may2009.ppt
Iowa Department of Transportation Intelligent Work Zone Deployments
 Iowa Department of Transportation Intelligent Work Zone Deployments SMARTER WORK ZONES TECHNOLOGY APPLICATIONS CASE STUDY The Every Day Counts Initiative (EDC-3) aims to accelerate the deployment of identified,
Using INRIX Data in Iowa. Kyle Barichello, Iowa DOT Skylar Knickerbocker, InTrans
 Using INRIX Data in Iowa Kyle Barichello, Iowa DOT Skylar Knickerbocker, InTrans What is probe data? What is INRIX data? INRIX Data Overview Purchased traffic data Covers Interstates, State Highway, some
Transportation Pooled Fund Study TPF-5 (231)
") ENTERPRISE Drafmu Transportation Pooled Fund Study TPF-5 (231) Real-Time Integration of Arrow Board Messages into Traveler Information Systems EVALUATION PLAN Prepared by September 2017 Acknowledgements
ENTERPRISE Drafmu Transportation Pooled Fund Study TPF-5 (231) Real-Time Integration of Arrow Board Messages into Traveler Information Systems EVALUATION PLAN Prepared by September 2017 Acknowledgements
Dec 20, 2007 Operations Performance Measures Conference Call
 Dec 20, 2007 Operations Performance Measures Conference Call Required Accuracy of Measures Performance Measure Traffic Engineering Transportation Planning Applications Traffic Management OPERATIONS Traveler
Florida s Approach to Maximizing Advances in Data and Technology for Performance Management
 Florida s Approach to Maximizing Advances in Data and Technology for Performance Management June 2, 2015 Topics 1. Florida s MPM Program 2. Data needs and sources 3. Use of measured data vs modeled 4.
Regional Integrated Multi-Modal Information Sharing (RIMIS) System Project Concept of Operations Executive Summary
 System Project Concept of Operations Executive Summary") Regional Integrated Multi-Modal Information Sharing (RIMIS) System Project Concept of Operations Executive Summary 190 North Independence Mall West Philadelphia, Pennsylvania EXECUTIVE SUMMARY Background
Regional Integrated Multi-Modal Information Sharing (RIMIS) System Project Concept of Operations Executive Summary 190 North Independence Mall West Philadelphia, Pennsylvania EXECUTIVE SUMMARY Background
Denver Traffic Management Center - Using Technology to Increase Operational Capabilities
 Denver Traffic Management Center - Using Technology to Increase Operational Capabilities Jim Fox, PE City and County of Denver Western ITE and Texas ITE Joint Conference June 26, 2018 Background Traffic
Florida s Accelerated Innovation Deployment (AID) Demonstration Project - Commercial Vehicle Parking System
 Demonstration Project - Commercial Vehicle Parking System") Florida s Accelerated Innovation Deployment (AID) Demonstration Project - Commercial Vehicle Parking System I. Project Abstract The goal of this project is to provide reliable real-time information about
Florida s Accelerated Innovation Deployment (AID) Demonstration Project - Commercial Vehicle Parking System I. Project Abstract The goal of this project is to provide reliable real-time information about
APPENDIX A: SHORT-TERM PROJECT DEPLOYMENTS
 APPENDIX A: SHORT-TERM PROJECT DEPLOYMENTS Page 1 of 15 ST-01: I-95 ITS DEPLOYMENT (DE STATE LINE TO AIRPORT) PROJECT DESCRIPTION AND SCOPE: Project will address gaps in ITS device coverage on I-95 from
City of Dubuque: Smart Traffic Routing with Efficient & Effective Traffic System (STREETS) Final Report version 1.1
 Final Report version 1.1") City of Dubuque: Smart Traffic Routing with Efficient Final Report version 1.1 June 22, 2018 Submitted to: 17J18 0640 Prepared by Iteris, Inc. Iteris, Inc. i DOCUMENT VERSION CONTROL DOCUMENT NAME SUBMITTAL
City of Dubuque: Smart Traffic Routing with Efficient Final Report version 1.1 June 22, 2018 Submitted to: 17J18 0640 Prepared by Iteris, Inc. Iteris, Inc. i DOCUMENT VERSION CONTROL DOCUMENT NAME SUBMITTAL
Chapter 10. Intelligent Transportation Systems. Ohio Kentucky Indiana Regional Council of Governments Regional Transportation Plan
 Chapter 10 Intelligent Transportation Systems Ohio Kentucky Indiana Regional Council of Governments 2030 Regional Transportation Plan Chapter 10 Intelligent Transportation Systems INTRODUCTION Intelligent
Appendix A: Equipment Packages for St. Louis Regional ITS Architecture
 Appendix A: Equipment Packages for St. Louis Regional ITS Architecture Appendix A: Equipment Packages for St. Louis Regional ITS Architecture... 1 1.1 ATMS01: Network Surveillance - Supporting Equipment
Congestion Management Process in the US A Federal Requirement
 Congestion Management Process in the US A Federal Requirement ITS Argentina November 6, 2013 U.S. Department of Transportation Federal Highway Administration Outline of Seminar Discussion of Congestion
Proposed Comprehensive Update to the State of Rhode Island s Congestion Management Process
 Proposed Comprehensive Update to the State of Rhode Island s Statewide Planning Program January 2018 Summary Outline of of Action Steps 1. Develop Objectives for Congestion Management What is the desired
Intelligent Transportation Systems (ITS) Concept of Operations for Freeway Traffic Management
 Concept of Operations for Freeway Traffic Management") Intelligent Transportation Systems (ITS) Concept of Operations for Freeway Traffic Management Prepared for: Minnesota Department of Transportation (Mn/DOT) Prepared by: Athey Creek Consultants and Alliant
Intelligent Transportation Systems (ITS) Concept of Operations for Freeway Traffic Management Prepared for: Minnesota Department of Transportation (Mn/DOT) Prepared by: Athey Creek Consultants and Alliant
End of Queue Warning Systems. Systems Requirements
 End of Queue Warning Systems Systems Requirements December 2015, Revised 2/14/2018 Acknowledgements This document was prepared for Minnesota Department of Transportation s (MnDOT) Systems Engineering to
The Next Era of Traveler Information E N T E R P R I S E
 The Next Era of Traveler Information National Rural ITS Conference Session C3 September 18, 2012 Outline Introduction Current Practices: Agencies Current Practices: Travelers Peer Exchange Questions Introduction
King County Intelligent Transportation Systems
 King County Intelligent Transportation Systems Signal Synchronization and Beyond Presentation to the Transportation Leadership Forum Department of Transportation February 24, 2005 System Control & Evaluation
SECTION II CONTROLLED ACCESS FACILITIES
 SECTION II CONTROLLED ACCESS FACILITIES SYSTEM IDENTIFICATION A critical component of the Dallas-Fort Worth (DFW) Metropolitan Transportation System is the regional freeway and tollway systems, which are
ODOT Transportation Systems Management & Operations Plan
 ODOT Plan Performance Measures Prepared for: Prepared by: May 2017 Updated December 2017 This page intentionally left blank Table of Contents List of Tables Introduction 1 ODOT s TSMO Performance Measures
Vehicle Detector Concept of Operations
 Vehicle Detector Concept of Operations Virginia Department of Transportation Northern Region Operations FINAL Prepared by: May 14, 2008 Table of Contents 1 Scope...1 1.1 Identification... 1 1.2 Role of
MICHIGAN DEPARTMENT OF TRANSPORTATION SPECIAL PROVISION FOR STOPPED TRAFFIC ADVISORY SYSTEM. OFS:CRB 1 of 8 APPR:JJG:LWB:
 MICHIGAN DEPARTMENT OF TRANSPORTATION SPECIAL PROVISION FOR STOPPED TRAFFIC ADVISORY SYSTEM OFS:CRB 1 of 8 APPR:JJG:LWB:10-30-13 a. Description. This work consists of providing, installing, operating,
AVHS encompass a wide and complex variety of technologies, such as artificial intelligence,
 CONCLUSIONS AVHS encompass a wide and complex variety of technologies, such as artificial intelligence, image processing, machine vision, expert systems, advanced materials, and microelectronics. The status
INTELLIGENT TRANSPORTATION SYSTEMS APPENDIX
 INTELLIGENT TRANSPORTATION SYSTEMS APPENDIX Southern California Association of Governments ADOPTED APRIL 2012 INTELLIGENT TRANSPORTATION SYSTEMS Introduction 1 Existing System Description 1 Existing System
MIST Version 5. Transportation Management for the Smart City. Make the most of your energy SM
 MIST Version 5 Transportation Management for the Smart City Make the most of your energy SM 04 Magelis ipc MIST Version 5 Part of Schneider Electric s SmartMobility TM suite of tools, Management Information
Transit Signal Priority in the Denver Metro. Bart Przybyl, P.E., PTOE
 Transit Signal Priority in the Denver Metro Bart Przybyl, P.E., PTOE BACKGROUND DRCOG Denver Regional Council of Governments RTD Regional Transportation District (Transit Authority) 2007 DRCOG/RTD Transit
Current Trends in Traffic Congestion Mitigation
 Current Trends in Traffic Congestion Mitigation April 24, 2009 NCSL Spring Forum Washington, DC Jeff Lindley Associate Administrator, Office of Operations Federal Highway Administration U.S. Department
ENTERPRISE Drafmu Transportation Pooled Fund Study TPF-5 (231)
") ENTERPRISE Drafmu Transportation Pooled Fund Study TPF-5 (231) Assess Speed Data for Traffic Management FINAL REPORT Prepared by September 2017 Acknowledgements This document was prepared for the ENTERPRISE
ENTERPRISE Drafmu Transportation Pooled Fund Study TPF-5 (231) Assess Speed Data for Traffic Management FINAL REPORT Prepared by September 2017 Acknowledgements This document was prepared for the ENTERPRISE
Developing a Successful ICM Project. Christopher Poe, Ph.D., P.E. Assistant Director Texas A&M Transportation Institute
 Developing a Successful ICM Project Christopher Poe, Ph.D., P.E. Assistant Director Texas A&M Transportation Institute What is ICM? What is ICM? The integrated management of freeway, arterial, transit,
SMART WORK ZONE SOLUTIONS
 SMART WORK ZONE SOLUTIONS JAMLOGIC WHY USE JAMLOGIC IN SMART WORK ZONES? IN US WORKZONES, THERE WERE: 669 47,758 FATALITIES IN 2014 41% INJURIES IN 2013 OF FATAL CRASHES WERE REAR-END COLLISIONS IN 2014
Automatic Vehicle Identification (AVI) Versus Anonymous Wireless Address Matching (AWAM) also known as Bluetooth
 Versus Anonymous Wireless Address Matching (AWAM) also known as Bluetooth") Automatic Vehicle Identification (AVI) Versus Anonymous Wireless Address Matching (AWAM) also known as Bluetooth Magdy Kozman,P.E. Texas Department of Transportation Transportation Operation Engineer Texas
Automatic Vehicle Identification (AVI) Versus Anonymous Wireless Address Matching (AWAM) also known as Bluetooth Magdy Kozman,P.E. Texas Department of Transportation Transportation Operation Engineer Texas
The ipems MAP-21 Module
 The ipems MAP-21 Module Producing the information you need from the National Performance Management Research Data Set (NPMRDS) January 2015 Innovation for better mobility Use the ipems MAP-21 Module to
Johnson City Regional ITS Architecture Update Kick-off Workshop. October 21, 2014
 Johnson City Regional ITS Architecture Update Kick-off Workshop October 21, 2014 Presentation Overview Overview of ITS ITS Architecture Development Process Existing Regional ITS Architecture Regional Boundaries
Automating Variable Speeds and Traveler Information with Real-Time Traffic and Weather
 Automating Variable Speeds and Traveler Information with Real-Time Traffic and Weather Joshua Crain, Jim Peters, P.E., PTOE, and Carl S. Olson ABSTRACT The Highway 217 freeway in Portland, Oregon was the
The Farmington Regional ITS Architecture Update. Submitted By:
 The Final Documentation July 2015 Submitted By: Consensus Systems Technologies Corporation 17 Miller Avenue, PO Box 517 Shenorock, NY 10587-0517 914-248-8466 rsj@consystec.com www.consystec.com Table of
Chattanooga Regional ITS Architecture Update Workshop. September 24, 2013
 Chattanooga Regional ITS Architecture Update Workshop September 24, 2013 CHCNGA TPO Boundaries Presentation Overview Overview of ITS ITS Architecture Development Process Existing Regional ITS Architecture
Smarter Work Zones Webinar Series
 Smarter Work Zones Webinar Series Webinar #12: Integrating Technology Applications Massachusetts DOT Todd Peterson and Neil Boudreau April 26, 2016 1:00-2:30pm EST Efficiency through technology and collaboration
A Concept for Measuring the Effects of Severe Weather and Weather Trends on Freight Movement In and Between Major Urban Areas
 A Concept for Measuring the Effects of Severe Weather and Weather Trends on Freight Movement In and Between Major Urban Areas Jeffrey Short, Senior Research Associate, ATRI American Transportation Research
Rural Intelligent Transportation Systems Toolbox. A National Highway Institute Training Program
 Rural Intelligent Transportation Systems Toolbox A National Highway Institute Training Program Course Goals Introduce the Rural ITS (Intelligent Transportation Systems) Toolbox Increase familiarity with
US 75 Integrated Corridor Management
 US 75 Integrated Corridor Management Koorosh Olyai,, P.E. Assistant Vice President Dallas Area Rapid Transit ITS Texas September 5, 2008 Why ICM is needed in the US 75 Corridor DFW 5 th most congested
Traffic/Mobility Analytics
 Daniel P. Farley Section Chief Traffic Operations Deployment and Maintenance dfarley@pa.gov 717-783-0333 How PennDOT is using large vehicle probe and crowd source information to begin to better plan, design,
OKLAHOMA DEPARTMENT OF TRANSPORTATION SPECIAL PROVISIONS FOR SMART WORK ZONE SYSTEM PROJECT NUMBER, JP NO (04), COUNTY
, COUNTY") 882-2(a-j) 09 OKLAHOMA DEPARTMENT OF TRANSPORTATION SPECIAL PROVISIONS FOR SMART WORK ZONE SYSTEM NUMBER, JP NO. 00000(04), COUNTY This special provision amends and where in conflict, supersedes applicable
882-2(a-j) 09 OKLAHOMA DEPARTMENT OF TRANSPORTATION SPECIAL PROVISIONS FOR SMART WORK ZONE SYSTEM NUMBER, JP NO. 00000(04), COUNTY This special provision amends and where in conflict, supersedes applicable
Truck Parking Information Management System (TPIMS) Glossary
 Glossary") Truck Parking Information Management System (TPIMS) Glossary AASHTO American Association of State Highway and Transportation Officials is the organization that provides recommendations for a variety of
Truck Parking Information Management System (TPIMS) Glossary AASHTO American Association of State Highway and Transportation Officials is the organization that provides recommendations for a variety of
Dallas Integrated Corridor Management (ICM) Update
 Update") Dallas Integrated Corridor Management (ICM) Update North Central Texas Council of Governments Surface Transportation Technical Committee April 26, 2013 What is ICM? The integrated management of freeway,
Dallas Integrated Corridor Management (ICM) Update North Central Texas Council of Governments Surface Transportation Technical Committee April 26, 2013 What is ICM? The integrated management of freeway,
Key Concepts of ARC-IT
 Key Concepts of ARC-IT The Architecture Reference for Cooperative and Intelligent Transportation (ARC-IT) provides a common framework for planning, defining, and integrating intelligent transportation
4.0 Method of Measurement. Measurement for Optional Temporary Pavement Marking will be made to the nearest linear foot.
 4.0 Method of Measurement. Measurement for Optional Temporary Pavement Marking will be made to the nearest linear foot. 5.0 Basis of Payment. Payment for OPTIONAL TEMPORARY PAVEMENT MARKING as described
Dallas ICM & 511 System. 87 th Annual Transportation Short Course
 Dallas ICM & 511 System 87 th Annual Transportation Short Course October 16, 2013 Agenda Introduction ICM Overview 511 Overview Next Steps / Schedule Q&A What is ICM? The integrated management of freeway,
SMART HIGHWAYS & TUNNELS
 A LEADING LAYER SWARCO specializes in the development of smart solutions in transport and infrastructure, and is a leading player in the market for intelligent transportation systems. Our solutions are
Origin-Destination Trips and Skims Matrices
 Origin-Destination Trips and Skims Matrices presented by César A. Segovia, AICP Senior Transportation Planner AECOM September 17, 2015 Today s Webinar Content Matrix Estimation Data sources Florida Application
Connected Corridors: I-210 Pilot Integrated Corridor Management System
 PARTNERS FOR ADVANCED TRANSPORTATION TECHNOLOGY INSTITUTE OF TRANSPORTATION STUDIES UNIVERSITY OF CALIFORNIA, BERKELEY Connected Corridors: I-210 Pilot Integrated Corridor Management System System Integration
US 75 Integrated Corridor Management System Using Technology and Partnership to Maximize Transportation System Capacity
 US 75 Integrated Corridor Management System Using Technology and Partnership to Maximize Transportation System Capacity Ahmad Sadegh, Ph.D. Schneider Electric US 75 Corridor Networks Freeway with continuous
Nashville Area. Regional ITS Architecture. Regional ITS Deployment Plan. June Prepared by:
 Regional ITS Architecture Regional ITS Deployment Plan Prepared by: 069223006 Copyright 2010 by Kimley-Horn and Associates, Inc. All rights reserved. TABLE OF CONTENTS REGIONAL ITS DEPLOYMENT PLAN 1. INTRODUCTION...
Concept of Operations
 Concept of Operations Monitoring Traffic in Work Zones: The icone System September 30, 2009 Prepared for: Minnesota Department of Transportation Prepared by: SRF Consulting Group, Inc. Project No. 6845
SR 99 Incident Response After- Action Plan
 SR 99 Incident Response After- Action Plan Background On June 10, 2014 at 1:52 PM, a pickup truck and a passenger car collided on southbound SR 99 (E Marginal Way S), just south of S Spokane St. The SDOT
Functional Requirements
 Missouri Department of Transportation Springfield Regional ITS Architecture Update Prepared for: Project ID: D8ITS-01 Missouri Department of Transportation Traffic Division MODOT DISTRICT 8 OFFICE M.O.
ITS Architecture Development
 Personal Information Access Transit Management Traffic Management Communications Fixed Point-to-Fixed Point Communica Vehicle Roadway ITS Architecture Development Systems Engineering For ITS Kickoff Workshop
SECTION III - REGIONAL ARTERIAL SYSTEM. The Regional Arterial System is a subcomponent of a broader regional thoroughfare system.
 SECTION III - REGIONAL ARTERIAL SYSTEM SYSTEM IDENTIFICATION The Regional Arterial System is a subcomponent of a broader regional thoroughfare system. The NCTCOG Regional Thoroughfare Plan (RTP) recognizes
EXPLORING THE APPLICABILITY OF COMMERCIALLY AVAILABLE SPEED AND TRAVEL TIME DATA AROUND BORDER CROSSINGS
 EXPLORING THE APPLICABILITY OF COMMERCIALLY AVAILABLE SPEED AND TRAVEL TIME DATA AROUND BORDER CROSSINGS Project performed by Rajat Rajbhandari Final Report 186051-00001 June 2012 Report prepared by Texas
An Application of ITS for Incident Management in Second-Tier Cities: A Fargo, ND Case Study
 30 MID-CONTINENT TRANSPORTATION SYMPOSIUM 2000 PROCEEDINGS An Application of ITS for Incident Management in Second-Tier Cities: A Fargo, ND Case Study SHAWN BIRST AND AYMAN SMADI Congestion on urban freeways,
USING A SIMULATION ENVIRONMENT FOR DYNAMIC TOLL ANALYSIS
 USING A SIMULATION ENVIRONMENT FOR DYNAMIC TOLL ANALYSIS ABSTRACT Robert Kerns and Darryn Paterson Transurban, USA 1421 Prince Street, Suite 200 Alexandria, Virginia 22314 571-527-2050; rkerns@transurban.com;
Corpus Christi Metropolitan Transportation Plan Fiscal Year Introduction:
 Introduction: Traffic congestion in the Corpus Christi Metropolitan area is not as much a function of population growth as the function of the increase in single occupant trips. Using census data, the
Traffic Impact Study Requirements
 [TYPE THE COMPANY NAME] Traffic Impact Study Requirements County of San Mateo Department of Public Works Roadway Services 9/1/2013 I. Introduction The County of San Mateo (County), Department of Public
ENTERPRISE Transportation Pooled Fund Study TPF-5 (231)
") ENTERPRISE Transportation Pooled Fund Study TPF-5 (231) Portable Travel Time Displays and ICM with Parallel Routes Phase 1 PROJECT SUMMARY REPORT Prepared by December 2016 Acknowledgements This document
ENTERPRISE Transportation Pooled Fund Study TPF-5 (231) Portable Travel Time Displays and ICM with Parallel Routes Phase 1 PROJECT SUMMARY REPORT Prepared by December 2016 Acknowledgements This document
TMC of the Future. Dr. Bob Edelstein, PE, PTOE Senior Vice President
 TMC of the Future Dr. Bob Edelstein, PE, PTOE Senior Vice President Overview Traffic Operations Centers Transportation Management Centers TMCs are transforming to be more proactive in addressing recurring
USING TRAVEL TIME RELIABILITY DATA TO DEVELOP CONGESTION MANAGEMENT STRATEGIES IN THE TRANSPORTATION PLANNING PROCESS.
 USING TRAVEL TIME RELIABILITY DATA TO DEVELOP CONGESTION MANAGEMENT STRATEGIES IN THE TRANSPORTATION PLANNING PROCESS by Shuangshuo Wang B.S. Engineering, Tongji University, 2014 Submitted to the Graduate
BCEO TRAFFIC IMPACT STUDY GUIDELINES
 BCEO TRAFFIC IMPACT STUDY GUIDELINES February 2006 TABLE OF CONTENTS INTRODUCTION..... i TRAFFIC IMPACT STUDY STRUCTURE... 1 WHEN IS A TRAFFIC IMPACT STUDY NEEDED?..... 1 STUDY AREA, SITE PLAN & HORIZON
ITS NEWS. Building Southern California s Goods Movement System for the Next Century. Gateway Cities. I-710 Zero Emissions Freight Corridor
 Building Southern California s Goods Movement System for the Next Century Gateway Cities ITS NEWS Summer 2013 I-710 Zero Emissions Freight Corridor PAGE 4 FRATIS Demonstration Advances PAGE 10 ALSO IN
ITS Concept of Operations: End of Queue Warning System for Work Zone
 ITS Concept of Operations: End of Queue Warning System for Work Zone August 2015 Prepared for: The Minnesota Department of Transportation Acknowledgements This document was prepared for Minnesota Department
Transportation Improvement Program (TIP) Relationship to 2040 Metropolitan Transportation Plan (MTP) - Goals and Performance Measures
 Relationship to 2040 Metropolitan Transportation Plan (MTP) - Goals and Performance Measures") Mid-Region Metropolitan Planning Organization Mid-Region Council of Governments 809 Copper Avenue NW Albuquerque, New Mexico 87102 (505) 247-1750-tel. (505) 247-1753-fax www.mrcog-nm.gov Transportation
Mid-Region Metropolitan Planning Organization Mid-Region Council of Governments 809 Copper Avenue NW Albuquerque, New Mexico 87102 (505) 247-1750-tel. (505) 247-1753-fax www.mrcog-nm.gov Transportation
Des Moines Metropolitan Area ITS Strategic Plan
 172 1998 TRANSPORTATION CONFERENCE PROCEEDINGS Des Moines Metropolitan Area ITS Strategic Plan THOMAS KANE, T.H. MAZE, AND VINCENT P. PEARCE The Des Moines Area Metropolitan Organization (MPO) completed
Maximize Transportation System Capacity
 US 75 Integrated Corridor Management System Using Technology and Partnership to Using Technology and Partnership to Maximize Transportation System Capacity What is ICM? The integrated management of freeway,
ITS Projects. Page 1 of 5. Project Name Project Status Timeframe Project Description
 NYSDOT-X80599-NYC TIP ID: Traffic Management NYSDOT R11 Advanced Traffic and Demand Management NYSDOT - Island Expy and Brooklyn Queens Expy Travel Time Systems MTA Bridges and Tunnels - VN-03 NYCDOT-X80674-NYC
Association for Commuter Transportation Recommendations to USDOT on MAP-21 Performance Measures
 Association for Commuter Transportation 1341 G Street, NW, 10th Floor Washington, DC 20005 Tel: 202.719.5331 www.actweb.org Association for Commuter Transportation Recommendations to USDOT on MAP-21 Performance
CONCEPT OF OPERATIONS REGIONAL TRANSIT SIGNAL PRIORITY IMPLEMENTATION PROGRAM (RTSPIP) FOR THE DEVELOPED FOR:
 FOR THE DEVELOPED FOR:") CONCEPT OF OPERATIONS FOR THE REGIONAL TRANSIT SIGNAL PRIORITY IMPLEMENTATION PROGRAM (RTSPIP) DEVELOPED FOR: REGIONAL TRANSPORTATION AUTHORITY 175 W. JACKSON BLVD, SUITE 1650 CHICAGO, IL 60604 DEVELOPED
CONCEPT OF OPERATIONS FOR THE REGIONAL TRANSIT SIGNAL PRIORITY IMPLEMENTATION PROGRAM (RTSPIP) DEVELOPED FOR: REGIONAL TRANSPORTATION AUTHORITY 175 W. JACKSON BLVD, SUITE 1650 CHICAGO, IL 60604 DEVELOPED
Real-Time Monitoring System
 Real-Time Monitoring System The University of Oklahoma Hazem Refai, Ph.D. NATMEC June 5, 2012 Dallas, TX Outline: Motivation Brief Review of FHWA Section 1201 Real-Time System Management Information Program
CHAMPAIGN-URBANA-SAVOY REGIONAL ITS ARCHITECTURE
 CHAMPAIGN-URBANA-SAVOY REGIONAL ITS ARCHITECTURE FINAL REPORT March 2005 Prepared by: Champaign-Urbana Urbanized Area Transportation Study A Program of the Champaign County Regional Planning Commission
HORIZON 2030: Plan Projects November 2005
 Horizon PROJECTS 2030 Projects 10-1 10-2 The Horizon 2030 Project Information section is comprised of individual project information in alphabetical order by project name. The information provided for
Executive Summary. March 24, Prepared by: Copyright 2005 by Texas Department of Transportation. All rights reserved.
 State of Texas ITS Architectures and Deployment Plans Permian Basin Region Executive Summary Prepared by: March 24, 2005 068510017 Copyright 2005 by Texas Department of Transportation. All rights reserved.
APPENDIX B. Public Works and Development Engineering Services Division Guidelines for Traffic Impact Studies
 APPENDIX B Public Works and Development Engineering Services Division Guidelines for Traffic Impact Studies Revised December 7, 2010 via Resolution # 100991 Reformatted March 18, 2011 TABLE OF CONTENTS
Policy Research CENTER
 TRANSPORTATION Policy Research CENTER New Approaches to Transportation Management (Task 1) Congestion continues to be a challenge in Texas and throughout the United States, and it is increasing, leading
DRCOG CMAQ Benefits Study Methodology Guidelines for Data Parameters and Application to Projects
 DRCOG CMAQ Benefits Study Methodology Guidelines for Data Parameters and Application to Projects Prepared for Denver Regional Council of Governments Transportation Planning and Operations Prepared by September
ENTERPRISE Transportation Pooled Fund Study TPF-5 (231)
") ENTERPRISE Transportation Pooled Fund Study TPF-5 (231) Use and Impacts of Camera Images and Other Displays of Traveler Information EXECUTIVE SUMMARY Prepared by September 2013 Acknowledgements This document
ENTERPRISE Transportation Pooled Fund Study TPF-5 (231) Use and Impacts of Camera Images and Other Displays of Traveler Information EXECUTIVE SUMMARY Prepared by September 2013 Acknowledgements This document
Advanced Transportation Management System (ATMS)
") Advanced Transportation Management System (ATMS) Presentation to the ITS Technology Workshop for Municipalities February 15, 2017 ATMS Project Background Increasing traffic volumes Roadway network is near
Advanced Transportation Management System (ATMS) Presentation to the ITS Technology Workshop for Municipalities February 15, 2017 ATMS Project Background Increasing traffic volumes Roadway network is near
Executive Summary. October 27, Prepared by: Copyright 2003 by Texas Department of Transportation. All rights reserved.
 State of Texas Regional ITS Architectures El Paso Region Executive Summary Prepared by: October 27, 2003 068510009 Copyright 2003 by Texas Department of Transportation. All rights reserved. TABLE OF CONTENTS
Developing an Integrated Traffic Corridor in Santa Fe through Intelligent Transportation Infrastructure
 Worcester Polytechnic Institute Digital WPI Interactive Qualifying Projects (All Years) Interactive Qualifying Projects May 2014 Developing an Integrated Traffic Corridor in Santa Fe through Intelligent
State of Qatar ITS Architecture. Customized Service Package Diagrams. Advanced Traffic Management Systems (ATMS)
") State of Qatar ITS Architecture Customized Service Package Diagrams Advanced Systems (ATMS) ATMS01 - Network Surveillance traffic sensor control Ashghal Detectors traffic flow Use NTCIP for Cameras and
State of Qatar ITS Architecture Customized Service Package Diagrams Advanced Systems (ATMS) ATMS01 - Network Surveillance traffic sensor control Ashghal Detectors traffic flow Use NTCIP for Cameras and
SIEMENS CONCERT: City of Seattle
 SIEMENS CONCERT: City of Seattle Use of ATMS to Enhance and Extend Signal Operations Abstract: Today s signal systems are part of a complex environment that includes varied and disparate data sources and
Intelligent Transportation Systems
 Intelligent Transportation Systems TABLE OF CONTENTS Introduction... 3 Background... 3 Existing Conditions... 4 Traffic Signals... 4 Transit... 6 Parking... 6 Staffing... 7 Best Practices... 8 Recommendations...
Changing to an Operations-Based Approach of Managing ITS. Bob Edelstein and Dan Corey
 Changing to an Operations-Based Approach of Managing ITS Bob Edelstein and Dan Corey For a Great Webinar Mute Your Phone Until Instructed Do Not Place Your Phone on Hold Participate Ask Questions Through
Integrated Corridor Management --An Overview --
 Integrated Corridor Management --An Overview -- Neil Spiller FHWA Office of Operations Program Manager: ICM KBPS video 1 Integrated.. combining or coordinating separate agencies so as to provide a harmonious,
Intelligent Movement of Goods Will Trucks/Trains be able to Operate More Efficiently?
 Intelligent Movement of Goods Will Trucks/Trains be able to Operate More Efficiently? UCLA Lake Arrowhead Symposium October 2008 Lawrence Jesse Glazer FHWA Calif. Division Office Jesse.Glazer@fhwa.dot.gov
MESSAGE STANDARDIZATION ON VARIABLE MESSAGE SIGNS (VMS) Simon Trépanier, Eng. Ministère des Transports du Québec
 Simon Trépanier, Eng. Ministère des Transports du Québec") MESSAGE STANDARDIZATION ON VARIABLE MESSAGE SIGNS (VMS) Simon Trépanier, Eng. Ministère des Transports du Québec simon.trepanier@mtq.gouv.qc.ca Presentation prepared for the Session on Innovation in traffic
MESSAGE STANDARDIZATION ON VARIABLE MESSAGE SIGNS (VMS) Simon Trépanier, Eng. Ministère des Transports du Québec simon.trepanier@mtq.gouv.qc.ca Presentation prepared for the Session on Innovation in traffic
Memphis MPO Regional ITS Architecture Update. Stakeholder Workshop June 6, 2018
 Memphis MPO Regional ITS Architecture Update Stakeholder Workshop June 6, 2018 Workshop Overview Welcome and Introductions Overview of the Regional ITS Architecture Review of Regional ITS Needs Review
Scope of Services Traffic Signal Retiming Contract FM NO Florida Department of Transportation District Four
 Scope of Services Traffic Signal Retiming Contract FM NO. 230017-8-32-01 Florida Department of Transportation District Four A-1 Contents 1. Background... 3 2. Summary of Services... 3 3. Consultant Requirements...
ITS and Work Zones. ARTBA Work Zone Conference November Tracy Scriba FHWA Office of Operations Work Zone Team
 ITS and Work Zones ARTBA Work Zone Conference November 2004 Tracy Scriba FHWA Office of Operations Work Zone Team Presentation Outline What is Work Zone ITS? Why Use It? Examples of Applications FHWA WZ
Fargo-Moorhead Traffic Operations Center. Project ITS Architecture: Centralized TOC. Version 1.1
 NDSU Dept #2880 PO Box 6050 Fargo, ND 58108-6050 Tel 701-231-8058 Fax 701-231-1945 www.ugpti.org www.atacenter.org Fargo-Moorhead Traffic Operations Center Project ITS Architecture: Centralized TOC Version
Dallas Integrated Corridor Management
 Dallas Integrated Corridor Management August 26, 2014 Ahmad Sadegh, Ph.D. Schneider Electric US 75 Corridor Networks Freeway with continous Frontage Roads Managed HOV lanes Dallas North Tollway 167 Miles