Greater Wellington Regional Council 2013 WTSM Update. Technical Note 9: WPTM 2013 Validation. July 2015
|
|
|
- Quentin Merritt
- 5 years ago
- Views:
Transcription

.")
1 Greater Wellington Regional Council 2013 WTSM Update Technical Note 9: WPTM 2013 Validation July 2015 TDG Ref: tn9 wptm 2013 validation v4 (etm data removed).docx
2 Greater Wellington Regional Council 2013 WTSM Update Technical Note Quality Assurance Statement Prepared by: Geoffrey Cornelis GWRC Reviewed by: Julie Ballantyne TDG Approved for Issue by: Julie Ballantyne TDG Status: Final Date: 1 July 2015 PO Box , Lower Hutt 5040 New Zealand P: TN9 WPTM 2013 Validation v4 (ETM data removed).docx
3 Technical Note 9: WPTM 2013 Validation Table of Contents 1. Introduction Methodology Demand and Assignment Validation GWRC Monthly Passengers Counts Kiwirail Guard Counts Volumes at Wellington Station CBD Cordon Survey Rail Screenline Volumes Rail Boardings Counts per Line Bus CBD Cordon Counts Bus Screenline Volumes Bus Boardings per Route Conclusion Appendix A WPTM Update to 2013 A.1 Introduction... 1 A.2 Summary of WPTM 2011 Process... 1 A.3 Options for Producing 2013 WPTM Demand... 1 A Observed Changes... 4 A.5 Summary and Recommendations... 7 Appendix B ETM Comparison B.1 Introduction... 1 B.2 Metlink Monthly Patronage... 1 B.3 Fare Zones Origin and Destination... 2 B.4 Sector Origin... 3 B.5 Sector Destination... 4 B.6 Sector to Sector Matrices... 4 B.7 Ticket Types... 5 B.8 Conclusion... 6
4 Technical Note 9: WPTM 2013 Validation Page 1 1. Introduction This technical note documents the validation of the Wellington Public Transport Model (WPTM) as part of the 2013 update of the model. The validation process ensures that the WPTM is a good representation of observed public transport patterns in the base year 2013, by comparing output from the model against a range of observed criteria. However it must be noted that the update of the model to 2013 conditions was a limited exercise, due to the short two year period since the model had been developed, and the fact that very little change had occurred in terms of both observed public transport demand and supply. In addition to the update of the transport network shared with the Wellington Transport Strategy Model (WTSM) detailed in TN3 Development of base year networks and the update of economic parameters detailed in TN5 Model input parameters, the only adjustments that were made were a factoring of rail demand per line to account for the minor changes in patronage that had been observed. More details on measured changes in public transport patterns for the 2011 to 2013 period and on the resulting rationale behind this limited update of the model have been recorded in two separate technical notes which are included in Appendices A and B. As the model is a representation of an average March 2013 weekday to coincide with the 2013 census, observed data used in the validation was sourced for this period as much as possible. When data for other time periods was used, it was adjusted accordingly to match with usual March conditions. This process is explained in more detail in TN1 Data Collection.
5 Technical Note 9: WPTM 2013 Validation Page 2 2. Methodology This report does not intend to replicate all validation measures that were presented in the previous calibration / validation report from the 2011 development of WPTM ( TN19 WPTM Calibration and Validation ). This is due to the following reasons: The validation for the 2011 WPTM was reported for all steps in the development of the model (base input matrices development, access choice model, full model with final assignment) to give the reader an understanding of the process and level of validation at each given step. In the present case however, this report documents a more limited update of the model and as a result only the final validation for the full model is reported. In addition, a lot of the data that was used in the calibration / validation of the 2011 WPTM was collected specifically for the development of the model. This included extensive rail and bus on board surveys, rail platform surveys, as well as detailed Electronic Ticketing Machine (ETM) data for March No such data was available this time around, so some components of the model could not be checked. This was not considered to be an issue due to the short period since the model was developed and the very limited apparent changes in terms of actual public transport patterns. The following table details the validation criteria that were reported in the 2011 WPTM validation report but that are not included in this technical note, as well as the reason why they were omitted. Criteria PT network supply Bus travel time comparison Rail boarding and alighting graphs Trip purpose, car availability and age split Access and egress trip length distribution All access choice measures Bus vs walk from Wellington rail station Assigned route Reason for omission Shared with WTSM, reported in TN3 Development of base year networks Shared with WTSM, reported in TN8 WTSM 2013 validation These have not been resurveyed. Comparison would therefore be largely identical to the 2011 model as both observed and modelled would be factored by the same amount to Not resurveyed for 2013 Not resurveyed for 2013 Not resurveyed for These include access mode split, distance distribution, station catchment areas. Not resurveyed for 2013 This was included in 2011 due to the new network and bus transit time calculation. However, the network is virtually identical and transit time functions are unchanged for 2013, high level checks show very little changes. Table 1: Omitted Validation Criteria Other criteria for which observed data was available are however reported in the following section. Again, due to only two years having passed since the model development and the
6 Technical Note 9: WPTM 2013 Validation Page 3 very small change in observed movements during this period, it is estimated that these comparisons are sufficient to demonstrate that the 2013 WPTM is a good representation of observed public transport patterns in the region.
7 Technical Note 9: WPTM 2013 Validation Page 4 3. Demand and Assignment Validation 3.1 GWRC Monthly Passengers Counts The first source of data used for the validation of WPTM is the GWRC monthly patronage counts, showing the total number of boardings per month separately for rail and bus. The figures from 2013 were obtained from the Metlink website and the same methodology as in the 2011 update was used to convert these to weekday two hourly values. The observed monthly total was obtained by averaging all months from The resulting monthly counts were then reduced using the following formula: AM/IP trips = (Monthly total trips) * (weekday trips as % of weekly trips) (Average weekdays in month) * (% of weekday trips in the AM / IP period) Factors from the 2011 update calculated using the ETM data for bus and rail guard counts for rail were used. The resulting values are shown in Table 2 below. These are not meant to represent exact volumes but rather should be taken as an indication of magnitude. In this respect, modelled numbers appear to be in the right range. Mode Observed Average Monthly Total Observed (factored) AM Modelled Difference Observed (factored) IP Modelled Difference Rail 947,222 12,496 12,816 3% 1,834 1,215 34% Bus 1,966,194 17,407 17,848 3% 7,070 5,881 17% Total 2,913,416 29,903 30,664 3% 8,904 7,096 20% Table 2: GWRC Monthly Passenger Counts vs all Modelled Trips 3.2 Kiwirail Guard Counts Volumes at Wellington Station Modelled inbound volumes at Wellington station were also compared against rail guard counts obtained from Kiwirail, which was assumed to be equivalent to the number of passengers arriving at the station. This was done for each line separately and for the AM peak. Guard count data from February to June 2013 was used and averaged. The results are shown in Table 3.
8 Technical Note 9: WPTM 2013 Validation Page 5 Line KiwiRail Volume at Wellington Station Difference JVL 1, % HVL / MEL / WRL 5,399 5,430 1% KPL / CC 4,722 4,906 4% Total 11,233 11,281 0% Table 3: Kiwirail guard Counts, AM Peak Inbound Only 3.3 CBD Cordon Survey The total number of PT users entering the CBD during the morning peak was also compared with the annual CBD cordon survey, carried out in March Observed values were factored to an average month. Results by mode and overall show a good fit and are well within the validation criterion used for the development of WPTM of +/ 15%. The only exception is the cable car, which only carries a very small number of passengers and is mostly aimed at tourists, therefore not driven by time and costs considerations as other users of the public transport network. Mode Cordon Count Modelled Assignment Difference Rail 10,970 11,282 3% Bus 9,951 9,278 7% Ferry % Cable Car % Total 21,242 20,769 2% Table 4: CBD Cordon Modelled vs Survey AM Peak 3.4 Rail Screenline Volumes This section presents a comparison of observed and modelled rail passenger volumes across a number of screenlines in the region. These are the same screenlines used in the validation of the WTSM and are shown in Figure 1 and Figure 2. Screenlines without any rail volumes have been excluded. Fully observed volumes in 2011 were derived from the extensive rail surveys that were carried out for the development of the model, however this information was not available for the 2013 update. Results for each screenline were therefore based on 2011 volumes, factored to match with the observed growth for each line (Appendix A details how these factors were derived).
9 Technical Note 9: WPTM 2013 Validation Page 6 The results are detailed in Table 5 which shows the observed and modelled volumes as well as the percentage difference and the GEH, the standard empirical measure used to compare modelled flows against observed volumes.


10 LEGEND: Wellington Lower Hutt Upper Hutt Porirua Kapiti K1 P1 P3 P1 U1 W5 L2 U2 W4 L3 Wednesday, 17 June mm W3 W1 W6 L1 W2 L4 Screenlines SCALE: G:\ \ \11992 GWRC Model Scoping\Drawings\TN9\11992_C_1A.dwg


11 LEGEND: Wellington Lower Hutt W5 L2 W4 W3 20mm W1 W2 Wednesday, 17 June W6 Screenlines - Wellington City ---G:\ \ \11992 GWRC Model Scoping\Drawings\TN9\11992_C_2A.dwg 2 SCALE:
12 Technical Note 9: WPTM 2013 Validation Page 9 AM IP ID Dir. Observed Modelled Diff % GEH Observed Modelled Diff % GEH C1 In 11,480 11,282 2% % 5.48 C1 Out % % 7.16 C2 In 2,600 2,447 6% % 2.80 C2 Out 3,735 3,793 2% % 3.00 C3 In 2,674 3,023 13% % 1.42 C3 Out 4,367 4,460 2% % 2.06 C4 In % % 0.14 C4 Out 748 1,151 54% % 0.96 W4 NB % % 7.06 W4 SB 11,304 11,282 0% % 5.25 L1 NB % % 4.84 L1 SB 5,380 5,451 1% % 3.39 L2 NB % % 0.78 L2 SB 1,810 1,911 6% % 0.43 L3 EB % % 3.07 L3 WB 4,440 4,499 1% % 2.38 U2 NB % % 1.06 U2 SB 1,801 1,906 6% % 0.32 P1 NB % % 1.50 P1 SB 1,957 1,868 5% % 1.21 P3 NB % % 3.51 P3 SB 3,714 3,755 1% % 2.54 K1 NB % % 1.14 K1 SB % % 0.30 TOTAL 58,743 59,528 1% ,011 4,575 24% Table 5: Rail Passenger Volumes at Screenlines, Observed vs Modelled Unsurprisingly, values are generally very close to the 2011 model and show a good match to observed volumes, although the same issue with flows being too low overall that was noted during the 2011 development of WPTM is still present. For the AM peak however, the validation criterion used during the development of WPTM of screenlines being within +/ 15% of observed is satisfied. Table 6 shows the ranges of GEH values for each time period. The Transport Model Development Guidelines (TMDG) developed by NZTA specifies a target of 60% of screenlines achieving a GEH of 5 or less. As can be observed, this target is achieved for both periods and most GEH values are acceptable.
13 Technical Note 9: WPTM 2013 Validation Page 10 GEH AM IP # % # % < % 20 83% >5 1 4% 4 17% >10 0 0% 0 0% Table 6: Distribution of Rail Screenline GEH Values Scatterplots of modelled vs observed patronage by screenline are shown below, as well as the R 2 coefficient of determination. The recommended values in the TMDG are for the R 2 to be above 0.85 and the slope of the line of best fit to be between 0.9 and 1.1. These are satisfied for both time periods, with the exception of the slope of the line of best fit in the inter peak confirming the under estimation of rail patronage in this period. 14,000 12,000 10,000 y = x R² = Modelled 8,000 6,000 4,000 2, ,000 4,000 6,000 8,000 10,000 12,000 14,000 Observed Figure 3: AM Rail Screenlines, Modelled vs Observed y = x R² = Modelled Observed Figure 4: Inter peak rail Screenlines, Modelled vs Observed 3.5 Rail Boardings Counts per Line Table 7 summarises the total number of boardings per line (as opposed to Table 3 which showed only inbound volumes at Wellington station), comparing modelled boardings
14 Technical Note 9: WPTM 2013 Validation Page 11 against observed demand. Note that since no new surveys were carried out for 2013, 2011 observed numbers of boardings factored up to match growth were used. Results are again very similar to the 2011 WPTM, with most lines achieving a good fit. The only exceptions are the Hutt Valley and Johnsonville lines in the inter peak which are both too low, although this translates to small numbers. This was investigated during the development of the model and was found to be due to competition between bus and rail on these corridors. It was noted that although it would be possible to apply specific parameters to rectify the issue, such an adjustment was rejected as it would detract from the integrity of the model. Line Observed Boards AM Modelled Boards Diff Observed Boards IP Modelled Boards JVL (Johnsonville) 1, % % HVL (Hutt Valley), MEL (Melling), WRL (Wairarapa) KPL (Kapiti), CC (Capital Connection) Table 7: Total Rail Boardings by Line, Observed and Modelled Demand 6, % % 5, % % Diff 3.6 Bus CBD Cordon Counts Table 8 below compares modelled AM peak inbound bus volumes across the CBD cordon with values observed during the March 2013 survey (factored down to an average month). Links of CBD Cordon Cordon Counts Average Month Modelled Difference Oriental Parade % Cambridge Terrace 1,674 1,560 7% Elizabeth Street 1,720 1,829 6% Willis Street % Taranaki Street % Tinakori Road 1,099 1,043 5% Kelburn Parade % Murphy Street 1, % Thorndon Quay 2,000 2,134 7% Total 9,951 9,278 7% Table 8: CBD Cordon Bus Passengers, Observed vs Modelled, AM Peak Inbound Modelled volumes are close to the 2011 WPTM results. Cordon counts on the other hand vary by location compared with 2011, which is due to these surveys being only a snapshot of a single day in March and therefore showing quite a bit of natural variability from year to
15 Technical Note 9: WPTM 2013 Validation Page 12 year. The total observed volumes across the CBD cordon are consistent however, showing a slight increase of 2%. The end result in terms of validation is that some locations improve while others deteriorate slightly, but performance of the model is very close to the 2011 version of WPTM and is considered acceptable compared with observed. 3.7 Bus Screenline Volumes This section presents a comparison of observed and modelled bus passenger volumes across the same screenlines used for the rail validation, and in the validation of WTSM. Observed volumes have been extracted from March 2013 ETM data using a tool developed for this purpose. This is the same source of data used for the WTSM validation and more detail on the process to derive this data can be found in Section 6 of TN8 WTSM Validation. The results are detailed in Table 9 which shows the observed and modelled volumes as well as the percentage difference and the GEH, the standard empirical measure used to compare modelled flows against observed volumes. Due to the highly sensitive nature of ETM data in terms of confidentiality, some numbers have been removed. ID Dir. AM IP Observed Modelled Diff % GEH Observed Modelled Diff % GEH W1 OUT W1 IN W2 EB W2 WB W3 EB W3 WB W4 NB W4 SB W5 NB W5 SB L1 NB L1 SB L2 NB L2 SB L3 EB L3 WB L4 EB L4 WB
16 Technical Note 9: WPTM 2013 Validation Page 13 ID Dir. AM Observed Modelled Diff % GEH Observed Modelled Diff % GEH U2 NB U2 SB P1 NB P1 SB P2 EB P2 WB P3 NB P3 SB TOTAL 21,477 20,577 4% 4.4 6,972 7,199 3% 1.9 Table 9: Bus Passenger Volumes at Screenlines, Observed vs Modelled Again, results are in line with WPTM 2011 and the model achieves a similar level of validation. The main exception is for screenline L1 southbound, for which modelled volumes have been stable but observed volumes have more than doubled. This could be due to the different process used to derive observed volumes in 2011 and However the difference in bus patronage is relatively minor compared with total public transport demand in this corridor, with rail being by far the main public transport mode. Table 10 shows the resulting ranges of GEH values, while Figure 5 and Figure 6 show scatterplots of observed vs modelled patronage by screenline. In all cases, the model achieves suitable levels of validation, and meets the targets set by the TMDG. IP GEH AM IP # % # % < % 22 85% >5 5 19% 3 12% >10 2 8% 1 4% Table 10: Distribution of Bus Patronage by Screenline GEH Values 12,000 10,000 8,000 y = x R² = Modelled 6,000 4,000 2, ,000 4,000 6,000 8,000 10,000 Observed Figure 5: AM Bus Screenlines, Modelled vs Observed
17 Technical Note 9: WPTM 2013 Validation Page 14 2,500 2,000 y = 0.957x R² = Modelled 1,500 1, ,000 1,500 2,000 2,500 Observed Figure 6: Inter Peak Bus Screenlines, Modelled vs Observed 3.8 Bus Boardings per Route Figure 7 and Figure 8 below compare observed against modelled total boardings for each route and direction. Again, the observed data was extracted from the ETM data for March The R 2 value for the morning peak is above the target of 0.85, while the value for the interpeak is slightly below. This was also the case in the 2011 version of WPTM. The interpeak is considered to replicate observed to a sufficient level even with an R 2 slightly lower than the target Modelled y = x R² = ,000 Observed Figure 7: AM Boardings per Service, Modelled vs Observed
18 Technical Note 9: WPTM 2013 Validation Page y = x R² = Modelled Observed Figure 8: Inter Peak Boardings per Service, Modelled vs Observed
19 Technical Note 9: WPTM 2013 Validation Page Conclusion This technical note reported the performance of the WPTM updated to 2013 when validating against a number of observed patterns. As noted previously, this update of the WPTM was limited in scope, due to some of the observed data that was used for the 2011 development of the model not being available for 2013, and to the fact that observed public transport patterns showed very little changes during the 2011 to 2013 period. Nonetheless, this validation exercise aimed to confirm that the 2013 version of WPTM still provides a good representation of public transport use in the region when compared to a range of observed data: GWRC monthly passenger counts Kiwirail guard counts CBD cordon survey for all modes Rail screenline volumes Rail boardings per line Bus CBD cordon count, per corridor Bus screenlines volumes Bus boardings per route and direction In all cases, results were found to be consistent with the 2011 WPTM, and to validate well against observed data.
20 Technical Note 9: WPTM 2013 Validation Appendix A WPTM Update to 2013
21 Technical Note 9: WPTM 2013 Validation Page 1 A.1 Introduction This note discusses suggested approaches for updating the Wellington Public Transport Model (WPTM) to a 2013 base year, and enabling forecasting for 2023, 2033 and 2043 future years. It describes the suggested options for updating the model together with their pros and cons, summarises observed changes in PT patronage, network and fares between 2011 and 2013, and based on this information recommends the favoured approach. A.2 Summary of WPTM 2011 Process WPTM has been designed to run in conjunction with the Wellington Strategy Model (WTSM). The current process for running forecast scenarios with both models is illustrated in the figure below. WPTM Observed 2011 WTSM Base 2011 Base WPTM Forecast WTSM Forecast Test WPTM has been calibrated and validated against observed demand using various 2011 datasets (Electronic ticketing machine bus data, rail guard counts, on board and station surveys, etc), and therefore has a base year of 2011; To run future or alternative scenarios, two runs need to be undertaken in WTSM: a Base run, which essentially corresponds to the base 2011 year in WPTM, and a Test run, usually corresponding to a future year scenario; Both the Base and Test scenario demands then get passed onto WPTM, and are used to factor (or pivot ) the observed 2011 matrices to derive the WPTM forecast demand. As part of the 2013 update of WTSM, this model has been rebased to a new 2013 base year. The question arises then about how to update the Base demand in WPTM to preserve the link between both models. Three options are suggested, which are described in the next section. A.3 Options for Producing 2013 WPTM Demand Forecast Option In this option, the 2013 WPTM demand would be produced using the standard forecasting ability of WPTM, and would therefore be considered as a Test scenario (see figure overleaf).
22 Technical Note 9: WPTM 2013 Validation Page 2 WPTM Observed 2011 WTSM Base 2011 Base WPTM Forecast WTSM New Base Test Both 2011 and 2013 demands from WTSM would be passed on to WPTM to factor the observed 2011 demand and produce a forecast 2013 demand. Assignment and mode choice parameter files would need to be produced for the year 2013 to reflect the increase in fare and GDP / capita (for the value of time). The results can then be validated against 2013 data (CBD cordon, rail guard counts, and ETM data). Forecasting for future years (2023 / 2033 / 2043) would work the same as it currently does, and still be factored / pivoted from a 2011 WTSM/WPTM base. Pros Uses existing functionality of model, easy to implement Cons 2011 and 2013 WTSM based on different assumptions, especially land use resulting in quite different PT volumes (e.g. Hutt Valley line was 10% too low in 2011, 10% too high in 2013). This would result in large differences in WPTM 2013, which may not validate. Also would create artificial differences between 2011 and 2023 / 33/ 43 based on the different land use assumptions. Has to maintain a link with WTSM 2011 as it is still used as a base demand in WPTM Factor Option With this approach, the whole modelling system is overhauled from 2011 to This is already being completed for WTSM as part of the model update, and for WPTM this would be achieved by manually factoring the 2011 observed demand to match 2013 observed data. WPTM Observed 2011 Manual factoring 2011 to 2013 WPTM Factored 2013 WTSM Base 2013 Base WPTM Forecast WTSM Forecast Test
23 Technical Note 9: WPTM 2013 Validation Page 3 As with the previous option, increases in fares and GDP / capita (for the value of time) will be incorporated through assignment and mode choice parameters. With the whole modelling system rebased to 2013, forecasting would then work as it currently does but for future years 2023, 2033 and 2043 pivoted off 2013 demand. Pros Allows for taking into account observed changes in the period and helps with validation Whole modelling system rebased to 2013, no link to 2011 model anymore Consistency between Base and Test WTSM runs (same 2013 version of the model with same assumptions) Cons Manual adjustments, more labour intensive Adjustments may be superfluous if not significant observed changes (criteria to be agreed with peer reviewer) No Change Option This option is a simplified version of the Factor option. It assumes that no significant changes has occurred between 2011 and 2013, and therefore directly uses the WPTM 2011 observed demand as a replacement for 2013 Base (see figure below) with no adjustment. WPTM Observed 2011 WTSM Base 2013 Base WPTM Forecast WTSM Forecast Test Clearly this option can only be used if observed data shows that PT patronage and movements haven t changed significantly between 2011 and 2013, and that WPTM can validate in 2013 with no manual intervention. The fares and values of time would also need to be updated if necessary, although this is unlikely to have much impact on validation as the two year difference would be minimal. The WPTM observed 2011 demand would potentially be renamed as 2013 demand for consistency. Plus Whole modelling system rebased to 2013, no link to 2011 model anymore Consistency between Base and Test WTSM runs (same 2013 version of the model with same assumptions) Easiest and fastest option as no manual adjustments Minus Only possible if no significant observed changes between 2011 and 2013 (criteria to be agreed with the peer reviewer)

24 Technical Note 9: WPTM 2013 Validation Page 4 A Observed Changes The choice of a preferred option to update WPTM is dependent on how the public transport supply and demand have changed between March 2011 and March This section looks at how much the PT network, fare structure, and bus and rail patronage have changed during this period. PT Networks PT services in the 2013 WTSM and WPTM have been imported directly from the General Transit Feed Specification (GTFS) which contains all services for all modes in the region. This is exactly the same approach that was used in 2011 and comparison of networks for both years therefore allows evaluating changes in the regional network during this two year period. The figure below shows the difference in service frequency (measured in vehicles per hour) between 2011 and 2013 for the AM peak period, a good indication of how the PT supply has changed. Red indicates an increase, green a decrease. Figure A1: Change in veh / hour The figure shows that differences between both networks are minimal (no more than two vehicles/hour in most cases). All the larger differences are caused by routing issues in the 2011 network and by link differences between both road networks (link splits / merges). The outcome is the same for other time periods which are therefore not shown here. PT Fares The PT fare structure hasn t changed between 2011 and 2013, with the same zones, boundaries and rules still in place. All types of fares have increased slightly however, with
25 Technical Note 9: WPTM 2013 Validation Page 5 the uplift being slightly different depending on number of zones travelled or ticket type. The average increase across the whole fare structure is however about 6%. Bus Patronage The figure below shows observed inbound passenger counts from the Wellington CBD cordon count, undertaken each year in March during a weekday AM peak (7:00 9:00am). Values are shown for 2011 and 2013, as well as 2012 to identify trends from natural variations Mar 11 Mar 12 Mar Figure A2: Wellington CBD Cordon Bus Passengers Count (AM Peak) The total amount of inbound patronage was circa 12,600 in 2011, 12,750 in 2012 (+1%) and 12,600 in 2013 (+0%), so virtually no change during this two year period. Observed volumes on each main corridor show no real trend from year to year, with the possible exception of Murphy Street. The CBD cordon count is however only a snapshot of demand, being based on only two hours during a single weekday, and only looking at inbound demand to Wellington CBD. For this reason, monthly patronage totals from Metlink were also reviewed and extensive comparison using March 2011, 2012 and 2013 Electronic Ticketing Machine (ETM) data was undertaken. This analysis is detailed in a separate technical note ( ETM Comparison ) included in Appendix B but the main findings are summarised here. Raw Metlink monthly patronage shows large variations from month to month, but when accounting for the number of weekdays per month and looking at rolling averages, changes between March 2011 and March 2013, as well as the two months before and after are within 1%. The ETM data analysis compared March 2011, 2012 and 2013 boardings and alightings per fare zone (1 to 9) and per fare sectors as used in WPTM (A to E, Z) to look at originsdestinations in more detail. This was carried out for both the AM and inter peak, but only on Go Wellington services as data for other operators was not available. This was considered suitable as Go Wellington represents in the order of 85% of all bus boardings in the region. Again, the analysis showed no significant changes or clear patterns between 2011 and Proportion of the various passenger types (adult, children) were constant,
26 Technical Note 9: WPTM 2013 Validation Page 6 and the only clear trend for ticket type was an increase in the uptake of Snapper card, with a corresponding reduction in other payment, especially cash. Rail Patronage The CBD cordon count also includes the number of rail users alighting at Wellington station. This shows a significant increase of 8% between 2011 and 2012, and an increase of 12% between 2011 and Again, this is only a snapshot of total rail demand. Review of Metlink monthly patronage actually shows less than 1% difference between March 2011 and 2013 if accounting for the difference in number of weekdays, and both the annual rolling average and year to date for March 2013 are only 1% higher than The breakdown per line is shown in the table below. March Only Year to Date PPL 2% 5% HVL 2% 1% JVL 6% 5% WRL 6% 4% Total 0% 1% Table A1: Metlink Rail Patronage Changes These show that although the total demand growth has been virtually flat, there are notable differences when looking at rail lines separately, with the Kapiti and Wairarapa lines increasing by 4 6%, while the Hutt Valley and especially Johnsonville lines decrease. Ticket sales from Kiwirail were directly analysed, which confirmed the 1% increase for March 2011 to It also indicated that the only substantial change in terms of ticket types is a 21% increase in Gold pass users, resulting in a total share of ticket type increasing from 9.5% to 11.5%. Rail guard counts were also obtained from Kiwirail, showing detailed total volumes per train service and per day. For 2011, data was only available from June to October, so the same period was used for comparison for It still provides a valuable check regarding the changes in patronage per line, as well as giving the breakdown per peak/off peak period. Summary results are shown in the table below. Peak Off Peak All Day PPL 4% 2% 4% HVL 2% 2% 2% JVL 2% 0% 1% WRL 2% Total 3% 2% 3% Table A2: Kiwirail Guard Counts Changes
27 Technical Note 9: WPTM 2013 Validation Page 7 Although the total all day figure shows an overall larger increase than Table 1, with a 3% increase, the breakdown per line is similar: the Kapiti and Wairarapa lines increase the most, followed by the Hutt Valley line and Johnsonville still decreasing. Results for peak and off peak periods are consistent, with both periods showing similar levels of growth. A.5 Summary and Recommendations The changes in the public transport supply and demand between the March 2011 and 2013 periods can be summarised as follows: The public transport network in March 2013 is virtually identical to 2011; The fare structure is unchanged in terms of ticket types and fare zones, but there has been a general price increase of 6% on average, which can be considered consistent across all fare products; In terms of the usage breakdown for fare products, the only two notable changes are the increase in Gold pass users for rail, and the larger uptake of Snapper card for bus users. However, these translate to relatively small changes in the total make up of ticket types, with Gold pass increasing only from 9.5% to 11.5% of rail tickets, and Snapper use increasing from 69% to 73% of bus tickets during the AM peak (37% to 41% during the inter peak); Bus patronage hasn t experienced any significant changes between March 2011 and March 2013, with flat growth and no change in distribution. This is confirmed by the CBD cordon count, Metlink patronage data and extensive analysis of ETM data; Rail patronage for the same period shows only a 1% growth, shown in the Metlink patronage data and Kiwirail ticket sales data. This however varies by services, with the Kapiti and Wairarapa lines increasing by about 5%, whereas the Hutt Valley line and especially the Johnsonville line decrease. The same trends are shown by guard count data, although this is for the June November periods in 2011 and 2013 which shows a larger increase overall. CBD cordon counts show a different picture but for one day only, and this is not supported by the other datasets. Based on these, the pros and cons of each option and initial findings from the WTSM validation, the following recommendations were made. The Forecasting approach, while being simple to implement, has the disadvantage of keeping a link with the 2011 version of WTSM as a base demand. Comparison of initial 2013 and 2011 WTSM results has shown both models return quite different volumes on some corridors, especially for rail patronage (the reasons for these are detailed in TN7 Production of 2013 Land use Data ). This will therefore result in differences between the 2011 and 2013 demand for WPTM. While this is not necessarily an issue for WTSM as it is a synthetic model for which more leeway is acceptable (and indeed some of these differences actually improve with the validation of the model), WPTM is an incremental model based on observed data and therefore is expected to achieve better accuracy. Applying directly the 2011 to 2013 changes in WTSM to factor WPTM demand would result in abrupt changes in patronage
28 Technical Note 9: WPTM 2013 Validation Page 8 which haven t occurred in reality, and would only be caused by different assumptions between the versions of WTSM. The WPTM model would thus be unlikely to validate. The Forecasting approach is therefore not recommended to be used. Based on the very small observed changes in patronage between 2011 and 2013, the recommended option is either No Change, or a simple Factor approach with only rail demand factored to match growth (or decrease) observed on each line as shown in Table A1. As a result, the 2011 demand would effectively be unchanged and used as is for 2013, with potentially the rail matrices factored after being imported into WPTM. In any case, a number of other slight modifications will have to be undertaken to fully update WPTM to 2013: Values of time to be increased in line with WTSM. This will have a very limited impact as it will be minor compared with other planned adjustments to the WPTM values of time (unit correction, resource cost correction, and switch to modal equity based) which have been documented separately in Appendix A of TN5 Model input parameters ; Fares to be increased across the board. To be consistent with WTSM, the nominal 6% increase needs to be discounted based on Consumer Price Index, resulting in a real 2011to 2013 increase of 3%. This is unlikely to have any impact as only the differential between PT modes is of importance in WPTM; The potential changes in average fare structure due to increase in Gold pass and Snapper use is not deemed likely to have a significant impact as it only results in small changes to the make up of fare products and has a limited effect on the differential between bus and rail costs. This can however be investigated in more detail if necessary, although the spreadsheets used in the initial WPTM fare calculations will have to be sourced; Car ownership for 2013, used to separate demand into "car available" and "non car available" segments will need to be updated.
29 Technical Note 9: WPTM 2013 Validation Appendix B ETM Comparison
30 Technical Note 9: WPTM 2013 Validation Page 1 B.1 Introduction This note details the analysis carried out using Electronic Ticketing Machine (ETM) information to compare bus patronage volumes and patterns for March 2011 and March The aim of this analysis is to estimate how much bus patronage has changed in the Wellington region during this period, in order to inform the choice of most appropriate approach to update the Wellington Public Transport Model (WPTM) representation of bus demand. Ticketing information for March 2011 comes from the original ETM data that was used for the development of the WPTM matrices. Data for 2013 was obtained from the data cube set up by the Public Transport department within GWRC, which allows interrogation of ETM data on a centralised server. As a result, there is the potential for some inconsistencies or differing definitions between both sets of data. Only Go Wellington services were assessed in this analysis, as ticketing data for other regional operators (Mana) is not available internally. However, investigation from the 2011 WPTM development 1 has shown that Go Wellington represents in the order of 85% of all bus boardings in the region so the exclusion of this dataset is not considered significant. B.2 Metlink Monthly Patronage Before looking at ETM boardings, patronage data from the Metlink website 2 was examined for preliminary checking, to investigate if the total patronage for March 2013 was significantly different from March Results showed that monthly boardings for March 2013 were 11% lower than March To understand if this was part of a trend or an outlier, results for the two months before and after March were compared, as well as the annual rolling average to each month for both 2011 and Results are shown in the table below. MONTHLY PATRONAGE ANNUAL ROLLING AVERAGE TO MONTH Month % Difference % Difference January 1,407,474 1,346,954 4% 24,035,359 23,863,273 1% February 1,905,876 1,985,454 4% 23,979,466 23,835,260 1% March 2,156,225 2,420,297 11% 23,976,203 23,792,963 1% April 1,933,240 1,856,546 4% 23,899,266 23,787,385 0% May 2,248,618 2,285,733 2% 23,695,750 23,861,753 1% Table B1: Total PT Patronage from MetLink Website Comparison of 2011 and 2013 monthly patronage showed that there was no clear trend when comparing 2011 and 2013, with some months increasing and decreasing, but for all of them except March the variation is less than 4% in absolute terms. Analysis of the annual rolling average confirmed that annual patronage between 2011 and 2013 has varied by no more than 1% in absolute terms. 1 TN7: Public Transport Matrix Development 2 services/public transport facts and figures/patronage/

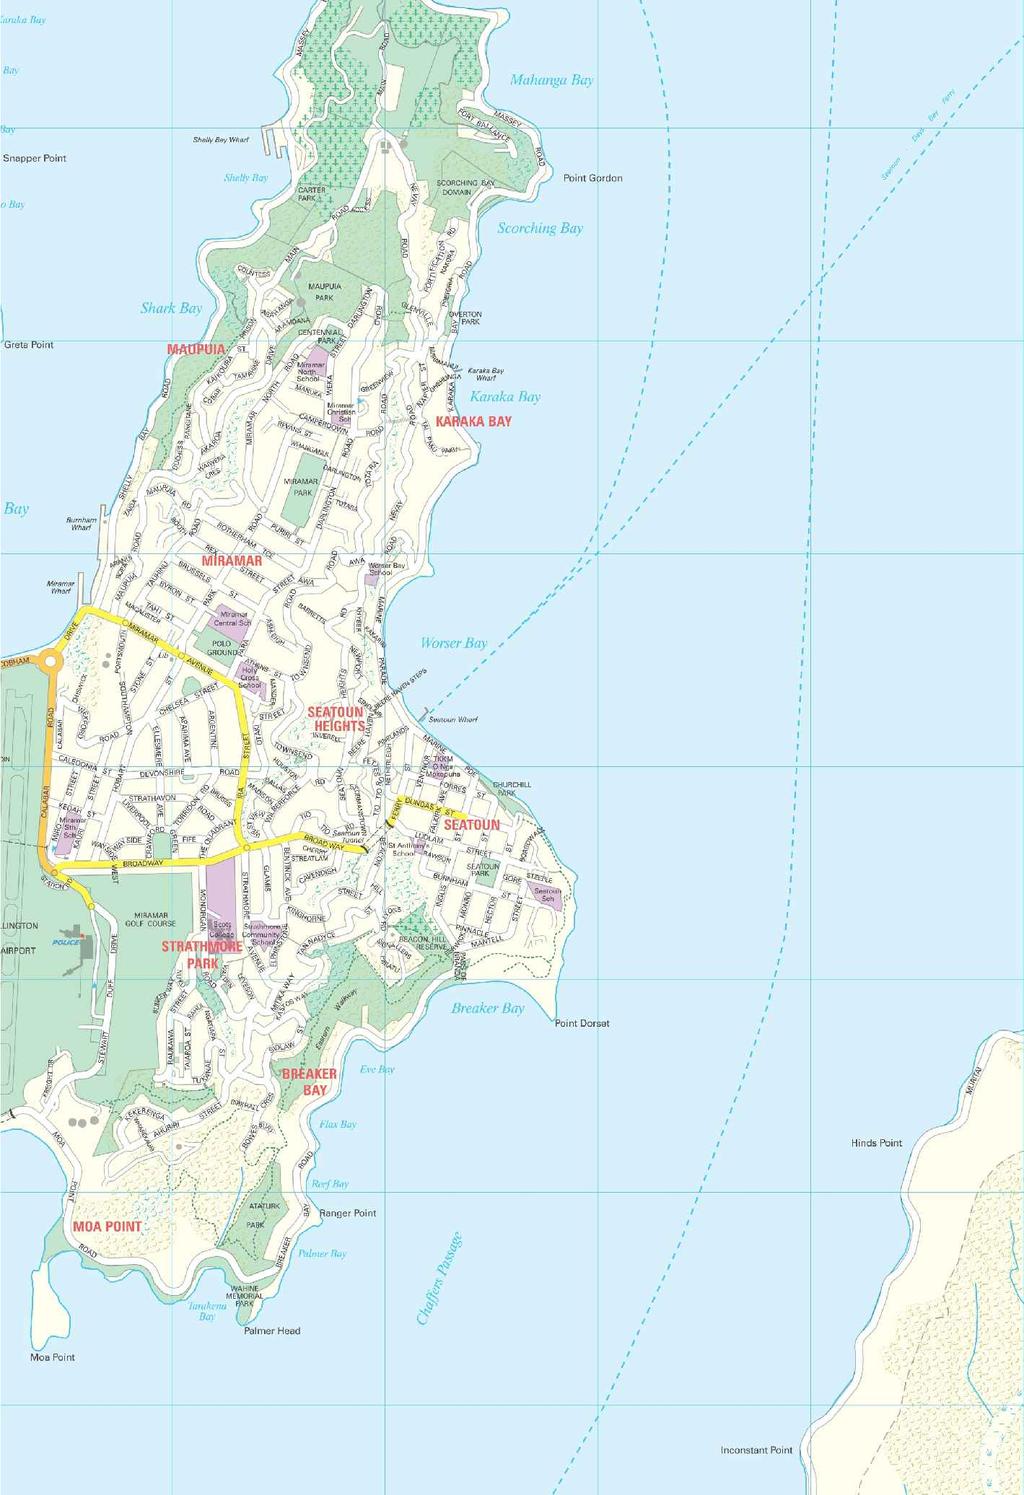
31 Technical Note 9: WPTM 2013 Validation Page 2 The most likely explanation for the large difference in boardings for March is that March 2011 had 23 weekdays, which experience significantly more patronage than weekend days, whereas March 2013 only had 21. This accounts for 9% less weekdays, which would therefore explain most of the difference between these two years. This in turn leaves only a small decrease in boardings between March 2011 and 2013, which is likely to be due more to month to month fluctuations than any sort of trend. Based on this analysis, it was therefore considered that more detailed comparison between March 2011 and March 2013 using ETM data was warranted, as long as it was ensured that ticketing data for the same number of weekdays was extracted for both years to compare like with like. B.3 Fare Zones Origin and Destination The 2011 ETM data used for the development of WPTM covered the period between Monday 28 February 2011 to Friday 25 March, i.e. 4 weeks or 20 weekdays. The period from Thursday 28 February 2013 to Wednesday 27 March was therefore used for extracting patronage data from the Public Transport data cube. Boarding numbers from a corresponding period in 2012 were also extracted to help distinguish natural variations from potential trends. Ticketing information both from the 2011 set of data provided by NZ Bus and from the data cube includes information on the fare zone where someone boarded a bus, and if using electronic payment (e.g. Snapper card) information on the fare zone where the person alighted the bus. The latter is however not available for other types of payment, including cash payment. This information only includes the fare zone as per the Metlink zoning (i.e. zones 1 to 14, see figure to the right and Metlink website for more details). It does not provide more information as to where in the zone the trip started or finished. As an example, this means that trips from Newlands cannot be distinguished from trips from Miramar. The data was however used to develop matrices showing trips between fare zone origin and destination for 2011, 2012 and Analysis of these matrices showed that the trip distribution was similar for all years with no major changes at an O D level. There was some variation occurring between each year, especially for O Ds with small numbers of trips, but it appears to be mostly monthto month fluctuation and showed no consistent trends between and Due to the highly sensitive nature of ETM data in terms of confidentiality, some numbers and figures have been removed.
 are shown in the following figures. Due to the highly sensitive nature of ETM data in terms of confidentiality, some numbers and figures have been removed.")
32 Technical Note 9: WPTM 2013 Validation Page 3 The matrices are not shown in this note, but the total numbers of boardings and alightings in each zone for the examined periods and during the morning peak (7:00am 9:00am) are shown in the following figures. Due to the highly sensitive nature of ETM data in terms of confidentiality, some numbers and figures have been removed. These results show that there is little variation for all years when looking at boardings per fare zone is generally slightly lower than 2011 (this is confirmed when looking at total boardings from the ETM data) but the distribution per zone is virtually identical for all three years. The same largely applies for alighting, with the exception of the blank categories, which show a gradual decline every year. This is due to a diminishing share of patrons paying by cash (for whom the alighting stop is not recorded) as the use of Snapper card becomes more prevalent. This is discussed in more detailed later in this note. The only notable difference is in alightings for zone 1 which increase by almost 20% between 2011 and 2012, but this is potentially due to more alightings being recorded through the use of Snapper card. Results for the inter peak are similar and are therefore not presented in this note. B.4 Sector Origin Although analysis in the previous section showed that there was little variation in boarding and alighting per fare zone, it was deemed important to investigate if there had been changes in demand in more detail geographically, i.e. separating demand from the north, south, etc. For this purpose, the sectors used during the development of WPTM were used. These are based on zones 0 to 14 from the Metlink fare zone system, but with further disaggregation per corridor. The resulting sector system is shown in the figure to the right. Due to the highly sensitive nature of ETM data in terms of confidentiality, some numbers and figures have been removed.
33 Technical Note 9: WPTM 2013 Validation Page 4 Total boardings per combination of sector and fare zone (e.g. Z0, C2, etc) were extracted. These are shown in the graphs below for the AM peak, together with the total for each sector (A, B, C etc) are again generally lower than the two previous years but results are relatively consistent, with no major variation for the combination of sector and fare zone, or at a sector level. The main difference in absolute terms is for sector A which shows a 5% decrease between 2011 and 2013, but this does not appear to be part of a trend as 2012 was 1% higher than The same analysis was undertaken for the inter peak (11:00am to 1:00pm), which is shown in the figures below. In the inter peak, results again show no major variation, although sector E does increase by 14% in 2012, and 20% in 2013 compared with On the other hand, boardings in zone Z decrease consistently between 2011 and 2013, by a small relative change but which translates to about 2,000 less passengers in 2013 than It is hard to determine from this data if these changes are trends but they must be taken into account when deciding how to update the representation of bus demand in WPTM. Due to the highly sensitive nature of ETM data in terms of confidentiality, some numbers and figures have been removed. B.5 Sector Destination The same analysis that was carried out for boardings was undertaken for alightings, again comparing patterns from the original March 2011 ETM data to information extracted from the GWRC PT data cube for March 2012 and Results are illustrated in the figures below. Due to the highly sensitive nature of ETM data in terms of confidentiality, some numbers and figures have been removed. As can be expected, a large majority of trips alight in sector Z, particularly Z0 which is the Golden Mile. Patterns are similar for all years, although there is a gradual decrease of trips alighting in sector A, and an increase in sectors D and Z. This increase is likely to be at least partly due to more people using Snapper card in 2013 than 2011 and therefore having their alighting stop recorded (see Section 2) in 2013 whereas they didn t in B.6 Sector to Sector Matrices Finally, sector to sector trip matrices were produced, linking the boardings to alightings. These showed some slightly more pronounced variation when looking at a more detailed level (i.e. sector + fare zones). This was particularly the case between the 2011 data and
34 Technical Note 9: WPTM 2013 Validation Page 5 the data, which would indicate that these variations may be caused by some changes in definitions between the two datasets, for examples some inconsistencies between fare zone attributes for some bus stops. More investigation would be needed to pinpoint the cause of this variation, but for the purpose of this exercise it was determined that it would not impact on the main findings. In order to show the variations in travel patterns between sectors, the share of each origindestination as a percentage of the whole demand is shown in the tables below for all three years for the morning peak. Due to the highly sensitive nature of ETM data in terms of confidentiality, some numbers and figures have been removed. Due to the highly sensitive nature of ETM data in terms of confidentiality, some numbers and figures have been removed. Due to the highly sensitive nature of ETM data in terms of confidentiality, some numbers and figures have been removed. As can be observed, the patterns are very similar from 2011 to The only meaningful differences are the decrease in unknown destination, again caused by more people using Snapper Card, and the gradual increase in trips to sector Z. As mentioned in Section B5, it is likely that these two changes are linked, as most trips during the AM peak alight in sector Z. Findings for the inter peak were again similar so they are not shown in this note. B.7 Ticket Types Finally, ticket sales per type were compared between the March 2011 and March 2013 datasets, for both the AM and inter peak. Results are shown in the graphs below, and confirm that the main change is an increase in uptake of Epurse use (i.e. Snapper card) to the detriment of other types, especially cash payment.
35 Technical Note 9: WPTM 2013 Validation Page 6 Due to the highly sensitive nature of ETM data in terms of confidentiality, some numbers and figures have been removed. B.8 Conclusion Analysis of the ETM data confirmed travel patterns in March 2013 were generally similar to those in March Where small differences were noted, no trend was discernible. The increasing use of Snapper Card results in an apparent change in the pattern of alightings in some cases but this is because there is more observed data in 2013 compared with Overall, it was concluded that travel patterns on public transport were similar in March 2013 to March 2011.
Wellington Transport Models
 Date: December 2012 Wellington Transport Models TN22: WPTM Sensitivity Testing prepared for Greater Wellington Regional Council Prepared By Harriet Priddey (Arup) Marius Roman (Arup) Opus International
TN18 WTSM Calibration and Validation
 TN18 WTSM Calibration and Validation Date: December 212 Wellington Transport Models TN18 WTSM Calibration & Validation prepared for Greater Wellington Regional Council Prepared By Opus International Consultants
Wellington Transport Models. Model Investigation Report
 Contract C3079 Wellington Transport Models WTSM update and WPTM development Wellington Transport Models Model Investigation Report Prepared By Dan Jones / Andy Wilson EMME modellers Opus International
Public Transport fares review - consultation
 Report 17.269 Date 2 August 2017 File IFT-10-180 Committee Author Sustainable Transport Committee Paul Kos, Manager Public Transport Planning Public Transport fares review - consultation 1. Purpose To
Tours-Based LUTI Modelling
 Tours-Based LUTI Modelling Leicester and Leicestershire Integrated Transport Model Mark Dazeley, Associate Director 16 th October 2014 Presentation Structure Introduction Team technical skills, clients
ACCURACY OF TRAFFIC COUNT DATA USED FOR CALIBRATION AND VALIDATION OF HIGHWAY MODELS
 ACCURACY OF TRAFFIC COUNT DATA USED FOR CALIBRATION AND VALIDATION OF HIGHWAY MODELS Reza Tolouei BEng MSc PhD MCIHT (corresponding author) Principal Consultant AECOM AECOM House 63-77 Victoria Street
Zenith Model Recalibration and Validation Version Review of VISTA. February Public Transport Victoria
 Zenith Model Recalibration and Validation Version 3.0.0 Review of VISTA February 2014 Public Transport Victoria Page Intentionally Left Blank Review of VISTA Draft Report Project No. ZML-VIC-Year4 COPYRIGHT:
New Zealand Bus Policy Model February NZ Transport Agency research report 472
 New Zealand Bus Policy Model February 2012 NZ Transport Agency research report 472 New Zealand Bus Policy Model February 2012 Ian Wallis and Daan Schneiders Ian Wallis Associates Ltd NZ Transport Agency
5 Kapiti Coast: Community, Transport and Travel Behaviour
 5 Kapiti Coast: Community, Transport and Travel Behaviour 5.1 Population Of all territorial authorities in the region, Kapiti Coast has the highest population. It also has the fourth highest population
WELLINGTON TRANSPORTATION MODELLING STEERING GROUP SUMMARY OF INVESTIGATIONS
 WELLINGTON TRANSPORTATION MODELLING STEERING GROUP Document Control File name = North Wellington Transportation Modelling Steering Group Report Final 1 st March 2016 Primary Author: Andrew Ford, Greater
Appendix B5 PT Model Validation
 Appendix B5 PT Model Validation PT Model Validation Report Sheffield and Rotherham Public Transport Model Report for Sheffield City Council August 2009 Document Control Project Title: MVA Project Number:
The Auckland Transport Models Project - Overview and Use to Date -
 The Auckland Transport Models Project - Overview and Use to Date - John Davies (Auckland Regional Council) Jojo Valero (Auckland Regional Council) David Young (David Young Consulting) Auckland Transport
Wellington Regional Rail Plan
 Wellington Regional Rail Plan 2010-2035 'A Fresh Look at a Better Rail Experience' 2013 Revised Edition A six- car Matangi train crosses the Ngauranga Gorge. The first two-car unit has enough capacity
Part Two. Rhona Hewitt, Manager Bus & Ferry Operations. Marketing & Customer Information. Paul Kos
 Part Two Agenda Item Presenter Procurement Approach Fleet Strategy Assets Integrated Fares & Ticketing Marketing & Customer Information Performance Management General Contract Approach Wrap up and next
report Smart Growth - Refined Transport Modelling
 report Smart Growth - Refined Transport Modelling report Smart Growth - Refined Transport Modelling Prepared for Smart Growth By Beca Carter Hollings & Ferner Ltd November 2002 8111359/210 Rev A L1:90421
Transport Model for Scotland. Kevin Lumsden MVA
 1. INTRODUCTION Transport Model for Scotland Kevin Lumsden MVA Transport Model for Scotland (TMfS) is a multi-modal transport demand and assignment model with an interactive Land Use model. The model area
WELLINGTON NORTHERN CORRIDOR. Project Summary Statement 21 December 2009
 WELLINGTON NORTHERN CORRIDOR Project Summary Statement 21 December 2009 1 Table of Contents 1. Purpose of Document 2. Strategic Context 3. Benefits 4. Project Scope and Economics 5. Implementation Plan
N4 Collooney to Castlebaldwin Road Scheme
 Traffic Analysis Brief of Evidence N4 Collooney to Castlebaldwin Road Scheme Presented by: Declan Keenan and Shane Dunny of AECOM Designer AECOM Lower Ground Floor Grand Canal House Upper Grand Canal Street
APPENDIX TRAVEL DEMAND MODELING OVERVIEW MAJOR FEATURES OF THE MODEL
 APPENDIX A TRAVEL DEMAND MODELING OVERVIEW The model set that the Central Transportation Planning Staff (CTPS), the Boston Region Metropolitan Planning Organization s (MPO) technical staff, uses for forecasting
Public Transport signage and information
 Report 13.728 Date 6 August 2013 File TM/01/08/01 Committee Author Economic Wellbeing Committee Alice Wills Johnson, Team Leader, Marketing and Information Public Transport signage and information 1. Purpose
2. DISTRIBUTION AND MODE CHOICE SUB-MODELS
 26 th Australasian Transport Research Forum Wellington New Zealand 1-3 October 23 DIFFICULT EXPERIENCES AND INNOVATIVE FEATURES OF THE WELLINGTON TRANSPORT STRATEGY MODEL DEVELOPMENT: TRIP DISTRIBUTION,
Proposed Petone to Grenada Link Road Options
 Report 15.41 Date 2 March 2015 File TP/03/29/02 Committee Author Regional Transport Committee Chris Upton, Chair Chief Executives Forum Proposed Petone to Grenada Link Road Options 1. Purpose This report
commuting Transport Calculator
 commuting Mass Transport Calculator Guide June 2009 TABLE OF CONTENTS 1.0 INTRODUCTION 3 2.0 DIFFERENCES BETWEEN GREEN STAR RATING TOOLS 3 3.0 HOW THE CALCULATOR WORKS 3 3.1 Definition of Terms used in
TRANSPORTATION MASTER PLAN DRAFT A TARGET TRANSIT MODE SHARE STRATEGY TECHNICAL MEMORANDUM # 1
 TRANSPORTATION MASTER PLAN DRAFT A TARGET TRANSIT MODE SHARE STRATEGY TECHNICAL MEMORANDUM # 1 16 FEBRUARY 2010 TABLE OF CONTENTS 1 INTRODUCTION... 1 2 EXPERIENCE With target transit mode shares... 2 2.1
Methodological Approach
 Appendix B Methodological Approach This section sets out the methodology which was utilised in the production of this analysis. It is informed by international literature and knowledge of the Irish transport
Woodburn Interchange Project Transportation Technical Report
 Final Report Woodburn Interchange Project Transportation Technical Report Prepared for Oregon Department of Transportation April 212 Prepared by DKS Associates Contents Methodologies... 4 Volume Development...
Improving Urban Mobility Through Urban Analytics Using Electronic Smart Card Data
 Improving Urban Mobility Through Urban Analytics Using Electronic Smart Card Data Mayuree Binjolkar, Daniel Dylewsky, Andrew Ju, Wenonah Zhang, Mark Hallenbeck Data Science for Social Good-2017,University
TABLE OF CONTENTS PAGE NUMBER. Executive Summary Why Variable Pricing? What Was Studied? User Surveys Air Quality Analysis User And Equity Analysis
 TABLE OF CONTENTS PAGE NUMBER Executive Summary Why Variable Pricing? What Was Studied? User Surveys Air Quality Analysis User And Equity Analysis Findings Scenario 1 Base Case Scenario 2 Detoll Scenario
9. TRAVEL FORECAST MODEL DEVELOPMENT
 9. TRAVEL FORECAST MODEL DEVELOPMENT To examine the existing transportation system and accurately predict impacts of future growth, a travel demand model is necessary. A travel demand model is a computer
Highways England s Regional Traffic Models Challenges over the past year Saturn User Group 2 nd November Alison Cox
 Highways England s Regional Traffic Models Challenges over the past year Saturn User Group 2 nd November 2016 Alison Cox Background to RTMs 5 models covering England Overlapping areas to consider potential
Bristol City Council Clean Air Local Plan: Transport and Air Quality Compliance Timescales, Assumptions and Calculations
 BRISTOL CLEAN AIR LOCAL PLAN Bristol City Council Clean Air Local Plan: Transport and Air Quality Compliance Timescales, Assumptions and Calculations PREPARED FOR: PREPARED BY: CHECKED BY Bristol City
Sustainable Transport Committee
 Sustainable Transport Committee 20 February 2019 - Front Page If calling please ask for: Democratic Services 15 February 2019 Sustainable Transport Committee Order Paper for the meeting of the Sustainable
THE CONTINUING ROLE OF THE STRATHCLYDE TRANSPORTATION AND LAND-USE MODEL IN STRATEGIC PLANNING. Paul Emmerson and Dr Andrew Ash TRL
 THE CONTINUING ROLE OF THE STRATHCLYDE TRANSPORTATION AND LAND-USE MODEL IN STRATEGIC PLANNING Paul Emmerson and Dr Andrew Ash TRL Jim Dunlop Strathclyde Partnership for Transport Andy Dobson David Simmonds
Database and Travel Demand Model
 Database and Travel Demand Model 7 The CMP legislation requires every CMA, in consultation with the regional transportation planning agency (the Metropolitan Transportation Commission (MTC) in the Bay
27th Australasian Transport Research Forum, Adelaide, 29 September 1 October 2004
 27th Australasian Transport Research Forum, Adelaide, 29 September 1 October 2004 Paper title: Author(s) name(s): Organisation(s): Economic development and investment in transportation infrastructure an
1 DRAFT Model Capability
 1 DRAFT Model Capability As part of the evaluation of the proposed Western Distributor, additional traffic counts and travel time surveys were collected. The model was updated and refined in several areas,
SEMMMS A6 to Manchester Airport Relief Road
 SEMMMS A6 to Manchester Airport Relief Road Public Transport Model Validation Report Report for DfT February 212 Document Control Project Title: MVA Project Number: Document Type: Directory & File Name:
Effects of toll removal on Tauranga Harbour Bridge, New Zealand
 Effects of toll removal on Tauranga Harbour Bridge, New Zealand A. Murray, Beca Infrastructure Ltd, Auckland, New Zealand Land Transport New Zealand Research Report 313 ISBN 0-478-28725-9 ISSN 1177-0600
UK Road Pricing Feasibility Study: Modelling the Impacts Elizabeth Cox 1 UK
 Abstract UK Road Pricing Feasibility Study: Modelling the Impacts Elizabeth Cox 1 UK In July 2003, the UK government set up a comprehensive study to examine how a new system of charging for road use could
Demand Reduction Assumptions Used For Travel Demand Analysis of EIS Alternatives
 M E M O R A N D U M Demand Reduction Assumptions Used For Travel Demand Analysis of EIS Alternatives TO: FROM: Project Management Team Steve Perone/PTV America DATE: Revised: February 6, 2009 Background
Travel Demand Modeling At NCTCOG
 Travel Demand Modeling At NCTCOG Arash Mirzaei North Central Texas Council Of Governments For University of Texas at Arlington ITE Student Chapter March 9, 2005 Agenda Background DFW Regional Model Structure
DART Fare Structure. Increase. and Proposed Fare. Board Workshop January 5, 2018
 DART Fare Structure and Proposed Fare Increase Board Workshop January 5, 2018 0 Presentation Outline Executive Summary Review of DART Fare Policy & FTA regulations, Financial Impact, and Fare History Fare
Caltrain Fare Study Update
 Caltrain Fare Study Update Board of Directors December 7, 2017 Agenda Item 10 Overview Study overview Key findings from Existing Conditions and Peer Comparison Reports Fare Study Rider Survey highlights
Creating a Transit Supply Index. Andrew Keller Regional Transportation Authority and University of Illinois at Chicago
 Creating a Transit Supply Index Andrew Keller Regional Transportation Authority and University of Illinois at Chicago Presented at Transport Chicago Conference June 1, 2012 Introduction This master's project
report final Decennial Model Update Executive Summary Contra Costa Transportation Authority Cambridge Systematics, Inc.
 final report prepared for Contra Costa Transportation Authority prepared by with Dowling Associates Caliper Corporation June 2003 Table of Contents 1.0 Introduction... ES-1 2.0 Data Development... ES-5
Regional Land Transport Plan 2015
 Wellington Attachment 2 to Report 15.157 Regional Land Transport Plan 2015 CONTENTS Introduction 5 Summary of strategic approach 9 POLICY FRAMEWORK 13 A. Vision 15 B. Transport network pressures and issues
Please complete this checklist by referencing locations where the relevant material can be found in the OBC document
 Large Local Major Schemes: Bid for construction funding Part Two: Checklist Please complete this checklist by referencing locations where the relevant material can be found in the OBC document Strategic
City of Brantford Chapter 3 TABLE OF CONTENTS
 Chapter 3 The Land Use & Transportation Connection TABLE OF CONTENTS 3.1 THE LAND USE & TRANSPORTATION LINK... 1 3.2 POPULATION & EMPLOYMENT GROWTH FORECASTS... 3 3.2.1 Proposed Places to Grow Plan Forecasts
California Statewide Interregional Integrated Modeling (SIIM) Framework. California STDM. HBA Specto Incorporated ULTRANS, UC Davis
 Framework. California STDM. HBA Specto Incorporated ULTRANS, UC Davis") California Statewide Interregional Integrated Modeling (SIIM) Framework California STDM HBA Specto Incorporated ULTRANS, UC Davis SIIM Advisory Group Meeting June 2010 model-wide economic / demographic
California Statewide Interregional Integrated Modeling (SIIM) Framework California STDM HBA Specto Incorporated ULTRANS, UC Davis SIIM Advisory Group Meeting June 2010 model-wide economic / demographic
The London Land-Use and Transport Interaction Model (LonLUTI)
") The London Land-Use and Transport Interaction Model (LonLUTI) October 2014 Contents 3 Introduction 4 Why do we need transport models? 6 TfL s suite of models 8 What is LonLUTI? 12 How was LonLUTI developed?
The London Land-Use and Transport Interaction Model (LonLUTI) October 2014 Contents 3 Introduction 4 Why do we need transport models? 6 TfL s suite of models 8 What is LonLUTI? 12 How was LonLUTI developed?
Transit Fare Review: Final Recommendations. July 2018
 Transit Fare Review: Final Recommendations July 2018 1 Contents Summary of Key Recommendations 2 Detailed List of Recommendations 3 Introduction 4 Fares by Distance 6 Fare Products 10 Transfer Time 14
Trip Generation Study of Drive-through Coffee Outlets
 BRIAN SCHAPEL Principal Traffic Engineer and Transport Planner Bitzios Consulting Pty Ltd brian@bitziosconsulting.com.au TRIP GENERATION STUDY OF DRIVE-THROUGH COFFEE OUTLETS There has been a dramatic
Calibration of a Micro-Simulation Model in a Large Urban Network
 in a Large Urban Network Timothy Oketch, Ph.D., P. Eng., Director, TIMCON Associates, 37 Portelli Crescent, Ajax, Ontario, LZ1 0C4, Email: TOketch@timcon.net, http://www.timcon.net (formerly Senior Project
ECONOMIC ANALYSIS. A. Introduction
 Greater Dhaka Sustainable Urban Transport Project (RRP BAN 42169) ECONOMIC ANALYSIS A. Introduction 1. Greater Dhaka is one of the fastest growing megacities in the world. Its population has more than
Freight Transportation Planning and Modeling Spring 2012
 Freight Model Validation Techniques Abstract Several reviews of validation techniques for statewide passenger and freight models have been published over the past several years. In this paper I synthesize
Munenori SHIBATA Transport Planning and Marketing Laboratory, Signalling and Transport Information Technology Division
 PAPER A Study on Passengers Train Choice Model in Urban Railways Noriko FUKASAWA Munenori SHIBATA Transport Planning and Marketing Laboratory, Signalling and Transport Information Technology Division This
Project Appraisal Guidelines
 Project Appraisal Guidelines Unit 5.2 Construction of Traffic Models February 2011 Project Appraisal Guidelines Unit 5.2 Construction of Transport Models Version Date Comments 1.0 February 2011 New Guidance
Project Appraisal Using PRISM Simon Hubbard 28 th September 2004
 Project Appraisal Using PRISM Simon Hubbard 28 th September 2004 Introduction : Overview of Presentation - Option Appraisal Policy Context - Potential PRISM Applications - Use of the Model / Scale of the
HAMILTON B LINE LRT EVALUATION OF PHASING SCENARIOS TECHNICAL REPORT
 HAMILTON B LINE LRT EVALUATION OF PHASING SCENARIOS March 2013 Table of Contents 1 Introduction... 1 1.1 Background... 1 1.2 Purpose of Study... 1 1.3 Report Structure... 2 2 Phasing Scenarios... 3 2.1
Truck GPS Data for Freight Planning
 Truck GPS Data for Freight Planning presented to Florida Model Task Force, Orlando presented by Frank Tabatabaee Abdul Pinjari Jeff Short (ATRI) Florida DOT University of South Florida (USF) American Transportation
8. STRATEGIC ROAD NETWORK
 8. STRATEGIC ROAD NETWORK 8.1 INTRODUCTION The strategic road forms the backbone of the region s transport. It comprises the state highways and some higher volume local roads. It serves an important role
CHAPTER 9 TRAVEL DEMAND MODEL SUMMARY
 CHAPTER 9 TRAVEL DEMAND MODEL SUMMARY This chapter describes the OKI / MVRPC regional travel demand model, used to support traffic and transit forecasts for the NSTI study. This model is based on version
The New Zealand National Transport Model
 TRANSPORTATION RESEARCH CENTRE The New Zealand National Transport Model WORKSTREAM 5: OPTIONS ANALYSIS Prepared for: Tim Herbert Ministry of Transport December 2015 Status Draft 2014-07-07 Project Number
APPENDIX B - GLOSSARY FEBRUARY 2017
 APPENDIX B - GLOSSARY FEBRUARY 2017 DENVERMOVES Transit Denver Moves: Transit - ii - APPENDIX B TRANSIT AND MOBILITY GLOSSARY Amenities, stop or station: Objects or facilities (such as a shelter, bench,
TECHNICAL REPORT 2001 GTA CORDON COUNT TRANSPORTATION TRENDS Prepared on behalf of:
 21 GTA CORDON COUNT TRANSPORTATION TRENDS 1991-21 TECHNICAL REPORT Prepared on behalf of: Ministry of Transportation, Ontario Regional Municipality of Durham Regional Municipality of Halton Regional Municipality
The Use of Modern Data Collection Technologies to Inform the Development of a Traffic Model and Asset Management Plan for Palmerston North
 The Use of Modern Data Collection Technologies to Inform the Development of a Traffic Model and Asset Management Plan for Palmerston North Simon Cager Infrastructure Investigations Engineer Palmerston
Modifying the Seed Matrix in the Iterative Proportional Fitting Method of Transit Survey Expansion [ITM # 92]
![Modifying the Seed Matrix in the Iterative Proportional Fitting Method of Transit Survey Expansion [ITM # 92]](/thumbs/88/116773056.jpg "Modifying the Seed Matrix in the Iterative Proportional Fitting Method of Transit Survey Expansion [ITM # 92]") Paper Author (s) Sujith Rapolu (corresponding), AECOM (sujith.rapolu@aecom.com) Ashutosh Kumar, AECOM (ashutosh.kumar@aecom.com) David Schmitt, AECOM (david.schmitt@aecom.com) Paper Title & Number Modifying
Paper Author (s) Sujith Rapolu (corresponding), AECOM (sujith.rapolu@aecom.com) Ashutosh Kumar, AECOM (ashutosh.kumar@aecom.com) David Schmitt, AECOM (david.schmitt@aecom.com) Paper Title & Number Modifying
Long-term Plan Transport Proposal. 29 October 2014
 Long-term Plan Transport Proposal 29 October 2014 2 Table of Contents Introduction... 4 The Two Networks... 5 What will it cost?... 12 What are the benefits?... 15 Meeting the government s transport objectives...
That will also contribute to achievement of a number of objectives and policies in the Regional Policy Statement.
 Board of Inquiry MacKays to Peka Peka Expressway Proposal Submitters Evidence Public Transport Voice 5 October 2012 Executive Summary Increasing modal share for public transport is a key outcome in the
City of Berkeley. Guidelines for Development of Traffic Impact Reports
 Office of Transportation (OOT) City of Berkeley Guidelines for Development of Traffic Impact Reports Office of Transportation, City of Berkeley 1 1. Overview These guidelines provide a framework to help
Regional Travel Demand Management Plan
 Regional Travel Demand Management Plan Adopted October 2009 Quality for life Regional Travel Demand Management Plan Adopted October 2009 For more information, contact: Greater Wellington 142 Wakefield
Wellington Public Transport Spine Study
 Greater Wellington Regional Council Wellington Public Transport Spine Study Option Evaluation - Long List TECHNICAL NOTE Option Evaluation - Long List Prepared for Greater Wellington Regional Council Prepared
Zenith Model Framework Papers - Version Paper G Mode Choice Model
 Zenith Model Framework Papers - Version 3.0.1 Paper G Mode Choice Model May 2014 Page Intentionally Left Blank Paper G Mode Choice Model Draft Report COPYRIGHT: The concepts and information contained in
Quantifying the performance of a traffic data collection system: Scout Connect match rate evaluation
 Technology Showcase Miovision Scout Quantifying the performance of a traffic data collection system: Scout Connect match rate evaluation Contents Executive summary 2 Elements of the study 2 Objectives
Strategic Options Assessment
 Strategic Options Assessment September 2009 1. Goal To develop a robust methodology that effectively tests the overall direction of the next Wellington Regional Land Transport Strategy (RLTS) issues and
Project Appraisal Guidelines
 Project Appraisal Guidelines Unit 5.4 Zone-Based Traffic Growth Forecasting January 2011 Project Appraisal Guidelines Unit 5.4 Zone-Based Traffic Growth Forecasting Version Date Comments 1.0 January 2011
Technical Support for Bus Service Planning
 Technical Support for Bus Service Planning David Ashley 1, Naomi Langdon 1, Craig McPherson 1 1 Sinclair Knight Merz, Melbourne, Australia 1 Introduction The purpose of this paper is to stimulate interest
GUIDE FOR THE PREPARATION OF TRAFFIC IMPACT STUDIES
 GUIDE FOR THE PREPARATION OF TRAFFIC IMPACT STUDIES Adopted by Town Council on November 25, 2008 Prepared By: HNTB Engineering Department Planning Department TABLE OF CONTENTS I. INTRODUCTION... 1 II.
BRIEFING NOTE FOR MAYOR PROPOSAL FOR JANUARY 2015 FARES 29 OCTOBER 2014
 AGENDA ITEM 2 BRIEFING NOTE FOR MAYOR PROPOSAL FOR JANUARY 2015 FARES 29 OCTOBER 2014 1. PURPOSE 1.1. This paper contains proposals for fares changes in January 2015. The Mayor is asked to APPROVE these
Park and Ride Action Plan Summary. A Catalyst for Change The Regional Transport Strategy for the west of Scotland
 Park and Ride Action Plan Summary A Catalyst for Change The Regional Transport Strategy for the west of Scotland 2007-2021 Strathclyde Partnership for Transport Contents Purpose...2 Issues, Constraints
APPENDIX H: TRAVEL DEMAND MODEL VALIDATION AND ANALYSIS
 APPENDIX H: TRAVEL DEMAND MODEL VALIDATION AND ANALYSIS Travel demand models (TDM) simulate current travel conditions and forecast future travel patterns and conditions based on planned system improvements
GWRC Scenario Planning Phase II
 GWRC Scenario Planning Phase II DRAFT SCOPE OF WORK/BUDGET PARSONS BRINCKERHOFF & SEVEN HILLS TOWN PLANNING G ROUP A PRIL, 2014 BACKGROUND Your Vision, Our Future completed in 2009 (Scenario Planning Phase
Summary of Impacts on Transit Ridership, The Transit Industry, Related Industries, and Energy Consumption
 Chapter IX Summary of Impacts on Transit Ridership, The Transit Industry, Related Industries, and Energy Consumption INTRODUCTION Chapter VIII reviewed the impact of various transit incentive and auto
Transit Demand Analysis
 Transit Demand Analysis Purpose To determine impact on ridership and revenues of any change in service policy. Need to know how demand estimates will be used. May not require an elaborate analysis in many
Regional Freight Plan
 Regional Freight Plan Adopted June 2011 Quality for Life Regional Freight Plan Adopted June 2011 For more information: Greater Wellington 142 Wakefield Street PO Box 11646 Manners Street Wellington 6142
Project Appraisal Guidelines for National Roads Unit CBA Audit Checklist
 Project Appraisal Guidelines for National Roads Unit 6.6 - CBA Audit Checklist October 2016 TRANSPORT INFRASTRUCTURE IRELAND (TII) PUBLICATIONS About TII Transport Infrastructure Ireland (TII) is responsible
ALBION FLATS DEVELOPMENT EXISTING TRAFFIC CONDITIONS AND POTENTIAL IMPACTS
 EXISTING TRAFFIC CONDITIONS AND POTENTIAL IMPACTS FINAL REPORT SEPTEMBER 2010 TABLE OF CONTENTS 1.0 INTRODUCTION 1 2.0 EXISTING TRAFFIC CONDITIONS 2 3.0 FUTURE TRAFFIC CONDITIONS 3 4.0 POTENTIAL IMPACTS
Analysis of the Observed Behavior of Users to Value Pricing and Travel time: The New Jersey Turnpike Case
 Analysis of the Observed Behavior of Users to Value Pricing and Travel time: The New Jersey Turnpike Case Kaan Ozbay, Ph. D. Associate Professor, Department of Civil and Environmental Engineering, Rutgers,
Sustainable Transport Committee
 Sustainable Transport Committee 5 December 2017, Order Paper - Front Page If calling please ask for: Democratic Services 29 November 2017 Sustainable Transport Committee Order Paper for the meeting of
Rail Passenger Demand Forecasting Methodology TAG Unit
 TAG Unit 3.15.4 April 2009 Department for Transport Transport Analysis Guidance (TAG) This Unit is part of a family which can be accessed at www.webtag.org.uk Contents 1. Summary 1 2. Introduction 1 3.
CITY OF VALLEJO PUBLIC WORKS DEPARTMENT TRAFFIC IMPACT Analysis/Study GUIDELINES
 The City Engineer, under the authority of the Public Works Director and recommendations from the Traffic Engineer, will make the final decision on the need for a traffic study. The purpose of the traffic
1. Introduction. 1.1 Project Background. ANTONY JOHNSTONE Transport Associate Aurecon
 ANTONY JOHNSTONE Transport Associate Aurecon Antony.johnstone@aurecongroup.com RAFAEL CARVAJAL Operational Modelling and Visualisation Coordinator Main Roads WA Rafael.CARVAJALCIFUENTES@mainroads.wa.gov.au
Access by Public Transport Calculator Guide December, 2015 DECEMBER 2015
 DECEMBER 2015 This guide is to be used for the 'Access by Public Transport criterion in both the Green Star Design & As Built and Green Star Interiors rating tools. 1 For information on this document,
Content of the module
 Content of the module Methodology approach Planning process Definition of working area Population and territorial context Supply Infrastructure Transport service Demand On board / at the stations or bus
Wellington Bus Rapid Transit (BRT) Business Case Update
 Business Case Update") Report 15.428 Date 8 September 2015 File TP/01/18/04 Committee Authors Regional Transport Committee Mark Edwards, Senior Transport Planner Wellington Bus Rapid Transit (BRT) Business Case Update 1. Purpose
Report 15.428 Date 8 September 2015 File TP/01/18/04 Committee Authors Regional Transport Committee Mark Edwards, Senior Transport Planner Wellington Bus Rapid Transit (BRT) Business Case Update 1. Purpose
Bus stop infrastructure
 Report 14.549 Date 3 December 2014 File T/20/16/10 Committee Author Strategy and Policy Matthew Lear, Team Leader, Network Service Design & Bus & Ferry Infrastructure Nicola Stitt, Policy Analyst, Bus
Sustainable Transport Committee
 Sustainable Transport Committee 20 March 2019, Order Paper - Front Page If calling please ask for: Democratic Services 14 March 2019 Sustainable Transport Committee Order Paper for the meeting of the Sustainable
Travel demand management in the Wellington region
 Report 15.408 Date 8 September 2015 File TP/03/06/04 Committee Author Regional Transport Natasha Hayes, Senior Transport Planner Melanie Thornton, Manager Sustainable Transport Travel demand management
Travel Demand Model Questions
 Travel Demand Model Questions Are we using the right kind of tools to address the scenarios we are trying to analyze? Are we missing tools? Are we working at the appropriate level of spatial, temporal
The Subway contributes to SPT s objectives to provide an excellent transport system and to encourage modal shift to sustainable travel modes.
 Agenda Item 5 Subway Passenger Survey Committee Operations Date of meeting 4 May 2018 Date of report 11 April 2018 Report by Senior Director 1. Object of report To inform the committee of the results of