FRACTURE TOUGHNESS ASSESSMENT OF SHALES BY NANOINDENTATION
|
|
|
- Coleen Wood
- 6 years ago
- Views:
Transcription

1 University of Massachusetts Amherst Amherst Geotechnical Engineering Masters Projects Civil and Environmental Engineering 2015 FRACTURE TOUGHNESS ASSESSMENT OF SHALES BY NANOINDENTATION Yunqui Liu Follow this and additional works at: Part of the Geotechnical Engineering Commons Liu, Yunqui, "FRACTURE TOUGHNESS ASSESSMENT OF SHALES BY NANOINDENTATION" (2015). Geotechnical Engineering Masters Projects. 4. Retrieved from This Article is brought to you for free and open access by the Civil and Environmental Engineering at Amherst. It has been accepted for inclusion in Geotechnical Engineering Masters Projects by an authorized administrator of Amherst. For more information, please contact
2 FRACTURE TOUGHNESS ASSESSMENT OF SHALES BY NANOINDENTATION A Master of Science Project By Yuqing Liu Department of Civil and Environmental Engineering University of Massachusetts Amherst Amherst, MA MASTER OF SCIENCE IN CIVIL ENGINEERING SEPTEMBER 2015 I
3 II
4 ACKNOWLEDGMENTS I would like to acknowledge the support, guidance, and friendship of the following people and groups who assisted me without hesitance throughout my entire graduate study. I would like to thank Dr. Guoping Zhang for his guidance, support, and encouragement throughout my graduate career. Many thanks to my co-workers for sharing their experiences and encouragement: Fuli Ma for the suggestions of sample preparation and test results analysis methods, Shengmin Luo for his help in setting indentation equipment. I would also like to acknowledge the Civil and Environmental Engineering Department staff that assisted me throughout my academic career, with a special thanks to Jodi Ozdarski. Lastly, to my family and friends who encouraged me to keep trying my best and to work to overcome any hardship I encountered in my academic career. Their loving support, belief, and encouragement are the means by which I got to where I am today. III
5 ABSTRACT FRACTURE TOUGHNESS ASSESSMENT OF SHALES BY NANOINDENTATION September 2015 Yuqing Liu, B.S., Jilin University M.S., University of Massachusetts Amherst Directed by: Dr. Guoping Zhang Nanoindentation has been reported as an effective tool for realizing the strength and stiffness (modulus of elasticity) of different materials including thin film materials, cementitious composites and rock or clay mineral materials. However, to the best of the authors knowledge, nanoscale fracture of shale materials has rarely been examined. Fracture toughness property of shale has been typically studied by observing crack growth of notched macroscale specimens subjected to flexural or tension loads. This research discusses the possible characterization of fracture toughness of shale using contact mechanics at the nanoscale. The analysis method is based on two traditional fracture toughness measurement methods which are used for some different materials. One is the radial crack length measurement method and the other one is based on evaluating the energy absorbed by radial cracks propagating from the indentation imprint in brittle materials. Nanoindentation experiments performed using Berkovich and Cube corner nanoindenter are reported. The Young s Modulus, Hardness and fracture toughness of shale are extracted from nanoindentation experiments. Fracture toughness for different types of shale are evaluated using both crack length measurement and an equivalent elastic crack energy approach and are compared to macroscale fracture IV
6 toughness of different types of shale from the literature. Mechanical properties for different types of shale are calculated from nanoindentation tests and mineralogy is found to play an important role in controlling mechanical properties of shales. An increase in organic content and clay minerals content decreases both Young s Modulus and Hardness of shale. But the deviation of fracture toughness calculation results in this project cannot be ignored comparing with results from macroscale tests. There is some influence for fracture toughness measurement by size effect and shale heterogeneity. Shale heterogeneity and compositional variability should be considered as serious challenges in quantifying the mechanical properties of shale in the future work. V
7 TABLE OF CONTENTS ACKNOWLEDGMENTS... III ABSTRACT... IV TABLE OF CONTENTS... VI LIST OF TABLES... IX LIST OF FIGURES... X LIST OF SYMBOLS... XIII LIST OF ABBRIEVIATIONS... XIV 1 INTRODUCTION General Indentation-based methods to assess fracture toughness Objectives of Research Scope of Research Organization of Thesis LITERATURE REVIEW Introduction Nano Mechanical Characterization of Shale Measurement of Fracture Toughness by Nanoindentation Methods Character and property of different types of Shale Introduction Opalinus Clay Shale Antrim Shale Utica Shale Mechanical Testing by Instrumented Indentation Introduction VI
8 4.1 Indentation Modulus Hardness Different Indenters Used in testing Berkovich Indenter Tip Cube Corner Indenter Tip The Differences between Berkovich Indenter Tip and Cube Corner Indenter Tip Continuous Stiffness Measurement EXPERIMENTAL PROGRAM Introduction Specimen Preparation Specimen Testing Antrim Shale Opalinus Clay Shale Utica Shale Comparison mechanical properties results of different types of shale Different Measurements of Fracture Toughness Introduction Crack Length Measurement Method Energy Method Characterization of Microstructure FRACTURE TOUGHNESS MEASUREMENT ANALYSIS Introduction Materials and Methods Antrim Shale VII
9 6.2.1 Crack length measurement Energy Approach Opalinus Clay Shale with bedding direction surface Crack length measurement Energy Approach Opalinus Clay Shale with normal to bedding direction surface SUMMARY, CONCLUSIONS, AND RECOMMENDATIONS Summary Antrim Shale Opalinus Clay Shale Conclusions Recommendations REFERENCES VIII
10 Table LIST OF TABLES Page Table 4-1 Summary of shape properties of Berkovich and Cube-corner indenter tips Table 5-1 Summary of sand paper information Table 6-1 Summary of crack length measurement analysis results (Antrim Shale) Table 6-2 Summary of energy approach measurement analysis results (Antrim Shale). 43 Table 6-3 Summary of crack length measurement analysis results (Opalinus Clay Shale) Table 6-4 Summary of energy approach measurement analysis results (Opalinus Clay Shale with bedding direction) Table 6-5 Summary of energy approach measurement analysis results for Opalinus Clay Shale with normal to bedding direction surface IX
11 Figure LIST OF FIGURES Page Figure 4.1 Basic theory of load displacement process for nanoindentation Figure 5.1 Polishing Machine Figure 5.2 Sand paper with different grade Figure 5.3 Alumina Lapping Film with different grade Figure 5.4 Different types of Shale Samples after Polishing Figure 5.5 Load-displacement curves of Antrim Shale from nanoindentation Figure 5.6 Average Young s Modulus-displacement analysis of Antrim Shale from nanoindentation Figure 5.7 Average Hardness-displacement analysis of Antrim Shale from nanoindentation Figure 5.8 Load-displacement curves of Opalinus Clay Shale from nanoindentation Figure 5.9 Average Young s Modulus-displacement analysis of Opalinus Clay Shale from nanoindentation Figure 5.10 Average Hardness-displacement analysis of Opalinus Clay Shale from nanoindentation Figure 5.11 Load-displacement curves of Utica Shale from nanoindentation Figure 5.12 Average Young s Modulus-displacement analysis of Utica Shale from nanoindentation Figure 5.13 Average Hardness-displacement analysis of Utica Shale from nanoindentation Figure 5.14 Comparison of Utica shale and Antrim shale by organic content Figure 5.15 Comparison of Utica shale and Opalinus Clay shale by clay mineral content Figure 5.16 Schematic illustration of cube corner indentation Figure 5.17 Schematic of a load-displacement curve, showing a step during the loading cycle and associated energy release Figure 5.18 SEM Image of Opalinus Clay Shale with bedding direction surface X
12 Figure 5.19 SEM Image of Opalinus Clay Shale with normal to bedding direction surface Figure 6.1 Indentation after testing with 4000nm displacement control Figure 6.2 Indentation after testing with 6000nm displacement control Figure 6.3 Indentation after testing with 8000nm displacement control Figure 6.4 Highlighted cracks of indentation with 4000nm displacement control Figure 6.5 Highlighted cracks of indentation with 6000nm displacement control Figure 6.6 Highlighted cracks of indentation with 8000nm displacement control Figure 6.7 Load-displacement curve with 4000nm displacement control Figure 6.8 Load-displacement curve with 6000nm displacement control Figure 6.9 Load-displacement curve with 8000nm displacement control Figure 6.10 Analysis image with 4000nm displacement control Figure 6.11 Analysis image with 6000nm displacement control Figure 6.12 Analysis image with 8000nm displacement control Figure 6.13 SEM image of indentations on Opalinus clay shale surface Figure 6.14 #1 indentation SEM image Figure 6.15 #3 indentation SEM image Figure 6.16 #4 indentation SEM image Figure 6.17 #5 indentation SEM image Figure 6.18 #6 indentation SEM image Figure 6.19 #7 indentation SEM image Figure 6.20 #8 indentation SEM image Figure 6.21 #9 indentation SEM image Figure 6.22 #11 indentation SEM image Figure 6.23 #6 indentation with highlight defined cracks Figure 6.24 #9 indentation with highlight defined cracks Figure 6.25 #11 indentation with highlight defined cracks Figure 6.26 Typical load-displacement curve for nanoindentation of Opalinus Clay Shale Figure 6.27 Typical analysis image for energy approach of Opalinus Clay Shale XI
13 Figure 6.28 Typical SEM image of indentation of Opalinus Clay Shale with normal to bedding direction surface Figure 6.29 Typical load-displacement curve for Opalinus Clay Shale with normal to bedding direction surface Figure 6.30 Typical analysis image of energy approach for Opalinus Clay Shale with normal to bedding direction surface XII
14 LIST OF SYMBOLS Symbol Units Description E GPa Young s Modulus H GPa Hardness Er GPa Reduced Modulus hc nm Contact depth Ac nm Contact area S mn/nm Stiffness Ut J Total energy Ue J Elastic energy Up J Plastic energy Upp J Pure plastic energy Ufrac J Fracture energy P mn Load c μm Radial crack length K1c Fracture stress intensity factor Cave μm Average radial crack length XIII
15 LIST OF ABBRIEVIATIONS Abbreviation TOC SRM SEM ASTM CSM Meaning Total organic carbon Standard reference material Scanning electron microscope American Society for Testing and Materials Continuous stiffness measurement XIV
16 1 INTRODUCTION 1.0 General Shale is a fine-grained rock often composed of clay and other minerals. The predominance of clays influences its mechanical properties and typically imparts a strong elastic anisotropy. Shales are often rich in organic material called kerogen which acts as a source during hydrocarbon generation. Shale formations are interesting to the oil and gas industry because they host vast natural gas and oil resources. Gas flows to the wellbore primarily through natural and induced fractures. The natural fractures are caused by tectonic forces, desiccation and hydrocarbon generation while the process of hydraulic fracturing stimulates and induces fractures. Advances in drilling technology have increased profitability of shale gas. Thus, the ability to form extensive, stable fractures in the shale is directly related to the profitability of gas production from shales. Mechanical properties especially the fracture toughness property is necessary in the design of these fractures; however, because of the mineralogical variability of shale, mechanical properties vary considerably. Many shales are chemically and mechanically unstable making recovery of suitably sized samples for standard mechanical testing impossible. Nano-indentation testing of drilling cuttings provides a viable and economically attractive option for recovering needed mechanical properties. Thus, the purpose of this project was to use instrumented indentation testing to measure the mechanical properties and then use different fracture toughness measurements to calculate the KIC values for different types of shale. 1.1 Indentation-based methods to assess fracture toughness The ability of a material to resist cracking, or fracture, has been vital to the studies of fracture mechanics. It is challenging to accurately determine the fracture toughness of brittle materials due to the difficulty in creating sharp pre-cracks without catastrophically failing the specimen. The study of fracture toughness is usually analyzed at a macro range using high load to create a large indent with long cracks at the edge. However, this 1
17 technique is limited when the test samples are used in a delicate environment or have special structures such as thin films and micro features. The capability of making accurate and repeatable measurements in a localized area at small loads makes nanoindentation system an ideal tool for fracture toughness study on small samples. In this project, the fracture toughness of different types of shale was calculated using different experienced equation. The traditional evaluation method was used by direct measurements of radial cracks created with a sharp diamond indenter. However, most clay shale samples could not present radial crack on the sample surfaces. Energy release and energy approach methods which were used in hydrated cement paste were considered for fracture toughness measurement for shale. 1.2 Objectives of Research As mentioned earlier, Instrumented Indentation method has been used in mechanical testing of Shale in some study. Based on the former research, nanoindentation can be used to evaluate the fracture toughness of materials and interfaces in a similar manner to that conventionally used in larger scale testing. The traditional method is used to calculate the fracture toughness using elastic modulus, hardness, load-displacement process and radial crack lengths measured on the sample surface after indenation. The objectives of the research are: 1. To develop polishing methods for different types of shale with different surface conditions. 2. To develop nanoindentation testing program with Berkovich and Cube-corner tips measuring the properties of shale. 3. To compare former methods used to measure fracture toughness of different materials and develop more effective analysis method for fracture toughness analysis of different types of shale. 4. To analyze fracture toughness analysis results and SEM images of shale sample surfaces after indentation, evaluate the process and method used for this research. 2
18 1.3 Scope of Research The research utilized G200 Nanoindentation system to measure the elastic modulus and hardness of shale samples, and analyze fracture toughness determinations using traditional radial crack length measurement and energy approach methods. The scope of the research involved designing shale samples for nanoindentation tests and different methods to analyze the fracture toughness of different types of shale. 1.4 Organization of Thesis Chapter 2 presents a background review of relevant literature pertaining to the justification of this research and several different methods used for fracture toughness analysis. It includes information on Opalinus Clay Shale, Antrim Shale, Utica Shale, and an introduction into other techniques in nanoindentation. Chapter 3 presents the character and properties of different types of shale including Opalinus Clay Shale, Antrim Shale and Utica Shale based on the experienced tests and information presented in the literature. Chapter 4 presents the characterization and technique information of nanoindentation system and an introduction of continuous stiffness measurement technique using in this research. Chapter 5 presents the experimental program followed in this study. It includes information on the materials used, preliminary lab work, experimental setup, and methods testing/analysis. Chapter 6 presents the experimental analysis of fracture toughness analysis of different types of shale using different methods including traditional radial crack analysis method and energy approach analysis method. Image analysis method is also used in this part to calculate the amount of energy during loading and unloading process. Chapter 7 presents the overall conclusions based on the results and recommendations for future work. 3
19 2 LITERATURE REVIEW 2.0 Introduction Fracture toughness of different types of shale were studied in this project based on the former research and literature about mechanical property measurement using nanoindentation and different fracture toughness measurement methods developed by other scientists. The increase in price of conventional oil and decline in petroleum reserves make shale reservoirs an attractive alternative source of hydrocarbon fuel (Eseme et al., 2007). The development of shale gas is made possible by horizontal drilling and multistage mechanical properties of shales have been poorly sampled primarily because of their chemical and mechanical instability. It is difficult to recover suitable samples of shale for conventional mechanical property measurements especially fracture toughness measurements. Organic rich and clay minerals rich shale are intrinsically heterogeneous and complex. Organic content present in shales can either act as an effective source or a potential source (Jarvie, 1991). Shale heterogeneity and compositional variability present serious challenges in quantifying the mechanical properties of shale. These can only be overcome with adequate statistical sampling. Nano-indentation technology can eliminate the need of larger samples thus allow improved statistical sampling. Fracture toughness measurements using nanoindentation technique have been developed for several years to calculate different type materials. Because there has also been a growing interest in identifying fracture toughness parameters of different materials using nanoindentation (Scholz et al. 2004). To the best of the authors knowledge, such analysis has not been applied to shale material yet. The major challenge in determining fracture toughness of materials using nanoindentation is the difficulty to obtain robust measurement of submicron crack propagation as the stress increases. There have been some suggestions of post measurement of the crack length extended from the edge of the indentation impression after unloading. This measurement can be determined using optical microscopes or atomic force microscope. Such measurements have been shown 4
20 possible with metallic and thin film specimens (Li et al. 1997). However, there is considerable difficulty to obtain these measurements from shale material with the multiple cracking in the shale. Moreover, stable propagation of radial cracks, or what is known as picture-frame cracks, under nanoindentation load has been questioned by many researchers (Chen & Bull 2007) and is a function of the material examined. A robust method for determining fracture toughness from nanoindentation can be based on energy assumptions independent of measuring radial crack propagation. 2.1 Nano Mechanical Characterization of Shale Because of the mineralogical variability of shale, mechanical properties vary considerably. Many shales are chemically and mechanically unstable making recovery of suitably sized samples for standard mechanical testing impossible. Hay et al. (2010) used nanoindentation testing of drill cuttings, fragments or sidewall cores provides a viable and economically attractive option for recovering needed mechanical properties in order to use instrumented indentation testing high-load option measure the mechanical properties of small volumes of Barnett shale. Kumar et al. (2012) reported on nanoindentation study of shales from the Barnett, Woodford, Ordovician, Eagle Ford and Haynesville plays. They used careful selection of load and displacement during nanoindentation testing to yield mechanical properties, such as Young s Modulus and Hardness. 2.2 Measurement of Fracture Toughness by Nanoindentation Methods The study of fracture toughness is usually analyzed at a macro range using high loads to create a large indent with long cracks at the edge. However, this technique is limited when the test samples are used in a delicate environment or have special structures. The capability of making accurate and repeated measurements in localized areas at small loads makes nanoindentation system an ideal tool for fracture toughness study on small samples. Another reason using nanoindentation to determine the mechanical property especially the fracture toughness property is the difficulty and expensive to get core samples for macroscale fracture testing. Based on the radial crack length measurement method, Palmqvist noted that the crack length l varied as a linear function of the indentation load. Lawn, Evans, and 5
21 Marshall formulated a different relationship, where they treated the fully formed radial crack and found the ration / is a constant, the value of which depends on the specimen material. Another fracture toughness measurement method used in this project is based on the energy analysis, which has been developed by some material researchers. For instance, Rosenfeld et al. (1990) developed an analytical model to determine the mixed mode interfacial fracture toughness of epoxy coatings on soda-lime glass substrates using micro-indentation. The method is based on computing the strain energy consumed in annular plate located above the crack using mechanics of materials. The elastic energy release rate can then be calculated by differentiating the energy with respect to the crack area. Field et al. (2003) computed the fracture toughness based on pop-in penetration. Pop-in occurs due to change in crack morphology when the median crack nucleates and propagates upward at the boundary of plastic zone to join the existing radial cracks. This results in extra penetration at the same indentation load level. The pop-in effect becomes negligible in materials whose microstructures contain a distribution of voids in various sizes because the pop-in effect due to these voids would dominate. Chen &Bull (2007) studied the fracture in thin optical coating on glass. Experiments on glass showed that well-developed radial cracks might not be observed when indenting thin films. This is contrary to the case of indenting a bulk material where radial cracks are well-developed and in some cases measureable. Therefore, an energy approach to estimate the fracture toughness was proposed. The proposed approach takes into account the effect of through thickness fracture. The total energy during indentation can be decomposed to elastic, plastic, fracture and other negligible energies. The total and elastic energies can be computed from the nanoindentation load-penetration curve. The plastic energy can be computed as the difference between the elastic and total energy. Cheng et al. (2002) suggested computing the plastic energy as a function of the residual to total penetration ratio. 6
22 3 Character and property of different types of Shale 3.0 Introduction In this project, there are three different types of shale were used for fracture toughness measurement analysis. In order to analyze the influence of organic and clay minerals content for the mechanical characterization of shale, the shale samples which were used in this project have different organic and clay minerals content. The reference properties are recommended by former researches using macro-scale test. The obvious difference of organic and clay minerals content is the motivation to use these three types of shale. The Opalinus Clay Shale contains more clay minerals than Utica Shale, as well the Antrim Shale includes more organic minerals than Utica Shale. 3.1 Opalinus Clay Shale Opalinus Clay Shale samples are collected from the study site known as the Mont Terri rock laboratory (Canton Jura, Switzerland), which is operated by an international consortium including several organizations dealing with radioactive waste disposal. The Opalinus Clay Shale is located at a depth of about 270m below the surface. It shows strong alignment of illite-smectite, kaolinite, chlorite, and calcite. The mineralogical composition of the Opalinus Clay Shale includes wt.% clay minerals, wt.% carbonates (mainly calcite, subordinate siderite, and ankerite), wt.% quartz and accessory feldspars, pyrite, and organic matter. 3.2 Antrim Shale The Antrim Shale is a formation of Upper Devonian age in the Michigan Basin, in the US state of Michigan, and extending into Ohio and Indiana. It is a major source of natural gas in the northern part of the basin. The Antrim Shale was defined by A. C. Lane in 1901, and named for type-section exposures in Antrim County, Michigan. The formation was previously known as the St. Cleric Shale in Michigan, and the Genessee Shale in Indiana. 7
23 The Antrim is a brown to black, pyritic, highly laminated and organic-rich shale, from 60 to 220 feet thick. Total organic content varies from 1% to 20%. In some places the unit includes a gray calcareous shale or limestone, and in places a fine-grained sandstone at the base. The formation is called the Kettle Point Formation in Ontario, and is the stratigraphic equivalent of the New Albany Shale in the Illinois Basin. It is overlain by the Bedford Shale, and underlain in some areas by the Jordan River Formation, and elsewhere by the Thunder Bay Limestone. The Antrim Shale, is a major source of shale gas, and produces natural gas along a swath across the northern part of the state. Most natural gas production is in Antrim, Crawford, Montmorency, Oscoda and Otsego counties. 3.3 Utica Shale The Utica Shale is a stratigraphical unit of Middle Ordovician age in the Appalachian Basin. It underlies much of the northeastern United States and adjacent parts of Canada. It takes the name from the city of Utica, New York, as it was first described as an outcrop along the Starch Factory Creek east of the city by Ebenezer Emmons in The Utica Shale is calcareous and organic-rich shale. It is a major source of tight gas in Quebec, and is rapidly becoming so in Ohio. The Utica Shale lies under most of New York, Pennsylvania, Ohio, and West Virginia and extends under adjacent parts of Ontario and Quebec in Canada and Kentucky, Maryland, Tennessee, and Virginia in the United States. Parts of the island of Montreal consist of Utica shale, which affected construction of parts of the Montreal metro. In some regions of Pennsylvania, the Utica Shale reaches to almost two miles below water level. However, the depth of the Utica Shale rock decreases to the west into Ohio and to the northwest towards Canada. It reaches a thickness of up to 1,000 feet (300 m) and can be as thin as 70 feet (20 m) towards the margins of the basin. 250 feet (80 m) are exposed in the type section. 8
24 Based on the research of mineralogical and TOC trends in the Ohio Utica Shale, [Harrington et al., 2013] average total organic carbon across all samples is about 1.70%. And the average weight of clay minerals is from 37% to 45%, the carbonates are from 19% to 44%. 9
25 4 Mechanical Testing by Instrumented Indentation 4.0 Introduction Indentation testing is a simple method that consists essentially of touching the material of interest whose mechanical properties such as elastic modulus and hardness are unknown with another material whose properties are known. Nanoindentation techniques initially evolved as a tool used in mechanical characterization of materials at small scale. Originally, this method was applied to homogeneous materials such as metals, alloys and ceramics which can be modeled as continuous elastic half space (Oliver & Pharr, 1992, 2004). However, this technique has evolved as a versatile tool; methods have evolved to extend its uses with different shapes of indenter. So has its application beyond continuum materials; to thin films, polymers, biological specimens and geo-materials. Nanoindentation is technique whereby an indenter tip of known geometry and mechanical properties is used to make an impression in a sample, with a penetration depth and force dynamically measured at resolutions of nanometers and micronewtons respectively. The resulting force-depth curve can be analyzed to give bulk properties such as modulus and hardness, as well as to study deformation mechanisms. Oliver and Pharr method (Oliver and Pharr, 2002) which is the extension of Doerner and Nix (1986) method is frequently used to determine indentation modulus and hardness. During loading deformation is modeled as both elastic and plastic, however, unloading is assumed to be pure elastic recovery (Oliver and Pharr, 2002). Corresponding loaddisplacement is presented in Figure 4.1. Next few sections are devoted to derivations of mechanical properties using indentation curves. 10
26 Figure 4.1 Basic theory of load displacement process for nanoindentation 4.1 Indentation Modulus Indentation modulus is derived as 2 11
27 Where β is dimensionless correction factor for indenter tip shape and β=1.05 is commonly used for Berkovich indenter (Oliver and Pharr 2004), Ac is the projected contact area between indenter and sample, which can be obtained solely using indentation parameters (Oliver & Pharr, 1992, 2004; Sneddon, 1965). where contact depth hc is defined as where ε is a constant that depends on indenter tip and used 0.75 for Berkovich indenter. For perfect Berkovich indenter lead term C0 is 24.5 and Cj (j= ) are needed to describe the deviations of the Berkovich tip shape to inevitable rounding effect at the tip due to manufacturing artifacts. The relation between the reduced and elastic modulus of the sample and indenter is expressed as (Doerner & Nix, 1986) where and υi are the Poisson s ratio of the sample and indenter, and E and Ei are the Young s modulus of the indenter and sample respectively. Previous studies suggest that the Poisson s ratio of the tested material has no significant influence on the Young s modulus (Mencik et al., 1997) a constant υ =0.25 is assumed for mica samples. For a diamond indenter, Ei =1141 GPa and υi=0.07 (Oliver & Pharr, 1992). For axisymmetric indenter and isotropic material, indentation modulus is independent of tip geometry (Pharr et al., 1992) and given as 4.2 Hardness Indentation hardness, H, is simply the measure of mean indentation stress at maximum load and given as 12
28 where Fmax is the maximum force and Ac is the contact area given by equations introduced before for Fmax. These equations indicate that indentation modulus and hardness are not independent parameters and related by 4.3 Different Indenters Used in testing Berkovich Indenter Tip The Berkovich indenter tip is the most frequently used indenter tip for instrumented indentation testing to measure mechanical properties on the nanoscale. The Berkovich indenter tip is a three-sided pyramid that can be ground to a point and thus maintains a self-similar geometry to very small scales. It is ideal for most testing purposed. It is not easily damaged and can be readily manufactured. It includes plasticity at very small loads which produces a meaningful measure of hardness. The Berkovich indenter tip has a large included angle of which minimizes the influence of friction. The Berkovich indenter tip is available as a traceable standard. The mean contact pressure is usually determined from a measure of the contact depth of penetration, hc, such that the projected area of the contact is given by: 3 3 Which for θ=65.27, evaluates to: and hence the mean contact pressure, or hardness, is: 13
29 24.5 Since it is customary to use the mean contact pressure as a definition of hardness in nanoindentation, Berkovich indenters used in nanoindentation work are designed to have the same ratio of projects area to indentation depth as the Vickers indenter in which case the face angle is The equivalent cone angle is From geometry, the ratio of the length of one side of the residual impression is related to the total depth of penetration by a factor of about 7.5. And the representative strain within the specimen material is approximately 8% Cube Corner Indenter Tip The Cube Corner indenter tip is a three-sided pyramid with mutually perpendicular faces arranged in geometry like the corner of a cube. The centerline-to-face angle for this indenter is 34.3 whereas for the Berkovich indenter it is The sharpness of the cube corner indenter tip produces much higher stresses and strain in the area of the contact. This is useful in producing very small, well-defined cracks around hardness impressions in brittle materials. These cracks can be used to estimate fracture toughness at very small scales. It is available as a traceable standard. Despite the acuteness of the indenter, it is still possible to perform nanoindentation testing in the normal manner and the expression for the projected area of contact: The equivalent cone angle for a cube corner indenter evaluates to The ratio of the length of a side of the residual impression to the total penetration depth is approximately 2.6. That is, the size of the impression on the surface is about 2.6 times as large as the total penetration depth. 14

 24.56d 2 2.5981d 2 Volume-depth relation 8.1873d 3 0.8657d 3 Projected area/face area 0.908 0.")
30 4.3.3 The Differences between Berkovich Indenter Tip and Cube Corner Indenter Tip The summary of both the Berkovich indenter tip and cube corner indenter tip property is presented in the Table 4-1 Summary of shape properties of Berkovich and Cube-corner indenter tips Table 4-1 Summary of shape properties of Berkovich and Cube-corner indenter tips Outward Berkovich Cube-Corner Shape 3-sided pyramid 3-sided pyramid w/perpendicular faces Applications Bulk Materials, Thin Films, Polymers, Scath Testing, Wear Testing, MEMS, Imaging Thin Films, Scratch Testing, Fracture Toughness, Wear Testing, MEMS, Imaging Centerline-to-face angle Area (projected) 24.56d d 2 Volume-depth relation d d 3 Projected area/face area Equivalent cone angle As mentioned before, the Berkovich indenter has a relatively large face angles, which ensures that deformation is more likely to be described by the expanding cavity model rather than slip-line theory, which is equivalent to saying that the stresses beneath the indenter are very strongly compressive. In some instances, it is desirable to indent a specimen with more of a cutting action, especially when intentional radial and median cracks are required to measure fracture toughness. A cube corner indenter offers a relatively acute face angle that can be beneficial in these circumstances. 15
31 4.4 Continuous Stiffness Measurement Nanoindentation is now commonly used for the study of mechanical properties of materials on the nanoscale because of the ease and speed with which it can be carried out. One of the significant improvements in nanoindentation testing is the continuous stiffness measurement (CSM) technique. It offers a direct measure of dynamic contact stiffness during the loading portion of an indentation test and, being somewhat insensitive to thermal drift, allows an accurate observation of small volume deformation. The CSM is accomplished by imposing a small, varying signal on top of a DC signal that drives the motion of the indenter. By analyzing the response of the system by means of a frequency specific amplifier data are obtained. This allows the measurement of contact stiffness at any point along the loading curve and not just at the point of unloading as in the conventional measurement. The CSM technique makes the continuous measurement of mechanical properties of materials possible in one sample experiment without the need for discrete unloading cycles, and with a time constant that is at least three orders of magnitude smaller than the time constant of the more conventional method of determining stiffness from the slope of an unloading curve. The measurements can be made at exceedingly small penetration depths. Thus, this technique is ideal for mechanical property measurements of nanometer thick films. Furthermore, its small time constant makes it especially useful for measuring the properties of polymeric materials. In nonuniform materials, such as graded materials and multilayers, the microstructure and mechanical properties change with indentation depth. Continuous measurements of mechanical properties of these materials during indentation are greatly needed. 16
32 5 EXPERIMENTAL PROGRAM 5.0 Introduction This chapter present the experimental program used for this project. For the samples used for nanoindentation, sample preparation is an essential requirement especially for shale samples what have much different mineral content. The equipment and materials used for polishing were introduced in this chapter. The mechanical properties such as Young s Modulus and Hardness were calculated using nanoindentation program. The average values of those mechanical properties for each sample had been calculated using analysis software of nanoindentation. In order to analyze the fracture toughness properties of different types of shale, both of the radial crack length measurement and energy method had been used in this project. And the microstructure of Opalinus Clay Shale was analyzed using SEM images. 5.1 Specimen Preparation Sample preparation is an important step to ensure quality results from Nanoindentation tests. ASTM Standard E2546, applied for nano-indentation testing states that the surface finish of the sample will directly affect the test results. The test should be performed on a suitably prepared surface (ASTM, 2007). Smoothness of sample surface is important because contact area is calculated from the contact depth and area function assuming surface before indentation is perfectly smooth. Furthermore, if the indenter encounters a rough surface it will glance off the ridges yielding inaccurate readings. The degree of mechanical polishing of any material is associated with its heterogeneity. On the microscale, shale is composed of several minerals, some hard like, quartz, intermediate like calcite, and soft like clay and kerogen. This mineralogic heterogeneity in shale leads to difficulty in polishing. Harder phases can be polished easily whereas softer phases tend to have scratches or are pulled out even 17

33 after fine polishing. The inability to obtain a perfectly smooth surface leads to large standard deviations in the calculated modulus. In this project, mechanically polishing using sand paper of different grit size with gradual transition from 800 to 4000 is used as the first step. (See Table 5-1) The polishing equipment and sand paper are shown in the Figure 5.1 and Figure 5.2. While polishing, the top and bottom surfaces of samples were ensured to be perfectly parallel. After attaining sufficient smoothness, different grades Alumina Lapping Films were used for final polishing. The grades are from 3 micron to 0.3 micron with different colors. (Figure 5.3) Figure 5.1 Polishing Machine Table 5-1 Summary of sand paper information Grit Size Approx. Micron Size 400[P800] [P1200] [P2500] MicroCut S Disc 8 P4000 MicroCut S Disc 5 18


34 Figure 5.2 Sand paper with different grade Figure 5.3 Alumina Lapping Film with different grade For each shale sample, because of the influence of the surface direction, there are two perpendicular orientations have been polished for test. One of them is the direction parallel to the bedding direction of the sample, the other one is the direction perpendicular to the bedding direction. Samples were glued on the disks which were used as sample holder for the nanoindentation test. The samples after polishing are presented in Figure

35 Figure 5.4 Different types of Shale Samples after Polishing 5.2 Specimen Testing Antrim Shale Nanoindentation CSM Module was used to measure the mechanical properties of Antrim shale. The 2000 displacement control method was used for 22 individual tests. From the Figure 5.5, the maximum load is about 40 mn, and curves for each individual test have similar trend. From the Figure 5.6 and Figure 5.7, the average value of Young s Modulus is 8.6 GPa and the average value of Hardness is 0.45 GPa, which were used for fracture toughness calculation in the next chapter. 20
36 Load on sample (mn) Displacement into surface (nm) Figure 5.5 Load-displacement curves of Antrim Shale from nanoindentation Modulus (GPa) Displacement into surface (nm) Figure 5.6 Average Young s Modulus-displacement analysis of Antrim Shale from nanoindentation 21
37 Hardness (GPa) Displacement into surface (nm) Figure 5.7 Average Hardness-displacement analysis of Antrim Shale from nanoindentation 5.2.2Opalinus Clay Shale Nanoindentation CSM Module was used to measure the mechanical properties of Opalinus Clay Shale. The 3000 displacement control method was used for 11 individual tests. From the Figure 5.8, the maximum load is about 50 mn, and curves for each individual test have similar trend except some individual test curves had pop-ins on the loading part because of the delamination on the sample surface during loading. From the Figure 5.9 and Figure 5.10, the average value of Young s Modulus is about 30 GPa a little higher than the results got from Berkovich indenter tip and the average value of Hardness is about 2 GPa, which were used for fracture toughness calculation in the next chapter. 22
38 60 50 Load on sample (nm) Displacement into surface (nm) Figure 5.8 Load-displacement curves of Opalinus Clay Shale from nanoindentation Modulus (GPa) Displacement into surface (nm) Figure 5.9 Average Young s Modulus-displacement analysis of Opalinus Clay Shale from nanoindentation 23
39 6 5 Hardness (GPa) Displacement into surface (nm) Figure 5.10 Average Hardness-displacement analysis of Opalinus Clay Shale from nanoindentation Utica Shale Nanoindentation CSM Module was used to measure the mechanical properties of Utica shale. The 2000 displacement control method was used for 12 individual tests and some of them had been ignored because of the incorrect data could not be used for analysis. From the Figure 5.11, the maximum load is about 400 mn, and curves for each individual test have similar trend except some individual test curves had pop-ins on the loading part because of the delamination on the sample surface during loading. From the Figure 5.12 and Figure 5.13, the average value of Young s Modulus is about 60 GPa and the average value of Hardness is about 8 to 9 GPa. 24
40 Load on sample (mn) Displacement into surface (nm) Figure 5.11 Load-displacement curves of Utica Shale from nanoindentation Modulus (GPa) Displacement into surface (nm) Figure 5.12 Average Young s Modulus-displacement analysis of Utica Shale from nanoindentation 25
41 Hardness (GPa) Displacement into surface (nm) Figure 5.13 Average Hardness-displacement analysis of Utica Shale from nanoindentation Comparison mechanical properties results of different types of shale Based on research, the differences of mineral content of shale could affect the mechanical properties of different types of shale. Clay minerals content and organic carbon content, which were two main difference of mineral content in the shales used for this project, were compared to present the influence of them for different types of shale rock. Figure 5.14 presented the comparison of Utica shale and Antrim shale by organic content. Because the organic content of Utica shale is 1.5% which is much lower than that of Antrim shale, both Young s Modulus and Hardness of Utica shale are bigger than those of Antrim shale. The increase of organic content in shale decreases both Young s Modulus and Hardness. 26
42 Modulus/Hardness (GPa) Modulus Hardness Organic (wt. %) Figure 5.14 Comparison of Utica shale and Antrim shale by organic content Figure 5.15 presented the comparison of Utica shale and Opalinus Clay shale by clay minerals content. Because the clay minerals content of Utica shale is less than 40% which is lower than that of Opalinus Clay shale, both Young s Modulus and Hardness of Utica shale are bigger than those of Opalinus Clay shale. The increase of clay minerals content in shale decreases both Young s Modulus and Hardness of shale. 27

43 Modulus/Hardness (GPa) Modulus Hardness Clay Minerals (wt. %) Figure 5.15 Comparison of Utica shale and Opalinus Clay shale by clay mineral content 5.3 Different Measurements of Fracture Toughness Introduction The study of fracture toughness is usually analyzed at a macro range using high loads to create a large indent with long cracks at the edge. However, this method is limited when the test samples have special structures such as thin films and micro features. The capability of making accurate and repeatable measurements in localized areas at small loads makes nanoindentation an ideal tool for fracture toughness study on small samples. The radial crack length measurement and energy approach measurement were used to calculate the fracture toughness property in this project Crack Length Measurement Method Fracture toughness evaluates the ability of a material containing a crack to resist brittle fracture. It can be assessed using indentation technique by making direct measurement of cracks created with a sharp diamond indenter. A relationship exists 28
44 between the fracture toughness, Kc, and the average crack length from the center of the indent to the tips of the cracks, c, of the form: K α E H P where P is the applied indentation load, and α is an empirical constant which depends on the indenter geometry. For the cube corner indenter α=0.032, while for the Vickers and Berkovich indenters α= Therefore, the cube corner indenter is usually selected as it can significantly reduce the cracking thresholds. c Figure 5.16 Schematic illustration of cube corner indentation Energy Method There are two different energy methods, one is used to calculate the energy release when there is delamination on the sample and the other one is used for quasibrittle material without pop-ins on the load-displacement curves. Li et al. (1999) developed the energy release measurement method for thin films material. The fracture toughness is calculated with the analysis of the energy release in cracking. As they established in their previous work, fracture process progresses in three stages: (1) first ring-like through-thickness cracks form around the indenter by high stresses in the contact area, (2) delamination and buckling occur around contact area at the film interface by high lateral pressure, (3) second ring-like through-thickness cracks and spalling are generated by high bending stresses at the edges of the buckled film. In the Figure 5.17, the energy difference before and after the crack generation is the area of 29
45 ABC, i.e., this energy stored in ABC will be released as strain energy to create the ringlike through-thickness crack. According to the theoretical analysis, the fracture toughness of thin films can be written as E K 1 ν U 2πC t where E is the elastic modulus, ν is the Poisson s ratio, 2πCR is the crack length in the film plane, U is the strain energy difference before and after cracking, and t is the film thickness. Figure 5.17 Schematic of a load-displacement curve, showing a step during the loading cycle and associated energy release The analysis method is based on the energy approach originally introduced for ductile materials by Cheng et al. (2002). It is assumed that the fracture energy is accounted for as a portion of the irreversible energy can be defined as the sum of the energy due to pure plasticity and the energy due to the extension of cracking, describe as The energy due to pure plasticity can be computed from the ratio of plastic to total energy after Cheng et al. (2002) 30
46 where is the residual indentation depth, is the maximum indentation depth, and is the total energy obtained from fitting a power law function to the loading portion of the indentation curve and substituting into the equation The pure plastic energy can be found by multiplying the right hand side of the portion equation by the total energy. Once the plastic energy is determined, the cracking energy can be determined from the equation _ The critical energy release rate can then be determined as where A is the contact area given for the cube corner indenter tip used for nanoindentation tests based on the maximum contact depth by substituting into equation This theory assumes that the crack growth under nanoindentation load is stable. The fracture stress intensity factor can be computed from the energy release rate and reduced modulus as 31


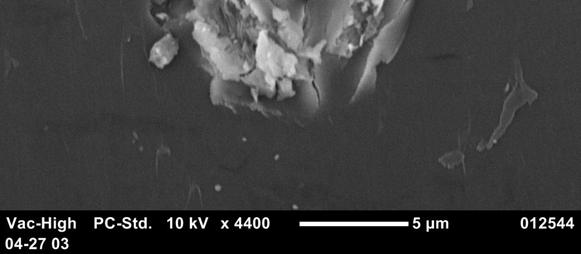
47 5.4 Characterization of Microstructure In order to analyze the influence of mineral for different types of shale, SEM was used for the Opalinus clay Shale. There are two different directions were captured images for this clay shale. One orientation is the bedding direction, and the other orientation is the direction perpendicular to the bedding direction. The Figure 5.18 and Figure 5.19 presented the microstructure of Opalinus clay shale. It indicated that the Opalinus clay shale contained a large percent of clay minerals from Figure Figure 5.18 SEM Image of Opalinus Clay Shale with bedding direction surface Figure 5.19 SEM Image of Opalinus Clay Shale with normal to bedding direction surface 32
48 6 FRACTURE TOUGHNESS MEASUREMENT ANALYSIS 6.0 Introduction Fracture toughness measurement analysis for Antrim shale and Opalinus clay shale is based on the results from nanoindentation testing. The load-displacement curves were presented with the load-displacement data point for each individual test, whereas the average value of Young s Modulus and Hardness were calculated using Analyze Nanoindentation program. Microscope and SEM images were used to measure the radial crack length for each indentation, image analysis software was used to measure the accurate values for each individual test. Then the equations used for the cement and other materials were used to calculate the fracture toughness of Antrim shale and Opalinus clay shale. There is a deviation range for each group of tests, the average values for each group of tests are shown in the analysis part. The crack length measurement method and energy approach method have been used to calculate the fracture toughness for both Antrim and Opalinus clay shale with the test results using nanoindentation. Microscope on the Nanoindentatino G200 system and JEOL JCM-5000 NeoScope scanning electron microscope were used to capture the image of each individual indentation. Image analysis software was used to measure three different orientation crack length for each indentation. Comparison of K1c values from different measurement methods was presented in the summary. The calculation procedures for each method of different shales are summarized in several tables. 6.1 Materials and Methods Antrim shale and Opalinus clay shale were used for the fracture toughness analysis, which contain obvious different clay minerals and organic. The average organic content of Antrim shale is about 20% according to some former research, the Young s Modulus and Hardness are smaller than those of other shale materials which have less organic content. On the other hand, the Opalinus clay shale contains more clay mineral which is about 70 weight percent. While both of the Young s Modulus and Hardness is smaller than those of other shale materials which have less clay minerals. 33

49 Both of the crack length measurement and energy approach have been used to measure the fracture toughness for these shales. For the Antrim shale, the microscope images for each indentation test were captured with the nanoindentation G200 program directly, then the three different orientation crack length were measured using image analysis software. The results based on the energy approach were calculated with the load-displacement curves for both of the Antrim shale and Opalinus clay shale. For the Opalinus clay shale, SEM images for each indentation test were captured with the JEOL JCM-5000 NeoScope scanning electron microscope, then three different orientation crack length were measured using image analysis software. 6.2 Antrim Shale Crack length measurement In order to produce obvious cracks on the sample surface for the measurement, three different displacement control programs were developed to test the Antrim shale. The different displacements are 4000nm, 6000nm, 8000nm, which are made as parameters for CSM mode of nanoindentation testing. The images of each test are shown in Figure 6.1, Figure 6.2 and Figure 6.3. Figure 6.1 Indentation after testing with 4000nm displacement control Figure 6.2 Indentation after testing with 6000nm displacement control 34


50 Figure 6.3 Indentation after testing with 8000nm displacement control With the images for each indentation, image analysis software was used to highlight the cracks and measure the length for every crack on the images. The indentation images with highlighted cracks are presented in Figure 6.4, Figure 6.5 and Figure 6.6. Figure 6.4 Highlighted cracks of indentation with 4000nm displacement control Figure 6.5 Highlighted cracks of indentation with 6000nm displacement control Figure 6.6 Highlighted cracks of indentation with 8000nm displacement control 35
51 The summary of calculation results using crack length measurement method is presented in the Table
52 Table 6-1 Summary of crack length measurement analysis results (Antrim Shale) Test # α E (GPa) H (GPa) P (mn) c1 c2 c3 cave(μm) cave(m) Kc (MPa m) 4000nm E nm nm E nm E nm nm E nm nm
53 6.2.2 Energy Approach The analysis method is based on the energy approach originally introduced for ductile materials by Cheng et al. (2002). It is assumed that the fracture energy is accounted for as a portion of the irreversible energy, rather than total energy. The irreversible energy can be defined as the sum of the energy due to pure plasticity and the energy due to the extension of cracking. The total energy, elastic energy, residual depth and maximum indentation depth can be calculated from the load-displacement curves, the typical load-displacement curves for different displacement control are presented in the Figure 6.7, Figure 6.8 and Figure nm 04 Load on sample (mn) Displacement into surface (nm) Figure 6.7 Load-displacement curve with 4000nm displacement control 38
54 6000nm Load on sample (mn) Displace into surface (nm) Figure 6.8 Load-displacement curve with 6000nm displacement control nm Load on sample (mn) Displace into surface (nm) Figure 6.9 Load-displacement curve with 8000nm displacement control 39

55 Then, image analysis software was used to define the area of total energy and the elastic energy. Typical analysis images are presented in the Figure 6.10, Figure 6.11 and Figure Figure 6.10 Analysis image with 4000nm displacement control 40


56 Figure 6.11 Analysis image with 6000nm displacement control Figure 6.12 Analysis image with 8000nm displacement control 41
57 In these analysis images, two different colors were used to define the area of different energy. The red area was defined as the irreversible energy producing with loading, whereas the blue area was defined as the elastic energy which was recovered after unloading. The summation of blue and red area is total energy for each indentation test. The residual indentation and maximum indentation depth can also be calculated directly from the load-displacement curves, the summary of fracture toughness results using energy approach is presented in Table
58 Table 6-2 Summary of energy approach measurement analysis results (Antrim Shale) Test # 4000n m n m n m n m n m n m n m n m n m n m n m 04 hm (nm) hf (nm) hf/h m Er (GPa) Ut (mn*nm ) Upp/ Ut Upp (mn*nm) Ue (mn*nm ) Ucrack (mn*nm) Ufra (N*m) hm (m) Am (m2) E E E E E E E E E E E E E E E E E E E E E E- 10 Gc (Nm/m2 ) Kc (MPa m )


59 6.3 Opalinus Clay Shale with bedding direction surface Crack length measurement Because the Opalinus clay shale is a kind of clay-rich shale, the delamination and bucking of overlapping clay mineral were produced during the loading process. Based on the initial tests, the cracks on the sample surface were difficult to define using microscope. In order to capture obvious indentations image and measure the length of cracks, SEM was used for the Opalinus clay shale analysis. The image of the group indentations used for fracture toughness analysis is presented in Figure Figure 6.13 SEM image of indentations on Opalinus clay shale surface Most of obvious indentations were used to measure the length of cracks individually. The images of each indentation with smaller scale are shown from Figure 6.14 to Figure


60 Figure 6.14 #1 indentation SEM image Figure 6.15 #3 indentation SEM image 45


61 Figure 6.16 #4 indentation SEM image Figure 6.17 #5 indentation SEM image 46


62 Figure 6.18 #6 indentation SEM image Figure 6.19 #7 indentation SEM image 47


63 Figure 6.20 #8 indentation SEM image Figure 6.21 #9 indentation SEM image 48


64 Figure 6.22 #11 indentation SEM image Crack length for each indentation was measured on the SEM images directly. Because of the delamination around the initial indentations, personal judgment was applied for some measurement. Some typical images with highlight cracks are shown from Figure 6.23 to Figure Figure 6.23 #6 indentation with highlight defined cracks 49


65 Figure 6.24 #9 indentation with highlight defined cracks Figure 6.25 #11 indentation with highlight defined cracks The summary of crack length analysis results is presented in Table
66 Table 6-3 Summary of crack length measurement analysis results (Opalinus Clay Shale) Test # α E (GPa) H (GPa) P (mn) c1 c2 c3 cave(μm) cave(m) Kc (MPa m) E E E E E E
67 6.3.2 Energy Approach The analysis method is based on the energy approach originally introduced for ductile materials by Cheng et al. (2002). It is assumed that the fracture energy is accounted for as a portion of the irreversible energy, rather than total energy. The irreversible energy can be defined as the sum of the energy due to pure plasticity and the energy due to the extension of cracking. The total energy, elastic energy, residual depth and maximum indentation depth can be calculated from the load-displacement curves, a typical load-displacement curve is shown in the Figure Load on sample (mn) Displacement into surface (nm) Figure 6.26 Typical load-displacement curve for nanoindentation of Opalinus Clay Shale The energy analysis with image analysis is as same as the method used for Antrim shale. The image analysis software was used for calculating the area with loading and unloading processes. Some essential parameter can be calculated from the loaddisplacement curves, a typical analysis image is presented in the Figure

68 Figure 6.27 Typical analysis image for energy approach of Opalinus Clay Shale In the analysis images, two different colors were used to define the area of different energy. The red area was defined as the irreversible energy producing with loading, whereas the blue area was defined as the elastic energy which was recovered after unloading. The summation of blue and red area is total energy for each indentation test. The residual indentation and maximum indentation depth can also be calculated directly from the load-displacement curves, the summary of fracture toughness results using energy approach measurement is presented in Table
69 Table 6-4 Summary of energy approach measurement analysis results (Opalinus Clay Shale with bedding direction) Tes t # hm (nm) hf (nm ) hf/ hm Er (GPa ) Ut (mn*n m) Upp /Ut Upp (mn*nm ) Ue (mn*n m) Ucrack (mn*nm) Ufra (N*m) E E E E E E E-09 hm (m) Am (m2) E E E E E E E-11 Gc (Nm/m 2) Kc (MPa m)


70 6.4 Opalinus Clay Shale with normal to bedding direction surface Based on the mechanical properties from nanoindentation testing, both of the Young s Modulus and Hardness of samples with normal to bedding direction surface are smaller than those of samples with bedding orientation surface. In order to compare the different of fracture toughness property between different surface orientations, the energy approach measurement was used to calculate the fracture toughness property of Opalinus clay shale with sample surface which is perpendicular to the bedding direction. Because of the unobvious cracks on the sample surface captured using SEM, the crack length measurement was difficult to use to calculate the fracture toughness property of Opalinus clay shale with normal to bedding direction surface. A typical SEM image is presented in the Figure Figure 6.28 Typical SEM image of indentation of Opalinus Clay Shale with normal to bedding direction surface As same as the energy approach measurement used for the other surface orientation sample, the parameters used to calculate the fracture toughness can be calculated with load-displacement curves for each individual test, such as total energy, elastic energy, residual depth and maximum depth. These parameters can be read directly 55

71 from the load-displacement curves or calculated using image analysis as the other surface orientation sample. A typical load-displacement curve of Opalinus clay shale with normal to bedding direction surface is presented in the Figure Load on sample (mn) Displacement into surface (nm) Figure 6.29 Typical load-displacement curve for Opalinus Clay Shale with normal to bedding direction surface Image analysis software was also used for each individual load-displacement of this sample, a typical analysis image is shown in the Figure Figure 6.30 Typical analysis image of energy approach for Opalinus Clay Shale with normal to bedding direction surface 56
YIELD & TENSILE STRENGTH OF STEEL & ALUMINIUM USING MICROINDENTATION
 YIELD & TENSILE STRENGTH OF STEEL & ALUMINIUM USING MICROINDENTATION Prepared by Duanjie Li, PhD & Pierre Leroux 6 Morgan, Ste156, Irvine CA 9618 P: 949.461.99 F: 949.461.93 nanovea.com Today's standard
M3 Review Automated Nanoindentation
 M3 Review Automated Nanoindentation Prepared by Duanjie Li, PhD & Pierre Leroux 6 Morgan, Ste156, Irvine CA 92618 P: 949.461.9292 F: 949.461.9232 nanovea.com Today's standard for tomorrow's materials.
Vickers Berkovich Knoop Conical Rockwell Spherical Figure 15 a variety of different indenter's shapes and sizes
 Hardness Test of Ceramic materials Hardness is a measure of a materials resistance to penetration by a hard indenter of defined geometry and loaded in prescribed manner, it is one of the most frequently
MICROINDENTATION & FRACTURE OF MINERAL ROCK
 MICROINDENTATION & FRACTURE OF MINERAL ROCK Prepared by Jorge Ramirez 6 Morgan, Ste156, Irvine CA 92618 P: 949.461.9292 F: 949.461.9232 nanovea.com Today s standard for tomorrow s materials. INTRO The
ELASTIC-PLASTIC RESPONSE OF POLYMER COATING UNDER REPETITIVE IMPACT
 ELASTIC-PLASTIC RESPONSE OF POLYMER COATING UNDER REPETITIVE IMPACT Prepared by Duanjie Li, PhD & Braden Altstatt 6 Morgan, Ste156, Irvine CA 9618 P: 949.461.99 F: 949.461.93 nanovea.com Today's standard
HONEYCOMB MECHANICAL BEHAVIOR USING MACROINDENTATION
 HONEYCOMB MECHANICAL BEHAVIOR USING MACROINDENTATION. Prepared by Duanjie Li, PhD 6 Morgan, Ste156, Irvine CA 92618 P: 949.461.9292 F: 949.461.9232 nanovea.com Today's standard for tomorrow's materials.
NANOINDENTATION CREEP MEASUREMENT
 NANOINDENTATION CREEP MEASUREMENT Prepared by Jorge Ramirez 6 Morgan, Ste156, Irvine CA 9618 P: 949.461.99 F: 949.461.93 nanovea.com Today's standard for tomorrow's materials. 010 NANOVEA INTRO Creep can
Evaluation of Mechanical Properties of Hard Coatings
 Evaluation of Mechanical Properties of Hard Coatings Comprehensive mechanical testing of two coated metal samples was performed on the UNMT- 1. The tests clearly distinguished brittle and ductile samples,
Nano Puncture Resistance Using Nanoindentation
 Nano Puncture Resistance Using Nanoindentation Prepared by Jorge Ramirez 6 Morgan, Ste156, Irvine CA 9618 P: 949.461.99 F: 949.461.93 nanovea.com Today's standard for tomorrow's materials. 011 NANOVEA
Chapter Outline Mechanical Properties of Metals How do metals respond to external loads?
 Chapter Outline Mechanical Properties of Metals How do metals respond to external loads?! Stress and Strain " Tension " Compression " Shear " Torsion! Elastic deformation! Plastic Deformation " Yield Strength
Mechanical Characterization of Sol-Gel Coatings Using a Nano Indenter G200
 Mechanical Characterization of Sol-Gel Coatings Using a Nano Indenter G200 Application Note Jennifer Hay Agilent Technologies Introduction This application note presents the results of nanomechanical tests
AMMONITE FOSSIL MECHANICAL PROPERTIES USING NANOINDENTATION
 AMMONITE FOSSIL MECHANICAL PROPERTIES USING NANOINDENTATION Prepared by Duanjie Li, PhD 6 Morgan, Ste156, Irvine CA 9618 P: 949.461.99 F: 949.461.93 nanovea.com Today's standard for tomorrow's materials.
CONTROLLED HUMIDITY NANOINDENTATION OF POLYMER FILMS
 CONTROLLED HUMIDITY NANOINDENTATION OF POLYMER FILMS Load (mn) 10 8 6 4 5 % Humidity 35 % Humidity 45 % Humidity 55 % Humidity 65 % Humidity 75 % Humidity 0 0.0 0. 0.4 0.6 0.8 1.0 1. 1.4 1.6 Displacement
EDGE CHIPPING RESISTANCE USING MACROINDENTATION TESTING
 EDGE CHIPPING RESISTANCE USING MACROINDENTATION TESTING Prepared by Ali Mansouri 6 Morgan, Ste156, Irvine CA 92618 P: 949.461.9292 F: 949.461.9232 nanovea.com Today's standard for tomorrow's materials.
Fracture. Brittle vs. Ductile Fracture Ductile materials more plastic deformation and energy absorption (toughness) before fracture.
 before fracture.") 1- Fracture Fracture: Separation of a body into pieces due to stress, at temperatures below the melting point. Steps in fracture: 1-Crack formation 2-Crack propagation There are two modes of fracture depending
1- Fracture Fracture: Separation of a body into pieces due to stress, at temperatures below the melting point. Steps in fracture: 1-Crack formation 2-Crack propagation There are two modes of fracture depending
Evaluation of Failure in Low-k Films Using Stiffness Mapping and Dynamic Imaging
 Evaluation of Failure in Low-k Films Using Stiffness Mapping and Dynamic Imaging Application Note Introduction Fracture toughness and scratch failure of thin films on the nano-scale is of particular interest
MSE 3143 Ceramic Materials
 MSE 3143 Ceramic Materials Mechanical Properties of Ceramics Assoc.Prof. Dr. Emre YALAMAÇ Res.Asst. B.Şölen AKDEMİR 2017-2018 Fall 1 OUTLINE Elasticity & Strength Stress & Strain Behaviour Of Materials
CORROSION HARDNESS EFFECT OF STEEL SCREWS BY NANOINDENTATION
 CORROSION HARDNESS EFFECT OF STEEL SCREWS BY NANOINDENTATION Prepared by Duanjie Li, PhD 6 Morgan, Ste156, Irvine CA 92618 P: 949.461.9292 F: 949.461.9232 nanovea.com Today's standard for tomorrow's materials.
Tablet Coating Failure Using Micro Scratch Testing
 Tablet Coating Failure Using Micro Scratch Testing Prepared by Jorge Ramirez 6 Morgan, Ste156, Irvine CA 92618 P: 949.461.9292 F: 949.461.9232 nanovea.com Today's standard for tomorrow's materials. 2011
EFFECT OF CRYSTALLOGRAPHIC ORIENTATION ON MECHANICAL PROPERTIES OF STEEL SHEETS BY DEPTH SENSING INDENTATION
 EFFECT OF CRYSTALLOGRAPHIC ORIENTATION ON MECHANICAL PROPERTIES OF STEEL SHEETS BY DEPTH SENSING INDENTATION Peter BURIK 1, Ladislav PEŠEK 2 1 Technical University of Liberec, Faculty of Mechanical Engineering,
MECHANICAL PROPERTIES AND TESTS. Materials Science
 MECHANICAL PROPERTIES AND TESTS Materials Science Stress Stress is a measure of the intensity of the internal forces acting within a deformable body. Mathematically, it is a measure of the average force
Indentation of Coatings at micro/nano scale: Crack formation and deflection
 Indentation of Coatings at micro/nano scale: Crack formation and deflection A.S.Bhattacharyya Centre for Nanotechnology Central University of Jharkhand Brambe, Ranchi: 835205 Email: 2006asb@gmail.com Abstract
Chapter Outline: Failure
 Chapter Outline: Failure How do Materials Break? Ductile vs. brittle fracture Principles of fracture mechanics Stress concentration Impact fracture testing Fatigue (cyclic stresses) Cyclic stresses, the
INSTRUMENTED INDENTATION TEST FOR HARDNESS AND MATERIALS PARAMETER FROM MILLINEWTONS TO KILONEWTONS
 INSTRUMENTED INDENTATION TEST FOR HARDNESS AND MATERIALS PARAMETER FROM MILLINEWTONS TO KILONEWTONS Michael Griepentrog, Christian Ullner and Alexander Dück Federal Institute for Materials Research and
NANOINDENTATION OF SILICON CARBIDE WAFER COATINGS
 NANOINDENTATION OF SILICON CARBIDE WAFER COATINGS Prepared by Jesse Angle 6 Morgan, Ste156, Irvine CA 9618 P: 949.461.99 F: 949.461.93 nanovea.com Today's standard for tomorrow's materials. 010 NANOVEA
Identifying Cohesive Failure of Screen Protectors with Acoustic Emission
 Identifying Cohesive Failure of Screen Protectors with Acoustic Emission Prepared by Frank Liu 6 Morgan, Ste156, Irvine CA 92618 P: 949.461.9292 F: 949.461.9232 nanovea.com Today's standard for tomorrow's
Nanoindentation. Kathy Walsh, Ph.D. Frederick Seitz Materials Research Laboratory University of Illinois at Urbana-Champaign
 Nanoindentation Kathy Walsh, Ph.D. Frederick Seitz Materials Research Laboratory University of Illinois at Urbana-Champaign Mechanical Testing: How does it respond when you poke it, squish it, or stretch
Tennessee State University College of Engineering and Technology Department of Mechanical Engineering
 Tennessee State University College of Engineering and Technology Department of Mechanical Engineering The Impact of Modeling, Simulation, and Characterization of the Mechanical Properties of Nano-materials
Chapter 4 MECHANICAL PROPERTIES OF MATERIAL. By: Ardiyansyah Syahrom
 Chapter 4 MECHANICAL PROPERTIES OF MATERIAL By: Ardiyansyah Syahrom Chapter 2 STRAIN Department of Applied Mechanics and Design Faculty of Mechanical Engineering Universiti Teknologi Malaysia 1 Expanding
EXPERIMENTAL AND NUMERICAL INVESTIGATIONS OF CONCRETE BEHAVIOUR AT MESO-LEVEL DURING QUASI-STATIC SPLITTING TENSION
 Size effect in concrete under tensile splitting - experiments and DEM analyses for different failure modes V International Conference on Particle-based Methods Fundamentals and Applications PARTICLES 2017
DCB TEST SAMPLE DESIGN FOR MICRO-MECHANICAL TESTING
 THE 19 TH INTERNATIONAL CONFERENCE ON COMPOSITE MATERIALS DCB TEST SAMPLE DESIGN FOR MICRO-MECHANICAL TESTING S. Zike, L. P. Mikkelsen, B. F. Sørensen Composites and Materials Mechanics Section, Department
Nanoindentation Behaviour of Mg Based Hybrid Composites with Graphite nanofiber/alumina Fiber
 Nanoindentation Behaviour of Mg Based Hybrid Composites with Graphite nanofiber/alumina Fiber Y.N.Joung, C.G.Kang, J.S.S.Babu * National Core Research Center, Pusan National University, Busan, South Korea
Nanoindentation and nanoscratch behaviors of DLC coatings on different steel substrates
 Composites Science and Technology 65 (2005) 1409 1413 COMPOSITES SCIENCE AND TECHNOLOGY www.elsevier.com/locate/compscitech Nanoindentation and nanoscratch behaviors of DLC coatings on different steel
High Temperature Mechanical Characterization of Tin (Sn) Using Nanoindentation
 Using Nanoindentation") High Temperature Mechanical Characterization of Tin (Sn) Using Nanoindentation Application Note Bryan Crawford Agilent Technologies Introduction Soft metals that exhibit time dependent deformation can
High Temperature Mechanical Characterization of Tin (Sn) Using Nanoindentation Application Note Bryan Crawford Agilent Technologies Introduction Soft metals that exhibit time dependent deformation can
1-6.4 THE CRACK TIP: THE INGLIS EQUATION
 1-6.4 THE CRACK TIP: THE INGLIS EQUATION In our discussions of fracture so far we have assumed that the crack looks much like that shown in Figure 1.26a. The crack separates planes of atoms, is atomically
Evaluation of length scale effects for micro and nano-sized cantilevered structures
 University of Wollongong Research Online University of Wollongong Thesis Collection 1954-2016 University of Wollongong Thesis Collections 2010 Evaluation of length scale effects for micro and nano-sized
THE VDI-3198 INDENTATION TEST EVALUATION OF A RELIABLE QUALITATIVE CONTROL FOR LAYERED COMPOUNDS
 THE VDI-3198 INDENTATION TEST EVALUATION OF A RELIABLE QUALITATIVE CONTROL FOR LAYERED COMPOUNDS N. Vidakis *, A. Antoniadis *, N. Bilalis** * Technological Educational Institute of Crete, Greece ** Technical
Mechanical behavior of crystalline materials - Stress Types and Tensile Behaviour
 Mechanical behavior of crystalline materials - Stress Types and Tensile Behaviour 3.1 Introduction Engineering materials are often found to posses good mechanical properties so then they are suitable for
SUPER HARDENING OF W/NbN NANOLAYERS UNDER SHALLOW NANOINDENTATION. Brian Michael Ennis. BSME, University of Pittsburgh, 2002
 SUPER HARDENING OF W/NbN NANOLAYERS UNDER SHALLOW NANOINDENTATION by Brian Michael Ennis BSME, University of Pittsburgh, 2002 Submitted to the Graduate Faculty of School of Engineering in partial fulfillment
Indentation Rules of Thumb
 Indentation Rules of Thumb Applications and Limits Application Note Introduction A wealth of information can be derived from instrumented indentation testing (also called nanoindentation); this testing
ME -215 ENGINEERING MATERIALS AND PROCESES
 ME -215 ENGINEERING MATERIALS AND PROCESES Instructor: Office: MEC325, Tel.: 973-642-7455 E-mail: samardzi@njit.edu PROPERTIES OF MATERIALS Chapter 3 Materials Properties STRUCTURE PERFORMANCE PROCESSING
Chapter 7: Mechanical Properties 1- Load 2- Deformation 3- Stress 4- Strain 5- Elastic behavior
 -1-2 -3-4 ( ) -5 ( ) -6-7 -8-9 -10-11 -12 ( ) Chapter 7: Mechanical Properties 1- Load 2- Deformation 3- Stress 4- Strain 5- Elastic behavior 6- Plastic behavior 7- Uniaxial tensile load 8- Bi-axial tensile
Introduction to Joining Processes
 4. TEST METHODS Joints are generally designed to support a load, and must be tested to evaluate their load-supporting capabilities. However, it is also important to evaluate, not the joint, but rather
Chapter 14 Fracture Mechanics
 Chapter 14 Fracture Mechanics Stress Concentrations - discontinuities typically exist in structures (holes, cross-section changes, keyways, etc) - discontinuities locally increase stress (stress raisers)
Keysight Technologies Indentation Rules of Thumb Applications and Limits
 Keysight Technologies Indentation Rules of Thumb Applications and Limits Application Note Introduction A wealth of information can be derived from instrumented indentation testing (also called nanoindentation);
Lecture 08 Fracture Toughness and Toughening Mechanisms Ref: Richerson, Modern Ceramic Engineering, Ch17, Marcel Dekker, 1992
 MME 467 Ceramics for Advanced Applications Lecture 08 Fracture Toughness and Toughening Mechanisms Ref: Richerson, Modern Ceramic Engineering, Ch17, Marcel Dekker, 1992 Prof. A. K. M. Bazlur Rashid Department
BFF1113 Engineering Materials DR. NOOR MAZNI ISMAIL FACULTY OF MANUFACTURING ENGINEERING
 BFF1113 Engineering Materials DR. NOOR MAZNI ISMAIL FACULTY OF MANUFACTURING ENGINEERING Course Guidelines: 1. Introduction to Engineering Materials 2. Bonding and Properties 3. Crystal Structures & Properties
Mechanical Properties of Materials
 INTRODUCTION Mechanical Properties of Materials Many materials, when in service, are subjected to forces or loads, it is necessary to know the characteristics of the material and to design the member from
MACROSCOPIC MODELING OF FINE LINE ADHESION TESTS
 π Mater. Res. Soc. Proc. Vol. 563, 1999 Symposium M: Material Reliability in Microelectronics IX MACROSCOPIC MODELING OF FINE LINE ADHESION TESTS A.A. Volinsky, J.C. Nelson, W.W. Gerberich * * University
Crack Branching Phenomenon of Zirconia Plasma Spray Coating
 Transactions of JWRI, Vol. 36 (7), No. Crack Branching Phenomenon of Zirconia Plasma Spray Coating EL-SHEIKHY Refat* and KOBAYASHI Akira** Abstract Gas tunnel plasma spray coating technology has been introduced
Electronics materials - Stress and its effect on materials
 Electronics materials - Stress and its effect on materials Introduction You will have already seen in Mechanical properties of metals that stress on materials results in strain first elastic strain and
3. MECHANICAL PROPERTIES OF STRUCTURAL MATERIALS
 3. MECHANICAL PROPERTIES OF STRUCTURAL MATERIALS Igor Kokcharov 3.1 TENSION TEST The tension test is the most widely used mechanical test. Principal mechanical properties are obtained from the test. There
Repetition: Adhesion Mechanisms
 Repetition: Adhesion Mechanisms a) Mechanical interlocking b) Monolayer/monolayer c) Chemical bonding d) Diffusion e) Psedo diffusion due to augmented energy input (hyperthermal particles) Repetition:
1) Fracture, ductile and brittle fracture 2) Fracture mechanics
 Fracture, ductile and brittle fracture 2) Fracture mechanics") Module-08 Failure 1) Fracture, ductile and brittle fracture 2) Fracture mechanics Contents 3) Impact fracture, ductile-to-brittle transition 4) Fatigue, crack initiation and propagation, crack propagation
Module-08 Failure 1) Fracture, ductile and brittle fracture 2) Fracture mechanics Contents 3) Impact fracture, ductile-to-brittle transition 4) Fatigue, crack initiation and propagation, crack propagation
Characterization of Physical Properties of Roadware Clear Repair Product
 Characterization of Physical Properties of Roadware Clear Repair Product November 5, 2009 Prof. David A. Lange University of Illinois at Urbana-Champaign Introduction Roadware MatchCrete Clear (MCC) is
CE 221: MECHANICS OF SOLIDS I CHAPTER 3: MECHANICAL PROPERTIES OF MATERIALS
 CE 221: MECHANICS OF SOLIDS I CHAPTER 3: MECHANICAL PROPERTIES OF MATERIALS By Dr. Krisada Chaiyasarn Department of Civil Engineering, Faculty of Engineering Thammasat university Outline Tension and compression
Chapter 7. Mechanical properties 7.1. Introduction 7.2. Stress-strain concepts and behaviour 7.3. Mechanical behaviour of metals 7.4.
 Chapter 7. Mechanical properties 7.1. Introduction 7.2. Stress-strain concepts and behaviour 7.3. Mechanical behaviour of metals 7.4. Mechanical behaviour of ceramics 7.5. Mechanical behaviour of polymers
Full Nanomechanical Characterization of Ultra-Thin Films
 APPLICATION NOTE By: Jeffrey Schirer and Julia Nowak, Ph.D. Hysitron, Inc. Eiji Kusano and Mune-aki Sakamoto Department of Chemistry, Kanazawa Institute of Technology, Japan Full Nanomechanical Characterization
Metallurgical Defect: Manufacturing of a Reference Specimen for NDE Studies
 13th International Symposium on Nondestructive Characterization of Materials (NDCM-XIII), 20-24 May 2013, Le Mans, France www.ndt.net/?id=15501 More Info at Open Access Database www.ndt.net/?id=15501 Metallurgical
NanoForce -short note - Ilja Hermann October 24,
 www.bruker.com NanoForce -short note - Ilja Hermann October 24, 2016 1 System overview Microscope for inspection pre- and pre- and post-test Actuator housing Specimen tray Thermal/Acoustic/ Seismic hood
The Mechanical Properties of Polymers
 The Mechanical Properties of Polymers Date: 14/07/2018 Abu Zafar Al Munsur Behavior Of Material Under Mechanical Loads = Mechanical Properties. Term to address here Stress and strain: These are size-independent
Failure and Fracture. Failure and Fracture. Outline. Design Strength and Safety Factors. where N is the.
 Failure and Fracture Outline failure of engineering materials is an undesirable occurrence!! can lead to loss of human life economic losses prevention is through good design and materials selection Failure
Using nano-indentation and microscopy to obtain mechanical properties
 Using nano-indentation and microscopy to obtain mechanical properties Mladena Luković, Erik Schlangen,Branko Šavija, Guang Ye, Oğuzhan Çopuroğlu Delft University of Technology, Faculty of Civil Engineering
DIRECT MEASUREMENT ON FRACTURE TOUGHNESS OF CARBON FIBER ABSTRACT
 DIRECT MEASUREMENT ON FRACTURE TOUGHNESS OF CARBON FIBER Yasuo Kogo 1, Yuta Imafuku 2, and Shinji Ogihara 3 1 Dept. of Materials Science, Tokyo University of Science, 2641, Yamazaki, Noda, Chiba 278-8510,
FME201 Solid & Structural Mechanics I Dr.Hussein Jama Office 414
 FME201 Solid & Structural Mechanics I Dr.Hussein Jama Hussein.jama@uobi.ac.ke Office 414 Lecture: Mon 11am -1pm (CELT) Tutorial Tue 12-1pm (E207) 10/1/2013 1 CHAPTER OBJECTIVES Show relationship of stress
Chapter 2: Mechanical Behavior of Materials
 Chapter : Mechanical Behavior of Materials Definition Mechanical behavior of a material relationship - its response (deformation) to an applied load or force Examples: strength, hardness, ductility, stiffness
ME254: Materials Engineering Second Midterm Exam 1 st semester December 10, 2015 Time: 2 hrs
 ME254: Materials Engineering Second Midterm Exam 1 st semester 1436-1437 December 10, 2015 Time: 2 hrs Problem 1: (24 points) A o = π/4*d o 2 = π/4*17 2 = 227 mm 2 L o = 32 mm a) Determine the following
QUASI-STATIC NANOINDENTATION STUDY OF PHERITE-MARTENSITE DUAL PHASE STEEL
 QUASI-STATIC NANOINDENTATION STUDY OF PHERITE-MARTENSITE DUAL PHASE STEEL Igor BARÉNYI * Jozef MAJERÍK 2 Assoc. prof. Ing. Igor Barényi, PhD., Faculty of special technology, Alexander Dubcek University
Failure Mechanism for Large-Sized Grouted Anchor Bolt under Tensile Load
 Failure Mechanism for Large-Sized Grouted Anchor Bolt under Tensile Load Nam-Ho Lee 1), Il-Hwan Moon 1), and In-Soo Ju 1) 1) Department of Civil/Architectural Engineering, Korea Power Engineering Company,
MECHANICAL PROPERTIES OF MATERIALS
 MECHANICAL PROPERTIES OF MATERIALS Stress-Strain Relationships Hardness Effect of Temperature on Properties Fluid Properties Viscoelastic Behavior of Polymers Mechanical Properties in Design and Manufacturing
Transients of deformation at nanoscale observed in displacement controlled nanoindentation testing
 Transients of deformation at nanoscale observed in displacement controlled nanoindentation testing Ude D. Hangen Hysitron Inc., Gottfried Hagen Strasse 60, 51105 Köln, Germany E-mail: uhangen@hysitron.com
Practicum 01: Instrumentation and an Introduction to Nanoscale Measurement
 Practicum 01: Instrumentation and an Introduction to Nanoscale Measurement Objective: Teach the fundamentals of measurement science and the NanoGuru instrumentation Practicum 01 introduces the student
PLASTIC DEFORMATION AND THE ONSET OF TENSILE INSTABILITY
 PLASTIC DEFORMATION AND THE ONSET OF TENSILE INSTABILITY Introduction In this experiment the plastic deformation behavior and the onset of plastic instability of some common structural alloys is investigated.
Nanoindentation stress-strain for Fracture Analysis and computational modeling for hardness and modulus
 Nanoindentation stress-strain for Fracture Analysis and computational modeling for hardness and modulus A.S.Bhattacharyya, S, Priyadarshi, Sonu, S. Shivam, S. Anshu Centre for Nanotechnology Central University
CHEM-E2105. Wood and Wood Products
 CHEM-E2105 Wood and Wood Products Mechanical properties II: The fracture & toughness of wood Mark Hughes 24 th February 2016 Toughness The worst sin in an engineering material is not lack of strength or
MACROSTRUCTURE, MICROSTRUCTURE AND MICROHARDNESS ANALYSIS
 109 Chapter 5 MACROSTRUCTURE, MICROSTRUCTURE AND MICROHARDNESS ANALYSIS 5.1 INTRODUCTION The microstructural studies of friction welding helps in understanding microstructural changes occurred during friction
Mechanical Behavior and Characterization of Stern-shaft Mechanical Sealing Device. Yongjin Lu a *, Rui Lin
 3rd International Conference on Material, Mechanical and Manufacturing Engineering (IC3ME 2015) Mechanical Behavior and Characterization of Stern-shaft Mechanical Sealing Device Yongjin Lu a *, Rui Lin
ENGR 151: Materials of Engineering LECTURE #12-13: DISLOCATIONS AND STRENGTHENING MECHANISMS
 ENGR 151: Materials of Engineering LECTURE #12-13: DISLOCATIONS AND STRENGTHENING MECHANISMS RECOVERY, RECRYSTALLIZATION, AND GRAIN GROWTH Plastically deforming metal at low temperatures affects physical
C. T. Liu Air Force Research Laboratory AFRRL/PRSM 10 E. Saturn Blvd. Edwards AFB CA
 NEAR TIP BEHAVIOR IN A PARTICULATE COMPOSITE MATERIAL UNDER CONSTANT STRAIN RATE INCLUDING TEMPERATURE AND THICKNESS EFFECTS ABSTRACT C. T. Liu Air Force Research Laboratory AFRRL/PRSM 10 E. Saturn Blvd.
The Failure Behavior of Composite Honeycomb Sandwich Structure with. Stringer Reinforcement and Interfacial Debonding
 ICCM015, 14-17 th July, Auckland, NZ The Failure Behavior of Composite Honeycomb Sandwich Structure with Stringer Reinforcement and Interfacial Debonding *Ruixiang Bai 1, S.H. Bao ¹, X.Y. Liu, and X.H.
Certification of Discontinuous Composite Material Forms for Aircraft Structures: Stiffness and Strength Predictions
 Certification of Discontinuous Composite Material Forms for Aircraft Structures: Stiffness and Strength Predictions Karen Harban and Mark Tuttle Dept Mechanical Engineering University of Washington AMTAS
بسم الله الرحمن الرحیم. Materials Science. Chapter 7 Mechanical Properties
 بسم الله الرحمن الرحیم Materials Science Chapter 7 Mechanical Properties 1 Mechanical Properties Can be characterized using some quantities: 1. Strength, resistance of materials to (elastic+plastic) deformation;
INSTRUCTION PROFESSOR K. KOMVOPOULOS. Mechanical Behavior of Engineering Materials (ME 108) (Undergraduate course, junior/senior level)
 (Undergraduate course, junior/senior level)") INSTRUCTION PROFESSOR K. KOMVOPOULOS. Mechanical Behavior of Engineering Materials (ME 108) (Undergraduate course, junior/senior level) Part I Microstructure and Deformation of Materials Alloying and Hardening
INSTRUCTION PROFESSOR K. KOMVOPOULOS. Mechanical Behavior of Engineering Materials (ME 108) (Undergraduate course, junior/senior level) Part I Microstructure and Deformation of Materials Alloying and Hardening
Welcome to ENR116 Engineering Materials. This lecture summary is part of module 2, Material Properties.
 Welcome to ENR116 Engineering Materials. This lecture summary is part of module 2, Material Properties. 1 2 Mechanical properties. 3 The intended learning outcomes from this lecture summary are that you
Module 8: Composite Testing Lecture 36: Quality Assessment and Physical Properties. Introduction. The Lecture Contains
 Introduction In the previous lecture we have introduced the needs, background and societies for mechanical testing of composites. In this lecture and subsequent lectures we will see principles for the
Analyzing Time on Sample During Nanoindentation
 Material Science Research India Vol. 13(2), 74-79 (216) Analyzing Time on Sample During Nanoindentation A.S.Bhattacharyya 1,2 *, P. Kumar 1, N.Rajak 1, R.P.Kumar 1, A. Sharma 1, G.Acharya 1 and V.Ranjan
THE USE OF FIELD INDENTATION MICROPROBE IN MEASURING MECHANICAL PROPERTIES OF WELDS
 Recent Trends in Welding Science and Technology - TWR 89 Proceedings of the 2 nd International Conference on Trends in Welding Research Gatlinburg, Tennessee USA 14-18 May 1989 THE USE OF FIELD INDENTATION
High Temperature Materials. By Docent. N. Menad. Luleå University of Technology ( Sweden )
") of Materials Course KGP003 Ch. 6 High Temperature Materials By Docent. N. Menad Dept. of Chemical Engineering and Geosciences Div. Of process metallurgy Luleå University of Technology ( Sweden ) Mohs scale
of Materials Course KGP003 Ch. 6 High Temperature Materials By Docent. N. Menad Dept. of Chemical Engineering and Geosciences Div. Of process metallurgy Luleå University of Technology ( Sweden ) Mohs scale
Research in Experimental Solid Mechanics. Krishna Jonnalagadda Mechanical Engineering Indian Institute of Technology Bombay
 Research in Experimental Solid Mechanics Krishna Jonnalagadda Mechanical Engineering Indian Institute of Technology Bombay TEQIP Workshop - Experimental Solid Mechanics Indian Institute of Technology Bombay
Sharp Contact Damage in Ion-Exchanged Cover Glass
 Engineering Conferences International ECI Digital Archives Functional Glasses: Properties And Applications for Energy and Information Proceedings Winter 1-8-2013 Sharp Contact Damage in Ion-Exchanged Cover
PRESTRESSED CONCRETE STRUCTURES. Amlan K. Sengupta, PhD PE Department of Civil Engineering Indian Institute of Technology Madras
 PRESTRESSED CONCRETE STRUCTURES Amlan K. Sengupta, PhD PE Department of Civil Engineering Indian Institute of Technology Madras Module 5: Analysis and Design for Shear and Torsion Lecture-23: Analysis
CHAPTER 3 OUTLINE PROPERTIES OF MATERIALS PART 1
 CHAPTER 3 PROPERTIES OF MATERIALS PART 1 30 July 2007 1 OUTLINE 3.1 Mechanical Properties 3.1.1 Definition 3.1.2 Factors Affecting Mechanical Properties 3.1.3 Kinds of Mechanical Properties 3.1.4 Stress
FAILURE MECHANISM OF Cu-Al 2 O 3 MICRO AND NANOMATERIALS OBSERVED BY "IN-SITU TENSILE TEST IN SEM"
 Powder Metallurgy Progress, Vol.14 (2014), No 4 228 FAILURE MECHANISM OF Cu-Al 2 O 3 MICRO AND NANOMATERIALS OBSERVED BY "IN-SITU TENSILE TEST IN SEM" M. Besterci, K. Sülleiová, B. Ballóková, O. Velgosová,
27th Risø International Symposium on Materials Science, Polymer Composite Materials for Wind Power Turbines, 2006
 27th Risø International Symposium on Materials Science, Polymer Composite Materials for Wind Power Turbines, 2006 SIMULATION OF CRACK INITIATION AND PROPAGATION IN AN ADHESIVE LAYER USING A MESOMECHANICAL
Study of Thickness Effect on Fracture Toughness of High Grade Pipeline Steel
 Study of Thickness Effect on Fracture Toughness of High Grade Pipeline Steel Hua ZHANG 1,,a,*, Hong ZHANG 1,b, Xinwei ZHAO,c,Yalong WANG,d and Na LI.e 1 China University of Petroleum-Beijing, Beijing 1049,China
Introduction to Engineering Materials ENGR2000 Chapter 8: Failure. Dr. Coates
 Introduction to Engineering Materials ENGR2000 Chapter 8: Failure Dr. Coates Canopy fracture related to corrosion of the Al alloy used as a skin material. 8.2 Fundamentals of Fracture Fracture is the separation
Mechanical Properties of Metals. Goals of this unit
 Mechanical Properties of Metals Instructor: Joshua U. Otaigbe Iowa State University Goals of this unit Quick survey of important metal systems Detailed coverage of basic mechanical properties, especially
Module 3 Machinability. Version 2 ME IIT, Kharagpur
 Module 3 Machinability Lesson 14 Failure of cutting tools and tool life Instructional objectives At the end of this lesson, the students will be able to (i) (ii) (iii) (iv) (v) State how the cutting tools
Energy Dissipation Mechanism Based Materials and Materials Systems Design
 Energy Dissipation Mechanism Based Materials and Materials Systems Design Wing Kam Liu w-liu@northwestern.edu Walter P. Murphy Professor of Mechanical and Civil Engineering President, International Association
Tensile/Tension Test Advanced Topics
 CIVE.3110 Engineering Materials Laboratory Fall 2017 Tensile/Tension Test Advanced Topics Tzuyang Yu Associate Professor, Ph.D. Structural Engineering Research Group (SERG) Department of Civil and Environmental