RNA-Seq data analysis
|
|
|
- Imogen Gibson
- 6 years ago
- Views:
Transcription
1 RNA-Seq data analysis
2 Material Slides: pdf : one per page pdf : three per page with comment lines Memento: Hands on: Data files: Results files:


3 The speakers Sarah Maman Christine Gaspin Céline Noirot Matthias Zytnicki Claire Hoede Cédric Cabau Nathalie Villa-Vialaneix (pour la partie biostat)
4 Session organisation Day 1 Morning (9h00-12h30) : - Prerequisite unix/format Exercises - Biological reminds Day 2 Morning (9h00-12h30) : - Spliced read mapping Exercises and Visualisation - Expression quantification Theory + exercises Afternoon (14h-17h) : - Sequence quality Theory + exercises - Spliced read mapping Theory Afternoon (14h-17h) : - mrna calling Theory + exercises - Models comparison Theory + exercises
5 Prerequisite unix
6 Summary - Unix reminders Genotoul infrastructure organisation How to connect to genotoul How to transfer data From the web to genotoul From genotoul to your computer How to launch jobs on the cluster...
 CPU CPU CPU")
7 Vocabulary : Cluster / Node Cluster : set of nodes Node : Huge computer (with several CPUs) CPU CPU CPU CPU

8 «genotoul» cluster node001 à 068 : 2720 INTEL cores, 17TB of memory qlogin qrsh ssh Ceri001 à 034 : 1632 AMD cores 12TB of memory Bigmem01 : 64 INTEL cores 1TB of memory smp : 240 INTEL cores 3TB of memory Internet «genotoul» login nodes computer nodes Storage Facilities
 + Putty (Connection) MobaXterm (Executable file) command line:")
9 How to connect to genotoul? Xming (Windows graphic) + Putty (Connection) MobaXterm (Executable file) command line: in a Terminal windows ssh username@genotoul.toulouse.inra.fr
10 Linux Linux account Access to a work environment Login + password Share resources (Cpu, memory, disk) Usage of software installed Free access to computational cluster Own space disk (/save & /work directory)
11 Linux Which are the main unix/linux commands you know?
12 Linux Three standard fluxes are opened when you launch a command: Stdin : standard Input Stdout: standard output (default: screen) Stderr: standard error output (default: screen)
13 Linux Redirections with specific operators > : redirection of standard output Ex: ls * > Liste_file < : redirection of standard input Ex: RNAfold < file.fa > Result.out >> : redirection of standard output with concatenation >& : redirection of standard error and output (pipe) : redirection of standard output on standard input
14 Linux & Genotoul Bioinfo file organization Tree organization: root represented by / (slash) Disk spaces on Genotoul Bioinfo / Usr bank /usr/local/bioinfo/src home work save.. Bioinformatics Software /bank/ International genomics Databanks /home/ User configuration files (ONLY) (100 MB user quota) /work/ HPC computational disk space (TEMPORARY) (1 TB user quota) /save/ User disk space (with BACKUP) (250 GB user quota)
15 Linux Essential commands Help pn commands man cmde Where I am in the tree? pwd Moving in the tree cd dir_name move to dir_name child directory cd.. move to parent directory List directory content ls list the content of current directory Visualize file content cat f_name, more f_name, head f_name, tail f_name Others cp, mv, rm, mkdir, rmdir, which, grep, wc...
 x (or - ): indicates execution permission (or absence of")
16 Linux Access rights r (or - ): indicates the presence (or absence) of permission to read and copy the file w (or - ): indicates write permission (or absence of permission) x (or - ): indicates execution permission (or absence of permission)
17 Very Important Tips Copy / Paste with the mouse Select a text (it is automatically copied) Click on the mouse wheel (the text is pasted where the cursor is located) Command and path completion : Use the TAB key Back to the previously used commands : Use the «up» and «down» keys
18 How to use Genotoul Bioinfo resources?
19 OGE (Open Grid Engine) Queues availables for users Queue Access Priority Max time Max slots workq (default) everyone H 4120 unlimitq everyone 100 unlimited 680 smpq on demand 0 unlimited 240 hypermemq on demand 0 unlimited 96 Interq (qlogin) everyone H 40 galaxyq galaxy users No node shared unlimited 120
20 OGE (Open Grid Engine) Characteristics of work working space Workq 1 core 8 GB memory maximum Write only /work directory (temporary disk space) Work space 1 TB quota disk per user (on /work directory) 120 days files without access automatic purged Time resource constraint H annually computing time (more on demand)
21 OGE (Open Grid Engine) qlogin (with display) / qrsh or qrsh -X Connected Disconnected [laborie@genotoul2 ~]$ qlogin Your job ("QLOGIN") has been submitted waiting for interactive job to be scheduled... Your interactive job has been successfully scheduled. Establishing /SGE/ogs/inra/tools/qlogin_wrapper.sh session to host node [laborie@node001 ~]$ [laborie@node001 ~]$ exit logout /SGE/ogs/inra/tools/qlogin_wrapper.sh exited with exit code 0 [laborie@genotoul2 ~]$
22 OGE (Open Grid Engine) Job Submission : some examples Script edition $nedit myscript.sh ### head of myscript.sh ### #!/bin/bash #$ -m a #$ -l mem=32g #$ -l h_vmem=36g #Mon programme commence ici ls ### end of myscript.sh ### Submission $qsub myscript.sh Your job ("mon_script.sh") has been submitted
23 OGE (Open Grid Engine) qsub : batch Submission 1 - First write a script (ex: myscript.sh) with the command line as following: #$ -N job_name to give a name to the job #$ -o /work/.../output_file_name to redirect output standard #$ -e /work/.../error_file_name error_file_name : to redirect error file #$ -q workq queue_name : to specify the batch queue #$ -m bea mail sending : (b:begin, a:abort, e:end) #$ -l mem=8g to ask for 8GB of mem (minimum reservation) #$ -l h_vmem=10g to fix the maximum consumption of memory # My command lines I want to run on the cluster blastall -d swissprot -p blastx -i /save/.../z72882.fa 2 - Then submit the job with the qsub command line as following: $qsub myscript.sh Your job ("mon_script.sh") has been submitted
24 OGE (Open Grid Engine) Job Submission : some examples Default (workq, 1 core, 8 GB memory max) $qsub myscript.sh Your job ("mon_script.sh") has been submitted More memory (workq, 1 core, 32 / 36 GB memory) $qsub -l mem=32g -l h_vmem=36g myscript.sh Your job ("mon_script.sh") has been submitted More cores (workq, 8 core, 8*8 GB memory) $qsub -l parallel smp 8 myscript.sh Your job ("mon_script.sh") has been submitted
25 OGE (Open Grid Engine) Monitoring jobs : qstat $qstat job-id prior name user state submit/start queue slots ja-task-id Job-ID : prior : name : user : state : submit/start at : Queue : slots : ja-task-id : job identifier priority of job job name user name actual state of job (see follow) submit/start date batch queue name number of slots aked for the job job array task identifier (see follow) qstat -u my_login more
26 OGE (Open Grid Engine) Monitoring jobs : qstat state : actually state of job d(eletion) : job is deleting E(rror) : job is in error state h(old), w(waiting) : job is pending t(ransferring) : job is about to be executed r(unning) : job is running man qstat : to see all options of qstat command
27 OGE (Open Grid Engine) Deleting a job : qdel $qstat -u laborie job-id prior name user state submit/start at queue slots ja-task-id sleep laborie r 02/25/ :23:03 workq@node002 1 $ qdel laborie has registered the job for deletion
28 Array of jobs concept Concept : segment a job into smaller atomic jobs Improve the processing time very significantly (the calculation is performed on multiple processing cores)
29 blast in job array mode split... blastx+ -d nt -i seq1.fa blastx+ -d nt -i seq2.fa blastx+ -d nt -i seq3.fa for i in... qarray script.sh Execution on 3 cores
 Winscp / scp wget http:// «genotoul»")
30 Downloading / transferring Several possible cases Internet browser ( + save as) Winscp / scp wget «genotoul» server
31 Downloading / transferring File download from Internet to «genotoul server»: Copy the URL of the file to download wget
32 Downloading / transferring Transfer between genotoul and desktop computer We recommend to use «scp» command (secure copy) scp [user@host1:]file1 [user@host2:]file2 copy file from the network Example copy from desktop to "genotoul": scp source_name bleuet@genotoul:destination_name

33 Downloading / transferring WinSCP / FileZilla : copy via graphical interface
34 Introduction to NGS formats
35 Summary - Format remind
36 fastq format Standard for storing outputs of HTS A text-based format for storing a read and its corresponding quality scores 1 read <-> 4 1:N:0:ATTCAGAATAATCTTA NCTAAGTGTTAGGGGGTTTCCGCCCCTTAGTGCTGCAGCTAACGCATTAAGCACTCCGCCTGGGGAGTACGGTCGCAAGACTGAAAA + #<3?BFGGGGGGEGGGGGGGEGGGGGG@F1FGGGGGGDDGG1FB</9FE=EGGGGGGGG>GGGGBGGGGG<<C/BDGGGGGGC=GGG Begins with '@' character and is followed by a sequence identifier The raw sequence Begins with a '+' character and is optionally followed by the same sequence identifier Encodes the quality values for th read, contains the same number of symbols as letters in the read

37 fastq format Sequence 1:Y:18:ATCACG 1. Begins with character and is followed by a sequence identifier

38 fastq format Base quality (Sanger 1:N:0:ATTCAGAATAATCTTA NCTAAGTGTTAGGGGGTTTCCGCCCCTTAGTGCTGCAGCTAACGCATTAAGCACTCCGCCTGGGGAGTACGGTCGCAAGACTGAAAA + #<3?BFGGGGGGEGGGGGGGEGGGGGG@F1FGGGGGGDDGG1FB</9FE=EGGGGGGGG>GGGGBGGGGG<<C/BDGGGGGGC=GGG ASCII-encoded version of the PHRED quality given by SANGER=PHRED+33 : H=ASCII(40+33)

39 fastq format la proba d'une erreur :
40 Sequence Alignment/Map (SAM) format Data sharing was a major issue with the 1000 genomes Capture all of the critical information about NGS data in a single indexed and compressed file (bam) Generic alignment format Supports short and long reads (454 Solexa Solid) Flexible in style, compact in size, efficient in random access Website : Paper : Li H.*, Handsaker B.*, Wysoker A., Fennell T., Ruan J., Homer N., Marth G., Abecasis G., Durbin R. and 1000 Genome Project Data Processing Subgroup (2009) The Sequence alignment/map (SAM) format and SAMtools. Bioinformatics, 25, [PMID: ]

41 Sequence Alignment/Map (SAM) format Header file : generic information Body file : read alignments

42 Sequence Alignment/Map (SAM) format Header file : generic information
43 Sequence Alignment/Map (SAM) format Header file: generic information Body file (alignment description) 11 mandatory fields Variable number of optional fields Tab delimited fields

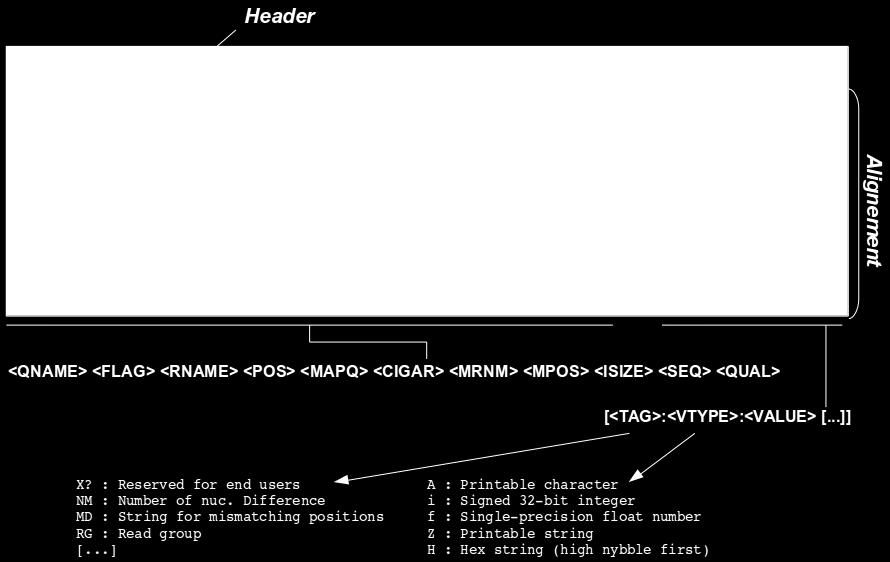
44 Sequence Alignment/Map (SAM) format
45 SAM format - Flag field Decimal values in sam lines Examples Other examples 0= ??? 99= ??? 147= ??? Picard tools

46 SAM format - cigar line M: match/mismatch S: softclip N: skipp I: insertion H: hardclip D: deletion P: padding
47 How to manipulate them? Samtools Picard tools Bedtools
48 Hands-on : unix & formats Training accounts : anemone aster camelia chardon cobee cosmos dahlia geranium arome bleuet capucine clematite coquelicot cyclamen digitale gerbera Exercise 1 : using basic unix commands Exercise 2 : format manipulation
49 Summary - Biological reminders Context, vocabulary, transcriptome variability... Methods to analyse transcriptomes What is RNAseq? High throughput sequencers Illumina protocol, paired-end library, directional library Retrieve public data and presentation of data for practical work

50 Different approaches : Alignment to De novo Reference transcriptome No reference genome, no transcriptome available Very expensive computationally Lots of variation in results depending on the software used Most are incomplete Computationally inexpensive Reference genome When available Allow reads to align to unannotated sites Computationally expensive Need a spliced aligner
51 Context Prerequis : Reference genome available RNAseq sequencing (sequence of transcript) Try to answer to : How to map transcript to the genome? How to discover new transcript? What are the alternative transcript? Source : en.wikipedia.org/wiki/user:forluvoft/sandbox
52 Vocabulary Gene : functional units of DNA that contain the instructions for generating a functional product. UTR Exon1 Promoter region Intron Exon2 Intron UTR Exon3 TSS Exon : coding region of mrna included in the transcript Intron : non coding region TSS : Transcription Start Site 1st amino acid Transcript : stretch of DNA transcribed into an RNA molecule
53 Transcription products Protein coding gene: transcribed in mrna ncrna : highly abundant and functionally important RNA trna, rrna, snornas, micrornas, sirnas, pirnas lincrna
54 ENCODE

55 Alternative splicing Alternative splicing (or differential splicing) the exons are reconnected in multiple ways during RNA splicing. different mrnas translated into different protein isoforms a single gene may code for multiple proteins. Intron Retention Post-transcriptional modification (eukaryotic cells) eg: the conversion of precursor messenger RNA into mature mrna (mrna), editing...

56 Transcript degradation mrna export to the cytoplasm, protected from degradation by a 5 cap structure and a 3 polya tail. the polya tail is gradually shortened by exonucleases the degradation machinery rapidly degrades the mrna in both in directions. others mechanisms, bypass the need for deadenylation and can remove the mrna from the transcriptional pool independently.

57 Cis-natural antisense transcript Natural antisense transcripts (NATs) are a group of RNAs encoded within a cell that have transcript complementarity to other RNA transcripts.
58 Fusion genes A fusion gene is a hybrid gene formed from two previously separate genes. It can occur as the result of a translocation, interstitial deletion, or chromosomal inversion. Often, fusion genes are oncogenes. They often come from trans-splicing : Trans-splicing is a special form of RNA processing in eukaryotes where exons from two different primary RNA transcripts are joined end to end and ligated.
59 Transcriptome variability Many types of transcripts (mrna, ncrna...) Many isoform (non canonical splice sites, intron retention...) Number of transcripts 6 possible variation factor between transcripts: 10 or more, expression variation between samples. Allele specific expression
60 How can we study the transcriptome? Techniques classification PCR/RT-QPCR EST SAGE MicroArrays No quantification Quantification Quantification Indirect quantification Low throughput Low throughput (up to hundreds) Low throughput (up to thousands) High throughput (up to millions) Discovery (Yes) No No Discovery (Yes) Need transcript sequence partially known Difficulties in discovering novels splice events
61 What is different with RNA-Seq? No prior knowledge of sequence needed Specificity of what is measured Increased dynamic range of measure, more sensitive detection Direct quantification Good reproducibility Different levels : genes, transcripts, allele specificity, structure variations New feature discovery: transcripts, isoforms, ncrna, structures (fusion...) Possible detection of SNPs,...

62 SGS platforms
63 SGS platforms
64 PacBio : ISOseq Produce full-length transcripts without assembly (up to 10 kb in length) Discover isoform Can not be used for differential expression analysis

65 MinION Available now for sequencing cdnas Longest read length: 98kb Median read length: 1kb Mean read length: 2kb Coming next: direct analysis of RNA RNA modifications PCR-free protocols Increased accuracy compared to using reverse transcriptases

66 What are we looking for? Identify genes List new genes Identify transcripts List new alternative splice forms Quantify these elements differential expression
67 Usual questions on RNA-Seq! How many replicates? Technical or/and biological replicates? How many reads for each sample? How many conditions for a full transcriptome? How long should my reads be? Single-end or paired-end?
68 Depth VS Replicates Encode (2016) : Experiments should be performed with two or more biological replicates, unless there is a compelling reason why this is impractical or wasteful Replicate concordance: the gene level quantification should have a Spearman correlation of >0.9 between isogenic (same donor) replicates and >0.8 between anisogenic (different donor) replicates. Between 30M and 100M reads per sample depending on the study. evaluate the similarity between the transcriptional profiles of two polya+ samples ==> modest depths of sequencing. discovery of novel transcribed elements and strong quantification of known transcript isoforms ==> more extensive sequencing. Zhang et al : From 3 replicates improve DE detection and control false positive rate.

69 Depth VS Replicates

70 Illumina RNA-Seq protocol 1 Flowcell: in general 1 run equivalent to 8 Lane Hiseq 2500: 2 Billion reads single or 4 Billion paired reads.
71 RNA-Seq library preparation


72 Clusters generation / Sequencing

73 Paired-end sequencing Modification of the standard single-read DNA library preparation facilitates reading both ends of each fragment Improvement of mapping Help to detect structural variations in the genome like insertions or deletions, copy number variations, and genome rearrangements
74 Paired-end VS single-end Single-end Paired-end sequence fragment 1 sequence fragment 1 (forward) (c)dna sequence fragment 2 alignement genome gene The cdna size hive the insert size (ex pb). The fragment are usually forward-reverse. (rev)
75 Strand specific RNA-Seq protocol
76 Retrieve public data Why? Because there s a lot of public data that would be sufficient for your analysis The authors often use only part of the data to answer their own problems Perhaps you don t need your own data

77 Retrieve public data

78 Retrieve public data

79 Retrieve public data

80 Retrieve public data

81 Retrieve public data
82 Retrieve public data


83 Retrieve public data
 fastq-dump sra_file.")
84 Retrieve public data prefetch <sra_accession> --max-size (20G by default) fastq-dump sra_file.sra
85 Summary - Sequence quality Known RNAseq biais How to check the quality? How to clean the data?
86 RNAseq specific bias Influence of the library preparation Random hexamer priming Positional bias and sequence specificity bias. Robert et al. Genome Biology, 2011,12:R22 Transcript length bias Some reads map to multiple locations (??)
87 Hexamer random priming bias


88 Hexamer random priming bias A strong distinctive pattern in the nucleotide frequencies of the first 13 positions at the 5'-end : sequence specificity of the polymerase due to the end repair performed Reads beginning with a hexamer over-represented in the hexamer distribution at the beginning relative to the end are down-weighted

89 Hexamer random effect Orange = reads start sites Blue = coverage


90 Transcript length bias the differential expression of longer transcripts is more likely to be identified than that of shorter transcripts
91 Bias mappability Quality of the reference genome influence results assembly finishing Sequence composition Repeated sequences Annotation quality


92 Verifying RNA-Seq quality FastQC : Has been developed for genomic data
, slightly abnormal (orange triangle) or very unusual (red cross).")
93 fastqqc Report The analysis in FastQC is performed by a series of analysis modules. Quick evaluation of whether the results of the module seem : entirely normal (green tick), slightly abnormal (orange triangle) or very unusual (red cross). These evaluations must be taken in the context of what you expect from your library. A 'normal' sample as far as FastQC is concerned is random and diverse.


94 fastqqc Report Statistics per Base Sequence Quality This view shows an overview of the range of quality values across all bases at each position in the FastQ file. Common to see base calls falling into the orange area towards the end of a read.

95 fastqqc Report Statistics per Sequence Quality Score See if a subset of your sequences have universally low quality values.


96 fastqqc Report Statistics per Base N Content This module plots out the percentage of base calls at each position for which an N was called. Usual to see a very low proportion of Ns appearing nearer the end of a sequence.


97 fastqqc Report Statistics Per Base Sequence Content Per Base Sequence Content plots out the proportion of each base position in a file for which each of the four normal DNA bases has been called. In a random library : little/no difference between the different bases of a sequence run, so the lines in this plot should run parallel with each other. If strong biases which change : overrepresented sequence contaminating your library. RNA-seq OK


98 fastqqc Report Statistics per Base GC Distribution Per Base GC Content plots out the GC content of each base position in a file. Random library : little/no difference between the different bases of a sequence run => plot horizontally. The overall GC content should reflect the GC content of the underlying genome. GC bias: changes in different bases, overrepresented sequence contaminating your library. => plot not horizontally. RNA-seq OK


99 fastqqc Report Statistics per Sequence GC Content This module measures the GC content across the whole length of each sequence in a file and compares it to a modeled normal distribution of GC content.

100 fastqqc Report Statistics per Sequence Length Distribution Some sequence fragments contain reads of wildly varying lengths. Even within uniform length libraries some pipelines will trim sequences to remove poor quality base calls from the end.


101 fastqqc Report Statistics per Duplicate Sequences High level of duplication indicate an enrichment biais. RNA-seq OK


102 fastqqc Report Overrepresented Kmers A kmer is a subsequence of length k Should spot overrepresented sequences, give a good impression of any contamination. Kmers showing a rise towards the end of the library indicate progressive contamination with adapters. Check for adaptor sequence or poly-a sequence RNA-seq OK
103 Take home message on quality analysis Elements to be checked : Random priming effect K-mer (polya, polyt) Adaptor presence Alignment on reference for the second quality check and filtering. A good run?: Expected number of reads produced (2x 2 billions / flowcell), Length of the reads expected (150pb), Random selection of the nucleotides and the GC%, Good alignment: very few unmapped reads, pairs mapped on opposite strands.
104 Cleaning analysis Cleaning : Low quality bases Adaptors Software : Trim_galore Cutadapt Trimmomatic Sickle PRINSEQ...
105 Cutadapt Searches & removes adapter & tag in all reads. Trim quality Filter too short or untrimmed reads (in a separate output file). cutadapt -a ADAPTER [options] [-o output.fastq] input.fastq Ex.: cutadapt -a AACCGGTT -o output.fastq input.fastq (3 adapter, single read) Input file : fasta, fastq or compressed (gz, bz2, xz). Source :

106 Cutadapt Cutadapt supports trimming of paired-end reads, trimming both reads in a pair at the same time. Processing both files at the same time is highly recommended.
107 Sickle Sickle trims the ends of the reads having poor quality. It s using sliding window instead of brutal threshold like cutadapt. Window length is 0.1 times the length of the read. The window slides along the quality values until the average quality in the window rises above the threshold, at which point the algorithm determines where within the window the rise occurs and cuts the read and quality there for end cut.
108 Hands-on: quality control Data for the exercises: - from Mohammed Zouine (ENSAT) - tomato wild type and mutant type (without seeds) with the transcription factor Sl-ARF8 (auxine response factor 8) overexpressed - clonal lineage - paired, 100 pb non stranded - triplicated - in the publication process - subsampled on chromosome 6 for faster analysis Use FastQC, cutadapt and sickle Exercise 3 : quality control of used datasets Exercise 4: cleaning used datasets
109 Analysis workflow Sample 1 RNA-seq reads Transcript modelling cufflinks Mapping STAR Tr/Gn Quantification RSEM Merge cuffmerge Tr/Gn Quantification RSEM Sample N RNA-seq reads Tr/Gn Quantification RSEM Ref Tr/Gn quantif. Sample 1 Ref. gene Genome annotation Mapping STAR Mapping STAR Ref Tr/Gn quantif. Sample N Novel gene Genome annotation Tr/Gn Quantification RSEM Transcript modelling cufflinks Novel Tr/Gn quantif. Sample 1 Mapping STAR Novel Tr/Gn quantif. Sample N
110 Analysis workflow Sample 1 RNA-seq reads Transcript modelling cufflinks Mapping STAR Tr/Gn Quantification RSEM Merge cuffmerge Tr/Gn Quantification RSEM Sample N RNA-seq reads Tr/Gn Quantification RSEM Ref Tr/Gn quantif. Sample 1 Ref. gene Genome annotation Mapping STAR Mapping STAR Ref Tr/Gn quantif. Sample N Novel gene Genome annotation Tr/Gn Quantification RSEM Transcript modelling cufflinks Novel Tr/Gn quantif. Sample 1 Mapping STAR Novel Tr/Gn quantif. Sample N
111 Summary Spliced read mapping & Visualisation What is a spliced aligner? Reference genome & transcriptome files formats Tophat principle STAR principle and usage BAM & Bed files formats Visualisation with IGV
112 Aim Spliced read mapping & Visualisation Aim: Discover the true location (origin) of each read on the reference. Problems: Some features (repetitive regions, assembly errors, missing information) make it impossible for some reads. Reads may be split by potentially thousands of bases of intronic sequence. And: Do it in/with reasonable time/resources.
113 Splice sites Canonical splice site: which accounts for more than 99% of splicing GT and AG for donor and acceptor sites Non-canonical site: GC-AG splice site pairs, AT-AC pairs Trans-splicing: splicing that joins two exons that are not within the same RNA transcript
 Repeats Reads spanning 3+ exons Gene or")

114 Hard case Lot of variations (sequencing errors, mutations) Repeats Reads spanning 3+ exons Gene or pseudogene Small end anchor Kim et al, Genome Biology, 2013 Unknown junction inside poorly rarely expressed gene


115 Most used tools Tools for splice-mapping: - Tophat: - STAR:
116 Comparing tools How to compare tools? sensibility (maximize #mapped reads) specificity (assign reads to the correct position) for reads and for junctions processing time memory requirement All of these are conflicting criteria...

117 RGASP3 The RNA-seq Genome Annotation Assessment Project Engström et al., Nature Methods, 2013

118 RGASP3 The RNA-seq Genome Annotation Assessment Project Engström et al., Nature Methods, 2013

119 RGASP3 The RNA-seq Genome Annotation Assessment Project Engström et al., Nature Methods, 2013

120 Other benchmark Basically similar conclusions...
121 Mapping steps Indexing reference (only once) Mapping reads using index FA index FQ BD map BAM

122 TopHat pipeline Numerous steps to resolve hard cases Each step uses of heuristics with parameters users have to define a value u/software/topha t Kim et al, Genome Biology, 2013

123 An other aligner : STAR Spliced Transcripts Alignment to a Reference Outperforms other aligners by more than a factor of 50 in mapping speed

124 STAR Another strategy: search for a MMP from the 1st base MMP search repeated for the unmapped portion next to the junction do it in both fwd and rev directions cluster seeds from the mates of paired-end RNA-seq reads Soft-clipping is the main difference between Tophat and STAR Dobin et al, Bioinformatics, 2011

125 Two passes strategy «Improved ability to align reads by short spanning lengths is sufficient to explain the quantification benefit of two-pass alignment» Veeneman et al, Bioinformatics, 2016
126 STAR indexing Hands-on: Type STAR and count the number of options. Core command: STAR --runmode genomegenerate --genomedir genome_dir --genomefastafiles genome.fasta To use N CPUs, add: --runthreadn N If you have an annotation: --sjdbgtffile annot.gtf Some precomputed indices are already available: bin/star/stargenomes or on your preferred platform: /bank/stardb
127 Where to find a reference genome? Retrieving the genome file (fasta): The Genome Reference Consortium NCBI chromosome naming with not well supported by mapping software Prefer EMBL

128 Reference transcriptome file What is a GTF file? An annotation file: loci of coding genes (transcripts, CDS, UTRs), non-coding genes, etc. Gene Transfer Format (derived from GFF): chr source ENSEMBL ENSEMBL ENSEMBL ENSEMBL feature exon exon exon exon start end score.... strand frame.... [attributes] gene_id "ENSG01"; gene_id "ENSG01"; gene_id "ENSG01"; gene_id "ENSG02"; transcript_id transcript_id transcript_id transcript_id ENST01.1 ; ENST01.1 ; ENST01.2 ; ENST02.1 ; gene_name gene_name gene_name gene_name "ABC"; "ABC"; "ABC"; "DEF"; ENST01.1 ENSG02, ENST02.1, DEF ENST01.2 ENSG01, ABC - gene_id value : unique identifier for the gene. - transcript_id value : unique identifier for the transcript. The chromosome names should be the same in the gtf file and fasta files (e.g. chr1 vs Chr1 vs 1).
129 Hands-on : STAR Exercise n 5 A/ Create a directory for the genome and annotation files. Get the FASTA and GTF files from: seq/data/reference/ Create the STAR index. Tip: you can allocate N CPUs with the qsub/qrsh option -pe parallel_smp N
130 STAR mapping Core command: STAR --genomedir genome_dir --readfilesin reads1.fastq reads2.fastq [--sjdbgtffile annot.gtf --runthreadn n] If the read files are gzipped (reads1.fq.gz): --readfilescommand zcat Intron options: genomic gap is considered intron if --alignintronmin [21] --alignintronmax [500000] Max. number of mismatches: --outfiltermismatchnmax [10] Default options are probably tuned for mammalian genomes.
131 SAM / BAM formats Sequence Alignment/Map format: Each line stores an alignment/map Coor ref +r001/1 +r002 +r003 +r004 -r003 -r001/ AGCATGTTAGATAA**GATAGCTGTGCTAGTAGGCAGTCAGCGCCAT TTAGATAAAGGATA*CTG aaaagataa*ggata gcctaagctaa ATAGCT...TCAGC ttagcttaggc CAGCGGCAT name flag chr start mapq cigar nnext snext tlen seq qual tags r ref M2I4M1D3M = TTAGATAAAGGATACTG * r002 0 ref S6M1P1I4M * 0 0 AAAAGATAAGGATA * r003 0 ref S6M * 0 0 GCCTAAGCTAA * SA:Z:ref,29,-,6H5M,17,0; r004 0 ref M14N5M * 0 0 ATAGCTTCAGC * r ref H5M * 0 0 TAGGC * SA:Z:ref,9,+,5S6M,30,1; r ref M = 7-39 CAGCGGCAT * NM:i:1 Header stores genome VN:1.5 SN:ref LN:45
132 Fields Coor ref AGCATGTTAGATAA**GATAGCTGTGCTAGTAGGCAGTCAGCGCCAT +r001/1 +r002 +r003 +r004 -r003 -r001/2 TTAGATAAAGGATA*CTG aaaagataa*ggata gcctaagctaa ATAGCT...TCAGC ttagcttaggc CAGCGGCAT name flag chr start mapq cigar nnext snext tlen seq qual tags r ref M2I4M1D3M = TTAGATAAAGGATACTG * r002 0 ref S6M1P1I4M * 0 0 AAAAGATAAGGATA * r003 0 ref S6M * 0 0 GCCTAAGCTAA * SA:Z:ref,29,-,6H5M,17,0; r004 0 ref M14N5M * 0 0 ATAGCTTCAGC * r ref H5M * 0 0 TAGGC * SA:Z:ref,9,+,5S6M,30,1; r ref M = 7-39 CAGCGGCAT * NM:i:1 Flags: MapQ: similar to a phred score nnext: = means same chr In general, * means NA
133 CIGAR Coor ref +r001/1 +r002 +r003 +r004 -r003 -r001/ AGCATGTTAGATAA**GATAGCTGTGCTAGTAGGCAGTCAGCGCCAT TTAGATAAAGGATA*CTG aaaagataa*ggata gcctaagctaa ATAGCT...TCAGC ttagcttaggc CAGCGGCAT name flag chr start mapq cigar nnext snext tlen seq qual tags r ref M2I4M1D3M = TTAGATAAAGGATACTG * r002 0 ref S6M1P1I4M * 0 0 AAAAGATAAGGATA * r003 0 ref S6M * 0 0 GCCTAAGCTAA * SA:Z:ref,29,-,6H5M,17,0; r004 0 ref M14N5M * 0 0 ATAGCTTCAGC * r ref H5M * 0 0 TAGGC * SA:Z:ref,9,+,5S6M,30,1; r ref M = 7-39 CAGCGGCAT * NM:i:1 30M means 30 matches or mismatches I and D: insertion/deletion S and H: soft/hard clipping
134 Tags Coor ref +r001/1 +r002 +r003 +r004 -r003 -r001/ AGCATGTTAGATAA**GATAGCTGTGCTAGTAGGCAGTCAGCGCCAT TTAGATAAAGGATA*CTG aaaagataa*ggata gcctaagctaa ATAGCT...TCAGC ttagcttaggc CAGCGGCAT name flag chr start mapq cigar nnext snext tlen seq qual tags r ref M2I4M1D3M = TTAGATAAAGGATACTG * r002 0 ref S6M1P1I4M * 0 0 AAAAGATAAGGATA * r003 0 ref S6M * 0 0 GCCTAAGCTAA * SA:Z:ref,29,-,6H5M,17,0; r004 0 ref M14N5M * 0 0 ATAGCTTCAGC * r ref H5M * 0 0 TAGGC * SA:Z:ref,9,+,5S6M,30,1; r ref M = 7-39 CAGCGGCAT * NM:i:1 Format: 2-letter name:format:value (many different) NM: # mismatches SA: chimeric reads NH, HI: # hits for this sequence, hit index AS: alignment score
135 SAM / BAM BAM (Binary Alignment/Map) format: Compressed binary representation of SAM Greatly reduces storage space requirements to about 27% of original SAM samtools: reading, writing, and manipulating BAM files Most tools require a sorted and indexed BAM file.
136 STAR output options Output format: --outsamtype BAM SortedByCoordinate [SAM] Add more tags: --outsamattributes All Default output file name: Aligned.bam Modify prefix: --outfilenameprefix prefix Infer strand using intron motifs (for Cufflinks) --outsamstrandfield intronmotif [None] Start IH at --outsamattrihstart 0 [1] (for Cufflinks)
137 STAR other options Remove reads that did not pass the junction filter: --outfiltertype BySJOut [Normal] Filter out alignments with non-canonical intron motifs --outfilterintronmotifs RemoveNoncanonical Output SAM/BAM alignments to transcriptome into a separate file (for RSEM) --quantmode TranscriptomeSAM Two passes mode: STAR is run once and discover new junctions. STAR is run again, knowing the new junctions. (Probably most useful for poorly annotated genomes.)
138 STAR Outputs Outputs (w/o specific options except BAM SortedByCoordinate): Aligned.sortedByCoord.out.bam: list of read alignments in SAM format compressed Log.out: main log file with a lot of detailed information about the run (for troubleshooting) Log.progress.out: reports job progress statistics Log.final.out: summary mapping statistics after mapping job is complete, very useful for quality control. SJ.out.tab: contains high confidence collapsed splice junctions in tab-delimited format (chr, intron start, end, strand, intron motif, in database, # uniquely mapping reads, # multi, max. overhang)
139 STAR technical issues Temporary disk space: Indexing the mouse genome requires 128GB and 1 hour on 6 slots. Mapping a 16M paired-end reads requires 110GB and 4 mins on 6 slots. New platform cluster: 34 cluster nodes with 4 12 cores and 384 GB of ram per node: 1632 cores 1 hypermem node (32 cores and 1024 GB of ram) A scratch file system (157 To available, 6 Gbps bandwith)
140 Hands-on : STAR Exercise n 5 B/ Map the 2 FASTQ files. Do not forget to provide a different output file name for each set. Index the output BAM files with: samtools index file.bam Get some stats with: samtools flagstat file.bam

141 Quasi-mapping: Sailfish Patro et al, Nat. Biotech., 2014 Reads are not mapped. Transcriptome is cut into small chunks of small k-mers. Same for reads. Take a k-mer from a transcript, counts how many times you find it in reads. Average the counts over a transcript. Resolve ambiguous counts.
142 Quasi-mapping: why? Bray et al, Nat. Biotech., 2016 Other (most used) tool: kallisto, salmon
143 Quasi-mapping: limitations Heavily relies on a good annotation: Unannotated genes will not be counted and may bias other genes counts. Does not align reads: Cannot find variation (SNP) in the reads.

144 Visualizing alignments on IGV
145 Step 1: set the genome Exercise n 5 C/ Open the Genomes menu Choose Load Genome from File Provide your FASTA file. Some updated fields: Genome Chromosome Locus Tips: Some chromosomes are bundled with IGV (but they should have the same chromosome names). You can fetch some others through the server.
146 Step 2: add the tracks Open the File menu Choose Load from File Provide your GTF file. Provide your BAM files (the BAI file should be also present). Some interesting loci: Go to locus: SL2.40ch06:34,298,666-34,306,292 Thin lines indicate introns. Notice that gene introns match with read introns. Notice that the first and last exons seems longer than annotation. It s probably not annotated UTR.
147 Explore IGV Zoom in/out Go right/left Hover over the reads and get some info. Notice (colored) genome variations. Change panel height. Go to next TSS with Ctrl+F (Ctrl+B for previous TSS) Go to SL2.40ch06:34,209,900-34,260,000 Look at the strand of the gene. Expand the gene track. Do you think the annotation is complete here? Which condition is more expressed?
148 Analysis workflow Sample 1 RNA-seq reads Transcript modelling cufflinks Mapping STAR Tr/Gn Quantification RSEM Merge cuffmerge Tr/Gn Quantification RSEM Sample N RNA-seq reads Tr/Gn Quantification RSEM Ref Tr/Gn quantif. Sample 1 Ref. gene Genome annotation Mapping STAR Mapping STAR Ref Tr/Gn quantif. Sample N Novel gene Genome annotation Tr/Gn Quantification RSEM Transcript modelling cufflinks Novel Tr/Gn quantif. Sample 1 Mapping STAR Novel Tr/Gn quantif. Sample N
149 Analysis workflow Sample 1 RNA-seq reads Transcript modelling cufflinks Mapping STAR Tr/Gn Quantification RSEM Merge cuffmerge Tr/Gn Quantification RSEM Sample N RNA-seq reads Tr/Gn Quantification RSEM Ref Tr/Gn quantif. Sample 1 Ref. gene Genome annotation Mapping STAR Mapping STAR Ref Tr/Gn quantif. Sample N Novel gene Genome annotation Tr/Gn Quantification RSEM Transcript modelling cufflinks Novel Tr/Gn quantif. Sample 1 Mapping STAR Novel Tr/Gn quantif. Sample N
150 Quantification Quantification: estimation of expression based on a read count. BAM files Gene A Gene A Gene B 5 2 Table file Gene B GTF file Estimation of: gene expression transcript expression exon expression
151 Difficult cases Multi-mapping read Every quantification tools uses its own rules!
152 Raw counts vs estimation Raw count vs estimation: what to do with ambiguous reads? ambiguous specific Gene A Gene B Pros estimation: Use more reads. More accurate? Cons estimation: Underlying model inaccurate. Raw counts for differential expression does not matter much.

153 Transcript expression Trapnell C et al. Nature Biotechnology 2010; 28:

154 Raw counts tool: featurecounts Levels : exon, transcript, gene Multiple option for : Paired reads Assignation of reads Oriented library Also exists: HTseq-Count
 Also exists: cufflinks")
155 Estimation tool: RSEM Exhaustive tool Levels : transcript, gene May be used without reference genome (RNA-Seq de novo) Also exists: cufflinks
156 RSEM workflow Two main steps: rsem-prepare-reference rsem-calculate-expression In default use case, RSEM maps the reads (with Bowtie). Using a different mapping tool (STAR) requires: Extra parameters for STAR Extra parameters for RSEM
157 Hands-in: prepare reference Exercise n 6 Command line: /usr/local/bioinfo/src/rsem/rsem-1.3.0/rsem-p repare-reference --gtf annot.gtf genome.fasta rsem_lib Output files: rsem_lib.grp, rsem_lib.ti, rsem_lib.seq, and rsem_lib.chrlist are for internal use. rsem_lib.idx.fa: the transcript sequences rsem_lib.n2g.idx.fa: same, with N G
158 Hands-in: calculate expression Command line: /usr/local/bioinfo/src/rsem/rsem-1.3.0/rsem-c alculate-expression --alignments alignment.bam rsem_lib quant Outputs: quant.isoforms.results: isoform level expression estimates quant.genes.results: same for genes quant.stat: directory with stats on various aspects of this step
159 Hands-in: calculate expression Other parameters: --paired-end: specify paired-end reads -p N: use N CPUs --seed N: seed for random number generators --calc-ci: calculate 95% credibility intervals and posterior mean estimates. --ci-memory 30000: size in MB of the buffer used for computing CIs --estimate-rspd: estimate the read start position distribution --no-bam-output: do not output any BAM file (produced by internal mapper)
160 Output file format effective_length: # positions that can generate a fragment expected_count: read count, with mapping prob. and read qual TPM: Transcripts Per Million, relative transcript abundance, see infra FPKM: Fragments Per Kilobase of transcript per Million mapped reads, see infra IsoPct: isoform percentage posterior_mean_count, posterior_standard_deviation_of_count, pme_tpm, pme_fpkm: estimates calculated Gibbs sampler
161 Output file format IsoPct_from_pme_TPM: isoform percentage calculated from pme_tpm values TPM_ci_lower_bound, TPM_ci_upper_bound, FPKM_ci_lower_bound, FPKM_ci_upper_bound: bounds of 95% credibility intervals TPM_coefficient_of_quartile_variation, RPKM_coefficient_of_quartile_variation: coefficients of quartile variation, a robust way of measuring the ratio between the standard deviation and the mean
162 RPKM vs FPKM vs TPM RPKM: Reads Per Kb of transcript per Million mapped r = # reads on a gene k = size of the gene (in kb) m = # reads in the sample (in millions) RKPM = r / (k m) FPKM: Fragments Per Kilobase Same with f = # fragments (2 reads in PE) on a gene Meaning: If you sequence at depth 106, you will have x = FPKM fragments of a 1kb-gene.
163 RPKM vs FPKM vs TPM TMP: ri = # reads on a gene i si = size of the gene i cpbi = ri / si cpb = cpbi TMPi = cpbi / cpb 106 Remark: TMPi = FPKMi / ( FPKMj) 106 Meaning: If you have 106 transcripts, x = TMPi will originate from gene i.
164 RPKM vs FPKM vs TPM These are refinement of library size normalization, with gene length effect. RPKM should not be used for PE reads. TMP tend to be favored now w.r.t. R/FPKM. None of them should be used for differential expression: only raw counts. Ask your questions to the stats guys.
165 Analysis workflow Sample 1 RNA-seq reads Transcript modelling cufflinks Mapping STAR Tr/Gn Quantification RSEM Merge cuffmerge Tr/Gn Quantification RSEM Sample N RNA-seq reads Tr/Gn Quantification RSEM Ref Tr/Gn quantif. Sample 1 Ref. gene Genome annotation Mapping STAR Mapping STAR Ref Tr/Gn quantif. Sample N Novel gene Genome annotation Tr/Gn Quantification RSEM Transcript modelling cufflinks Novel Tr/Gn quantif. Sample 1 Mapping STAR Novel Tr/Gn quantif. Sample N
166 Analysis workflow Sample 1 RNA-seq reads Transcript modelling cufflinks Mapping STAR Tr/Gn Quantification RSEM Merge cuffmerge Tr/Gn Quantification RSEM Sample N RNA-seq reads Tr/Gn Quantification RSEM Ref Tr/Gn quantif. Sample 1 Ref. gene Genome annotation Mapping STAR Mapping STAR Ref Tr/Gn quantif. Sample N Novel gene Genome annotation Tr/Gn Quantification RSEM Transcript modelling cufflinks Novel Tr/Gn quantif. Sample 1 Mapping STAR Novel Tr/Gn quantif. Sample N

167 New transcriptome: why?
168 Transcript reconstruction Gene location Exon location Junctions : - between read pair junction - within read junction

169 Model building strategies

170 Cufflinks assembles transcripts estimates their abundances: based on how many reads support each one last version: cufflinks 2.2.1, released May 05, 2014
: nb incompatible read = mini nb of transcripts needed each path = set of mutually compatible fragments overlapping each other Trapnell")
171 Cufflinks transcript assembly Transcripts assembly: fragments are divided into non-overlapping loci each locus is assembled independently Cufflinks assembler find the mini nb of transcripts that explain the reads find a minimum path cover (Dilworth's theorem): nb incompatible read = mini nb of transcripts needed each path = set of mutually compatible fragments overlapping each other Trapnell C et al. Nature Biotechnology 2010
172 Cufflinks transcript assembly Transcripts assembly: identification of incompatible fragments originated from distinct isoforms connection of compatible fragments in an overlap graph assembling isoforms from the overlap graph: here minimally covered by three paths, each representing a different isoform Trapnell C et al. Nature Biotechnology 2010

173 Cufflinks transcript assembly Reference Annotation Based Transcripts Assembly Assembling novel transcripts in the context of an existing annotation Roberts et al. Bioinformatics 2011
174 Cufflinks inputs and options Command line: cufflinks [options] <aligned_reads.(sam/bam)> Some options: -h/--help -o/--output-dir -p/--num-threads -G/--GTF <reference_annotation.(gtf/gff)> estimate isoform expression, no novel transcripts -g/--gtf-guide <reference_annotation.(gtf/gff)> use reference transcript annotation to guide assembly --max-bundle-length [3,500,000] --max-bundle-frags [500,000] --library-type library prep used for input reads
175 Cufflinks library types

176 Cufflinks library types

177 Cufflinks outputs transcripts.gtf contains assembled isoforms (coordinates and abundances) genes.fpkm_tracking contains the genes FPKM isoforms.fpkm_tracking contains the isoforms FPKM skipped.gtf contains skipped loci (too many fragments)
178 Cufflinks GTF description transcripts.gtf (coordinates and abundances): contains assembled isoforms can be visualized with a genome viewer attributes: ids, FPKM, confidence interval, read coverage & support score: most abundant isoform = 1000 minor isoforms = minor FPKM/major FPKM cov: estimate for depth across the transcript
179 Cufflinks GTF description transcripts.gtf (coordinates and abundances): visualization in IGV
180 Cufflinks / Cuffcompare Compare assemblies between conditions: compare your assembled transcripts to a reference annotation track Cufflinks transcripts across multiple experiments Command: cuffcompare [-r <reference.gtf>] [-o <outprefix>] <input1.gtf> Outputs: overall summary statistics <outprefix>.combined.gtf - union of all transfrags <cuff_in>.refmap - transfrags matching to reference transcript <cuff_in>.tmap - best reference transcript for each transfrag <outprefix>.tracking - tracking transfrags across samples <outprefix>.stats -
181 Cuffcompare Class code de cuffcompare = complete match c contained j novel isoform e single exon i within intron o exonic overlap p polymerase run-on r repeat u unknown, intergenic x exonic overlap on the opposite strand s intronic overlap on the opposite strand > 50% lower case bases
182 Cufflinks / Cuffmerge Merge together several assemblies: merge novel isoforms and known isoforms filters a number of transfrags that are probably artifacts build a new gene model describing all conditions Command: cuffmerge [options] -o <assembly_gtf_list> Options: -o/--output-dir -g/--ref-gtf -s/--ref-sequence --min-isoform-fraction discard isoforms with abundance below this [0.05] -p/--num-threads
:")


183 Cufflinks / Cuffmerge merged.gtf (coordinates and legacy): contains merged input assemblies can be visualized with a genome viewer attributes: ids, name, oid, nearest_ref, class_code, tss_id, p_id


184 Tuxedo protocol
185 StringTie assembles transcripts StringTie identified 36-60% more transcripts than the next best assembler (Cufflinks) last version: stringtie 1.3.3, released Feb 15, 2017

186 Pertea et al. Nature Biotechnology 2015 StringTie transcript assembly
187 StringTie Command: stringtie <aligned_reads.bam> [options] Some options: -o [<path/>]<out.gtf> -G <ref_ann.gff> --rf --fr - stranded library fr-firststrand fr-secondstrand -p <int> --merge - transcript merge mode Main output: GTF file containing the assembled transcripts Gene abundances in tab-delimited format Fully covered transcripts matching the reference annotation Files required as input to Ballgown In merge mode, a merged GTF file from a set of GTF files


188 StringTie protocol
189 StringTie / gffcompare Command: gffcompare [-r <reference.gtf>] [-o <outprefix>] <input1.gtf> Some options: -R for -r option consider only the reference transcripts that overlap any of the input transfrags (Sn correction) -Q for -r option consider only the input transcripts that overlap any of the reference transcripts (Precision correction); discard all "novel" loci Output: cuffcompare like output files
190 StringTie / gffcompare strtcmp.stats (transcript assembly accuracy comparison) #= Summary for dataset: stringtie_asm.gtf # Query mrnas: in loci (17231 multi-exon transcripts) # (3731 multi-transcript loci, ~1.3 transcripts per locus) # Reference mrnas : in loci (15850 multi-exon) # Super-loci w/ reference transcripts: # Sensitivity Precision Base level: Exon level: Intron level: Intron chain level: Transcript level: Locus level:
191 gffcompare2highcharts.pl Command: gffcompare2highcharts.pl --stats STATS_FILE[...,STATS_FILE_n] > output.html
192 Hands-on: transcripts assembly Using cufflinks et al: Exercise 7: reconstruct known and novel transcripts
193 Analysis workflow Sample 1 RNA-seq reads Transcript modelling cufflinks Mapping STAR Tr/Gn Quantification RSEM Merge cuffmerge Tr/Gn Quantification RSEM Sample N RNA-seq reads Tr/Gn Quantification RSEM Ref Tr/Gn quantif. Sample 1 Ref. gene Genome annotation Mapping STAR Mapping STAR Ref Tr/Gn quantif. Sample N Novel gene Genome annotation Tr/Gn Quantification RSEM Transcript modelling cufflinks Novel Tr/Gn quantif. Sample 1 Mapping STAR Novel Tr/Gn quantif. Sample N
194 Analysis workflow Sample 1 RNA-seq reads Transcript modelling cufflinks Mapping STAR Tr/Gn Quantification RSEM Merge cuffmerge Tr/Gn Quantification RSEM Sample N RNA-seq reads Tr/Gn Quantification RSEM Ref Tr/Gn quantif. Sample 1 Ref. gene Genome annotation Mapping STAR Mapping STAR Ref Tr/Gn quantif. Sample N Novel gene Genome annotation Tr/Gn Quantification RSEM Transcript modelling cufflinks Novel Tr/Gn quantif. Sample 1 Mapping STAR Novel Tr/Gn quantif. Sample N
195 Hands-on : star, RSEM with new gtf Exercise n 8 (Optional) Commands : Star and RSEM: see exercise n 5 and 6
196 How to choose count matrix? Quality of the annotation : do not forget to check the genes structure with IGV presence of genes of interest too many transcripts quality metrics with gffcompare Number of reads mapped Number of reads assigned
197 Jflow Workflow management system configuration, parallelization and monitoring Launch a workflow with one command line Available on the Genotoul platform /usr/local/bioinfo/src/jflow/jflow/bin/jflow_cli.py <workflow_name> <workflow_parameters...>

198 Rna-Seq Workflows on Jflow
 --gtf-file model.")
199 Rna-Seq Workflows on Jflow Launch workflow: /usr/local/bioinfo/src/jflow/jflow/bin/jflow_cli.p y rnaseq --sample reads-1=myfile_r1.fastq.gz (reads-2=myfile_r2.fastq.gz) --reference-genome fasta-file=reference.fasta (index-directory=/path/to/directory) --gtf-file model.gtf --protocol (illumina_stranded, other) default : illumina_stranded Others parameters: --trim-reads : to trim reads before proceeding default: TruSeq Adapter --compute-gtf-model : to compute a new gtf model (gtf-file parameter is optional in this case) --modeling-software [cufflinks stringtie] (default: cufflinks)
 --gtf-file model.")
200 Rna-Seq Workflows on Jflow Launch workflow: /usr/local/bioinfo/src/jflow/jflow/bin/jflow_cli.py rnaseqproc --sample reads-1=myfile_r1.fastq.gz (reads-2=myfile_r2.fastq.gz) --reference-genome reference.fasta (--indexed-genome) --gtf-file model.gtf --protocol (illumina_stranded, other) default: illumina_stranded Other parameters: --trim-reads: to trim reads default: TruSeq Adapter --use-bowtie2: use bowtie2 instead of default bwa --multi-map: If specified, multi-mapping reads/fragments will be counted --multi-assign: If specified, reads will be allowed to be assigned to multiple meta-feature

201 Rna-Seq Workflows on Jflow Launch workflow: /usr/local/bioinfo/src/jflow/jflow/bin/jflow_cli.p y rnaseqnoalign --sample reads-1=myfile_r1.fastq.gz (reads-2=myfile_r2.fastq.gz) Case 1: you have the transcriptome: --transcriptome : transcriptome fasta file Case 2: you don t have the transcriptome: --reference-genome reference.fasta --gtf-file model.gtf
RNA-Seq data analysis
 RNA-Seq data analysis Material Slides: http://genoweb.toulouse.inra.fr/~formation/lignecmd/rnaseq/doc/ pdf : one per page pdf : three per page with comment lines Memento: http://genoweb.toulouse.inra.fr/~formation/lignecmd/rnaseq/doc/mementounix.pdf
RNA-Seq Software, Tools, and Workflows
 RNA-Seq Software, Tools, and Workflows Monica Britton, Ph.D. Sr. Bioinformatics Analyst September 1, 2016 Some mrna-seq Applications Differential gene expression analysis Transcriptional profiling Assumption:
RNA-Seq with the Tuxedo Suite
 RNA-Seq with the Tuxedo Suite Monica Britton, Ph.D. Sr. Bioinformatics Analyst September 2015 Workshop The Basic Tuxedo Suite References Trapnell C, et al. 2009 TopHat: discovering splice junctions with
RNA-seq Data Analysis
 Lecture 3. Clustering; Function/Pathway Enrichment analysis RNA-seq Data Analysis Qi Sun Bioinformatics Facility Biotechnology Resource Center Cornell University Lecture 1. Map RNA-seq read to genome Lecture
RNAseq Differential Gene Expression Analysis Report
 RNAseq Differential Gene Expression Analysis Report Customer Name: Institute/Company: Project: NGS Data: Bioinformatics Service: IlluminaHiSeq2500 2x126bp PE Differential gene expression analysis Sample
Bioinformatics in next generation sequencing projects
 Bioinformatics in next generation sequencing projects Rickard Sandberg Assistant Professor Department of Cell and Molecular Biology Karolinska Institutet May 2013 Standard sequence library generation Illumina
RNA Seq: Methods and Applica6ons. Prat Thiru
 RNA Seq: Methods and Applica6ons Prat Thiru 1 Outline Intro to RNA Seq Biological Ques6ons Comparison with Other Methods RNA Seq Protocol RNA Seq Applica6ons Annota6on Quan6fica6on Other Applica6ons Expression
Introduction to RNA-Seq
 Introduction to RNA-Seq Monica Britton, Ph.D. Sr. Bioinformatics Analyst March 2015 Workshop Overview of RNA-Seq Activities RNA-Seq Concepts, Terminology, and Work Flows Using Single-End Reads and a Reference
RNA-Seq Workshop AChemS Sunil K Sukumaran Monell Chemical Senses Center Philadelphia
 RNA-Seq Workshop AChemS 2017 Sunil K Sukumaran Monell Chemical Senses Center Philadelphia Benefits & downsides of RNA-Seq Benefits: High resolution, sensitivity and large dynamic range Independent of prior
Introduction to RNA sequencing
 Introduction to RNA sequencing Bioinformatics perspective Olga Dethlefsen NBIS, National Bioinformatics Infrastructure Sweden November 2017 Olga (NBIS) RNA-seq November 2017 1 / 49 Outline Why sequence
L3: Short Read Alignment to a Reference Genome
 L3: Short Read Alignment to a Reference Genome Shamith Samarajiwa CRUK Autumn School in Bioinformatics Cambridge, September 2017 Where to get help! http://seqanswers.com http://www.biostars.org http://www.bioconductor.org/help/mailing-list
Mapping strategies for sequence reads
 Mapping strategies for sequence reads Ernest Turro University of Cambridge 21 Oct 2013 Quantification A basic aim in genomics is working out the contents of a biological sample. 1. What distinct elements
measuring gene expression December 5, 2017
 measuring gene expression December 5, 2017 transcription a usually short-lived RNA copy of the DNA is created through transcription RNA is exported to the cytoplasm to encode proteins some types of RNA
Introduction to transcriptome analysis using High Throughput Sequencing technologies. D. Puthier 2012
 Introduction to transcriptome analysis using High Throughput Sequencing technologies D. Puthier 2012 A typical RNA-Seq experiment Library construction Protocol variations Fragmentation methods RNA: nebulization,
Ecole de Bioinforma(que AVIESAN Roscoff 2014 GALAXY INITIATION. A. Lermine U900 Ins(tut Curie, INSERM, Mines ParisTech
 GALAXY INITIATION A. Lermine U900 Ins(tut Curie, INSERM, Mines ParisTech How does Next- Gen sequencing work? DNA fragmentation Size selection and clonal amplification Massive parallel sequencing ACCGTTTGCCG
RNA-Sequencing analysis
 RNA-Sequencing analysis Markus Kreuz 25. 04. 2012 Institut für Medizinische Informatik, Statistik und Epidemiologie Content: Biological background Overview transcriptomics RNA-Seq RNA-Seq technology Challenges
Alignment. J Fass UCD Genome Center Bioinformatics Core Wednesday December 17, 2014
 Alignment J Fass UCD Genome Center Bioinformatics Core Wednesday December 17, 2014 From reads to molecules Why align? Individual A Individual B ATGATAGCATCGTCGGGTGTCTGCTCAATAATAGTGCCGTATCATGCTGGTGTTATAATCGCCGCATGACATGATCAATGG
Sanger vs Next-Gen Sequencing
 Tools and Algorithms in Bioinformatics GCBA815/MCGB815/BMI815, Fall 2017 Week-8: Next-Gen Sequencing RNA-seq Data Analysis Babu Guda, Ph.D. Professor, Genetics, Cell Biology & Anatomy Director, Bioinformatics
RNA-Seq analysis workshop
 RNA-Seq analysis workshop Zhangjun Fei Boyce Thompson Institute for Plant Research USDA Robert W. Holley Center for Agriculture and Health Cornell University Outline Background of RNA-Seq Application of
Course Presentation. Ignacio Medina Presentation
 Course Index Introduction Agenda Analysis pipeline Some considerations Introduction Who we are Teachers: Marta Bleda: Computational Biologist and Data Analyst at Department of Medicine, Addenbrooke's Hospital
De Novo Assembly of High-throughput Short Read Sequences
 De Novo Assembly of High-throughput Short Read Sequences Chuming Chen Center for Bioinformatics and Computational Biology (CBCB) University of Delaware NECC Third Skate Genome Annotation Workshop May 23,
Reference genomes and common file formats
 Reference genomes and common file formats Overview Reference genomes and GRC Fasta and FastQ (unaligned sequences) SAM/BAM (aligned sequences) Summarized genomic features BED (genomic intervals) GFF/GTF
Machine Learning Methods for RNA-seq-based Transcriptome Reconstruction
 Machine Learning Methods for RNA-seq-based Transcriptome Reconstruction Gunnar Rätsch Friedrich Miescher Laboratory Max Planck Society, Tübingen, Germany NGS Bioinformatics Meeting, Paris (March 24, 2010)
Gene Identification in silico
 Gene Identification in silico Nita Parekh, IIIT Hyderabad Presented at National Seminar on Bioinformatics and Functional Genomics, at Bioinformatics centre, Pondicherry University, Feb 15 17, 2006. Introduction
BCHM 6280 Tutorial: Gene specific information using NCBI, Ensembl and genome viewers
 BCHM 6280 Tutorial: Gene specific information using NCBI, Ensembl and genome viewers Web resources: NCBI database: http://www.ncbi.nlm.nih.gov/ Ensembl database: http://useast.ensembl.org/index.html UCSC
RNA-seq data analysis with Chipster. Eija Korpelainen CSC IT Center for Science, Finland
 RNA-seq data analysis with Chipster Eija Korpelainen CSC IT Center for Science, Finland chipster@csc.fi What will I learn? 1. What you can do with Chipster and how to operate it 2. What RNA-seq can be
SCALABLE, REPRODUCIBLE RNA-Seq
 SCALABLE, REPRODUCIBLE RNA-Seq SCALABLE, REPRODUCIBLE RNA-Seq Advances in the RNA sequencing workflow, from sample preparation through data analysis, are enabling deeper and more accurate exploration
Post-assembly Data Analysis
 Assembled transcriptome Post-assembly Data Analysis Quantification: the expression level of each gene in each sample DE genes: genes differentially expressed between samples Clustering/network analysis
Illumina (Solexa) Throughput: 4 Tbp in one run (5 days) Cheapest sequencing technology. Mismatch errors dominate. Cost: ~$1000 per human genme
 Throughput: 4 Tbp in one run (5 days) Cheapest sequencing technology. Mismatch errors dominate. Cost: ~$1000 per human genme") Illumina (Solexa) Current market leader Based on sequencing by synthesis Current read length 100-150bp Paired-end easy, longer matepairs harder Error ~0.1% Mismatch errors dominate Throughput: 4 Tbp in
Illumina (Solexa) Current market leader Based on sequencing by synthesis Current read length 100-150bp Paired-end easy, longer matepairs harder Error ~0.1% Mismatch errors dominate Throughput: 4 Tbp in
Whole Transcriptome Analysis of Illumina RNA- Seq Data. Ryan Peters Field Application Specialist
 Whole Transcriptome Analysis of Illumina RNA- Seq Data Ryan Peters Field Application Specialist Partek GS in your NGS Pipeline Your Start-to-Finish Solution for Analysis of Next Generation Sequencing Data
Long and short/small RNA-seq data analysis
 Long and short/small RNA-seq data analysis GEF5, 4.9.2015 Sami Heikkinen, PhD, Dos. Topics 1. RNA-seq in a nutshell 2. Long vs short/small RNA-seq 3. Bioinformatic analysis work flows GEF5 / Heikkinen
Next-Generation Sequencing. Technologies
 Next-Generation Next-Generation Sequencing Technologies Sequencing Technologies Nicholas E. Navin, Ph.D. MD Anderson Cancer Center Dept. Genetics Dept. Bioinformatics Introduction to Bioinformatics GS011062
Differential gene expression analysis using RNA-seq
 https://abc.med.cornell.edu/ Differential gene expression analysis using RNA-seq Applied Bioinformatics Core, August 2017 Friederike Dündar with Luce Skrabanek & Ceyda Durmaz Day 1: Introduction into high-throughput
Incorporating Molecular ID Technology. Accel-NGS 2S MID Indexing Kits
 Incorporating Molecular ID Technology Accel-NGS 2S MID Indexing Kits Molecular Identifiers (MIDs) MIDs are indices used to label unique library molecules MIDs can assess duplicate molecules in sequencing
Gene Expression Technology
 Gene Expression Technology Bing Zhang Department of Biomedical Informatics Vanderbilt University bing.zhang@vanderbilt.edu Gene expression Gene expression is the process by which information from a gene
Genomic DNA ASSEMBLY BY REMAPPING. Course overview
 ASSEMBLY BY REMAPPING Laurent Falquet, The Bioinformatics Unravelling Group, UNIFR & SIB MA/MER @ UniFr Group Leader @ SIB Course overview Genomic DNA PacBio Illumina methylation de novo remapping Annotation
Sequencing technologies. Jose Blanca COMAV institute bioinf.comav.upv.es
 Sequencing technologies Jose Blanca COMAV institute bioinf.comav.upv.es Outline Sequencing technologies: Sanger 2nd generation sequencing: 3er generation sequencing: 454 Illumina SOLiD Ion Torrent PacBio
Mate-pair library data improves genome assembly
 De Novo Sequencing on the Ion Torrent PGM APPLICATION NOTE Mate-pair library data improves genome assembly Highly accurate PGM data allows for de Novo Sequencing and Assembly For a draft assembly, generate
Sequencing technologies. Jose Blanca COMAV institute bioinf.comav.upv.es
 Sequencing technologies Jose Blanca COMAV institute bioinf.comav.upv.es Outline Sequencing technologies: Sanger 2nd generation sequencing: 3er generation sequencing: 454 Illumina SOLiD Ion Torrent PacBio
SMARTer Ultra Low RNA Kit for Illumina Sequencing Two powerful technologies combine to enable sequencing with ultra-low levels of RNA
 SMARTer Ultra Low RNA Kit for Illumina Sequencing Two powerful technologies combine to enable sequencing with ultra-low levels of RNA The most sensitive cdna synthesis technology, combined with next-generation
Genomics AGRY Michael Gribskov Hock 331
 Genomics AGRY 60000 Michael Gribskov gribskov@purdue.edu Hock 331 Computing Essentials Resources In this course we will assemble and annotate both genomic and transcriptomic sequence assemblies We will
MODULE 1: INTRODUCTION TO THE GENOME BROWSER: WHAT IS A GENE?
 MODULE 1: INTRODUCTION TO THE GENOME BROWSER: WHAT IS A GENE? Lesson Plan: Title Introduction to the Genome Browser: what is a gene? JOYCE STAMM Objectives Demonstrate basic skills in using the UCSC Genome
Outline. Annotation of Drosophila Primer. Gene structure nomenclature. Muller element nomenclature. GEP Drosophila annotation projects 01/04/2018
 Outline Overview of the GEP annotation projects Annotation of Drosophila Primer January 2018 GEP annotation workflow Practice applying the GEP annotation strategy Wilson Leung and Chris Shaffer AAACAACAATCATAAATAGAGGAAGTTTTCGGAATATACGATAAGTGAAATATCGTTCT
MAKING WHOLE GENOME ALIGNMENTS USABLE FOR BIOLOGISTS. EXAMPLES AND SAMPLE ANALYSES.
 MAKING WHOLE GENOME ALIGNMENTS USABLE FOR BIOLOGISTS. EXAMPLES AND SAMPLE ANALYSES. Table of Contents Examples 1 Sample Analyses 5 Examples: Introduction to Examples While these examples can be followed
RNA-Seq analysis using R: Differential expression and transcriptome assembly
 RNA-Seq analysis using R: Differential expression and transcriptome assembly Beibei Chen Ph.D BICF 12/7/2016 Agenda Brief about RNA-seq and experiment design Gene oriented analysis Gene quantification
Bioinformatics small variants Data Analysis. Guidelines. genomescan.nl
 Next Generation Sequencing Bioinformatics small variants Data Analysis Guidelines genomescan.nl GenomeScan s Guidelines for Small Variant Analysis on NGS Data Using our own proprietary data analysis pipelines
RNA-Seq analysis workshop. Zhangjun Fei
 RNA-Seq analysis workshop Zhangjun Fei Outline Background of RNA-Seq Application of RNA-Seq (what RNA-Seq can do?) Available sequencing platforms and strategies and which one to choose RNA-Seq data analysis
Gene Regulation Solutions. Microarrays and Next-Generation Sequencing
 Gene Regulation Solutions Microarrays and Next-Generation Sequencing Gene Regulation Solutions The Microarrays Advantage Microarrays Lead the Industry in: Comprehensive Content SurePrint G3 Human Gene
Post-assembly Data Analysis
 Assembled transcriptome Post-assembly Data Analysis Quantification: get expression for each gene in each sample Genes differentially expressed between samples Clustering/network analysis Identifying over-represented
Data Analysis with CASAVA v1.8 and the MiSeq Reporter
 Data Analysis with CASAVA v1.8 and the MiSeq Reporter Eric Smith, PhD Bioinformatics Scientist September 15 th, 2011 2010 Illumina, Inc. All rights reserved. Illumina, illuminadx, Solexa, Making Sense
DATA FORMATS AND QUALITY CONTROL
 HTS Summer School 12-16th September 2016 DATA FORMATS AND QUALITY CONTROL Romina Petersen, University of Cambridge (rp520@medschl.cam.ac.uk) Luigi Grassi, University of Cambridge (lg490@medschl.cam.ac.uk)
COMPUTER RESOURCES II:
 COMPUTER RESOURCES II: Using the computer to analyze data, using the internet, and accessing online databases Bio 210, Fall 2006 Linda S. Huang, Ph.D. University of Massachusetts Boston In the first computer
SCIENCE CHINA Life Sciences
 SCIENCE CHINA Life Sciences SPECIAL TOPIC February 2013 Vol.56 No.2: 143 155 RESEARCH PAPER doi: 10.1007/s11427-013-4442-z Comparative study of de novo assembly and genome-guided assembly strategies for
Quality assessment and control of sequence data
 Quality assessment and control of sequence data Naiara Rodríguez-Ezpeleta Workshop on Genomics 2015 Cesky Krumlov fastq format fasta Most basic file format to represent nucleotide or amino-acid sequences
Outline. Introduction to ab initio and evidence-based gene finding. Prokaryotic gene predictions
 Outline Introduction to ab initio and evidence-based gene finding Overview of computational gene predictions Different types of eukaryotic gene predictors Common types of gene prediction errors Wilson
Measuring transcriptomes with RNA-Seq
 Measuring transcriptomes with RNA-Seq BMI/CS 776 www.biostat.wisc.edu/bmi776/ Spring 2017 Anthony Gitter gitter@biostat.wisc.edu These slides, excluding third-party material, are licensed under CC BY-NC
How to view Results with. Proteomics Shared Resource
 How to view Results with Scaffold 3.0 Proteomics Shared Resource An overview This document is intended to walk you through Scaffold version 3.0. This is an introductory guide that goes over the basics
Bionano Access 1.1 Software User Guide
 Bionano Access 1.1 Software User Guide Document Number: 30142 Document Revision: B For Research Use Only. Not for use in diagnostic procedures. Copyright 2017 Bionano Genomics, Inc. All Rights Reserved.
How to view Results with Scaffold. Proteomics Shared Resource
 How to view Results with Scaffold Proteomics Shared Resource Starting out Download Scaffold from http://www.proteomes oftware.com/proteom e_software_prod_sca ffold_download.html Follow installation instructions
Introduction to Bioinformatics and Gene Expression Technologies
 Introduction to Bioinformatics and Gene Expression Technologies Utah State University Fall 2017 Statistical Bioinformatics (Biomedical Big Data) Notes 1 1 Vocabulary Gene: hereditary DNA sequence at a
Agenda. Web Databases for Drosophila. Gene annotation workflow. GEP Drosophila annotation projects 01/01/2018. Annotation adding labels to a sequence
 Agenda GEP annotation project overview Web Databases for Drosophila An introduction to web tools, databases and NCBI BLAST Web databases for Drosophila annotation UCSC Genome Browser NCBI / BLAST FlyBase
Chang Xu Mohammad R Nezami Ranjbar Zhong Wu John DiCarlo Yexun Wang
 Supplementary Materials for: Detecting very low allele fraction variants using targeted DNA sequencing and a novel molecular barcode-aware variant caller Chang Xu Mohammad R Nezami Ranjbar Zhong Wu John
De novo metatranscriptome assembly and coral gene expression profile of Montipora capitata with growth anomaly
 Additional File 1 De novo metatranscriptome assembly and coral gene expression profile of Montipora capitata with growth anomaly Monika Frazier, Martin Helmkampf, M. Renee Bellinger, Scott Geib, Misaki
Next Gen Sequencing. Expansion of sequencing technology. Contents
 Next Gen Sequencing Contents 1 Expansion of sequencing technology 2 The Next Generation of Sequencing: High-Throughput Technologies 3 High Throughput Sequencing Applied to Genome Sequencing (TEDed CC BY-NC-ND
From Variants to Pathways: Agilent GeneSpring GX s Variant Analysis Workflow
 From Variants to Pathways: Agilent GeneSpring GX s Variant Analysis Workflow Technical Overview Import VCF Introduction Next-generation sequencing (NGS) studies have created unanticipated challenges with
Read Quality Assessment & Improvement. UCD Genome Center Bioinformatics Core Tuesday 14 June 2016
 Read Quality Assessment & Improvement UCD Genome Center Bioinformatics Core Tuesday 14 June 2016 QA&I should be interactive Error modes Each technology has unique error modes, depending on the physico-chemical
Gene Expression: Transcription
 Gene Expression: Transcription The majority of genes are expressed as the proteins they encode. The process occurs in two steps: Transcription = DNA RNA Translation = RNA protein Taken together, they make
Introduction to the UCSC genome browser
 Introduction to the UCSC genome browser Dominik Beck NHMRC Peter Doherty and CINSW ECR Fellow, Senior Lecturer Lowy Cancer Research Centre, UNSW and Centre for Health Technology, UTS SYDNEY NSW AUSTRALIA
Introduction to Next Generation Sequencing (NGS) Andrew Parrish Exeter, 2 nd November 2017
 Andrew Parrish Exeter, 2 nd November 2017") Introduction to Next Generation Sequencing (NGS) Andrew Parrish Exeter, 2 nd November 2017 Topics to cover today What is Next Generation Sequencing (NGS)? Why do we need NGS? Common approaches to NGS NGS
Introduction to Next Generation Sequencing (NGS) Andrew Parrish Exeter, 2 nd November 2017 Topics to cover today What is Next Generation Sequencing (NGS)? Why do we need NGS? Common approaches to NGS NGS
About Strand NGS. Strand Genomics, Inc All rights reserved.
 About Strand NGS Strand NGS-formerly known as Avadis NGS, is an integrated platform that provides analysis, management and visualization tools for next-generation sequencing data. It supports extensive
SNP calling and VCF format
 SNP calling and VCF format Laurent Falquet, Oct 12 SNP? What is this? A type of genetic variation, among others: Family of Single Nucleotide Aberrations Single Nucleotide Polymorphisms (SNPs) Single Nucleotide
Workflow of de novo assembly
 Workflow of de novo assembly Experimental Design Clean sequencing data (trim adapter and low quality sequences) Run assembly software for contiging and scaffolding Evaluation of assembly Several iterations:
TIGR THE INSTITUTE FOR GENOMIC RESEARCH
 Introduction to Genome Annotation: Overview of What You Will Learn This Week C. Robin Buell May 21, 2007 Types of Annotation Structural Annotation: Defining genes, boundaries, sequence motifs e.g. ORF,
Basic Bioinformatics: Homology, Sequence Alignment,
 Basic Bioinformatics: Homology, Sequence Alignment, and BLAST William S. Sanders Institute for Genomics, Biocomputing, and Biotechnology (IGBB) High Performance Computing Collaboratory (HPC 2 ) Mississippi
Next Generation Sequencing: An Overview
 Next Generation Sequencing: An Overview Cavan Reilly November 13, 2017 Table of contents Next generation sequencing NGS and microarrays Study design Quality assessment Burrows Wheeler transform Next generation
Green Center Computational Core ChIP- Seq Pipeline, Just a Click Away
 Green Center Computational Core ChIP- Seq Pipeline, Just a Click Away Venkat Malladi Computational Biologist Computational Core Cecil H. and Ida Green Center for Reproductive Biology Science Introduc
Ensembl Tools. EBI is an Outstation of the European Molecular Biology Laboratory.
 Ensembl Tools EBI is an Outstation of the European Molecular Biology Laboratory. Questions? We ve muted all the mics Ask questions in the Chat box in the webinar interface I will check the Chat box periodically
RNA-Seq Tutorial 1. Kevin Silverstein, Ying Zhang Research Informatics Solutions, MSI October 18, 2016
 RNA-Seq Tutorial 1 Kevin Silverstein, Ying Zhang Research Informatics Solutions, MSI October 18, 2016 Slides available at www.msi.umn.edu/tutorial-materials RNA-Seq Tutorials Lectures RNA-Seq experiment
Measuring transcriptomes with RNA-Seq. BMI/CS 776 Spring 2016 Anthony Gitter
 Measuring transcriptomes with RNA-Seq BMI/CS 776 www.biostat.wisc.edu/bmi776/ Spring 2016 Anthony Gitter gitter@biostat.wisc.edu Overview RNA-Seq technology The RNA-Seq quantification problem Generative
axe Documentation Release g6d4d1b6-dirty Kevin Murray
 axe Documentation Release 0.3.2-5-g6d4d1b6-dirty Kevin Murray Jul 17, 2017 Contents 1 Axe Usage 3 1.1 Inputs and Outputs..................................... 4 1.2 The barcode file......................................
Sequence assembly. Jose Blanca COMAV institute bioinf.comav.upv.es
 Sequence assembly Jose Blanca COMAV institute bioinf.comav.upv.es Sequencing project Unknown sequence { experimental evidence result read 1 read 4 read 2 read 5 read 3 read 6 read 7 Computational requirements
TSSpredator User Guide v 1.00
 TSSpredator User Guide v 1.00 Alexander Herbig alexander.herbig@uni-tuebingen.de Kay Nieselt kay.nieselt@uni-tuebingen.de June 3, 2013 1 Getting Started TSSpredator is a tool for the comparative detection
Analysing genomes and transcriptomes using Illumina sequencing
 Analysing genomes and transcriptomes using Illumina uencing Dr. Heinz Himmelbauer Centre for Genomic Regulation (CRG) Ultrauencing Unit Barcelona The Sequencing Revolution High-Throughput Sequencing 2000
Quality assessment and control of sequence data. Naiara Rodríguez-Ezpeleta
 Quality assessment and control of sequence data Naiara Rodríguez-Ezpeleta Workshop on Genomics 2014 Quality control is important Some of the artefacts/problems that can be detected with QC Sequencing Sequence
CNV and variant detection for human genome resequencing data - for biomedical researchers (II)
") CNV and variant detection for human genome resequencing data - for biomedical researchers (II) Chuan-Kun Liu 劉傳崑 Senior Maneger National Center for Genome Medican bioit@ncgm.sinica.edu.tw Abstract Common
CNV and variant detection for human genome resequencing data - for biomedical researchers (II) Chuan-Kun Liu 劉傳崑 Senior Maneger National Center for Genome Medican bioit@ncgm.sinica.edu.tw Abstract Common
Welcome to the NGS webinar series
 Welcome to the NGS webinar series Webinar 1 NGS: Introduction to technology, and applications NGS Technology Webinar 2 Targeted NGS for Cancer Research NGS in cancer Webinar 3 NGS: Data analysis for genetic
Axiom mydesign Custom Array design guide for human genotyping applications
 TECHNICAL NOTE Axiom mydesign Custom Genotyping Arrays Axiom mydesign Custom Array design guide for human genotyping applications Overview In the past, custom genotyping arrays were expensive, required
Hands-On Four Investigating Inherited Diseases
 Hands-On Four Investigating Inherited Diseases The purpose of these exercises is to introduce bioinformatics databases and tools. We investigate an important human gene and see how mutations give rise
Transcription in Eukaryotes
 Transcription in Eukaryotes Biology I Hayder A Giha Transcription Transcription is a DNA-directed synthesis of RNA, which is the first step in gene expression. Gene expression, is transformation of the
less sensitive than RNA-seq but more robust analysis pipelines expensive but quantitiatve standard but typically not high throughput
 Chapter 11: Gene Expression The availability of an annotated genome sequence enables massively parallel analysis of gene expression. The expression of all genes in an organism can be measured in one experiment.
Demo of mrna NGS Concluding Report
 Demo of mrna NGS Concluding Report Project: Demo Report Customer: Dr. Demo Company/Institute: Exiqon AS Date: 09-Mar-2015 Performed by Exiqon A/S Company Reg.No.(CVR) 18 98 44 31 Skelstedet 16 DK-2950,
B&DA Committee Bioinformatics and Data Analysis. PAG January 2016
 B&DA Committee Bioinformatics and Data Analysis PAG January 2016 B&DA progress so far Aim: to define standard bfx pipelines for FAANG data Group has skyped many times We have a Wiki: hosted by EBI Sub-groups
RADSeq Data Analysis. Through STACKS on Galaxy. Yvan Le Bras Anthony Bretaudeau Cyril Monjeaud Gildas Le Corguillé
 RADSeq Data Analysis Through STACKS on Galaxy Yvan Le Bras Anthony Bretaudeau Cyril Monjeaud Gildas Le Corguillé RAD sequencing: next-generation tools for an old problem INTRODUCTION source: Karim Gharbi
Analysis of Differential Gene Expression in Cattle Using mrna-seq
 Analysis of Differential Gene Expression in Cattle Using mrna-seq mrna-seq A rough guide for green horns Animal and Grassland Research and Innovation Centre Animal and Bioscience Research Department Teagasc,
Bio11 Announcements. Ch 21: DNA Biology and Technology. DNA Functions. DNA and RNA Structure. How do DNA and RNA differ? What are genes?
 Bio11 Announcements TODAY Genetics (review) and quiz (CP #4) Structure and function of DNA Extra credit due today Next week in lab: Case study presentations Following week: Lab Quiz 2 Ch 21: DNA Biology
Functional analysis using EBI Metagenomics
 Functional analysis using EBI Metagenomics Contents Tutorial information... 2 Tutorial learning objectives... 2 An introduction to functional analysis using EMG... 3 What are protein signatures?... 3 Assigning
Sequence Annotation & Designing Gene-specific qpcr Primers (computational)
") James Madison University From the SelectedWorks of Ray Enke Ph.D. Fall October 31, 2016 Sequence Annotation & Designing Gene-specific qpcr Primers (computational) Raymond A Enke This work is licensed under
James Madison University From the SelectedWorks of Ray Enke Ph.D. Fall October 31, 2016 Sequence Annotation & Designing Gene-specific qpcr Primers (computational) Raymond A Enke This work is licensed under
Genomic Data Analysis Services Available for PL-Grid Users
 Domain-oriented services and resources of Polish Infrastructure for Supporting Computational Science in the European Research Space PLGrid Plus Domain-oriented services and resources of Polish Infrastructure
High Cross-Platform Genotyping Concordance of Axiom High-Density Microarrays and Eureka Low-Density Targeted NGS Assays
 High Cross-Platform Genotyping Concordance of Axiom High-Density Microarrays and Eureka Low-Density Targeted NGS Assays Ali Pirani and Mohini A Patil ISAG July 2017 The world leader in serving science
HLA and Next Generation Sequencing it s all about the Data
 HLA and Next Generation Sequencing it s all about the Data John Ord, NHSBT Colindale and University of Cambridge BSHI Annual Conference Manchester September 2014 Introduction In 2003 the first full public