APPENDIX E. LESA Models
|
|
|
- Alberta Sutton
- 6 years ago
- Views:
Transcription
1 APPENDIX E LESA Models
2 LESA ASSESSMENT CALEXICO SOLAR FARM I PHASE A PROJECT AREA CALEXICO SOLAR FARM I PHASE A PROJECT (SW/4 Section 13, S/2 Section 14, S/2 NE/4 Section 15, NW/4 Section 15, T17S, R13E, SBB&M) IMPERIAL COUNTY, CALIFORNIA July 2011 EMA Report No A Prepared for: 88FT 8ME, LLC Santa Monica Boulevard, Suite 300 Los Angeles, California ENVIRONMENTAL MANAGEMENT ASSOCIATES
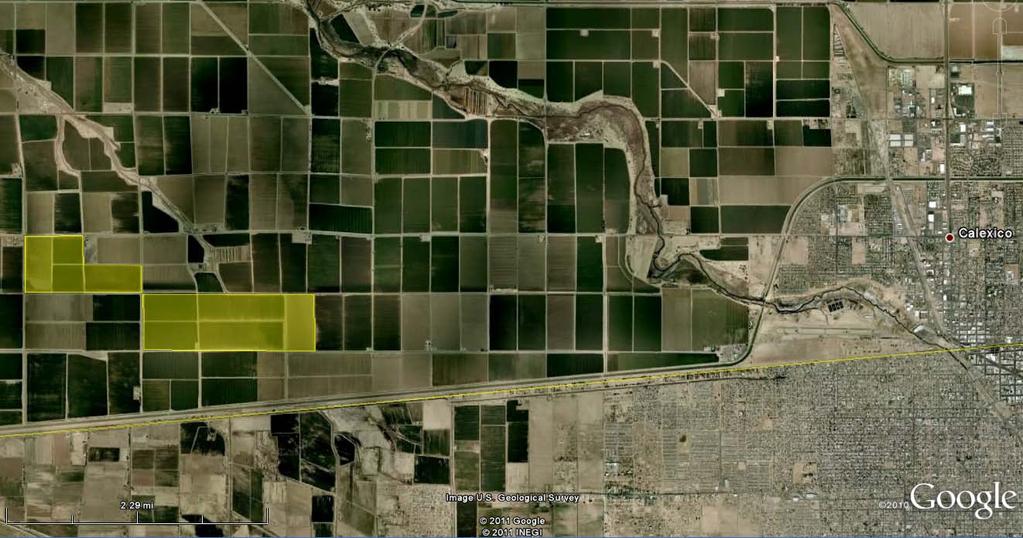
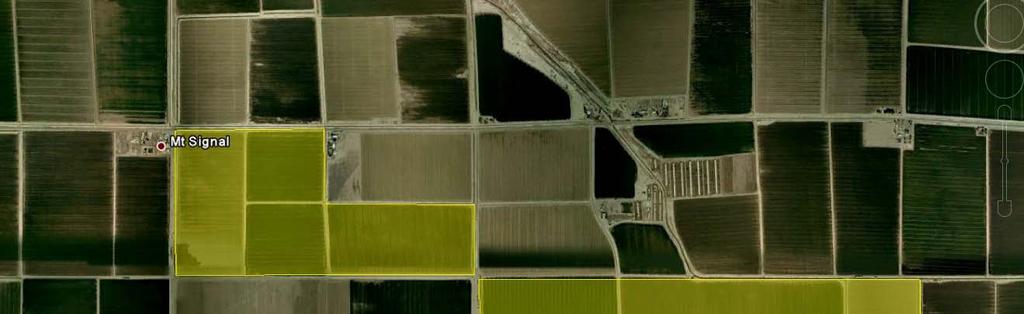
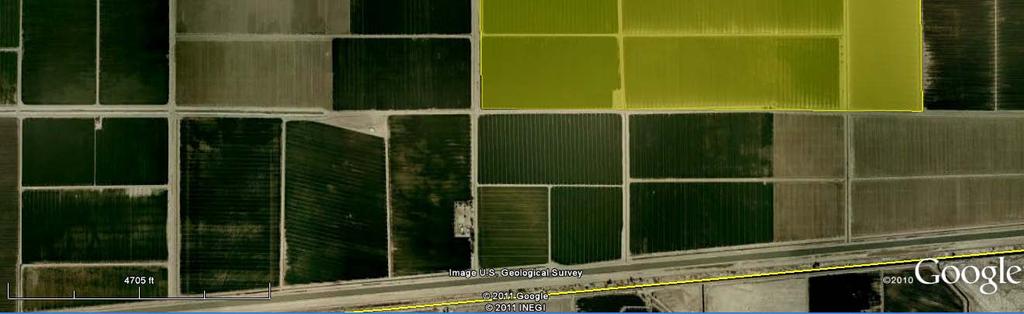
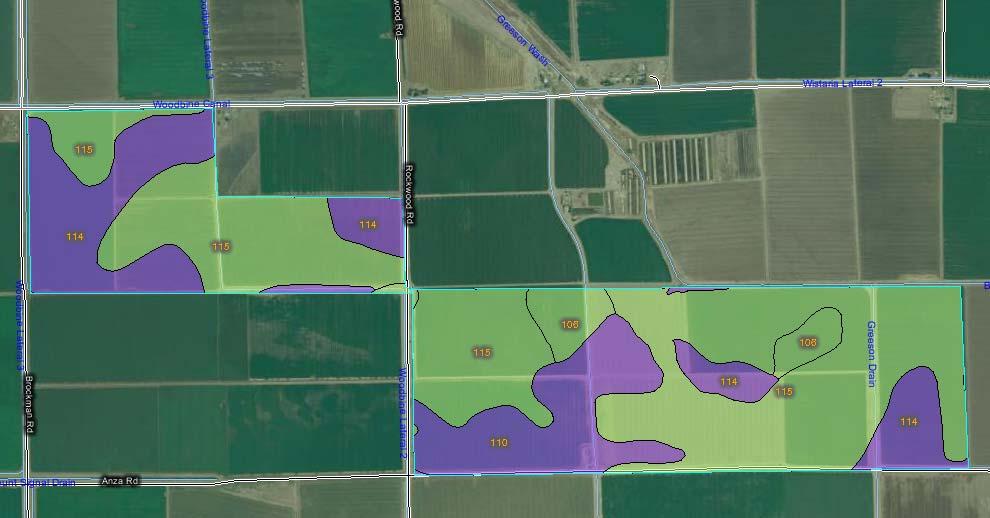
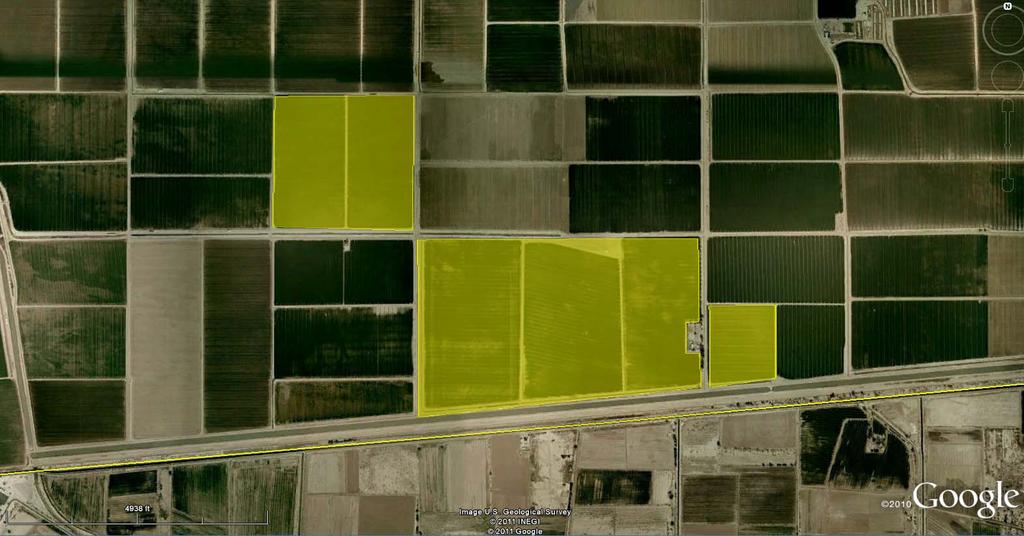
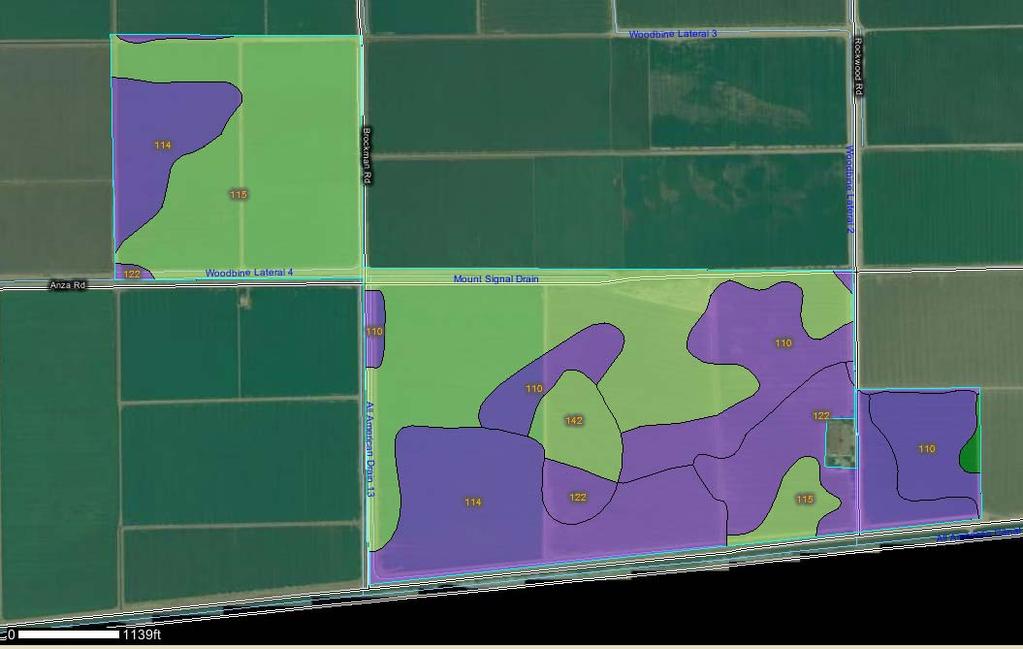
3 LAND EVALUATION AND SITE ASSESSMENT MODEL CALEXICO SOLAR FARM I PHASE A PROJECT (SW/4 Section 13, S/2 Section 14, S/2 NE/4 Section 15, NW/4 Section 15, T17S, R13E, SBB&M) IMPERIAL COUNTY, CALIFORNIA The Land Evaluation and Site Assessment (LESA) model is an approach for rating the relative quality of land resources based upon specific measurable features. The LESA model was first developed by the federal (NRCS) in It was subsequently adapted in 1990 by the California Department of Conservation to evaluate land use decisions that affect the conversion of agriculture lands in California. The formulation of the California LESA Model is intended to provide lead agencies under the California Environmental Quality Act (CEQA) with an optional methodology to ensure that significant effects on the environment of agricultural land conversions are quantitatively and consistently considered in the environmental review process. For determining the potential CEQA significance resulting from the conversion of agricultural lands to some other purpose, the California Agricultural LESA Model has developed Scoring Thresholds which are used to compare the Final LESA Score and the Weighted Factor Scores for the Project with suggested Scoring Decisions. These LESA Scores do not take into consideration any proposed mitigation measures or other factors that might affect a lead agency s determination of the significance of the agricultural lands conversion impact under CEQA. The information provided on the following pages present documentation of the LESA assessment prepared using the California Agricultural LESA Model for the proposed Calexico Solar Farm I Phase A Project (Project) (APNs ; ; ; and ). The proposed Project would be constructed on approximately 720 acres of privately owned land located about seven miles west of the city of Calexico, California (Figure 1). The Project is bounded on the north by California State Route 98 and bounded on the south by Anza Road, an Imperial County road (Figure 2).
4 LESA ASSESSMENT 88FT 8ME, LLC CALEXICO SOLAR FARM I PHASE A PROJECT IMPERIAL COUNTY, NEVADA TABLE OF CONTENTS SUMMARY... i LIST OF FIGURES... ii LIST OF APPENDICES... ii 1. CALIFORNIA LAND EVALUATION AND SITE ASSESSMENT MODEL... 3 A LAND CAPABILITY CLASSIFICATION ( LCC )...3 B STORIE INDEX RATING...3 C PROJECT SIZE RATING...5 D WATER RESOURCES AVAILABILITY RATING...6 E SURROUNDING AGRICULTURAL LAND RATING...7 F SURROUNDING PROTECTED RESOURCE LAND RATING...7 G WEIGHTING OF FACTORS AND FINAL LESA SCORE...10 Page LIST OF FIGURES Figure 1: Location Map... 1 Figure 2: Project Area Map on an Aerial Photographic Base... 2 Figure 3: Project Area Soils Map... 4 Figure 4: Zone of Influence... 9 Page LIST OF APPENDICES APPENDIX A: CALEXICO SOLAR FARM I PHASE A PROJECT SOILS DETAILS
5
6
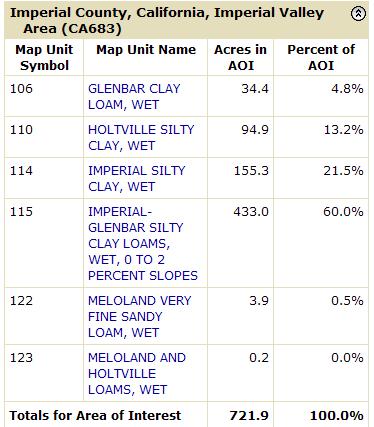
7 Land Evaluation Worksheet A B C D E F G H Soil Map Unit* Project Acres Proportion of LCC** LCC Rating LCC Score Storie Storie Index Project Area (irrigated) (irrigated)*** (C x E) Index** Score (C x G) IIw IIw IIIw IIIw IIIw IIIw Totals LCC Total Storie Index 64 Score Total Score 59 Total Project Area (acres)= 720 * The Soil Map Unit information and acreage were determined from the current soil survey information available at the USDA website: (Figure 3). ** The Land Capability Classification and Storie Index information was obtained from the current soil survey information available at the USDA website: (Appendix A). *** The LCC Rating for irrigated land was determined from the LCC Point Rating Table 2 from the LESA Instruction Manual (California Department of Conservation 1997).
8
9 Site Assessment Worksheet 1 Project Size Score* I J K LCC Class I-II LCC Class III LCC Class IV-VIII Project Acres per LCC Class Project Acres per LCC Class Project Acres per LCC Class 3.89 Project Acres per LCC Class 0.22 Project Acres per LCC Class Total Project Acres per LCC Class * Project Size Scores Highest Project Size Score 100 * Project Size Score was determined from the Project Size Scoring Table from the LESA Instruction Manual (California Department of Conservation 1997).
10 A B C D E Project Portion Water Source Site Assessment Worksheet 2 Water Resources Availability Proportion of Project Area Water Availability Score* Weighted Availability Score (C x D) 1 Irrigation District Only Total Water (Must Sum to 1.0) 100 Resource Score * The Water Availability Score was determined using the Water Resources Availability Scoring Table from the LESA Instruction Manual (California Department of Conservation 1997).
11 Site Assessment Worksheet 3 Surrounding Agricultural Land & Surrounding Protected Resource Land A B C D E F G Zone of Influence* Surrounding Surrounding Percent Agricultural Protected Acres of Percent in Protected Land Score Resource Land Acres in Protected Total Acres Agriculture Resource (From LESA Score (From Agriculture Resource (B/A) Land Manual LESA Manual Land (C/A) Table 6) Table 7)** * In conformance with the instructions in the LESA Instruction Manual (California Department of Conservation 1997), the Zone of Influence was determined by drawing the smallest rectangle that could completely encompass the entire Project Area. A second rectangle was then drawn which extended one quarter mile on all sides beyond the first rectangle. The Zone of Influence is represented by the entire area of all parcels with any lands inside the outer rectangle, less the area of the proposed project (Figure 4). ** The LESA Instruction Manual (California Department of Conservation 1997) describes Protected Resource Land as those lands with long term use restrictions that are compatible with or supportive of agricultural uses of land. Included among them are the following: Williamson Act contracted lands; Publicly owned lands maintained as park, forest, or watershed resources; and Lands with agricultural, wildlife habitat, open space, or other natural resource easements that restrict the conversion of such land to urban or industrial uses. Surrounding Parcels*** Acres Protected Resource Land? Percent Protected Resource Land Acres in Protected Land Agricultural Land? Percent Agricultural Land Acres of Agriculture N 0 0 N N 0 0 Y N 0 0 Y N 0 0 Y N 0 0 Y N 0 0 Y N 0 0 Y N 0 0 Y N 0 0 Y N 0 0 Y N 0 0 Y N 0 0 N N 0 0 N N 0 0 N N 0 0 N N 0 0 N N 0 0 N N 0 0 N N 0 0 N N 0 0 N 0 0.0
12 Surrounding Parcels*** Acres Protected Resource Land? Percent Protected Resource Land Acres in Protected Land Agricultural Land? Percent Agricultural Land Acres of Agriculture N 0 0 N N 0 0 Y N 0 0 Y N 0 0 Y N 0 0 Y N 0 0 Y N 0 0 Y N 0 0 Y N 0 0 Y N 0 0 Y N 0 0 N N 0 0 N N 0 0 Y N 0 0 Y N 0 0 Y N 0 0 N N 0 0 N N 0 0 Y N 0 0 Y N 0 0 Y N 0 0 Y N 0 0 Y N 0 0 Y N 0 0 Y N 0 0 Y N 0 0 Y N 0 0 Y N 0 0 N N 0 0 Y Total Total 0 Total **The Imperial County Assessors website was accessed to identify the surrounding parcel numbers ( The percentage of agriculture was determined from a map overlay used to estimate the proportion of land in agriculture and the California Department of Conservation Important Farmland Map Series.
13 Scale: 1"= feet Title: Date: 3/24/2011 This map represents a visual display of related geographic information. Data provided hereon is not a guarantee of actual field conditions. To be sure of complete accuracy, please contact IMPERIALCOUNTY_PUBLIC staff for the most up-to-date information.
14 Final LESA Score Sheet Factor Scores Factor Weight Weighted Factor Scores LE Factors Land Capability Classification Storie Index LE subtotal SA Factors Project Size Water Resource Availability Surrounding Agricultural Land Protected Resource Land SA Subtotal Total LESA Score Total LESA Score 0 to 39 Points 40 to 59 Points 60 to 79 Points California LESA Model Scoring Thresholds Not Considered Significant to 100 Points Considered Significant Scoring Decision Considered Significant only if LE and SA subscores are each greater than or equal to 20 points Considered Significant unless either LE or SA subscore is less than 20 points
15 APPENDIX A: CALEXICO SOLAR FARM I PHASE A PROJECT SOILS DETAILS
16 Map Unit Description: GLENBAR CLAY LOAM, WET Imperial County, California, Imperial Valley Area Imperial County, California, Imperial Valley Area 106 GLENBAR CLAY LOAM, WET Map Unit Setting Elevation: -230 to 200 feet Mean annual precipitation: 0 to 3 inches Mean annual air temperature: 72 to 75 degrees F Frost-free period: 300 to 350 days Map Unit Composition Glenbar, wet, and similar soils: 85 percent Minor components: 15 percent Description of Glenbar, Wet Setting Landform: Basin floors Landform position (three-dimensional): Dip Down-slope shape: Linear Across-slope shape: Linear Parent material: Alluvium derived from mixed sources Properties and qualities Slope: 0 to 1 percent Depth to restrictive feature: More than 80 inches Drainage class: Moderately well drained Capacity of the most limiting layer to transmit water (Ksat): Moderately high (0.20 to 0.57 in/hr) Depth to water table: More than 80 inches Frequency of flooding: None Frequency of ponding: None Calcium carbonate, maximum content: 5 percent Maximum salinity: Nonsaline to slightly saline (2.0 to 8.0 mmhos/cm) Sodium adsorption ratio, maximum: 5.0 Available water capacity: High (about 10.8 inches) Interpretive groups Land capability classification (irrigated): 2w Land capability (nonirrigated): 7w Typical profile 0 to 13 inches: Clay loam 13 to 60 inches: Clay loam Minor Components Holtville Percent of map unit: 5 percent Meloland Percent of map unit: 5 percent 3/24/2011 Page 1 of 2
17 Map Unit Description: GLENBAR CLAY LOAM, WET Imperial County, California, Imperial Valley Area Indio Percent of map unit: 5 percent Data Source Information Soil Survey Area: Imperial County, California, Imperial Valley Area Survey Area Data: Version 5, Jul 25, /24/2011 Page 2 of 2
18 Map Unit Description: HOLTVILLE SILTY CLAY, WET Imperial County, California, Imperial Valley Area Imperial County, California, Imperial Valley Area 110 HOLTVILLE SILTY CLAY, WET Map Unit Setting Elevation: -230 to 200 feet Mean annual precipitation: 0 to 3 inches Mean annual air temperature: 72 to 75 degrees F Frost-free period: 300 to 350 days Map Unit Composition Holtville, wet, and similar soils: 85 percent Minor components: 15 percent Description of Holtville, Wet Setting Landform: Basin floors Landform position (three-dimensional): Talf Down-slope shape: Linear Across-slope shape: Linear Parent material: Alluvium derived from mixed sources Properties and qualities Slope: 0 to 2 percent Depth to restrictive feature: More than 80 inches Drainage class: Moderately well drained Capacity of the most limiting layer to transmit water (Ksat): Very low to moderately low (0.00 to 0.06 in/hr) Depth to water table: More than 80 inches Frequency of flooding: None Frequency of ponding: None Calcium carbonate, maximum content: 5 percent Maximum salinity: Nonsaline to slightly saline (2.0 to 8.0 mmhos/cm) Sodium adsorption ratio, maximum: 10.0 Available water capacity: Moderate (about 7.6 inches) Interpretive groups Land capability classification (irrigated): 2w Land capability (nonirrigated): 7w Typical profile 0 to 17 inches: Silty clay 17 to 24 inches: Clay 24 to 35 inches: Silt loam 35 to 60 inches: Loamy very fine sand Minor Components Glenbar Percent of map unit: 5 percent Imperial Percent of map unit: 5 percent 3/24/2011 Page 1 of 2
19 Map Unit Description: HOLTVILLE SILTY CLAY, WET Imperial County, California, Imperial Valley Area Indio Percent of map unit: 3 percent Vint Percent of map unit: 2 percent Data Source Information Soil Survey Area: Imperial County, California, Imperial Valley Area Survey Area Data: Version 5, Jul 25, /24/2011 Page 2 of 2
20 Map Unit Description: IMPERIAL SILTY CLAY, WET Imperial County, California, Imperial Valley Area Imperial County, California, Imperial Valley Area 114 IMPERIAL SILTY CLAY, WET Map Unit Setting Elevation: -230 to 200 feet Mean annual precipitation: 0 to 3 inches Mean annual air temperature: 72 to 75 degrees F Frost-free period: 300 to 350 days Map Unit Composition Imperial, wet, and similar soils: 85 percent Minor components: 15 percent Description of Imperial, Wet Setting Landform: Basin floors Landform position (three-dimensional): Talf Down-slope shape: Linear Across-slope shape: Linear Parent material: Clayey alluvium derived from mixed sources and/or clayey lacustrine deposits derived from mixed sources Properties and qualities Slope: 0 to 2 percent Depth to restrictive feature: More than 80 inches Drainage class: Moderately well drained Capacity of the most limiting layer to transmit water (Ksat): Moderately low to moderately high (0.06 to 0.20 in/hr) Depth to water table: More than 80 inches Frequency of flooding: None Frequency of ponding: None Calcium carbonate, maximum content: 5 percent Maximum salinity: Very slightly saline to slightly saline (4.0 to 8.0 mmhos/cm) Sodium adsorption ratio, maximum: 20.0 Available water capacity: Moderate (about 8.3 inches) Interpretive groups Land capability classification (irrigated): 3w Land capability (nonirrigated): 7w Typical profile 0 to 12 inches: Silty clay 12 to 60 inches: Silty clay loam Minor Components Glenbar Percent of map unit: 4 percent Meloland Percent of map unit: 4 percent 11/12/2010 Page 1 of 2
21 Map Unit Description: IMPERIAL SILTY CLAY, WET Imperial County, California, Imperial Valley Area Holtville Percent of map unit: 4 percent Niland Percent of map unit: 3 percent Data Source Information Soil Survey Area: Imperial County, California, Imperial Valley Area Survey Area Data: Version 5, Jul 25, /12/2010 Page 2 of 2
22 Map Unit Description: IMPERIAL-GLENBAR SILTY CLAY LOAMS, WET, 0 TO 2 PERCENT SLOPES Imperial County, California, Imperial Valley Area Imperial County, California, Imperial Valley Area 115 IMPERIAL-GLENBAR SILTY CLAY LOAMS, WET, 0 TO 2 PERCENT SLOPES Map Unit Setting Elevation: -230 to 200 feet Mean annual precipitation: 0 to 3 inches Mean annual air temperature: 72 to 75 degrees F Frost-free period: 300 to 350 days Map Unit Composition Glenbar, wet, and similar soils: 40 percent Imperial, wet, and similar soils: 40 percent Minor components: 20 percent Description of Imperial, Wet Setting Landform: Basin floors Landform position (three-dimensional): Talf Down-slope shape: Linear Across-slope shape: Linear Parent material: Clayey alluvium derived from mixed sources and/or clayey lacustrine deposits derived from mixed sources Properties and qualities Slope: 0 to 2 percent Depth to restrictive feature: More than 80 inches Drainage class: Moderately well drained Capacity of the most limiting layer to transmit water (Ksat): Moderately high (0.20 to 0.57 in/hr) Depth to water table: More than 80 inches Frequency of flooding: None Frequency of ponding: None Calcium carbonate, maximum content: 5 percent Maximum salinity: Very slightly saline to slightly saline (4.0 to 8.0 mmhos/cm) Sodium adsorption ratio, maximum: 20.0 Available water capacity: Moderate (about 8.6 inches) Interpretive groups Land capability classification (irrigated): 3w Land capability (nonirrigated): 7w Typical profile 0 to 12 inches: Silty clay loam 12 to 60 inches: Silty clay loam Description of Glenbar, Wet Setting Landform: Basin floors Landform position (three-dimensional): Talf 11/12/2010 Page 1 of 2
23 Map Unit Description: IMPERIAL-GLENBAR SILTY CLAY LOAMS, WET, 0 TO 2 PERCENT SLOPES Imperial County, California, Imperial Valley Area Down-slope shape: Linear Across-slope shape: Linear Parent material: Alluvium derived from mixed Properties and qualities Slope: 0 to 2 percent Depth to restrictive feature: More than 80 inches Drainage class: Moderately well drained Capacity of the most limiting layer to transmit water (Ksat): Moderately high (0.20 to 0.57 in/hr) Depth to water table: More than 80 inches Frequency of flooding: None Frequency of ponding: None Calcium carbonate, maximum content: 5 percent Maximum salinity: Nonsaline to slightly saline (2.0 to 8.0 mmhos/cm) Sodium adsorption ratio, maximum: 15.0 Available water capacity: High (about 10.8 inches) Interpretive groups Land capability classification (irrigated): 3w Land capability (nonirrigated): 7w Typical profile 0 to 13 inches: Silty clay loam 13 to 60 inches: Clay loam Minor Components Holtville Percent of map unit: 10 percent Meloland Percent of map unit: 10 percent Data Source Information Soil Survey Area: Imperial County, California, Imperial Valley Area Survey Area Data: Version 5, Jul 25, /12/2010 Page 2 of 2
24 Map Unit Description: MELOLAND VERY FINE SANDY LOAM, WET Imperial County, California, Imperial Valley Area Imperial County, California, Imperial Valley Area 122 MELOLAND VERY FINE SANDY LOAM, WET Map Unit Setting Elevation: -230 to 200 feet Mean annual precipitation: 0 to 3 inches Mean annual air temperature: 72 to 75 degrees F Frost-free period: 300 to 350 days Map Unit Composition Meloland, wet, and similar soils: 85 percent Minor components: 15 percent Description of Meloland, Wet Setting Landform: Basin floors Landform position (three-dimensional): Talf Down-slope shape: Linear Across-slope shape: Linear Parent material: Alluvium derived from mixed sources and/or eolian deposits derived from mixed sources Properties and qualities Slope: 0 to 2 percent Depth to restrictive feature: More than 80 inches Drainage class: Moderately well drained Capacity of the most limiting layer to transmit water (Ksat): Very low to moderately low (0.00 to 0.06 in/hr) Depth to water table: More than 80 inches Frequency of flooding: None Frequency of ponding: None Calcium carbonate, maximum content: 5 percent Maximum salinity: Slightly saline to moderately saline (8.0 to 16.0 mmhos/cm) Sodium adsorption ratio, maximum: 13.0 Available water capacity: Moderate (about 7.8 inches) Interpretive groups Land capability classification (irrigated): 3w Land capability (nonirrigated): 7w Typical profile 0 to 12 inches: Very fine sandy loam 12 to 26 inches: Stratified loamy fine sand to silt loam 26 to 71 inches: Clay Minor Components Imperial Percent of map unit: 3 percent 3/24/2011 Page 1 of 2
25 Map Unit Description: MELOLAND VERY FINE SANDY LOAM, WET Imperial County, California, Imperial Valley Area Indio Percent of map unit: 3 percent Holtville Percent of map unit: 3 percent Glenbar Percent of map unit: 3 percent Vint Percent of map unit: 3 percent Data Source Information Soil Survey Area: Imperial County, California, Imperial Valley Area Survey Area Data: Version 5, Jul 25, /24/2011 Page 2 of 2
26 Map Unit Description: MELOLAND AND HOLTVILLE LOAMS, WET Imperial County, California, Imperial Valley Area Imperial County, California, Imperial Valley Area 123 MELOLAND AND HOLTVILLE LOAMS, WET Map Unit Setting Elevation: -230 to 300 feet Mean annual precipitation: 0 to 3 inches Mean annual air temperature: 72 to 75 degrees F Frost-free period: 300 to 350 days Map Unit Composition Holtville, wet, and similar soils: 40 percent Meloland, wet, and similar soils: 40 percent Minor components: 20 percent Description of Meloland, Wet Setting Landform: Basin floors Landform position (three-dimensional): Talf Down-slope shape: Linear Across-slope shape: Linear Parent material: Alluvium derived from mixed sources and/or eolian deposits derived from mixed sources Properties and qualities Slope: 0 to 2 percent Depth to restrictive feature: More than 80 inches Drainage class: Moderately well drained Capacity of the most limiting layer to transmit water (Ksat): Very low to moderately low (0.00 to 0.06 in/hr) Depth to water table: More than 80 inches Frequency of flooding: None Frequency of ponding: None Calcium carbonate, maximum content: 5 percent Maximum salinity: Slightly saline to moderately saline (8.0 to 16.0 mmhos/cm) Sodium adsorption ratio, maximum: 13.0 Available water capacity: Moderate (about 7.4 inches) Interpretive groups Land capability classification (irrigated): 3w Land capability (nonirrigated): 7w Typical profile 0 to 12 inches: Loam 12 to 26 inches: Stratified loamy fine sand to silt loam 26 to 38 inches: Clay 38 to 60 inches: Stratified silt loam to loamy fine sand Description of Holtville, Wet Setting Landform: Basin floors 3/24/2011 Page 1 of 2
27 Map Unit Description: MELOLAND AND HOLTVILLE LOAMS, WET Imperial County, California, Imperial Valley Area Landform position (three-dimensional): Talf Down-slope shape: Linear Across-slope shape: Linear Parent material: Alluvium and/or lacustrine deposits derived from mixed Properties and qualities Slope: 0 to 2 percent Depth to restrictive feature: More than 80 inches Drainage class: Moderately well drained Capacity of the most limiting layer to transmit water (Ksat): Very low to moderately low (0.00 to 0.06 in/hr) Depth to water table: More than 80 inches Frequency of flooding: None Frequency of ponding: None Calcium carbonate, maximum content: 5 percent Maximum salinity: Nonsaline to slightly saline (2.0 to 8.0 mmhos/cm) Sodium adsorption ratio, maximum: 10.0 Available water capacity: Moderate (about 7.7 inches) Interpretive groups Land capability classification (irrigated): 3w Land capability (nonirrigated): 7w Typical profile 0 to 12 inches: Loam 12 to 24 inches: Clay 24 to 36 inches: Silt loam 36 to 60 inches: Loamy very fine sand Minor Components Glenbar Percent of map unit: 4 percent Imperial Percent of map unit: 4 percent Indio Percent of map unit: 4 percent Rositas Percent of map unit: 4 percent Vint Percent of map unit: 4 percent Data Source Information Soil Survey Area: Imperial County, California, Imperial Valley Area Survey Area Data: Version 5, Jul 25, /24/2011 Page 2 of 2
28 California Revised Storie Index Rating (CA) Imperial County, California, Imperial Valley Area California Revised Storie Index Rating (CA) The Storie Index is a soil rating based on soil properties that govern a soil's potential for cultivated agriculture in California. The Storie Index asseses the productivity of a soil from the following four characteristics: Factor A, degree of soil profile development; factor B, texture of the surface layer; factor C, slope; and factor X, manageable features, including drainage, microrelief, fertility, acidity, erosion, and salt content. A score ranging from 0 to 100 percent is determined for each factor, and the scores are mukltiplied together to derive an index rating. For simplification, Storie Index ratings have been combined into six grades classes as follows: Grade 1 (excellent), 100 to 80; grade 2 (good), 79 to 60; grade 3 (fair), 59 to 40; grade 4 (poor), 39 to 20; grade 5 (very poor), 19 to 10; and grade 6 (nonagricultural), less than 10. Report California Revised Storie Index Rating (CA) The Storie Index is a soil rating based on soil properties that govern a soil map unit component's potential for cultivated agriculture. [Absence of an entry indicates that a Storie Index rating is not applicable or was not estimated]. For simplification, Storie Index ratings have been combined into six grades as follows: Grade 1 (Excellent): Soils that rate between 80 and 100 and which are suitable for a wide range of crops. Grade 2 (Good) Soils that rate between 60 and 79 and which are suitable for a wide range of crops. Grade 3 (Fair): Soils that range between 40 and 59. Soils in this grade may give good results with certain specialized crops. Grade 4 (Poor): Soils that rate between 20 and 39 and which have a narrow range in their agricultural potential. Grade 5 (Very Poor): Soil that rate between 10 and 19 and are of very limited agricultural use except for pasture because of adverse soil conditions. Grade 6 (Nonagricultural): Soils that rate less than 10. [The numbers in the "Limiting feature value" column range from 0.01 to Soils with a smaller the value have a lower potential for cultivated agriculture. The table shows each of the sub-factors used to generate the Storie Index rating for each soil component]. California Revised Storie Index Rating (CA) Imperial County, California, Imperial Valley Area Map symbol and soil name Pct. of map unit Storie index rating California Revised Storie Index (CA) Storie index grade and limiting features Limiting feature value 106 GLENBAR CLAY LOAM, WET Glenbar, wet Grade Two - Good Rated Soil Order 1.00 Profile Group 1.00 Nearly level to gently sloping 0.98 USDA Texture 0.95 Wetness, flooding, ponding, drainage, erosion /7/2011 Page 1 of 3
29 California Revised Storie Index Rating (CA) Imperial County, California, Imperial Valley Area California Revised Storie Index Rating (CA) Imperial County, California, Imperial Valley Area Map symbol and soil name Pct. of map unit Storie index rating California Revised Storie Index (CA) Storie index grade and limiting features Limiting feature value 110 HOLTVILLE SILTY CLAY, WET Holtville, wet Grade Three - Fair Rated Soil Order 1.00 Profile Group 1.00 Nearly level to gently sloping Wetness, flooding, ponding, drainage, erosion Toxicity IMPERIAL SILTY CLAY, WET Imperial, wet Grade Three - Fair Rated Soil Order 1.00 Profile Group 1.00 Nearly level to gently sloping Wetness, flooding, ponding, drainage, erosion Toxicity IMPERIAL-GLENBAR SILTY CLAY LOAMS, WET, 0 TO 2 PERCENT SLOPES Glenbar, wet Grade Two - Good Rated Soil Order 1.00 Profile Group 1.00 Nearly level to gently sloping 0.98 USDA Texture 0.95 Wetness, flooding, ponding, drainage, erosion 0.90 Imperial, wet Grade Two - Good Rated Soil Order 1.00 Profile Group 1.00 Nearly level to gently sloping 0.98 USDA Texture 0.95 Wetness, flooding, ponding, drainage, erosion /7/2011 Page 2 of 3
30 California Revised Storie Index Rating (CA) Imperial County, California, Imperial Valley Area California Revised Storie Index Rating (CA) Imperial County, California, Imperial Valley Area Map symbol and soil name Pct. of map unit Storie index rating California Revised Storie Index (CA) Storie index grade and limiting features Limiting feature value 122 MELOLAND VERY FINE SANDY LOAM, WET Meloland, wet Grade Three - Fair USDA Texture 1.00 Rated Soil Order 1.00 Profile Group 1.00 Nearly level to gently sloping Wetness, flooding, ponding, drainage, erosion MELOLAND AND HOLTVILLE LOAMS, WET Holtville, wet Grade Two - Good USDA Texture 1.00 Rated Soil Order 1.00 Profile Group 1.00 Nearly level to gently sloping Wetness, flooding, ponding, drainage, erosion Meloland, wet Grade Three - Fair USDA Texture 1.00 Rated Soil Order 1.00 Profile Group 1.00 Nearly level to gently sloping Wetness, flooding, ponding, drainage, erosion Data Source Information Soil Survey Area: Imperial County, California, Imperial Valley Area Survey Area Data: Version 5, Jul 25, /7/2011 Page 3 of 3
31 LESA ASSESSMENT CALEXICO SOLAR FARM I PHASE B PROJECT AREA CALEXICO SOLAR FARM I PHASE B PROJECT (N/4 Section 22, W/2 NE/4 Section 22, NE/4 NE/4 Section 22, SE/4 NE/4 (portion) Section 22, Lot 1, 2, 3 and 4 (portion) Section 22, SW/4 SW/4 Section 23, Lot 1 (portion) Section 23, T17S, R13E, SBB&M) IMPERIAL COUNTY, CALIFORNIA April 2011 EMA Report No B Prepared for: 88FT 8ME, LLC Santa Monica Boulevard, Suite 300 Los Angeles, California ENVIRONMENTAL MANAGEMENT ASSOCIATES
32 LAND EVALUATION AND SITE ASSESSMENT MODEL CALEXICO SOLAR FARM I PHASE B PROJECT (N/4 Section 22, W/2 NE/4 Section 22, NE/4 NE/4 Section 22, SE/4 NE/4 (portion) Section 22, Lot 1, 2, 3 and 4 (portion) Section 22, SW/4 SW/4 Section 23, Lot 1 (portion) Section 23, T17S, R13E, SBB&M) IMPERIAL COUNTY, CALIFORNIA The Land Evaluation and Site Assessment (LESA) model is an approach for rating the relative quality of land resources based upon specific measurable features. The LESA model was first developed by the federal (NRCS) in It was subsequently adapted in 1990 by the California Department of Conservation to evaluate land use decisions that affect the conversion of agriculture lands in California. The formulation of the California LESA Model is intended to provide lead agencies under the California Environmental Quality Act (CEQA) with an optional methodology to ensure that significant effects on the environment of agricultural land conversions are quantitatively and consistently considered in the environmental review process. For determining the potential CEQA significance resulting from the conversion of agricultural lands to some other purpose, the California Agricultural LESA Model has developed Scoring Thresholds which are used to compare the Final LESA Score and the Weighted Factor Scores for the Project with suggested Scoring Decisions. These LESA Scores do not take into consideration any proposed mitigation measures or other factors that might affect a lead agency s determination of the significance of the agricultural lands conversion impact under CEQA. The information provided on the following pages present documentation of the LESA assessment prepared using the California Agricultural LESA Model for the proposed Calexico Solar Farm I Phase B Project (Project) (APNs ; ; ; ; and ). The proposed Project would be constructed on approximately 613 acres of privately owned land located about eight miles west of the city of Calexico, California (Figure 1). The Project is bounded on the south by Mandrapa Road, an Imperial County road (Figure 2). The international border with Mexico is located immediately south of Mandrapa Road.
33 LESA ASSESSMENT 88FT 8ME, LLC CALEXICO SOLAR FARM I PHASE B PROJECT IMPERIAL COUNTY, NEVADA TABLE OF CONTENTS SUMMARY... i LIST OF FIGURES... ii LIST OF APPENDICES... ii 1. CALIFORNIA LAND EVALUATION AND SITE ASSESSMENT MODEL... 3 A LAND CAPABILITY CLASSIFICATION ( LCC )...3 B STORIE INDEX RATING...3 C PROJECT SIZE RATING...5 D WATER RESOURCES AVAILABILITY RATING...6 E SURROUNDING AGRICULTURAL LAND RATING...7 F SURROUNDING PROTECTED RESOURCE LAND RATING...7 G WEIGHTING OF FACTORS AND FINAL LESA SCORE...10 Page LIST OF FIGURES Figure 1: Location Map... 1 Figure 2: Project Area Map on an Aerial Photographic Base... 2 Figure 3: Project Area Soils Map... 4 Figure 4: Zone of Influence... 9 Page LIST OF APPENDICES APPENDIX A: CALEXICO SOLAR FARM I PHASE B PROJECT SOILS DETAILS

34
35
36 Land Evaluation Worksheet A B C D E F G H Soil Map Unit* Project Acres Proportion of LCC** LCC Rating LCC Score Storie Storie Index Project Area (irrigated) (irrigated)*** (C x E) Index** Score (C x G) IIw IIIw IIIw IIw IIIw IIIw IIw Totals LCC Total Storie Index 64 Score Total Score 56 Total Project Area (acres)= 613 * The Soil Map Unit information and acreage were determined from the current soil survey information available at the USDA website: (Figure 3). ** The Land Capability Classification and Storie Index information was obtained from the current soil survey information available at the USDA website: (Appendix A). *** The LCC Rating for irrigated land was determined from the LCC Point Rating Table 2 from the LESA Instruction Manual (California Department of Conservation 1997).

37 *Adjusted to 613 acres
38 Site Assessment Worksheet 1 Project Size Score* I J K LCC Class I-II LCC Class III LCC Class IV-VIII Project Acres per LCC Class Project Acres per LCC Class Project Acres per LCC Class Project Acres per LCC Class 2.45 Project Acres per LCC Class Total Project Acres per LCC Class * Project Size Scores Highest Project Size Score 100 * Project Size Score was determined from the Project Size Scoring Table from the LESA Instruction Manual (California Department of Conservation 1997).
39 A B C D E Project Portion Water Source Site Assessment Worksheet 2 Water Resources Availability Proportion of Project Area Water Availability Score* Weighted Availability Score (C x D) 1 Irrigation District Only Total Water (Must Sum to 1.0) 100 Resource Score * The Water Availability Score was determined using the Water Resources Availability Scoring Table from the LESA Instruction Manual (California Department of Conservation 1997).
40 Site Assessment Worksheet 3 Surrounding Agricultural Land & Surrounding Protected Resource Land A B C D E F G Zone of Influence* Surrounding Surrounding Total Acres Percent Agricultural Protected Acres of Percent in Protected Land Score Resource Land Acres in Protected Agriculture Resource (From LESA Score (From Agriculture Resource (B/A) Land Manual LESA Manual Land (C/A) Table 6) Table 7)** * In conformance with the instructions in the LESA Instruction Manual (California Department of Conservation 1997), the Zone of Influence was determined by drawing the smallest rectangle that could completely encompass the entire Project Area. A second rectangle was then drawn which extended one quarter mile on all sides beyond the first rectangle. The Zone of Influence is represented by the entire area of all parcels with any lands inside the outer rectangle, less the area of the proposed project (Figure 4). ** The LESA Instruction Manual (California Department of Conservation 1997) describes Protected Resource Land as those lands with long term use restrictions that are compatible with or supportive of agricultural uses of land. Included among them are the following: Williamson Act contracted lands; Publicly owned lands maintained as park, forest, or watershed resources; and Lands with agricultural, wildlife habitat, open space, or other natural resource easements that restrict the conversion of such land to urban or industrial uses. Surrounding Parcels*** Acres Protected Resource Land? Percent Protected Resource Land Acres in Protected Land Agricultural Land? Percent Agricultural Land Acres of Agriculture N 0 0 Y N 0 0 Y N 0 0 Y N 0 0 Y N 0 0 Y N 0 0 Y N 0 0 Y N 0 0 Y N 0 0 Y N 0 0 Y N 0 0 Y N 0 0 Y N 0 0 Y N 0 0 Y N 0 0 Y
41 Surrounding Parcels*** Acres Protected Resource Land? Percent Protected Resource Land Acres in Protected Land Agricultural Land? Percent Agricultural Land Acres of Agriculture N 0 0 N N 0 0 N N 0 0 Y N 0 0 N Total Total 0 Total **The Imperial County Assessors website was accessed to identify the surrounding parcel numbers ( The percentage of agriculture was determined from a map overlay used to estimate the proportion of land in agriculture and the California Department of Conservation Important Farmland Map Series.
42 Scale: 1"= feet Title: Date: 3/24/2011 This map represents a visual display of related geographic information. Data provided hereon is not a guarantee of actual field conditions. To be sure of complete accuracy, please contact IMPERIALCOUNTY_PUBLIC staff for the most up-to-date information.
43 Final LESA Score Sheet Factor Scores Factor Weight Weighted Factor Scores LE Factors Land Capability Classification Storie Index LE subtotal SA Factors Project Size Water Resource Availability Surrounding Agricultural Land Protected Resource Land SA Subtotal Total LESA Score Total LESA Score 0 to 39 Points 40 to 59 Points 60 to 79 Points California LESA Model Scoring Thresholds Not Considered Significant to 100 Points Considered Significant Scoring Decision Considered Significant only if LE and SA subscores are each greater than or equal to 20 points Considered Significant unless either LE or SA subscore is less than 20 points
44 APPENDIX A: CALEXICO SOLAR FARM I PHASE B PROJECT SOILS DETAILS
45 Map Unit Description: HOLTVILLE SILTY CLAY, WET Imperial County, California, Imperial Valley Area Imperial County, California, Imperial Valley Area 110 HOLTVILLE SILTY CLAY, WET Map Unit Setting Elevation: -230 to 200 feet Mean annual precipitation: 0 to 3 inches Mean annual air temperature: 72 to 75 degrees F Frost-free period: 300 to 350 days Map Unit Composition Holtville, wet, and similar soils: 85 percent Minor components: 15 percent Description of Holtville, Wet Setting Landform: Basin floors Landform position (three-dimensional): Talf Down-slope shape: Linear Across-slope shape: Linear Parent material: Alluvium derived from mixed sources Properties and qualities Slope: 0 to 2 percent Depth to restrictive feature: More than 80 inches Drainage class: Moderately well drained Capacity of the most limiting layer to transmit water (Ksat): Very low to moderately low (0.00 to 0.06 in/hr) Depth to water table: More than 80 inches Frequency of flooding: None Frequency of ponding: None Calcium carbonate, maximum content: 5 percent Maximum salinity: Nonsaline to slightly saline (2.0 to 8.0 mmhos/cm) Sodium adsorption ratio, maximum: 10.0 Available water capacity: Moderate (about 7.6 inches) Interpretive groups Land capability classification (irrigated): 2w Land capability (nonirrigated): 7w Typical profile 0 to 17 inches: Silty clay 17 to 24 inches: Clay 24 to 35 inches: Silt loam 35 to 60 inches: Loamy very fine sand Minor Components Glenbar Percent of map unit: 5 percent Imperial Percent of map unit: 5 percent 3/24/2011 Page 1 of 2
46 Map Unit Description: HOLTVILLE SILTY CLAY, WET Imperial County, California, Imperial Valley Area Indio Percent of map unit: 3 percent Vint Percent of map unit: 2 percent Data Source Information Soil Survey Area: Imperial County, California, Imperial Valley Area Survey Area Data: Version 5, Jul 25, /24/2011 Page 2 of 2
47 Map Unit Description: IMPERIAL SILTY CLAY, WET Imperial County, California, Imperial Valley Area Imperial County, California, Imperial Valley Area 114 IMPERIAL SILTY CLAY, WET Map Unit Setting Elevation: -230 to 200 feet Mean annual precipitation: 0 to 3 inches Mean annual air temperature: 72 to 75 degrees F Frost-free period: 300 to 350 days Map Unit Composition Imperial, wet, and similar soils: 85 percent Minor components: 15 percent Description of Imperial, Wet Setting Landform: Basin floors Landform position (three-dimensional): Talf Down-slope shape: Linear Across-slope shape: Linear Parent material: Clayey alluvium derived from mixed sources and/or clayey lacustrine deposits derived from mixed sources Properties and qualities Slope: 0 to 2 percent Depth to restrictive feature: More than 80 inches Drainage class: Moderately well drained Capacity of the most limiting layer to transmit water (Ksat): Moderately low to moderately high (0.06 to 0.20 in/hr) Depth to water table: More than 80 inches Frequency of flooding: None Frequency of ponding: None Calcium carbonate, maximum content: 5 percent Maximum salinity: Very slightly saline to slightly saline (4.0 to 8.0 mmhos/cm) Sodium adsorption ratio, maximum: 20.0 Available water capacity: Moderate (about 8.3 inches) Interpretive groups Land capability classification (irrigated): 3w Land capability (nonirrigated): 7w Typical profile 0 to 12 inches: Silty clay 12 to 60 inches: Silty clay loam Minor Components Glenbar Percent of map unit: 4 percent Meloland Percent of map unit: 4 percent 11/12/2010 Page 1 of 2
48 Map Unit Description: IMPERIAL SILTY CLAY, WET Imperial County, California, Imperial Valley Area Holtville Percent of map unit: 4 percent Niland Percent of map unit: 3 percent Data Source Information Soil Survey Area: Imperial County, California, Imperial Valley Area Survey Area Data: Version 5, Jul 25, /12/2010 Page 2 of 2
49 Map Unit Description: IMPERIAL-GLENBAR SILTY CLAY LOAMS, WET, 0 TO 2 PERCENT SLOPES Imperial County, California, Imperial Valley Area Imperial County, California, Imperial Valley Area 115 IMPERIAL-GLENBAR SILTY CLAY LOAMS, WET, 0 TO 2 PERCENT SLOPES Map Unit Setting Elevation: -230 to 200 feet Mean annual precipitation: 0 to 3 inches Mean annual air temperature: 72 to 75 degrees F Frost-free period: 300 to 350 days Map Unit Composition Glenbar, wet, and similar soils: 40 percent Imperial, wet, and similar soils: 40 percent Minor components: 20 percent Description of Imperial, Wet Setting Landform: Basin floors Landform position (three-dimensional): Talf Down-slope shape: Linear Across-slope shape: Linear Parent material: Clayey alluvium derived from mixed sources and/or clayey lacustrine deposits derived from mixed sources Properties and qualities Slope: 0 to 2 percent Depth to restrictive feature: More than 80 inches Drainage class: Moderately well drained Capacity of the most limiting layer to transmit water (Ksat): Moderately high (0.20 to 0.57 in/hr) Depth to water table: More than 80 inches Frequency of flooding: None Frequency of ponding: None Calcium carbonate, maximum content: 5 percent Maximum salinity: Very slightly saline to slightly saline (4.0 to 8.0 mmhos/cm) Sodium adsorption ratio, maximum: 20.0 Available water capacity: Moderate (about 8.6 inches) Interpretive groups Land capability classification (irrigated): 3w Land capability (nonirrigated): 7w Typical profile 0 to 12 inches: Silty clay loam 12 to 60 inches: Silty clay loam Description of Glenbar, Wet Setting Landform: Basin floors Landform position (three-dimensional): Talf 11/12/2010 Page 1 of 2
50 Map Unit Description: IMPERIAL-GLENBAR SILTY CLAY LOAMS, WET, 0 TO 2 PERCENT SLOPES Imperial County, California, Imperial Valley Area Down-slope shape: Linear Across-slope shape: Linear Parent material: Alluvium derived from mixed Properties and qualities Slope: 0 to 2 percent Depth to restrictive feature: More than 80 inches Drainage class: Moderately well drained Capacity of the most limiting layer to transmit water (Ksat): Moderately high (0.20 to 0.57 in/hr) Depth to water table: More than 80 inches Frequency of flooding: None Frequency of ponding: None Calcium carbonate, maximum content: 5 percent Maximum salinity: Nonsaline to slightly saline (2.0 to 8.0 mmhos/cm) Sodium adsorption ratio, maximum: 15.0 Available water capacity: High (about 10.8 inches) Interpretive groups Land capability classification (irrigated): 3w Land capability (nonirrigated): 7w Typical profile 0 to 13 inches: Silty clay loam 13 to 60 inches: Clay loam Minor Components Holtville Percent of map unit: 10 percent Meloland Percent of map unit: 10 percent Data Source Information Soil Survey Area: Imperial County, California, Imperial Valley Area Survey Area Data: Version 5, Jul 25, /12/2010 Page 2 of 2
51 Map Unit Description: INDIO LOAM, WET Imperial County, California, Imperial Valley Area Imperial County, California, Imperial Valley Area 118 INDIO LOAM, WET Map Unit Setting Elevation: -230 to 200 feet Mean annual precipitation: 0 to 3 inches Mean annual air temperature: 72 to 75 degrees F Frost-free period: 300 to 350 days Map Unit Composition Indio, wet, and similar soils: 85 percent Minor components: 15 percent Description of Indio, Wet Setting Landform: Basin floors Landform position (three-dimensional): Talf Down-slope shape: Linear Across-slope shape: Linear Parent material: Alluvium derived from mixed sources and/or eolian deposits derived from mixed sources Properties and qualities Slope: 0 to 2 percent Depth to restrictive feature: More than 80 inches Drainage class: Moderately well drained Capacity of the most limiting layer to transmit water (Ksat): Moderately high to high (0.57 to 1.98 in/hr) Depth to water table: More than 80 inches Frequency of flooding: None Frequency of ponding: None Calcium carbonate, maximum content: 5 percent Maximum salinity: Nonsaline to very slightly saline (0.0 to 4.0 mmhos/ cm) Sodium adsorption ratio, maximum: 5.0 Available water capacity: Moderate (about 8.5 inches) Interpretive groups Land capability classification (irrigated): 2w Land capability (nonirrigated): 7w Typical profile 0 to 12 inches: Loam 12 to 72 inches: Stratified loamy very fine sand to silt loam Minor Components Vint Percent of map unit: 6 percent Meloland Percent of map unit: 3 percent 3/24/2011 Page 1 of 2
52 Map Unit Description: INDIO LOAM, WET Imperial County, California, Imperial Valley Area Holtville Percent of map unit: 3 percent Glenbar Percent of map unit: 3 percent Data Source Information Soil Survey Area: Imperial County, California, Imperial Valley Area Survey Area Data: Version 5, Jul 25, /24/2011 Page 2 of 2
53 Map Unit Description: MELOLAND VERY FINE SANDY LOAM, WET Imperial County, California, Imperial Valley Area Imperial County, California, Imperial Valley Area 122 MELOLAND VERY FINE SANDY LOAM, WET Map Unit Setting Elevation: -230 to 200 feet Mean annual precipitation: 0 to 3 inches Mean annual air temperature: 72 to 75 degrees F Frost-free period: 300 to 350 days Map Unit Composition Meloland, wet, and similar soils: 85 percent Minor components: 15 percent Description of Meloland, Wet Setting Landform: Basin floors Landform position (three-dimensional): Talf Down-slope shape: Linear Across-slope shape: Linear Parent material: Alluvium derived from mixed sources and/or eolian deposits derived from mixed sources Properties and qualities Slope: 0 to 2 percent Depth to restrictive feature: More than 80 inches Drainage class: Moderately well drained Capacity of the most limiting layer to transmit water (Ksat): Very low to moderately low (0.00 to 0.06 in/hr) Depth to water table: More than 80 inches Frequency of flooding: None Frequency of ponding: None Calcium carbonate, maximum content: 5 percent Maximum salinity: Slightly saline to moderately saline (8.0 to 16.0 mmhos/cm) Sodium adsorption ratio, maximum: 13.0 Available water capacity: Moderate (about 7.8 inches) Interpretive groups Land capability classification (irrigated): 3w Land capability (nonirrigated): 7w Typical profile 0 to 12 inches: Very fine sandy loam 12 to 26 inches: Stratified loamy fine sand to silt loam 26 to 71 inches: Clay Minor Components Imperial Percent of map unit: 3 percent 3/24/2011 Page 1 of 2
54 Map Unit Description: MELOLAND VERY FINE SANDY LOAM, WET Imperial County, California, Imperial Valley Area Indio Percent of map unit: 3 percent Holtville Percent of map unit: 3 percent Glenbar Percent of map unit: 3 percent Vint Percent of map unit: 3 percent Data Source Information Soil Survey Area: Imperial County, California, Imperial Valley Area Survey Area Data: Version 5, Jul 25, /24/2011 Page 2 of 2
55 Map Unit Description: MELOLAND AND HOLTVILLE LOAMS, WET Imperial County, California, Imperial Valley Area Imperial County, California, Imperial Valley Area 123 MELOLAND AND HOLTVILLE LOAMS, WET Map Unit Setting Elevation: -230 to 300 feet Mean annual precipitation: 0 to 3 inches Mean annual air temperature: 72 to 75 degrees F Frost-free period: 300 to 350 days Map Unit Composition Holtville, wet, and similar soils: 40 percent Meloland, wet, and similar soils: 40 percent Minor components: 20 percent Description of Meloland, Wet Setting Landform: Basin floors Landform position (three-dimensional): Talf Down-slope shape: Linear Across-slope shape: Linear Parent material: Alluvium derived from mixed sources and/or eolian deposits derived from mixed sources Properties and qualities Slope: 0 to 2 percent Depth to restrictive feature: More than 80 inches Drainage class: Moderately well drained Capacity of the most limiting layer to transmit water (Ksat): Very low to moderately low (0.00 to 0.06 in/hr) Depth to water table: More than 80 inches Frequency of flooding: None Frequency of ponding: None Calcium carbonate, maximum content: 5 percent Maximum salinity: Slightly saline to moderately saline (8.0 to 16.0 mmhos/cm) Sodium adsorption ratio, maximum: 13.0 Available water capacity: Moderate (about 7.4 inches) Interpretive groups Land capability classification (irrigated): 3w Land capability (nonirrigated): 7w Typical profile 0 to 12 inches: Loam 12 to 26 inches: Stratified loamy fine sand to silt loam 26 to 38 inches: Clay 38 to 60 inches: Stratified silt loam to loamy fine sand Description of Holtville, Wet Setting Landform: Basin floors 3/24/2011 Page 1 of 2
Loam Ridge Almond Orchard
 AG-LAND Investment Brokers 645 Antelope Blvd., Suite 17 PO Box 896 Red Bluff, CA 96080 530-529-4400 Fax 530-527-5042 Loam Ridge Almond Orchard Contact: AG-LAND Investment Brokers Prepared by FSA Date:
AG-LAND Investment Brokers 275 Sale Lane Red Bluff, CA Fax Corning Eucalyptus Farm
 AG-LAND Investment Brokers 275 Sale Lane Red Bluff, CA 96080 530-529-4400 Fax 530-527-5042 Corning Eucalyptus Farm Tehama County,, California 1 of 6 deep irrigation wells Drip tubing rolled at the edge
Gonsalves Ranch, 756 +/- Total Acres Red Bluff, California
 AG-LAND INVESTMENT BROKERS 275 Sale Lane, Suite 2 / P. O. Box 896 Red Bluff, CA 96080 530.529.4400 office / 530.527.5042 fax Gonsalves Ranch, 756 +/- Total Acres Red Bluff, California Listing Price: $675,000.
Custom Soil Resource Report for Polk County, Wisconsin
 United States Department of Agriculture Natural Resources Conservation Service A product of the National Cooperative Soil Survey, a joint effort of the United States Department of Agriculture and other
PHYSICAL SOIL PROPERTIES
 PHYSICAL SOIL PROPERTIES Physical Soil Properties Santa Cruz County, California Scotts Valley Target Physical Soil Properties This table shows estimates of some physical characteristics and features that
RI Site Specific Soil Mapping Standards and Procedures
 RI Site Specific Soil Mapping Standards and Procedures Understanding Hydrologic Soil Groups and Site Specific Mapping URI Coastal Institute, Kingston June 28 th 2012 Jillian Phillips URI Cooperative Extension
Standards for Soil Erosion and Sediment Control in New Jersey May 2012 STANDARD FOR GRASSED WATERWAYS. Definition. Purpose
 STANDARD FOR GRASSED WATERWAYS Definition A natural or constructed watercourse shaped or graded in earth materials and stabilized with suitable vegetation for the safe conveyance of runoff water. Purpose
FOR SALE. 1,237.33± Acres, Wasco Kern County, California. CA BRE # Exclusively Presented By: Pearson Realty
 FOR SALE Wasco Almonds & Farmland Opportunity 1,237.33± Acres, Wasco Kern County, California Access to district & well water Quality soils & well water to work with 747.13± acres of almonds, 595.52± acres
Initial Run-on and Run-off Control System Plan
 Initial Run-on and Run-off Control System Plan For Compliance with the Coal Combustion Residuals Rule (40 CFR 257.81) Valmont Station - Ash Disposal Facility Public Service Company of Colorado Denver,
Characteristics of Land Resources
 Chapter Chapter 1 Characteristics of Land Resources The geology, soils and topography of Woodford County T he geology, soils and topography of an area are important to the community planning process for
Grapes, Wine $95,231,000 Milk $42,517,000 Nursery Stock $26,408,000 Pears, Bartlett $26,100,000 Corn, Field $10,295,000
 This section of the Draft Environmental Impact Report (EIR) describes the agricultural resources that exist within the Planning Area. Sources utilized in this section to assess impacts of the project include
Sugarbeet Production in the Imperial Valley
 Sugarbeet Production in the Imperial Valley Stephen Kaffka, Department of Plant Sciences, University of California, Davis (srkaffka@ucdavis.edu) And Ron Tharp, Spreckels Sugar Company Coachella Valley,
THE CITY OF THE VILLAGE PLANNED UNIT DEVELOPMENT DESIGN STATEMENT FOR MULFORD ESTATES
 THE CITY OF THE VILLAGE PLANNED UNIT DEVELOPMENT DESIGN STATEMENT FOR MULFORD ESTATES Revised August 18, 2016, August 10, 2016, September 19,2016 Prepared By: Isch and Associates, Inc. 14848 Bristol Park
Saturated Buffer. Subsurface Drainage PURPOSE N REDUCTION LOCATION COST BARRIERS
 Saturated Buffer To intercept tile drainage prior to discharging to surface waters and redistribute the water laterally in the soil profile of the streamside buffer. Subsurface drainage, also known as
Appendix F Preliminary Flood Hazard Assessments
 Appendix F Preliminary Flood Hazard Assessments Final Preliminary Flood Hazard Assessment, Regulus Solar Project REGULUS SOLAR PROJECT Kern County, California Preliminary Flood Hazard Assessment FINAL
BENEFITS FROM IMPROVING FLOOD IRRIGATION EFFICIENCY
 BENEFITS FROM IMPROVING FLOOD IRRIGATION EFFICIENCY Report of Progress 544 Agricultural Experiment Station Kansas State University, Manhattan Walter R. Woods, Director BENEFITS FROM IMPROVING FLOOD IRRIGATION
Overall Instructions
 Farm Evaluation Survey Overall Instructions This Farm Evaluation Survey is prepopulated with member information you provide to the Coalition. If any information is incorrect, please indicate the correct
Ponds. Pond A water impoundment made by excavating a pit, or constructing a dam or an embankment.
 POND SITE SELECTION AND CONSTRUCTION Uses, Planning, & Design David Krietemeyer Area Engineer USDA-NRCS June 20, 2008 Uses Considerations for Location of Commonly Used Terms Pond A water impoundment made
1,119+/- ACRES ANTELOPE COUNTY, NE
 LAND FOR SALE 1,119+/- ACRES ANTELOPE COUNTY, NE 7 Contiguous Irrigated Quarters Tracts 2 & 3 OWNERS: William K. & Connie K. Becker 800-887-8625 www.bigironrealty.com LISTING AGENT DENNIS FOWLKES 402-447-6113
Soil Resources Analysis Hurricane Ivan-RCW Expansion Project Conecuh National Forest
 Soil Resources Analysis Hurricane Ivan-RCW Expansion Project Conecuh National Forest Current Conditions of Soil Resources: The project area is wide spread across the forest, the result of a large scale
Anne F. Wronal. Keywords: alfalfa. open drains, sweetpotato whitefly, CUFIO1, dry down, salinity, Colorado River water. soils, agronomic practices
 Palo Alfalfa Production in the Imperial and Verde Valleys Anne F. Wronal Abstract: Alfalfa is planted on more acreage than any other crop in the Imperial and Palo Verde valleys of California. Gross returns
PROJECT NO A. ISSUED: February 29, 2016
 INTERPRETIVE REPORT FOR INFILTRATION SYSTEM DESIGN, PROPOSED VILLA VERONA APARTMENT COMMUNITY, ASSESSOR S PARCEL NUMBERS 311-040-015, 311-040-021, 311-040-024, 311-040-026 AND 311-040-013, LOCATED ON THE
Estimating the Seasonal High Water Table: A Mix of Art & Science
 Estimating the Seasonal High Water Table: A Mix of Art & Science PONDS WORKSHOP - SJRWMD Devo Seereeram, Ph.D., P.E. This paper was originally written over 4 years ago & generated a lot of interest. The
Seismic conditions, proximity to faults, risk of seismic related ground failure Landslide risk Risk of substantial soil erosion
 A. GEOLOGY AND SOILS 1. Environmental Issue This section of the EIR was prepared by Firma using the available geologic and soils investigation reports for properties within the Planning Area. 1 These studies
Infiltration Testing For Stormwater BMPs: What Would Mickey Mouse Do?
 Infiltration Testing For Stormwater BMPs: What Would Mickey Mouse Do? CCLC Turning A New Leaf November 3, 2017 David J. Hirschman Hirschman Water & Environment, LLC www.hirschmanwater.com dave@hirschmanwater.com
ATTACHMENT 4 USDA NRCS HYDRIC SOIL UNIT DESCRIPTIONS
 ATTACHMENT 4 USDA NRCS HYDRIC SOIL UNIT DESCRIPTIONS USDA NRCS descriptions of the 23 wetland soil units (hydric soils and soils with hydric inclusions) That occur within the proposed Marble River Wind
Standards for Soil Erosion and Sediment Control in New Jersey May 2012 STANDARD FOR SLOPE PROTECTION STRUCTURES. Definition
 STANDARD FOR SLOPE PROTECTION STRUCTURES Definition Structures to safely conduct surface runoff from the top of a slope to the bottom of the slope. Purpose The purpose of this practice is to convey storm
Topsoil Loss and Modification During Suburbanization: Impact on Demands for Municipal Water. R.G. Darmody
 Topsoil Loss and Modification During Suburbanization: Impact on Demands for Municipal Water R.G. Darmody Department of Natural Resources and Environmental Sciences University of Illinois The Problem Demands
HEADQUARTERS WEST LTD. FARM, RANCH, AGRIBUSINESS REAL ESTATE SALES & SERVICES
 Offered For Sale HUNT VALLEY RANCH Apache County, Arizona Exclusively Listed By: Traegen Knight Headquarters West, Ltd. P.O. Box 1980 St. Johns, Arizona 85936 Ph. 928 524-3740 Fx. 928 563-7004 Hunt Valley
Irrigation Scheduling: Checkbook Method
 Know how. Know now. EC709 Irrigation Scheduling: Checkbook Method Steven R. Melvin, Extension Educator C. Dean Yonts, Extension Irrigation Specialist Irrigation scheduling helps determine when and how
Culvert Sizing procedures for the 100-Year Peak Flow
 CULVERT SIZING PROCEDURES FOR THE 100-YEAR PEAK FLOW 343 APPENDIX A: Culvert Sizing procedures for the 100-Year Peak Flow A. INTRODUCTION Several methods have been developed for estimating the peak flood
Overview of NRCS (SCS) TR-20 By Dr. R.M. Ragan
 TR-20 By Dr. R.M. Ragan") Overview of NRCS (SCS) TR-20 By Dr. R.M. Ragan TR-20 is a computer program for the simulation of runoff occurring from a single storm event. The program develops flood hydrographs from runoff and routes
Overview of NRCS (SCS) TR-20 By Dr. R.M. Ragan TR-20 is a computer program for the simulation of runoff occurring from a single storm event. The program develops flood hydrographs from runoff and routes
Treatment Volume: Curve Numbers. Composite CN or Not? Treatment Volume: Curve Numbers. Treatment Volume: Calculation. Treatment Volume: Calculation
 Stormwater Engineering Bioretention Design Bill Hunt, PE, Ph.D. Extension Specialist & Assistant Professor NCSU-BAE www.bae.ncsu.edu/stormwater Bioretention Design Six Step Process 1 Determine Volume to
TES Industrial Development SW ¼ SEC Lacombe County Outline Plan
 TES Industrial Development Lacombe County Outline Plan 112849297 June 2012 am v:\1128\active\112849297\07_reports_studies\rpt_tes_20120508.doc i Table of Contents 1.0 INTRODUCTION... 1 1.1 PURPOSE... 1
SOUTH FLORIDA WATER MANAGEMENT DISTRICT. Question 13: Wetlands
 SOUTH FLORIDA WATER MANAGEMENT DISTRICT Question 13: Wetlands 1. The wetland responses and topographical data provided in the ADA for the 520- acre project site are conceptual in nature. The referenced
Irrigation District Efficiencies and Potential Water Savings in the Lower Rio Grande Valley of Texas
 Irrigation District Efficiencies and Potential Water Savings in the Lower Rio Grande Valley of Texas Guy Fipps and Craig Pope1 Abstract Agriculture holds about 90 percent of all the water rights in the
Irrigation Improvement Options part 1- on field irrigation
 Training Course Conceptual irrigation design in the context of IRBM Arba Minch University, Arba Minch 26 30 March, 2012 Irrigation Improvement Options part 1- on field irrigation March 2012, Henk Ritzema
Monitoring soil moisture helps refine irrigation management
 Enviroscan soil moisture sensors like the one shown, that monitor on a continuous basis, provide more information that can be valuable. Monitoring soil moisture helps refine irrigation management Blaine
Determination of Design Infiltration Rates for the Sizing of Infiltration based Green Infrastructure Facilities
 Determination of Design Infiltration Rates for the Sizing of Infiltration based Green Infrastructure Facilities 1 Introduction This document, developed by the San Francisco Public Utilities Commission
Public Notice ISSUED: 26 December 2017 EXPIRES: 26 January 2018
 SPONSOR: Carex Group, LLC Public Notice ISSUED: 26 December 2017 EXPIRES: 26 January 2018 REFER TO: MVP-2015-01348-EJI SECTION:404 - Clean Water Act 1 WETLAND COMPENSATORY MITIGATION BANK PROPOSAL 2 SPECIFIC
Instructions for the South Pacific Division Nationwide Permit Pre- Construction Notification (PCN):
:") This PCN integrates the requirements of the U.S. Army Corps of Engineers (Corps) Nationwide Permit Program within the South Pacific Division (SPD), including the Albuquerque, Los Angeles, San Francisco,
This PCN integrates the requirements of the U.S. Army Corps of Engineers (Corps) Nationwide Permit Program within the South Pacific Division (SPD), including the Albuquerque, Los Angeles, San Francisco,
Environmental Information Worksheet
 Environmental Information Worksheet Water System Owner (Attach additional sheets if necessary) Needs and Alternatives Provide a brief narrative that describes: Current drinking water system needs. Project
Chapter 3 Calculating the WQCV and Volume Reduction
 Contents 1.0 Introduction... 1 2.0 Hydrologic Basis of the WQCV... 1 2.1 Development of the WQCV... 1 2.2 Optimizing the Capture Volume... 3 2.3 Attenuation of the WQCV (BMP Drain Time)... 4 2.4 Excess
State of the Valley Report
 State of the Valley Report An overview of the characteristics and trends of natural resources in the San Joaquin Valley s rural spaces, with an eye on resource sustainability for the future Aerial view
Coefficients for Estimating SAR from Soil ph and EC Data and Calculating ph from SAR and EC Values in Salinity Models
 Arid Soil Research and Rehabilitation, Volume 7, pp. 29-38 0890-3069/93 $10.00 +.00 Printed in the UK. All rights reserved. Copyright 1993 Taylor & Francis Coefficients for Estimating SAR from Soil ph
NCDA&CS 2012 AGRICULTURAL LANDS ASSESSMENT
 Introduction AGRICULTURAL LANDS ASSESSMENT In the last 10 years, North Carolina has lost 4,600 farms, an 8% decrease. In addition, land in farms has decreased by 6.5%, a total loss of 600,000 acres. Agriculture
East TX Test Site (1/2 Treated)
") 1 East TX Test Site (1/2 Treated) 2 CATION EXCHANGE CAPACITY ( CEC ) It is a measure of the quantity of cations reversibly adsorbed per unit weight of soil. CEC is expressed in meq/100 g of mass (meq is
1 East TX Test Site (1/2 Treated) 2 CATION EXCHANGE CAPACITY ( CEC ) It is a measure of the quantity of cations reversibly adsorbed per unit weight of soil. CEC is expressed in meq/100 g of mass (meq is
Storm Water Management Standards
 Storm Water Management Standards The City of Roseville has developed specific requirements that apply to development and redevelopment projects. These standards are intended to help achieve the water resource
Irrigation Management for Trees and Vines
 Irrigation Management for Trees and Vines Louise Ferguson LFerguson@ucdavis.edu Department of Plant Sciences University of California Davis Agriculture & Natural Resources University of California Cooperative
When the land division tree preservation requirements apply
 INFORMATION GUIDE Tree Preservation on Your Land Division Site The land division process provides the flexibility and opportunity to promote creative site design that considers multiple objectives, including
Simbol Calipatria II CUP # SmCP-2 Project Trip Assignment
 Path: L:\SanDiego\HudsonRanch_Geothermal\MAPS\MXDs\Figure_4_14-4_SmCP2_Project_Trip_Assignment.mxd Riverside County Imperial County MEXICO Simbol Calipatria II CUP #12-0005 SmCP-2 Project Trip Assignment
Smith Land Service Co.
 Smith Land Service Co. Farmland Sales Management Appraisal FARM FOR SALE: 135 ACRES, MIL WASHINGTON TWP. ADAMS COUNTY, IOWA Phil Carley Ranch Location & Roads: Located 6 miles north of Corning,. Fronted
Appendix A. Agricultural Resource Lands Designation: Selected Washington Counties Fully Planning Under the Growth Management Act
 Appendix A Agricultural Resource Lands Designation: Selected Washington Counties Fully Planning Under the Growth Management Act Chelan County Comprehensive Plan, Land Use Element Chelan County is in the
Guidance on Determining Feasibility and Sizing of Rainwater Harvesting Systems
 SANTA CLARA VALLEY URBAN RUNOFF POLLUTION PREVENTION PROGRAM Appendix I Guidance on Determining Feasibility and Sizing of Rainwater Harvesting Systems Table of Contents I.1 Introduction I.2 Rainwater Harvesting/Use
Rainwater Harvesting for Irrigation
 Rainwater Harvesting for Irrigation Dotty Woodson, Water Resources Specialist Texas A&M AgriLife Extension d-woodson@tamu.edu Abstract. Many are looking for an affordable alternative water source for landscape
Surface Irrigation Suitability Assessment of the Soils of Almanaqil Ridge, Gezira State, Sudan
 IJETST-Vol. 2 Issue 7 Pages 23-2814 July ISSN 2348-94 2015 International Journal of Emerging Trends in Science and Technology Surface Irrigation Suitability Assessment of the Soils of Almanaqil Ridge,
# 5 ) UN THREE CUPS YARD NORTH AMERICA CULTIVATION FACILITY SPECIAL USE PERMIT PUBLIC HEARING
 UN THREE CUPS YARD NORTH AMERICA CULTIVATION FACILITY SPECIAL USE PERMIT PUBLIC HEARING") # 5 ) UN-74-16 THREE CUPS YARD NORTH AMERICA CULTIVATION FACILITY SPECIAL USE PERMIT PUBLIC HEARING STAFF REPORT To: Planning Commission Meeting date: November 9, 2016 Item: UN-74-16 Prepared by: Marc
# 5 ) UN-74-16 THREE CUPS YARD NORTH AMERICA CULTIVATION FACILITY SPECIAL USE PERMIT PUBLIC HEARING STAFF REPORT To: Planning Commission Meeting date: November 9, 2016 Item: UN-74-16 Prepared by: Marc
Irrigation Scheduling for Urban and Small Farms
 Irrigation Scheduling for Urban and Small Farms Urban and Small Farm Workshop February 18, 2015 Presentation by L. Niel Allen Extension Irrigation Engineer n.allen@usu.edu http://extension.usu.edu/irrigation/
Economics of Irrigation Ending Date for Corn 1
 Economics of Irrigation Ending Date for Corn 1 Summary Mahbub Alam 2, Troy J. Dumler, Danny H. Rogers, and Kent Shaw Professor and Extension Specialist, Extension Agricultural Economist, SW Research- Extension
Blue Earth County Code
 Blue Earth County Code Sec. 114-116 Special Provisions (b) Agriculture use standards. (1)General cultivation farming, grazing, nurseries, horticulture, truck farming, sod farming and wild crop harvesting
3.1 Affected Environment
 Chapter 3 Earth This chapter of the Draft EIS examines geology and soil conditions to identify and characterize potential earth-related hazards associated with future development in the Sammamish Town
Irrigation can increase the production of
 B-6150 5/04 Irrigation of Forage Crops Juan Enciso, Dana Porter, Guy Fipps and Paul Colaizzi* Irrigation can increase the production of forages where rainfall is limited. In planning an irrigation system
NOTICE OF PREPARATION
 NOTICE OF PREPARATION Date: June 12, 2014 To: From: Subject: Governor s Office of Planning and Research/State Clearinghouse Unit, Responsible Agencies, Trustee Agencies, and Interested Parties Announcement
A proposed pattern of Land Capability Classification system
 Eco. Env. & Cons. 15 (2) : 2009; pp. (353-360) Copyright@ Enviromedia A proposed pattern of Land Capability Classification system *A.C. Pandey and **N.N. Sirothia College of Agricultural Engineering and
Champaign County LESA Update Committee MEETING 8 - AGENDA. Kevin Donoho Debra Griest (Committee Chair) Elizabeth R.
 Elizabeth R.") Champaign County LESA Update Committee Committee Members: MEETING 8 - AGENDA Kevin Donoho Debra Griest (Committee Chair) Elizabeth R. Jones Kyle Krapf Committee Facilitator: Susan Monte W. Steven Moser
Champaign County LESA Update Committee Committee Members: MEETING 8 - AGENDA Kevin Donoho Debra Griest (Committee Chair) Elizabeth R. Jones Kyle Krapf Committee Facilitator: Susan Monte W. Steven Moser
Very slight to negligible limitations no special land management practices required.
 Land Capability Classes Land and Soil Capability Class 1 Class 1 Definition Very slight to negligible limitations no special land management practices required. On-site impact of land management practices
WETLAND DELINEATION REPORT
 WETLAND DELINEATION REPORT WHITMORE LAKE LOT WASHTENAW COUNTY, MICHIGAN JULY 2015 PREPARED FOR: WASHTENAW COUNTY PARKS AND RECREATION 2230 SOUTH PLATT ROAD ANN ARBOR, MICHIGAN 48104 PREPARED BY: THE MANNIK
Stormwater Local Design Manual For Houston County, Georgia
 Stormwater Local Design Manual For Houston County, Georgia Adopted November 15, 2005 TABLE OF CONTENTS 1. FORWARD... 1 2. GENERAL LEVEL OF SERVICE STANDARDS... 2 2.1. DETENTION REQUIREMENTS... 2 2.1.1.
An Explanation of the Hydric Soil Technical Standard and Normal Precipitation
 An Explanation of the Hydric Soil Technical Standard and Normal Precipitation From: National Technical Committee for Hydric Soils. 2001. Hydric Soil Technical Standard (Technical Note 11). http://soils.usda.gov/soil_us
COON CREEK WATERSHED DISTRICT PERMIT REVIEW. Spring Lake Park Schools Westwood Middle School st Avenue NE, Spring Lake Park, MN 55432
 PAN 16-112, Westwood Middle School, Page 1 of 6 COON CREEK WATERSHED DISTRICT PERMIT REVIEW MEETING DATE: August 22, 2016 AGENDA NUMBER: 10 FILE NUMBER: 16-112 ITEM: Westwood Middle School RECOMMENDATION:
Nutrient Management in. A presentation to the West Metro Water Alliance
 Nutrient Management in Developing and Agricultural Areas A presentation to the West Metro Water Alliance Chris Meehan, P.E. May 25, 2011 Agenda Physical Improvements Planning Improvements How to get it
How do we meet current and future water needs? Niklas Christensen, PE Watershed Professionals Network
 How do we meet current and future water needs? Niklas Christensen, PE Watershed Professionals Network Objectives of Basin Study Analyze water supply and demand, include climate change Analyze how existing
REQUEST FOR QUALIFICATIONS FOR DAYTON VALLEY AREA DRAINAGE MASTER PLAN
 REQUEST FOR QUALIFICATIONS FOR DAYTON VALLEY AREA DRAINAGE MASTER PLAN Statement of Qualifications due Friday, November 3, 2017 at 12:00 PM (Pacific Time) To the Carson Water Subconservancy District Office
APPENDIX IV. APPROVED METHODS FOR QUANTIFYING HYDROLOGIC CONDITIONS OF CONCERN (NORTH ORANGE COUNTY)
") APPENDIX IV. APPROVED METHODS FOR QUANTIFYING HYDROLOGIC CONDITIONS OF CONCERN (NORTH ORANGE COUNTY) Hydromodification design criteria for the North Orange County permit area are based on the 2- yr, 24-hr
APPENDIX IV. APPROVED METHODS FOR QUANTIFYING HYDROLOGIC CONDITIONS OF CONCERN (NORTH ORANGE COUNTY) Hydromodification design criteria for the North Orange County permit area are based on the 2- yr, 24-hr
L A N D F O R S A L E. Hayes Center Farm. 3,270 acres located in Hayes County, Nebraska
 L A N D F O R S A L E Hayes Center Farm 3,270 acres located in Hayes County, Nebraska Pivot Irrigated Cropland, Dryland Cropland, & Rangeland Offered in 3 separate parcels Contact: Brian Reynolds; Listing
Section 1 & Pt. S 1/
 Section 1 & Pt. S 1/2-12-31-07-3 Legend Township Section Quarter Section Rural Municipality National Park Provincial Park Recreation Site Protected Area Authority Historic Site Regional Park City Unincorporated
MODEL Stormwater Local Design Manual. City of Centerville
 MODEL Stormwater Local Design Manual City of Centerville Adopted December 6, 2005 TABLE OF CONTENTS 1. FORWARD... 1 2. GENERAL LEVEL OF SERVICE STANDARDS... 1 2.1. DETENTION REQUIREMENTS... 1 2.1.1. Discharge
POND CONSTRUCTION. Woodland Steward Series
 POND CONSTRUCTION Woodland Steward Series BOB TWOMEY DISTRICT CONSERVATIONIST USDA NATURAL RESOURCES CONSERVATION SERVICE COURSE OUTLINE DEFINITION OF A POND OR LAKE TYPES OF PONDS GEOLOGIC CONSIDERATIONS
Economic Factors of Drainage Related to Corn Production
 Page 1 of 8 NCH-23 WATER MANAGEMENT (DRAINAGE) Purdue University Cooperative Extension Service West Lafayette, IN 47907 Economic Factors of Drainage Related to Corn Production B. H. Nolte and R. D. Duvick,
CHAPTER 7. San Dieguito River Flooding Adaptation
 CHAPTER 7 San Dieguito River Flooding Adaptation This chapter includes a range of adaptation measures to address vulnerabilities from flooding along the San Dieguito River, including the river valley,
Buying or Selling Hay
 Volume 17, Number 8 August 2011 Buying or Selling Hay Producers buying or selling hay always have the issue of pricing the stuff. Hay pricing should take into account all production costs. These include
Placement and Interpretation of Soil Moisture Sensors for Irrigated Cotton Production in Humid Regions SITE SELECTION IN A FIELD OBJECTIVE
 Brian Leib, University of Tennessee Jose Payero, Clemson University Lyle Pringle, Mississippi State University James Bordovsky, Texas A&M University Wesley Porter, University of Georgia Ed Barnes, Cotton
PLANNED UNIT DEVELOPMENT, PLANNING APPROVAL & SUBDIVISION STAFF REPORT Date: June 4, 2015
 PLANNED UNIT DEVELOPMENT, PLANNING APPROVAL & SUBDIVISION STAFF REPORT Date: June 4, 2015 NAME SUBDIVISION NAME CC Williams Plant Subdivision CC Williams Plant Subdivision LOCATION CITY COUNCIL DISTRICT
APPENDIX H Guidance for Preparing/Reviewing CEQA Initial Studies and Environmental Impact Reports
 APPENDIX H H.1 Guidance for Preparing and Reviewing CEQA Initial Studies Step 1: Consider the Project Characteristics as Provided by the Project Applicant Review the project application and draft plan
ATTACHMENT 4 Section Project Status Quarterly Report - Dec 31, 2015 Measure V - Clean Beaches and Ocean Parcel Tax
 ATTACHMENT 4 Section 3.0 - Project Status Quarterly Report - Dec 31, 2015 Completed Projects Description Bicknell Avenue Green Street Pier Storm Drain Improvement Pier Water Quality Improvement Permeable
VIRGINIA POLLUTION ABATEMENT PERMIT APPLICATION
 VIRGINIA POLLUTION ABATEMENT PERMIT APPLICATION FORM B ANIMAL WASTE Department of Environmental Quality VPA FORM B ANIMAL WASTE INSTRUCTIONS This form is to be completed by applicants requesting a VPA
Long-term Management Plan For The Mitigation Bank
 Note: The California multi-agency Project Delivery Team developed this general outline to assist in the development of the Long-term Management Plan for mitigation banks. Objectives and tasks are provided
Location: Grant County, W. side of Dodson Rd, between Rd 8 and 8.5 NW Soil: Ephrata/Malaga gravely sandy loam Cropping system
 High Residue Farming under Irrigation 2008 field trial report Andy McGuire, WSU Extension, Grant-Adams Area Agricultural Systems Educator, Center for Sustaining Agriculture and Natural Resources In cooperation
Storm Drain Inlet Protection for Construction Sites (1060)
") Storm Drain Inlet Protection for Construction Sites (1060) Wisconsin Department of Natural Resources Conservation Practice Standard I. Definition A temporary device installed in or around a storm drain
Storm Drain Inlet Protection for Construction Sites (1060) Wisconsin Department of Natural Resources Conservation Practice Standard I. Definition A temporary device installed in or around a storm drain
Project Alignment Appendix A
 Project Alignment Appendix A Fargo Moorhead Metropolitan Area Flood Risk Management Project EA Document This page is intentionally left blank Project Alignment Appendix A Table of Contents 1 BACKGROUND...
iswm TM Technical Manual Hydrology:
 : 1.0 2.0 Downstream Assessment 3.0 Streambank Protection 4.0 Water Balance 5.0 Rainfall Tables 6.0 Hydrologic Soils Data Table of Contents 1.0... HO-1 1.1 Estimating Runoff... HO-1 1.1.1 Introduction
FOR SALE. Thompson Vineyards, Raisin Processing Facility and Fruit Dehydrator
 FOR SALE Thompson Vineyards, Raisin Processing Facility and Fruit Dehydrator Vineyards 452± Acres Thompson Vineyard Prime Soils Irrigated, Wells and Fresno Irrigation District Number 1 Agricultural County
Bench terraces on loess soil China - 土坎梯田, 梯地
 Bench terraces on loess soil China - 土坎梯田, 梯地 A Terrace is a structural SLM practice with a raised flat platform built on the slope to reduce soil loss and runoff on the slope, increase the rainfall infiltration
Draft Programmatic Environmental Impact Report, Imperial County Renewable Energy and Transmission Element Update Imperial County, California
 4.8 HAZARDS AND HAZARDOUS MATERIALS 4.8.1 Regulatory Setting Resource Conservation and Recovery Act The Resource Conservation and Recovery Act (RCRA) gives the Environmental Protection Agency (EPA) the
Township of Washington Master Plan Highlands Element Exhibit A:
 Exhibit A: Regional Master Plan Overlay Zone Designation Zone Protection Lakes Greater Than 10 acres Conservation Existing Community Sub-Zone Existing Community Environmentally Constrained Conservation
DAKOTA COUNTY SOIL AND WATER CONSERVATION DISTRICT COMPREHENSIVE PLAN
 DAKOTA COUNTY SOIL AND WATER CONSERVATION DISTRICT COMPREHENSIVE PLAN 2011-2015 4100 220 th Street West, Suite 102 Farmington, MN 55024 651-480-7777 www.dakotacountyswcd.org I. INTRODUCTION A. Purpose
GRAY WATER SYSTEMS FOR RESIDENTIAL BUILDINGS
 INFORMATION BULLETIN / PUBLIC - PLUMBING CODE REFERENCE NO.: LAMC 94.1502.0 Effective: 01-01-2017 DOCUMENT NO.: P/PC 2017-012 Revised: Previously Issued As: P/PC 20014-012 GRAY WATER SYSTEMS FOR RESIDENTIAL
Hydrologic Soil Group Knowledge Matrix
 Hydrologic Soil Group Knowledge Matrix Refinement Of Soils Parameter For MPCA s Minimum Impact Design Standards Calculator and Stand-Alone Hydrologic Soil Group Determination Funding for this project was
EFFECT OF UPSTREAM DEVELOPMENT ON THE CLEAR CREEK AREA
 EFFECT OF UPSTREAM DEVELOPMENT ON THE CLEAR CREEK AREA Technical Memorandum Farming in the Floodplain Project Prepared for May 2017 PCC Farmland Trust Photo credit: Google Earth TABLE OF CONTENTS Page
Climate, Soils, and Seed Production. Thomas G Chastain CSS 460/560 Seed Production
 Climate, Soils, and Seed Production Thomas G Chastain CSS 460/560 Seed Production Climate and Seed Production Much of the land mass of the Eastern US is wetter than the Western US. There are individual