Linking Water Quality and Migratory Fish Passage to Economic Contributions of Fisheries and Water Use
|
|
|
- Brianna Ball
- 6 years ago
- Views:
Transcription


1 Insert Your Image Here Linking Water Quality and Migratory Fish Passage to Economic Contributions of Fisheries and Water Use
2 Project/Grant Objective 1. Delineate impacts to drinking water quality from the surrounding land uses through a SWAT model & identify priority areas for investments in nutrient reductions (RESPEC/Tetra Tech). 2. Research the health impacts to fisheries & describe via a meta analysis of existing scientific literature the impacts of pollutants/high levels of nutrients on fish health (UNCW). 3. Estimate the economic contribution of commercial and recreational fishing occurring on the Cape Fear River (NCDMF). 4. Create a website describing the project results and directing 4. Create a website describing the project results and directing information and resources at particular stakeholders (TNC).
")


3 Soil and Water Assessment Tool (SWAT) Spatial extent: Deep River & Haw River Lock and Dam #1 Data Used: HUC12 scale 30 m DEM NLCD 2006 SSURGO soils Weather forcing NLDAS 2 Point sources
4 Model Calibration and Validation Hydrology Dil Daily flow at USGS gages Water balance Evapotranspiration Water Quality Monthly regression loads at Cape Fear River Basin Monitoring i Coalition Locations Paired loads Calibration period WY 2006 to WY 2013 Validation period WY 2000 to WY 2005
5 Hydrology Calibration and Validation Water Budget Lautier, 2006 (NC DENR), Hydrologic Framework and Ground Water Conditions in the North Carolina Southern Coastal Plain (adapted from Hardin, Fine, and Spruill, USGS, 2003 and Wilder, 1978)

 Modeled Flow Duration (10/1/2006 to 9/30/2013 ) 8000 Ave erage")

 y Average Flow")
6 Hydrology Calibration and Validation Flow Simulated flow generally in good agreement with observed flow. Dil Daily NSE values generally greater than and on the tib tributaries t i and mainstem, respectively. Total volume error less than 10%. Observed Flow Duration (10/1/2006 to 9/30/2013 ) Modeled Flow Duration (10/1/2006 to 9/30/2013 ) 8000 Ave erage Modeled Flow (cfs) Avg Flow (10/1/2006 to 9/30/2013) Line of Equal Value Best-Fit Line y = x R² = Flow (cfs) Avg Monthly Rainfall (in) Avg Observed Flow (10/1/2006 to 9/30/2013) Avg Modeled Flow (Same Period) 8000 Oct Nov Dec Jan Feb Mar Apr May Jun Jul Aug Sep Monthly Rainfall (in) y Average Flow (cfs) Daily Average Observed Flow (cfs) Month % 10% 20% 30% 40% 50% 60% 70% 80% 90% 100% Percent of Time that Flow is Equaled or Exceeded

7 Water Quality Calibration and Validation Model performance fair to very good at all locations with the exception of Rockfish Creek.


8 Non Point Sediment and Nutrient Loading Sediment Yield Total Phosphorus Total Nitrogen


9 Non Point Sediment and Nutrient Loading By Source 7 broad categories Manured and un manured agricultural and pasture lands Agricultural lands Corn Soybean Winter Wheat Cotton
10 In Stream Sediment and Nutrient Loading


11 Nutrient Loading by Source Categories
12 Alternative Management Scenarios Reforestation The importance of Longleaf Pine Point Sources How big is their contribution? Fertilization & Setting Realistic Expectations no more N and P!! Combining options Controlled drainage and wetland BMPs (revised)
13 Reforestation Scenario Rf Reforest tthe upland areas where longleaf l pine soils exist itin the Turnbull Creek, Harrison Creek, and Rockfish Creek HRUs use the soils from the NCFS to determine locations for reforestation of longleaf pine. Conversion of loblolly pine (Pinus taeda) to longleaf pine (Pinus palustris). The model represents the differences between species, including leafarea area development, stomatalconductance conductance, temperature responses, radiation use efficiency, canopy height, root depth, and plant biomass nutrient content.


14 Reforestation Scenario
15 Reforestation Scenario
16 Results of Reforestation Scenario Reduction in nutrient load at local scale. TNand TPloadreduction by 1% and 3%, respectively, at Lock and Dam #1. Scenario Total Nitrogen (TN) Total Phosphorus (TP) Eiti Existing Conditions (Tons/Year) Longleaf (Tons/Year) Percent Reduction 4 43
17 Point Source Scenario Select the largest N and P dischargers into the basin, then: Remove these sources from the model completely and indicate the order of magnitude by which nutrient loads decrease. Reduce these large sources of nutrients by 30% to determine relative contributions of these sources.
18 Point Source Scenario Major point in study area source make up for 12% and 21% of TN and TP loads, respectively, at Lock and Dam #1. NPDES NC Name West Point Place Wastewater Treatment Plant (WWTP) Flow TN TP (MGD) (Tons/Year) (Tons/Year) NC DuPont Fayetteville Works NC Cedar Creek Site NC Fort Bragg WWTP NC Cross Creek WWTP NC Raeford WWTP NC Spring Lake WWTP NC Dunn WWTP NC Rockfish Creek WWTP NC Holly Springs WWTP NC Erwin WWTP NC Smithfield Packing Company Inc NC Northeast Brunswick Regional WWTP TOTAL
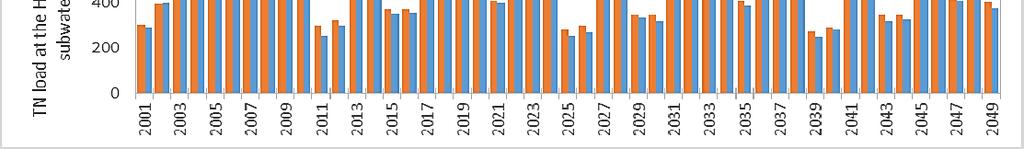
19 Fertilization Scenario To emphasize the over application of nutrients and to underscore how many nutrients are already in the system Remove all P inputs into the system to show how long until water and soil quality improves Reduce P inputs by 30% Reduce N inputs by 30% Ran the model for multiple decades using repeated weather data to look at long term trends. For N, fertilizer inputs reduced but did not modify the N concentrations in groundwater as those N stores are much more persistent. We also leave atmospheric deposition of N unchanged.

20 Results of 100% Reduction in External TP 42% and 15% reduction in non point and load delivered to Lock and Dam #1, respectively, over a 50 year period. 53% and 18% reduction in non point and load delivered to Lock and Dam #1, respectively, during the last t10 years. 13% reduction in soil phosphorus.

21 Results of 30% Reduction in External TP 13% and 5% reduction in non point and load delivered to Lock and Dam #1, respectively, over a 50 year period. 17% and 6% reduction in non point and loaddelivered to Lock 17% and 6% reduction in non point and load delivered to Lock and Dam #1, respectively, during the last 10 years.


22 Results of 30% Reduction in External TN A large fraction (about 18%) of TN load from groundwater sources. 4% and 1% reduction in non point and load delivered to Lock and Dam #1, respectively. 26% and 20% reduction in nitrate N non point source loads from manured and un manured lands, respectively.
23 Combining Options Combinethe reforestation scenarios (#1) and the N fertilization scenario (#3b). In other words, show the benefit to nutrient load reductions from both reforesting critical uplands while also decreasing N inputs onto the landscape. Combine the reforestation scenarios (#1) and the P fertilization scenario (#3a). In other words show the benefit to nutrient load reductions from both reforesting critical uplands while also decreasing P inputs onto the landscape.
24 Combining Options Scenario TN TP Existing Conditions (Tons/Year) Longleaf + 30 Percent TP Reduction(Tons/Year) Percent Reduction % and 16% reduction in non point TN and TP loads, respectively, for the entire watershed. Scenario TN TP Existing Conditions (Tons/Year) Longleaf + 30 Percent TN Reduction (Tons/Year) Percent Reduction % and 3% reduction in non point TN and TP loads, respectively.
25 Takeaways Approximately half of nutrients present at L&D #1 originate from Haw River and Deep River. There is no quick fix or real low hanging fruit to mitigate issue of high levels nutrients in the Cape Fear River. SWAT data can be used for many functions. TNC wants this information disseminated & used stakeholders.
26 Literature Review Evaluating water quality in the lower Cape Fear: Effects on the health and survival of migratory fishes. A.D. Goff and S.M. Brander Findings : Anthropogenic addition of nutrients, pesticides, wastewater, heavy metals, and other pollutants are changing aquatic habitats and as a result, impacting fishes in our rivers. Phosphates are not directly toxic to fish, although they do promote algal blooms, but nitrogen in its various forms does have toxic effects on fish (ammonia and nitrite are most toxic, nitrate and ammonium are least toxic). For migratory fish, the persistence of elevated nutrient levels in the main stem of the river may be causing disruptions to chemosensory cues that have historically provided navigation towards established spawning sites. Mi t fi h ldb tti th i t f th di d t f i l Migratory fish could be putting their progeny at a further disadvantage for survival by spawning in an area that is highly contaminated by elevated concentrations of nitrogenous substances.
27 Literature Review MC=microsystin EDCs= endocrine disrupting compound
28 Literature Review Recommendations: Significant gaps in available literature pertaining to toxicity of MCs and ammonia, nitrite and nitrate and their effects on fish health were identified. d Laboratory research and subsequent results combined with field sampling will establish a better understanding di of the impact. The importance of multiple stressor considerations when evaluating issues like eutrophication, persistence of algal blooms, input of persistent pollutants, and climate change, is critical. There is never just one culprit behind an environmental concern.
Utilization of the SWAT Model and Remote Sensing to Demonstrate the Effects of Shrub Encroachment on a Small Watershed
 Utilization of the SWAT Model and Remote Sensing to Demonstrate the Effects of Shrub Encroachment on a Small Watershed Jason Afinowicz Department of Biological and Agricultural Engineering Texas A&M University
Water Quality Study In the Streams of Flint Creek and Flint River Watersheds For TMDL Development
 Water Quality Study In the Streams of Flint Creek and Flint River Watersheds For TMDL Development Idris Abdi Doctoral Dissertation Presentation Major Advisor: Dr. Teferi Tsegaye April 18, 2005 Alabama
Science Supporting Policy: The Case For Flow Quantity
 MassDEP Water Management Program Science Supporting Policy: The Case For Flow Quantity Integrating Water Resources Management UMASS Conference April 8, 2008 Overview Human impact on streamflow and aquatic
Overview of the Surface Hydrology of Hawai i Watersheds. Ali Fares Associate Professor of Hydrology NREM-CTAHR
 Overview of the Surface Hydrology of Hawai i Watersheds Ali Fares Associate Professor of Hydrology NREM-CTAHR 5/23/2008 Watershed Hydrology Lab 1 What is Hydrology? Hydrology is the water science that
Climate Change & Urbanization Have Changed River Flows in Ontario
 Climate Change & Urbanization Have Changed River Flows in Ontario by Trevor Dickinson & Ramesh Rudra Water Resources Engineering University of Guelph Acknowledgements Agencies NSERC, OMAF & Environment
M.L. Kavvas, Z. Q. Chen, M. Anderson, L. Liang, N. Ohara Hydrologic Research Laboratory, Civil and Environmental Engineering, UC Davis
 Assessment of the Restoration Activities on Water Balance and Water Quality at Last Chance Creek Watershed Using Watershed Environmental Hydrology (WEHY) Model M.L. Kavvas, Z. Q. Chen, M. Anderson, L.
Protecting Utah s Water Resources. Nutrient Issues
 Protecting Utah s Water Resources Nutrient Issues Nutrient Issues Questions What are they? Why are they important? Nationally Locally What are the impact on my community Costs Timing What are Nutrients?
ASSIMILATIVE CAPACITY MODELING USING INTEGRATED WATERSHED AND LAKE MODELS IN SUPPORT OF THE GEORGIA COMPREHENSIVE STATEWIDE WATER MANAGEMENT PLAN
 B.J. Watson, et al., Int. J. of Design & Nature and Ecodynamics. Vol. 7, No. 2 (2012) 155 165 ASSIMILATIVE CAPACITY MODELING USING INTEGRATED WATERSHED AND LAKE MODELS IN SUPPORT OF THE GEORGIA COMPREHENSIVE
EUTROPHICATION. Student Lab Workbook
 EUTROPHICATION Student Lab Workbook THE SCIENTIFIC METHOD 1. Research Background literature research about a topic of interest 2. Identification of a problem Determine a problem (with regards to the topic)
The Impacts of Climate Change on Portland s Water Supply
 The Impacts of Climate Change on Portland s Water Supply Richard Palmer and Margaret Hahn University of Washington Department of Civil and Environmental Engineering Joe Dvorak, Dennis Kessler, Azad Mohammadi
North Dakota s Nutrient Reduction Strategy. Presented to the 2016 ND Water Quality Monitoring Conference March 4, 2016
 North Dakota s Nutrient Reduction Strategy Presented to the 2016 ND Water Quality Monitoring Conference March 4, 2016 Nutrients Nutrients, in appropriate amounts, are essential to the growth and health
Ta r-pa m l i c o Ri v e r
 Ta r-pa m l i c o Ri v e r Basinwide Wat e r Qu a l i t y Ma n a g e m e n t Pl a n 2010 Su m m a ry Introduc tion This 2010 document is the fourth five-year update of the Tar-Pamlico River Basinwide Water
USING ARCSWAT TO EVALUATE EFFECTS OF LAND USE CHANGE ON WATER QUALITY. Adam Gold Geog 591
 USING ARCSWAT TO EVALUATE EFFECTS OF LAND USE CHANGE ON WATER QUALITY Adam Gold Geog 591 Introduction The Soil and Water Assessment Tool (SWAT) is a hydrologic transport model with an objective to predict
Cedar River Watershed Habitat Conservation Plan
 Cedar River Watershed Habitat Conservation Plan Briefing for the WRIA 8 Salmon Recovery Council November 21, 2013 Cyndy Holtz Seattle Public Utilities cyndy.holtz@seattle.gov What is an HCP? Habitat Conservation
Missouri River Basin Water Management
 Missouri River Basin Water Management Spring 2011 Public Meetings April 12 th 11:00 a.m. Nebraska City, NE April 12 th 7:00 p.m. Fort Peck, MT April 13 th 1:00 p.m. Bismarck, ND April 13 th 7:00 p.m. Pierre,
Appendix 5. Fox River Study Group Interim Monitoring Evaluation
 Appendix 5. Fox River Study Group Interim Monitoring Evaluation Introduction Submitted to Fox River Study Group 6 March 3 The purpose of this report is to review data collected by the Fox River Study Group
Modeling Nutrient and Sediment Losses from Cropland D. J. Mulla Dept. Soil, Water, & Climate University of Minnesota
 Modeling Nutrient and Sediment Losses from Cropland D. J. Mulla Dept. Soil, Water, & Climate University of Minnesota Watershed Management Framework Identify the problems and their extent Monitor water
SAN BERNARD RIVER WATER QUALITY MODEL UPDATE. August 18, 2011
 SAN BERNARD RIVER WATER QUALITY MODEL UPDATE August 18, 2011 Agenda Model Set-up Watershed model Watershed delineations Generate model input files & establish coefficients Receiving Water model Establish
Joint Research Centre (JRC)
") Joint Research Centre (JRC) Marco Pastori and Faycal Bouraoui IES - Institute for Environment and Sustainability Ispra - Italy http://ies.jrc.ec.europa.eu/ http://www.jrc.ec.europa.eu/ CONTENT Introduction
Joint Research Centre (JRC) Marco Pastori and Faycal Bouraoui IES - Institute for Environment and Sustainability Ispra - Italy http://ies.jrc.ec.europa.eu/ http://www.jrc.ec.europa.eu/ CONTENT Introduction
Development of a tool to estimate Best Management Practices (BMP) efficiency using SWAT
 efficiency using SWAT") 5 th International SWAT Conference Development of a tool to estimate Best Management Practices (BMP) efficiency using SWAT Maringanti C., I. Chaubey, B. Engel Purdue University, West Lafayette, IN M. Arabi
5 th International SWAT Conference Development of a tool to estimate Best Management Practices (BMP) efficiency using SWAT Maringanti C., I. Chaubey, B. Engel Purdue University, West Lafayette, IN M. Arabi
Eco-hydrological assessment of German lowland catchments experiences and challenges- N. Fohrer, B. Schmalz, G. HörmannH
 Eco-hydrological assessment of German lowland catchments experiences and challenges- N., B. Schmalz, G. HörmannH Dep. Hydrology & Water Resources Management Ecology Centre, CAU Kiel 1 Landscape processes
Nitrate Load Reduction Strategies for the Raccoon and Des Moines Rivers. Keith Schilling, Calvin Wolter Iowa DNR Geological and Water Survey
 Nitrate Load Reduction Strategies for the Raccoon and Des Moines Rivers Keith Schilling, Calvin Wolter Iowa DNR Geological and Water Survey Outline of Presentation Background of nitrate impairments Nitrate
Flow-ecology relationships. Flow-ecology relationships Susitna case study
 Flow-ecology relationships Flow-ecology relationships Susitna case study Flow regime Ecologically-Relevant Flow Regime Characteristics Seasonal or typical conditions Annual extreme conditions High and
Hood River Water Conservation Strategy: achieving long-term water resource reliability for agriculture & local fish populations
 Hood River Water Conservation Strategy: achieving long-term water resource reliability for agriculture & local fish populations Cindy Thieman Hood River Watershed Group Ed Salminen & Niklas Christensen
Using Paired Edge of Field Data to Assess Impacts of Management on Surface and Subsurface P Loss
 Using Paired Edge of Field Data to Assess Impacts of Management on Surface and Subsurface P Loss Kevin W. King, Mark R. Williams, and Norm R. Fausey USDA ARS Soil Drainage Research Unit Columbus, OH Edge-of-field
MODELING SEDIMENT AND PHOSPHORUS YIELDS USING THE HSPF MODEL IN THE DEEP HOLLOW WATERSHED, MISSISSIPPI
 MODELING SEDIMENT AND PHOSPHORUS YIELDS USING THE HSPF MODEL IN THE DEEP HOLLOW WATERSHED, MISSISSIPPI Jairo Diaz-Ramirez, James Martin, William McAnally, and Richard A. Rebich Outline Background Objectives
SURFACE WATER WITHDRAWALS & LOW FLOW PROTECTION POLICY MICHAEL COLLEGE, P.E. SUSQUEHANNA RIVER BASIN COMMISSION
 SURFACE WATER WITHDRAWALS & LOW FLOW PROTECTION POLICY MICHAEL COLLEGE, P.E. SUSQUEHANNA RIVER BASIN COMMISSION SCENARIOS Direct withdrawal from surface water (SW): PA MOU w/padep NY MOU w/nysdec MD No
John H. Kerr Dam and Reservoir Virginia and North Carolina (Section 216)
") John H. Kerr Dam and Reservoir Virginia and North Carolina (Section 216) Wilmington District, Corps of Engineers Stakeholder Update Presentation January 24, 2014 Authorized under Section 216 of Public
John H. Kerr Dam and Reservoir Virginia and North Carolina (Section 216) Wilmington District, Corps of Engineers Stakeholder Update Presentation January 24, 2014 Authorized under Section 216 of Public
North Carolina Nutrient Criteria Development Plan
 North Carolina Nutrient Criteria Development Plan Version 2.0 March 3, 2014 Submitted to the United States Environmental Protection Agency - Region 4 by the North Carolina Department of Environment and
Lecture 9A: Drainage Basins
 GEOG415 Lecture 9A: Drainage Basins 9-1 Drainage basin (watershed, catchment) -Drains surfacewater to a common outlet Drainage divide - how is it defined? Scale effects? - Represents a hydrologic cycle
The Myakka River. Presented to the Myakka River Management Coordinating Council January 9, 2009
 The Myakka River Presented to the Myakka River Management Coordinating Council January 9, 2009 Kathryn L. Meaux Environmental Specialist III Sarasota County Integrated Water Resources Historical Monitoring
Catchment restoration challenges
 Catchment restoration challenges Yan Li 1, Marjo Tarvainen 2, Guangwei Zhu 1, Anne-Mari Ventelä 2, Hengpeng Li 1, Teija Kirkkala 2, Huiyun Li 1, Ari Jolma 3, Boqiang Qin 1, Jouko Sarvala 4, Yang Cui 1,
The Fourth Assessment of the Intergovernmental
 Hydrologic Characterization of the Koshi Basin and the Impact of Climate Change Luna Bharati, Pabitra Gurung and Priyantha Jayakody Luna Bharati Pabitra Gurung Priyantha Jayakody Abstract: Assessment of
General Instream Flow Methods Overview. Agency Meeting on 2012 Draft Study Descriptions January 24, 2011
 General Instream Flow Methods Overview Agency Meeting on 2012 Draft Study Descriptions January 24, 2011 1 Susitna River 2 Main Channel and Side Channels 3 Sloughs and Side Channels 4 Turbidity Portage
Chronic Stream Pollution in a CAFO Rich Watershed in Duplin County, NC
 Chronic Stream Pollution in a CAFO Rich Watershed in Duplin County, NC Michael A. Mallin, Matthew R. McIver, Amanda Kahn Dickens and Anna R. Robuck Center for Marine Sciences University of North Carolina
Buffalo River Watershed SWAT Modeling
 Buffalo River Watershed SWAT Modeling Final Report August 13, 2013 Table of Contents 1. Summary... 1 2. Model Development... 1 2.1. Weather Data... 2 2.2. Land Cover... 3 2.3. Soils... 4 2.4. Overland
Application of a Basin Scale Hydrological Model for Characterizing flow and Drought Trend
 Application of a Basin Scale Hydrological Model for Characterizing flow and Drought Trend 20 July 2012 International SWAT conference, Delhi INDIA TIPAPORN HOMDEE 1 Ph.D candidate Prof. KOBKIAT PONGPUT
Climate change and lakes: effects on ecological status and status assessment. Peeter Nõges Estonian University of Life Sciences
 Climate change and lakes: effects on ecological status and status assessment Peeter Nõges Estonian University of Life Sciences 600 500 400 300 200 100 0 NAO and water level NAO and water level 1999 1859
Pembina River Watershed Water Quality Report
 Pembina River Watershed Water Quality Report January 29 Prepared by: Manitoba Water Stewardship 16-123 Main St. Winnipeg, MB. Canada State of the Watershed Report 5OA and 5OB Pembina River Watershed -
L-THIA Online and LID in a watershed investigation
 L-THIA Online and LID in a watershed investigation Larry Theller Agricultural and Biological Engineering, Purdue University Great Lakes Sedimentation Workshop Ann Arbor Mi. L-THIA On-line watershed delineation
Decision Rationale. Total Maximum Daily Load for Phosphorus for the Sassafras River, Cecil and Kent Counties, Maryland 4/1/2002
 Decision Rationale I. Introduction Total Maximum Daily Load for Phosphorus for the Sassafras River, Cecil and Kent Counties, Maryland 4/1/2002 The Clean Water Act (CWA) requires a Total Maximum Daily Load
Ammonia costs spike sharply higher Nitrogen prices disrupt calm in fertilizer market By Bryce Knorr, grain market analyst
 Ammonia costs spike sharply higher Nitrogen prices disrupt calm in fertilizer market By Bryce Knorr, grain market analyst Ammonia joined other forms of nitrogen in the parade of higher costs, with contracts
It has been over two years since numeric nutrient
 FWRJ How to Comply With Numeric Nutrient Criteria and Facilitate Permit Renewal Russel Frydenborg and Beck Frydenborg It has been over two years since numeric nutrient criteria (NNC) were adopted, and
Nitrogen Cycling, Primary Production, and Water Quality in the New River Estuary. Defense Coastal/Estuarine Research Program (DCERP)
") Nitrogen Cycling, Primary Production, and Water Quality in the New River Estuary Defense Coastal/Estuarine Research Program (DCERP) Introduction: A key theme of the ongoing DCERP program is monitoring
Nitrogen Cycling, Primary Production, and Water Quality in the New River Estuary Defense Coastal/Estuarine Research Program (DCERP) Introduction: A key theme of the ongoing DCERP program is monitoring
Water Resources on PEI: an overview and brief discussion of challenges
 Water Resources on PEI: an overview and brief discussion of challenges Components: Components and links Atmospheric water Surface water (including glacial water) Groundwater Links: Precipitation (atm(
INTRODUCTION TO HOBBY FARMING AND WATER QUALITY
 SECTION ONE INTRODUCTION TO HOBBY FARMING AND WATER QUALITY This is a handbook for owners of Hobby Farms - small scale farms operated primarily as a residential lifestyle - to provide their owners with
Nutrient Loading: NAWQA Regional SPARROW model
 Nutrient Loading: NAWQA Regional SPARROW model Pee Dee River Basin and Winyah Bay Estuary Waccamaw Water Quality Data Conference Wednesday, September 19, 2013 Celeste Journey, Water-Quality Specialist
 Good Morning! Bruce Gilman Department of Environmental Conservation and Horticulture Finger Lakes Community College 3325 Marvin Sands Drive Canandaigua, New York 14424 585-785- 1255 gilmanba@flcc.edu Northern
Nutrient Sources, Fate, Transport, and Effects Study of Galveston Bay, Texas Rachel Windham,
 Nutrient Sources, Fate, Transport, and Effects Study of Galveston Bay, Texas Rachel Windham, Department of Marine Biology Texas A&M University at Galveston 2 Acknowledgements: Dr. Antonietta Quigg Members
B1. Monitoring Stream Nitrogen Concentrations
 B1. Monitoring Stream Nitrogen Concentrations Author: David Wall, MPCA Assistance with project design, data analysis and mapping provided by: David Lorenz, Abigail Tomasek, and Chris Sanocki (U.S. Geologic
Missouri River Basin Water Management
 Missouri River Basin Water Management Spring 2015 Public Meetings April 7 th April 7 th April 8 th April 9 th April 9 th 11:00 a.m. 6:00 p.m. 11:00 a.m. 11:00 a.m. 6:00 p.m. Pierre, SD Bismarck, ND Fort
Uncertainty in hydrologic impacts of climate change: A California case study
 Uncertainty in hydrologic impacts of climate change: A California case study Ed Maurer Civil Engineering Dept. Santa Clara University Photos from USGS Motivating Questions What are potential impacts of
Mathematical models in predicting the fate of Lake Pyhäjärvi waters
 Mathematical models in predicting the fate of Lake Pyhäjärvi waters Pori 22.10.2014 Timo Huttula, Inese Huttunen, Olli Malve, Anita Pätynen and Janne Ropponen SYKE Recent projects and modelling (besides
Relationships between Residence Time and Cyanobacterial Blooms in a Nutrient-Rich River System
 Relationships between Residence Time and Cyanobacterial Blooms in a Nutrient-Rich River System Michael F. Coveney, John C. Hendrickson, Erich R. Marzolf, Rolland S. Fulton, Jian J. Di, Clifford P. Neubauer,
Initial Application of a Landscape Evolution Model to a Louisiana Wetland
 Initial Application of a Landscape Evolution Model to a Louisiana Wetland by Carl F. Cerco PURPOSE: Corps planning projects encompass a wide variety of restoration goals. These include wetland restoration,
Surface Soil Moisture Assimilation with SWAT
 Surface Soil Moisture Assimilation with SWAT Eunjin Han, Venatesh Merwade School of Civil Engineering, Purdue University, West Lafayette, IN, USA Gary C. Heathman USDA-ARS, National Soil Erosion Research
Stormwater and LEED. Vancouver LEED User s Group May 27, Craig Kipkie, M.Sc., P.Eng, LEED AP
 Stormwater and LEED Vancouver LEED User s Group May 27, 2005 Craig Kipkie, M.Sc., P.Eng, LEED AP Outline Sustainable Sites 2 Stormwater credits SSc6.1 SSc6.2 Synergies with other Credits Case Study How
Arkansas Water Resources Center
 Arkansas Water Resources Center WATER SAMPLING, ANALYSIS AND ANNUAL LOAD DETERMINATIONS FOR TSS, NITROGEN AND PHOSPHORUS AT THE L ANGUILLE RIVER NEAR PALESTINE Submitted to the Arkansas Soil and Water
Integrated Watershed Management Plan
 mighty peace watershed alliance Integrated Plan SUMMARY What is the Plan? The Mighty Peace Alliance (MPWA) supports the three goals of Alberta s Water for Life Strategy: safe secure drinking water, healthy
Does Water Resources Management in the Snake River Basin Matter for the Lower Columbia River? Or Is the Snake River Part of Another Watershed?
 Does Water Resources Management in the Snake River Basin Matter for the Lower Columbia River? Or Is the Snake River Part of Another Watershed? John C. Tracy, Director Idaho Water Resources Research Institute
Hydrologic Modeling with the Distributed-Hydrology- Soils- Vegetation Model (DHSVM)
") Hydrologic Modeling with the Distributed-Hydrology- Soils- Vegetation Model (DHSVM) DHSVM was developed by researchers at the University of Washington and the Pacific Northwest National Lab 200 Simulated
Hydrologic Modeling with the Distributed-Hydrology- Soils- Vegetation Model (DHSVM) DHSVM was developed by researchers at the University of Washington and the Pacific Northwest National Lab 200 Simulated
Introducing the WBG Guidelines for selecting EFlow assessment methods. Cate Brown
 Introducing the WBG Guidelines for selecting EFlow assessment methods Cate Brown This presentation Factors affected potential impacts Level of detail in EFlows assessments: Magnitude and complexity of
Aquaculture Effluents and the Environment. CS Tucker, Mississippi State University
 Aquaculture Effluents and the Environment CS Tucker, Mississippi State University Characteristics of catfish pond effluents Impacts of catfish pond effluents Ways to reduce impacts of effluents What is
North Carolina Nutrient Criteria Development Plan
 North Carolina Nutrient Criteria Development Plan June 20, 2014 Submitted to the United States Environmental Protection Agency - Region 4 by the North Carolina Department of Environment and Natural Resources
Hood River Basin Study
 Hood River Basin Study Climate Change Impacts to Streamflow & Opportunities for a Sustainable Future Cindy Thieman Hood River Watershed Group Niklas Christensen Watershed Professionals Network Overview
Using Weather Forecasting For Decision Tools For Animal Agriculture
 Using Weather Forecasting For Decision Tools For Animal Agriculture Steve Buan National Weather Service Minnkota Agri-Builders and Equipment Suppliers Association 11 March 2016 Cattle Heat Stress Forecast
A GIS Tool Prioritizing Dams for Removal within the State of North Carolina Kat Hoenke Southeast Aquatic Resources Partnership (SARP)
") A GIS Tool Prioritizing Dams for Removal within the State of North Carolina Kat Hoenke Southeast Aquatic Resources Partnership (SARP) Cape Fear River Partnership Meeting May 15-16, 2014 Project Background
A GIS Tool Prioritizing Dams for Removal within the State of North Carolina Kat Hoenke Southeast Aquatic Resources Partnership (SARP) Cape Fear River Partnership Meeting May 15-16, 2014 Project Background
Case Study. BiOWiSH Aqua has Positive Long-Term Effects. Biological Help for the Human Race
 Case Study BiOWiSH Aqua has Positive Long-Term Effects After Two Years, Sustains Improved Effluent Quality in South Korean Slaughterhouse Executive Summary BiOWiSH Aqua was implemented in a South Korean
Aspinall Unit Overview
 Aspinall Unit Overview Dan Crabtree Erik Knight Sandi Caskey Jennifer Hamilton US Bureau of Reclamation Western Colorado Area Office Grand Junction, Colorado Reclamation Service of 1902 In Early 1900 s
Runoff Risk: A Decision Support Tool for Nutrient Applications
 Runoff Risk: A Decision Support Tool for Nutrient Applications Current & Planned Ecosystem IDSS Utilizing NWS Modeling to Help Improve the Nation s Water Quality Dustin Goering National Weather Service
Chesapeake Bay. report card
 Chesapeake Bay report card 2010 C- C Healthy water quality provides better habitat conditions for crabs, fish, and other aquatic species. issolved oxygen is essential to the survival of all these organisms;
Urbanization effects on the hydrology of the Atlanta area, Georgia (USA)
") 14/06/01 Impact of Human Activity on Groundwater Dynamics (Proceedings of a symposium held during the Sixth IAHS Scientific Assembly at Maastricht, The Netherlands, July 2001). IAHS Publ. no. 269, 2001.
14/06/01 Impact of Human Activity on Groundwater Dynamics (Proceedings of a symposium held during the Sixth IAHS Scientific Assembly at Maastricht, The Netherlands, July 2001). IAHS Publ. no. 269, 2001.
3.3 Paw Paw River, Michigan
 Conservancy will be applying the results of this assessment (and conducting some additional assessment using the stream power tool) to select target reaches for restoration using 1) channel restoration
Appendix 12. Pollutant Load Estimates and Reductions
 Appendix 12. Pollutant Load Estimates and Reductions A pollutant loading is a quantifiable amount of pollution that is being delivered to a water body. Pollutant load reductions can be calculated based
Multi-Objective Optimization Tool for the Selection and Placement of BMPs for Pesticide (Atrazine) Control
 Control") Multi-Objective Optimization Tool for the Selection and Placement of BMPs for Pesticide (Atrazine) Control Chetan, M., Chaubey, I. Purdue University, IN Arabi, M. Colorado State University, CO ASABE AIM
Multi-Objective Optimization Tool for the Selection and Placement of BMPs for Pesticide (Atrazine) Control Chetan, M., Chaubey, I. Purdue University, IN Arabi, M. Colorado State University, CO ASABE AIM
MARYLAND DEPARTMENT OF THE ENVIRONMENT 1800 Washington Boulevard Baltimore MD
 MARYLAND DEPARTMENT OF THE ENVIRONMENT 1800 Washington Boulevard Baltimore MD 21230 410-537-3000 1-800-633-6101 Martin O Malley Governor Anthony G. Brown Lieutenant Governor November 6, 2009 Shari T. Wilson
global science solutions
 global science solutions Tim Martin: Riverside Technology, inc. Fort Collins, Colorado, USA 2.4: Water Security Information and Tools to Support Global Water Security International Symposium on Synergistic
Coupling Transport and Transformation Model with Land Surface Scheme SABAE- HW: Application to the Canadian Prairies
 HW-1 Coupling Transport and Transformation Model with Land Surface Scheme SABAE- HW: Application to the Canadian Prairies Allan D. Woodbury, Alireza Hejazi Department of Civil Engineering University of
Electric Forward Market Report
 Mar-01 Mar-02 Jun-02 Sep-02 Dec-02 Mar-03 Jun-03 Sep-03 Dec-03 Mar-04 Jun-04 Sep-04 Dec-04 Mar-05 May-05 Aug-05 Nov-05 Feb-06 Jun-06 Sep-06 Dec-06 Mar-07 Jun-07 Sep-07 Dec-07 Apr-08 Jun-08 Sep-08 Dec-08
Water quality monitoring and assessment: general principles and fitness for purpose
 Water quality monitoring and assessment: general principles and fitness for purpose Deborah V Chapman GEMS/Water Capacity development Centre University College Cork Considerations Purpose of monitoring
Mekong Climate Change and Adaptation Initiative of the Mekong River Commission
 Mekong Climate Change and Adaptation Initiative of the Mekong River Commission H. E. Mr. Kol Vathana Mekong River Commission; Deputy Secretary General Cambodia National Mekong Committee Mekong is one of
History of Model Development at Temple, Texas. J. R. Williams and J. G. Arnold
 History of Model Development at Temple, Texas J. R. Williams and J. G. Arnold INTRODUCTION Then Model development at Temple A long history (1937-present) Many scientists participating in: Data collection
Development of a Stormwater Management Plan for Phase II Small MS4s Insight and Innovation
 Development of a Stormwater Management Plan for Phase II Small MS4s Insight and Innovation Ohio Water Environment Association 2016 Technical Conference & Expo June 29, 2016 Objective To create a Stormwater
Nitrate and Phosphorous Levels in Selected Surface Water Sites in Southern Ontario
 Nitrate and Phosphorous Levels in Selected Surface Water Sites in Southern Ontario 4-4 By: Ron Fleming P.Eng and Heather Fraser Ridgetown College-University of Guelph August,. Objectives Using existing
San Antonio Water System Mitchell Lake Constructed Wetlands Below the Dam Preliminary Hydrologic Analysis
 San Antonio Water System enhancement. This recommendation was based on limited water quality data provided by SAWS and using a free-water surface constructed wetland with approximately 112 acres of wetted
Session 2 Biodiversity Conservation
 Session 2 Biodiversity Conservation Nutrient Concentration and Water Turbidity on Coral Reef Area and their Effects on the Living Coral Koichi KINJO Okinawa Prefectural Institute of Health and Environment
Point) Coastal (Shell Point to Causeway) Total 4,
 Coastal (Shell Point to Causeway) Total 4,") Table 8.1. Nutrient loading figures for each sub-watershed within the Caloosahatchee Watershed. Please refer to Figure 8.1 for the locations of these sub-watersheds. Figures are provided for total nitrogen
Table 8.1. Nutrient loading figures for each sub-watershed within the Caloosahatchee Watershed. Please refer to Figure 8.1 for the locations of these sub-watersheds. Figures are provided for total nitrogen
Medicine Lake Excess Nutrients TMDL project: Water Quality Standards
 Medicine Lake Excess Nutrients TMDL project: Water Quality Standards Steering Committee Meeting #1 November 18 th, 2008 Water Quality Standards Water quality standards the fundamental benchmarks by which
Protecting Your Water and Air Resources
 Protecting Your Water and Air Resources Montana Agri-Business Association Convention (Feb 1, 2013) by Clain Jones, Extension Soil Fertility Specialist and Adam Sigler, Extension Associate Water Quality
Regional Watershed Planning. Calumet Summit 2010: A Call to Connect Calumet Conference Center April 27, 2010
 Regional Watershed Planning Calumet Summit 2010: A Call to Connect Calumet Conference Center April 27, 2010 Basins The Calumet Region Watershed Communities Land Cover- 2006 Impervious Cover 303d Listed
Coupling SWAT with land cover and hydropower models for sustainable development in the Mekong Basin
 Coupling SWAT with land cover and hydropower models for sustainable development in the Mekong Basin Mauricio E. Arias 1 Tom A. Cochrane 1, Thanapon Piman 1,2, Ornanorg Vonnarart 2, Thomas B. Wild 3, Daniel
Streaming to Cleaner Water
 Streaming to Cleaner Water A look at the past, present and future Doug Wetzstein Watershed Division February 23, 2013 Clean Water Act Federal Clean Water Act 72 Goal fishable/swimmable by 1983 Framework
EVALUATION OF HYDROLOGIC AND WATER RESOURCES RESPONSE TO METEOROLOGICAL DROUGHT IN THESSALY, GREECE
 EVALUATION OF HYDROLOGIC AND WATER RESOURCES RESPONSE TO METEOROLOGICAL DROUGHT IN THESSALY, GREECE A. LOUKAS*, AND L. VASILIADES Laboratory of Hydrology and Water Systems Analysis,, Volos, Greece *E-mail:
Ecosystems: Nutrient Cycles
 Ecosystems: Nutrient Cycles Greeks, Native Peoples, Buddhism, Hinduism use(d) Earth, Air, Fire, and Water as the main elements of their faith/culture Cycling in Ecosystems the Hydrologic Cycle What are
Manitoba Water Quality Standards, Objectives, and Guidelines Dwight Williamson, Manager Water Quality Management Section Manitoba Conservation
 Manitoba Water Quality Standards, Objectives, and Guidelines 2002 Dwight Williamson, Manager Water Quality Management Section Manitoba Conservation 1 Outline Brief history Review process Overview of proposed
Pete Fandel Illinois Central College llinois Council on Best Management Practices
 Pete Fandel Illinois Central College llinois Council on Best Management Practices July 2013 Hypoxic Zone Mississippi River Watershed Nitrogen N Sales in 2012 was 2,293,812,952 pounds Target Reduction
Chapter 4 Watershed Goals and Objectives
 Chapter 4 Watershed Goals and Objectives Eight (8) long-term watershed goals have been developed by the NEW Watershed Advisory Group (WAG) after consideration of discussions held during monthly watershed
WATER QUALITY ASSESSMENT REPORT 2013 SAGINAW CHIPPEWA INDIAN TRIBE. Clean Water Act Section 106 October 1, 2012 September 31, 2013 Grant #: I 00E57603
 WATER QUALITY ASSESSMENT REPORT 2013 SAGINAW CHIPPEWA INDIAN TRIBE Clean Water Act Section 106 October 1, 2012 September 31, 2013 Grant #: I 00E57603 Technical Contacts: Carey Pauquette Water Quality Specialist