Supplementary figures
|
|
|
- Dennis Hardy
- 5 years ago
- Views:
Transcription
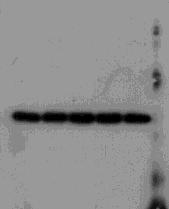
1 Relative intensity Relative intensity Relative intensity Supplementary figures a None Caffeine None Caffeine c None Caffeine ISG UBE1L UBCH EFP 1 1 DOX (h) 1 1 CPT (h) 1 1 UV (h) Supplementary Figure 1. Quantification of DNA damage-induced changes in the levels of ISG-conjugating system. Experiments were performed as in Fig. 1 and the and intensities were determined y using a densitometer and normalized y those of -actin. The normalized densities seen at time points were expressed as 1. and the others were as its relative values. Error ar, ± s.d. (n=3).


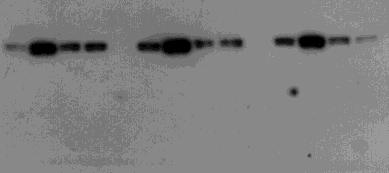
2 a UOS MCF7 A59 UOS MCF7 A59 DOX: None Caffeine None Caffeine None Caffeine CPT: None Caffeine None Caffeine None Caffeine 1 1 ISG- conjugates ISG- conjugates ISG p-chk1 ISG p-chk1 p-p53 p-p53 p53 p53 13 UBE1L 13 UBE1L UBCH8 UBCH8 EFP EFP -Actin -Actin c UOS MCF7 A59 None Caffeine None Caffeine None Caffeine UV: 1 ISG- conjugates ISG p-chk1 p-p53 13 p53 UBE1L UBCH8 EFP -Actin Supplementary Figure. Effect of caffeine on the expression of ISG- conjugating system in various cancer cells. Doxoruicin (a), camptothecin (), and UV (c) were treated to UOS, MCF7, and A59 cells with and with caffeine, followed y immunolot analysis as in Fig. 1.
 1 1 1")


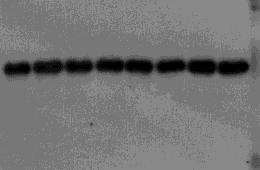
3 HeLa HeLa HeLa HCT116 (p53 / ) None Caffeine None Caffeine None Caffeine None Caffeine DOX: CPT: UV: (h) ISG- conjugates ISG UBE1L UBCH8 EFP p-chk1 p53 -Actin Supplementary Figure 3. Effect of caffeine on the expression of ISG- conjugating system in HeLa cells. Experiments were performed as in Supplementary Fig. 1, ut using HeLa cells.


 cells (a) and A59 (p53 / ) and H199 (p53 -/- )")
 cells (c) and A59 (p53 / ) cells (d) that had een transfected with or shp53 were")
4 a HCT116 p53 / p53 -/- A59 H199 p53 / p53 -/ (h): UV UBE1L (h): UV UBE1L UBCH8 UBCH8 EFP EFP 1 1 ISG- conjugates ISG- conjugates ISG ISG p53 p53 p1 p1 GAPDH GAPDH c p53 / HCT116 d A59 shp53 shp (h): UV UBE1L (h): UV UBE1L UBCH8 EFP UBCH8 EFP 1 ISG- conjugates 1 ISG- conjugates ISG ISG p53 p53 p1 p1 GAPDH GAPDH Supplementary Figure. p53 induces the expression of ISG-conjugating system. After exposure to UV, HCT116 (p53 / and p53 -/- ) cells (a) and A59 (p53 / ) and H199 (p53 -/- ) cells () were incuated for various periods. They were then sujected to immunolot analysis. HCT116 (p53 / ) cells (c) and A59 (p53 / ) cells (d) that had een transfected with or shp53 were exposed to UV. After incuation, they were sujected to immunolot analysis.
5 a c d ISG RE1 RE RE3 RE3* ISRE ISRE* UBE1L RE1 RE RE3 RE1/* ISRE ISRE* UBCH8 RE1 RE RE3 RE RE1* ISRE ISRE* EFP RE1 RE RE3 RE1/* GGACATGTGCTCCGTTCCTGCTACTTGTTT TTCCAAGTTTACTAATTTTGCAAGTTG GGGCATGCCT GGGACGTCCT GAAAGGGAAACCGAAACTGAAG GAAAGGTCCACCTCCACTGAAG GGGCAAGGTGGGAGGATCACTTGAGGCCAGGCAT GGCCAGGCATTCGAGACCAGCCTGGGCAAGATA GAGCAAGCCT GGGACCTGTGGGAGGATCACTTGAGGCACTTCATTCGAGACCAGCCTGGGACCTATA CTTTCACTTTTCTTTTC CTGGAACTTGGATTGGA GAACTAGAACCCAGGTCTCCCTGGGGCTTGTTC CATCATGTTTCACAATACACTTGGAT CAACAAGTCTCATCTTCCCCAGATGCTGCTTGGTG CTGCAAGTACTCTGTCCTTGCAC GAAAGCTAACCCAGGTCTCCCTGGGGAGGTTTC AAAAGAGAAA AACCTATCCA AAACAAGATGTGGGACAGGCCC GGACAGGCCCATGGTGGCTCATGCCT GGACTTGCTCCGAGCGCAAGTTT AAAACCTATGTGGGAACTTCCCATGGTGGCTACGTCCT ISRE ISRE* TTTCGTTT TGGAGTGG Supplementary Figure 5. Sequences of ISREs and putative p53res in the promoter regions of the genes for ISG-conjugating system. Sequences of ISREs and putative p53res in the promoter regions of the ISG (a), UBE1L (), UBCH8 (c), and EFP genes (d) were shown. The asterisks indicate the mutant forms of p53res and ISREs. The mutated nucleotides were indicated with the red letters.
6 a Input a-p53 a-igg p53 RE3 (ISG) p53re (p1) Input a-p53 a-igg p53 RE1/ (UBE1L) p53re (p1) c Input a-p53 a-igg p53 RE1 (UBCH8) p53re (p1) d Input a-p53 a-igg p53 RE1/ (EFP) p53re (p1) Supplementary Figure 6. Binding of p53 to p53res in the promoter regions of the ISG, UBE1L, UBCH8, and EFP genes. HA-p53 was expressed in p53 -/- HCT116 cells. Cell lysates were sujected to ChIP assay using anti-p53 antiody or anti-mouse IgG. Bound DNAs were sujected to PCR using the following proes for: (a) ISG, 5 -TGCGCGATATTTAGGTGTTTCCAGGGTGTTGGGT-3 (forward) and 5 -CTGGTGGCCAAATTTGGCTTCAGTTTCGGTTTCC-3 (reverse); () UBE1L, 5 -CATGGTGGCTCACACCTGTAATCCCAGCAC-3 (forward) and 5 - ATGTTGCCTAGGCTGGTCTCGAATCTCTGG-3 (reverse); (c) UBCH8, 5 - AATGGTCCTGGCAAGCAGATAGGAGTTTCC-3 (forward) and 5 - CCACTGGTGTGCCTTTCATGTCCTTTCACA-3 (reverse); (d) EFP, 5 - TGGGCTGTGTGCCAATGTCCATTCTTAGAC-3 (forward) and 5 - ATACAAGCACGTGCCACCACACCCAGCTAA-3 (reverse); (A-D) p1, 5 - CAGGCTGTGGCTCTGATTGG-3 (forward) and 5 - TTCAGAGTAACAGGCTAAGG-3 (reverse).
 or pcdna-ha-p53 () were exposed to UV and then incuated for increasing periods.")
7 UV IFNa (h) HA-p53 ISG- conjugates ISG p53 p1 p-stat1 (Tyr1) UBE1L UBCH8 EFP -Actin Supplementary Figure 7. UV and IFNa independently induce ISGylation of cellular proteins. p53 -/- HCT116 cells that had een transfected with an empty vector () or pcdna-ha-p53 () were exposed to UV and then incuated for increasing periods. The cells were also treated with IFNa for increasing periods. Cell lysates were sujected to immunolot analysis.

8 Relative mrna level a 1 HisMax-p (h): UV ISG- conjugates 13 ISG p53 UBE1L UBCH8 EFP GAPDH ISG UBE1L UBCH8 EFP HisMax-p53 UV (h) Supplementary Figure 8. p53 is required for UV-mediated increase in the expression of ISG-conjugating system. (a) H199 cells transfected with an empty vector () or pcdna-hismax-p53 () were exposed to UV followed y incuation for increasing periods. They were then sujected to immunolot analysis. () The cells prepared as in a were sujected to qrt-pcr. The level of mrna for each component of ISG-conjugating system seen without ectopic expression of p53 at time point was expressed as 1. and the others were as its relative values. Error ar, ± s.d. (n=3).
9 Relative intensity Relative intensity a UV UV CHX (h) p53 GAPDH KR GAPDH UV UV Wt KR CHX (h) Supplementary Figure 9. Effect of ISGylation-deficient KR mutation on p53 staility. (a) p53 and KR were expressed in p53 -/- HCT116 cells. After exposure to UV, cells were sujected to incuation with. mg/ml cycloheximide (CHX) for increasing periods followed y immunolot analysis. () Experiments in a were repeated and the and intensities were scanned y using a densitometer and normalized y those of GAPDH. The normalized densities seen at time points were expressed as 1. and the others were as its relative values. Error ar, ± s.d. (n=3).

 Deletions of p53 (p 1- p ) were expressed in HEK93T cells with and without HA-EFP.")

 Deletions of EFP (E 1-E ) were expressed in HEK93T cells with and without HisMax-p53.")
10 Lysate Lysate IP : a-xpress IP: a-ha a p53 p 1 p p 3 p EFP-inding region Binding EFP E 1 E E 3 E p53-inding region Binding HisMax-p53 HisMax-p 1 HisMax-p HisMax-p 3 HisMax-p HA-EFP EFP p53 p 1 * p p 3 ** p 3 6 HA-EFP HA-E 1 HA-E HA-E 3 HA-E HisMax-p53 p53 EFP E 1 E 3 * E E 3 6 EFP p53 p p 3 p 3 6 p53 EFP E 1 E 3 ** E E Supplementary Figure 1. Identification of the regions for interaction etween p53 and EFP. (a) Deletions of p53 (p 1- p ) were expressed in HEK93T cells with and without HA-EFP. Cell lysates were sujected to immunoprecipitation with anti-xpress antiody followed y immunolot with anti- HA or anti-xpress antiody. They were also directly proed with anti-ha and anti- Xpress antiodies. The asterisk indicates the IgG heavy chain and the doule asterisk shows the IgG light chain. () Deletions of EFP (E 1-E ) were expressed in HEK93T cells with and without HisMax-p53. Cell lysates were sujected to immunoprecipitation with anti-ha antiody followed y immunolot with anti-xpress or anti-ha antiody. They were also directly proed with anti- Xpress and anti-ha antiodies. The asterisk indicates the IgG heavy chain and the doule asterisk shows a nonspecific and.
11 Relative activity of Luc PG13-Luc p1-luc BAX-Luc DOX(h) Mock Wt KR Mock Wt KR Mock Wt KR Supplementary Figure 11. ISGylation promotes p53 transactivity. Experiments were performed as in Fig. 6a, ut in the presence of doxoruicin in place of UV exposure. The luciferase activity seen without any treatment (i.e., time in Mock) was expressed as 1. andthe others were as its relative values.
12 a HisMax-p53 HisMax-KR UV (h) p53 1 MDM 5 5 BAX p1 5 5 shisg shefp Flag-ISG Myc-EFP UV p53 Flag-ISG Flag-ISG GAPDH ISG Myc-EFP EFP MDM BAX p1 GAPDH Supplementary Figure 1. Immunolot analysis of cells used for determining p53 transactivity. Cells prepared as in Fig. 6a (a) and 6 () were sujected to immunolot analysis.
 HCT116 (p53 / ) cells transfected with, shisg, or shefp were exposed UV. They were then sujected to immunolot analysis.")
13 Relative intensity a shisg shefp UV p53 p-chk p53 p-chk1 ISG 1 EFP GAPDH shisg shefp UV Supplementary Figure 13. Effect of knockdown of ISG or EFP on UVinduced Chk1 phosphorylation. (a) HCT116 (p53 / ) cells transfected with, shisg, or shefp were exposed UV. They were then sujected to immunolot analysis. () Experiments were performed as in a and the and intensities were determined y using a densitometer and normalized y those of GAPDH. The normalized densities for p53 and p-chk1 seen in the presence of and UV were expressed as 1. and the others were as its relative values. Error ar, ± s.d. (n=3).
14 % Input % Input % Input a p1 MDM BAX ISG HisMax-p53 Es/Flag-ISG Flag-UBP a-igg a-p53 a-igg a-p53 a-igg a-p53 a-igg a-p53 p1 MDM BAX ISG HisMax-p53 HisMax-KR Es/Flag-ISG a-igg a-p53 a-igg a-p53 a-igg a-p53 a-igg a-p53 c p1 MDM BAX ISG UV Flag-ISG shisg shisg shisg shisg a-igg a-p53 a-igg a-p53 a-igg a-p53 a-igg a-p53 Supplementary Figure 1. Recruitment of p53 to p53res of the p1, MDM, BAX, and ISG genes. (a-c) Experiments were performed as in Fig. 6c-e, respectively, ut the ound DNAs were sujected to qpcr using the proes for p53res of CDKN1, MDM, BAX, and ISG. Error ar, ± s.d. (n=).
15 Relative intensity Lysate a HisMax-p53 HisMax-KR UV Ac-p53 p-p53 p53 GAPDH Ac-p53 p-p53 HisMax-p53 HisMax-KR UV c IP: a-p UV (h) p53-isg p53 p-p53 Ac-p53 GAPDH Supplementary Figure. ISGylation of p53 promotes its acetylation and phosphorylation. (a) HisMax-tagged p53 or KR was expressed H199 cells. After exposure to UV, cells were sujected to incuation for h followed y immunolot analysis. () Experiments were performed as in a and the and intensities were determined y using a densitometer and normalized y those of GAPDH. The normalized densities for Ac-p53 and p-p53 seen with HisMax-p53 and without UV treatment were expressed as 1. and the others were as its relative values. Error ar, ± s.d. (n=3). (c) After UV treatment, p53 / HCT116 cells were incuated for increasing periods. Cell lysates were sujected to immunoprecipitation with anti-p53 antiody followed y immunolot with anti- ISG antiody. They were also directly sujected to immunolot analysis.
16 a shisg HisMax-p53 HisMax-KR DOX(h) p53 ISG GAPDH shisg Mock HisMax-p53 HisMax-KR DOX p53 ISG GAPDH c p53 / p53 / shisg Flag-ISG DOX p53 5 Flag-ISG ISG GAPDH Supplementary Figure 16. Immunolot analysis of cells used for determining cell growth and colony formation. Cells prepared as in Fig. 7a (a), 7 (), and 7d (c) were sujected to immunolot analysis.
 p53 -/- HCT116 cells expressing HisMax-tagged p53, its KR mutant, or an empty vector (Mock) were treated with different concentrations of doxoruicin. They were then sujected to TUNEL assay.")
17 % Apoptotic cells a.3 mm.6 mm (DOX) Mock p53 KR 5 3 DOX (mm) Mock p53 KR Supplementary Figure. Promotion of doxoruicin-induced apoptosis y p53 ISGylation. (a) p53 -/- HCT116 cells expressing HisMax-tagged p53, its KR mutant, or an empty vector (Mock) were treated with different concentrations of doxoruicin. They were then sujected to TUNEL assay. () Experiments were performed as in a and the numer of TUNEL-positive cells were counted and expressed as percentage of total numer of cells. Error ar, ± s.d. (n=3).

 and p53 -/- HCT116 cells expressing")


18 a shisg DOX shisg DOX p53 p-p53 1 MDM BAX p1 ISG 13 UBE1L UBCH8 EFP GAPDH Mock p53 KR DOX HisMax-p53 HisMax-KR DOX p53 p-p53 1 MDM BAX p1 ISG 13 UBE1L UBCH8 EFP GAPDH Supplementary Figure 18. ISGylation of p53 suppresses tumor growth. p53 / HCT116 cells expressing or shisg (a) and p53 -/- HCT116 cells expressing wild-type p53 or its ISGylation-deficient KR mutant () were injected to BALB/c nude mice. Mock in indicates mice injected with cells that had een transfected with an empty vector. After treatment with PBS or doxoruicin, tumors were dissected out and photographed (left panels). Lysates were prepared from the tumor tissues, and sujected to immunolot analysis (right panels). Bar, mm.
19 Relative intensity a shisg shisg DOX (h) 1. p53 p53 1. p p-p53 1. p-p53 p-p MDM.5.5 BAX p1 ISG MDM BAX MDM BAX UBE1L UBCH8.5 1 p1 p1.5 1 EFP UBP GAPDH ISG UBE1L ISG UBE1L UBCH8 UBCH EFP EFP UBP UBP DOX (h).5 Supplementary Figure 19. UBP represses p53-induced expression of ISG-conjugating system. (a) p53 / HCT116 cells that staly express or shisg were treated with doxoruicin for increasing periods. They were then sujected to immunolot analysis. () Experiments were performed as in a and the and intensities were determined y using a densitometer and normalized y those of GAPDH. The normalized peak densities of the indicated proteins seen with were expressed as 1. and the others were as its relative values. Error ar, ± s.d. (n=3).


20 Fig. 1 Fig. 1a Fig. 1c Fig. 1 1 Supplementary Figure. Full lots.


21 Fig. d Fig. e Fig Fig. 5c Fig. 5d


22 Fig. 5e Fig. 5f Fig. 6e Fig. 6c Fig. 6d


23 S. Fig. a S. Fig. S. Fig. c


24 S. Fig. 3 S. Fig. a S. Fig. c S. Fig. 8a


25 S. Fig. 9a S. Fig. 13a S. Fig. a S. Fig. c 1 1


26 S. Fig. 16a S. Fig. 16 S. Fig. 18a S. Fig. 19a
T H E J O U R N A L O F C E L L B I O L O G Y
 T H E J O U R N A L O F C E L L B I O L O G Y Supplemental material Han et al., http://www.jcb.org/cgi/content/full/jcb.201311007/dc1 Figure S1. SIVA1 interacts with PCNA. (A) HEK293T cells were transiently
ASPP1 Fw GGTTGGGAATCCACGTGTTG ASPP1 Rv GCCATATCTTGGAGCTCTGAGAG
 Supplemental Materials and Methods Plasmids: the following plasmids were used in the supplementary data: pwzl-myc- Lats2 (Aylon et al, 2006), pretrosuper-vector and pretrosuper-shp53 (generous gift of
Coleman et al., Supplementary Figure 1
 Coleman et al., Supplementary Figure 1 BrdU Merge G1 Early S Mid S Supplementary Figure 1. Sequential destruction of CRL4 Cdt2 targets during the G1/S transition. HCT116 cells were synchronized by sequential
TRIM31 is recruited to mitochondria after infection with SeV.
 Supplementary Figure 1 TRIM31 is recruited to mitochondria after infection with SeV. (a) Confocal microscopy of TRIM31-GFP transfected into HEK293T cells for 24 h followed with SeV infection for 6 h. MitoTracker
SUPPLEMENTARY INFORMATION
 doi:10.1038/nature09732 Supplementary Figure 1: Depletion of Fbw7 results in elevated Mcl-1 abundance. a, Total thymocytes from 8-wk-old Lck-Cre/Fbw7 +/fl (Control) or Lck-Cre/Fbw7 fl/fl (Fbw7 KO) mice
Supplementary Fig. 1 Proteomic analysis of ATR-interacting proteins. ATR, ARID1A and
 Supplementary Figure Legend: Supplementary Fig. 1 Proteomic analysis of ATR-interacting proteins. ATR, ARID1A and ATRIP protein peptides identified from our mass spectrum analysis were shown. Supplementary
SUPPLEMENTARY INFORMATION
 DOI: 10.1038/ncb3240 Supplementary Figure 1 GBM cell lines display similar levels of p100 to p52 processing but respond differentially to TWEAK-induced TERT expression according to TERT promoter mutation
SUPPLEMENTARY INFORMATION
 doi:.38/nature899 Supplementary Figure Suzuki et al. a c p7 -/- / WT ratio (+)/(-) p7 -/- / WT ratio Log X 3. Fold change by treatment ( (+)/(-)) Log X.5 3-3. -. b Fold change by treatment ( (+)/(-)) 8
Supplementary Figure 1. TRIM9 does not affect AP-1, NF-AT or ISRE activity. (a,b) At 24h post-transfection with TRIM9 or vector and indicated
 At 24h post-transfection with TRIM9 or vector and indicated") Supplementary Figure 1. TRIM9 does not affect AP-1, NF-AT or ISRE activity. (a,b) At 24h post-transfection with TRIM9 or vector and indicated reporter luciferase constructs, HEK293T cells were stimulated
Supplementary Figure 1. TRIM9 does not affect AP-1, NF-AT or ISRE activity. (a,b) At 24h post-transfection with TRIM9 or vector and indicated reporter luciferase constructs, HEK293T cells were stimulated
Supplementary data. sienigma. F-Enigma F-EnigmaSM. a-p53
 Supplementary data Supplemental Figure 1 A sienigma #2 sienigma sicontrol a-enigma - + ++ - - - - - - + ++ - - - - - - ++ B sienigma F-Enigma F-EnigmaSM a-flag HLK3 cells - - - + ++ + ++ - + - + + - -
Cell proliferation was measured with Cell Counting Kit-8 (Dojindo Laboratories, Kumamoto, Japan).
.") 1 2 3 4 5 6 7 8 Supplemental Materials and Methods Cell proliferation assay Cell proliferation was measured with Cell Counting Kit-8 (Dojindo Laboratories, Kumamoto, Japan). GCs were plated at 96-well
1 2 3 4 5 6 7 8 Supplemental Materials and Methods Cell proliferation assay Cell proliferation was measured with Cell Counting Kit-8 (Dojindo Laboratories, Kumamoto, Japan). GCs were plated at 96-well
SUPPLEMENTAL FIGURES AND TABLES
 SUPPLEMENTAL FIGURES AND TABLES A B Flag-ALDH1A1 IP: α-ac HEK293T WT 91R 128R 252Q 367R 41/ 419R 435R 495R 412R C Flag-ALDH1A1 NAM IP: HEK293T + + - + D NAM - + + E Relative ALDH1A1 activity 1..8.6.4.2
Supplementary Information. HBx-upregulated lncrna UCA1 promotes cell growth and tumorigenesis
 Supplementary Information HBx-upregulated lncrna UCA1 promotes cell growth and tumorigenesis by recruiting EZH2 and repressing p27kip1/cdk2 signaling Jiao-Jiao Hu 1, Wei Song 1, Shao-Dan Zhang 1, Xiao-Hui
Supplementary Table 1. Sequences for BTG2 and BRCA1 sirnas.
 Supplementary Table 1. Sequences for BTG2 and BRCA1 sirnas. Target Gene Non-target / Control BTG2 BRCA1 NFE2L2 Target Sequence ON-TARGET plus Non-targeting sirna # 1 (Cat# D-001810-01-05) sirna1: GAACCGACAUGCUCCCGGA
supplementary information
 DOI: 10.1038/ncb2116 Figure S1 CDK phosphorylation of EZH2 in cells. (a) Comparison of candidate CDK phosphorylation sites on EZH2 with known CDK substrates by multiple sequence alignments. (b) CDK1 and
HCT116 SW48 Nutlin: p53
 Figure S HCT6 SW8 Nutlin: - + - + p GAPDH Figure S. Nutlin- treatment induces p protein. HCT6 and SW8 cells were left untreated or treated for 8 hr with Nutlin- ( µm) to up-regulate p. Whole cell lysates
Supplementary Figure 1. GST pull-down analysis of the interaction of GST-cIAP1 (A, B), GSTcIAP1
, GSTcIAP1") Legends Supplementary Figure 1. GST pull-down analysis of the interaction of GST- (A, B), GST mutants (B) or GST- (C) with indicated proteins. A, B, Cell lysate from untransfected HeLa cells were loaded
Legends Supplementary Figure 1. GST pull-down analysis of the interaction of GST- (A, B), GST mutants (B) or GST- (C) with indicated proteins. A, B, Cell lysate from untransfected HeLa cells were loaded
A RRM1 H2AX DAPI. RRM1 H2AX DAPI Merge. Cont. sirna RRM1
 A H2AX DAPI H2AX DAPI Merge Cont sirna Figure S1: Accumulation of RRM1 at DNA damage sites (A) HeLa cells were subjected to in situ detergent extraction without IR irradiation, and immunostained with the
Fig. S1. Effect of p120-catenin overexpression on the interaction of SCUBE2 with E-cadherin. The expression plasmid encoding FLAG.
 Fig. S1. Effect of p120-catenin overexpression on the interaction of SCUBE2 with E-cadherin. The expression plasmid encoding FLAG.SCUBE2, E-cadherin.Myc, or HA.p120-catenin was transfected in a combination
HPV E6 oncoprotein targets histone methyltransferases for modulating specific. Chih-Hung Hsu, Kai-Lin Peng, Hua-Ci Jhang, Chia-Hui Lin, Shwu-Yuan Wu,
 1 HPV E oncoprotein targets histone methyltransferases for modulating specific gene transcription 3 5 Chih-Hung Hsu, Kai-Lin Peng, Hua-Ci Jhang, Chia-Hui Lin, Shwu-Yuan Wu, Cheng-Ming Chiang, Sheng-Chung
supplementary information
 DOI: 10.1038/ncb2172 Figure S1 p53 regulates cellular NADPH and lipid levels via inhibition of G6PD. (a) U2OS cells stably expressing p53 shrna or a control shrna were transfected with control sirna or
Regulation of transcription by the MLL2 complex and MLL complex-associated AKAP95
 Supplementary Information Regulation of transcription by the complex and MLL complex-associated Hao Jiang, Xiangdong Lu, Miho Shimada, Yali Dou, Zhanyun Tang, and Robert G. Roeder Input HeLa NE IP lot:
Sarker et al. Supplementary Material. Subcellular Fractionation
 Supplementary Material Subcellular Fractionation Transfected 293T cells were harvested with phosphate buffered saline (PBS) and centrifuged at 2000 rpm (500g) for 3 min. The pellet was washed, re-centrifuged
transcription and the promoter occupancy of Smad proteins. (A) HepG2 cells were co-transfected with the wwp-luc reporter, and FLAG-tagged FHL1,
 HepG2 cells were co-transfected with the wwp-luc reporter, and FLAG-tagged FHL1,") Supplementary Data Supplementary Figure Legends Supplementary Figure 1 FHL-mediated TGFβ-responsive reporter transcription and the promoter occupancy of Smad proteins. (A) HepG2 cells were co-transfected
Supplementary Data Supplementary Figure Legends Supplementary Figure 1 FHL-mediated TGFβ-responsive reporter transcription and the promoter occupancy of Smad proteins. (A) HepG2 cells were co-transfected
Primers used for PCR of conductin, SGK1 and GAPDH have been described in (Dehner et al,
 Supplementary METHODS Flow Cytometry (FACS) For FACS analysis, trypsinized cells were fixed in ethanol, rehydrated in PBS and treated with 40μg/ml propidium iodide and 10μ/ml RNase for 30 min at room temperature.
Supplementary Fig. 1 Identification of Nedd4 as an IRS-2-associated protein in camp-treated FRTL-5 cells.
 Supplementary Fig. 1 Supplementary Fig. 1 Identification of Nedd4 as an IRS-2-associated protein in camp-treated FRTL-5 cells. (a) FRTL-5 cells were treated with 1 mm dibutyryl camp for 24 h, and the lysates
Supplemental Figure Legends:
 Supplemental Figure Legends: Fig S1. GFP-ABRO1 localization. U2OS cells were infected with retrovirus expressing GFP- ABRO1. The cells were fixed with 3.6% formaldehyde and stained with antibodies against
SUPPLEMENTAL MATERIAL. Carvajal et al. Supplemental Table 1. List of quantitative PCR primers used for cdna analyses and
 UPPLEMEAL MATERIAL Carvajal et al. upplemental Table 1. List of quantitative PCR primers used for cdna analyses and chromatin immunoprecipitation assays. Figure 1. DNA damage-induced transcriptional repression
Supplementary Figure 1. Nur77 and leptin-controlled obesity. (A) (B) (C)
 (B) (C)") Supplementary Figure 1. Nur77 and leptin-controlled obesity. (A) Effect of leptin on body weight and food intake between WT and KO mice at the age of 12 weeks (n=7). Mice were i.c.v. injected with saline
Supplementary Figure 1. Nur77 and leptin-controlled obesity. (A) Effect of leptin on body weight and food intake between WT and KO mice at the age of 12 weeks (n=7). Mice were i.c.v. injected with saline
b alternative classical none
 Supplementary Figure. 1: Related to Figure.1 a d e b alternative classical none NIK P-IkBa Total IkBa Tubulin P52 (Lighter) P52 (Darker) RelB (Lighter) RelB (Darker) HDAC1 Control-Sh RelB-Sh NF-kB2-Sh
GFP CCD2 GFP IP:GFP
 D1 D2 1 75 95 148 178 492 GFP CCD1 CCD2 CCD2 GFP D1 D2 GFP D1 D2 Beclin 1 IB:GFP IP:GFP Supplementary Figure 1: Mapping domains required for binding to HEK293T cells are transfected with EGFP-tagged mutant
Figure 1: TDP-43 is subject to lysine acetylation within the RNA-binding domain a) QBI-293 cells were transfected with TDP-43 in the presence or
 QBI-293 cells were transfected with TDP-43 in the presence or") Figure 1: TDP-43 is subject to lysine acetylation within the RNA-binding domain a) QBI-293 cells were transfected with TDP-43 in the presence or absence of the acetyltransferase CBP and acetylated TDP-43
Figure 1: TDP-43 is subject to lysine acetylation within the RNA-binding domain a) QBI-293 cells were transfected with TDP-43 in the presence or absence of the acetyltransferase CBP and acetylated TDP-43
Supplementary Figure 1 Phosphorylated tau accumulates in Nrf2 (-/-) mice. Hippocampal tissues obtained from Nrf2 (-/-) (10 months old, 4 male; 2
 mice. Hippocampal tissues obtained from Nrf2 (-/-) (10 months old, 4 male; 2") Supplementary Figure 1 Phosphorylated tau accumulates in Nrf2 (-/-) mice. Hippocampal tissues obtained from Nrf2 (-/-) (10 months old, 4 male; 2 female) or wild-type (5 months old, 1 male; 11 months old,
Supplementary Figure 1 Phosphorylated tau accumulates in Nrf2 (-/-) mice. Hippocampal tissues obtained from Nrf2 (-/-) (10 months old, 4 male; 2 female) or wild-type (5 months old, 1 male; 11 months old,
supplementary information
 DOI: 1.138/ncb1839 a b Control 1 2 3 Control 1 2 3 Fbw7 Smad3 1 2 3 4 1 2 3 4 c d IGF-1 IGF-1Rβ IGF-1Rβ-P Control / 1 2 3 4 Real-time RT-PCR Relative quantity (IGF-1/ mrna) 2 1 IGF-1 1 2 3 4 Control /
Supporting Information
 Supporting Information Su et al. 10.1073/pnas.1211604110 SI Materials and Methods Cell Culture and Plasmids. Tera-1 and Tera-2 cells (ATCC: HTB- 105/106) were maintained in McCoy s 5A medium with 15% FBS
Supplementary Information
 Supplementary Information Supplementary Figure 1: Over-expression of CD300f in NIH3T3 cells enhances their capacity to phagocytize AC. (a) NIH3T3 cells were stably transduced by EV, CD300f WT or CD300f
monoclonal antibody. (a) The specificity of the anti-rhbdd1 monoclonal antibody was examined in
 The specificity of the anti-rhbdd1 monoclonal antibody was examined in") Supplementary information Supplementary figures Supplementary Figure 1 Determination of the s pecificity of in-house anti-rhbdd1 mouse monoclonal antibody. (a) The specificity of the anti-rhbdd1 monoclonal
Supplementary information Supplementary figures Supplementary Figure 1 Determination of the s pecificity of in-house anti-rhbdd1 mouse monoclonal antibody. (a) The specificity of the anti-rhbdd1 monoclonal
Supplementary Table 1. Primers used to construct full-length or various truncated mutants of ISG12b2.
 Supplementary Table 1. Primers used to construct full-length or various truncated mutants of ISG12b2. Construct name ISG12b2 (No tag) HA-ISG12b2 (N-HA) ISG12b2-HA (C-HA; FL-HA) 94-283-HA (FL-GFP) 93-GFP
Pei et al. Supplementary Figure S1
 Pei et al. Supplementary Figure S1 C H-CUL9: + + + + + Myc-ROC1: - - + + + U2OS/pcDN3 U2OS/H-CUL9 U2OS/ + H-CUL9 IP: -H -myc input -H -myc 1 2 3 4 5 H-CUL9 Myc-ROC1 -H -H -H -H H-CUL9: wt RR myc-roc1:
seminal vesicle thymus kidney lung liver
 a 1 HEK293 1 B 3 3 T GFPSMAD TGFβ (T)/ BMP (B) IB: SMAD1/3TP IB: GFP b wild type mouse tissue kidney thymus seminal vesicle liver lung brain adipose tissue muscle pancreas heart uterus spleen testis IB:
Online Supplementary Information
 Online Supplementary Information NLRP4 negatively regulates type I interferon signaling by targeting TBK1 for degradation via E3 ubiquitin ligase DTX4 Jun Cui 1,4,6,7, Yinyin Li 1,5,6,7, Liang Zhu 1, Dan
Supplementary Methods Plasmid constructs
 Supplementary Methods Plasmid constructs. Mouse cdna encoding SHP-1, amplified from mrna of RAW264.7 macrophages with primer 5'cgtgcctgcccagacaaactgt3' and 5'cggaattcagacgaatgcccagatcacttcc3', was cloned
supplementary information
 DOI: 10.1038/ncb1864 Figure S1 Apak specifically inhibits p53 transcriptional activity. Transcription activity of p53 was measured in U2OS (p53 wild-type) and H1299 (p53 deficient) cells which were transfected
Supplementary Table 1. The Q-PCR primer sequence is summarized in the following table.
 Supplementary Table 1. The Q-PCR primer sequence is summarized in the following table. Name Sequence (5-3 ) Application Flag-u ggactacaaggacgacgatgac Shared upstream primer for all the amplifications of
Supplementary Fig. 1
 a FL (1-2266) NL (1-1190) CL (1191-2266) HA-ICE1: - HA-ICE1: - - - FLAG-ICE2: + + + + FLAG-ELL: + + + + + + IP: anti-ha FLAG-ICE2 HA-ICE1-FL HA-ICE1-NL HA-ICE1-CL FLAG-ICE2 b IP: anti-ha FL (1-2266) NL
Supplemental Figure 1: CIP2A and SET levels are increased in some. primary human pancreatic cancer samples. (A) CIP2A mrna levels were
 CIP2A mrna levels were") Supplemental Figure Legends and Figures: Supplemental Figure 1: CIP2A and SET levels are increased in some primary human pancreatic cancer samples. (A) CIP2A mrna levels were measured in 3 benign (non-cancer)
Supplemental Figure Legends and Figures: Supplemental Figure 1: CIP2A and SET levels are increased in some primary human pancreatic cancer samples. (A) CIP2A mrna levels were measured in 3 benign (non-cancer)
Supplementary Fig. 1. Schematic structure of TRAIP and RAP80. The prey line below TRAIP indicates bait and the two lines above RAP80 highlight the
 Supplementary Fig. 1. Schematic structure of TRAIP and RAP80. The prey line below TRAIP indicates bait and the two lines above RAP80 highlight the prey clones identified in the yeast two hybrid screen.
This is the author's accepted version of the manuscript.
 This is the author's accepted version of the manuscript. The definitive version is published in Nature Communications Online Edition: 2015/4/16 (Japan time), doi:10.1038/ncomms7780. The final version published
Tumor Growth Suppression Through the Activation of p21, a Cyclin-Dependent Kinase Inhibitor
 Tumor Growth Suppression Through the Activation of p21, a Cyclin-Dependent Kinase Inhibitor Nicholas Love 11/28/01 A. What is p21? Introduction - p21 is a gene found on chromosome 6 at 6p21.2 - this gene
TITLE: Identification of Androgen Receptor-Regulated Genes in Castration-Recurrent Prostate Cancer
 AD Award Number: W81XWH-11-1-0116 TITLE: Identification of Androgen Receptor-Regulated Genes in Castration-Recurrent Prostate Cancer PRINCIPAL INVESTIGATOR: Irwin H. Gelman, Ph.D. CONTRACTING ORGANIZATION:
Supplementary Materials for
 www.sciencesignaling.org/cgi/content/full/3/146/ra80/dc1 Supplementary Materials for DNMT1 Stability Is Regulated by Proteins Coordinating Deubiquitination and Acetylation-Driven Ubiquitination Zhanwen
Supplementary Figure 1 Validate the expression of mir-302b after bacterial infection by northern
 Supplementary Figure 1 Validate the expression of mir-302b after bacterial infection by northern blot. Northern blot analysis of mir-302b expression following infection with PAO1, PAK and Kp in (A) lung
Supplementary information. Supplementary Figures
 Supplementary information Supplementary Figures Supplementary Figure 1. A. i. HA-JMY expressing U2OS cells were treated with SAHA (6h). DAPI was used to visualise nuclei. ii. U2OS cells stably expressing
Supplementary Figure 1
 Supplementary Figure 1 PTEN promotes virus-induced expression of IFNB1 and its downstream genes. (a) Quantitative RT-PCR analysis of IFNB1 mrna (left) and ELISA of IFN-β (right) in HEK 293 cells (2 10
Supplemental Materials and Methods
 Supplemental Materials and Methods Co-immunoprecipitation (Co-IP) assay Cells were lysed with NETN buffer (20 mm Tris-HCl, ph 8.0, 0 mm NaCl, 1 mm EDT, 0.5% Nonidet P-40) containing 50 mm β-glycerophosphate,
Site-Directed Mutagenesis. Mutations in four Smad4 sites of mouse Gat1 promoter
 Supplement Supporting Materials and Methods Site-Directed Mutagenesis. Mutations in four Smad4 sites of mouse Gat1 promoter were independently generated using a two-step PCR method. The Smad4 binding site
Nature Genetics: doi: /ng Supplementary Figure 1. ChIP-seq genome browser views of BRM occupancy at previously identified BRM targets.
 Supplementary Figure 1 ChIP-seq genome browser views of BRM occupancy at previously identified BRM targets. Gene structures are shown underneath each panel. Supplementary Figure 2 pref6::ref6-gfp complements
(a) Immunoblotting to show the migration position of Flag-tagged MAVS
 Immunoblotting to show the migration position of Flag-tagged MAVS") Supplementary Figure 1 Characterization of six MAVS isoforms. (a) Immunoblotting to show the migration position of Flag-tagged MAVS isoforms. HEK293T Mavs -/- cells were transfected with constructs expressing
Supplementary Figure 1 Characterization of six MAVS isoforms. (a) Immunoblotting to show the migration position of Flag-tagged MAVS isoforms. HEK293T Mavs -/- cells were transfected with constructs expressing
SUPPLEMENTARY INFORMATION
 DOI: 10.1038/ncb2271 Supplementary Figure a! WM266.4 mock WM266.4 #7 sirna WM266.4 #10 sirna SKMEL28 mock SKMEL28 #7 sirna SKMEL28 #10 sirna WM1361 mock WM1361 #7 sirna WM1361 #10 sirna 9 WM266. WM136
Supplementary Figure 1. TSA (10 nmol/l), non-class-selective HDAC inhibitor, potentiates
, non-class-selective HDAC inhibitor, potentiates") Supplementary Figure 1. TSA (10 nmol/l), non-class-selective HDAC inhibitor, potentiates vascular calcification (VC). (a) Von Kossa staining shows that TSA potentiated the Pi-induced VC. Scale bar, 100
Supplementary Figure 1. TSA (10 nmol/l), non-class-selective HDAC inhibitor, potentiates vascular calcification (VC). (a) Von Kossa staining shows that TSA potentiated the Pi-induced VC. Scale bar, 100
SUPPLEMENTARY INFORMATION
 (Supplementary Methods and Materials) GST pull-down assay GST-fusion proteins Fe65 365-533, and Fe65 538-700 were expressed in BL21 bacterial cells and purified with glutathione-agarose beads (Sigma).
Figure S1. Sequence alignments of ATRIP and ATR TopBP1 interacting regions.
 A H. sapiens 204 TKLQTS--ERANKLAAPSVSH VSPRKNPSVVIKPEACS-PQFGKTSFPTKESFSANMS LP 259 B. taurus 201 TKLQSS--ERANKLAVPTVSH VSPRKSPSVVIKPEACS-PQFGKPSFPTKESFSANKS LP 257 M. musculus 204 TKSQSN--GRTNKPAAPSVSH
Supplementary Materials for
 www.sciencesignaling.org/cgi/content/full/8/404/ra120/dc1 Supplementary Materials for The subcellular localization and activity of cortactin is regulated by acetylation and interaction with Keap1 Akihiro
Supplementary Figure 1. The Hsp70 acetylation level is related to the co-chaperone binding of Hsp70 under various stress conditions.
 Supplementary Figure 1. The Hsp70 acetylation level is related to the co-chaperone binding of Hsp70 under various stress conditions. 1 (a) Etoposide treatment gradually changes acetylation level and co-chaperone
USP19 modulates autophagy and antiviral immune responses by. deubiquitinating Beclin-1
 USP19 modulates autophagy and antiviral immune responses by deubiquitinating Beclin-1 Shouheng Jin 1,2,, Shuo Tian 1,, Yamei Chen 1,, Chuanxia Zhang 1,2, Weihong Xie, 1 Xiaojun Xia 3,4, Jun Cui 1,3* &
Nature Biotechnology: doi: /nbt Supplementary Figure 1
 Supplementary Figure 1 Generation of the AARE-Gene system construct. (a) Position and sequence alignment of AAREs extracted from human Trb3, Chop or Atf3 promoters. AARE core sequences are boxed in grey.
SUPPLEMENTARY INFORMATION
 Figure S1: Activation of the ATM pathway by I-PpoI. A. HEK293T cells were either untransfected, vector transfected, transfected with an I-PpoI expression vector, or subjected to 2Gy γ-irradiation. 24 hrs
SUPPLEMENTARY INFORMATION
 DOI: 10.1038/ncb3363 Supplementary Figure 1 Several WNTs bind to the extracellular domains of PKD1. (a) HEK293T cells were co-transfected with indicated plasmids. Flag-tagged proteins were immunoprecipiated
Supplementary Information
 Supplementary Information Supplementary Figures Supplementary Figure 1. MLK1-4 phosphorylate MEK in the presence of RAF inhibitors. (a) H157 cells were transiently transfected with Flag- or HA-tagged MLK1-4
SUPPLEMENTARY INFORMATION
 SUPPLEMENTARY INFORMATION Dynamic Phosphorylation of HP1 Regulates Mitotic Progression in Human Cells Supplementary Figures Supplementary Figure 1. NDR1 interacts with HP1. (a) Immunoprecipitation using
Supplementary Figure 1
 Supplementary Figure 1 Virus infection induces RNF128 expression. (a,b) RT-PCR analysis of Rnf128 (RNF128) mrna expression in mouse peritoneal macrophages (a) and THP-1 cells (b) upon stimulation with
Fig. S1. eif6 expression in HEK293 transfected with shrna against eif6 or pcmv-eif6 vector.
 Fig. S1. eif6 expression in HEK293 transfected with shrna against eif6 or pcmv-eif6 vector. (a) Western blotting analysis and (b) qpcr analysis of eif6 expression in HEK293 T cells transfected with either
Supplementary Figure 1 PARP1 is involved in regulating the stability of mrnas from pro-inflammatory cytokine/chemokine mediators.
 Supplementary Figure 1 PARP1 is involved in regulating the stability of mrnas from pro-inflammatory cytokine/chemokine mediators. (a) A graphic depiction of the approach to determining the stability of
SUPPLEMENTARY INFORMATION
 The Supplementary Information (SI) Methods Cell culture and transfections H1299, U2OS, 293, HeLa cells were maintained in DMEM medium supplemented with 10% fetal bovine serum. H1299 and 293 cells were
Supplementary Materials for
 advances.sciencemag.org/cgi/content/full/4/9/eaat5401/dc1 Supplementary Materials for GLK-IKKβ signaling induces dimerization and translocation of the AhR-RORγt complex in IL-17A induction and autoimmune
At E17.5, the embryos were rinsed in phosphate-buffered saline (PBS) and immersed in
 and immersed in") Supplementary Materials and Methods Barrier function assays At E17.5, the embryos were rinsed in phosphate-buffered saline (PBS) and immersed in acidic X-gal mix (100 mm phosphate buffer at ph4.3, 3 mm
Supplementary Materials and Methods Barrier function assays At E17.5, the embryos were rinsed in phosphate-buffered saline (PBS) and immersed in acidic X-gal mix (100 mm phosphate buffer at ph4.3, 3 mm
Nature Biotechnology: doi: /nbt Supplementary Figure 1
 Supplementary Figure 1 Schematic and results of screening the combinatorial antibody library for Sox2 replacement activity. A single batch of MEFs were plated and transduced with doxycycline inducible
Supplementary Figures
 Supplementary Figures Supplementary Figure 1. Description of the observed lymphatic metastases in two different SIX1-induced MCF7 metastasis models (Nude and NOD/SCID). Supplementary Figure 2. MCF7-SIX1
SUPPLEMENTAL EXPERIMENTAL PROCEDURES
 SUPPLEMENTAL EXPERIMENTAL PROCEDURES Luciferase Assays Cells were seeded on 24well plates and grown to 7% confluency. Cells were then transfected with ng of reporter constructs and 1 ng of the renilla
TE5 KYSE510 TE7 KYSE70 KYSE140
 TE5 KYSE5 TT KYSE7 KYSE4 Supplementary Figure. Hockey stick plots showing input normalized, rank ordered H3K7ac signals for the candidate SE-associated lncrnas in this study. Rpm Rpm Rpm Chip-seq H3K7ac
Nature Immunology: doi: /ni Supplementary Figure 1
 Supplementary Figure 1 EPRS expression in multiple cell lines upon viral infection. (a,b) EPRS is slightly induced upon viral induction. qpcr of Eprs mrna (a) and immunoblot analysis of corresponding endogenous
EXPERIMENTAL PROCEDURES
 EXPERIMENTAL PROCEDURES Cell culture and antibodies-human colorectal cancer HCT-116 cells, human embryonic kidney 293 cells and human normal breast epithelial cells MCF-10A cells were cultured as recommended
Tandem E2F Binding Sites in the Promoter of the p107 Cell Cycle Regulator Control p107 Expression and Its Cellular Functions
 Tandem E2F Binding Sites in the Promoter of the p107 Cell Cycle Regulator Control p107 Expression and Its Cellular Functions Deborah L. Burkhart 1,2, Stacey E. Wirt 1,2, Anne-Flore Zmoos 1, Michael S.
Supplementary Materials for
 www.sciencesignaling.org/cgi/content/full/5/233/ra50/dc1 Supplementary Materials for Epidermal Growth Factor Receptor Is Essential for Toll-Like Receptor 3 Signaling Michifumi Yamashita, Saurabh Chattopadhyay,
Parthanatos mediates AIMP2-activated age-dependent dopaminergic neuronal loss
 SUPPLEMENTARY INFORMATION Parthanatos mediates AIMP2-activated age-dependent dopaminergic neuronal loss Yunjong Lee, Senthilkumar S. Karuppagounder, Joo-Ho Shin, Yun-Il Lee, Han Seok Ko, Debbie Swing,
SUPPLEMENTARY INFORMATION
 DOI: 10.1038/ncb2743 Figure S1 stabilizes cellular protein level, post-transcriptionally. (a, b) and DDR1 were RNAi-depleted from HEK.293.-CBG cells. Western blots with indicated antibodies (a). RT-PCRs
Supplementary Figures
 Supplementary Figures 11 1 1 Supplementary Figure 1. Clinical features of EBS cases with KLHL mutations. (a) Photo of Patient 1 s hands showing mild atrophic skin and unaffected finger nails. (b) The skin
Xu et al., Supplementary Figures 1-7
 Xu et al., Supplementary Figures 1-7 Supplementary Figure 1. PIPKI is required for ciliogenesis. (a) PIPKI localizes at the basal body of primary cilium. RPE-1 cells treated with two sirnas targeting to
Flag-Rac Vector V12 V12 N17 C40. Vector C40 pakt (T308) Akt1. Myc-DN-PAK1 (N-SP)
 Akt1. Myc-DN-PAK1 (N-SP)") a b FlagRac FlagRac V2 V2 N7 C4 V2 V2 N7 C4 p (T38) p (S99, S24) p Flag (Rac) NIH 3T3 COS c +Serum p (T38) MycDN (NSP) Mycp27 3 6 2 3 6 2 3 6 2 min p Myc ( or p27) Figure S (a) Effects of Rac mutants on
a b FlagRac FlagRac V2 V2 N7 C4 V2 V2 N7 C4 p (T38) p (S99, S24) p Flag (Rac) NIH 3T3 COS c +Serum p (T38) MycDN (NSP) Mycp27 3 6 2 3 6 2 3 6 2 min p Myc ( or p27) Figure S (a) Effects of Rac mutants on
Cell line CDH1 mrna AS-paRNA S-paRNA
 a b Cell line mrna AS-paRNA S-paRNA HCT116 P53 +/+ 39.47 + + HCT116 P53 -/- 35.36 + + LNCAP 1562.4 + - MCF7 C1 1864.76 + - MCF7 C2 1812.81 + - Supplementary Figure 1. Promoter-associated transcripts at
Supplementary Figure 1 (A), (B), and (C) Docking of a physiologic ligand of integrin αvβ3, the tenth type III RGD domain of wild-type fibronectin
, (B), and (C) Docking of a physiologic ligand of integrin αvβ3, the tenth type III RGD domain of wild-type fibronectin") Supplementary Figure 1 (A), (B), and (C) Docking of a physiologic ligand of integrin αvβ3, the tenth type III RGD domain of wild-type fibronectin (A), D1-CD2 (B), and the D1-CD2 variant 3 (C) to Adomain
Supplementary Figure 1 (A), (B), and (C) Docking of a physiologic ligand of integrin αvβ3, the tenth type III RGD domain of wild-type fibronectin (A), D1-CD2 (B), and the D1-CD2 variant 3 (C) to Adomain
Supplemental Information. Mitophagy Controls the Activities. of Tumor Suppressor p53. to Regulate Hepatic Cancer Stem Cells
 Molecular Cell, Volume 68 Supplemental Information Mitophagy Controls the Activities of Tumor Suppressor to Regulate Hepatic Cancer Stem Cells Kai Liu, Jiyoung Lee, Ja Yeon Kim, Linya Wang, Yongjun Tian,
Supplementary Information
 Supplementary Information MLL histone methylases regulate expression of HDLR- in presence of estrogen and control plasma cholesterol in vivo Khairul I. Ansari 1, Sahba Kasiri 1, Imran Hussain 1, Samara
Supplementary Figure 1. (a) The qrt-pcr for lnc-2, lnc-6 and lnc-7 RNA level in DU145, 22Rv1, wild type HCT116 and HCT116 Dicer ex5 cells transfected
 The qrt-pcr for lnc-2, lnc-6 and lnc-7 RNA level in DU145, 22Rv1, wild type HCT116 and HCT116 Dicer ex5 cells transfected") Supplementary Figure 1. (a) The qrt-pcr for lnc-2, lnc-6 and lnc-7 RNA level in DU145, 22Rv1, wild type HCT116 and HCT116 Dicer ex5 cells transfected with the sirna against lnc-2, lnc-6, lnc-7, and the
Supplementary Figure 1. (a) The qrt-pcr for lnc-2, lnc-6 and lnc-7 RNA level in DU145, 22Rv1, wild type HCT116 and HCT116 Dicer ex5 cells transfected with the sirna against lnc-2, lnc-6, lnc-7, and the
Supplementary Information for. Regulation of Rev1 by the Fanconi Anemia Core Complex
 Supplementary Information for Regulation of Rev1 by the Fanconi Anemia Core Complex Hyungjin Kim, Kailin Yang, Donniphat Dejsuphong, Alan D. D Andrea* *Corresponding Author: Alan D. D Andrea, M.D. Alan_dandrea@dfci.harvard.edu
Table S1. Primers used in RT-PCR studies (all in 5 to 3 direction)
") Table S1. Primers used in RT-PCR studies (all in 5 to 3 direction) Epo Fw CTGTATCATGGACCACCTCGG Epo Rw TGAAGCACAGAAGCTCTTCGG Jak2 Fw ATCTGACCTTTCCATCTGGGG Jak2 Rw TGGTTGGGTGGATACCAGATC Stat5A Fw TTACTGAAGATCAAGCTGGGG
Table S1. Primers used in RT-PCR studies (all in 5 to 3 direction) Epo Fw CTGTATCATGGACCACCTCGG Epo Rw TGAAGCACAGAAGCTCTTCGG Jak2 Fw ATCTGACCTTTCCATCTGGGG Jak2 Rw TGGTTGGGTGGATACCAGATC Stat5A Fw TTACTGAAGATCAAGCTGGGG
Supplementary Information: Materials and Methods. GST and GST-p53 were purified according to standard protocol after
 Supplementary Information: Materials and Methods Recombinant protein expression and in vitro kinase assay. GST and GST-p53 were purified according to standard protocol after induction with.5mm IPTG for
Supplementary Figures 1-12
 Supplementary Figures 1-12 Supplementary Figure 1. The specificity of anti-abi1 antibody. Total Proteins extracted from the wild type seedlings or abi1-3 null mutant seedlings were used for immunoblotting
JCB. Supplemental material THE JOURNAL OF CELL BIOLOGY. Kimura et al.,
 Supplemental material JCB Kimura et al., http://www.jcb.org/cgi/content/full/jcb.201503023/dc1 THE JOURNAL OF CELL BIOLOGY Figure S1. TRIMs regulate IFN-γ induced autophagy. (A and B) HC image analysis
Supplementary Materials for
 www.sciencesignaling.org/cgi/content/full/9/429/ra54/dc1 Supplementary Materials for Dephosphorylation of the adaptor LAT and phospholipase C by SHP-1 inhibits natural killer cell cytotoxicity Omri Matalon,