Digital Dashboards: Best Practices and Lessons Learned
|
|
|
- Estella Bruce
- 6 years ago
- Views:
Transcription

1 Digital Dashboards: Best Practices and Lessons Learned March 18, 2013 Martin Schneiderman President Information Age Associates 47 Murray Place Princeton, NJ 0540 USA Copyright 2013 Information Age Associates. All Rights Reserved. 1

2 A User-Centered Design Approach Can Result in an Intuitive Interface A usable interface becomes invisible; sometimes you know you've gotten it right when your customers/users don't talk about how usable the product is... they're too busy raving about how you've made their life better. Don Norman, useit.com, "The Design of Everyday Things published in

3 Some Benefits of Digital Dashboards for Grantmakers See the big picture of information and operations Graphical representation of data and performance measures Measure efficiencies and inefficiencies Quickly identify correlations and data outliers See key trends that need adjustment or correction Ability to make better informed decisions based on accurate information It s more effective than just running reports 3

4 Digital Dashboards Many thanks to CSDC Grantium and MicroEdge for sharing some of their useful lessons learned and recommendations

5 Best Practices Who are your information consumers? They may not be inputting or managing data, but are already consuming reports from the system. They can become self-service users. Make the focus being actionable information and lessons learned! What information (vs. data) do staff need at their fingertips in an at-a-glance format? 5

6 More Best Practices Don t try to graphically represent non-quantitative data. Get dashboard requirements from users. (e.g. what do staff need and want to see) What searches/reports are run most often? Which aren t and need to be? Start by creating a whiteboard layout. Use requirements to develop standard dashboard parts for each user type. 6
 Make each graphic part do double (or triple) duty when possible. (e.g. YTD to current to a detailed view) Use the graphic type that best conveys the information you re displaying.")
7 More Best Practices Decide who is best qualified to create and maintain accurate dashboards. (The data is complex and it s easy to make a mistake creating a dashboard view) Make each graphic part do double (or triple) duty when possible. (e.g. YTD to current to a detailed view) Use the graphic type that best conveys the information you re displaying. (e.g. a bar chart for comparison vs. a line chart for trend) 7

8 Napoleon's Grand Army Invasion of Moscow from Kowno Lithuania 500,000 French troops head east to invade Moscow Only 27,000 French troops returned to Kowno after the successful Russian scorched-earth tactic 8

9 More Best Practices Develop simple instructions and templates for creating and using dashboards parts. Train each type of user how to use their dashboards and record training for traveling staff. Repeat training months later and regularly so staff have times to use the system and ask questions. 9

10 Some Important Things to Do

11 Some Important Things to Do Clarify scope with users and conduct a thorough requirements analysis. Build, evaluate and refine prototypes. Distinguish between requirements for dashboards vs. regular reports. 11
.")
12 Some More Important Things to Do Consider consolidating information on a single screen display (keep in mind the limited real estate on smaller screens). Use the appropriate graphical display medium for efficient communication of data (graphs are understood faster than lists/tables). The better the quality of data available, the more meaningful the dashboard. 12


13 Major Potholes... and What Not to Do 13
 14")
14 Some of the Major Data-related Potholes 1. Data that s missing and/or has gaps 2. Incomplete data 3. Inaccurate data 4. Incorrectly entered data 5. Inconsistently coded data 6. Diversely coded data 7. Different standards by different staff 8. Duplicate records (orgs, requests and contacts) 14

15 More Major Data-related Potholes No clear definition of minority that changes among countries and over time. Constantly changing synonymous codes du jour. French for codes of the day Too many unnecessary levels of codes. Different coding terminology and program names among: Grant database Accounting system (AP) Communications for the Board, pubs and Web 15
16 Some of the Most Common Data Mapping Problems Mapping only the grantee s HQ office location vs. the grant program s geographic area served. Mixing all of these codes at the same level: Continents, countries, regions, counties, states, cities and neighborhoods (often using non-standard names) Countries and cities listed in the wrong continents. 16

17 Examples of Good Coding A logical graphical hierarchy Continent Country State, province, prefecture, canton County City Borough or neighborhood Use standard code names that last over time, that are logical and enable searching. 17
18 Some Types of Digital Dashboards Bar charts Pie charts Line charts Bullet graphs Area chart Tables Gauges Maps (U.S. and worldwide) Summary statistics Trend charts Cards (e.g. contact info) Meters Calendars Timeline charts 18


19 23 North American Integrated Foundation Information System Software and Service Providers 19

20 A Delectable Smörgåsbord of Digital Dashboards


21 Outlook Link to Grant Data Outlook Grant information 21

22 Charts,Tables and Pie Different chart types 22

23 Application Status with Quick Action Dropdown Quick Actions 23
24 Grantseeker Step-by-Step Application Progress Showing the grantseeker s step-by-step process 24

25 Grantmaker Dashboard Organization Detail Checklist 25
26 Funding Opportunity Dashboard Summary statistics and charts 26

27 Project Budget Totals Charts and a table 27


28 Chart, Summary, Table and Pie Multiple charts and statistical formats 28


29 Record Lookup, Resources, Budget Chart and Table A chart of the current budget status 29

30 Key Grant Statistics Linked to Drill-down Google Map Map presentation of your grant data 30

31 Budget Overview by Program U.S. and China Spending 31

32 Summary Statistics Dashboard View Multiple cards each with different data 32

33 Request Pipeline and Google Street View of Addressee Street view of a grantee s address 33

34 Administrator View of Assigned Grant Follow Ups Provides drill down 34

35 Organization Summary with Link to GuideStar Charity Check Auto-links and displays GuideStar s external Charity Check subscription service 35

36 What s New, Alerts, Asset Summary, Distributions, Quick Links, Grants and Tax Center Both a chart and different data formats 36


37 Dashboard Visualizer of Core Grants A drill-down digital dashboard accessing an organization s grant data 37

38 Program Area Map on an ipad Grant data displaying on an Apple ipad 38

39 Budget Payments Chart and Table A bar chart and a table with drill down capability 39

40 Requests by Program, Status, NTEE Coding, and Requests Received Multiple charts formats with different types of data 40

41 Quick Views, Tools, To Do, and Summary Data Colors highlight different status types 41

42 Review and Manage Grants Flags can show the nationality of the grantee 42


43 Incoming Grants, Grant Summary, Request Summary and Requirements to Review A toolbar with 7 different dashboards 43


44 High Level Charts of Requests and Grants by Program Combo of a bar and pie chart of Requests this year 44


45 Program Budget and Summary Statistics Multiple graphical parts and a summary section 45

46 Grants Managers View Each frame has multiple graphical part options 46


47 Grants by Fund/Year A toolbar with 5 different views 47


48 Payment by Program, Pending Grant Reports, Budget Consumption Multiple graphical parts 48


49 Budget Allocation Report Multi-level hierarchical programs with budgets and balance amounts 49


50 Grants by Count Multiple graphical parts 50

51 Grant Summary Information A calendar and a table with drill down capability 51
")
52 Application Status, Indicators and Summary Data This new Acadia enhancement is coming March 2013 Key Performance Indicator (KPI) Information 52

53 Submission Status, Pending Review, Regional Counts, GIFTS by Type Drill-down capability Staff submission by status summary 53

54 Grant Application Table with Review Ratings Drill-down capability 54

55 Post-Funding Report Status Late and requires action 55
56 An Online Service that s a Digital Dashboard for egrant Reporters

57 What is a mashup? A mashup is an application that combines content from more than one source into an integrated experience.
58 58
59 59
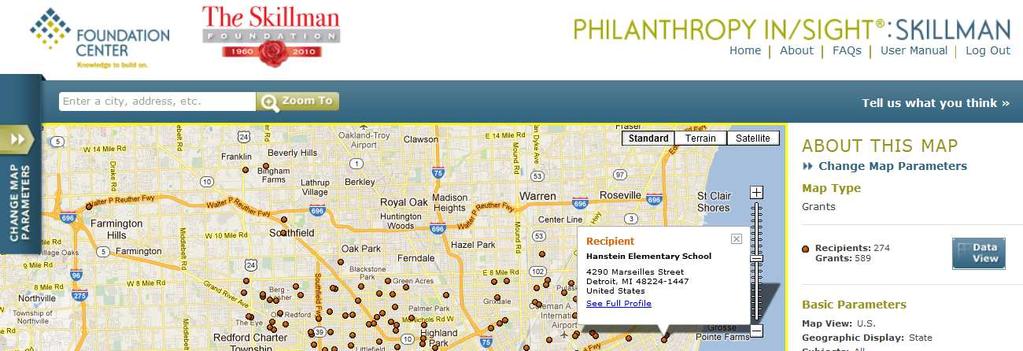

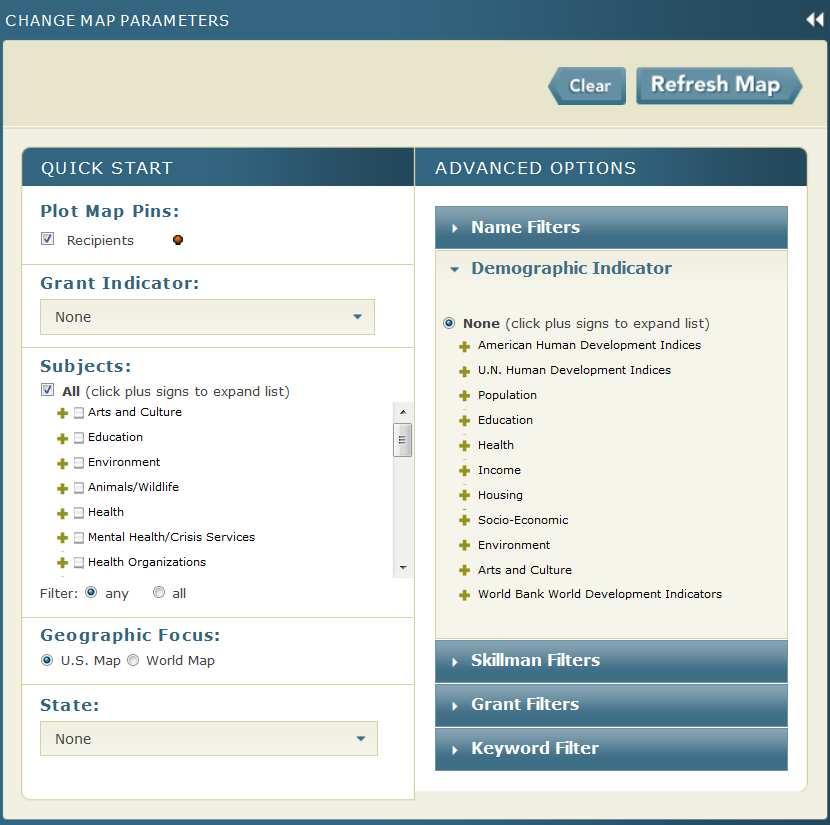

60 150+ demographic mashup database overlays to see with your grant information 60


61 Source: 61
62 Time for Q&A! Go to for more information about integrated foundation information systems and digital dashboards 62
Strategies and Deal Breakers for Choosing an Integrated Grants Management System
 Strategies and Deal Breakers for Choosing an Integrated Grants Management System March 16, 2015 Martin Schneiderman President Information Age Associates 47 Murray Place Princeton, NJ 0540 USA mbs@iaa.com
Key Performance Indicator (KPI)
") In this data-driven world, everything counts upon insights and facts. Whether it is a technological advancement or evaluating the performance, data is used everywhere. In this context today we will talk
In this data-driven world, everything counts upon insights and facts. Whether it is a technological advancement or evaluating the performance, data is used everywhere. In this context today we will talk
Step-by-step CRM data analytics for sales teams. How to go beyond metrics and find actionable insights to improve sales performance
 Step-by-step CRM data analytics for sales teams How to go beyond metrics and find actionable insights to improve sales performance On average, On average, Finding insights is hard don t make it any harder
Sage Peachtree Business Intelligence
 Sage Peachtree Business Intelligence Standard Reports Our ready-to-use reports give you immediate insight into and across your business. Delivered in the familiar environment of Microsoft Excel, the reports
Salient Interactive Miner 4.x
 Salient Interactive Miner 4.x Getting Started Getting Started in 6 Easy Steps Working with Salient Analyses Knowledge Manager Technology Summary Salient Interactive Miner Designed to Work the Way You Think
Best Practices in Dashboard Design
 Best Practices in Dashboard Design Dan Bulos bulos@symcorp.com Agenda What is a Dashboard? Dashboard Best Practices Dashboard Components Navigation Metaphors Go Only So Far Monitors a Continuous Process
Skelta. Capital Expenditure Management. Business Process Management for All POWERED BY SKELTA BPM
 Skelta Capital Expenditure Management POWERED BY SKELTA BPM Business Process Management for All www.skelta.com Track organizational budget and increase productivity of your CAPEX cycle using Skelta BPM.
Scorecarding with IBM Planning Analytics
 Scorecarding with IBM Planning Analytics Elevating the role of metrics in high-participation planning Highlights Link high-participation planning, budgeting and forecasting processes to actual performance
QPR ScoreCard. White Paper. QPR ScoreCard - Balanced Scorecard with Commitment. Copyright 2002 QPR Software Oyj Plc All Rights Reserved
 QPR ScoreCard White Paper QPR ScoreCard - Balanced Scorecard with Commitment QPR Management Software 2/25 Table of Contents 1 Executive Overview...3 2 Implementing Balanced Scorecard with QPR ScoreCard...4
Infor PM for Manufacturing
 Infor PM for Manufacturing The software automates so many of our monthly reporting processes that it gives us more time to spend on analysis as well as the ability to quickly respond to management inquiries.
Q&As. Managing Projects with Microsoft Project Pass Microsoft Exam with 100% Guarantee
 74-343 Q&As Managing Projects with Microsoft Project 2013 Pass Microsoft 74-343 Exam with 100% Guarantee Free Download Real Questions & Answers PDF and VCE file from: 100% Passing Guarantee 100% Money
TABLE OF CONTENTS ! +
 TABLE OF CONTENTS MEANINGFUL DASHBOARDS... 2 What is a Dashboard?... 2 Where are Dashboards Used?... 4 The Market View... 6 What Should You Look For?... 7 The Key Benefits... 9 Creating Meaningful Dashboards
Program Overview and Course Offerings. EAM elearning. Instructor-led online Infor EAM software training
 EAM elearning Instructor-led online Infor EAM software training EAM elearning from SwainSmith is designed for companies on the move that want to get the most out of Infor EAM. With EAM elearning, you get
BEACON PRINT ANALYTICS AND FLEET MANAGER
 BEACON PRINT ANALYTICS AND FLEET MANAGER BEACON PRINT ANALYTICS Easily discover ways to optimize and save by accessing comprehensive job-level details about how people print across your organization. It
EVOLVING PAYROLL IN ADP WORKFORCE NOW : YOUR SEAT AT THE TABLE
 EVOLVING PAYROLL IN ADP WORKFORCE NOW : YOUR SEAT AT THE TABLE Ari Osur, Senior Director, Product Marketing Description Have you seen the latest changes to ADP Workforce Now payroll? During this session,
The tools you need to maximize building efficiency in a big way.
 WebCTRL building Analytics The tools you need to maximize building efficiency in a big way. We make data big. Environmental Index The right tools make everyone comfortable. While there s a lot of buzz
Sage Evolution Version 7 Intelligence Reporting Standard Reports
 Sage Evolution Version 7 Intelligence Reporting Standard Reports Get a number of ready-to-use reports that give you immediate insight into and across your business. Delivered in the familiar environment
Sage 100 ERP 2015 Intelligence Reporting Standard reports
 Standard reports Get six ready-to-use reports that give you immediate insight into and across your business. Delivered in the familiar environment of Microsoft Excel, the reports are fully customizable
Unit4 PSA Suite Business Performance Edition
 for Microsoft Dynamics CRM Unit4 PSA Suite Business Performance Edition Release Notes Unit4 PSA Suite Business Performance Edition July 2017 v.31.07.2017 - MvB (C) Copyright 2017 Unit4 Table of Contents...
The Missing Piece of a Successful Application Lifetime Management
 The Missing Piece of a Successful Application Lifetime Management The Cycle Is Not Complete Atlassian provides us with the necessary tools to manage every step of the application lifecycle from planning
Complete Guide to Field Service
 Complete Guide to Field Service Salesforce, Winter 19 @salesforcedocs Last updated: October 10, 2018 Copyright 2000 2018 salesforce.com, inc. All rights reserved. Salesforce is a registered trademark of
Which Chart or Graph is Right for you?
 Which Chart or Graph is Right for you? You know that data can answer your business questions, but how do you visualize your data to answer those questions in a way that is easily understandable? Choosing
Process Manufacturing Extensions for Endeca Subtitle
 Process Manufacturing Extensions for Endeca Subtitle Karen Theel Senior Director EBS Manufacturing Application Strategy June 10, 2014 Safe Harbor Statement The preceding is intended to outline our general
PROACTIS Solutions & Services for Finance
 PROACTIS Solutions & Services for Finance What we do for you as the person responsible for financial management How We Help increase savings, reduce risk and improve efficiencies by providing you with
QUICK GUIDE. Dashboards: Why Dashboards are Better than Data Alone. Why Dashboards are Better than Data Alone
 QUICK GUIDE Dashboards: Why Dashboards are Better than Data Alone 1 Think about the dashboards in the cockpit of a plane, or even in your car. There are vast amounts of information being generated by these
Infor PM 10. Do business better.
 Infor PM 10 Infor PM is designed for companies in all industries that seek to better monitor, measure, and manage their business performance in real time. Do business better. The speed, complexity, and
State Analytical Reporting System (STARS)
") Table of Contents Human Resources Analytics Dashboards and Reports... 3 WORKFORCE DEPLOYMENT... 4 WORKFORCE DEMOGRAPHICS... 8 COMPENSATION... 11 RETENTION... 16 TIME AND LABOR ANALYSIS... 21 ACCRUAL...
Table of Contents Human Resources Analytics Dashboards and Reports... 3 WORKFORCE DEPLOYMENT... 4 WORKFORCE DEMOGRAPHICS... 8 COMPENSATION... 11 RETENTION... 16 TIME AND LABOR ANALYSIS... 21 ACCRUAL...
Oracle Utilities Analytics Dasboards for Distribution Analytics, Outage Analytics
 Oracle Utilities Analytics Dasboards for Distribution Analytics, Outage Analytics Metric Reference Guide Release 2.5.2 E49006-06 August 2015 Oracle Utilities Analytics Dasboards for Distribution Analytics,
INFOR PM 10 DO BUSINESS BETTER. LEVERAGE EXPERIENCE.
 Infor PM is designed for companies in all industries that seek to better monitor, measure, and manage their business performance in real time. INFOR PM 10 DO BUSINESS BETTER. The speed, complexity, and
Inspired Design meets Dynamic Technology for Community & Public Foundations
 Inspired Design meets Dynamic Technology for Community & Public Foundations Integrated online software that works the way you do. Now and in the future. Community Akoya.net integrates all essential functions
IBM Planning Analytics
 Speed, agility and foresight Powered by IBM TM1 Highlights Automates manual, spreadsheet-based planning, budgeting, forecasting, reporting and analysis Links operational tactics to financial plans, synthesizes
HORIZON Business Intelligence
 HORIZON Business Intelligence The Art of Analysis Ryan Hodges, HORIZON 360 BI Development Manager 5/22/2017 Objective Apply the tools of an artist to the work of a data analyst Art Color Form Flow Narrative
An Introduction to An Introduction to. BIRST Infor EAM
 An Introduction to An Introduction to BIRST Infor EAM Introduction In any asset-intensive business, there is no room for poor performance. The smallest problem can lead to costly downtime or even pose
GLOSSARY OF TERMS For Business Performance Management
 GLOSSARY OF TERMS For Business Performance Management September 2012 Table of Contents Table of Contents... 1 Introduction... 2 Glossary... 2 Page 1 Introduction Many terms we use when talking about Business
Admin. Provides a simple interface to create employees, assign them to groups and relate to responsibility tags Encompasses universal broking methods
 Admin suite is a web based application built on an open architecture, with enormous flexibility for insurance broking houses. Our approach is to deliver a solution that can increase processing productivity,
EVOLVING PAYROLL IN ADP WORKFORCE NOW : YOUR SEAT AT THE TABLE
 EVOLVING PAYROLL IN ADP WORKFORCE NOW : YOUR SEAT AT THE TABLE Lance Kadushin, Senior Director Product Management Description Have you seen the latest changes to ADP Workforce Now payroll? During this
NICE Customer Engagement Analytics - Architecture Whitepaper
 NICE Customer Engagement Analytics - Architecture Whitepaper Table of Contents Introduction...3 Data Principles...4 Customer Identities and Event Timelines...................... 4 Data Discovery...5 Data
Sage 50 Accounts Why upgrade from Sage 50 Accounts 2011
 Sage 50 Accounts Why upgrade from Sage 50 Accounts 2011 Sage 50 Accounts has been transformed. Now it gives you the best of both worlds, with the benefits of stable, reliable desktop software and the choice
WebCTRL BUILDING ANALYTICS
 Next level building automation engineered to help you make smart decisions. WebCTRL BUILDING ANALYTICS The tools you need to maximize building efficiency in a big way. While there s a lot of buzz around
Contents Introduction... 1 What Kind of Metrics Should I Use?... 1 Data Integration... 1 Reporting... 2 Reports Dashboards...
 MICHAEL BOONIE Contents Introduction... 1 What Kind of Metrics Should I Use?... 1 Data Integration... 1 Reporting... 2 Reports... 2 Dashboards... 3 Introduction From business to education and from manufacturing
Project Tracker. BAS Project Management. Creates monthly progress billing and simplifies project status reporting
 Project Tracker BAS Project Management Creates monthly progress billing and simplifies project status reporting Improves Field and Administration productivity by 27% Increases project communication A Project
Management Information Systems Frameworks
 ACS-1803 Introduction to Information Systems Instructor: Kerry Augustine Management Information Systems Frameworks Lecture Outline 3 ACS-1803 Introduction to Information Systems Learning Objectives 1.
User Guide. Version 1.1 9/10/2015
 BILLING SOLUTION User Guide Version 1.1 9/10/2015 TABLE OF CONTENTS ABOUT THIS DOCUMENT... 2 REPORT CODE DEFINITIONS...2 BILLING SOLUTION OVERVIEW... 2 ROCK-POND REPORTS DIVE IN... 2 IS MY PRICING CORRECT?...2
REPORTING ON HISTORICAL CHANGES IN YOUR DATA
 REPORTING ON HISTORICAL CHANGES IN YOUR DATA Summary Get deeper insight and make data-driven decisions by analyzing your organization's activity over over the last three months. Report on Historical Changes
Sage 200 Commercials Datasheet
 Sage 200 Datasheet Sage 200 automates the delivery of your customer orders with effective stock management. By responding to product and pricing demands quickly and effectively you can maintain customer
The why and what of a BPMS Methodology. Salman Akhtar
 The why and what of a BPMS Methodology Salman Akhtar The BPTrends Associates Pyramid Enterprise Level Business Process Level Implementation Level. Human Resource Development Job Design Training Development
Enterprise Performance Management Bridging the Gap from Strategy to Operations
 Enterprise Performance Management Bridging the Gap from Strategy to Operations A White Paper by Guident Technologies, Inc. Adam Getz Business Intelligence Architect May, 2007 2007 Guident 1 Summary In
Grow Your Small Business With Salesforce SELL. SERVICE. MARKET. SUCCEED.
 Grow Your Small Business With Salesforce SELL. SERVICE. MARKET. SUCCEED. Table of Contents Grow Your Small Business With Salesforce 01 02 03 04 05 Introduction The Salesforce Advantage Chapter 1 Make Everyone
ENTERPRISE LIVE USER GUIDE
 MULTI - SITE W ALK - IN SPA HAIR BARBER CLINIC ENTERPRISE LIVE USER GUIDE HOME & MOBILE BEAUTY CONTENTS BASICS... STARTING ENTERPRISE LIVE... NAVIGATING ENTERPRISE LIVE... 2 ACCESS... 3 USING THE ACCESS
Getting Started in the Central Hudson Territory. ESCO Guide Last updated on 7/05/2016
 Getting Started in the Central Hudson Territory ESC Guide Last updated on 7/05/2016 Navigating the Central Hudson Website This link provides access to the Central Hudson Information Center for Retail Suppliers:
Foundation Pack (ID: 14,005,200) Designed for Dynamics NAV 2009 Classic or RTC with 49 great features all in one FOB
 Designed for Dynamics NAV 2009 Classic or RTC with 49 great features all in one FOB") Foundation Pack (ID: 14,005,200) Designed for Dynamics NAV 2009 Classic or RTC with 49 great features all in one FOB Help our environment Do not print this document Why Foundation Pack from Cost Control
Foundation Pack (ID: 14,005,200) Designed for Dynamics NAV 2009 Classic or RTC with 49 great features all in one FOB Help our environment Do not print this document Why Foundation Pack from Cost Control
Infor Property Management-AMSI
 Property Management Infor Property Management-AMSI Use one solution to efficiently manage your operations, control accounting, and create reporting. Designed specifically for the property management industry,
Table of Contents. Contents. Introduction. Program Setup. Locations. Warehouses. Company Settings. PM Schedule Templates.
 Contents I Table of Contents Introduction...1 Program Setup...1 Locations...1 Warehouses...3 Company Settings...5 PM Schedule Templates...8 Adding Equipment...13 Configuring Last...15 PM Data The Home
VISUAL BI EXTENSIONS (VBX) FOR SAP LUMIRA DESIGNER
 FOR SAP LUMIRA DESIGNER") VISUAL BI EXTENSIONS (VBX) FOR SAP LUMIRA DESIGNER Product Roadmap Gopal Krishnamurthy Founder/CEO, Visual BI Solutions www.visualbi.com 2018 Visual BI Solutions, Inc. All rights reserved. Friday March
VISUAL BI EXTENSIONS (VBX) FOR SAP LUMIRA DESIGNER Product Roadmap Gopal Krishnamurthy Founder/CEO, Visual BI Solutions www.visualbi.com 2018 Visual BI Solutions, Inc. All rights reserved. Friday March
Problem Solved
 www.engineeroffice.com Problem Solved We have the solution to your business problems. BQE EngineerOffice is an award-winning time tracking, billing, and project management software for engineers. For more
A digital experience that clicks with your workforce
 Explore enterprise workforce use cases for AI Bots. A digital experience that clicks with your workforce This executive guide provides a quick look into the most common, initial internal bot use cases
Microsoft Dynamics NAV
 Microsoft Dynamics NAV Maximising value through business insight Business Intelligence White Paper November 2016 CONTENTS Reports were tedious. Earlier it would take days for manual collation. Now all
Avoiding Knowledge Management Pitfalls. Ten Common Mistakes and How to Avoid Them
 Avoiding Knowledge Management Pitfalls Ten Common Mistakes and How to Avoid Them Table of Contents Introduction... 1 1. Failure to Set and Track Specific Goals... 1 2. Doing Too Much at Once... 2 3. Starting
EXECUTIVE SUMMARY. Union Metrics unionmetrics.com
 EXECUTIVE SUMMARY Instagram is one of the fastest growing and most popular social media platforms on the planet. If you work in digital marketing, you re probably doing something for your brands or clients
Microsoft Office Project 2010 Basic Course 01: Getting Started
 Microsoft Office Project 2010 Basic Course 01: Getting Started Slide 1 Topic A Project Management Concepts Slide 2 Project Constraints Slide 3 Phases of Project Management The initial Phase Initiating
Contents Getting Started... 9 Sample Dashboards... 17
 Analytics Reference Guide 16 R1 March 2016 Contents Getting Started... 9 About Oracle Primavera Analytics... 10 Prerequisites to Use Primavera Analytics... 11 About Analyses... 11 About s... 12 About
Identify challenges IFTA presents to carriers and the impact it has on carriers.
 White Paper Understanding IFTA Get Smart about IFTA The International Fuel Tax Agreement Executive Summary: Interstate motor carriers have to deal with a wide array of government regulations that demand
IBM Planning Analytics Express
 Performance management and business intelligence for midsize organisations IBM Planning is a performance management (PM) and business intelligence (BI) solution for midsize organisations. It delivers the
New Degree Day History Screen
 This document describes the various enhancements and modifications to DRM Windows that occurred between versions 9.1.270 and 10.2.280. New Degree Day History Screen This screen compares the current heating
Sage 300 ERP 2014 Intelligence Reporting Standard Reports
 Sage 300 ERP 2014 Intelligence Reporting Standard Reports Get a number of ready-to-use reports that give you immediate insight into and across your business. Delivered in the familiar environment of Microsoft
INTRODUCTION COUNTERPOINT REPORTS. KEY REPORTS This report guide includes an overview of CounterPoint s key reports as well as Dashboard.
 Reports Booklet Contents Introduction... 3 Flash Sales... 4 Historical Valuation... 6 Inventory Analysis... 8 Inventory Snapshot... 10 Merchandise Analysis... 12 Purchasing Advice... 16 Sales Analysis
DATA MANAGEMENT BASICS. July 19, 2017 September 8, 2017
 DATA MANAGEMENT BASICS July 19, 2017 September 8, 2017 OBJECTIVES Enthuse evaluative thinking Encourage performance measurement Build knowledge of concepts related to: o Data collection o Data analysis
Build Contacts, Manage Relationships, Get Results
 Build Contacts, Manage Relationships, Get Results ACT! is the world s best selling contact management software with over 120,000 UK registered users. By using Sage ACT!, individuals, small businesses and
Oracle Utilities Analytics Dashboards for Customer Analytics, Revenue Analytics, and Credit & Collections Analytics
 Oracle Utilities Analytics Dashboards for Customer Analytics, Revenue Analytics, and Credit & Collections Analytics Release 2.5.0.0.1 E49003-02 February 2014 Oracle Utilities Analytics Dashboards for Customer
(KPIs) featuring a nancial analysis and Top 5
 featuring a nancial analysis and Top 5") Sage ERP MAS Sage ERP MAS Intelligence Standard Reports Sage ERP MAS Intelligence empowers you to quickly and easily gain control and obtain the information you need from across your business. Using familiar
Sage ERP MAS Sage ERP MAS Intelligence Standard Reports Sage ERP MAS Intelligence empowers you to quickly and easily gain control and obtain the information you need from across your business. Using familiar
DASHBOARDS, INFOGRAPHICS & EXECUTIVE SUMMARIES
 DASHBOARDS, INFOGRAPHICS & EXECUTIVE SUMMARIES AGENDA Context Dashboards Infographics Executive Summaries Questions OPEN & TRANSPARENT DASHBOARDS DASHBOARDS Single Screen Visual Objective Specific
Web-based project management software
 Web-based project management software Track and share your team s projects more efficiently Projects Dashboard WorkZone is easy-to-use, web-based software that gives your team a central place to track
Arena Administrator: Data Audit (Course# A212)
") Arena Administrator: Data Audit (Course# A212) Presented by: Dr. Josh Creason Pastor of Family and Community Life Germantown Baptist Church 2018 Shelby Systems, Inc. Other brand and product names are trademarks
Arena Administrator: Data Audit (Course# A212) Presented by: Dr. Josh Creason Pastor of Family and Community Life Germantown Baptist Church 2018 Shelby Systems, Inc. Other brand and product names are trademarks
Managing cash flow used to be a thorn in my side, but not now
 Managing cash flow used to be a thorn in my side, but not now Discover your business potential with 2013 NEW 2013 makes it easier to keep on top of those essential accounting tasks that keep your business
LICENSE COMPARISON CHART FOR SAP BUSINESS ONE USER TYPES
 LICENSE COMPARISON CHART FOR SAP BUSINESS ONE USER TYPES Module Functionality Professional $3,154 Limited CRM $1,666 Limited Limited Financials Logistics $1,666 $1,666 Administration Create New Company
New Sage 50 Accounts Detailed feature comparisons - Sage Accounts Range
 New Detailed feature comparisons - Sage Range Get up and running Easy to set up and use Company configuration Help centre with online content In a language non accountants can understand View video demos
Introducing the legal research tool you ve been searching for
 Overview Introducing the legal research tool you ve been searching for Search across LexisNexis and selected legal content from the Web Dodd-Frank Innovation through collaboration. Driving better outcomes
Let s Talk about GOOOOOOAAALS!
 Let s Talk about GOOOOOOAAALS! Welcome to the Goals & Conversions worksheet. This is the 2nd supplementary training resource for Paid Search Magic s Audit Month. Goals and Conversions and the tracking
WSIPC Guide to Time Off
 WSIPC Guide to Time Off Contents Contents i About This Guide 1 What You Should Know Before You Start 2 Be Sure You re Signed In 2 How to Use This Guide 2 Navigation Paths 2 Getting Around 2 Screen Shots
NEW RULES OF ERP. At a Glance
 NEW RULES OF ERP At a Glance Today s manufacturer faces an ever-changing set of challenges. Customer requirements, rising numbers of orders, mergers and acquisitions, along with other demands, all impact
FEATURES. Kanban Manage projects and tasks like sticky notes on a whiteboard.
 FEATURES To learn more about TaskRay, the top-rated 100% Salesforce native project management app, schedule a demo by emailing us at sales@bracketlabs.com. VIEWS Kanban Manage projects and tasks like sticky
Enterprise Mass Media Co.
 The Path to Better Marketing Planning and Measurement Annual revenue: >$10B Size of marketing team: 300 Title of key stakeholders: CMO, VP of Marketing & Demand, Director of Marketing Analytics, Marketing
Infor Expense Management
 Infor Expense Management Dhruv Parekh, Solution Consultant, Infor Why Expense Management 2 Knowledge is power Manual or home-grown systems Spend ~$41 processing each expense claim Have trouble reimbursing
efacility - Maintenance Management System
 efacility - Maintenance Management System SIERRA ODC Private Limited 1.1 Maintenance Management System efacility - Maintenance Management System efacility an outstanding Tool, which acts as a powerful
Key Performance Indicator (KPI) Visualization Tools for Lean Manufacturing Facilities
 Visualization Tools for Lean Manufacturing Facilities") Key Performance Indicator (KPI) Visualization Tools for Lean Manufacturing Facilities As a production process becomes more complex, the availability and exchange of information become more critical to
Key Performance Indicator (KPI) Visualization Tools for Lean Manufacturing Facilities As a production process becomes more complex, the availability and exchange of information become more critical to
What s New. Enhanced End-to-End Customer Relationships & Processes with Maximizer CRM 10.5 Freedom
 What s includes new features and key enhancements in the following areas: 1. Mobile 2. Web Access 3. Marketing Automation 4. Business Intelligence 5. Social Networking 6. Business Productivity Enhanced
Dashboard. Best Practices Guide. Copyright 2016 Yellowfin International Pty Ltd
 Dashboard Best Practices Guide 1 #1 #2 #3 #4 #5 #6 #7 #8 #9 #10 Dashboard Best Practices Why dashboards? Page 3 Purpose Who is your intended audience? Page 4 Summarize Focus on a single subject area per
Razvan IONITA 27 Oct 2016 UNIFORMANCE SUITE. Delivers New Process Intelligence Capabilities
 Razvan IONITA 27 Oct 2016 UNIFORMANCE SUITE Delivers New Process Intelligence Capabilities Did you know the Uniformance Suite enables 1 A global oil and gas producer to manage over 10 million data points
Drowning In A Sea of Data
 1 Drowning In A Sea of Data Data is the lifeblood of business. Its volume, velocity, variety and complexity is bigger and growing faster than ever. Organizations are struggling to keep up and find themselves
Index. Sarah Critchley 2018 S. Critchley, Dynamics 365 CE Essentials,
 A Accounts and contacts activities activities tab, 37 advantage of, 32 business, 29 capabilities, 35 case resolution form, 33 configuration, 36 definition, 28 feature, 29 filter, 38 form component, 34
CLINIC CONTROLLER MANAGE YOUR ENTIRE PRACTICE REPORTING REPORTING REPORTING COVER
 CLINIC CONTROLLER EMR COVER SCHEDULING BILLING MANAGE YOUR ENTIRE PRACTICE WWW.A2CMEDICAL.COM We know how hard it is to choose an EMR / Practice Management System. This brochure provides only a brief overview
Lanteria HR Core HR
 Lanteria HR 2013 - Core HR User's Guide for version 4.2.0 Copyright 2015 Lanteria Table of Contents 1 Introduction... 4 1.1 The Core HR Module Overview... 4 1.2 Terminology List... 4 2 Core HR Dashboard...
Visualization & Dashboard Design with Excel Monitor and display performance more effectively with advanced visualization techniques and dashboards.
 Visualization & Dashboard Design with Excel Monitor and display performance more effectively with advanced visualization techniques and dashboards. What to Expect? This two-day training demonstrates how
Instant Care. Connect with a doctor and start feeling better now. Lauren Duffy UX Design 59 3/26/18
 Instant Care Connect with a doctor and start feeling better now. Lauren Duffy UX Design 59 3/26/18 I can t connect with a doctor immediately when I m dealing with a non-urgent health issue. HYPOTHESIS
QT9 ERP Job Management Software. Compliance. Paperless. User Friendly. Powerful.
 Compliance. Paperless. User Friendly. Powerful. SOFTWARE FEATURES Email Alerting Configure email alerts for inventory level of both your raw materials and your finished goods Outlook Integration Create
Make Your Projects Perform
 Make Your Projects Perform The Project Management Software Beyond Project Management Software Experience the Power of the Market Leader* InLoox PM for Outlook is the intelligent solution for successful
White paper. The impact of bad contact data quality
 White paper The impact of bad contact data quality Table of contents: Introduction...1 Data quality is top of mind...2 Contact data inaccuracies persist...3 Data quality stewardship...4 Best practices
Welcome to the 404 Institute Webcast
 Welcome to the 404 Institute Webcast Leveraging data analytics and continuous auditing processes for improved audit planning, effectiveness, and efficiency Thursday, October 25, 2012 2:00 p.m. 3:00 p.m.
Verity. election software like no other. integrated end-to-end election management VERITY DATA BUILD CENTRAL COUNT. tabulation and reporting
 Verity election software like no other VERITY DATA BUILD CENTRAL COUNT election data management election definition absentee / by-mail scanning tabulation and reporting integrated end-to-end election management
April Microsoft Corp. All rights reserved
 Select the right tools for today and tomorrow. Microsoft Project 2010 offers flexibility and choice by providing tailored work management solutions for individuals, teams and the enterprise. April 2010