Air Quality Report for the North Meadows Extension to US 85 and Interstate 25
|
|
|
- Phillip Cobb
- 5 years ago
- Views:
Transcription

1 for the North Meadows Extension to US 85 and Interstate 25 March 2010 Prepared for: Town of Castle Rock Douglas County Colorado Department of Transportation Federal Highway Administration Prepared by: Felsburg Holt & Ullevig 6300 S. Syracuse Way, Suite 600 Centennial, CO CDOT Project CC Douglas County Project CI FHU Project No
2 This Page Left Intentionally Blank
3 TABLE OF CONTENTS Page 1.0 Introduction Purpose Project Description Analysis Approach Affected Environment Local Setting National Ambient Air Quality Standards Overview NAAQS Monitoring Data Overview Transportation and Circulation System Sensitive Receptors Other Air Quality Considerations Environmental Consequences Transportation and Circulation System Sensitive Receptors Carbon Monoxide Results Particulate Matter Results Ozone Toxic Air Pollutants Construction Impacts Mitigation Summary Cumulative Impacts Global Climate Change Cumulative Effects Discussion References Page i
4 LIST OF FIGURES Page Figure 1 Study Area Figure 2 Prevailing Winds, CDOT Founders Point Weather Station Figure 3 Predicted National MSAT Emissions Figure 4 Modeled Intersections and Sensitive Areas LIST OF TABLES Table 1 National Ambient Air Quality Standards Table 2 Study Area 2030 Intersection Levels of Service (AM/PM) Table 3 Maximum Modeled Carbon Monoxide Concentrations Table 4 Carbon Dioxide Emissions Data APPENDIX APPENDIX A CAL3QHC MODEL OUTPUT FILES Page ii
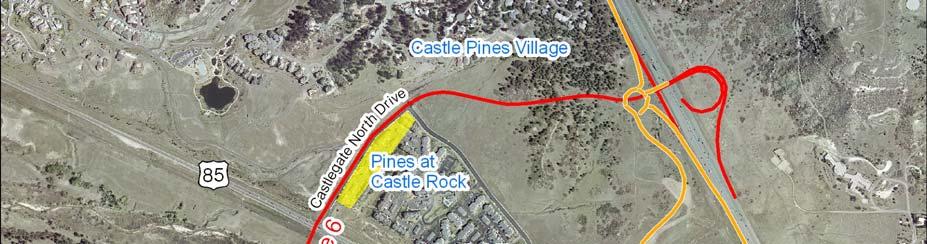
5 1.0 INTRODUCTION The National Environmental Policy Act (NEPA) of 1969 established a mandate for federal agencies to consider the potential environmental consequences of their proposed actions, to document the analysis, and to make the information available to the public for comment prior to implementation. In accordance with NEPA and related regulations, the Federal Highway Administration (FHWA), as the Lead Agency, in cooperation with the Colorado Department of Transportation (CDOT) as a Joint Lead Agency, has prepared this (EA) for a proposed extension of North Meadows Drive from The Meadows area to US Highway 85 (US 85) and to Interstate 25 (I-25) in Douglas County, Colorado. The proposed North Meadows Extension would cross the Burlington Northern Santa Fe (BNSF) Railway, East Plum Creek, and the Union Pacific Railroad (UPRR) (Figure 1 Study Area). The project is sponsored by the Town of Castle Rock and Douglas County. The US Department of the Interior Fish and Wildlife Service (USFWS) is a Cooperating Agency. 1.1 Purpose The purpose of the air quality document is to present the overall analysis that was performed as part of the EA to assess potential air quality impacts from the proposed transportation improvements. The overall analysis evaluates the emissions levels of both criteria air pollutants and mobile source air toxics in accordance with the Clean Air Act and its amendments for designated nonattainment and/or attainment/maintenance areas. Emissions of these pollutants are a concern because of the potential risk to public health (Section 2.0). For overall perspective, there has been a trend of decreasing total pollutant emissions nationwide from mobile sources for several decades, even when allowing for the growing number of vehicle miles of travel (VMT). These improving results are due to a number of successful emission control regulations. On-road sources account for varying amounts of the overall emissions but tend to be declining even though national VMT more than doubled over the past 30 years. Advances in vehicle technology as well as cleaner fuels have been major reasons for the improvements. Several recent federal regulations on vehicle emissions are expected to continue the trend of improvement and further lower vehicle emissions in the future. 1.2 Project Description The study area is in north Castle Rock and includes residences, businesses, schools and undeveloped areas abutting the streets and roads of interest for the project. The study area includes developing areas, so more homes and businesses are expected in the area in the future. Two future build alternatives, and the No-Build Alternative, are being considered in the analysis. The No-Build Alternative (No-Build) has no new road improvements as part of this project, though some changes to the current road network may be made by other projects. Refined Alternatives 6 and 7 would establish a new interchange on I-25 and a differing 4-lane road connection between I-25 and Meadows Boulevard (Figure 1 Study Area). For additional details on the alternatives and improvements, refer to the EA document. Page 3

6 Figure 1 Study Area Page 4
7 1.3 Analysis Approach Consultations were held among the Town of Castle Rock, FHWA, CDOT, the Colorado Department of Public Health and Environment-Air Pollution Control Division (APCD) and the Environmental Protection Agency (EPA) to discuss air quality issues related to the project and to select the most appropriate approach for this study. The decision was made that the air quality analysis for the project should consist of several components: Review the regional conformity modeling for the current fiscally-constrained regional transportation plan (RTP) and transportation improvement program (TIP) to show and ensure that the project alternatives are compatible with the State Implementation Plans (SIPs). (The conformity modeling is done by the Denver Regional Council of Governments [DRCOG] as part of the regional planning and conformity demonstration activities.) A project-level hot-spot analysis for carbon monoxide to show that the proposed actions will not cause local violations of the National Ambient Air Quality Standards (NAAQS). Intersections that could be potential hot-spots have been identified and analyzed for local conformity. Project-level qualitative analyses for particulate matter and toxic pollutants. Regional Conformity In air quality non-attainment and maintenance areas, the Clean Air Act requires that RTPs, TIPs and individual projects can not: cause new violations of a NAAQS increase the frequency or severity of existing violations of the NAAQS delay attainment of the NAAQS The transportation conformity process is the mechanism used by the responsible metropolitan planning organization (DRCOG) to assure that the requirements of the Clean Air Act are met for planned transportation improvements within the region. The fiscally-constrained RTP and TIP must identify all projects that are expected to receive federal funds or that will require FHWA or Federal Transit Administration approval. These projects and other regionally-significant projects regardless of funding source must be included in a regional emissions analysis that demonstrates conformity to the SIPs to comply with the Clean Air Act. Road improvement projects can not be built unless the regional road system in aggregate conforms to the regional SIPs. Individual projects can demonstrate regional conformity by being part of a conforming fiscally-constrained RTP, which looks at longer-range transportation planning, and either a TIP, which includes projects likely to proceed in the next few years, or the road network used for the RTP/TIP conformity document. The 2035 RTP (DRCOG, 2007) and the TIP (DRCOG, 2008a) are the adopted fiscally-constrained conforming plans for DRCOG. The proposed I-25 interchange within this project is included in the 2035 RTP (DRCOG, 2007), and in Conformity of the Fiscally Constrained 2035 Regional Transportation Plan and the Transportation Improvement Program with the State Implementation Plan for Air Quality (DRCOG, 2008b), thus demonstrating regional air quality conformity for the project. Page 5
8 Local Conformity Individual projects within air quality nonattainment or maintenance areas, such as the Denver metropolitan area, must demonstrate that they will not cause violations of the NAAQS in localized areas known as hot spots. Three NAAQS pollutants are primary concerns for the Denver region (carbon monoxide [CO], suspended particulate matter [PM 10 ] and ozone [O 3 ]), but only two (CO and PM 10 ) are potential hot spot pollutants. CO hot spots are most likely to be a concern where traffic is very congested and slow moving, such as at congested, high-volume intersections. The majority of PM 10 emissions from vehicles are from road dust, so a hot spot is most likely in areas with high traffic volumes traveling at relatively high speeds on unswept roads. In contrast, O 3 is influenced by regional pollutant emissions and is not a hot spot concern. Between CO and PM 10, an approved quantitative method for hot spot analysis is available only for CO; no dispersion models have been approved for PM 10. Therefore, hot spot modeling for NAAQS pollutants other than CO or for other pollutants from mobile sources is not possible because there are no accepted EPA guidelines for hot spot analyses at this time. PM 10 was evaluated for conformity through a qualitative assessment (Section 3.4 Particulate Matter Results). The methods for each are described below. Carbon Monoxide Areas likely to become CO hot spots are identified based primarily on traffic volumes and congestion, and a determination is then made whether a detailed analysis is needed for each area. Generally, the need for CO hot spot analysis is assessed with respect to three criteria, as provided by EPA: The Level of Service (LOS) of a project intersection will be D, E or F The project affects locations identified in the SIP as sites of actual or potential violations of the CO NAAQS A project intersection is one of the top three in the SIP with respect to highest traffic volume or worst LOS The goal of the intersection selection process is to choose the most congested and heavily trafficked intersections for CO analysis (Section 3.3), with these worst-case intersections also representing less congested intersections and areas. If an area intersection meets one of the above criteria, it may be modeled for CO concentrations. If the congested intersections do not show hot spot problems, less congested intersections will not either. If an intersection does not meet one of the above criteria, it is unlikely to be a hot spot and need not be assessed further. Particulate Matter Unlike CO pollution, quantitative tools for analysis of particulate matter pollution have not been developed and approved for mobile sources. Therefore, a qualitative process was used for the analysis of PM 10. NAAQS violations for PM 2.5 are not a concern anywhere in Colorado (Section 2.2 National Ambient Air Quality Standards Overview), therefore PM 2.5 was not included. The qualitative analysis follows both the procedures in the transportation conformity rule (EPA, 2006a) and the most recent EPA/FHWA guidance (FHWA, 2006a). The guidance requires that PM 10 hotspot analyses address the following elements: Description of the project (location, design and scope; date project is expected to be open) Description of existing conditions and changes resulting from the project Page 6
9 Contributing factors o Air Quality o Transportation and traffic conditions o Built and natural environment o Meteorology, climate and seasonal data o Adopted emissions control measures Description of analysis method chosen Description of type of emissions considered in the analysis (e.g., exhaust, road dust, construction emissions) Description of analysis years; consider full time frame of area s RTP, and examine year or years in which emissions are expected to peak Professional judgment of impact Evaluate both forms of PM 10 standard (24-hour and annual) Discuss any mitigation measures Written commitments for mitigation Conclusion on how project meets the requirements of 40 CFR and These items are discussed in detail in Section 3.4 Particulate Matter Results. Section (b)(1) of the latest conformity rule only requires hotspot analysis for projects of air quality concern, which are defined as projects which feature a large volume of diesel traffic. However, this provision does not apply in Colorado because Colorado s Regulation 10, which contains Colorado s conformity requirements, is based on an older version of the federal transportation conformity rule that does not reflect this provision. Thus, particulate matter hotspot analyses are required for all non-exempt federal projects in Colorado s PM 10 maintenance areas, so whether this project would be a project of air quality concern is not relevant. Section (b)(1) of the federal rule will only apply in Colorado when Regulation 10 has been revised to reflect the most recent federal requirements and the revision has been approved by EPA. Page 7
10 This Page Left Intentionally Blank Page 8
11 2.0 AFFECTED ENVIRONMENT The project is near the largest metropolitan area in Colorado. Based on the 2000 census, the 7-county Denver metropolitan area has approximately 2.4 million residents. The primary air quality issues of concern for this project are pollutants associated with operation of vehicles on roadways. These issues include direct emissions of pollutants from vehicles, secondary pollutants formed from direct emissions, and road dust. Air quality issues related to road construction are also a potential short-term concern. 2.1 Local Setting The study area lies in foothills south of the Denver metropolitan area. The study area elevations are generally between 6,000 and 6,200 feet above sea level. To the west is the much higher Front Range of the Rocky Mountains while to the east and lower in elevation is the Great Plains. The study area includes a significant local drainage in Plum Creek. The coldest month for the study area usually is January, with an average daily temperature range of degrees Fahrenheit. The warmest month usually is July, with an average daily temperature range of degrees Fahrenheit. Thermal inversions are known to occur in the study area during times of low winds. The study area generally receives about 19 inches of precipitation annually, with the wettest months generally May and April. Prevailing winds in the study area can be somewhat variable due to local topography, but the prevailing winds near ground surface tend to be from the south (Figure 2 Prevailing Winds, CDOT Founders Point Weather Station). 2.2 National Ambient Air Quality Standards Overview The Clean Air Act of 1970 and its amendments led to the establishment by EPA of the NAAQS for the criteria air pollutants: CO, sulfur dioxide, O 3, PM 10, nitrogen dioxide and lead (Table 1 National Ambient Air Quality Standards). In 1997, EPA changed the O 3 standard (which was revised again in 2008) and added a new standard for very fine particulate matter (PM 2.5 ), though implementation of these two NAAQSs was delayed until EPA is also currently evaluating lowering the nitrogen dioxide NAAQS, but the NAAQS is not expected to change during this project. Motor vehicles are important contributors of CO, O 3, nitrogen dioxide and particulate matter, so only these criteria pollutants will be discussed in detail below. Under the Clean Air Act, cities and regions were required to determine their compliance with the NAAQSs. Areas that met the NAAQS were classified as attainment areas while areas that did not meet a NAAQS were classified as nonattainment for that NAAQS. These classifications are long term and do not change often. The Denver metropolitan area has been in attainment of the sulfur dioxide, nitrogen dioxide and lead NAAQSs for more than 30 years. The Denver metropolitan area was a nonattainment area for CO, O 3 (1-hour), and PM 10 beginning in the early 1970 s, so those three pollutants have historically been concerns in the Denver region. The region included in the nonattainment areas were all or parts of the following counties: Denver, Jefferson, Boulder, Adams, Arapahoe, Douglas and Broomfield. A number of successful air quality improvement actions over many years resulted in cleaner air and the Denver region meeting all of the NAAQS that were in force in The Denver region was reclassified by EPA as attainment/maintenance areas in 2001 and 2002 for CO, O 3 (1-hour) and PM 10 and regional maintenance plans were developed for all three pollutants. The study area is within all three of these maintenance areas. Page 9
12 Nonattainment areas for the new PM 2.5 and 8-hour O 3 NAAQSs were designated by EPA in No areas in Colorado have been designated as nonattainment for PM 2.5, so it is not a major issue in the state. However, O 3 is again a concern in the Denver region. The Denver region officially became a nonattainment area for the 8-hour O 3 NAAQS on November 20, The nonattainment area includes the 7-county metropolitan area plus parts of Larimer and Weld Counties. Carbon Monoxide CO is an odorless, colorless gas that is most commonly formed by incomplete combustion of fuel. CO is dangerous because it interferes with the body s ability to absorb oxygen. High concentrations of CO can cause dizziness, headaches, loss of vision, impaired dexterity and even death, if the concentration is high enough. Major sources of CO include vehicle exhaust, coal burning and forest fires. CO is most commonly a concern in localized areas around the CO sources, such as near congested road intersections. CO can be a regional concern if concentrations are high enough and disperse into the surrounding area. Table 1 National Ambient Air Quality Standards Pollutant Averaging Time Primary Standard Carbon Monoxide Sulfur Dioxide 8 hours 9 ppm 1 hour 35 ppm Annual 0.03 ppm 24 hours 0.14 ppm 8 hour (2008) ppm Ozone 8 hour (1997) 0.08 ppm 1 hour 0.12 ppm Particulate Matter <10 µm (PM 10 ) 24 hours 150 µg/m 3 Particulate Matter <2.5 µm (PM 2.5 ) Annual 15 µg/m 3 24 hours 35 µg/m 3 Nitrogen Dioxide Annual ppm Lead Quarterly 0.15 µg/m 3 SOURCE: EPA, Note: ppm = parts per million µg/m 3 = micrograms per cubic meter µm = micrometers Page 10
13 Figure 2 Prevailing Winds, CDOT Founders Point Weather Station SOURCE: CDOT, Particulate Matter Particulate matter (both PM 10 and PM 2.5 ) is a complex mix of very small solid particles and liquid droplets. Particulate matter is a concern because it can be inhaled deeply into the lungs and can interfere with lung function or lead to other health effects. Particulate matter can aggravate asthma, diminish lung capacity and cause lung or heart problems. Particulate matter can also cause haze. Sources of particulate matter include road dust, smoke and diesel engine exhaust. Particulate matter can be a concern around sources, but winds can disperse particulate matter over a larger area and cause regional concerns. Ground Level Ozone Ground-level O 3 is a gas that is not typically emitted by any common sources; rather it is formed by chemical reactions between other pollutants in the atmosphere. Nitrogen oxides (NOx) and hydrocarbons in the presence of sunlight and certain weather conditions can form O 3. O 3 is a strong oxidizing agent and can damage cells in lungs and plants. O 3 can cause eye irritation, coughing and lung damage. There are not specific sources of O 3 because it is rarely emitted directly. However, O 3 concentrations are affected through the precursor pollutants NOx and hydrocarbons. Automotive sources of NOx include vehicle exhaust. Automotive sources of hydrocarbons include fuel evaporation and incomplete combustion of fuel. O 3 is a regional concern because it takes time for O 3 to form and the pollutants can drift a considerable distance in that time (California Air Resources Board [CARB], 2002). Rural/undeveloped areas can have O 3 Page 11
14 problems because of transported pollutants, even if there are not major local emissions of precursors (CARB, 2002). Nitrogen Dioxide The atmosphere is about 80 percent nitrogen gas. When fuel is burned at high temperature in air, the nitrogen can react with oxygen to form gases such as nitrogen dioxide and other NOx compounds. NOx can contribute to O 3 formation, particulate matter formation and acid deposition. Common sources of nitrogen oxides are vehicles and electrical utilities. Nitrogen dioxide can damage cells in lungs and plants and damage water quality. Nitrogen dioxide can be transported over great distances and is a regional concern. 2.3 NAAQS Monitoring Data Overview There are several air quality monitoring stations in the Denver region that measure the criteria air pollutants, however none are close to the study area. The closest active monitoring stations and the pollutant data used for the EA from each are: Chatfield monitor (PM 2.5, O 3 ) 1300 Blake Street-Denver (CO) 678 S. Jason Street-Denver (PM 10 ) CAMP-downtown Denver (nitrogen dioxide) Monitoring stations at other locations in the region have been active in the past. The stations listed above are outside the study area, but overall these stations provide the monitoring data nearest the study area. The most recent complete data set from these stations when the analysis was performed was for In 2007, none of the NAAQS levels were exceeded for CO, PM 10, PM 2.5, O 3 (1-hour) or nitrogen dioxide. The 8-hour O 3 NAAQS has been violated in the Denver region but the concentrations at Chatfield just meet the 1997 NAAQS. Monitoring data for the three pollutants subject to maintenance plans in the Denver region (CO, PM 10 and O 3 ) are summarized below. Carbon Monoxide Measured concentrations of CO in the Denver region have not violated the NAAQS since 1995 (CAQCC, 2004a). For the CO station, the 2007 measured values for NAAQS comparison for 1 hour and 8 hours are 4.1 ppm and 2.4 ppm, respectively. These values are below their respective NAAQS (Table 2 Study Area Intersection Level of Service (AM/PM). Particulate Matter For the PM 10 station, the 2007 measured values for NAAQS comparison for 24 hours is 67 µg/m 3. There was an exceedence of the NAAQS calculated for Commerce City in 1999, but measured concentrations of PM 10 in the Denver region generally have not violated the NAAQS since 1993 (CAQCC, 2004a). For the PM 2.5 station, the 2007 measured values for NAAQS comparison for 24 hours and annual were 19 µg/m 3 and 6.8 µg/m 3, respectively. These values are below their respective NAAQS (Table 2 Study Area Intersection Level of Service (AM/PM). Page 12
15 Nitrogen Dioxide and Ozone Nitrogen dioxide is a criteria pollutant and an O 3 precursor. For the nitrogen dioxide station, the 2007 measured value for NAAQS comparison for annual average is ppm. The other major O 3 precursor pollutant (hydrocarbons) is not an NAAQS pollutant. For the O 3 monitoring station, the 2007 measured value for NAAQS comparison for 1 hour is ppm and for 8 hours is ppm. The three-year average of the fourth-highest 8-hour O 3 concentrations at Chatfield was ppm in The measured O 3 concentrations were below the 1-hour NAAQS and the 8-hour concentrations just did meet the 1997 NAAQS (through data rounding requirements) but would not have met the 2008 NAAQS. The high O 3 concentrations have been in the western metropolitan area and have not been in the study area. 2.4 Transportation and Circulation System The transportation and circulation system evaluated for this report was the streets and highways within the study area (Figure 1 Study Area) that were likely to be impacted by changes in traffic patterns by the alternative. This group of roads consisted of: I-25 US 85 Meadows Parkway Meadows Boulevard North Meadows Drive Atrium Drive Castlegate Drive North Data pertaining to traffic volumes and LOS in this report are drawn from the traffic study (FHU, 2008). The LOSs of the various intersections of interest to the project were assessed for morning and afternoon peak traffic hours (Table 2 Study Area Intersection Level of Service (AM/PM)). LOSs provide an indication of intersection congestion and likely hot spots for air pollutants from vehicles. LOS A describes the best traffic operation of free-flowing, light volume traffic and LOS F represents the worst condition of heavy traffic congestion. Table 2 Study Area 2030 Intersection Levels of Service (AM/PM) Intersection Refined Alternative 6 (2030) Refined Alternative 7 (2030) I-25 Interchange Ramp Connections Not applicable A/A Meadows Blvd. & N. Meadows Dr. D/D D/D Meadows Blvd. & Meadows Pkwy. C/D D/D US 85 & Meadows Pkwy. E/E E/E N. Meadows Dr. & Butterfield C/B C/B US 85 & Castlegate Dr. N. B/B D/C US 85 & Atrium Dr. C/C B/B SOURCE: FHU, Page 13
16 I-25 is one of the largest freeways in the state and carries a corresponding volume of traffic. I-25 has three through lanes in each direction in the study area with additional merge/diverge lanes at the interchanges. I-25 currently carries a traffic load of about 91,000 vehicles per day in the study area. US 85 is a regional arterial in the project corridor. US 85 generally has two through lanes each direction with additional turn lanes at the various intersections, but necks down to one lane around Castlegate Drive North to the north. US 85 currently carries a traffic load of about 19,000 vehicles per day. Meadows Parkway is an arterial in the project corridor. Meadows Parkway has two through lanes in each direction with additional turn lanes at the various intersections. Meadows Parkway currently carries a traffic load of about 23,000 vehicles per day. Meadows Boulevard is an arterial in the project corridor. Meadows Boulevard has two through lanes each direction with additional turn lanes at the various intersections. Meadows Boulevard currently carries a traffic load of about 18,000 vehicles per day. North Meadows Drive currently is a two-lane arterial, planned for four lanes, that ends near Butterfield Crossing. The proposed project would expand this street to four lanes and extend it to US 85. North Meadows Drive currently carries a traffic load of about 7,000 vehicles per day in the study area. Atrium Drive and Castlegate Drive North currently are very short streets in a partially developed area and carry relatively little traffic. The build alternatives would expand one of these streets to four lanes and extend it to connect I-25 with US Sensitive Receptors Locations where people spend extended periods of time are likely to be the most sensitive receptors. The receptors most likely to be directly affected by pollutants from project roads are those receptors closest to the roads. These types of locations in the study area include homes, schools and parks. There are approximately 34 developed properties within about 100 feet of the major roads that were examined within the study area. 2.6 Other Air Quality Considerations Two other air quality topics that were considered were toxic air pollutants and general construction activities. Toxic Air Pollutants FHWA has released interim guidance on when and how to analyze Mobile Source Air Toxic pollutants (MSATs) in the NEPA process for highways (FHWA, 2006). The following discussion is in accordance with the interim guidance. Background In addition to the criteria air pollutants for which there are NAAQS, EPA also regulates air toxics. Most air toxics originate from human-made sources, including on-road mobile sources, non-road mobile sources (e.g., airplanes), area sources (e.g., dry cleaners) and stationary sources (e.g., factories or refineries). The group of 21 MSATs that has been identified by EPA is a subset of the 188 air toxics defined by the Clean Air Act. MSATs are compounds emitted from highway vehicles and non-road Page 14
17 equipment. Some toxic compounds are present in fuel and are emitted to the air when the fuel evaporates or passes through the engine unburned. Other toxics are emitted from the incomplete combustion of fuels or as secondary combustion products. Metal air toxics also result from engine wear or from impurities in oil or gasoline (EPA, 2000b). EPA is the lead Federal Agency for administering the Clean Air Act and has certain responsibilities regarding the health effects of MSATs. EPA issued a Final Rule on Controlling Emissions of Hazardous Air Pollutants from Mobile Sources (EPA, 2001). This rule was issued under the authority in Section 202 of the Clean Air Act. Through the rule, EPA examined the impacts of existing and newly promulgated mobile source control programs, including the reformulated gasoline program, the national low emission vehicle standards, the Tier 2 motor vehicle emissions standards and gasoline sulfur control requirements, and the proposed heavy duty engine and vehicle standards and on-highway diesel fuel sulfur control requirements. Through this rule, EPA identified a reduced list of six priority MSATs: acetaldehyde, benzene, formaldehyde, diesel exhaust, acrolein, and 1,3-butadiene (EPA, 2001). Between 2000 and 2020, FHWA projects that even with a 64 percent increase in VMT, these programs will reduce on-highway emissions of benzene, formaldehyde, 1,3-butadiene, and acetaldehyde by 57 percent to 65 percent, and will reduce on-highway diesel particulate emissions by 87 percent (Figure 2 Predicted National MSAT Emissions). EPA is preparing another rule under authority of Section 202(l) of the Clean Air Act that will address these issues and could make adjustments to the full 21 and the six primary MSATs. Figure 3 Predicted National MSAT Emissions U.S. Annual Vehicle Miles Traveled vs. Mobile Source Air Toxics Emissions, ,000 Miles Traveled (trillions/year) VMT (+64%) 3 100,000 Benzene (-57%) DPM+DEOG (-87%) Emissions (tons/year) Formaldehyde (-65%) Acetaldehyde (-62%) 1,3-Butadiene (-60%) Acrolein (-63%) Notes: For on-road mobile sources. Emissions factors were generated using MOBILE6.2. MTBE proportion of market for oxygenates is held constant, at 50%. Gasoline RVP and oxygenate content are held constant. VMT: Highway Statistics 2000, Table VM-2 for 2000, analysis assumes annual growth rate of 2.5%. "DPM + DEOG" is based on MOBILE6.2-generated factors for elemental carbon, organic carbon and SO4 from diesel-powered vehicles, with the particle size cutoff set at 10.0 microns. SOURCE: FHWA, Page 15
18 Benzene is unique among the primary six MSATs in that it is present both in fuel and in tailpipe emissions, while the other priority MSATs are generally only in tailpipe emissions. Therefore, benzene emissions can come from more sources than the other priority MSATs and are directly affected by more regulatory controls such as Tier 2 and reformulated gasolines. Summary of Existing Credible Scientific Evidence Relevant to Evaluating the Impacts of MSATS Research into the health impacts of MSATs is ongoing. For different emission types, there are a variety of studies that show that some emissions either are statistically associated with adverse health outcomes through epidemiological studies (frequently based on emissions levels found in occupational settings) or that animals demonstrate adverse health outcomes when exposed to large doses. Exposure to toxics has been a focus of a number of EPA efforts. Most notably, EPA conducted the National Air Toxics Assessment (EPA, 1996; EPA, 2006b) to evaluate modeled estimates of human exposure applicable to the county level. While not intended for use as a measure of or benchmark for local exposure, the modeled estimates best illustrate the levels of various toxics when aggregated to a national or State level. EPA is in the process of assessing the risks of various kinds of exposures to these pollutants. The EPA Integrated Risk Information System (IRIS) is a database of human health effects that may result from exposure to various substances found in the environment. The IRIS database is located online at The following toxicity information for the six prioritized MSATs and two other substances of potential concern (naphthalene and polycyclic organic matter) was taken from the IRIS database Weight of Evidence Characterization summaries. This information is taken verbatim from EPA s IRIS database and represents the Agency s most current evaluations of the potential hazards and toxicology of these chemicals or mixtures. Benzene is characterized as a known human carcinogen. The potential carcinogenicity of acrolein cannot be determined because the existing data are inadequate for an assessment of human carcinogenic potential for either the oral or inhalation route of exposure. Formaldehyde is a probable human carcinogen, based on limited evidence in humans, and sufficient evidence in animals. 1,3-butadiene is characterized as carcinogenic to humans by inhalation. Acetaldehyde is a probable human carcinogen based on increased incidence of nasal tumors in male and female rats and laryngeal tumors in male and female hamsters after inhalation exposure. Diesel exhaust is likely to be carcinogenic to humans by inhalation from environmental exposures. Diesel exhaust as reviewed in this document is the combination of diesel particulate matter and diesel exhaust organic gases. Diesel exhaust also represents chronic respiratory effects, possibly the primary non-cancer hazard from MSATs. Prolonged exposures may impair pulmonary function and could produce symptoms, such as cough, phlegm, and chronic bronchitis. Exposure relationships have not been developed from these studies. Naphthalene is a possible human carcinogen. Acute exposure may cause cataracts or hemolytic anemia in children and infants after oral or inhalation exposure or after maternal exposure during pregnancy. Page 16
19 Polycyclic organic matter includes several compounds common in combustion which are considered to be human carcinogens. There have been other studies that address MSAT health impacts in proximity to roadways. The Health Effects Institute, a non-profit organization funded by EPA, FHWA, and industry, has undertaken a major series of studies to research near-roadway MSAT hot spots, the health implications of the entire mix of mobile source pollutants, and other topics. The final summary of the series is not expected for several years. Some recent studies have reported that proximity to roadways is related to adverse health outcomes, particularly respiratory problems (South Coast Air Quality Management District, 2000; Sierra Club, 2004; and Environmental Law Institute, 2005). Much of this research is not specific to MSATs, but instead surveys the full spectrum of both NAAQS and other pollutants. The FHWA cannot evaluate the validity of these studies, but more importantly, the studies do not provide information that would be useful to alleviate the uncertainties listed above and enable a more comprehensive evaluation of the health impacts specific to this project. Construction Finally, air quality impacts from construction can be a concern. Long-term construction projects near sensitive receptors can represent health concerns. As with MSATs, there are no ambient air standards specifically for construction or direct mechanisms for assessing such impacts. Page 17
20 This Page Left Intentionally Blank Page 18
21 3.0 ENVIRONMENTAL CONSEQUENCES Because of the past and present regional air quality challenges in the Denver metropolitan area (including Castle Rock), infrastructure projects that might exacerbate the air quality problems must meet certain requirements before they can proceed. In general, projects of the type considered in the EA must be analyzed with respect to the potential impact on air quality at both the regional and local levels. The region of influence examined for air quality in this project is around the highways and streets described in Section 2.4 Transportation and Circulation System. 3.1 Transportation and Circulation System The EA is examining possible future changes to the highway and street network in the study area. The future transportation and circulation system may be similar in many ways to the existing system. Some roads may be widened, some intersections may be improved, and completely new roads may be built. The changes to area roads were previously described in Section Sensitive Receptors The receptors most likely to be directly affected by pollutants from project roads are those receptors closest to the roads (Figure 4 Modeled Intersections and Sensitive Areas). The alternative being considered could bring higher traffic volumes closer to some receptors. There are approximately 34 developed properties within about 100 feet of the study area roads that were examined. This includes the Castle View High School campus and several homes. 3.3 Carbon Monoxide Results Two study area intersections predicted to function at LOS D or worse in 2030 (Table 2 Study Area Intersection Level of Service (AM/PM)) were selected for CO hot spot analysis: US 85/Meadows Parkway and Meadows Boulevard/North Meadows Drive (Figure 4 Modeled Intersections and Sensitive Areas). The 2030 conditions for both intersections are nearly identical for Refined Alternatives 6 and 7 identical intersection configurations with at most tiny differences in predicted turning movements. Therefore, a single evaluation applies to both build alternatives for these intersections and the Refined Alternative 7 conditions were used. Two conditions were examined for the build alternatives, represented by Refined Alternative 7. First, predicted Year 2030 conditions were modeled and reviewed. Second, a worst case situation was also modeled and reviewed for each intersection to ensure that the year of maximum CO emissions was considered. For this worst case model, the highest CO emissions factors (2008) were combined with the highest traffic volumes (2030). These artificial conditions were purposely devised to overstate the maximum CO concentrations associated with the project to ensure that the maximum potential CO concentrations were adequately considered. The afternoon peak hour traffic volumes were used because they are higher. The model results were compared to the NAAQS. Page 19


22 Figure 4 Modeled Intersections and Sensitive Areas Page 20
23 The CO model results are summarized in Table 3 Maximum Modeled Carbon Monoxide Concentrations. The model output data (Appendix A) have been corrected for altitude within CAL3QHC. The CAL3QHC model provides 1-hour average CO concentrations which must then be added to background CO concentrations. To calculate 8-hour CO results, the 1-hour model results were multiplied by a persistence factor of 0.57 and added to the 8-hour background CO concentrations, following APCD and CDOT guidance. This correction is needed because the average hourly traffic over eight consecutive hours will be less than the peak hour traffic that is modeled, and the meteorological conditions including wind speed and direction may vary during that time. Year 2030 CO background concentrations were also used for the 2008/2030 worst case results because 2030 background would be slightly higher than 2008 (per APCD). One-hour CO background concentrations of 1.3 and 0.8 ppm and 8-hour CO backgrounds of 0.4 and 0.5 ppm were used for the US 85 and N. Meadows Drive intersections, respectively. The maximum 1-hour CO concentration predicted for any intersection was 9.4 ppm, which is below the NAAQS of 35 ppm (Table 3 Maximum Modeled Carbon Monoxide Concentrations). The maximum 8- hour CO concentration predicted was 5.0 ppm, which is below the NAAQS of 9 ppm (Table 3 Maximum Modeled Carbon Monoxide Concentrations). Therefore, no CO hot spots in violation of the NAAQS are predicted and no mitigation for CO is required. Table 3 Maximum Modeled Carbon Monoxide Concentrations Intersection 1-Hour CO Result (ppm) 8-Hour CO Result (ppm) 2030 No-Build Alternative Meadows Blvd. and N. Meadows Dr US 85 and Meadows Pkwy Refined Alternative 7 Meadows Blvd. and N. Meadows Dr. a US 85 and Meadows Pkwy. a Refined Alternative 7 with 2008 emission factors and 2030 traffic (worst case) Meadows Blvd. and N. Meadows Dr. a US 85 and Meadows Pkwy. a NAAQS 35 9 a Also applies to Refined Alternative 6 SOURCE: FHU, Modeling Results. CO concentrations are expected to decrease at the target intersections in the future even with higher traffic volumes. This is primarily because vehicles will be emitting less CO. This benefit will be from vehicle emission regulation and will be realized regardless of which alternative is selected from the EA. Page 21
24 None of the future alternatives have a clear and universal CO benefit over the others. Each alternative has aspects at some locations where it may benefit local air quality more than the other alternatives because of less traffic congestion. Overall, the results from modeling potential CO impacts indicate that none of the alternatives being considered will cause violations of CO standards, so any of the alternatives would be acceptable in terms of CO impacts. 3.4 Particulate Matter Results A qualitative evaluation of PM 10 emissions was performed for the project. Description of Project This information has been summarized in Section 1.0 Purpose and Need and is detailed in the EA itself. Description of Existing Conditions and Changes Resulting from Project This information is presented in Section 2.0. In evaluating the PM 10 hotspot potential of the project, the worst-case location in the study area was identified based on the highest daily traffic volumes. Re-entrained road dust is a major source of vehicular PM 10 and road dust is most prevalent where the largest traffic volume travels at the highest speed. In the study area, this is the I-25 corridor, so the proposed new interchange on I-25 was selected. Estimated 2030 traffic volumes on I-25 from DRCOG data would be approximately 159,000 vehicles per day. Contributing Factors This information is provided in Section 2.0 above (air quality, meteorology, climate data, built and natural environment) and Section 3.0 (transportation and traffic data) of the EA. Emissions control measures for PM 10 in the Denver metropolitan area include a diesel vehicle inspection and maintenance program, and various state and local programs to reduce road dust emissions, including street sweeping and use of alternative deicers. These programs will be in place in the study area to reduce PM 10 emissions regardless of which alternative is selected. The above factors would be largely the same in the future regardless of which alternative is selected. However, there could be some changes in the built environment within the project vicinity depending on which alternative is selected, due to localized changes in accessibility. The speed at which The Meadows or adjacent vacant areas develop may change. The potential road changes are described in Section 1.0. The PM 10 monitor nearest the study area at 678 S. Jason Street in Denver has been active since There has been one calculated exceedence of the PM 10 standard anywhere in the Denver region in the past decade (Section 2.3). The most relevant PM 10 components from mobile sources are re-entrained fugitive dust and tailpipe emissions, which account for about half the PM 10 emissions in the Denver area. APCD is responsible for studying and improving the air quality in Colorado. In addition to the air quality monitoring mentioned above, APCD also performs regional air quality modeling. PM 10 concentrations are modeled in support of the SIP and the model includes the emissions from local sources of PM 10. The model provides predicted PM 10 concentrations for a modeling grid covering most of the Denver metropolitan area (CAQCC, 2005b). Please note that the study area is within the PM 10 maintenance area but outside the APCD modeling domain. Therefore, there are not APCD PM 10 model results for the study area, so the two APCD model nodes nearest the study area (#7 and #8) were reviewed. These model results show that PM 10 concentrations are predicted to increase over the next 25 years, due mainly to increased vehicle Page 22
25 traffic. However, the highest predicted sixth-maximum PM 10 concentration for any of the years modeled by APCD ( µg/m 3 at #7 in 2030) is well below the NAAQS of 150 µg/m 3. As was previously mentioned, the Final Rule redesignating the Denver area from nonattainment to maintenance status for PM 10 became effective on October 16, This redesignation also included approval of a Maintenance Plan for PM 10 for the Denver area (CAQCC, 2001b) that was updated in 2005 (CAQCC, 2005b). These types of plans are required to ensure maintenance of the relevant NAAQS for at least 10 years. The Maintenance Plan included a number of strategies to reduce future PM 10 emissions to demonstrate maintenance for 2002 and beyond. These reductions will come mostly from lower tailpipe emissions, better street sanding procedures and ongoing vehicle inspection/maintenance requirements of the AIR Program. Reentrained road dust tends to be a larger source of PM 10 then tailpipe emissions for mobile sources. Street sanding practices are controlled by Colorado Air Quality Commission Regulation No. 16 and are expected to be the biggest contributor to PM 10 control for the Denver area. The Maintenance Plan also includes controls for emissions from road construction activities. Description of Analysis Method Chosen Because the study area is outside the PM 10 SIP modeling domain, this analysis uses the comparison to another location approach outlined in Section 4.1 of the March 2006 guidance (FHWA, 2006a). The analysis relies on ambient dispersion modeling already conducted for the Denver PM 10 Maintenance Plan to evaluate the potential for the proposed project to cause or contribute to violations of the PM 10 NAAQS. This approach has been used for other projects in the Denver area, and involves three technical steps: 1) identify worst-case locations based on traffic volume for the proposed project (Section 3.4.2); 2) review the PM 10 Maintenance Plan dispersion modeling to identify similar comparison locations, or locations that have even higher traffic volumes; and 3) ensure that the modeled PM 10 concentrations at these comparison locations in the Maintenance Plan are below the NAAQS. Description of Type of Emissions Considered in this Analysis Because the dispersion modeling for the Maintenance Plan includes all sources (mobile and stationary) of local PM 10 emissions, the analysis method used for PM 10 includes all mobile sources of emissions. As noted above, road dust is the predominant source of mobile source emissions in the Denver area, followed by tailpipe exhaust emissions. Construction emissions are also reflected in the Maintenance Plan modeling. These emissions include all types of construction (residential, commercial and roadway). The transportation conformity rule only requires consideration of construction emissions in cases where construction activity lasts longer than five years at any individual location, which is not expected for this project. The dispersion modeling for the Maintenance Plan also includes mobile source precursor gases (such as NOx) that contribute to PM 10 concentrations. PM 10 hotspot analyses are not required to consider these emissions under the conformity rule, so including the dispersion modeling results is more comprehensive than required. Description of Analysis Years The amended conformity rule (EPA, 2006a) and the EPA/FHWA guidance (FHWA, 2006a) require that particulate matter hotspot analyses 1) cover the entire timeframe of the area s RTP, and 2) be based on the year or years in which peak emissions are expected. The currently conforming RTP in the Denver metropolitan region is the 2035 Metro Vision Regional Page 23
AIR QUALITY IMPACT ANALYSIS
 FEDERAL BOULEVARD (5 TH AVENUE TO HOWARD PLACE) PLANNING ENVIRONMENTAL LINKAGE STUDY AIR QUALITY IMPACT ANALYSIS Prepared for: City and County of Denver 201 West Colfax Avenue, Department 509 Denver, CO
Pollutant Averaging Time Primary Standard. Sulfur Dioxide 24 hours 0.14 ppm Ozone. 8 hour 0.08 ppm 1 hour 0.12 ppm Particulate Matter <10 µm
 4.4 AIR QUALITY The Clean Air Act (CAA) and its amendments led to the establishment by the U.S. Environmental Protection Agency (EPA) of National Ambient Air Quality Standards (NAAQS) for six criteria
I-70 East ROD 1: Phase 1 (Central 70 Project) Air Quality Conformity Technical Report
 Air Quality Conformity Technical Report") I-70 East ROD 1: Air Quality Conformity Technical Report January 2017 I-70 East ROD 1: Air Quality Conformity Technical Report TABLE OF CONTENTS Chapter Page 1 PURPOSE OF THIS REPORT... 1 2 PROJECT DESCRIPTION...
I-70 East ROD 1: Air Quality Conformity Technical Report January 2017 I-70 East ROD 1: Air Quality Conformity Technical Report TABLE OF CONTENTS Chapter Page 1 PURPOSE OF THIS REPORT... 1 2 PROJECT DESCRIPTION...
Florida Department of Transportation, District Three
 MEMORANDUM To: From: Florida Department of Transportation, District Three Bryant Brantley, Atkins Re: Air Quality Analysis for Gulf Coast Parkway, Gulf and Bay County Financial Project ID: 410981-2-28-01
Mobile Source Air Toxics Analysis for FHWA Projects
 Mobile Source Air Toxics Analysis for FHWA Projects Jeff Houk FHWA Resource Center March 29, 2007 Overview Background on mobile source air toxics How MSATs became an issue for highway projects FHWA MSAT
Analysis of Mobile Source Air Toxics 1 August 2006
 Technical Guidance for TG-POL-01-06 Analysis of Mobile Source Air Toxics 1 August 2006 This technical guidance, provided by the ODOT Office of Environmental Services, presents guidelines for performing
4.2 Air Quality and Greenhouse Gas
 4.2 Air Quality and Greenhouse Gas Federal agencies are required under the Clean Air Act (CAA) to ensure that projects they fund (such as the Center City Connector) are in compliance with existing federal
Transportation Conformity Guidance for Qualitative Hot-spot Analyses in PM 2.5 and PM 10 Nonattainment and Maintenance Areas
 Transportation Conformity Guidance for Qualitative Hot-spot Analyses in PM 2.5 and PM 10 Nonattainment and Maintenance Areas United States Environmental Protection Agency Federal Highway Administration
Air Quality Technical Memorandum
 Southeast Extension Project Lincoln Station to RidgeGate Parkway Prepared for: Federal Transit Administration Prepared by: Denver Regional Transportation District May 2014 Table of Contents Page No. Chapter
Air Quality Technical Report
 Air Quality Technical Report January 2016 I-70 East Final Environmental Impact Statement This page intentionally left blank. I-70 East Final EIS Air Quality Technical Report TABLE OF CONTENTS Chapter Page
10.0 Air Quality Introduction Current Use of Adjoining Properties Pollutants and Regulatory Setting
 10.0 Air Quality 10.1 Introduction An air quality assessment was conducted to identify the potential for impacts associated with the proposed Columbia Pike Transit Initiative project. The air quality assessment
Going One Step Beyond in North Denver
 Going One Step Beyond in North Denver A Neighborhood Scale Air Pollution Modeling Assessment Part I : Predicted Mobile Emissions in 2035 Michael Ogletree Denver Environmental Health Purpose To compare
Draft Air Quality Analysis Protocol. Detroit River International Crossing Environmental Impact Statement
 Draft Air Quality Analysis Protocol Detroit River International Crossing Environmental Impact Statement May 31, 2007 1. Introduction Under the National Environmental Policy Act (NEPA), federal agencies
Air Quality Analysis Report. Appendix H. Air Quality Analysis Report
 Air Quality Analysis Report Appendix H Air Quality Analysis Report I-35W North Corridor Project EA Minnesota Department of Transportation MEMORANDUM To: From: Brett Danner SRF Consulting Group, Inc. John
AIR QUALITY ANALYSIS. I-77/I- 81 Overlap Improvements , P100 (UPC 51441) Prepared by:
 Prepared by:") AIR QUALITY ANALYSIS I-77/I- 81 Overlap Improvements 0077-098-104, P100 (UPC 51441) Prepared by: Environmental Division Virginia Department of Transportation September 2009 TABLE OF CONTENTS Summary...
AIR QUALITY ANALYSIS I-77/I- 81 Overlap Improvements 0077-098-104, P100 (UPC 51441) Prepared by: Environmental Division Virginia Department of Transportation September 2009 TABLE OF CONTENTS Summary...
Air Quality Technical Report PM2.5 Quantitative Hot spot Analysis. A. Introduction. B. Interagency Consultation
 Air Quality Technical Report PM2.5 Quantitative Hot spot Analysis I 65, SR44 to Southport Road (Segmented from SR44 to Main Street and Main Street to Southport Road) A. Introduction This technical report
Railroad Technical Memorandum for the North Meadows Extension to US 85 and Interstate 25
 for the North Meadows Extension to US 85 and Interstate 25 March 2010 Prepared for: Town of Castle Rock Douglas County Colorado Department of Transportation Federal Highway Administration Prepared by:
Robin Rhinesmith and Crystal Geiger, Florida Department of Transportation (FDOT) Lindsay Baumaister, KB Environmental Sciences, Inc.
 Lindsay Baumaister, KB Environmental Sciences, Inc.") -MEMO- Date: February 21, 2019 To: From: CC: Robin Rhinesmith and Crystal Geiger, Florida Department of Transportation (FDOT) Lindsay Baumaister, KB Environmental Sciences, Inc. Steve Gordillo, WSP Subject:
-MEMO- Date: February 21, 2019 To: From: CC: Robin Rhinesmith and Crystal Geiger, Florida Department of Transportation (FDOT) Lindsay Baumaister, KB Environmental Sciences, Inc. Steve Gordillo, WSP Subject:
A. INTRODUCTION AND METHODOLOGY
 Chapter 10: Air Quality A. INTRODUCTION AND METHODOLOGY The different alternatives being evaluated as part of the Manhattan East Side Transit Alternatives Study have the potential to result in air quality
Appendix U Air Quality Technical Memorandum DRAFT ENVIRONMENTAL IMPACT STATEMENT
 Appendix U Air Quality Technical Memorandum DRAFT ENVIRONMENTAL IMPACT STATEMENT Chicago Red Line Extension Project Air Quality Technical Memorandum June 21, 2013 Updated July 27, 2015 Prepared for: Chicago
Air Quality Technical Report
 Air Quality Technical Report Loop 336 South From IH 45 to FM 1314 Montgomery County CSJ: 0338-11-056 July 2017 The environmental review, consultation, and other actions required by applicable Federal environmental
5.3 Air Quality and Greenhouse Gas Emissions
 5. NEPA 5.3 Air Quality and Greenhouse Gas Emissions For a comprehensive discussion of the Project s affected environment and cumulative impacts as it relates to air quality and greenhouse gas (GHG) emissions,
5.0 AIR QUALITY. 5.1 Introduction
 5.0 AIR QUALITY 5.1 Introduction This chapter provides a summary of the detailed information in DSEIS Appendix B: Air Quality Written Reevaluation/Technical Report. The microscale carbon monoxide, regional
A. INTRODUCTION B. POLLUTANTS FOR ANALYSIS
 Chapter 2, Section F: Air Quality A. INTRODUCTION This section examines the potential for air quality impacts due to the proposed operational and geometric changes in traffic conditions along Fulton Street
DRAFT 2015 OZONE CONFORMITY ANALYSIS FOR THE 2019 FEDERAL TRANSPORTATION IMPROVEMENT PROGRAM AND THE 2018 REGIONAL TRANSPORTATION PLAN
 DRAFT 2015 OZONE CONFORMITY ANALYSIS FOR THE 2019 FEDERAL TRANSPORTATION IMPROVEMENT PROGRAM AND THE 2018 REGIONAL TRANSPORTATION PLAN JANUARY 9, 2019 KINGS COUNTY ASSOCIATION OF GOVERNMENTS This report
6.1 INTRODUCTION 6.2 REGULATORY FRAMEWORK NATIONAL AMBIENT AIR QUALITY STANDARDS COMPLIANCE STATUS TRANSPORTATION CONFORMITY
 Chapter 6 Air Quality 6.1 INTRODUCTION This chapter presents a project-level analysis of the potential for air quality impacts that could result from mobile and stationary sources of air emissions generated
Chapter 6 CO, PM 10, and Other Pollutant Air Quality Impacts and Mitigation For Project Operation
 Chapter 6 CO, PM 10, and Other Pollutant Air Quality Impacts and Mitigation For Project Operation 6.1 Introduction This Chapter addresses the recommended techniques for quantifying emissions of carbon
Air pollution is caused by high concentrations of gases and particles emitted form combustion sources (vehicles, power plants, industries)
") AIR POLLUTION Clean Air Act & Criteria Pollutants 7.1-7.5 Motor Vehicle Emissions: 7.8 Indoor Air and Box Models: 7.12 Air Pollution Meteorology: 7.10 Gaussian Plume Modeling: 7.11 1 Air pollution is caused
AIR POLLUTION Clean Air Act & Criteria Pollutants 7.1-7.5 Motor Vehicle Emissions: 7.8 Indoor Air and Box Models: 7.12 Air Pollution Meteorology: 7.10 Gaussian Plume Modeling: 7.11 1 Air pollution is caused
Eastside Transit Corridor Phase 2 Draft Environmental Impact Statement/ Environmental Impact Report APPENDIX R
 Eastside Transit Corridor Phase 2 Draft Environmental Impact Statement/ Environmental Impact Report APPENDIX R AIR QUALITY IMPACTS AND HEALTH RISK ASSESSMENT TECHNICAL MEMORANDUM State Clearinghouse Number:
Section 3.2 Air Quality ENVIRONMENTAL SETTING MOJAVE DESERT AIR BASIN AIR POLLUTANTS OF CONCERN
 Section 3.2 Air Quality This section examines the air quality in the project area, includes a summary of applicable air quality regulations, and analyzes potential air quality impacts associated with the
2012 Nitrogen Dioxide Summary
 2012 Nitrogen Dioxide Summary New Jersey Department of Environmental Protection NATURE AND SOURCES Nitrogen Dioxide (NO 2 ) is a reddishbrown, highly reactive gas that is formed in the air through the
Chapter 3. Changes to Environmental Impacts of the Project
 Chapter 3 Changes to Environmental Impacts of the Project This Draft Supplemental EIR/Environmental Reevaluation (DSEIR/ER) is being prepared to evaluate the potential environmental impacts associated
FHWA s Interim Guidance on Mobile Source Air Toxics Analysis in NEPA Documents
 FHWA s Interim Guidance on Mobile Source Air Toxics Analysis in NEPA Documents Karen Perritt, M.S. Air Quality Specialist FHWA Office of Natural Environment Mobile Source Air Toxics for Transportation
11-1 INTRODUCTION 11-2 REGULATORY CONTEXT
 Chapter 11: Air Quality 11-1 INTRODUCTION In this chapter, the effect of the project s operation on air quality is analyzed. The regulatory context, methods of analysis, existing air quality, and the future
Criteria Pollutants. Sulfur Dioxide (SO 2 ) Nitrogen Oxides (NOx)
 Nitrogen Oxides (NOx)") 1) Sulfur dioxide 2) Nitrogen oxides 3) Carbon monoxide 4) Ozone 5) Particulates 6) Lead Criteria Pollutants Sulfur Dioxide (SO 2 ) SO 2 is a colorless gas that is formed from the combustion of sulfur-containing
1) Sulfur dioxide 2) Nitrogen oxides 3) Carbon monoxide 4) Ozone 5) Particulates 6) Lead Criteria Pollutants Sulfur Dioxide (SO 2 ) SO 2 is a colorless gas that is formed from the combustion of sulfur-containing
Technical Report Air Quality
 Technical Report Air Quality 1.0 Introduction Motorized vehicles affect air quality by emitting airborne pollutants. Changes in traffic volumes, travel patterns, and roadway locations affect air quality
Fine Particles in the Air
 Fine Particles in the Air Presentation for STAPPA Outreach Committee Rich Damberg, EPA Office of Air Quality Planning and Standards April 6, 2004 Particulate Matter: What is It? A complex mixture of extremely
11-1 INTRODUCTION 11-2 REGULATORY CONTEXT
 Chapter 11: Air Quality 11-1 INTRODUCTION In this chapter, the effect of the project s operation on air quality is analyzed and includes a description of the regulatory context, methods of analysis, existing
Air Report. Project Information PPTA/LAP. Traffic Data I-495 NORTHERN SECTION SHOULDER USE. Project Number: , C501, P101 UPC:
 Air Report Project Information Project Name: I-495 NORTHERN SECTION SHOULDER USE Project Number: 0495-029-123, C501, P101 UPC: 105130 Route Number: 495 Project Limit - From: South of Old Dominion Drive
4.2 Air Quality Introduction Environmental and Regulatory Setting Environmental Setting. Existing Air Quality Conditions
 4.2 4.2.1 Introduction This section describes the affected environment and environmental consequences related to air quality from operations of the NEPA Alternatives. Information in this section is based
BACKGROUND TO THE 1993 GENERAL PLAN AS AMENDED
 General Plan Air Quality Element BACKGROUND TO THE 1993 GENERAL PLAN AS AMENDED Portions of the background section text were updated as part of the 2011 amendments to the County General Plan. County of
Final Air Quality Report
 Florida Department of Transportation - District VII County Line Road (C.R. 578) Project Development and Environment Study From U.S. 19 (S.R. 55) to U.S. 41 (S.R. 45) Work Program Item Segment Number: 257298
DRAFT Denver-North Front Range (Northern Subarea) 8-Hour Ozone Nonattainment Area Conformity Determination
 8-Hour Ozone Nonattainment Area Conformity Determination") DRAFT Denver-North Front Range (Northern Subarea) 8-Hour Ozone Nonattainment Area Conformity Determination for the North Front Range Metropolitan Planning Area FY2019-2022 Transportation Improvement Program
DRAFT Denver-North Front Range (Northern Subarea) 8-Hour Ozone Nonattainment Area Conformity Determination for the North Front Range Metropolitan Planning Area FY2019-2022 Transportation Improvement Program
Appendix 6-1 CO Screening Memorandum
 Appendix 6-1 CO Screening Memorandum 550 Kearny Street Suite 800 San Francisco, CA 94108 415.896.5900 phone 415.896.0332 fax www.esassoc.com memorandum date December 23, 2016 to cc from subject Wade Wietgrefe,
Dispersion Modeling for Mobile Source Applications
 Dispersion Modeling for Mobile Source Applications Chad Bailey EPA Office of Transportation and Air Quality Regional, State, and Local Air Modelers Workshop Philadelphia, PA May 14, 2009 1 Overview Upcoming
INTERSTATE 395 EXPRESS LANES NORTHERN EXTENSION AIR QUALITY ANALYSIS TECHNICAL REPORT SEPTEMBER 2016
 INTERSTATE 395 EXPRESS LANES NORTHERN EXTENSION AIR QUALITY ANALYSIS TECHNICAL REPORT SEPTEMBER 2016 INTERSTATE 395 EXPRESS LANES NORTHERN EXTENSION Air Quality Analysis Technical Report City of Alexandria,
APPENDIX VIII AIR QUALITY CONFORMITY ANALYSIS
 2018 Kings County Regional Transportation Plan APPENDIX VIII AIR QUALITY CONFORMITY ANALYSIS H:\RTPA\2018 RTP Update\Final RTP\APPENDIX VIII - Air Quality Conformity Title Page.docx Appendix VIII CONFORMITY
COMMENTS ON THE ADDITION OF THE PROPOSED I-70 EXPANSION PROJECT TO THE DENVER REGIONAL TRANSPORTATION PLAN and TRANSPORTATION IMPROVEMENT PROGRAM
 COMMENTS ON THE ADDITION OF THE PROPOSED I-70 EXPANSION PROJECT TO THE DENVER REGIONAL TRANSPORTATION PLAN and TRANSPORTATION IMPROVEMENT PROGRAM The Rocky Mountain Chapter of the Sierra Club submits these
Section 4.7 Air Quality
 Section 4.7 Air Quality This section summarizes the potential for air quality impacts resulting from construction and operation of the proposed Eastside Transit Corridor Phase 2 Project alternatives. Information
18 June 2017 PRACTITIONER S HANDBOOK AASHTO ADDRESSING AIR QUALITY ISSUES IN THE NEPA PROCESS FOR HIGHWAY PROJECTS
 AASHTO PRACTITIONER S HANDBOOK 18 June 2017 ADDRESSING AIR QUALITY ISSUES IN THE NEPA PROCESS FOR HIGHWAY PROJECTS This handbook is intended to assist practitioners in addressing air quality issues, including
Lecture 4 Air Pollution: Particulates METR113/ENVS113 SPRING 2011 MARCH 15, 2011
 Lecture 4 Air Pollution: Particulates METR113/ENVS113 SPRING 2011 MARCH 15, 2011 Reading (Books on Course Reserve) Jacobson, Chapter 5, Chapter 8.1.9 Turco, Chapter 6.5, Chapter 9.4 Web links in following
AIR QUALITY IMPACT ANALYSIS GOLDEN VALLEY ROAD BRIDGE SANTA CLARITA, CALIFORNIA
 AIR QUALITY IMPACT ANALYSIS GOLDEN VALLEY ROAD BRIDGE SANTA CLARITA, CALIFORNIA EA No. 932589 Prepared for: 23920 Valencia Boulevard, Suite 300 Santa Clarita, California 91355 and U.S. Federal Highway
Estimated Impacts From Idling Locomotives in the Borough of Raritan, N.J. February 2008
 Jon S. Corzine Governor Department of Environmental Protection Environmental Regulation Diesel Risk Reduction Program Post Office Box 418 Trenton, New Jersey 08625-0418 Tel: (609) 292-7953, Fax: (609)
3.3 AIR QUALITY. Introduction. Existing Conditions. Topography, Meteorology, and Climate
 3.3 AIR QUALITY Introduction This section describes the environmental setting and effects of the proposed project with regard to air quality. Existing air quality conditions within the Santa Clara-Alum
Air Quality Technical Report Prepared in Support of the Supplemental Environmental Impact Statement
 Air Quality Technical Report Prepared in Support of the Supplemental Environmental Impact Statement VDOT Virginia Department of Transportation U.S. Department of Transportation Federal Highway Administration
4.4 Air Quality Regulatory Setting. Federal
 station designs will complement the areas in which they are located. Executing these mitigation measures will not result in any impacts after mitigation. The opening of the LPA as a single phase under
Vista Canyon Transit Center - Air Quality Technical Memorandum
 803 Camarillo Springs Road, Suite C Camarillo, California 93012 (805) 437-1900 FAX (805) 437 1901 www.impactsciences.com MEMORANDUM To: Kris Markarian, City of Santa Clarita Job No. 1046.003 From: Susan
CHAPTER 11. Air Quality and the Transportation Plan
 Chapter 11. Air Quality and the Transportation Plan 159 CHAPTER 11. Air Quality and the Transportation Plan Background Air quality in Anchorage is subject to national ambient air quality standards established
Frumkin, 2e Part Three: Environmental Health on the Regional Scale. Chapter 12: Air Pollution
 Frumkin, 2e Part Three: Environmental Health on the Regional Scale Chapter 12: Air Pollution History of Air Pollution Since human beings discovered fire, they began to pollute the air. At first, air pollution
2007 Chugiak-Eagle River Long-Range Transportation Plan and Transportation Improvement Program. PM-10 Air Quality Conformity Determination
 2007 Chugiak-Eagle River Long-Range Transportation Plan and 2006-2008 Transportation Improvement Program PM-10 Air Quality Conformity Determination Prepared By: Municipality of Anchorage Traffic Department
Final Revisions to the Primary National Ambient Air Quality Standard for Nitrogen Dioxide (NO 2 )
") Final Revisions to the Primary National Ambient Air Quality Standard for Nitrogen Dioxide (NO 2 ) General Overview Office of Air and Radiation Office of Air Quality Planning and Standards January 2010
Final Revisions to the Primary National Ambient Air Quality Standard for Nitrogen Dioxide (NO 2 ) General Overview Office of Air and Radiation Office of Air Quality Planning and Standards January 2010
Air Pollution. tutorial by Paul Rich. Brooks/Cole Publishing Company / ITP
 Air Pollution tutorial by Paul Rich Outline 1. The Atmosphere layers, some major processes 2. Urban Air Pollution photochemical & industrial smog 3. Regional Air Pollution from Acid Deposition acid deposition,
Chapter 14: Air Quality
 Chapter 14: Air Quality Introduction and Setting Nevada County exhibits large variations in terrain and consequently exhibits large variations in climate, both of which affect air quality. The western
Air quality in the vicinity of a governmental school in Kuwait
 Air Pollution XVI 237 Air quality in the vicinity of a governmental school in Kuwait E. Al-Bassam 1, V. Popov 2 & A. Khan 1 1 Environment and Urban Development Division, Kuwait Institute for Scientific
PREPARED FOR: VDOT ENVIRONMENTAL DIVISON PREPARED BY: MICHAEL BAKER INTERNATIONAL IN ASSOCIATION WITH: SC&A INC.
 Transform I-66 Inside the Beltway Investing in Multi-Modal Solutions Project Level Air Quality Analysis in Support of a Categorical Exclusion STATE PROJECT NO. : 0066-96A-358 UPC: 107371 PREPARED FOR:
Air Quality Overview RETHINKING I-94
 4 Air Quality Overview m, RETHINKING I-94 AIR QUALITY OVERVIEW FOR RETHINKING I-94 In the Cities of Minneapolis and St. Paul, And the Counties of Hennepin and Ramsey, Minnesota January 2018 (Updated June
Traffic Data Collection Programs for PM 2.5 Non-Attainment Areas
 Traffic Data Collection Programs for PM 2.5 Non-Attainment Areas Jack Stickel Alaska Department of Transportation and Public Facilities NATMEC 23 June, 2010 Traffic Data to Address Air Quality and Climate
Appendix C: GHG Emissions Model
 Appendix C: GHG Emissions Model 1 METHOD OVERVIEW The Maryland Statewide Transportation Model (MSTM) Emissions Model (EM) is a CUBE-based model that uses emission rates calculated by the MOVES2010 EPA
Air Pollution Chapter 21. Atmosphere as a Resource
 Air Pollution Chapter 21 Atmosphere as a Resource Atmospheric Composition Nitrogen 78.08% Oxygen 20.95% Argon 0.93% Carbon dioxide 0.04% Ecosystem services Blocks UV radiation Moderates the climate Redistributes
Air Q ualit y Con formity Det er minat ion a n d Document at io n 8 -Hour Ozone & P M 2.5
 AQ Air Q ualit y Con formity Det er minat ion a n d Document at io n 8 -Hour Ozone & P M 2.5 2022 Transportation t Program and related amendments t o Connected2045, t h e transportation plan for the St.
Appendix E Air Quality
 Appendix E Air Quality Appendix E: Air Quality A. INTRODUCTION This appendix examines the potential for air quality impacts associated with the Proposed Action, which involves the construction of a five-level
AIR QUALITY WRITTEN REEVALUATION/TECHNICAL REPORT
 APPENDIX B AIR QUALITY WRITTEN REEVALUATION/TECHNICAL REPORT TABLE OF CONTENTS 1.0 INTRODUCTION... 1 1.1 Purpose... 1 1.2 Methodology and Approach... 1 2.0... 3 2.1 2004 Analysis Methods & Prevailing Regulations/Guidelines...
Twomile Ecological Restoration Project Air Quality Report Anna Payne, Mi-Wok District Fuels Specialists August 2011
 Twomile Ecological Restoration Project Air Quality Report Anna Payne, Mi-Wok District Fuels Specialists August 2011 The National Environmental Policy Act (NEPA), the Federal Clean Air Act, and California
Appendix E. Air Quality Conformity Analysis
 Appendix E Air Quality Conformity Analysis AIR QUALITY CONFORMITY ANALYSIS FOR THE 2017-2020 REGIONAL TRANSPORTATION IMPROVEMENT PROGRAM Table of Contents INTRODUCTION... 1 AIR QUALITY STATUS... 1 Figure
GE 2211 Environmental Science and Engineering Unit III Air Pollution. M. Subramanian
 GE 2211 Environmental Science and Engineering Unit III Air Pollution M. Subramanian Assistant Professor Department of Chemical Engineering Sri Sivasubramaniya Nadar College of Engineering Kalavakkam 603
Air Q ualit y Con formity Det er minat ion a n d Document at io n 8 -Hour Ozone & P M 2.5
 AQ Air Q ualit y Con formity Det er minat ion a n d Document at io n 8 -Hour Ozone & P M 2.5 2022 Transportation t Program and related amendments t o Connected2045, t h e transportation plan for the region.
Americans make the equivalent of round
 AIR POLLUTION CE 326 Principles of Environmental Engineering Prof. Tim Ellis January 18, 2008 Air Pollution Factoids Americans make the equivalent of round trips to the moon each year in their automobiles.
Courtyard and Towneplace Suites Hotel Project Air Quality Study
 Courtyard and Towneplace Suites Hotel Project TABLE OF CONTENTS Page Project Description... 1 Air Quality Background... 1 Local Climate and Meteorology... 1 Air Quality Regulation... 2 Current Air Quality...
CHAPTER 7. AIR QUALITY
 CHAPTER 7. AIR QUALITY 7.1 INTRODUCTION This chapter describes the potential environmental consequences associated with implementation of the alternatives within the four regions of influence (ROI) North,
Appendix K. Detroit River International Crossing Study Air Quality Impact Analysis Technical Report Addendum
 Appendix K Detroit River International Crossing Study Air Quality Impact Analysis Technical Report Addendum Detroit International River Crossing Air Quality Impact Analysis Technical Report Addendum November
Clean Air Act of 1970
 Clean Air Act of 1970 Set National Ambient Air Quality Standards (NAAQS), to protect public health and welfare Set New Source Performance Standards (NSPS), that strictly regulated emissions of a new source
2016 Nitrogen Dioxide Summary
 2016 Nitrogen Dioxide Summary New Jersey Department of Environmental Protection SOURCES Nitrogen dioxide (NO2) is a reddish-brown highly reactive gas that is formed in the air through the oxidation of
2009 Amendment Cycle 2 Denver-North Front Range Joint Interim 8-Hour Ozone Conformity Determination
 2009 Amendment Cycle 2 Denver-North Front Range Joint Interim 8-Hour Ozone Conformity Determination for the DRCOG Amended Fiscally Constrained 2035 Regional Transportation Plan and the Amended 2008-2013
AIR QUALITY CONFORMITY ANALYSIS
 AIR QUALITY CONFORMITY ANALYSIS For the 2011 Regional Transportation Plan and 2013 Federal Transportation Improvement Program Adopted on July 25, 2012 Stanislaus Council of Governments 1111 I Street, Suite
A. INTRODUCTION B. POLLUTANTS FOR ANALYSIS
 Chapter 18: Air Quality A. INTRODUCTION The potential for air quality impacts from the proposed project is examined in this chapter. Air quality impacts can be either direct or indirect. Direct impacts
DRAFT PREPARED FOR: VDOT ENVIRONMENTAL DIVISON PREPARED BY: MICHAEL BAKER INTERNATIONAL IN ASSOCIATION WITH: SC&A INC. KB ENVIRONMENTAL SCIENCES, INC.
 DRAFT Transform I-66 Outside the Beltway Tier 2 Environmental Assessment STATE PROJECT NO. : 0066-96A-297 UPC: 105500 PREPARED FOR: VDOT ENVIRONMENTAL DIVISON PREPARED BY: MICHAEL BAKER INTERNATIONAL IN
Monterey Bay Unified Air Pollution Control District (
 3.3.8 Air Quality Introduction The Air Quality section addresses the impacts of the project on ambient air quality and the exposure of people, especially sensitive individuals, to hazardous pollutant concentrations.
Chapter Introduction. 1.2 Purpose. 1.3 Background. 1.4 Ozone Production and Health Effects. 1.5 Responsibilities of Agencies
 Chapter 1 1.1 Introduction 1.2 Purpose 1.3 Background 1.4 Ozone Production and Health Effects 1.5 Responsibilities of Agencies 1.1 INTRODUCTION On July 18, 1997, the United States Environmental Protection
Changes to Air Quality
 Changes to Air Quality Identifying how the Detroit River International Crossing (DRIC) study alternatives may change air quality is an important consideration in the DRIC Environmental Assessment. Air
Air Pollution Sources Overview. Amy Roberts, Division Manager January 24, 2019
 Air Pollution Sources Overview Amy Roberts, Division Manager January 24, 2019 Types of Air Pollutants Criteria Pollutants Particulate Matter Nitrogen Dioxide Ozone Carbon Monoxide Lead Sulfur Dioxide Air
CE 213A Introduction to Environmental Science
 CE 213A Introduction to Environmental Science Module D Air Pollution Dr. Anubha Goel FB 308, anubha@iitk.ac.in, x 7027 Nazaroff, Ch. 7 Air Pollution 2 Key Concepts Structure and composition of the atmosphere
CE 326 Principles of Environmental Engineering Prof. Tim Ellis
 AIR POLLUTION CE 326 Principles of Environmental Engineering Prof. Tim Ellis January 25, 2008 Seven Major Pollutants of Concern 1. P 2. S Oxides (SO X ) 3. O 4. N Oxides (NO X ) 5. Carbon M (CO and other
History of significant air pollution events
 Ch17 Air Pollution A thick layer of smoke and haze covers Santiago, Chile. History of significant air pollution events Many of the worst air pollution episodes occurred in the last two centuries in London
Amendment 4 - OKI 2040 REGIONAL TRANSPORTATION PLAN
 Amendment 4 - OKI 2040 REGIONAL TRANSPORTATION PLAN October, 2018 Prepared by the Ohio-Kentucky-Indiana Regional Council of Governments Acknowledgments Title Amendment 4 - OKI 2040 Regional Transportation
YORK TOLL PLAZA MAINE TURNPIKE AUTHORITY AIR QUALITY REPORT. September 28, 2016 NOISE ANALYSIS REPORT MAINETURNPIKE AUTHORI TY
 NOISE ANALYSIS REPORT MAINETURNPIKE AUTHORI TY YORK TOLL PLAZA MAINE TURNPIKE AUTHORITY AIR QUALITY REPORT September 28, 2016 (Cover photograph provided by MTA) TABLE OF CONTENTS 1.0 EXECUTIVE SUMMARY...
Table Ambient Criteria Air Pollutant Monitoring Data ( )
") Section 5.4 Air Quality and Climate Change This section describes the potential air quality and climate change impacts associated with the proposed changes to the approved project. This section supplements
Section 5.4 Air Quality and Climate Change This section describes the potential air quality and climate change impacts associated with the proposed changes to the approved project. This section supplements
Highlights from the 2012 FHWA EPA Northern Transportation and Air Quality Summit
 em summit highlights Highlights from the 2012 FHWA EPA Northern Transportation and Air Quality Summit by Kevin Black, Martin Kotsch, Michael Roberts, Greg Becoat, Melanie Zeman, Joseph Rich, Mark Glaze,
2011 Amendment Cycle 1 DRCOG CO and PM 10 Conformity Determination
 2011 Amendment Cycle 1 DRCOG CO and PM 10 Conformity Determination for the Amended Fiscally Constrained 2035 Regional Transportation Plan and the Amended 2012-2017 Transportation Improvement Program Denver
Appendix E. Air Quality Conformity Analysis
 Appendix E Air Quality Conformity Analysis AIR QUALITY CONFORMITY ANALYSIS FOR THE DRAFT 2019-2022 REGIONAL TRANSPORTATION IMPROVEMENT PROGRAM INTRODUCTION This paper documents the positive air quality
National Ambient Air Quality Standards, Implementation Plans and Public Participation. Laura McKelvey U.S. EPA
 National Ambient Air Quality Standards, Implementation Plans and Public Participation Laura McKelvey U.S. EPA mckelvey.laura @epa.gov Topics What are the NAAQS? Why are they important? What is the air