AIR QUALITY IMPACT ANALYSIS
|
|
|
- Irma Logan
- 6 years ago
- Views:
Transcription
1 FEDERAL BOULEVARD (5 TH AVENUE TO HOWARD PLACE) PLANNING ENVIRONMENTAL LINKAGE STUDY AIR QUALITY IMPACT ANALYSIS Prepared for: City and County of Denver 201 West Colfax Avenue, Department 509 Denver, CO Colorado Department of Transportation Region S. Holly Street Denver, CO Federal Highway Administration West Dakota Avenue, Suite 180 Lakewood, CO Prepared by: Felsburg Holt & Ullevig 6300 South Syracuse Way, Suite 600 Centennial, CO / FHU Reference No June 2009
2
3 TABLE OF CONTENTS Air Quality Impact Analysis Page 1.0 INTRODUCTION Project Description Analysis Approach AFFECTED ENVIRONMENT Local Setting National Ambient Air Quality Standards Overview NAAQS Monitoring Data Overview Transportation and Circulation System Sensitive Receptors Other Air Quality Considerations ENVIRONMENTAL CONSEQUENCES Transportation and Circulation System Sensitive Receptors Carbon Monoxide Results Particulate Matter Results Ozone Construction Impacts Mitigation Summary CUMULATIVE IMPACTS REFERENCES APPENDIX A CAL3QHC MODEL OUTPUT FILES APPENDIX B EMISSION FACTORS AND BACKGROUND CONCENTRATIONS FELSBURG HOLT & ULLEVIG
4 LIST OF FIGURES Air Quality Impact Analysis Page Figure 1. Air Quality Impact Analysis Study Area and Intersections of Interest Figure 2. Prevailing Winds, CDOT I-25 & Walnut Weather Station LIST OF TABLES Table 1. National Ambient Air Quality Standards Table 2. Study Area Intersection Levels of Service (AM/PM) Table 3. Maximum Modeled Carbon Monoxide Concentrations FELSBURG HOLT & ULLEVIG
5 1.0 INTRODUCTION The City and County of Denver (CCD), in cooperation with the Colorado Department of Transportation (CDOT) and the Federal Highway Administration (FHWA), is conducting a Planning Environmental Linkage (PEL) study of Federal Boulevard from 5th Avenue to Howard Place (Figure 1). CCD has recently completed an Environmental Assessment (EA) and Finding of No Significant Impact (FONSI) of Federal Boulevard from Alameda Avenue to 5th Avenue (CDOT, 2007; CDOT, 2008) that resulted in a proposed action to add a third northbound lane, a raised median, and other geometric improvements on Federal Boulevard. CCD s long-range plans are to extend similar improvements north of 5th Avenue to Howard Place, the PEL study area. Federal Boulevard in the PEL study area and to the south currently has an unbalanced road section, with three through lanes southbound and two through lanes northbound. The roadway currently has substandard lane widths and a multitude of access points without a raised median to control turning movements. CDOT released the Interstate 25 (I-25) Valley Highway Environmental Impact Statement (EIS) document in 2006 and the Record of Decision (ROD) in 2007 (CDOT, 2006; CDOT, 2007b). The I-25 Valley Highway project included an area along 6th Avenue (US 6) corridor from I-25 to west of Federal Boulevard (CDOT, 2006). The Preferred Alternative for the 6th Avenue/Federal Boulevard interchange is reconstructing the interchange to a standard tight diamond configuration. The Regional Transportation District (RTD) prepared a Draft and Final EIS (RTD, 2003a; RTD, 2003b) and ROD (RTD, 2004) for the West Corridor FasTracks light-rail (LRT) project, which crosses underneath Federal Boulevard at Lakewood Gulch. The Federal Boulevard/Decatur Street LRT station will be constructed along Howard Place, east of Federal Boulevard. In addition, RTD is in the process of preparing a Categorical Exclusion (CatEx) for replacement of the Federal Boulevard Bridge over Lakewood Gulch (RTD, 2007). The National Environmental Policy Act (NEPA) of 1969 established a mandate for federal agencies to consider the potential environmental consequences of their proposed actions, to document the analysis, and to make the information available to the public for comment prior to implementation. In accordance with NEPA and related regulations, CCD is preparing a CatEx on behalf of FHWA, as the Lead Agency, and CDOT, as a Joint Lead Agency. The CatEx is for the proposed improvements on Federal Boulevard from 5th Avenue to 7th Avenue, which is all of the project that is currently funded. Because of CCD s longer term plans to widen Federal Boulevard to Howard Place, this larger project was examined, too (Figure 1). The purpose of the analyses presented in this report is to conclude whether air quality will be impacted by the proposed improvements. This report presents an overall analysis that was performed as part of the CatEx and the PEL to evaluate existing and future air quality conditions. FELSBURG HOLT & ULLEVIG Page 1


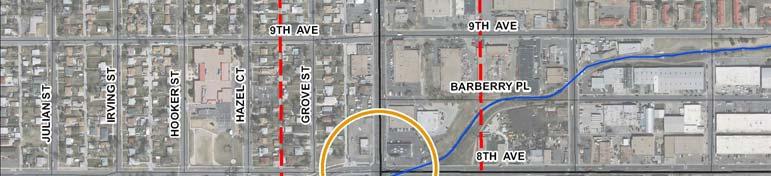
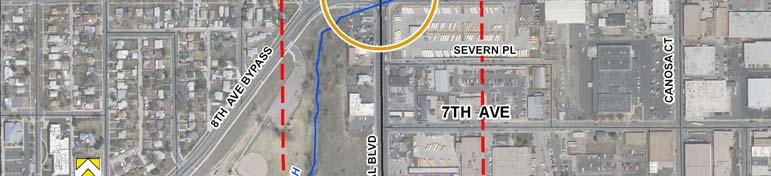
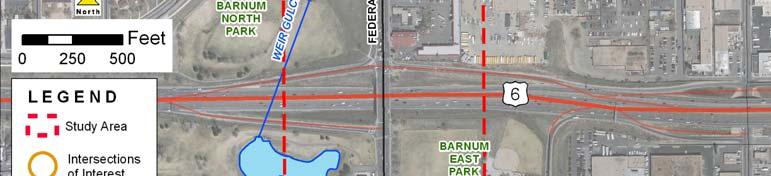
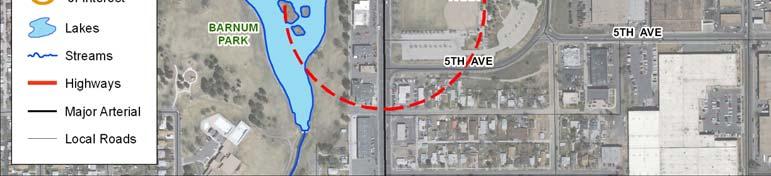
6 Figure 1. Air Quality Impact Analysis Study Area and Intersections of Interest Source: Compiled by FHU FELSBURG HOLT & ULLEVIG Page 2
7 1.1 Project Description The air quality impact analysis study area (study area) primarily has businesses immediately adjacent to Federal Boulevard through the study area. Homes, parks and motels are also facing Federal Boulevard, and there also are numerous homes in the second row of properties, a half block off Federal Boulevard, in several locations. The improvements being considered for Federal Boulevard in the study area generally are widening to three through lanes in both directions and installing safety and control features (such as medians). It is important to note that to accomplish this, Federal Boulevard would be widened to the east, which would require the acquisition of some private property for right-ofway. The proposed improvements were examined for potential air quality impacts. In contrast, the No-Action Alternative (No-Action) would have no new road improvements as part of this project, though changes in the study area may be made by other projects. 1.2 Analysis Approach The air quality analysis for the project consisted of several components: A regional conformity evaluation to show that the alternatives are compatible with the state implementation plans. (The analysis is done by the Denver Regional Council of Governments [DRCOG] as part of the regional planning and conformity demonstration activities.) A local hot-spot analysis for carbon monoxide (CO) to show that the proposed actions will not cause local violations of the National Ambient Air Quality Standards (NAAQS). Intersections that could be potential hot-spots have been identified and analyzed for local conformity. Qualitative analyses for particulate matter Regional Conformity In air quality non-attainment and maintenance areas, the Clean Air Act requires that fiscallyconstrained long-range regional transportation plans (RTPs), transportation improvement programs (TIPs) and individual projects can not: Cause new violations of a NAAQS Increase the frequency or severity of existing violations of the NAAQS Delay attainment of the NAAQS The transportation conformity process is the mechanism used by the responsible metropolitan planning organization (DRCOG) to assure that the requirements of the Clean Air Act are met for planned transportation improvements within the region. The fiscally-constrained RTP and TIP must identify all projects that are expected to receive federal funds or that will require FHWA or Federal Transit Administration approval. These projects and other regionally significant projects regardless of funding source must be included in a regional emissions analysis that demonstrates conformity to the State Implementation Plans (SIPs) to comply with the Clean Air Act. FELSBURG HOLT & ULLEVIG Page 3
8 Road improvement projects can not be built unless the regional road system in aggregate conforms to the regional SIPs. Individual projects can demonstrate regional conformity by being part of a conforming fiscally-constrained RTP, which looks at longer-range transportation planning, and either a TIP, which includes projects likely to proceed in the next few years, or the road network used to demonstrate conformity (TIP technical appendix). The 2035 RTP (DRCOG, 2008) and the TIP (DRCOG, 2008a) are the adopted fiscally-constrained conforming plans for DRCOG. The first phase of the proposed improvements (5th Avenue to 7th Avenue) is included in the 2035 RTP Local Conformity Individual projects within air quality nonattainment or maintenance areas, such as the Denver metropolitan area, must demonstrate that they will not cause violations of the NAAQS in localized areas known as hot spots. Among the NAAQS pollutants that are primary concerns for the Denver region (CO, suspended particulate matter [PM 10 ] and ozone [O 3 ]), CO and PM 10 are the potential hot spot pollutants. CO hot spots are most likely to be a concern where traffic is very congested and slow moving, such as at congested, high-volume intersections. The majority of PM 10 emissions from vehicles are from road dust, so a hot spot is most likely in areas with high traffic volumes traveling at relatively high speeds on unswept roads. In contrast, O 3 is influenced by regional pollutant emissions and is not a hot spot concern. Between CO and PM 10, an approved quantitative method for hot spot analysis is available only for CO; no dispersion models have been approved for PM 10. Therefore, hot spot modeling for NAAQS pollutants other than CO or for other pollutants from mobile sources is not possible because there are no accepted EPA guidelines for hot spot analyses for them at this time. PM 10 was evaluated for conformity through a qualitative assessment (Section 3.4). The methods for each are described below Carbon Monoxide Areas likely to become CO hot spots are identified based primarily on traffic volumes and congestion, and a determination is then made whether a detailed analysis is needed for each area. Generally, the need for CO hot spot analysis is assessed with respect to three criteria, as suggested by EPA: The Level of Service (LOS) of a project intersection will be D, E or F The project affects locations identified in the SIP as sites of actual or potential violations of the CO NAAQS A project intersection is one of the top three in the SIP with respect to highest traffic volume or worst LOS The goal of the intersection selection process is to choose the most congested and heavily trafficked intersections for CO analysis (Section 3.3), with these worst-case intersections also representing less congested intersections and areas. If a project intersection meets one of the above criteria, it may be modeled for CO concentrations. If these congested intersections do not show hot spot problems, less congested intersections will not either. If an intersection does not meet one of the above criteria, it is unlikely to be a hot spot and need not be assessed further. FELSBURG HOLT & ULLEVIG Page 4
9 Particulate Matter Unlike CO pollution, quantitative tools for analysis of particulate matter pollution have not been developed and approved for mobile sources. Therefore, a qualitative process was used for the analysis of PM 10. NAAQS violations for PM 2.5 are not a concern anywhere in Colorado (Section 2.2), therefore PM 2.5 was not included. The qualitative analysis for PM 10 follows both the procedures in the transportation conformity rule (EPA, 2006) and the most recent EPA/FHWA guidance (FHWA, 2006). The guidance requires that PM 10 hotspot analyses address the following elements: Description of the project (location, design and scope; date project is expected to be open) Description of existing conditions and changes resulting from the project Contributing factors Air Quality Transportation and traffic conditions Built and natural environment Meteorology, climate and seasonal data Adopted emissions control measures Description of analysis method chosen Description of type of emissions considered in the analysis (e.g., exhaust, road dust, construction emissions) Description of analysis years; consider full time frame of area s RTP, and examine year or years in which emissions are expected to peak Professional judgment of impact Evaluate both forms of PM 10 standard (24-hour and annual) Discuss any mitigation measures Written commitments for mitigation Conclusion on how project meets the requirements of 40 CFR and These items are discussed in detail in Section 3.4. Section (b)(1) of the latest conformity rule only requires hotspot analysis for projects of air quality concern, which are defined as projects which feature a large volume of diesel traffic. However, this provision does not apply in Colorado because Colorado s Regulation 10, which contains Colorado s conformity requirements, is based on an older version of the federal transportation conformity rule that does not reflect this provision. Thus, particulate matter hotspot analyses are required for all non-exempt federal projects in Colorado s PM 10 maintenance areas, so whether this project would be a project of air quality concern is not relevant. Section (b)(1) of the federal rule will only apply in Colorado when Regulation 10 has been revised to reflect the most recent federal requirements and the revision has been approved by EPA. FELSBURG HOLT & ULLEVIG Page 5
10 2.0 AFFECTED ENVIRONMENT The project is in the largest metropolitan area in Colorado. Based on the 2000 census, the 7- county Denver metropolitan area has approximately 2.4 million residents. The primary air quality issues of concern for this project are pollutants associated with operation of vehicles on roadways. These issues include direct emissions of pollutants from vehicles, secondary pollutants formed from direct emissions, and road dust. Air quality issues related to road construction are also a potential short-term concern. 2.1 Local Setting The study area is near the South Platte River in the central Denver metropolitan area. The study area elevations are generally about 5,200 feet above sea level. To the west is the much higher Front Range of the Rocky Mountains while to the east and lower in elevation is the Great Plains. The coldest month for the study area usually is January, with an average daily temperature range of degrees Fahrenheit. The warmest month usually is July, with an average daily temperature range of degrees Fahrenheit. Thermal inversions are known to occur in the study area during times of low winds. The study area generally receives about 19 inches of precipitation annually, with the wettest months generally May and April. Prevailing winds in the study area can be somewhat variable due to local topography, but the prevailing winds near ground surface tend to be from the south (Figure 2). 2.2 National Ambient Air Quality Standards Overview The Clean Air Act of 1970 and its amendments led to the establishment by EPA of the NAAQS for the criteria air pollutants: CO, sulfur dioxide, O 3, PM 10, nitrogen dioxide and lead (Table 1). In 1997, EPA changed the O 3 standard and added a new standard for very fine particulate matter (PM 2.5 ), though implementation of these two NAAQS was delayed until Motor vehicles are important contributors of CO, O 3, nitrogen dioxide and particulate matter, so only these criteria pollutants will be discussed in detail below. Under the Clean Air Act, cities and regions were required to determine their compliance with the NAAQS. Areas that met the NAAQS were classified as attainment areas while areas that did not meet a NAAQS were classified as nonattainment for that NAAQS. These classifications are long term and do not change often. The Denver metropolitan area has been in attainment of the sulfur dioxide, nitrogen dioxide and lead NAAQS for more than 30 years. The Denver metropolitan area was a nonattainment area for CO, O 3 (1-hour), and PM 10 beginning in the early 1970 s, so those three pollutants have historically been concerns in the Denver region. The region included in the nonattainment areas were all or parts of the following counties: Denver, Jefferson, Boulder, Adams, Arapahoe, Douglas and Broomfield. A number of successful air quality improvement actions over many years resulted in cleaner air and the Denver region meeting all of the NAAQS that were in force in The Denver region was reclassified by EPA as attainment/maintenance areas in 2001 and 2002 for CO, O 3 (1-hour) and PM 10 and regional maintenance plans were developed for all three pollutants. The study area is within all three of these maintenance areas. Nonattainment areas for the new PM 2.5 and 8-hour O 3 NAAQS were designated by EPA in No areas in Colorado have been designated as nonattainment for PM 2.5, so it is not a major issue in the state. However, O 3 is again a concern in the Denver region. The Denver region FELSBURG HOLT & ULLEVIG Page 6
11 officially became a nonattainment area for the 8-hour O 3 NAAQS on November 20, The nonattainment area includes the 7-county metropolitan area plus parts of Larimer and Weld Counties. Table 1. National Ambient Air Quality Standards Pollutant Averaging Time Primary Standard Carbon Monoxide 8 hours 9 ppm 1 hour 35 ppm Sulfur Dioxide Annual 0.03 ppm 24 hours 0.14 ppm Ozone 8 hour (1997/2008) 0.08 / ppm 1 hour 0.12 ppm Particulate Matter <10 µm (PM 10 ) 24 hours 150 µg/m 3 Particulate Matter <2.5 µm (PM 2.5 ) Annual 15 µg/m 3 24 hours 35 µg/m 3 Nitrogen Dioxide Annual ppm Lead Quarterly 1.5 µg/m 3 Note: ppm = parts per million µg/m 3 = micrograms per cubic meter µm = micrometers Source: EPA, 2008a. Figure 2. Prevailing Winds, CDOT I-25 & Walnut Weather Station Source: CDOT, 2008a. FELSBURG HOLT & ULLEVIG Page 7
12 2.2.1 Carbon Monoxide CO is an odorless, colorless gas that is most commonly formed by incomplete combustion of fuel. CO is dangerous because it interferes with the body s ability to absorb oxygen. High concentrations of CO can cause dizziness, headaches, loss of vision, impaired dexterity and even death, if the concentration is high enough. Major sources of CO include vehicle exhaust, burning and forest fires. CO is most commonly a concern in localized areas around the CO sources, such as near congested road intersections. CO can be a regional concern if concentrations are high enough and disperse into the surrounding area Particulate Matter Particulate matter (both PM 10 and PM 2.5 ) is a complex mix of very small solid particles and liquid droplets. Particulate matter is a concern because it can be inhaled deeply into the lungs and can interfere with lung function or lead to other health effects. Particulate matter can aggravate asthma, diminish lung capacity and cause lung or heart problems. Particulate matter can also cause haze. Sources of particulate matter include road dust, smoke and diesel engine exhaust. Particulate matter can be a concern around sources, but winds can disperse particulate matter over a larger area and cause regional concerns Ground Level Ozone Ground-level O 3 is a gas that is not typically emitted by any common sources; rather it is formed by chemical reactions between other pollutants in the atmosphere. Nitrogen oxides (NO X ) and hydrocarbons in the presence of sunlight and certain weather conditions can form O 3. O 3 is a strong oxidizing agent and can damage cells in lungs and plants. O 3 can cause eye irritation, coughing and lung damage. There are no direct sources of O 3 because it is rarely emitted directly. However, O 3 concentrations are affected through the precursor pollutants NO X and hydrocarbons. Automotive sources of NO X include vehicle exhaust. Automotive sources of hydrocarbons include fuel evaporation and incomplete combustion of fuel. O 3 is a regional concern because it takes time for O 3 to form and the pollutants can drift a considerable distance in that time (California Air Resources Board [CARB], 2002). Rural/undeveloped areas can have O 3 problems because of transported pollutants, even if there are not major local emissions of precursors (CARB, 2002) Nitrogen Dioxide The atmosphere is about 80 percent nitrogen gas. When fuel is burned at high temperature in air, the nitrogen can react with oxygen to form gases such as nitrogen dioxide and other NO X. NO X can contribute to O 3 formation, particulate matter formation and acid deposition. Common sources of nitrogen oxides are vehicles and electrical utilities. Nitrogen dioxide can damage cells in lungs and plants and damage water quality. Nitrogen dioxide can be transported over great distances and is a regional concern. FELSBURG HOLT & ULLEVIG Page 8
13 2.3 NAAQS Monitoring Data Overview There are several air quality monitoring stations in the Denver region that measure the criteria air pollutants, however none are within the study area. The closest active monitoring stations and the pollutant data used for the PEL from each are: 678 South Jason Street-Denver (PM 2.5, PM 10 ) 1300 Blake Street-Denver (CO) 2325 Irving Street-Denver (O 3 ) CAMP-downtown Denver (nitrogen dioxide) Monitoring stations at other locations in the region have been active in the past. The stations listed above are outside the study area, but overall these stations provide the monitoring data nearest the study area. The most recent complete data set from these stations is for In 2007, none of the NAAQS levels were exceeded for CO, PM 10, PM 2.5, O 3 or nitrogen dioxide. Monitoring data for the three pollutants subject to maintenance plans in the Denver region (CO, PM 10 and O 3 ) are summarized below Carbon Monoxide Measured concentrations of CO in the Denver region have not violated the NAAQS since 1995 (CAQCC, 2004). For the CO station, the 2007 measured values for NAAQS comparison for 1 hour and 8 hours are 4.1 ppm and 2.4 ppm, respectively. These values are below their respective NAAQS (Table 1) Particulate Matter For the PM 10 station, the 2007 measured value for NAAQS comparison for 24 hours is 67 µg/m 3. There was an unusually high value recorded for Commerce City in 1999, but measured concentrations of PM 10 in the Denver region generally have not violated the NAAQS since 1993 (CAQCC, 2004). For the PM 2.5 station, the 2007 measured values for NAAQS comparison for 24 hours and annual were 20 µg/m 3 and 9.9 µg/m 3, respectively. These values are below their respective NAAQS (Table 1) Nitrogen Dioxide and Ozone Nitrogen dioxide is a criteria pollutant and an O 3 precursor. For the nitrogen dioxide station, the 2007 measured value for NAAQS comparison for annual average is ppm. The other major O 3 precursor pollutant (hydrocarbons) is not a NAAQS pollutant. For the O 3 monitoring station, the 2007 measured value for NAAQS comparison for 1 hour is ppm and for 8 hours is ppm (exceeds the 2008 NAAQS level but not the 1997). For comparison, the three-year average of the fourth-highest 8-hour O 3 concentrations at Rocky Flats North was ppm, which exceeded the NAAQS. The 8-hour O 3 problems are in the western metropolitan area and have not been detected in the study area. FELSBURG HOLT & ULLEVIG Page 9
14 2.4 Transportation and Circulation System Air Quality Impact Analysis The transportation and circulation system evaluated for this report was the streets and highways within the study area (Figure 1) that were likely to be impacted by changes in traffic patterns by the improvements. This group of roads consisted of: US 6 Federal Boulevard 8th Avenue Data pertaining to traffic volumes and LOS in this report are drawn from the traffic study (FHU, 2008). The LOSs of the various intersections of interest to the project was assessed (Table 2). LOS provides an indication of intersection congestion and likely hot spots for air pollutants from vehicles. LOS A is the best traffic operation, LOS F is the worst. Table 2. Study Area Intersection Levels of Service (AM/PM) Intersection (Federal Boulevard) Existing No-Action (2035) Proposed Action (2035) South US 6 ramps B/B B/D C/C North US 6 ramps B/B C/E B/C 8th Avenue C/F F/F D/F 10th Avenue B/B D/F C/E Holden Place A/B A/C A/B Source: FHU, US 6 is a large freeway for the Denver region and carries a corresponding volume of traffic (about 130,000 vehicles per day). Only the US 6 ramps affect the project and they currently carry a small fraction of that traffic volume. Federal Boulevard is a regional arterial and state highway (SH 88) in the project corridor. Federal Boulevard has two lanes northbound and three lanes southbound with additional turn lanes at the various intersections. Federal Boulevard currently carries a traffic load of about 41,000 vehicles per day. Holden Place, 8th Avenue and 10th Avenue are two-lane local streets and carry relatively light traffic loads, although there is a relatively high truck percentage in the industrial area east of Federal Boulevard. 2.5 Sensitive Receptors Locations where people spend extended periods of time are likely to be the most sensitive receptors. The receptors most likely to be directly affected by pollutants from project roads are those receptors closest to the roads. These types of locations in the study area include homes and businesses. There are approximately 47 developed properties (most are businesses) within about 100 feet of Federal Boulevard in the study area. 2.6 Other Air Quality Considerations Two other air quality topics that were considered were toxic air pollutants and general construction activities. FELSBURG HOLT & ULLEVIG Page 10
15 2.6.1 Toxic Air Pollutants The purpose of the proposed improvements was described in Section 1.0. This project will not result in any meaningful changes in traffic volumes, vehicle mix, location of the existing facility, or any other factor that would cause an increase in emissions impacts relative to No-Action. As such, FHWA guidance supports the conclusion that this project will generate minimal air quality impacts for Clean Air Act criteria pollutants and has not been linked with any special air toxics concerns. Consequently, this effort is exempt from analysis for air toxics. Moreover, EPA regulations for vehicle engines and fuels will cause overall air toxics emissions to decline significantly over the next 20 years. Even after accounting for a 64 percent increase in VMT, FHWA predicts MSATs will decline in the range of 57 percent to 87 percent, from 2000 to 2020, based on regulations now in effect, even with a projected 64 percent increase in VMT. This will both reduce the background level of MSATs as well as the possibility of even minor MSAT emissions from this project Construction Finally, air quality impacts from construction can be a concern. Long-term construction projects near sensitive receptors can represent health concerns. As with MSATs, there are no ambient air standards specifically for construction or direct mechanisms for assessing such impacts. FELSBURG HOLT & ULLEVIG Page 11
16 3.0 ENVIRONMENTAL CONSEQUENCES Because of the past and present regional air quality challenges in the Denver metropolitan area, infrastructure projects that might exacerbate the air quality problems must meet certain requirements before they can proceed. In general, projects of the type considered in the PEL must be analyzed with respect to the potential impact on air quality at both the regional and local levels. The region of influence examined for air quality in this project is around the highways and streets described in Section Transportation and Circulation System The PEL is examining possible future changes to the highway and street network in the study area. The future transportation and circulation system will be similar in many ways to the existing system. Federal Boulevard would be widened and some intersections may be improved. The changes to area roads were previously described in Section Sensitive Receptors The receptors most likely to be directly affected by pollutants from project roads are those receptors closest to the roads. Many buildings are already quite close to Federal Boulevard. The proposed improvements being considered could bring traffic closer to some receptors, but would remove some receptors that are even closer on the east side of Federal Boulevard. There are approximately 47 developed properties within about 100 feet of the study area roads that were examined. This includes three homes. 3.3 Carbon Monoxide Results Two study area intersections, Federal Boulevard/8 th Avenue and Federal Boulevard/10 th Avenue, have been predicted to function at LOS D or worse in 2035 with the proposed improvements (Table 2), so they were selected for CO hot spot analysis. To streamline the CO hot spot evaluation and to ensure that the year of maximum CO emissions was considered, a worst case situation was modeled for each intersection using CAL3QHC. The highest CO emissions factors (2008) were combined with the highest traffic volumes (2035) in the CAL3QHC input files. These artificial conditions were purposely devised to overstate the maximum CO concentrations associated with the project to ensure that the maximum potential CO concentrations were adequately considered and that the project would maintain air quality conformity throughout the interim years. The afternoon peak hour was used because traffic volumes are higher and the LOSs worse (Table 2). The model results were compared to the NAAQS. The CO model results are summarized in Table 3. The model output data (Appendix A) have been corrected for altitude in CAL3QHC. The CAL3QHC model provides 1-hour average CO concentrations which must then be added to background CO concentrations. To calculate 8- hour CO results, the 1-hour model results were multiplied by a persistence factor of 0.57 and added to the 8-hour background CO concentrations, following APCD and CDOT guidance. This correction is needed because the average hourly traffic over eight consecutive hours will be less than the peak hour traffic that is modeled, and the meteorological conditions including wind speed and direction may vary during that time. CO background concentrations were provided by APCD (Appendix B) and the 2008 CO background concentration of 3.8 ppm was used because it is higher than 2035 (Appendix B). FELSBURG HOLT & ULLEVIG Page 12
17 The maximum 1-hour CO concentration predicted for either intersection was 6.7 ppm, which is below the NAAQS of 35 ppm (Table 3). The maximum 8-hour CO concentration predicted was 5.5 ppm, which is below the NAAQS of 9 ppm (Table 3). Therefore, no CO hot spots in violation of the NAAQS are predicted and no mitigation for CO is required. CO concentrations are expected to decrease at the target intersections in the future even with higher traffic volumes. This is primarily because vehicles will be emitting less CO. This benefit will be from vehicle emission regulation and will be realized regardless of the improvements made. Table 3. Maximum Modeled Carbon Monoxide Concentrations Intersection 1-Hour CO Result (ppm) 8-Hour CO Result (ppm) 8th Avenue th Avenue NAAQS 35 9 Source: FHU, Modeling Results 3.4 Particulate Matter Results A qualitative evaluation of PM 10 emissions was performed for the project Description of Project This information has been summarized in Section Description of Existing Conditions and Changes Resulting from Project This information is presented in Section 2.0. In evaluating the PM 10 hotspot potential of the project, the worst-case location in the study area was identified based on the highest daily traffic volumes. Re-entrained road dust is a major source of vehicular PM 10 and road dust is most prevalent where the largest traffic volume travels at the highest speed. In the study area, this is the US 6 corridor. The proposed improvements will not affect traffic volumes on either US 6 or Federal Boulevard; traffic on Federal Boulevard would just flow more smoothly but would not have an effect on PM 10 levels. Federal Boulevard carries about one quarter the traffic volume of US Contributing Factors This information is provided above. Emissions control measures for PM 10 in the Denver metropolitan area include a diesel vehicle inspection and maintenance program, and various state and local programs to reduce road dust emissions, including street sweeping and use of alternative deicers. These programs will be in place in the study area to reduce PM 10 emissions regardless of which alternative is selected. The above factors would be largely the same in the future regardless of which alternative is selected. However, there could be some changes in the built environment in the project vicinity depending on which alternative is selected, due to localized changes in accessibility. The potential road changes are described in Section 1.0. Raised center medians on Federal Boulevard will add traffic safety due to the less chaotic entrance to properties via the numerous curb cuts. The Federal Boulevard speed limit will remain at 35 miles per hour (MPH). FELSBURG HOLT & ULLEVIG Page 13
18 The PM 10 monitor nearest the study area at 678 S. Jason Street has been active since There has been no exceedance of the PM 10 standard anywhere in the Denver region over the past decade (Section 2.3). The most relevant PM 10 components from mobile sources are reentrained fugitive dust and tailpipe emissions, which account for about half the PM 10 emissions in the Denver area. APCD is responsible for studying and improving the air quality in Colorado. In addition to the air quality monitoring mentioned above, APCD also performs regional air quality modeling. PM 10 concentrations are modeled in support of the SIP and the model includes the emissions from local sources of PM 10. The model provides predicted PM 10 concentrations for a modeling grid covering most of the Denver metropolitan area (CAQCC, 2005). These model results show that PM 10 concentrations are predicted to increase over the next 25 years, due mainly to increased vehicle traffic. However, the highest predicted sixth-maximum PM 10 concentration in the study area for any of the years modeled by APCD ( µg/m 3 at Receptor 660 in 2030) is below the NAAQS of 150 µg/m 3. As was previously mentioned, the Final Rule redesignating the Denver area from nonattainment to maintenance status for PM 10 became effective on October 16, This redesignation also included approval of a Maintenance Plan for PM 10 for the Denver area (CAQCC, 2001) that was updated in 2005 (CAQCC, 2005). These types of plans are required to ensure maintenance of the relevant NAAQS for at least 10 years. The Maintenance Plan included a number of strategies to reduce future PM 10 emissions to demonstrate maintenance for 2002 and beyond. These reductions will come mostly from lower tailpipe emissions, better street sanding procedures and ongoing vehicle inspection/maintenance requirements of the AIR Program. Reentrained road dust tends to be a larger source of PM 10 then tailpipe emissions for mobile sources. Street sanding practices are controlled by Colorado Air Quality Control Commission Regulation No. 16 and are expected to be the biggest contributor to PM 10 control for the Denver area. The Maintenance Plan also includes controls for emissions from road construction activities Description of Analysis Method Chosen Because the study area is within the central modeling domain for the PM 10 SIP, this analysis uses the air quality studies approach outlined in Section 4.1 of the March 2006 guidance (FHWA, 2006). The analysis relies on ambient dispersion modeling already conducted for the Denver PM 10 Maintenance Plan to evaluate the potential for the proposed project to cause or contribute to violations of the PM 10 NAAQS. The proposed project would add a travel lane (primarily for gasoline vehicles) to an existing arterial street, but would not change the associated traffic volume or speed limit (which is 35 MPH). This project appears to be not an air quality concern (FHWA, 2006). Isopleth maps of PM10 concentrations indicate that the major contributors are high speed highways, such as I-25 and US 6 (APCD, 2005) Description of Type of Emissions Considered in this Analysis Because the dispersion modeling for the Maintenance Plan includes all sources (mobile and stationary) of local PM 10 emissions, the analysis method used for PM 10 includes all mobile sources of emissions. As noted above, road dust is the predominant source of mobile source emissions in the Denver area, followed by tailpipe exhaust emissions. Construction emissions are also reflected in the Maintenance Plan modeling. These emissions include all types of construction (residential, commercial and roadway). The transportation conformity rule only requires consideration of construction emissions in cases where FELSBURG HOLT & ULLEVIG Page 14
19 construction activity lasts longer than five years at any individual location, which is not expected for this project. The dispersion modeling for the Maintenance Plan also includes mobile source precursor gases (such as nitrogen oxides) that contribute to PM 10 concentrations. PM 10 hotspot analyses are not required to consider these emissions under the conformity rule, so including the dispersion modeling results is more comprehensive than required Description of Analysis Years The amended conformity rule (EPA, 2006) and the EPA/FHWA guidance (FHWA, 2006) require that particulate matter hotspot analyses 1) cover the entire timeframe of the area s RTP, and 2) be based on the year or years in which peak emissions are expected. The currently conforming RTP in the Denver metropolitan region is the 2035 Metro Vision Regional Transportation Plan, adopted in December 2007 and most recently amended in August Therefore, the analysis must extend at least through the year To identify the year or years of peak emissions, both mobile source trends and general trends in background emissions need to be considered. The mobile source emissions inventories from the PM 10 Maintenance Plan are presented in the SIP support document (APCD, 2005). The dispersion modeling for the Maintenance Plan includes mobile source contributions as well as background concentrations (APCD, 2005). Both of these trends show PM 10 increases throughout the maintenance period, with the highest values in While the tailpipe fraction of emissions declines due to tighter tailpipe emissions standards, road dust emissions increase due to increased traffic volumes. These trends are likely to continue past 2030, therefore, it was concluded that 2035 represents the year of peak emissions Professional Judgment of Impact EPA defines a project of air quality concern for PM 10 as one involving significant levels of diesel vehicle traffic or having localized air quality concerns from the SIP. Neither of these conditions applies to this project. Federal Boulevard is estimated to carry about 55,000 vehicles per day in 2035, well below the guideline of 125,000 vehicles per day being of concern (FHWA, 2006). With a posted speed limit of 35 MPH and slower speeds during peak hours due to congestion, Federal Boulevard in this area is not a major source of road dust. The project is in the central modeling area for the Denver PM 10 Maintenance Plan. The project is near some of the highest PM 10 concentration areas covered by the Maintenance Plan, but these areas were found to comply with the NAAQS through 2030 (APCD, 2005). As was mentioned previously, the PM 10 Maintenance Plan extends to 2030 while the RTP is for To overcome this disconnect, the APCD-modeled PM 10 concentrations for 2030 were increased by 5 percent because the expected traffic growth on Federal Boulevard between 2030 and 2035 is expected to be about 5 percent (FHU, 2008). This would give a maximum PM 10 concentration at APCD Receptor 660 of about 143 µg/m 3, which would still be below the NAAQS. Therefore, it is expected that a worst-case condition for the study area would be below the NAAQS through Overall, No-Action should have lower total PM 10 emissions in 2035 because of lower traffic speeds and greater overall congestion in the study area, though the difference would be small. However, PM 10 is the subject of a comprehensive Maintenance Plan for the Denver area and impacts from traffic are major considerations within the Maintenance Plan. PM 10 concentrations around Denver have been below the NAAQS even with the past growth in traffic. None of the FELSBURG HOLT & ULLEVIG Page 15
20 alternatives are expected to cause or contribute to violations of the PM 10 NAAQS. None of the alternatives are expected to interfere with the Maintenance Plan or its goals. Therefore, no impacts are expected and no mitigation is necessary for PM Evaluate Both Forms of Particulate Matter Standard (24 Hour and Annual) Effective December 18, 2006, EPA revoked the annual PM 10 standard, so it is not included in this discussion. The Denver area has been designated nonattainment, and then maintenance, due to the 24- hour PM 10 standard. The PM 10 monitoring data for the Denver area was discussed in Section 2.3, and the PM 10 concentrations have been below the NAAQS for more than a decade. Both the Maintenance Plan comparison results and the worst-case extrapolation results (Section 3.4.7) showed that the PM 10 concentrations are predicted to be below the 24-hour PM 10 NAAQS Discussion of Any Mitigation Measures As noted above, the proposed project is not expected to cause or contribute to violations of the PM 10 standard nor is the proposed project expected to interfere with the Maintenance Plan or its goals. Therefore, no mitigation is necessary to demonstrate conformity for PM 10. However, standard particulate control measures during construction will be implemented Conclusion of How Project Meets 40 CFR and As outlined above, a worst-case condition associated with the proposed project was evaluated against the PM 10 NAAQS (Section 3.4.4). The APCD modeling included contributions from roadway traffic, precursor and construction emissions, and emissions from all other sources affecting urban background concentrations. The evaluation showed that the proposed project location would not be likely to cause or contribute to violations of the PM 10 NAAQS. 3.5 Ozone As was previously discussed, O 3 is a regional pollutant (Section 2.2.3) and as such is controlled at a regional level. Emissions of O 3 precursors near a particular location may not be important because the precursors need time to mix and the right weather conditions to be present before O 3 is formed. In that time, the precursors can drift a considerable distance, so the O 3 pollution may not be near the precursor emission source. The entire Denver metropolitan area will be subject to O 3 precursor emission reduction strategies that are being developed for the Denver nonattainment area. This project and the larger regional road network must, in the aggregate, conform to the approved O 3 SIP emission budgets. That analysis must occur at the regional level, i.e. with the RTP. Therefore, the inclusion of the first phase of the proposed project in the conforming 2035 RTP satisfies conformity for the O 3 NAAQS. The later project phases will need to meet this requirement before proceeding. 3.6 Construction Impacts The overall construction for the project has the potential to last several months. Construction activities may be sources of temporary air quality impacts from fugitive dust or equipment emissions. Adjoining properties in the study area would be near construction activities when the FELSBURG HOLT & ULLEVIG Page 16
21 proposed project is built. Construction emissions differ from regular traffic emissions in several ways: Construction emissions last only for the duration of the construction period Construction activities generally are short-term, and depending on the nature of the construction operations, could last from seconds (e.g., a truck passing) to months (e.g., constructing a bridge) Construction can involve other emission sources, such as fugitive dust from ground disturbance Construction emissions tend to be intermittent and depend on the type of operation, location, and function of the equipment, and the equipment usage cycle; traffic emissions are present in a more continuous fashion after construction activities are completed There are not many sensitive areas such as residences or schools abutting Federal Boulevard in this area, but there are many within a block of the project. Even so, people in neighboring areas could be exposed to construction-related emissions. The proposed project would be similar in nature to other road projects and the construction emissions should be representative of projects of this type and magnitude. These types of projects generally do not cause meaningful air quality impacts. 3.7 Mitigation Given that air pollutants are not predicted to exceed the NAAQS in the future as a result of the proposed improvements, mitigation measures for air quality are not necessary for the project. Future emissions from on-road mobile sources will be minimized globally through several federal regulations. The Denver area SIPs for CO, O 3 and PM 10 will serve to avoid and minimize pollutant emissions from project roads. Standard emission minimization measures for construction activities are recommended (Section 3.7). Neighboring areas could be exposed to construction-related emissions and particular attention will be given to minimizing total emissions near sensitive areas such as homes. To address the temporary elevated air emissions that may be experienced during construction, standard construction mitigation measures should be incorporated into construction contracts. These include following best management practices and relevant CDOT construction specifications. These will include: Engines and exhaust systems on equipment in good working order. Equipment maintained on a regular basis, and equipment subject to inspection by the project manager to ensure maintenance. Fugitive dust systematically controlled through diligent implementation of CDOT s Standard Specifications for Road and Bridge Construction, particularly Sections , 209 and 250, and APCD s Air Pollutant Emission Notification requirements. No excessive idling of inactive equipment or vehicles and comply with CCD s idling ordinance (5 minutes). Construction equipment and vehicles using low-sulfur fuel to reduce pollutant emissions. Other emission reduction actions may include: FELSBURG HOLT & ULLEVIG Page 17
22 Stationary equipment located as far from sensitive receivers as possible (when conditions allow). More strict dust control measures near schools during school hours. Retrofit older construction vehicles to reduce emissions. 3.8 Summary Air Quality Impact Analysis Project-related air pollutants were evaluated through air quality analysis. Regional conformity for phase one of the proposed improvements has been demonstrated by inclusion in the 2035 RTP. Later phases of the project will need to be evaluated in this regard before proceeding. Relevant NAAQS air quality standards were reviewed for the future years. Future emissions from vehicles will be minimized through several federal regulations (such as emission standards) and regional controls (such as street sanding regulations). The Denver area maintenance plans that are already in place for CO and PM 10 will serve to avoid and minimize pollutant emissions from vehicles. Due to cleaner vehicles, future daily air pollutant levels for most pollutants are predicted to be lower than current levels, even with more vehicles on the roads. Total particulate matter levels may increase in the future because of more vehicles, but the preliminary analysis indicates the concentrations would meet the NAAQS. Standard emission minimization measures for construction activities, as previously described, are recommended. The proposed improvements were found not to cause violations of health-based air quality standards or other relevant evaluation criteria through the air quality analysis. FELSBURG HOLT & ULLEVIG Page 18
Air Quality Report for the North Meadows Extension to US 85 and Interstate 25
 for the North Meadows Extension to US 85 and Interstate 25 March 2010 Prepared for: Town of Castle Rock Douglas County Colorado Department of Transportation Federal Highway Administration Prepared by:
I-70 East ROD 1: Phase 1 (Central 70 Project) Air Quality Conformity Technical Report
 Air Quality Conformity Technical Report") I-70 East ROD 1: Air Quality Conformity Technical Report January 2017 I-70 East ROD 1: Air Quality Conformity Technical Report TABLE OF CONTENTS Chapter Page 1 PURPOSE OF THIS REPORT... 1 2 PROJECT DESCRIPTION...
I-70 East ROD 1: Air Quality Conformity Technical Report January 2017 I-70 East ROD 1: Air Quality Conformity Technical Report TABLE OF CONTENTS Chapter Page 1 PURPOSE OF THIS REPORT... 1 2 PROJECT DESCRIPTION...
Pollutant Averaging Time Primary Standard. Sulfur Dioxide 24 hours 0.14 ppm Ozone. 8 hour 0.08 ppm 1 hour 0.12 ppm Particulate Matter <10 µm
 4.4 AIR QUALITY The Clean Air Act (CAA) and its amendments led to the establishment by the U.S. Environmental Protection Agency (EPA) of National Ambient Air Quality Standards (NAAQS) for six criteria
FEDERAL BOULEVARD (5 TH AVENUE TO HOWARD PLACE) PLANNING ENVIRONMENTAL LINKAGE STUDY TRAFFIC NOISE IMPACT ANALYSIS
 PLANNING ENVIRONMENTAL LINKAGE STUDY TRAFFIC NOISE IMPACT ANALYSIS") FEDERAL BOULEVARD (5 TH AVENUE TO HOWARD PLACE) PLANNING ENVIRONMENTAL LINKAGE STUDY TRAFFIC NOISE IMPACT ANALYSIS Prepared for: City and County of Denver 201 West Colfax Avenue, Department 509 Denver,
FEDERAL BOULEVARD (5 TH AVENUE TO HOWARD PLACE) PLANNING ENVIRONMENTAL LINKAGE STUDY TRAFFIC NOISE IMPACT ANALYSIS Prepared for: City and County of Denver 201 West Colfax Avenue, Department 509 Denver,
Transportation Conformity Guidance for Qualitative Hot-spot Analyses in PM 2.5 and PM 10 Nonattainment and Maintenance Areas
 Transportation Conformity Guidance for Qualitative Hot-spot Analyses in PM 2.5 and PM 10 Nonattainment and Maintenance Areas United States Environmental Protection Agency Federal Highway Administration
Air Quality Technical Report PM2.5 Quantitative Hot spot Analysis. A. Introduction. B. Interagency Consultation
 Air Quality Technical Report PM2.5 Quantitative Hot spot Analysis I 65, SR44 to Southport Road (Segmented from SR44 to Main Street and Main Street to Southport Road) A. Introduction This technical report
Draft Air Quality Analysis Protocol. Detroit River International Crossing Environmental Impact Statement
 Draft Air Quality Analysis Protocol Detroit River International Crossing Environmental Impact Statement May 31, 2007 1. Introduction Under the National Environmental Policy Act (NEPA), federal agencies
4.2 Air Quality and Greenhouse Gas
 4.2 Air Quality and Greenhouse Gas Federal agencies are required under the Clean Air Act (CAA) to ensure that projects they fund (such as the Center City Connector) are in compliance with existing federal
Air Quality Technical Memorandum
 Southeast Extension Project Lincoln Station to RidgeGate Parkway Prepared for: Federal Transit Administration Prepared by: Denver Regional Transportation District May 2014 Table of Contents Page No. Chapter
A. INTRODUCTION AND METHODOLOGY
 Chapter 10: Air Quality A. INTRODUCTION AND METHODOLOGY The different alternatives being evaluated as part of the Manhattan East Side Transit Alternatives Study have the potential to result in air quality
Robin Rhinesmith and Crystal Geiger, Florida Department of Transportation (FDOT) Lindsay Baumaister, KB Environmental Sciences, Inc.
 Lindsay Baumaister, KB Environmental Sciences, Inc.") -MEMO- Date: February 21, 2019 To: From: CC: Robin Rhinesmith and Crystal Geiger, Florida Department of Transportation (FDOT) Lindsay Baumaister, KB Environmental Sciences, Inc. Steve Gordillo, WSP Subject:
-MEMO- Date: February 21, 2019 To: From: CC: Robin Rhinesmith and Crystal Geiger, Florida Department of Transportation (FDOT) Lindsay Baumaister, KB Environmental Sciences, Inc. Steve Gordillo, WSP Subject:
6.1 INTRODUCTION 6.2 REGULATORY FRAMEWORK NATIONAL AMBIENT AIR QUALITY STANDARDS COMPLIANCE STATUS TRANSPORTATION CONFORMITY
 Chapter 6 Air Quality 6.1 INTRODUCTION This chapter presents a project-level analysis of the potential for air quality impacts that could result from mobile and stationary sources of air emissions generated
A. INTRODUCTION B. POLLUTANTS FOR ANALYSIS
 Chapter 2, Section F: Air Quality A. INTRODUCTION This section examines the potential for air quality impacts due to the proposed operational and geometric changes in traffic conditions along Fulton Street
5.3 Air Quality and Greenhouse Gas Emissions
 5. NEPA 5.3 Air Quality and Greenhouse Gas Emissions For a comprehensive discussion of the Project s affected environment and cumulative impacts as it relates to air quality and greenhouse gas (GHG) emissions,
18 June 2017 PRACTITIONER S HANDBOOK AASHTO ADDRESSING AIR QUALITY ISSUES IN THE NEPA PROCESS FOR HIGHWAY PROJECTS
 AASHTO PRACTITIONER S HANDBOOK 18 June 2017 ADDRESSING AIR QUALITY ISSUES IN THE NEPA PROCESS FOR HIGHWAY PROJECTS This handbook is intended to assist practitioners in addressing air quality issues, including
Chapter 6 CO, PM 10, and Other Pollutant Air Quality Impacts and Mitigation For Project Operation
 Chapter 6 CO, PM 10, and Other Pollutant Air Quality Impacts and Mitigation For Project Operation 6.1 Introduction This Chapter addresses the recommended techniques for quantifying emissions of carbon
Final Air Quality Report
 Florida Department of Transportation - District VII County Line Road (C.R. 578) Project Development and Environment Study From U.S. 19 (S.R. 55) to U.S. 41 (S.R. 45) Work Program Item Segment Number: 257298
Air Report. Project Information PPTA/LAP. Traffic Data I-495 NORTHERN SECTION SHOULDER USE. Project Number: , C501, P101 UPC:
 Air Report Project Information Project Name: I-495 NORTHERN SECTION SHOULDER USE Project Number: 0495-029-123, C501, P101 UPC: 105130 Route Number: 495 Project Limit - From: South of Old Dominion Drive
11-1 INTRODUCTION 11-2 REGULATORY CONTEXT
 Chapter 11: Air Quality 11-1 INTRODUCTION In this chapter, the effect of the project s operation on air quality is analyzed and includes a description of the regulatory context, methods of analysis, existing
Appendix 6-1 CO Screening Memorandum
 Appendix 6-1 CO Screening Memorandum 550 Kearny Street Suite 800 San Francisco, CA 94108 415.896.5900 phone 415.896.0332 fax www.esassoc.com memorandum date December 23, 2016 to cc from subject Wade Wietgrefe,
10.0 Air Quality Introduction Current Use of Adjoining Properties Pollutants and Regulatory Setting
 10.0 Air Quality 10.1 Introduction An air quality assessment was conducted to identify the potential for impacts associated with the proposed Columbia Pike Transit Initiative project. The air quality assessment
Air Quality Technical Report
 Air Quality Technical Report January 2016 I-70 East Final Environmental Impact Statement This page intentionally left blank. I-70 East Final EIS Air Quality Technical Report TABLE OF CONTENTS Chapter Page
Air Quality Analysis Report. Appendix H. Air Quality Analysis Report
 Air Quality Analysis Report Appendix H Air Quality Analysis Report I-35W North Corridor Project EA Minnesota Department of Transportation MEMORANDUM To: From: Brett Danner SRF Consulting Group, Inc. John
2007 Chugiak-Eagle River Long-Range Transportation Plan and Transportation Improvement Program. PM-10 Air Quality Conformity Determination
 2007 Chugiak-Eagle River Long-Range Transportation Plan and 2006-2008 Transportation Improvement Program PM-10 Air Quality Conformity Determination Prepared By: Municipality of Anchorage Traffic Department
Going One Step Beyond in North Denver
 Going One Step Beyond in North Denver A Neighborhood Scale Air Pollution Modeling Assessment Part I : Predicted Mobile Emissions in 2035 Michael Ogletree Denver Environmental Health Purpose To compare
CHAPTER 11. Air Quality and the Transportation Plan
 Chapter 11. Air Quality and the Transportation Plan 159 CHAPTER 11. Air Quality and the Transportation Plan Background Air quality in Anchorage is subject to national ambient air quality standards established
Appendix K. Detroit River International Crossing Study Air Quality Impact Analysis Technical Report Addendum
 Appendix K Detroit River International Crossing Study Air Quality Impact Analysis Technical Report Addendum Detroit International River Crossing Air Quality Impact Analysis Technical Report Addendum November
MOUNTAIN VISTA SUBAREA PLAN FORT COLLINS, COLORADO TRAFFIC NOISE EVALUATION REPORT
 MOUNTAIN VISTA SUBAREA PLAN FORT COLLINS, COLORADO TRAFFIC NOISE EVALUATION REPORT Prepared for: City of Fort Collins 250 N. Mason Street Fort Collins, CO 80522 Prepared by: Felsburg Holt & Ullevig 6300
Appendix U Air Quality Technical Memorandum DRAFT ENVIRONMENTAL IMPACT STATEMENT
 Appendix U Air Quality Technical Memorandum DRAFT ENVIRONMENTAL IMPACT STATEMENT Chicago Red Line Extension Project Air Quality Technical Memorandum June 21, 2013 Updated July 27, 2015 Prepared for: Chicago
Vista Canyon Transit Center - Air Quality Technical Memorandum
 803 Camarillo Springs Road, Suite C Camarillo, California 93012 (805) 437-1900 FAX (805) 437 1901 www.impactsciences.com MEMORANDUM To: Kris Markarian, City of Santa Clarita Job No. 1046.003 From: Susan
Standard emission minimization measures for construction activities will be implemented, as indicated above.
 The nature of the proposed improvements are such that undue construction emissions should not be a concern; overall emissions should be similar to other projects of this type and magnitude. Construction
Appendix E. Air Quality Conformity Analysis
 Appendix E Air Quality Conformity Analysis AIR QUALITY CONFORMITY ANALYSIS FOR THE DRAFT 2019-2022 REGIONAL TRANSPORTATION IMPROVEMENT PROGRAM INTRODUCTION This paper documents the positive air quality
A. INTRODUCTION B. POLLUTANTS FOR ANALYSIS
 Chapter 18: Air Quality A. INTRODUCTION The potential for air quality impacts from the proposed project is examined in this chapter. Air quality impacts can be either direct or indirect. Direct impacts
DRAFT AIR QUALITY TECHNICAL MEMORANDUM
 AIR QUALITY TECHNICAL MEMORANDUM PROJECT DEVELOPMENT AND ENVIRONMENT STUDY STATE ROAD 60 GRADE SEPARATION OVER CSX RAILROAD Polk County, Florida Financial Project ID: 436559-1-22-01 Prepared for: Florida
Chapter 14: Air Quality
 Chapter 14: Air Quality Introduction and Setting Nevada County exhibits large variations in terrain and consequently exhibits large variations in climate, both of which affect air quality. The western
DRAFT 2015 OZONE CONFORMITY ANALYSIS FOR THE 2019 FEDERAL TRANSPORTATION IMPROVEMENT PROGRAM AND THE 2018 REGIONAL TRANSPORTATION PLAN
 DRAFT 2015 OZONE CONFORMITY ANALYSIS FOR THE 2019 FEDERAL TRANSPORTATION IMPROVEMENT PROGRAM AND THE 2018 REGIONAL TRANSPORTATION PLAN JANUARY 9, 2019 KINGS COUNTY ASSOCIATION OF GOVERNMENTS This report
YORK TOLL PLAZA MAINE TURNPIKE AUTHORITY AIR QUALITY REPORT. September 28, 2016 NOISE ANALYSIS REPORT MAINETURNPIKE AUTHORI TY
 NOISE ANALYSIS REPORT MAINETURNPIKE AUTHORI TY YORK TOLL PLAZA MAINE TURNPIKE AUTHORITY AIR QUALITY REPORT September 28, 2016 (Cover photograph provided by MTA) TABLE OF CONTENTS 1.0 EXECUTIVE SUMMARY...
Appendix E. Air Quality Conformity Analysis
 Appendix E Air Quality Conformity Analysis AIR QUALITY CONFORMITY ANALYSIS FOR THE 2017-2020 REGIONAL TRANSPORTATION IMPROVEMENT PROGRAM Table of Contents INTRODUCTION... 1 AIR QUALITY STATUS... 1 Figure
DRAFT Denver-North Front Range (Northern Subarea) 8-Hour Ozone Nonattainment Area Conformity Determination
 8-Hour Ozone Nonattainment Area Conformity Determination") DRAFT Denver-North Front Range (Northern Subarea) 8-Hour Ozone Nonattainment Area Conformity Determination for the North Front Range Metropolitan Planning Area FY2019-2022 Transportation Improvement Program
DRAFT Denver-North Front Range (Northern Subarea) 8-Hour Ozone Nonattainment Area Conformity Determination for the North Front Range Metropolitan Planning Area FY2019-2022 Transportation Improvement Program
Twomile Ecological Restoration Project Air Quality Report Anna Payne, Mi-Wok District Fuels Specialists August 2011
 Twomile Ecological Restoration Project Air Quality Report Anna Payne, Mi-Wok District Fuels Specialists August 2011 The National Environmental Policy Act (NEPA), the Federal Clean Air Act, and California
Section 3.2 Air Quality ENVIRONMENTAL SETTING MOJAVE DESERT AIR BASIN AIR POLLUTANTS OF CONCERN
 Section 3.2 Air Quality This section examines the air quality in the project area, includes a summary of applicable air quality regulations, and analyzes potential air quality impacts associated with the
INTERSTATE 395 EXPRESS LANES NORTHERN EXTENSION AIR QUALITY ANALYSIS TECHNICAL REPORT SEPTEMBER 2016
 INTERSTATE 395 EXPRESS LANES NORTHERN EXTENSION AIR QUALITY ANALYSIS TECHNICAL REPORT SEPTEMBER 2016 INTERSTATE 395 EXPRESS LANES NORTHERN EXTENSION Air Quality Analysis Technical Report City of Alexandria,
A. INTRODUCTION B. POLLUTANTS FOR ANALYSIS
 Chapter 18: Air Quality A. INTRODUCTION The potential for air quality impacts from the proposed project is examined in this chapter. Air quality impacts can be either direct or indirect. Direct impacts
11-1 INTRODUCTION 11-2 REGULATORY CONTEXT
 Chapter 11: Air Quality 11-1 INTRODUCTION In this chapter, the effect of the project s operation on air quality is analyzed. The regulatory context, methods of analysis, existing air quality, and the future
Environmental Consequences and Mitigation
 Chapter 4 Environmental Consequences and Mitigation 4.1 Introduction This chapter provides a detailed description of the impacts (and indirect impacts where applicable) associated with the alternatives
3 CONSTRUCTION-GENERATED CRITERIA AIR POLLUTANT AND PRECURSOR EMISSIONS
 3 CONSTRUCTION-GENERATED CRITERIA AIR POLLUTANT AND PRECURSOR EMISSIONS 3.1 INTRODUCTION Construction activities have the potential to generate a substantial amount of air pollution. In some cases, the
CONSULTANT S GUIDE AIR QUALITY PROJECT LEVEL ANALYSIS. Prepared by: Douglas Landwehr Air Quality Meteorologist. And. Amy Costello Air Quality Manager
 CONSULTANT S GUIDE AIR QUALITY PROJECT LEVEL ANALYSIS Prepared by: Douglas Landwehr Air Quality Meteorologist And Amy Costello Air Quality Manager The Air, Noise and Energy Section, Environmental Division
Qualitative Hot Spot Analysis for PM2.5 February 4, 2008
 Technical Guidance for TG-POL-01-08 Qualitative Hot Spot Analysis for PM2.5 February 4, 2008 This technical guidance provides general guidelines for performance of a qualitative hot spot analysis for particulate
The Regional Transportation Plan Appendix D. Regional Air Quality Conformity Analysis. Puget Sound Regional Council.
 The 2018 Appendix D Regional Air Quality Conformity Analysis May 2018 Puget Sound Regional Council May 2018 Funding for this document provided in part by member jurisdictions, grants from U.S. Department
Air pollution is caused by high concentrations of gases and particles emitted form combustion sources (vehicles, power plants, industries)
") AIR POLLUTION Clean Air Act & Criteria Pollutants 7.1-7.5 Motor Vehicle Emissions: 7.8 Indoor Air and Box Models: 7.12 Air Pollution Meteorology: 7.10 Gaussian Plume Modeling: 7.11 1 Air pollution is caused
AIR POLLUTION Clean Air Act & Criteria Pollutants 7.1-7.5 Motor Vehicle Emissions: 7.8 Indoor Air and Box Models: 7.12 Air Pollution Meteorology: 7.10 Gaussian Plume Modeling: 7.11 1 Air pollution is caused
Highlights from the 2012 FHWA EPA Northern Transportation and Air Quality Summit
 em summit highlights Highlights from the 2012 FHWA EPA Northern Transportation and Air Quality Summit by Kevin Black, Martin Kotsch, Michael Roberts, Greg Becoat, Melanie Zeman, Joseph Rich, Mark Glaze,
Air Q ualit y Con formity Det er minat ion a n d Document at io n 8 -Hour Ozone & P M 2.5
 AQ Air Q ualit y Con formity Det er minat ion a n d Document at io n 8 -Hour Ozone & P M 2.5 2022 Transportation t Program and related amendments t o Connected2045, t h e transportation plan for the St.
Chapter 3. Changes to Environmental Impacts of the Project
 Chapter 3 Changes to Environmental Impacts of the Project This Draft Supplemental EIR/Environmental Reevaluation (DSEIR/ER) is being prepared to evaluate the potential environmental impacts associated
5.0 AIR QUALITY. 5.1 Introduction
 5.0 AIR QUALITY 5.1 Introduction This chapter provides a summary of the detailed information in DSEIS Appendix B: Air Quality Written Reevaluation/Technical Report. The microscale carbon monoxide, regional
Technical Report Air Quality
 Technical Report Air Quality 1.0 Introduction Motorized vehicles affect air quality by emitting airborne pollutants. Changes in traffic volumes, travel patterns, and roadway locations affect air quality
2009 Amendment Cycle 2 Denver-North Front Range Joint Interim 8-Hour Ozone Conformity Determination
 2009 Amendment Cycle 2 Denver-North Front Range Joint Interim 8-Hour Ozone Conformity Determination for the DRCOG Amended Fiscally Constrained 2035 Regional Transportation Plan and the Amended 2008-2013
APPENDIX VIII AIR QUALITY CONFORMITY ANALYSIS
 2018 Kings County Regional Transportation Plan APPENDIX VIII AIR QUALITY CONFORMITY ANALYSIS H:\RTPA\2018 RTP Update\Final RTP\APPENDIX VIII - Air Quality Conformity Title Page.docx Appendix VIII CONFORMITY
2 ENVIRONMENTAL REVIEW AND THRESHOLDS OF SIGNIFICANCE
 2 ENVIRONMENTAL REVIEW AND THRESHOLDS OF SIGNIFICANCE 2.1 ENVIRONMENTAL REVIEW PROCESS The California Environmental Quality Act (CEQA) requires that public agencies (e.g., local, county, regional, and
AIR QUALITY TECHNICAL MEMORANDUM
 AIR QUALITY TECHNICAL MEMORANDUM AIR QUALITY TECHNICAL MEMORANDUM GOLDEN GLADES INTERCHANGE PD&E STUDY Miami-Dade County, Florida Financial Management Number: 428358-1-22-01 Efficient Transportation Decision
Appendix C: GHG Emissions Model
 Appendix C: GHG Emissions Model 1 METHOD OVERVIEW The Maryland Statewide Transportation Model (MSTM) Emissions Model (EM) is a CUBE-based model that uses emission rates calculated by the MOVES2010 EPA
Air Q ualit y Con formity Det er minat ion a n d Document at io n 8 -Hour Ozone & P M 2.5
 AQ Air Q ualit y Con formity Det er minat ion a n d Document at io n 8 -Hour Ozone & P M 2.5 2022 Transportation t Program and related amendments t o Connected2045, t h e transportation plan for the region.
Changes to Air Quality
 Changes to Air Quality Identifying how the Detroit River International Crossing (DRIC) study alternatives may change air quality is an important consideration in the DRIC Environmental Assessment. Air
Presentation Overview
 Assessing Near Roadway Emissions Impact and Hot-spot Modeling Matt Laurita U.S. EPA Region 2 MARAMA Transportation & Air Quality Workshop February 27, 2013 1 Presentation Overview Near roadway public health
Environmental Analysis, Chapter 4 Consequences, and Mitigation
 Environmental Analysis, Chapter 4 4.5 Air Quality This section describes the air quality conditions for the project area and analyzes both shortterm impacts of emissions during construction and long-term
4.12 AIR QUALITY INTRODUCTION
 4.12 AIR QUALITY INTRODUCTION Air quality is an environmental factor that helps to define the quality of life throughout the San Joaquin Valley. In Fresno County, ambient air quality conditions presently
2011 Amendment Cycle 1 DRCOG CO and PM 10 Conformity Determination
 2011 Amendment Cycle 1 DRCOG CO and PM 10 Conformity Determination for the Amended Fiscally Constrained 2035 Regional Transportation Plan and the Amended 2012-2017 Transportation Improvement Program Denver
Air Quality Technical Report Prepared in Support of the Supplemental Environmental Impact Statement
 Air Quality Technical Report Prepared in Support of the Supplemental Environmental Impact Statement VDOT Virginia Department of Transportation U.S. Department of Transportation Federal Highway Administration
Air Quality Analysis Technical Memorandum
 Air Quality Analysis Technical Memorandum Segment 2: State Road 400 (SR 400) / Interstate 4 (I-4) from West of SR 528 (Beachline Expressway) to West of SR 435 (Kirkman Road) Orange County (75280), Florida
VEHICLE PARTICULATE EMISSIONS ANALYSIS
 VEHICLE PARTICULATE EMISSIONS ANALYSIS Prepared for ARIZONA DEPARTMENT OF TRANSPORTATION TRANSPORTATION PLANNING DIVISION MPOs/COGs AIR QUALITY POLICY AND LOCAL PROGRAMS SECTION AND YUMA METROPOLITAN PLANNING
Appendix E Air Quality
 Appendix E Air Quality Appendix E: Air Quality A. INTRODUCTION This appendix examines the potential for air quality impacts associated with the Proposed Action, which involves the construction of a five-level
Air Quality Technical Report
 Air Quality Technical Report Loop 336 South From IH 45 to FM 1314 Montgomery County CSJ: 0338-11-056 July 2017 The environmental review, consultation, and other actions required by applicable Federal environmental
AIR QUALITY WRITTEN REEVALUATION/TECHNICAL REPORT
 APPENDIX B AIR QUALITY WRITTEN REEVALUATION/TECHNICAL REPORT TABLE OF CONTENTS 1.0 INTRODUCTION... 1 1.1 Purpose... 1 1.2 Methodology and Approach... 1 2.0... 3 2.1 2004 Analysis Methods & Prevailing Regulations/Guidelines...
July 26, Leah Martland, Air Pollution Control Division
 July 26, 2016 Leah Martland, Air Pollution Control Division National Ambient Air Quality Standards (NAAQS) Area Designations State Implementation Plans (SIP) Colorado s Ozone SIPs July 26, 2016 2 Maroon
GLNG PROJECT - ENVIRONMENTAL IMPACT STATEMENT
 6 J:\Jobs\42626220\07 Deliverables\EIS\FINAL for Public Release\6. Values and Management of Impacts\6-8 Air Quality\06 08 Air Quality (Section 6.8) FINAL PUBLIC track.doc GLNG Project - Environmental Impact
INTERCHANGE IMPROVEMENTS S T A T E P R O J E C T : , P ; U P C
 V I R G I N I A D E P A R T M E N T O F T R A N S P O R T A T I O N F A I R F A X C O U N T Y P A R K W A Y INTERCHANGE IMPROVEMENTS S T A T E P R O J E C T : 0 0 9 5-0 2 9-8 9 0, P 1 0 1 ; U P C 9 6 2
Criteria Pollutants. Sulfur Dioxide (SO 2 ) Nitrogen Oxides (NOx)
 Nitrogen Oxides (NOx)") 1) Sulfur dioxide 2) Nitrogen oxides 3) Carbon monoxide 4) Ozone 5) Particulates 6) Lead Criteria Pollutants Sulfur Dioxide (SO 2 ) SO 2 is a colorless gas that is formed from the combustion of sulfur-containing
1) Sulfur dioxide 2) Nitrogen oxides 3) Carbon monoxide 4) Ozone 5) Particulates 6) Lead Criteria Pollutants Sulfur Dioxide (SO 2 ) SO 2 is a colorless gas that is formed from the combustion of sulfur-containing
Fine Particles in the Air
 Fine Particles in the Air Presentation for STAPPA Outreach Committee Rich Damberg, EPA Office of Air Quality Planning and Standards April 6, 2004 Particulate Matter: What is It? A complex mixture of extremely
Table of Contents. (a) APPLICABILITY... 1 (b) EXEMPTIONS... 1 (c) DEFINITIONS... 1 (d) STANDARDS... 2
 APPLICABILITY... 1 (b) EXEMPTIONS... 1 (c) DEFINITIONS... 1 (d) STANDARDS... 2") RULE 20.4 NEW SOURCE REVIEW PORTABLE EMISSION UNITS (ADOPTED AND EFFECTIVE 5/17/94) (REV. ADOPTED AND EFFECTIVE 12/17/97) (REV. ADOPTED 11/4/98; EFFECTIVE 12/17/98) (REV. ADOPTED AND EFFECTIVE 4/27/16)
RULE 20.4 NEW SOURCE REVIEW PORTABLE EMISSION UNITS (ADOPTED AND EFFECTIVE 5/17/94) (REV. ADOPTED AND EFFECTIVE 12/17/97) (REV. ADOPTED 11/4/98; EFFECTIVE 12/17/98) (REV. ADOPTED AND EFFECTIVE 4/27/16)
PM 2.5 Conformity Hot-spot Analysis for Fairbanks, Alaska
 PM 2.5 Conformity Hot-spot Analysis for Fairbanks, Alaska November 24, 2010 Practical Overview While a process is needed to meet the PM 2.5 project-level requirements after December 14, 2010, it is unlikely
COMMENTS ON THE ADDITION OF THE PROPOSED I-70 EXPANSION PROJECT TO THE DENVER REGIONAL TRANSPORTATION PLAN and TRANSPORTATION IMPROVEMENT PROGRAM
 COMMENTS ON THE ADDITION OF THE PROPOSED I-70 EXPANSION PROJECT TO THE DENVER REGIONAL TRANSPORTATION PLAN and TRANSPORTATION IMPROVEMENT PROGRAM The Rocky Mountain Chapter of the Sierra Club submits these
Section 7 Environmental Constraints
 Section 7 Environmental Constraints i Yakima Valley Metropolitan and Regional Transportation Plan Public Comment DRAFT 1/27/2016 Environmental Constraints Analysis A programmatic-level review of potential
PREPARED FOR: VDOT ENVIRONMENTAL DIVISON PREPARED BY: MICHAEL BAKER INTERNATIONAL IN ASSOCIATION WITH: SC&A INC.
 Transform I-66 Inside the Beltway Investing in Multi-Modal Solutions Project Level Air Quality Analysis in Support of a Categorical Exclusion STATE PROJECT NO. : 0066-96A-358 UPC: 107371 PREPARED FOR:
A. INTRODUCTION AND METHODOLOGY
 Chapter 11: Air Quality A. INTRODUCTION AND METHODOLOGY This chapter and its accompanying appendix (Appendix I) present a project-level analysis of the potential local and regional air quality impacts
Estimated Impacts From Idling Locomotives in the Borough of Raritan, N.J. February 2008
 Jon S. Corzine Governor Department of Environmental Protection Environmental Regulation Diesel Risk Reduction Program Post Office Box 418 Trenton, New Jersey 08625-0418 Tel: (609) 292-7953, Fax: (609)
Eastside Transit Corridor Phase 2 Draft Environmental Impact Statement/ Environmental Impact Report APPENDIX R
 Eastside Transit Corridor Phase 2 Draft Environmental Impact Statement/ Environmental Impact Report APPENDIX R AIR QUALITY IMPACTS AND HEALTH RISK ASSESSMENT TECHNICAL MEMORANDUM State Clearinghouse Number:
Crittenden County NOx, VOC & CO Emission Inventory Ozone NAAQS Nonattainment
 Crittenden County NOx, VOC & CO Emission Inventory 2008 NAAQS Nonattainment 2014 TABLE OF CONTENTS 1 Introduction 2 A. Background B. Emissions Summary Section I 3 Area Source Inventory Section II 6 On-road
APPENDIX E EMISSIONS ESTIMATE FOR GENERAL CONFORMITY
 APPENDIX E EMISSIONS ESTIMATE FOR GENERAL CONFORMITY Environmental and Planning Consultants 440 Park Avenue South, 7th Floor New York, New York 10016 tel: 212-696-0670 fax: 212-213-3191 www.akrf.com Memorandum
Air Quality and Greenhouse Gas Analysis
 Air Quality and Greenhouse Gas Analysis Prepared for: BRENTWOOD DEVELOPMENTS JANUARY 2018 Prepared by: 1501 Sports Drive, Suite A Sacramento CA 95834 Office 916.372.6100 Fax 916.419.6108 INFO@raneymanagement.com
AIR QUALITY ANALYSIS. I-77/I- 81 Overlap Improvements , P100 (UPC 51441) Prepared by:
 Prepared by:") AIR QUALITY ANALYSIS I-77/I- 81 Overlap Improvements 0077-098-104, P100 (UPC 51441) Prepared by: Environmental Division Virginia Department of Transportation September 2009 TABLE OF CONTENTS Summary...
AIR QUALITY ANALYSIS I-77/I- 81 Overlap Improvements 0077-098-104, P100 (UPC 51441) Prepared by: Environmental Division Virginia Department of Transportation September 2009 TABLE OF CONTENTS Summary...
BACKGROUND TO THE 1993 GENERAL PLAN AS AMENDED
 General Plan Air Quality Element BACKGROUND TO THE 1993 GENERAL PLAN AS AMENDED Portions of the background section text were updated as part of the 2011 amendments to the County General Plan. County of
DRAFT PREPARED FOR: VDOT ENVIRONMENTAL DIVISON PREPARED BY: MICHAEL BAKER INTERNATIONAL IN ASSOCIATION WITH: SC&A INC. KB ENVIRONMENTAL SCIENCES, INC.
 DRAFT Transform I-66 Outside the Beltway Tier 2 Environmental Assessment STATE PROJECT NO. : 0066-96A-297 UPC: 105500 PREPARED FOR: VDOT ENVIRONMENTAL DIVISON PREPARED BY: MICHAEL BAKER INTERNATIONAL IN
Air quality in the vicinity of a governmental school in Kuwait
 Air Pollution XVI 237 Air quality in the vicinity of a governmental school in Kuwait E. Al-Bassam 1, V. Popov 2 & A. Khan 1 1 Environment and Urban Development Division, Kuwait Institute for Scientific
4.3 AIR QUALITY EXISTING CONDITIONS CLIMATE AND METEOROLOGY
 4.3 AIR QUALITY The information presented in this section is based on documents prepared by the Sacramento Metropolitan Air Pollution Control District (APCD), U.S. Environmental Protection Agency (EPA),
Santa Barbara County Air Pollution Control District. (Contact: Vijaya Jammalamadaka, )
") To: From: Santa Barbara County Planning Commission Santa Barbara County Air Pollution Control District Date: (Contact: Vijaya Jammalamadaka, 961-8893) Subject: Air Quality Impacts of Drive-through Facilities
To: From: Santa Barbara County Planning Commission Santa Barbara County Air Pollution Control District Date: (Contact: Vijaya Jammalamadaka, 961-8893) Subject: Air Quality Impacts of Drive-through Facilities
3.3 AIR QUALITY. Introduction. Existing Conditions. Topography, Meteorology, and Climate
 3.3 AIR QUALITY Introduction This section describes the environmental setting and effects of the proposed project with regard to air quality. Existing air quality conditions within the Santa Clara-Alum
Traffic Data Collection Programs for PM 2.5 Non-Attainment Areas
 Traffic Data Collection Programs for PM 2.5 Non-Attainment Areas Jack Stickel Alaska Department of Transportation and Public Facilities NATMEC 23 June, 2010 Traffic Data to Address Air Quality and Climate
Spokane Regional Clean Air Agency Air Quality Report - September 2011
 Spokane Regional Clean Air Agency Air Quality Report - September 211 An atmospheric high pressure ridge brought exceptionally warm, sunny and dry weather, light winds and marginal to poor ventilation to
AIR QUALITY IMPACT ANALYSIS GOLDEN VALLEY ROAD BRIDGE SANTA CLARITA, CALIFORNIA
 AIR QUALITY IMPACT ANALYSIS GOLDEN VALLEY ROAD BRIDGE SANTA CLARITA, CALIFORNIA EA No. 932589 Prepared for: 23920 Valencia Boulevard, Suite 300 Santa Clarita, California 91355 and U.S. Federal Highway
Air Quality Memorandum - DRAFT
 Air Quality Memorandum - DRAFT REPORT NO. 39 DATE February 15, 2019 SUBJECT CONFORMITY ANALYSIS FOR THE WFRC 2019-2050 REGIONAL TRANSPORTATION PLAN. ABSTRACT The FAST Act and the Clean Air Act Amendments
Air Quality Memorandum
 Air Quality Memorandum REPORT NO. 33 DATE October 22, 2015 SUBJECT **DRAFT** CONFORMITY ANALYSIS FOR THE AMENDED WFRC 2015-2040 REGIONAL TRANSPORTATION PLAN. ABSTRACT The Moving Ahead for Progress in the