NO2, SO2, PM2.5, Oh my!?! Information Session EPA R/S/L Modelers Workshop May 10, 2010
|
|
|
- Britney McKenzie
- 6 years ago
- Views:
Transcription

1 NO2, SO2, PM2.5, Oh my!?! Information Session EPA R/S/L Modelers Workshop May 10, 2010
2 Purpose & Outline Provide background and updates on permit modeling processes and technical aspects related to new NAAQS and related policy changes. What new NAAQS? Applicability of Federal PSD requirements Modeling under PSD Walk through each new NAAQS SO2, NO2, PM2.5 2
3 Ongoing National Ambient Air Quality Reviews Lead NO 2 Primary SO 2 Primary Ozone CO PM NO 2 /SO 2 Secondary Proposal New schedule being developed Jun 26, 2009 Nov 16, 2009 Jan 6, 2010 Oct 28, 2010 Nov 2010 July 12, 2011 Final Oct 15, 2008 Jan 22, 2010 Jun 2, 2010 Aug 31, 2010 May 13, 2011 July 2011 Mar 20, 2012 NOTE: Underlined dates indicate court-ordered or settlement agreement deadlines. 3
4 Anticipated NAAQS Implementation Milestones Pollutant NAAQS Promulgation Date Designations Effective (approximate date) 110(a) SIPs Due (3 yrs after NAAQS promulgation) Attainment Demonstration Due Attainment Date PM 2.5 (2006) Sept 2006 Nov 2009 Sept 2009 Nov 2012 Nov 2014/2019 Pb Oct 2008 Nov 2010/2011 (extra time for new monitors) Oct 2011 June 2012/2013 Nov 2015/2016 NO 2 (primary) SO 2 (primary) Jan 2010 Feb 2012 Jan 2013 Aug 2013 Feb 2017 June 2010 July 2012 June 2013 Jan 2014 July 2017 Ozone Aug 2010 Aug 2011 (based on data) Aug 2013 Dec 2013 (to be proposed) Dec 2017 (Moderate) CO May 2011 June 2013 May 2014 Dec 2014 May 2018 PM 2.5 (2011) July 2011 Aug 2013 July 2014 Aug 2016 Aug 2018/2023 NO 2 /SO 2 Secondary March 2012 April 2014 March 2015 Oct 2015 N/A 4
5 Primary Standards Secondary Standards Pollutant Level Averaging Time Level Averaging Time Carbon Monoxide 9 ppm (10 mg/m 3 ) 35 ppm (40 mg/m 3 ) 8-hour (1) 1-hour (1) Lead 0.15 µg/m 3 (2) Rolling 3-Month Average Same as Primary None Nitrogen Dioxide Particulate Matter (PM 10 ) 1.5 µg/m 3 Quarterly Average Same as Primary 53 ppb (3) Annual (Arithmetic Average) Same as Primary 100 ppb 1-hour (4) None 150 µg/m 3 24-hour (5) Same as Primary Particulate Matter (PM 2.5 ) 15.0 µg/m 3 Annual (6) (Arithmetic Average) Same as Primary Ozone 35 µg/m 3 24-hour (7) Same as Primary ppm (2008 std) 0.08 ppm (1997 std) 8-hour (8) 8-hour (9) Same as Primary Same as Primary 0.12 ppm 1-hour (10) Same as Primary Sulfur Dioxide 0.03 ppm Annual (Arithmetic Average) 0.14 ppm 24-hour (1) 0.5 ppm 3-hour (1) 5
6 Applicability of Federal PSD Permit Requirements for New NAAQS April 1, 2010 Steve Page memorandum states EPA generally interprets the CAA and EPA s PSD permitting program regulations to require each final PSD permit decision reflect consideration of NAAQS that are in effect at time permitting authority issues final permit. New NO2 NAAQS on Jan. 22, 2010 with final rule published in Federal Register on February 9 th and becomes effective on April 12, No grandfathering provision related to new 1-hr NAAQS for permits in process but not yet issued as of that date. 6
7 Modeling Under PSD Air quality models (screening and refined) are used in various ways under the PSD program. Step 1: Significant Impact Analysis Use of either screening or refined model to determine if emissions from PSD project alone are significant. If not significant, no further modeling required. If significant, cumulative impact analysis of PSD project and other nearby sources required for all applicable NAAQS and increments Step 2: Cumulative Impact Analysis Use of refined models to determine cumulative impacts from PSD project in conjunction with nearby sources does not cause or contribute to violations of applicable NAAQS and increments. If violation occurs, PSD policy is to determine if PSD project contributes significantly to violation at the exact time and location where violation is predicted by modeling. If PSD project does not contribute significantly at the same time and location where violation was predicted by modeling, project can move forward. If PSD project is contributes significantly, PSD permit cannot be issued until contribution to violation is mitigated. 7
8 SO2 NAAQS: Status On November 16, 2009, EPA proposed to strengthen the NAAQS for sulfur dioxide (SO2) by revising the primary SO2 standard, designed to protect public health, to a level of between 50 and 100 parts per billion (ppb) measured over 1- hour (~130 to 260 µg/m3) EPA will issue a final rule by June 2, EPA is considering the need for changes to the secondary standard under a separate review. 8
9 9
10 NO2 NAAQS: Status On January 22, 2010, EPA strengthened the health-based National Ambient Air Quality for nitrogen dioxide (NO2) by setting a new 1-hour NO2 standard at the level of 100 parts per billion (ppb) (~190 µg/m3) EPA established a new form for the 1-hour NO2 standard as the 3-year average of the 98th percentile of the annual distribution of daily maximum 1-hour average concentrations. EPA is considering the need for changes to the secondary standard under a separate review. 10
11 11
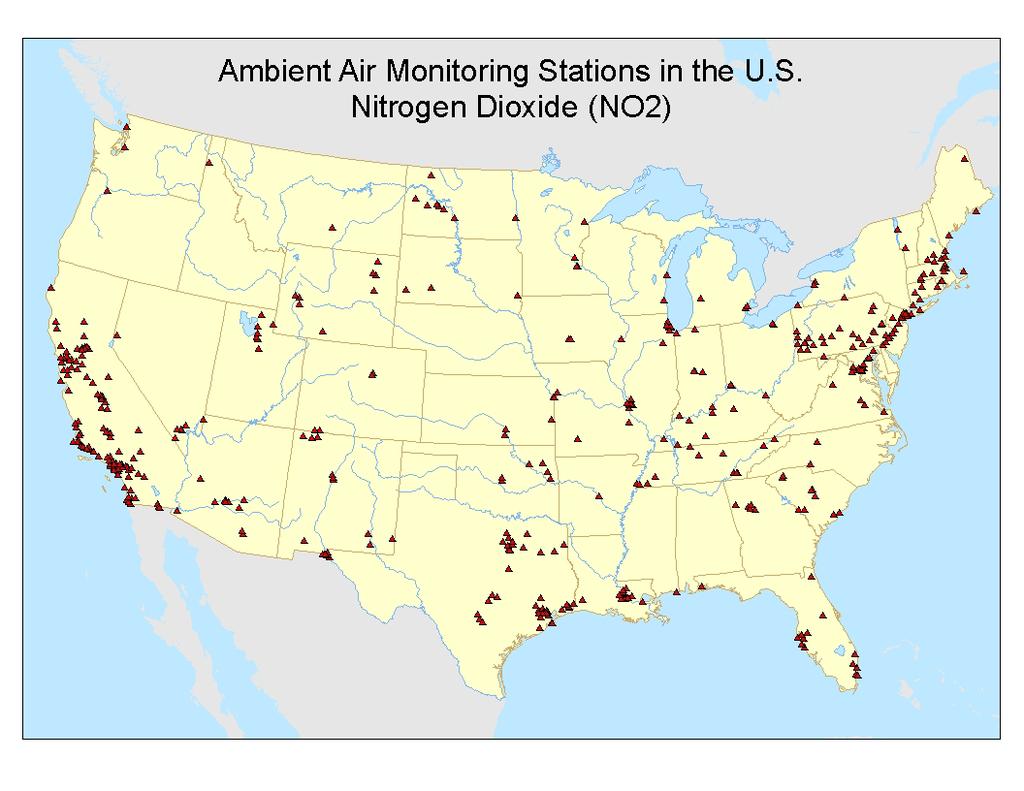
12 NO2 Monitoring Network To determine compliance with the new standard, EPA is establishing new ambient air monitoring and reporting requirements for NO2. In urban areas, monitors are required near major roads as well as in other locations where maximum concentrations are expected. Additional monitors are required in large urban areas to measure the highest concentrations of NO2 that occur more broadly across communities. Working with the states, EPA will site a subset of monitors in locations to help protect communities that are susceptible and vulnerable to NO2-related health effects. 12
 24 areas would require 2 monitors (> 2.")
13 Near Road NO 2 Monitors Are Required in 102 Urban Areas Not shown on map Anchorage, Alaska Honolulu, Hawaii San Juan, Puerto Rico Minimum Near-Road NO 2 Monitoring Requirements 78 areas would require 1 monitor (> 500,000 population) 24 areas would require 2 monitors (> 2.5 million population or road segments with annual average daily traffic counts > 250,000 vehicles) Monitors required no later then January 1, total monitors Approximately 40 additional monitors will be placed in locations to help protect communities that are susceptible and vulnerable to NO2-related health effects 13
14 Community-Wide NO 2 Monitors Are Required in 53 Urban Areas Not shown on map San Juan, Puerto Rico Honolulu, Hawaii Minimum Community-wide NO 2 Monitoring Requirements 53 areas would require 1 monitor (> 1 million population) 418 existing NO 2 monitoring sites in 2008 Many of these sites would satisfy the proposed community-wide monitoring requirements. Monitors required no later then January 1,
15 Background for NO2 NAAQS and PSD PSD rules apply to any new or revised NAAQS on the effective date of the NAAQS New 1-hour NO2 NAAQS published on Feb 9, 2010; effective date is April 12, 2010 (Page memorandum, April 1, 2010) There is concern about the anticipated difficulties in demonstrating compliance with the new NAAQS Compliance with the NO2 NAAQS has generally not been an issue, because previously only an annual NAAQS for NO2 15
16 Modeling Guidance for 1-Hour NO2 NAAQS Under PSD PSD regulations requires that modeling be conducted in accordance the Guideline on Air Quality Models Appendix W to 40 CFR Part 51 ( Guideline on Air Quality Models ) outlines recommendations and requirements for PSD permit modeling procedures AERMOD is the EPA Preferred Model for PSD modeling for all criteria pollutants. AERMOD simulates dispersion of inert pollutants and provides estimates of concentrations from 1-hour to annual averages Appendix W outlines screening level procedures to estimate conversion of NO2 from NOx emissions. EPA uses screening methods to account for the amount of conversion. 16
17 EPA Actions on Modeling Guidance Emissions Provide background on inventory development methods to generate hourly emissions for purposes of modeling NO2 Air Quality Modeling AERMOD is the EPA Preferred Model for NSR/PSD permit modeling Issue clarification memo on how Appendix W s 3-tiered screening level procedures, involving the conversion of NOx to NO2, apply to new hourly standard Tier 1 = 100% conversion Tier 2 = 75% conversion based on ambient ratios Tier 3 = Case-by-case methods based on stack ratios, etc. Provide post-processing tool to generate appropriate modeling results for comparison to new hourly standard We believe that sources will benefit significantly from use of the conversion guidance (Tier 3 options), rather than conservative assumption that all NOx is NO2 (Tier 1 option) Date for issuing guidance and providing processing tool: May 28,
18 Emissions Inventory Hourly NO2 Model emission rates for short term NAAQS are computed consistent with the requirements of Section 8.1 of Appendix W to 40 CFR Part 51, Tables 8-1 and 8-2. The maximum allowable (SIP approved process weight rate limits) or federally enforceable permit limit emission rates assuming design capacity or federally enforceable capacity limitation are used to compute hourly emissions for dispersion modeling against short term NAAQS such as the new 1-hour NO2 NAAQS. If a source assumes a limit on the hourly firing capacity of a boiler, this is reflected in the calculations. Otherwise, the design capacity of the source is used to compute the model emission rate. Permit may not have an enforceable hourly limit. Although for enforcement testing purposes, a short-term limit should exist. We understand that a state likely will not have established a limit for hourly NO2. This is just a quotation from Section 8.1 of Appendix W. Under this scenario, the maximum allowable is SIP approved equivalent of the process weight rate. States will have these backstop limits in their SIP for both SO2 and NO2 in addition to the old PM process weight rate limits. 18
19 EXAMPLE - ANNUAL Data derived for the annual state emission inventory (EI) is different than how it is computed for near-field dispersion modeling. A source computes their annual emissions based upon the AP-42 emission factor multiplied by the total annual throughput or total fuel combusted. In the 30 MMBtu/hr boiler example, the annual NOx emissions reported to the NEI is computed by: Eannual = (AP-42 emission factor) x (total annual fuel combusted) Eannual = (100 lbs/106 SCF) x ( SCF/yr) = 10,000 lbs. NOx/yr or 5 tons NOx/yr 19
20 EXAMPLE 1 HOUR An uncontrolled natural gas package boiler with a design firing rate of 30 MMBtu/hr. The AP-42 emission factor for an uncontrolled natural gas external combustion source (AP-42, Section 1.4) for firing rates less than 100 MMBtu/hr is 100 lbs. NOx/106 SCF natural combusted. The hourly emission rate is derived by converting the emission factor expressed in terms of lbs. NOx/106 SCF to lbs. NOx/MMBtu. The conversion is done by dividing the 100 lbs. NOx/106 SCF by 1,020 to convert the AP-42 factor to lbs. NOx/MMBtu. The new emission factor is now lbs. NOx/MMBtu. For this example, the source has no limit on the hourly firing rate of the boiler; therefore, the maximum hourly emissions are then computed by multiplying the design firing rate of the boiler by the new emission factor. Ehourly = lbs/mmbtu x 30MMBtu/hr = 2.94 lbs/hr Thus 2.94 lbs/hr represents the emission rate that would be input into the dispersion model for modeling against the 1-hour NO2 NAAQS to comply with emission rate requirements of Section 8.1 of Appendix W. 20
21 Current NO2 Screening Procedures Tier I Assume total conversion of NO NO2 Tier II Multiply Hourly NOx Estimate by Representative Equilibrium NO2 / NOx Ratio (Current National Default for Annual NAAQS = 0.75) Tier III Detailed Analysis Case-by-Case Basis 21
22 Current NO2 Screening Procedures in Detail Tier I Total Conversion of NO to NO2 (most conservative 100% conversion) Tier II Ambient Ratio Method (ARM) default of 0.75 likely too high for estimating hourly NO2 conversion. Requires source oriented NO2 and NOx monitoring to develop a more site specific and representative hourly NO2 to NOx conversion ratio Data unavailable in many cases to derive representative ratio Tier III: Several alternative methods currently implemented in AERMOD model Ozone Limiting Method (OLM) limits amount of NO2 conversion by available ambient ozone Plume Molar Volume Ratio Method (PVMRM) limits conversion of NO2 by amount of ambient ozone that is able to mix into the NOx plume on an hourly basis 22
23 NO2 Experiences: Discussion Gain input from participants of their understanding and experiences thus far in terms of permit modeling for NO2 Issues Concerns Areas of needs Thoughts on process Potential efforts to improve things? BREAK 23
24 PM NAAQS: Status In 2006, EPA strengthened the 24-hour fine particle standard from the 1997 level of 65 micrograms per cubic meter (μg/m3) to 35μg/m3, and retained the current annual fine particle standard at 15μg/m3. The Agency also retained the existing national 24-hour PM10 standard of 150μg/m3. EPA is currently reviewing the PM2.5 NAAQS Proposal in November 2010 Final rule in July
25 25
26 PM10 Surrogate Policy Status Pursuant to case law re surrogacy, EPA has required that sources demonstrate that PM10 is an adequate surrogate for PM2.5 for that specific application This EPA position was articulated in the LG&E Order and essentially required that the source either submit a demonstration of the adequacy of surrogacy or a PM2.5 NAAQS compliance demonstration. EPA has proposed to repeal the grandfathering provision for federal permits and end the surrogate policy early for SIP-approved States 2/11/2010 NPRM to repeal grandfather provision (allowed continued use of PM 10 Surrogate Policy for grandfathered sources) Administrative stay of grandfather provision ( to ) Second stay (via rulemaking) on grandfather provision ( to ) 26
27 Status of EPA Rulemaking: PM 2.5 Increments, SILs & SMC Proposed on September 21, 2007 Final rule package cleared OMB review Estimated promulgation date is 06/
28 PM2.5 Permit Modeling Guidance: Background August 2009 Administrative Order on LG&E essentially established two paths forward in addressing PM2.5 for permits Demonstrate adequacy of PM10 surrogacy policy for PM2.5 Conduct PM2.5 modeling March 23, 2010 Page Memorandum provides: Clarifications on demonstrating the appropriateness of PM10 surrogacy policy to comply with PM2.5 NAAQS Provides recommended modeling procedures for two main stages in PSD ambient impact analysis, i.e., Significant Impact Analysis and Cumulative Impact Analysis 28
29 PM2.5 Modeling Analysis: It s Simply Different Differences in nature of PM2.5 from other criteria pollutants and the form of the daily NAAQS standard means that standard modeling practices may not be appropriate Recognizing this and associated technical difficulties, PSD modeling for PM2.5 should be viewed as screening-level analysis similar to Appendix W approach for NO2 (Section 5.2.4) 29

30 PM2.5 Composition in Urban Areas 30
31 13 Urban/Rural Site Pairings 31

32 Regional & Local Contributions to Urban PM2.5 32

33 Local/Regional Contribution by PM2.5 Species 33
34 National map of urban excess by component for 13 areas 34
35 PM2.5 Mass (ug/m3) Daily PM2.5 Mass Birmingham, AL Annual Avg: 17.9 ug/m3 08/25/ /15/ /14/ /09/ /23/ /30/ /26/ /02/ /18/ /12/ /24/ /19/ /24/ /06/ /10/ /24/ /06/ /02/ /08/ /26/ /20/ /24/ /21/ /03/ /07/ /26/ /26/ /27/ /09/ /05/ /28/ /12/ /17/ /16/ /20/ /21/ /30/ /03/ /27/ /18/ /24/ /22/ /07/ /08/ /02/ /29/ /03/ /29/ /21/ /09/ /15/ /01/ /30/ /17/ /11/ /14/ /16/ /20/ /18/ /30/ /13/ /04/ /26/ /15/ /30/ /23/ /06/ /22/ /15/ /17/ /03/ /27/ /11/ /04/ /02/ /05/ /20/ /08/ /12/ /11/ /09/ /20/ /09/ /21/ /27/ /05/ /11/ /11/ /31/ /31/ /06/ /17/ /23/ /14/ /27/ /10/ /28/ /21/ /06/ /02/ /03/ /29/ /19/ /15/ /24/ /23/ /08/ /23/ /14/ /18/ /18/ /05/ /29/ /05/ /08/ /12/ /13/ /14/ /17/ /12/2003 Dirtiest Day % Avg of 15 dirtiest days 7.4% Avg of Intermediate days 7.5% Avg. of 15 cleanest 6.7% days 34.6% 33.3% 39.2% 37.5% 55.1% 41.3% 49.2% 48.4% 1.9% 4.2% 9.4% 18.7% SulfatesNitratesTCMCrustalFRM MassBirmingham 2003 Dirtiest Day in Dirtiest 15 Avg Intermediate Avg Cleanest 15 Avg Annual Average
36 Technical Elements of PM2.5 Permit Modeling Modeling Inventory Develop an emissions inventory of background sources to be included in modeling analysis using traditional guidance Dispersion Modeling Use AERMOD as the EPA Preferred Model for permit modeling to account for primary emissions from project sources & nearby sources, as appropriate Background Concentrations Determine representative background concentration and use DV metrics for annual and daily PM2.5 stds Accounts for majority of secondarily formed PM2.5 (to be determined extent to which account for project s contribution by its precursor emissions) 36
37 Comparison to SIL and NAAQS Significant Impact Analysis For 5 years of NWS met data, use highest average of modeled annual averages and average of first highest 24-hr average Cumulative Impact Analysis NAAQS 1 st Tier: Combine background as DV metric with modeled result (based on same procedure for SIL comparison) NAAQS 2 nd Tier (for daily): where modeled PM2.5 emissions are not temporally correlated with background PM2.5 levels then combine on a seasonal or quarterly basis NAAQS 3 rd Tier (for daily): consider more temporal and spatial pairing to determine better basis 37

38 Preliminary Analysis: Simulation of a PSD modeling effort based on Clairton, PA 38
39 Preliminary Results for Individual Years Example PM 24 Hour Data: Clairton, Pa Year Source H2 Bkg H2 Truth H2 Tier X Tier 1 Bkg H2 + Bkg H2 + Src H2 Src H Note: H2 (second highest values) estimates the 98th percentile. Tier 2 not calculated for individual years -- only for five year aggregates 39
40 Results for 3-year Design Values (Background Data Taken from Most Recent of 5 Years Used for Source Impact) Example PM 24 Hour Data: Clairton, Pa Period Source H2 Bkg H2 Truth H2 Tier X Tier 1 Tier 2 (5 year avg) (3 year avg) (3 year avg) Bgk H2 + Bkg H2 + Bkg H2 + Src H1 Src H2 Src H1 within quarter y2001_ y2002_ y2003_ y2004_ y2005_
41 PM2.5 Activities and Plans PM2.5 rule on SILs, SMCs, Increment Final rule in June 2010 (currently at OMB) OTAQ PM2.5 Hot-spot modeling guidance for conformity End of May: Publish FR notice announcing 45-day comment period and post draft guidance on OTAQ website Early Fall 2010: Publish FR notice announcing final guidance release EPA-NACAA PM2.5 Modeling Workgroup to gain input on: Development of emissions inventories Determination of Representative background Accounting for secondary formation from project source Subgroup recommendations due end of Sept
42 Planned next steps Develop draft PM2.5 permit modeling guidance by this Fall Host workshop to gain input on draft guidance Fall 2010 in???? Issue final PM2.5 permit modeling guidance by end of year or early 2011 PLEASE NOTE: PM2.5 modeling for permits will continue so seek technical input from OAQPS and vet technical issues through the Model Clearinghouse 42
Update on USEPA Actions to address Climate Change. Colleen McKaughan Associate Director, Air Division US EPA Region IX June 10, 2010
 Update on USEPA Actions to address Climate Change Colleen McKaughan Associate Director, Air Division US EPA Region IX June 10, 2010 1 Select Federal GHG Regulations Tailoring Rule & Light Duty Vehicle
Status of EPA s Guideline on Air Quality Models
 Status of EPA s Guideline on Air Quality Models 2013 R/S/L Modelers Workshop April 23, 2013 Tyler Fox Office of Air Quality Planning and Standards Overview Challenges to Our Current Guideline Recent Guidance
EPA Air Quality Modeling Updates
 EPA Air Quality Modeling Updates Tyler Fox, EPA/OAQPS Presentation for R/S/L Modelers Workshop November 15, 2016 Presentation Overview Final Revisions to EPA s Guideline on Air Quality Models Draft SILs
National Ambient Air Quality Standards
 Modeling Issues with the New National Ambient Air Quality Standards James Red Oris Solutions / BEE-Line Software Presented to North Texas Chapter of the Air & Waste Management Association August 24, 2010
ISSUES RELATED TO NO2 NAAQS MODELING
 ISSUES RELATED TO NO2 NAAQS MODELING Presented to North Texas Chapter of the Air & Waste Management Association By James Red Providence Engineering and Environmental November 17, 2015 1 OUTLINE Overview
National Ambient Air Quality Standards, Implementation Plans and Public Participation. Laura McKelvey U.S. EPA
 National Ambient Air Quality Standards, Implementation Plans and Public Participation Laura McKelvey U.S. EPA mckelvey.laura @epa.gov Topics What are the NAAQS? Why are they important? What is the air
Understanding the NAAQS and the Designation Process
 Understanding the NAAQS and the Designation Process Shawn Seals Senior Environmental Manager Office of Air Quality Indiana Department of Environmental Management (IDEM) September 21, 2016 1 Presentation
Air Quality Update. Sheila Holman, Director North Carolina Division of Air Quality. Environmental Review Commission January 18, 2011
 Air Quality Update Sheila Holman, Director North Carolina Division of Air Quality Environmental Review Commission January 18, 2011 1 Topics Status of EPA Review of National Ambient Air Quality Standards
Hot Topics: Appendix W, MERPS, and SILs
 Hot Topics: Appendix W, MERPS, and SILs Richard Chet Wayland Director, Air Quality Assessment Division Office of Air Quality Planning and Standards September 14, 2016 1 Regulatory Revisions to Appendix
PM2.5 NAAQS Implementation & Permitting in Georgia
 PM2.5 NAAQS Implementation & Permitting in Georgia Georgia Environmental Conference Jekyll Island, Georgia August 25, 2016 Brad James, P.E. Overview Current UFP Regulation (as PM 2.5 ) PM 2.5 NAAQS SIP
NO 2 NAAQS Guidance. Supervising AQS. RSL Atlanta, Ga June 7,
 NO 2 NAAQS Guidance Leland Villalvazol Supervising AQS San Joaquin Valley APCD RSL Atlanta, Ga June 7, 2011 1 NO 2 NAAQS Guidance And Tools Disclaimer The information presented herein does not represent
AIR DISPERSION MODELING
 Click to edit Master title style AIR DISPERSION MODELING Use of AERMOD for NAAQS Area Designations and State Implementation Plan Submittals SPEAKER Stewart McCollam DATE February 10, 2016 USE OF AERMOD
Spokane Regional Clean Air Agency Air Quality Report - August 2015
 Spokane Regional Clean Air Agency Air Quality Report - August 2015 Wildfire smoke pushed the Air Quality Index (AQI) for fine particulate matter (PM 2.5 ) well into the unhealthy (red) air quality range.
Complying with 1-Hour NO2 NAAQS
 Complying with 1-Hour NO2 NAAQS SESHA Hill Country Chapter November 16, 2010 Brett Jay Davis, PE Zephyr Environmental Corporation bdavis@zephyrenv.com, 512 879-6628 Presentation Outline 1. NO2 NAAQS What
Technical Manual Guideline on Air Quality Impact Modeling Analysis
 New Jersey Department of Environmental Protection Division of Air Quality Bureau of Technical Services Technical Manual 1002 Guideline on Air Quality Impact Modeling Analysis November 2009 Table of Contents
NAAQS and Other Implementation Updates
 NAAQS and Other Implementation Updates M E G A N V. B R A C H T L, R H E A J O N E S A N D V E R A KO R N Y L A K E PA - O A Q P S, A I R Q U A L I T Y P O L I C Y D I V I S I O N A A P C A FA L L M E
EPNG is herein providing supplemental environmental information, including certain attachments, intended to clarify previously submitted data.
 September 19, 2018 Federal Energy Regulatory Commission 888 First Street, N.E. Washington, D.C. 20426 Attention: Ms. Kimberly D. Bose, Secretary Re: El Paso Natural Gas Company, L.L.C.; Docket No. CP18-332-000
Final Revisions to the Primary National Ambient Air Quality Standard for Nitrogen Dioxide (NO 2 )
") Final Revisions to the Primary National Ambient Air Quality Standard for Nitrogen Dioxide (NO 2 ) General Overview Office of Air and Radiation Office of Air Quality Planning and Standards January 2010
Final Revisions to the Primary National Ambient Air Quality Standard for Nitrogen Dioxide (NO 2 ) General Overview Office of Air and Radiation Office of Air Quality Planning and Standards January 2010
Overview of Appendix W Changes
 Overview of Appendix W Changes ERM Webinar January 10, 2017 Insert then choose Picture select your picture. Right click your picture and Send to back. Copyright 2015 by ERM Worldwide Limited and/or its
Pima Association of Government s Air Quality Forum June 23, 2015
 Pima Association of Government s Air Quality Forum June 23, 2015 Proposed new 8-hour ozone standard Background Proposed NAAQS Final NAAQS National and Regional Maps Planning or Implementation Requirements
Merrill Field Lead Monitoring Report
 Municipality of Anchorage Department of Health and Human Services December 2012 Merrill Field Lead Monitoring Report Overview Merrill Field was selected by EPA as one 15 airports nationwide for inclusion
Northeast Ohio NAAQS Nonattainment Factsheet Covering the counties of Ashtabula, Cuyahoga, Geauga, Lake, Lorain, Medina, Portage and Summit
 215 November 2 1 5 Northeast Ohio NAAQS Nonattainment Factsheet Covering the counties of Ashtabula, Cuyahoga, Geauga, Lake, Lorain, Medina, Portage and Summit 1 Northeast Ohio NAAQS Nonattainment Factsheet
North Central Indiana Air Quality Update
 North Central Indiana Air Quality Update Shawn Seals Senior Environmental Manager Office of Air Quality Indiana Department of Environmental Management (IDEM) April 26, 2016 1 Presentation Summary: Geographic
6.1 INTRODUCTION 6.2 REGULATORY FRAMEWORK NATIONAL AMBIENT AIR QUALITY STANDARDS COMPLIANCE STATUS TRANSPORTATION CONFORMITY
 Chapter 6 Air Quality 6.1 INTRODUCTION This chapter presents a project-level analysis of the potential for air quality impacts that could result from mobile and stationary sources of air emissions generated
Air Quality Management (AQM) Clean Air Act (History, Objectives, NAAQS) Non-attainment regions
 Clean Air Act (History, Objectives, NAAQS) Non-attainment regions") Air Quality Management (AQM) Clean Air Act (History, Objectives, NAAQS) Non-attainment regions National Ambient Air Quality Standards (NAAQS) The Clean Air Act, which was last amended in 1990, requires
Air Quality Management (AQM) Clean Air Act (History, Objectives, NAAQS) Non-attainment regions National Ambient Air Quality Standards (NAAQS) The Clean Air Act, which was last amended in 1990, requires
MPCA Citizens Board. Michael Sandusky Director Environment Analysis and Outcomes Division
 DEPARTMENT : POLLUTION CONTROL AGENCY DATE : September 17, 2010 SF-00006-05(4/86) STATE OF MINNESOTA Office Memorandum TO : FROM : MPCA Citizens Board Michael Sandusky Director Environment Analysis and
Air Permi>ng: A Major Piece of the Puzzle or Trying to Keep All of
 Air Permi>ng: A Major Piece of the Puzzle or Trying to Keep All of the Balls in the Air Insert then choose Picture select your picture. Right click your picture and Send to back. The world s leading sustainability
Implementation Updates for 2015 Ozone NAAQS
 Implementation Updates for 2015 Ozone NAAQS Anna Marie Wood, Director, Air Quality Policy Division Richard A. Chet Wayland, Director, Air Quality Assessment Division U.S. Environmental Protection Agency
Modeling For Managers. aq-ppt5-11
 Modeling For Managers aq-ppt5-11 Types of Models Near-field *Preferred: EPA AERMOD model 50km CLASS II; Increment Far-field CALPUFF 50km 100+km CLASS I; Chemical Transformation What is used at MPCA History
Allegheny County Health Department. Air Quality in Allegheny County. GWC Workshop No. 9 August 27, 2015
 Allegheny County Health Department Air Quality in Allegheny County GWC Workshop No. 9 August 27, 2015 Who Are We Environmental Protection Agency (EPA) State & Local Programs Implement Clean Air Act through
Technical Manual Guidance on Preparing an Air Quality Modeling Protocol
 New Jersey Department of Environmental Protection Division of Air Quality Technical Manual 1002 Guidance on Preparing an Air Quality Modeling Protocol 2018 Table of Contents 1.0 Introduction... 1 1.1
Dick Sch u t tt EPA Region June 25, 2008
 New Ozone NAAQS Dick Sch tt EPA Region 4 Dick Schutt EPA Region 4 June 25, 2008 Topics to Cover National Ambient Air Quality Standards (NAAQS) 2008 8-Hour Ozone Standard EAC Status Measures for reducing
Spokane Regional Clean Air Agency Air Quality Report - September 2013
 Spokane Regional Clean Air Agency Air Quality Report - September 2013 September began with a high pressure ridge over the region and rising levels of fine particulate matter (PM 2.5 ) in Spokane. An approaching
COMMONWEALTH OF VIRGINIA STATE AIR POLLUTION CONTROL BOARD REGULATIONS FOR THE CONTROL AND ABATEMENT OF AIR POLLUTION
 COMMONWEALTH OF VIRGINIA STATE AIR POLLUTION CONTROL BOARD REGULATIONS FOR THE CONTROL AND ABATEMENT OF AIR POLLUTION 9VAC5 CHAPTER 30. AMBIENT AIR QUALITY STANDARDS. 9VAC5-30-10. General. 9VAC5-30-15.
Allegheny County Health Department
 Allegheny County Health Department Roger Westman,, Ph.D Manager, Air Quality Program April 29, 2005 PM 2.5 Nonattainment Areas Western PA LAWRENCE BEAVER BUTLER ARMSTRONG Pittsburgh Beaver Valley Area
Spokane Regional Clean Air Agency Air Quality Report - July 2014
 Spokane Regional Clean Air Agency Air Quality Report - July 2014 July and August are the hottest and driest months in the Pacific Northwest and, in addition to September, are the most active in terms of
NAAQS Update. Amy Marshall March 22, 2016
 NAAQS Update Amy Marshall March 22, 2016 Presentation Topics Current NAAQS Review Schedule and Status Ozone NAAQS Update SO 2 1-hr NAAQS Update NAAQS Modeling Update Other NAAQS related news/activities
PROPOSED ADOPTION OF RULE 3.25, FEDERAL NEW SOURCE REVIEW FOR NEW AND MODIFIED MAJOR PM2.5 SOURCES FINAL STAFF REPORT
 Yolo-Solano Air Quality Management District 1947 Galileo Court, Suite 103 Davis, CA 95618 (530)757-3650 www.ysaqmd.org PROPOSED ADOPTION OF RULE 3.25, FEDERAL NEW SOURCE REVIEW FOR NEW AND MODIFIED MAJOR
Final Ozone NAAQS - PAMS and Enhanced Monitoring Plans- Ambient Air Monitoring in NESCAUM
 Final Ozone NAAQS - PAMS and Enhanced Monitoring Plans- Ambient Air Monitoring in NESCAUM Robert Judge Air Monitoring Coordinator EPA- Region 1 Providence, RI December 7, 2016 1 Overview 2015 Final Ozone
Cumulative Impact Analysis (CIA)
") Cumulative Impact Analysis (CIA) Modeling Domain, Source Data, and Background Concentrations 2017 EPA Regional, State, and Local Modelers Workshop Research Triangle Park, NC George M. Bridgers OAQPS-AQAD-Air
Cumulative Impact Analysis (CIA) Modeling Domain, Source Data, and Background Concentrations 2017 EPA Regional, State, and Local Modelers Workshop Research Triangle Park, NC George M. Bridgers OAQPS-AQAD-Air
Spokane Regional Clean Air Agency Air Quality Report - January 2012
 Spokane Regional Clean Air Agency Air Quality Report - January 2012 Air quality in January varied as weather systems moved through the region at regular intervals. Storms on January 5, 10 and 14 helped
Spokane Regional Clean Air Agency Air Quality Report - September 2011
 Spokane Regional Clean Air Agency Air Quality Report - September 211 An atmospheric high pressure ridge brought exceptionally warm, sunny and dry weather, light winds and marginal to poor ventilation to
Update on PM2.5, SO2 and NO2 Modeling Guidance
 Update on PM2.5, SO2 and NO2 Modeling Guidance NACAA 2011 Spring Membership Meeting Chicago, IL Richard A. Chet Wayland Director, Air Quality Assessment Division 5/17/2011 U.S. Environmental Protection
National Ambient Air Quality Standards (NAAQS) March 18, 2014
 March 18, 2014") National Ambient Air Quality Standards (NAAQS) March 18, 2014 Beth M. Hassett-Sipple US EPA/Office of Air Quality Planning and Standards Health and Environmental Impacts Division/Ambient Standards Group
National Ambient Air Quality Standards (NAAQS) March 18, 2014 Beth M. Hassett-Sipple US EPA/Office of Air Quality Planning and Standards Health and Environmental Impacts Division/Ambient Standards Group
Significant Impact Levels (SILs) Guidance: Technical Basis. R. Chris Owen, EPA-OAQPS Tuesday, Nov. 15, 2016
 Guidance: Technical Basis. R. Chris Owen, EPA-OAQPS Tuesday, Nov. 15, 2016") Significant Impact Levels (SILs) Guidance: Technical Basis R. Chris Owen, EPA-OAQPS Tuesday, Nov. 15, 2016 Basis for SILs technical analysis EPA position: insignificant impact = change in air quality that
Significant Impact Levels (SILs) Guidance: Technical Basis R. Chris Owen, EPA-OAQPS Tuesday, Nov. 15, 2016 Basis for SILs technical analysis EPA position: insignificant impact = change in air quality that
New 2015 Ozone Standard and Implications. July 2016
 New 2015 Ozone Standard and Implications July 2016 What is Ozone? Ground level ozone is formed from the mixture of sunlight, NOx and VOC. 2 Effects of Ground Level Ozone 3 Effects of Ground Level Ozone
The Denver Air Toxics Assessments
 Denver Department of Environmental Health Environmental Quality Division The Denver Air Toxics Assessments Sabrina Williams Gregg Thomas City and County of Denver Department of Environmental Health Background
NSR Update/Permit Streamlining
 NSR Update/Permit Streamlining Dan deroeck, New Source Review Group Air Quality Policy Division, U.S. EPA R/S/L Modelers Workshop September 25-26, 2017 2 NSR Update Draft PM2.5/Ozone SILs Guidance Overview
November 5, Department of Environmental Quality
 November 5, 2015 North Carolina Division of Air Quality Update 2015 Air Quality Forum Mecklenburg County Air Quality Land Use & Environmental Services Agency November 5, 2014 Randy Strait North Carolina
Revisions to National Ambient Air Quality Standards for Particle Pollution. Webinar for States and Local Agencies December 19, 2012
 Revisions to National Ambient Air Quality Standards for Particle Pollution Webinar for States and Local Agencies December 19, 2012 1 Background on National Ambient Air Quality Standards The Clean Air Act
Clean Air Act History
 Clean Air Act Compliance Clean Air Act Compliance Clean Air Act History 1940s serious smog in LA, CA and Donora, PA raised concerns about air quality. 1955, Air Pollution Control Act was the 1st national
AIR POLLUTION. History of Clean Air Act Clean Air Update The Role of APCD
 AIR POLLUTION History of Clean Air Act Clean Air Update The Role of APCD History 1940-1959 1947 California Air Pollution Control Act First state legislation Permitted APCD s 1945 City of Los Angeles Bureau
Draft Guidance for PM 2.5 Permit Modeling
 Draft Guidance for PM 2.5 Permit Modeling 2013 Regional, State, and Local Modelers Workshop Dallas, TX George Bridgers OAQPS-AQAD-Air Quality Modeling Group 1 Introductions, Acknowledgements, and Disclaimers
APPENDIX E EMISSIONS ESTIMATE FOR GENERAL CONFORMITY
 APPENDIX E EMISSIONS ESTIMATE FOR GENERAL CONFORMITY Environmental and Planning Consultants 440 Park Avenue South, 7th Floor New York, New York 10016 tel: 212-696-0670 fax: 212-213-3191 www.akrf.com Memorandum
Comments on ADEQ s NAAQS SIP/Minor NSR Permitting Guidance Document
 July 2, 2015 Comments on ADEQ s NAAQS SIP/Minor NSR Permitting Guidance Document AEF submits the following comments on the ADEQ document entitled Developing the NAAQS SIP: A Look at Minor Stationary Source
2016 Nitrogen Dioxide Summary
 2016 Nitrogen Dioxide Summary New Jersey Department of Environmental Protection SOURCES Nitrogen dioxide (NO2) is a reddish-brown highly reactive gas that is formed in the air through the oxidation of
Air Quality Technical Report PM2.5 Quantitative Hot spot Analysis. A. Introduction. B. Interagency Consultation
 Air Quality Technical Report PM2.5 Quantitative Hot spot Analysis I 65, SR44 to Southport Road (Segmented from SR44 to Main Street and Main Street to Southport Road) A. Introduction This technical report
Air Quality Program Update. SWEP Regulatory Update Meeting Harrisburg, PA November 5, 2015
 Air Quality Program Update SWEP Regulatory Update Meeting Harrisburg, PA November 5, 2015 1 National Ambient Air Quality Standards Under Section 109 of the Clean Air Act (CAA), the U.S. Environmental Protection
NORTH CAROLINA PSD MODELING GUIDANCE
 NORTH CAROLINA PSD MODELING GUIDANCE January 6, 2012 NORTH CAROLINA DEPARTMENT OF ENVIRONMENT AND NATURAL RESOURCES DIVISION OF AIR QUALITY PERMITTING SECTION AIR QUALITY ANALYSIS BRANCH Introduction TABLE
Clean Air Act Emission Limits
 1 Clean Air Act Emission Limits CAA Emission Limits Authority for and Origin of Limits Federally promulgated regulations (e.g. NSPS, NESHAP, or MACT) SIP requirements PSD and N/A NSR permits 2 NSPS 3 New
Overview of Ambient Air Quality Monitoring in Singapore: Current Status
 Overview of Ambient Air Quality Monitoring in Singapore: Current Status Rajasekhar Balasubramanian Department of Civil & Environmental Engineering National University of Singapore Network of Ambient Air
EPA Permit Modeling Updates
 EPA Permit Modeling Updates Chris Owen EPA/OAQPS/Air Quality Modeling Group November 14, 2018 Permit Modeling Topics Revisions to EPA s Guideline AERMOD Development Plan AERSURFACE update IG Report Model
July 26, Leah Martland, Air Pollution Control Division
 July 26, 2016 Leah Martland, Air Pollution Control Division National Ambient Air Quality Standards (NAAQS) Area Designations State Implementation Plans (SIP) Colorado s Ozone SIPs July 26, 2016 2 Maroon
Non-attainment in Georgia
 Non-attainment in Georgia Compliance with Federal National Ambient Air Quality Standards James Kelly Georgia EPD Air Protection Branch February 22, 2010 Nonattainment in Georgia Nonattainment with the
2012 Nitrogen Dioxide Summary
 2012 Nitrogen Dioxide Summary New Jersey Department of Environmental Protection NATURE AND SOURCES Nitrogen Dioxide (NO 2 ) is a reddishbrown, highly reactive gas that is formed in the air through the
Changes to Federal Ambient Air Quality Standards and the Affect on Industry in BC
 Changes to Federal Ambient Air Quality Standards and the Affect on Industry in BC EMA of BC - 2017 Workshop February 16, 2017 Anna Henolson Outline Background New SO2 CAAQS CAAQS Implementation in British
NSR Program for PM-2.5 NAAQS. Overview of Potential Proposal
 NSR Program for PM-2.5 NAAQS Overview of Potential Proposal PM 2.5 Precursors The CAA defines air pollutant to include any pollutant that enters the air and any precursor to the formation of such pollutant
Transportation Conformity Guidance for Qualitative Hot-spot Analyses in PM 2.5 and PM 10 Nonattainment and Maintenance Areas
 Transportation Conformity Guidance for Qualitative Hot-spot Analyses in PM 2.5 and PM 10 Nonattainment and Maintenance Areas United States Environmental Protection Agency Federal Highway Administration
ATTACHMENT A. Designations and Classifications
 ATTACHMENT A Detailed Comments from the Northeast States for Coordinated Air Use Management (NESCAUM) on EPA s Proposed Rule for Implementing the 8-hour Ozone Standard (68 FR 32802-32870) Designations
NO 2 Primary NAAQS Final Rulemaking
 NO 2 Primary NAAQS Final Rulemaking NO2 Briefing February 10, 2011 Prepared for WILMAPCO By Gregory A. Becoat Air Program Planning 1 Schedule Action Date Revised NO2 NAAQS signed January 22, 2010 State/Tribe
DRAFT 2015 OZONE CONFORMITY ANALYSIS FOR THE 2019 FEDERAL TRANSPORTATION IMPROVEMENT PROGRAM AND THE 2018 REGIONAL TRANSPORTATION PLAN
 DRAFT 2015 OZONE CONFORMITY ANALYSIS FOR THE 2019 FEDERAL TRANSPORTATION IMPROVEMENT PROGRAM AND THE 2018 REGIONAL TRANSPORTATION PLAN JANUARY 9, 2019 KINGS COUNTY ASSOCIATION OF GOVERNMENTS This report
Wildfires: Smoke Impacts and Public Health Protection
 Wildfires: Smoke Impacts and Public Health Protection Julie Hunter, Senior Air Quality Specialist Washoe County Health District, Air Quality Management Division Great Basin Climate Forum December 6, 2018
CO2, SO2 and NOX Emission Rates. August 21, 2015
 August 21, 2015 This page is intentionally left blank. PJM 2015 www.pjm.com 1 P age Introduction In recent years, federal and state environmental regulations have applied or will apply more stringent restrictions
Emission and Air Quality Trends Review
 Emission and Air Quality Trends Review 1999-2011 New Mexico July 2013 1 Project Objective p To develop and present publicly available information on trends in emissions and ambient air quality in the U.S.
I-70 East ROD 1: Phase 1 (Central 70 Project) Air Quality Conformity Technical Report
 Air Quality Conformity Technical Report") I-70 East ROD 1: Air Quality Conformity Technical Report January 2017 I-70 East ROD 1: Air Quality Conformity Technical Report TABLE OF CONTENTS Chapter Page 1 PURPOSE OF THIS REPORT... 1 2 PROJECT DESCRIPTION...
I-70 East ROD 1: Air Quality Conformity Technical Report January 2017 I-70 East ROD 1: Air Quality Conformity Technical Report TABLE OF CONTENTS Chapter Page 1 PURPOSE OF THIS REPORT... 1 2 PROJECT DESCRIPTION...
ECONOMIC IMPACTS ASSOCIATED WITH AIR QUALITY
 ECONOMIC IMPACTS ASSOCIATED WITH AIR QUALITY Regions As The Building Blocks of The Global Economy May 28, 2008 Chris Klaus Senior Program Manager North Central Texas Council of Governments ECONOMIC IMPACTS
REQUEST FOR REDESIGNATION AND MAINTENANCE PLAN FOR OZONE ATTAINMENT IN THE EIGHT-HOUR OZONE BASIC NONATTAINMENT AREA
 REQUEST FOR REDESIGNATION AND MAINTENANCE PLAN FOR OZONE ATTAINMENT IN THE EIGHT-HOUR OZONE BASIC NONATTAINMENT AREA Toledo, OH: Lucas and Wood County Developed By: Ohio Environmental Protection Agency
Clean Air Fine Particle Implementation Rule for the 1997 PM2.5 Standards. Paul T Wentworth, P.E. EPA Region 3 October 31, 2007
 Clean Air Fine Particle Implementation Rule for the 1997 PM2.5 Standards Paul T Wentworth, P.E. EPA Region 3 October 31, 2007 PM2.5 Implementation Rule Issues Particle Matter: What is it? EPA s PM 2.5
Table of Contents. (a) APPLICABILITY... 1 (b) EXEMPTIONS... 1 (c) DEFINITIONS... 1 (d) STANDARDS... 2
 APPLICABILITY... 1 (b) EXEMPTIONS... 1 (c) DEFINITIONS... 1 (d) STANDARDS... 2") RULE 20.4 NEW SOURCE REVIEW PORTABLE EMISSION UNITS (ADOPTED AND EFFECTIVE 5/17/94) (REV. ADOPTED AND EFFECTIVE 12/17/97) (REV. ADOPTED 11/4/98; EFFECTIVE 12/17/98) (REV. ADOPTED AND EFFECTIVE 4/27/16)
RULE 20.4 NEW SOURCE REVIEW PORTABLE EMISSION UNITS (ADOPTED AND EFFECTIVE 5/17/94) (REV. ADOPTED AND EFFECTIVE 12/17/97) (REV. ADOPTED 11/4/98; EFFECTIVE 12/17/98) (REV. ADOPTED AND EFFECTIVE 4/27/16)
Air pollution is caused by high concentrations of gases and particles emitted form combustion sources (vehicles, power plants, industries)
") AIR POLLUTION Clean Air Act & Criteria Pollutants 7.1-7.5 Motor Vehicle Emissions: 7.8 Indoor Air and Box Models: 7.12 Air Pollution Meteorology: 7.10 Gaussian Plume Modeling: 7.11 1 Air pollution is caused
AIR POLLUTION Clean Air Act & Criteria Pollutants 7.1-7.5 Motor Vehicle Emissions: 7.8 Indoor Air and Box Models: 7.12 Air Pollution Meteorology: 7.10 Gaussian Plume Modeling: 7.11 1 Air pollution is caused
Moving Forward. the challenges to attaining clean air DAN BROWN, FAIRBANKS PM PROGRAM MANAGER OFFICE OF AIR & WASTE, EPA REGION 10
 Moving Forward the challenges to attaining clean air DAN BROWN, FAIRBANKS PM PROGRAM MANAGER OFFICE OF AIR & WASTE, EPA REGION 10 Outline There s No Easy Path EPA s role Health effects Magnitude of the
Kendra Abkowitz & Quincy Styke III
 Kendra Abkowitz & Quincy Styke III Developed with input from TCCI Air Quality Subcommittee emails and letters sent to all Title V sources Proposed - September 11, 2015 Public Hearing November 2, 2015,
NAAQS AND OTHER IMPLEMENTATION UPDATES
 NAAQS AND OTHER IMPLEMENTATION UPDATES Anna Marie Wood, Director, Air Quality Policy Division Todd Hawes, Brian Timin, Norm Possiel and Mark Houyoux, Air Quality Assessment Division U.S. EPA CenSARA Spring
Table of Contents. (a) APPLICABILITY... 1 (b) EXEMPTIONS... 1 (c) DEFINITIONS... 1 (d) STANDARDS... 2
 APPLICABILITY... 1 (b) EXEMPTIONS... 1 (c) DEFINITIONS... 1 (d) STANDARDS... 2") RULE 20.4 NEW SOURCE REVIEW PORTABLE EMISSION UNITS (ADOPTED AND EFFECTIVE 5/17/94) (REV. ADOPTED AND EFFECTIVE 12/17/97) (REV. ADOPTED 11/4/98; EFFECTIVE 12/17/98) (REV. ADOPTED AND EFFECTIVE 4/27/16)
RULE 20.4 NEW SOURCE REVIEW PORTABLE EMISSION UNITS (ADOPTED AND EFFECTIVE 5/17/94) (REV. ADOPTED AND EFFECTIVE 12/17/97) (REV. ADOPTED 11/4/98; EFFECTIVE 12/17/98) (REV. ADOPTED AND EFFECTIVE 4/27/16)
REDESIGNATION REQUEST AND MAINTENANCE PLAN FOR THE COLUMBUS ANNUAL PM 2.5 NONATTAINMENT AREA
 REDESIGNATION REQUEST AND MAINTENANCE PLAN FOR THE COLUMBUS ANNUAL PM 2.5 NONATTAINMENT AREA Coshocton, Delaware, Fairfield, Franklin, and Licking Counties, Ohio Prepared by: Ohio Environmental Protection
Appendix G. Precursor Demonstration
 Appendix G Precursor Demonstration San Joaquin Valley Air Pollution Control District 2018 PM2.5 SIP Page 1 of 23 Appendix: San Joaquin Valley PM2.5 SIP INTRODUCTION Fine particulate matter (PM2.5) is made
Presentation Overview
 Assessing Near Roadway Emissions Impact and Hot-spot Modeling Matt Laurita U.S. EPA Region 2 MARAMA Transportation & Air Quality Workshop February 27, 2013 1 Presentation Overview Near roadway public health
Capturing the Emissions Reduction Benefits of Energy Efficiency
 Capturing the Emissions Reduction Benefits of Energy Efficiency 2013 ACEEE National Symposium on Market Transformation Presented by John Shenot March 25, 2013 The Regulatory Assistance Project 50 State
A. INTRODUCTION B. POLLUTANTS FOR ANALYSIS
 Chapter 2, Section F: Air Quality A. INTRODUCTION This section examines the potential for air quality impacts due to the proposed operational and geometric changes in traffic conditions along Fulton Street
Uncertainty and Sustainable Energy Investments
 Uncertainty and Sustainable Energy Investments Michael J. Kelleher Executive Director Energy and Sustainability SUNY College Of Environmental Science and Forestry mkellehe@esf.edu Energy Inelastic Demand
Chapter 6 CO, PM 10, and Other Pollutant Air Quality Impacts and Mitigation For Project Operation
 Chapter 6 CO, PM 10, and Other Pollutant Air Quality Impacts and Mitigation For Project Operation 6.1 Introduction This Chapter addresses the recommended techniques for quantifying emissions of carbon
U.S. EPA Region 4 Air Quality Update
 U.S. EPA Region 4 Air Quality Update GA AWMA Regulatory Update Conference March 25, 2015 Beverly Banister, Director Air, Pesticides and Toxics Management Division U.S. EPA, Atlanta, GA 1 Presentation Overview
PM2.5 Designations: Evaluating Contribution of Multiple Pollutants Using the Weighted Emissions Score
 PM2.5 Designations: Evaluating Contribution of Multiple Pollutants Using the Weighted Emissions Score Discussion with STAPPA/ALAPCO May 5, 2004 Timeline for PM2.5 Implementation Program Action Date States/Tribes
Ambient air quality standards.
 3745-25-02 Ambient air quality standards. [Comment: For dates of non-regulatory government publications, publications of recognized organizations and associations, federal rules, and federal statutory
REDESIGNATION REQUEST AND MAINTENANCE PLAN FOR THE CINCINNATI-HAMILTON, OH-KY-IN 8- HOUR OZONE NONATTAINMENT AREA
 REDESIGNATION REQUEST AND MAINTENANCE PLAN FOR THE CINCINNATI-HAMILTON, OH-KY-IN 8- HOUR OZONE NONATTAINMENT AREA Butler, Clermont, Clinton, Hamilton, and Warren Counties, Ohio Prepared by: Ohio Environmental
Transportation Impacts on Air Quality
 TRANSPORTATION & AIR QUALITY WORKSHOP February 26 27, 2013 Annapolis, MD Transportation Impacts on Air Quality Chris Salmi February 26, 2013 Content The Challenge Mobile Sources Are Significant Emitters
PERMIT APPLICATION REVIEW SUMMARY
 PERMIT APPLICATION REVIEW SUMMARY New Hampshire Department of Environmental Services Air Resources Division P.O. Box 95, 29 Hazen Drive Concord, NH 03302-0095 Phone: 603-271-1370 Fax: 603-271-7053 AFS
Final Updates to National Ambient Air Quality Standards (NAAQS) for Ozone. October 2015
 for Ozone. October 2015") Final Updates to National Ambient Air Quality Standards (NAAQS) for Ozone October 2015 What we ll cover 2015 Final 8-hour Ozone Standards Primary: 70 ppb Secondary: 70 ppb Areas will meet the standards
Final Updates to National Ambient Air Quality Standards (NAAQS) for Ozone October 2015 What we ll cover 2015 Final 8-hour Ozone Standards Primary: 70 ppb Secondary: 70 ppb Areas will meet the standards
REDESIGNATION REQUEST AND MAINTENANCE PLAN FOR THE COLUMBUS ANNUAL PM 2.5 NONATTAINMENT AREA
 REDESIGNATION REQUEST AND MAINTENANCE PLAN FOR THE COLUMBUS ANNUAL PM 2.5 NONATTAINMENT AREA Coshocton, Delaware, Fairfield, Franklin, and Licking Counties, Ohio Prepared by: Ohio Environmental Protection
Comments on Hi-Test Sand PSD Modeling Protocol Submitted by Kalispel Tribe of Indians October 2017
 Comments on Hi-Test Sand PSD Modeling Protocol Submitted by Kalispel Tribe of Indians October 2017 HiTest Sand, LLC (HiTest) proposes to construct and operate a silica smelter near Newport, WA along the