ISSUES RELATED TO NO2 NAAQS MODELING
|
|
|
- Isaac Wiggins
- 6 years ago
- Views:
Transcription

1 ISSUES RELATED TO NO2 NAAQS MODELING Presented to North Texas Chapter of the Air & Waste Management Association By James Red Providence Engineering and Environmental November 17,
2 OUTLINE Overview Chemistry Back to Permitting EPA s 3 Tier Approach Culpability 2
3 OVERVIEW The NO2 NAAQS was originally promulgated in 1971 as 53 ppb (100 ug/m3), annual average. EPA did not change the standard during reviews in 1985 or 1996, affirming the 1971 standard. But then came
4 OVERVIEW January 22, 2010, US EPA announced1 a new 1-hour NO2 NAAQS of 100 ppb (188 mg/m3) (Level) The NO2 standard is the 3-year average of the 98th percentile (8 th highest) of the annual distribution of daily maximum 1-hour concentrations. (Form) [Significant Impact Level (SIL) of 4 ppb (7.5 mg/m 3 )] 5-year average for modeling
5 OVERVIEW Since promulgation of the new standard, there have been no areas (Texas or nationwide) that have been designated as nonattainment for it. (Yea!) DFW current design value = 49 ppb 5
6 OVERVIEW So, the monitoring data looks good, but what if I want to build a new facility that emits NOx? Won t that affect ambient concentrations of NOx (and therefore, NO2)? I must obtain a construction permit from TCEQ and demonstrate that my new or increased emissions will not cause or contribute to an exceedance of any NAAQS Since I can t measure my impacts before construction, dispersion modeling is used 6
 NOx = NO (nitric oxide) + NO2 (nitrogen dioxide) So, where does NOx come")
7 CHEMISTRY Although the NAAQS is based on NO2, emission estimates and calculations are typically based on total oxides of nitrogen (NOx) NOx = NO (nitric oxide) + NO2 (nitrogen dioxide) So, where does NOx come from? 7
8 CHEMISTRY Combustion CH 4 + 2(O N 2 ) -> CO 2 + 2H 2 O N 2 (0% EA) CH x 2(O N 2 ) -> CO 2 + 2H 2 O + 0.5O N 2 (25% EA) NO & NO 2 Formation: N 2 + O 2 = 2NO ½ N 2 + O 2 = NO 2 8
9 CHEMISTRY Basic NOx cycle: NO 2 + uv NO + O - O 2 + O - O 3 NO + O 3 NO 2 + O 2 Or 1 mole of O 3 converts 1 mole of NO to 1 mole of NO 2 9
10 CHEMISTRY NO 2 + uv NO + O - (photolysis) Occurs much further downwind Neglected in NO2 permit modeling Conversion of NO to NO2 by ozone more close in to source Much more important 1 mole of O 3 converts 1 mole of NO to 1 mole of NO 2 More on this in a moment 10
11 BACK TO PERMITTING. Easy as (or is it?) 1. Model (using AERMOD) proposed new or modified NOx sources at proposed maximum hourly rates 2. If maximum concentration < SIL (4 ppb or 7.5 ug/m3), exercise is complete 3. If > SIL, determine background from modeled external background sources and ambient monitoring data and compare cumulative/total impact to NAAQS 11
12 BACK TO PERMITTING. If my impact exceeds the SIL, what do I do next? Define how far out I exceed the SIL Request a point source emissions inventory from the State (Air Permits Allowable Database) that includes all sources within that area Model my sources, plus the retrieved sources, over all receptors where I modeled over the SIL Is that all? Nope 12
13 BACK TO PERMITTING. NAAQS is a total ambient measure, so what about non-point sources of NOX, like on-road mobile sources, non-road mobile sources, area sources, un-inventoried point sources, and biogenic sources? Obtain ambient monitoring data and add to the modeled impacts. 13
14 BACK TO PERMITTING. Easy enough if you have a monitor nearby to your location (within ~10 km) (but might double count impact of modeled sources) For example, urban areas like DFW typically have a good network of monitors: 14
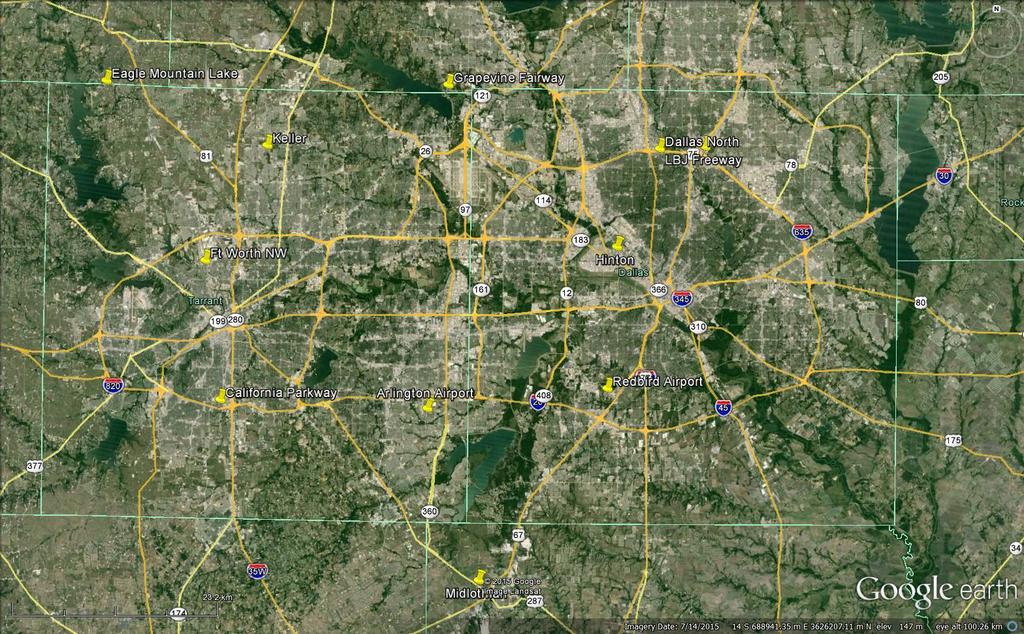
15 15
16 BACK TO PERMITTING. However, in many instances, a remote or regional monitoring site must be used and justified. That is, how is the proposed NOx source site similar to the monitoring site: Similar terrain? Similar climatology? Similar nearby emissions? County-wide down to 10 km radius This may take a little time. 16
17 NO2 3-TIER APPROACH Because of stringency of new 1-hour NO2 NAAQS, refinements to the modeling approach are needed Recall that emissions are typically NOx, but standard is NO2 EPA s Guideline on Air Quality Models lists a 3-tiered approach for refining NO2 impacts 17
18 NO2 3-TIER APPROACH Tier 1: Assume that all of the NOX is NO2 (extremely conservative) Tier 2: Use an ambient ratio of NO2/NOX (EPA current default for 1-hour NO2 is 0.8. Better, but still conservative) Tier 3: Refined screening techniques that make use of the NO + O 3 NO 2 + O 2 relationship 18
19 NO2 3-TIER APPROACH Tier 2 Ambient Ratio Method (ARM) Ties model predictions to actual observations Although 0.8 is national default, alternative ratio may be used if documented/defensible *NEW* EPA currently proposing to replace ARM with ARM2 (stay tuned!) 19
20 NO2 3-TIER APPROACH ARM2 (from API) A variable NO2/NOx ambient ratio or conversion curve was derived from the AQS monitoring data. This approach is less conservative than a fixed ratio. Because of the large number of data points, the data was sorted into bins from 20 to 600 ppb NOx each bin was 20 ppb wide. A reasonable upper bound ratio was estimated for each bin using the 98th percentile. The tail ends of the curve were limited to a maximum 0.9 and minimum 0.2 ratio. (but EPA proposal is for a minimum of 0.5) 20

21 NO2 3-TIER APPROACH ARM2 EPA proposed min API min 21
22 NO2 3-TIER APPROACH Tier 3 Refined screening techniques Ozone Limiting Method (OLM) Plume Volume Molar Ratio Method (PVMRM) Currently require approval from permitting authority (State or EPA) but EPA proposing to make these regulatory options (stay tuned!) 22
23 NO2 3-TIER APPROACH Tier 3 This approach assumes that ambient concentrations of ozone can convert NO to NO2 This does not account for downwind photolysis of NO2 in the plume Inputs required are: NO2/NOX in-stack ratio (initial condition) Equilibrium ratio (default is 0.9) Ozone data 23
24 NO2 3-TIER APPROACH Tier 3 In-stack ratio how much of the NOX in the emitted plume is already NO2, and how much of what is left can be converted from NO to NO2 Back in the day, we assumed it was 0.1 (10 percent), but EPA s national default is now 0.5 If you have measured or other test data for your particular source, you may use it 24
25 NO2 3-TIER APPROACH Tier 3 EPA has begun a project to compile in-stack ratios for various types of combustion sources, based on validated stack test data: However, it s not anywhere near being a complete compendium only about 2,300 entries at this point. 25
26 NO2 3-TIER APPROACH Tier 3 Ozone data Can be input to AERMOD in several temporal flavors (but all based on measured ozone data): Annual a single hourly value applied to each hour of the year Temporally varying: Season, Month, Day of Week, Hour/Day of Week, etc or Hourly file of ozone data (8760 or 8784 hours). Time period/year of ozone data has to match meteorological data 26
27 NO2 3-TIER APPROACH Tier 3 OLM or PVMRM? EPA has no preference for one over the other OLM uses the ozone concentration as being at the receptor. OLM calculates NO 2 based on all O 3 as being available to the NO from each source. PVMRM calculates the volume of the plume from the stack to the receptor and uses the amount of ozone within the plume. 27
28 NO2 3-TIER APPROACH OLM example: NO 2 /NO X = 0.4, [100]NO X, BG of [50]O 3 [100]NO X = [40]NO 2 + [60]NO [40]NO 2 + [60]NO + [50]O 3 = [40]NO 2 + [50]NO 2 + [10]NO + [50]O 2 28
29 NO2 3-TIER APPROACH Tier 3 PVMRM calculates the conversion of NO X to NO 2 based on the NO X moles emitted into the plume, and the amount of O3 moles contained within the volume of the plume between the source and receptor. EPA has proposed a modified version of PVMRM, called PVMRM2, to be included as the regulatory version in AERMOD (Stay tuned!) 29
30 CULPABILITY What if I ran my cumulative 1-hour NO2 modeling, and I have predicted exceedances of the NAAQS? Options can include scrubbing down the State-supplied inventory it will have errors in it But if that s been completely corrected, I can look at determining source culpability No cause or contribute to an exceedance of the NAAQS 30
31 CULPABILITY What does cause or contribute to an exceedance mean? Can t exceed the standard all by myself or Can t exceed the standard at a receptor and a time period when/where I exceed the SIL There can be predicted exceedances of the standard due to the background sources, but if you re below the SIL in those cases, you do not contribute 31
32 CULPABILITY There is a way within AERMOD to determine if your impacts are contributing to the NAAQS exceedance. Output option called MAXDCONT However, only programmed to work for 1-hour NO2, 1-hour SO2, and 24-hour PM2.5 Requires setting up Source Groups at least ALL and your sources Goes through user-defined ranks of outputs and or a threshold (NAAQS) to assess your contribution to ALL s concentration 32
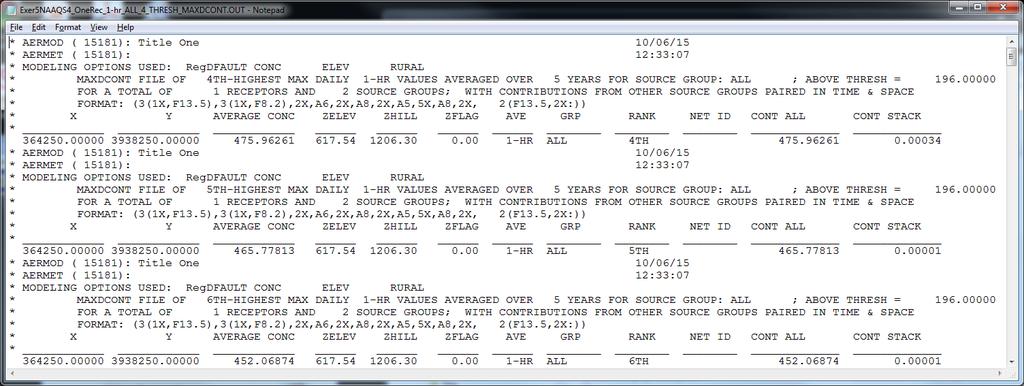
33 CULPABILITY 33
34 CULPABILITY MAXDCONT caveat: Even though you may show no significance at the NAAQS rank (98 th percentile = 8 th high), you must follow MAXDCONT ranks down until no more exceedances show up AND continue to show that your sources were not significant! 34

35 CULPABILITY 35
36 Any questions? 36
37 PRESENTED BY: James Red Providence Engineering and Environmental (512) (828)
National Ambient Air Quality Standards
 Modeling Issues with the New National Ambient Air Quality Standards James Red Oris Solutions / BEE-Line Software Presented to North Texas Chapter of the Air & Waste Management Association August 24, 2010
Complying with 1-Hour NO2 NAAQS
 Complying with 1-Hour NO2 NAAQS SESHA Hill Country Chapter November 16, 2010 Brett Jay Davis, PE Zephyr Environmental Corporation bdavis@zephyrenv.com, 512 879-6628 Presentation Outline 1. NO2 NAAQS What
NO2, SO2, PM2.5, Oh my!?! Information Session EPA R/S/L Modelers Workshop May 10, 2010
 NO2, SO2, PM2.5, Oh my!?! Information Session EPA R/S/L Modelers Workshop May 10, 2010 Purpose & Outline Provide background and updates on permit modeling processes and technical aspects related to new
Changes to Federal Ambient Air Quality Standards and the Affect on Industry in BC
 Changes to Federal Ambient Air Quality Standards and the Affect on Industry in BC EMA of BC - 2017 Workshop February 16, 2017 Anna Henolson Outline Background New SO2 CAAQS CAAQS Implementation in British
NO 2 NAAQS Guidance. Supervising AQS. RSL Atlanta, Ga June 7,
 NO 2 NAAQS Guidance Leland Villalvazol Supervising AQS San Joaquin Valley APCD RSL Atlanta, Ga June 7, 2011 1 NO 2 NAAQS Guidance And Tools Disclaimer The information presented herein does not represent
Modeling For Managers. aq-ppt5-11
 Modeling For Managers aq-ppt5-11 Types of Models Near-field *Preferred: EPA AERMOD model 50km CLASS II; Increment Far-field CALPUFF 50km 100+km CLASS I; Chemical Transformation What is used at MPCA History
Technical Manual Guideline on Air Quality Impact Modeling Analysis
 New Jersey Department of Environmental Protection Division of Air Quality Bureau of Technical Services Technical Manual 1002 Guideline on Air Quality Impact Modeling Analysis November 2009 Table of Contents
Modeling Compliance of The Federal 1-Hour NO 2 NAAQS
 Modeling Compliance of The Federal 1-Hour NO 2 NAAQS CAPCOA Guidance Document Prepared by: CAPCOA Engineering Managers Approved for Release October 27, 2011 CAPCOA Engineering Managers NO 2 Modeling Committee
AIR DISPERSION MODELING
 Click to edit Master title style AIR DISPERSION MODELING Use of AERMOD for NAAQS Area Designations and State Implementation Plan Submittals SPEAKER Stewart McCollam DATE February 10, 2016 USE OF AERMOD
APPENDIX H AIR DISPERSION MODELLING REPORT BY PROJECT MANAGEMENT LTD. (REF. CHAPTER 11 AIR QUALITY AND CLIMATIC FACTORS)
") 101050.22.RP.0001 A Environmental Impact Statement 15 th April 2005 APPENDIX H AIR DISPERSION MODELLING REPORT BY PROJECT MANAGEMENT LTD. (REF. CHAPTER 11 AIR QUALITY AND CLIMATIC FACTORS) S:\Projects\190900\101050
101050.22.RP.0001 A Environmental Impact Statement 15 th April 2005 APPENDIX H AIR DISPERSION MODELLING REPORT BY PROJECT MANAGEMENT LTD. (REF. CHAPTER 11 AIR QUALITY AND CLIMATIC FACTORS) S:\Projects\190900\101050
AERMOD Modeling of SO2 Impacts of the Luminant Martin Lake Coal Plant
 AERMOD Modeling of SO2 Impacts of the Luminant Martin Lake Coal Plant Final Report June 2011 Prepared for Sierra Club San Francisco, California Prepared by Mr. Khanh T. Tran Principal AMI Environmental
APPENDIX D MODELING AND DEPOSITION ANALYSIS
 APPENDIX D MODELING AND DEPOSITION ANALYSIS Appendix D Ambient Air Quality Dispersion and Deposition Modeling Analyses Supporting a Permit to Install Application Eagle Project Located in Michigamme Township,
Status of EPA s Guideline on Air Quality Models
 Status of EPA s Guideline on Air Quality Models 2013 R/S/L Modelers Workshop April 23, 2013 Tyler Fox Office of Air Quality Planning and Standards Overview Challenges to Our Current Guideline Recent Guidance
Use of EMVAP to Evaluate 1-hour NAAQS Compliance with Long-term Emission Rates
 Use of EMVAP to Evaluate 1-hour NAAQS Compliance with Long-term Emission Rates Bob Paine, AECOM and Dr. Eladio Knipping, EPRI Presentation to EPA RSL Workshop May 20, 2014 Outline of Presentation Emission
PM2.5 NAAQS Implementation & Permitting in Georgia
 PM2.5 NAAQS Implementation & Permitting in Georgia Georgia Environmental Conference Jekyll Island, Georgia August 25, 2016 Brad James, P.E. Overview Current UFP Regulation (as PM 2.5 ) PM 2.5 NAAQS SIP
Overview of Appendix W Changes
 Overview of Appendix W Changes ERM Webinar January 10, 2017 Insert then choose Picture select your picture. Right click your picture and Send to back. Copyright 2015 by ERM Worldwide Limited and/or its
EPA Air Quality Modeling Updates
 EPA Air Quality Modeling Updates Tyler Fox, EPA/OAQPS Presentation for R/S/L Modelers Workshop November 15, 2016 Presentation Overview Final Revisions to EPA s Guideline on Air Quality Models Draft SILs
Diesel Powered Generators for STOR & Balancing Market: NO X Modelling & Impact Assessment Guidance
 Diesel Powered Generators for STOR & Balancing Market: NO X Modelling & Impact Assessment Guidance Alun Roberts-Jones Advisor, Air Quality Modelling and Assessment Unit (AQMAU) Environment Agency 4 December
Final Revisions to the Primary National Ambient Air Quality Standard for Nitrogen Dioxide (NO 2 )
") Final Revisions to the Primary National Ambient Air Quality Standard for Nitrogen Dioxide (NO 2 ) General Overview Office of Air and Radiation Office of Air Quality Planning and Standards January 2010
Final Revisions to the Primary National Ambient Air Quality Standard for Nitrogen Dioxide (NO 2 ) General Overview Office of Air and Radiation Office of Air Quality Planning and Standards January 2010
Annual Monitoring Network Plan for the North Carolina Division of Air Quality. Volume 1 Addendum 2
 2016-2017 Annual Monitoring Network Plan for the North Carolina Division of Air Quality Volume 1 Addendum 2 December 28, 2016 North Carolina Division of Air Quality A Division of the North Carolina Department
Hot Topics: Appendix W, MERPS, and SILs
 Hot Topics: Appendix W, MERPS, and SILs Richard Chet Wayland Director, Air Quality Assessment Division Office of Air Quality Planning and Standards September 14, 2016 1 Regulatory Revisions to Appendix
Molar Ratio Method (PVMRM) and Ozone Limiting Method (OLM) for Predicting Short-term NO 2 Impacts
 and Ozone Limiting Method (OLM) for Predicting Short-term NO 2 Impacts") Review of Plume Volume Molar Ratio Method (PVMRM) and Ozone Limiting Method (OLM) for Predicting Short-term NO 2 Impacts Elizabeth Hendrick, CCM Vincent Tino, CCM Dr. Bruce Egan, CCM Dr. Steven Hanna,
Review of Plume Volume Molar Ratio Method (PVMRM) and Ozone Limiting Method (OLM) for Predicting Short-term NO 2 Impacts Elizabeth Hendrick, CCM Vincent Tino, CCM Dr. Bruce Egan, CCM Dr. Steven Hanna,
Air Quality Modelling & Assessment Unit (AQMAU)
") Air Quality Modelling & Assessment Unit (AQMAU) AQMAU reference: Project title: AQMAU--RP1 Diesel generator short term NO2 impact assessment Date requested: 13/9/216 AQMAU response date: 1/11/216 1 Summary
Air Quality Modelling & Assessment Unit (AQMAU) AQMAU reference: Project title: AQMAU--RP1 Diesel generator short term NO2 impact assessment Date requested: 13/9/216 AQMAU response date: 1/11/216 1 Summary
OZONE IN NORTH TEXAS AND THE CLEAN AIR ACT
 OZONE IN NORTH TEXAS AND THE CLEAN AIR ACT North Texas Commission Topics: North Texas Webinar Series June 25, 2014 Chris Klaus, Senior Program Manager Mindy Mize, Program Manager Air Quality Planning &
SO 2 Air Dispersion Modeling Report for White Bluff Steam Electric Station. ERM Project No The world s leading sustainability consultancy
 SO 2 Air Dispersion Modeling Report for White Bluff Steam Electric Station August 2015 ERM Project No. 0268066 www.erm.com The world s leading sustainability consultancy SO 2 Air Dispersion Modeling Report
NORTH CAROLINA PSD MODELING GUIDANCE
 NORTH CAROLINA PSD MODELING GUIDANCE January 6, 2012 NORTH CAROLINA DEPARTMENT OF ENVIRONMENT AND NATURAL RESOURCES DIVISION OF AIR QUALITY PERMITTING SECTION AIR QUALITY ANALYSIS BRANCH Introduction TABLE
Brunswick Layover Environmental Assessment (EA) Appendix D: Air Quality Assessment. September 2013
 Appendix D: Air Quality Assessment. September 2013") Brunswick Layover Environmental Assessment (EA) Appendix D: Air Quality Assessment September 2013 BRUNSWICK RAIL MAINTENANCE FACILITY POTENTIAL AIR QUALITY IMPACTS OF PROPOSED FACILITY ON NEARBY SENSITIVE
Brunswick Layover Environmental Assessment (EA) Appendix D: Air Quality Assessment September 2013 BRUNSWICK RAIL MAINTENANCE FACILITY POTENTIAL AIR QUALITY IMPACTS OF PROPOSED FACILITY ON NEARBY SENSITIVE
Ozone 101. Maricopa County Air Quality Department. September 4, Tom Moore WRAP Air Quality Program Manager WESTAR Council
 Ozone 101 Maricopa County Air Quality Department September 4, 2014 Tom Moore WRAP Air Quality Program Manager WESTAR Council 1 Ozone is an air pollutant of concern, regulated under the Clean Air Act High
EPNG is herein providing supplemental environmental information, including certain attachments, intended to clarify previously submitted data.
 September 19, 2018 Federal Energy Regulatory Commission 888 First Street, N.E. Washington, D.C. 20426 Attention: Ms. Kimberly D. Bose, Secretary Re: El Paso Natural Gas Company, L.L.C.; Docket No. CP18-332-000
O3/PM2.5/Regional Haze Modeling Guidance Summary. Brian Timin EPA/OAQPS Western Met, Emissions, and AQ Modeling Workshop June 22, 2011
 O3/PM2.5/Regional Haze Modeling Guidance Summary Brian Timin EPA/OAQPS Western Met, Emissions, and AQ Modeling Workshop June 22, 2011 1 Ozone/PM2.5/Regional Haze Modeling Guidance Guidance on the use of
Significant Impact Levels (SILs) Guidance: Technical Basis. R. Chris Owen, EPA-OAQPS Tuesday, Nov. 15, 2016
 Guidance: Technical Basis. R. Chris Owen, EPA-OAQPS Tuesday, Nov. 15, 2016") Significant Impact Levels (SILs) Guidance: Technical Basis R. Chris Owen, EPA-OAQPS Tuesday, Nov. 15, 2016 Basis for SILs technical analysis EPA position: insignificant impact = change in air quality that
Significant Impact Levels (SILs) Guidance: Technical Basis R. Chris Owen, EPA-OAQPS Tuesday, Nov. 15, 2016 Basis for SILs technical analysis EPA position: insignificant impact = change in air quality that
Review and Evaluation of the Plume Volume Molar Ratio Method (PVMRM) and Ozone Limiting Method (OLM) for short-term (1-hour average) NO2 Impacts
 and Ozone Limiting Method (OLM) for short-term (1-hour average) NO2 Impacts") Review and Evaluation of the Plume Volume Molar Ratio Method (PVMRM) and Ozone Limiting Method (OLM) for short-term (1-hour average) NO2 Impacts Prepared for: The American Petroleum Institute 1220 L Street,
Review and Evaluation of the Plume Volume Molar Ratio Method (PVMRM) and Ozone Limiting Method (OLM) for short-term (1-hour average) NO2 Impacts Prepared for: The American Petroleum Institute 1220 L Street,
STATE OF MINNESOTA MINNESOTA POLLUTION CONTROL AGENCY
 p-ear2-80b STATE OF MINNESOTA MINNESOTA POLLUTION CONTROL AGENCY IN THE MATTER OF THE DECISION ON THE NEED FOR AN ENVIRONMENTAL IMPACT STATEMENT FOR THE PROPOSED REG ALBERT LEA, LLC PROJECT FREEBORN COUNTY
Metropolitan Transit. Prepared for. Original Submittal: May 28, Resubmitted: November 10, 2010 January 21, aq5-28
 Criteria Pollutant Air Dispersion Modeling Analysis for Metro Transit s Existing Hiawatha Light Rail Vehicle Operation & Maintenance Facility, Proposed Paint Booth, and Proposed Light Rail Support Facility
What are Dr. Seuss s favorite air pollutants?
 What are Dr. Seuss s favorite air pollutants? 1 NO x and SO x 2011 The Williams Companies, Inc. All rights reserved. GPA Presentation 1 NO x and Ambient Air Chemistry as it relates to the New NO 2 1-Hour
Analysis of SO 2 Modeling Issues for Ameren Power Plants in the Greater St. Louis Area
 Analysis of SO 2 Modeling Issues for Ameren Power Plants in the Greater St. Louis Area Prepared by AECOM August 19, 2014 1. Introduction In 2010, the United States Environmental Protection Agency (EPA)
New Source Review (NSR) Reform. Modeling Guidance: Policies and Procedures
 Reform. Modeling Guidance: Policies and Procedures") New Source Review (NSR) Reform Modeling Guidance: Policies and Procedures Prepared by: Dennis Becker Craig Thorstenson January 28, 2004 Minnesota Pollution Control Agency 520 Lafayette Road North St. Paul,
New Source Review (NSR) Reform Modeling Guidance: Policies and Procedures Prepared by: Dennis Becker Craig Thorstenson January 28, 2004 Minnesota Pollution Control Agency 520 Lafayette Road North St. Paul,
STATE OF MINNESOTA MINNESOTA POLLUTION CONTROL AGENCY
 p-ear2-75b STATE OF MINNESOTA MINNESOTA POLLUTION CONTROL AGENCY IN THE MATTER OF THE DECISION ON THE NEED FOR AN ENVIRONMENTAL IMPACT STATEMENT FOR THE PROPOSED SOUTHERN MINNESOTA MUNICIPAL POWER AGENCY
Modeling Tools Used in New Jersey s 126 Petition Against Portland Power Plant
 Modeling Tools Used in New Jersey s 126 Petition Against Portland Power Plant Section 126 Clean Air Act A state may petition the Administrator for a finding that a major source or group of stationary sources
New 2015 Ozone Standard and Implications. July 2016
 New 2015 Ozone Standard and Implications July 2016 What is Ozone? Ground level ozone is formed from the mixture of sunlight, NOx and VOC. 2 Effects of Ground Level Ozone 3 Effects of Ground Level Ozone
Application of the AERMOD modeling system for air pollution dispersion in the South Pars oilfield
 First International Symposium on Urban Development: Koya as a Case Study 339 Application of the AERMOD modeling system for air pollution dispersion in the South Pars oilfield 1,2 1,2 3 M. Rouhi, H. Moradi
Attachment 2. Modeling Protocol for Duke Energy Carolinas, LLC Belews Creek Steam Station
 Attachment 2 Modeling Protocol for Duke Energy Carolinas, LLC Belews Creek Steam Station Duke Energy Belews Creek Generating Station Modeling Protocol For 1-hour SO 2 National Ambient Air Quality Standard
Technical Manual Guidance on Preparing an Air Quality Modeling Protocol
 New Jersey Department of Environmental Protection Division of Air Quality Technical Manual 1002 Guidance on Preparing an Air Quality Modeling Protocol 2018 Table of Contents 1.0 Introduction... 1 1.1
Proposed Implementation of the 2015 Ozone Standard and Related Impacts to Transportation Conformity
 Proposed Implementation of the 2015 Ozone Standard and Related Impacts to Transportation Conformity Lauren DeVore DNREC Division of Air Quality Some Basics Behind the Standard Section 109 (d) of the Clean
START OF OZONE SEASON & OTHER AIR QUALITY UPDATES. NCTCOG Public Meetings April 2017
 START OF OZONE SEASON & OTHER AIR QUALITY UPDATES NCTCOG Public Meetings April 2017 March 1 st November 30 th 2017 OZONE SEASON Current 10-County Nonattainment Area for Ozone 2 HOW OZONE IS FORMED Ozone
Regional Photochemical Modeling - Obstacles and Challenges. Extended Abstract No Prepared By:
 Regional Photochemical Modeling - Obstacles and Challenges Extended Abstract No. 33594 Prepared By: Christine L Haman, PhD Consultant Abhishek S Bhat, PhD Senior Consultant Tiffany L Gardner BREEZE Product
Evaluation of a New Screening Technique for Regional Haze Impacts Using Standard AERMOD Output
 Evaluation of a New Screening Technique for Regional Haze Impacts Using Standard AERMOD Output Bret Anderson, US Forest Service Jason Reed, SLR International Corporation James Zapert, Carter Lake Consulting
Dispersion Modeling of NO x and SO x in Phase 9 and 10 of South Pars Oilfield
 Dispersion Modeling of NO x and SO x in Phase 9 and 10 of South Pars Oilfield Maryam Rouhi 1, Hossein Moradi 2, Alireza Soffianian 3, Alireza Dahaghin 4 1 Master student of Environmental Sciences E-mail:
Cumulative Impact Analysis (CIA)
") Cumulative Impact Analysis (CIA) Modeling Domain, Source Data, and Background Concentrations 2017 EPA Regional, State, and Local Modelers Workshop Research Triangle Park, NC George M. Bridgers OAQPS-AQAD-Air
Cumulative Impact Analysis (CIA) Modeling Domain, Source Data, and Background Concentrations 2017 EPA Regional, State, and Local Modelers Workshop Research Triangle Park, NC George M. Bridgers OAQPS-AQAD-Air
NAAQS Attainment & PSD Modeling Update
 NAAQS Attainment & PSD Modeling Update Jim Boylan Manager, Planning and Support Program Georgia EPD - Air Protection Branch Air & Waste Management Association REGULATORY UPDATE CONFERENCE Atlanta, GA May
Review of GHD s Modeling Assessment and Analysis of the Coal-fired Power Stations in the Latrobe Valley. Dr. H. Andrew Gray Gray Sky Solutions
 Review of GHD s Modeling Assessment and Analysis of the Coal-fired Power Stations in the Latrobe Valley Dr. H. Andrew Gray Gray Sky Solutions September 19, 2018 1 Introduction My name is Dr. H. Andrew
Guidelines for Soil and Vegetation Analysis And Visibility Analysis
 Guidelines for Soil and Vegetation Analysis And Visibility Analysis December 2015 1. Introduction 1.1 Scope This document explains the requirements for performing a soil and vegetation analysis and a visibility
Dodge Cove Improvement District comment on Aurora Application Calculation of NO2 concentrations over residential areas
 Dodge Cove Improvement District comment on Aurora Application Calculation of NO2 concentrations over residential areas We are concerned that Aurora underestimated NO2 concentrations over Dodge Cove in
Air pollution is caused by high concentrations of gases and particles emitted form combustion sources (vehicles, power plants, industries)
") AIR POLLUTION Clean Air Act & Criteria Pollutants 7.1-7.5 Motor Vehicle Emissions: 7.8 Indoor Air and Box Models: 7.12 Air Pollution Meteorology: 7.10 Gaussian Plume Modeling: 7.11 1 Air pollution is caused
AIR POLLUTION Clean Air Act & Criteria Pollutants 7.1-7.5 Motor Vehicle Emissions: 7.8 Indoor Air and Box Models: 7.12 Air Pollution Meteorology: 7.10 Gaussian Plume Modeling: 7.11 1 Air pollution is caused
Kitimat Airshed Emissions Effects Assessment and CALPUFF Modelling
 Kitimat Airshed Emissions Effects Assessment and CALPUFF Modelling EMA of BC - May 2016 Session - Regional Air Topics Anna Henolson Topics to Cover What is Air Dispersion Modelling? Types of Models CALPUFF
Chapter 5 FUTURE OZONE AIR QUALITY
 Chapter 5 FUTURE OZONE AIR QUALITY 5 FUTURE OZONE AIR QUALITY 5.1 INTRODUCTION AND SUMMARY Air quality models are used to predict ozone concentrations in future years. These models simulate the formation,
LINN COUNTY PUBLIC HEALTH DEPARTMENT
 LINN COUNTY PUBLIC HEALTH DEPARTMENT Air Quality Division M E M O R A N D U M DATE: MARCH 13, 2009 TO: FROM: RE: CC: TONY DAUGHERTY PM2.5 PREDICTED MODELING IMPACTS OF OUTDOOR WOOD BOILERS INTRODUCTION
Policy for PSD Modeling District Rule 2410 Guidance for Determining Modeling Domain
 San Joaquin Valley Air Pollution Control District Policy for PSD Modeling District Rule 2410 Guidance for Determining Modeling Domain Approved By: Date: XXXXXXXX Arnaud Marjollet, Director of Permit Services
Comments on Hi-Test Sand PSD Modeling Protocol Submitted by Kalispel Tribe of Indians October 2017
 Comments on Hi-Test Sand PSD Modeling Protocol Submitted by Kalispel Tribe of Indians October 2017 HiTest Sand, LLC (HiTest) proposes to construct and operate a silica smelter near Newport, WA along the
Proposed Repeal of Volatile Organic Compounds (VOC) Regulations for Pulaski County
 Regulations for Pulaski County") Proposed Repeal of Volatile Organic Compounds (VOC) Regulations for Pulaski County Overview History of the Pulaski County VOC Regulations Pulaski County Air Quality Monitoring Trends Air Quality Modeling
Proposed Repeal of Volatile Organic Compounds (VOC) Regulations for Pulaski County Overview History of the Pulaski County VOC Regulations Pulaski County Air Quality Monitoring Trends Air Quality Modeling
Update on MERPs Guidance. Tyler Fox/Kirk Baker US EPA/OAQPS/Air Quality Modeling Group June 5, 2018
 Update on MERPs Guidance Tyler Fox/Kirk Baker US EPA/OAQPS/Air Quality Modeling Group June 5, 2018 Overview: Chapter 5 of Guideline Totally new chapter in 2017 revisions to Guideline Clear distinction
Air Quality in the Capital Area Planning for a More Stringent Ground-level Ozone Standard
 Air Quality in the Capital Area Planning for a More Stringent Ground-level Ozone Standard Written by Bill Gill, Kristin Hebert, and Faith Melgaard, CAPCOG Air Quality Staff August 2008 Air quality in the
The Air We Breathe. A report on Garfield County air quality monitoring results for
 The Air We Breathe A report on Garfield County air quality monitoring results for 2008-2014 Morgan Hill Environmental Health Specialist Garfield County Public Health mhill@garfield-county.com Cassie Archuleta
3 CONSTRUCTION-GENERATED CRITERIA AIR POLLUTANT AND PRECURSOR EMISSIONS
 3 CONSTRUCTION-GENERATED CRITERIA AIR POLLUTANT AND PRECURSOR EMISSIONS 3.1 INTRODUCTION Construction activities have the potential to generate a substantial amount of air pollution. In some cases, the
Applications of Source Contribution and Emissions Sensitivity Modeling to Assess Transport and Background Ozone Attribution
 Applications of Source Contribution and Emissions Sensitivity Modeling to Assess Transport and Background Ozone Attribution April 2014 Kirk Baker, Norm Possiel, Brian Timin, Pat Dolwick 1 Source Sensitivity
Air Quality Issues in Vermont Rich Poirot, Air Quality and Climate Division, VT DEC
 Air Quality Issues in Vermont Rich Poirot, Air Quality and Climate Division, VT DEC Burlington, VT on 5/25/07 PM 2.5 = 38 ug/m 3 8-hr Ozone = 0.087 ppm Slide from talk on CASAC Ozone NAAQS Review, OTC
Interim Photochemical Modeling Report
 FY14-15 PGA 582-14-40056 FY14-2 Task 3.1 Amendment 2 Interim Photochemical Modeling Report Evaluation of Potential Ozone Impacts from Proposed Electric Generating Units at Tradinghouse and Lake Creek Power
Comparison of Two Dispersion Models: A Bulk Petroleum Storage Terminal Case Study
 Comparison of Two Dispersion Models: A Bulk Petroleum Storage Terminal Case Study Prepared By: Anthony J. Schroeder BREEZE SOFTWARE 12770 Merit Drive Suite 900 Dallas, TX 75251 +1 (972) 661-8881 breeze-software.com
NO 2 Primary NAAQS Final Rulemaking
 NO 2 Primary NAAQS Final Rulemaking NO2 Briefing February 10, 2011 Prepared for WILMAPCO By Gregory A. Becoat Air Program Planning 1 Schedule Action Date Revised NO2 NAAQS signed January 22, 2010 State/Tribe
NO 2 status update. R. Chris Owen, EPA-OAQPS Clint Tillerson, EPA-OAQPS Leiran Biton, EPA-R1 Tuesday, Nov. 15, 2016
 NO 2 status update R. Chris Owen, EPA-OAQPS Clint Tillerson, EPA-OAQPS Leiran Biton, EPA-R1 Tuesday, Nov. 15, 2016 Proposed tiered NO 2 screening modeling Proposed Appendix W kept 3-tierd screening structure
DFW Conceptual Model Review
 Air Quality Division DFW Conceptual Model Review June 16, 2014 Page 1 DFW Conceptual Model Review Presented at Dallas-Fort Worth Nonattainment Area Air Quality Technical Meeting June 16, 2014 Air Quality
Appendix G. Air Quality Impact Analysis and Risk Management Review
 Appendix G Air Quality Impact Analysis and Risk Management Review Table of Contents Table of Contents... 2 1. Purpose of this Document... 4 2. Applicant... 4 3. Project Location... 5 4. Project Description...
MPCA Citizens Board. Michael Sandusky Director Environment Analysis and Outcomes Division
 DEPARTMENT : POLLUTION CONTROL AGENCY DATE : September 17, 2010 SF-00006-05(4/86) STATE OF MINNESOTA Office Memorandum TO : FROM : MPCA Citizens Board Michael Sandusky Director Environment Analysis and
AIR WATER WASTE CONSULTANTS. Audit of TCEQ s Air Dispersion Modeling Prepared in Support of Proposed OGS Permit By Rule and Standard Permit
 S OURCE ENVIRONMENTAL SCIENCES, INC. AIR WATER WASTE CONSULTANTS 4100 WESTHEIMER, SUITE 106 HOUSTON, TEXAS 77027-4427 source@source-environmental.com Phone: (713) 621-4474 Fax: (713) 621-4588 September
Appendix 9-C Cumulative PM-10 Emissions Inventories (PSD/Major Sources and Local Sources)
") Appendix 9-C Cumulative PM-10 Emissions Inventories (PSD/Major Sources and Local Sources) 9.0 Air Quality Multi-source PSD PM 10 Modeling Inventory Development A multi-source modeling emissions inventory
Appendix 9-C Cumulative PM-10 Emissions Inventories (PSD/Major Sources and Local Sources) 9.0 Air Quality Multi-source PSD PM 10 Modeling Inventory Development A multi-source modeling emissions inventory
12. Ozone pollution. Daniel J. Jacob, Atmospheric Chemistry, Harvard University, Spring 2017
 12. Ozone pollution Daniel J. Jacob, Atmospheric Chemistry, Harvard University, Spring 2017 The industrial revolution and air pollution Pittsburgh in the 1940s Make great efforts to build China into a
Pima Association of Government s Air Quality Forum June 23, 2015
 Pima Association of Government s Air Quality Forum June 23, 2015 Proposed new 8-hour ozone standard Background Proposed NAAQS Final NAAQS National and Regional Maps Planning or Implementation Requirements
Estimating Ozone and Secondary PM2.5 for Permit Related Programs. June 2015
 Estimating Ozone and Secondary PM2.5 for Permit Related Programs June 2015 1 Updates for Secondary Pollutants EPA granted Sierra Club petition (Jan 4, 2012) with commitment to update the Guideline on Air
Annual Monitoring Network Plan for the North Carolina Division of Air Quality. Volume 1 Addendum
 2016-2017 Annual Monitoring Network Plan for the North Carolina Division of Air Quality Volume 1 Addendum September 1, 2016 North Carolina Division of Air Quality A Division of the North Carolina Department
Pasadena Citizen s Advisory Council 2018 Ambient Air Monitoring Report
 Pasadena Citizen s Advisory Council 2018 Ambient Air Monitoring Report Bradley Flowers, Ph. D. Project Manager Network 1 Purpose is a voluntary industry-funded technical resource dedicated to performing
Prepared for Capital Area Council of Governments (CAPCOG) P.O. Box Austin, TX and
 P.O. Box Austin, TX and") Analysis of the Impact of Reductions in Anthropogenic NO x and VOC Emissions on Ozone Concentrations in the Austin Area using the Rider 8 Photochemical Modeling Episode for May 31-July 2, 2006 Prepared
Analysis of the Impact of Reductions in Anthropogenic NO x and VOC Emissions on Ozone Concentrations in the Austin Area using the Rider 8 Photochemical Modeling Episode for May 31-July 2, 2006 Prepared
Nova Scotia Air Zone Report. Nova Scotia Air Quality Unit, 2015
 Nova Scotia Air Zone Report Nova Scotia Air Quality Unit, 2015 Acronyms AQHI Air Quality Health Index AQMS Air Quality Management System AQU Nova Scotia Environment s Air Quality Unit CAAQS Canadian Ambient
GLNG PROJECT - ENVIRONMENTAL IMPACT STATEMENT
 6 J:\Jobs\42626220\07 Deliverables\EIS\FINAL for Public Release\6. Values and Management of Impacts\6-8 Air Quality\06 08 Air Quality (Section 6.8) FINAL PUBLIC track.doc GLNG Project - Environmental Impact
Prepared for Capital Area Council of Governments (CAPCOG) P.O. Box Austin, TX and
 P.O. Box Austin, TX and") Analysis of the Impact of Reductions in Anthropogenic NO x and VOC Emissions on Ozone Concentrations in the Austin Area using the Rider 8 Photochemical Modeling Episode for May 31-July 2, 2006 Prepared
Analysis of the Impact of Reductions in Anthropogenic NO x and VOC Emissions on Ozone Concentrations in the Austin Area using the Rider 8 Photochemical Modeling Episode for May 31-July 2, 2006 Prepared
EXAMPLE AIR QUALITY ANALYSIS CHECKLIST a
 EXAMPLE AIR QUALITY ANALYSIS CHECKLIST a 1. Source location map(s) showing location with respect to:! Urban areas b! PSD Class I areas! Nonattainment areas b! Topographic features (terrain, lakes, river
Ambient Air Monitoring
 Ambient Air Monitoring At Shannon, Co. Clare 15 th March 2011 18 th July 2012 Contents Summary........ 3 Introduction........ 4 Time Period........ 5 Siting......... 5 Monitoring Methods....... 6 Results.........
NJDEP Comments on STAPPA/ALAPCO/WESTAR List of Issues to be Addressed in the PSD Reform Initiative
 Alan Dresser New Jersey DEP, Bureau of Air Quality Evaluation 12/9/04 NJDEP Comments on STAPPA/ALAPCO/WESTAR List of Issues to be Addressed in the PSD Reform Initiative Emission Inventory Issues General
Distributed Generation. David C. Schanbacher, P.E. TCEQ Chief Engineer
 Distributed Generation David C. Schanbacher, P.E. TCEQ Chief Engineer Background Federal CAA directs EPA to establish National Ambient Air Quality Standards (NAAQS) for commonly-occurring air pollutants
Ambient Air Monitoring
 Ambient Air Monitoring At Newbridge, Co. Kildare 1 st October 2009 24 th May 2010 Contents Summary........ 3 Introduction........ 4 Time Period........ 5 Siting......... 5 Monitoring Methods....... 6 Results.........
FLINT HILLS SMOKE MODELING TOOL
 FLINT HILLS SMOKE MODELING TOOL 2013 Tallgrass Prairie & Oak Savanna Regional Fire Conference Jan 29, 2013 Tom Gross, Bureau of Air, KDHE Flint Hills Tall Grass Prairie Over 6 million acres of tall grass
Monitoring Critical Levels of Ozone in Remote Rocky Mountain Ecosystems and Exceedances of the National Ambient Air Quality Standard
 Monitoring Critical Levels of Ozone in Remote Rocky Mountain Ecosystems and Exceedances of the National Ambient Air Quality Standard Robert C. Musselman John L. Korfmacher USDA Forest Service Rocky Mountain
Evaluation of Options for Addressing Secondary PM 2.5 and Ozone Formation. Bruce Macdonald, PhD Jason Reed, CCM
 Evaluation of Options for Addressing Secondary PM 2.5 and Ozone Formation Bruce Macdonald, PhD Jason Reed, CCM 1 Overview Timeline and reasoning Regulatory drivers in the U.S. Emerging approaches Qualitative
Revised EPA Ozone Standard Effects in the West. May 15, 2008
 Revised EPA Ozone Standard Effects in the West May 15, 2008 EPA - all Ozone Monitoring Sites during 2004-06 1055 ozone monitoring sites with complete data, 2004-06 240 ozone monitoring sites with incomplete
Prepared by: Lindsey Meyers
 Air Dispersion Modeling Analysis For Verifying Compliance of Allowable Emissions with the One-Hour SO 2 and NO 2 NAAQS: UNC Manning and Cogeneration Power Plants Prepared by: Lindsey Meyers October 24,
The Clean Air Act: Multi-State, Multi-National Air Issues. It s a small multi-pollutant world after all. Jed Anderson The AL Law Group
 The Clean Air Act: Multi-State, It s a small multi-pollutant world after all. Multi-National Air Issues Jed Anderson The AL Law Group UH LAW SCHOOL ENVIRONMENTAL LAW LAW 5390 FALL 2018 Local/State/National/Global
Tips to Improve Model Results
 Tips to Improve Model Results 2019 Missouri Air Compliance Seminar Joseph Stolle, PE, Senior Environmental Engineer Wendy Vit, PE, Senior Environmental Engineer March 7, 2019 What is an Air Model? Used
NAAQS Update. Amy Marshall March 22, 2016
 NAAQS Update Amy Marshall March 22, 2016 Presentation Topics Current NAAQS Review Schedule and Status Ozone NAAQS Update SO 2 1-hr NAAQS Update NAAQS Modeling Update Other NAAQS related news/activities
Serving Two Masters; Understanding Texas and EPA Permitting Programs
 Serving Two Masters; Understanding Texas and EPA Permitting Programs 4C Health, Safety, and Environmental Conference April 3 rd, 2018 Texas and EPA Permitting Programs 2 Quick History of Air Permitting
Final Ozone/PM2.5/Regional Haze Modeling Guidance Summary. AWMA Annual Conference Brian Timin June 28, 2007
 Final Ozone/PM2.5/Regional Haze Modeling Guidance Summary AWMA Annual Conference Brian Timin June 28, 2007 Ozone/PM2.5/Regional Haze Modeling Guidance Guidance on the use of Models and Other Analyses for
Air pollution modeling of the industrial complexes and cities in the Kurdistan region using AERMOD view
 First International Symposium on Urban Development: Koya as a Case Study 333 Air pollution modeling of the industrial complexes and cities in the Kurdistan region using AERMOD view H. Moradi 1,2, M. Rouhi