TEHRAN UNIVERSITY OF MEDICAL SCIENCES. SCHOOL OFPUBLIC HEALTH US Iran Symposium on Air Pollution in Megacities, 3-5th December
|
|
|
- Abigail Mathews
- 6 years ago
- Views:
Transcription

1 TEHRAN UNIVERSITY OF MEDICAL SCIENCES SCHOOL OFPUBLIC HEALTH 1
2 Application of LUR model for chronic exposure estimation to SO 2 and PM 10 in Tehran, Iran Hasan Amini Seyed Mahmood Taghavi Shahri Sarah Henderson Masud yunesian Institute for Environmental Research and School of Public Health TUMS, Tehran, Iran 2
3 Outline Introduction Acute and chronic effects of air pollution Four generations of epidemiological studies Limitations of existing tools Conceptual framework of LUR Methods Model development Diagnostics Results Limitations Works in progress and future works 3
4 Introduction Health consequences of exposure to air pollution: Acute: Time series analysis (Ecological studies) studies Chronic: Cohort and cross sectional studies The importance of accurate exposure measurement 4
5 Introduction Generations of air pollution epidemiology (Irva Hertz-Picciotto in: Modern Epidemiology, 3rd Edition, 2008) First generation studies (similar to infectious diseases): within-community comparisons using a before-and-after design 5
6 Introduction Generations of air pollution epidemiology (Irva Hertz-Picciotto in: Modern Epidemiology, 3rd Edition, 2008) First generation studies (similar to infectious diseases): within-community comparisons using a before-and-after design Second generation (comparing communities with higher versus lower pollutant levels): Many standards and Clean Air Act of 1970 in the United States Individual and region specific confounders (some times >40) 6
7 Introduction Generations of air pollution epidemiology (Irva Hertz-Picciotto in: Modern Epidemiology, 3rd Edition, 2008) First generation studies (similar to infectious diseases): within-community comparisons using a before-and-after design Second generation (comparing communities with higher versus lower pollutant levels): Many standards and Clean Air Act of 1970 in the United States Individual and region specific confounders (some times >40) Third generation (comparisons over time within a given area): Good control of individual confounders Problem of ecological confounders Inability to evaluate chronic effects 7
8 Introduction Generations of air pollution epidemiology (Irva Hertz-Picciotto in: Modern Epidemiology, 3rd Edition, 2008) First generation studies (similar to infectious diseases): within-community comparisons using a before-and-after design Second generation (comparing communities with higher versus lower pollutant levels): Many standards and Clean Air Act of 1970 in the United States Individual and region specific confounders (some times >40) Third generation (comparisons over time within a given area): Good control of individual confounders Problem of ecological confounders Inability to evaluate chronic effects Newer generations (cohorts in which individual-level data are integrated with community-based exposure data): Better exposure measurement (Land use regression models) 8
9 Introduction : Limitation of existing tools for exposure measurement in Tehran The need to capture within cities variation on a large number of people (for cohort and cross sectional studies) Insufficient number of monitoring stations to capture all individuals Inadequacy of existing models for evaluation of personal exposure status in Tehran 9
10 Introduction : Limitation of existing tools for exposure measurement in Tehran-models 1. Proximity Based Assessment and Proxies 2. Geostatistical Interpolation Approaches Kriging, Spline, Inverse Distance Weighted, Theissen Triangulation 3. Dispersion Models Gaussian Plume Eulerian (grid-cell) LaGrangian or Puff Models 4. Integrated Meteorological-Emission (IME) Models 5. Hybrid Models 10

11 Introduction: Number of papers indexed in Pubmed by year papers in Megacities, 3-5th September 2013? 0 11
12 Conceptual framework: How does it work Construct a model to estimate the averaged level of given pollutant at each monitoring station (Y) using predictor variables (X) To measure the value of each variable in the final model for any location using digitalized map Imputing these X values in the model to get the estimation of Y value 12

.")
13 Study Area Characteristics Largest and the Most Populated City of Iran Resident Population is Roughly 8.7 million 22 Districts Surface Area =612 km 2 Average Elevation =1200 m (Roughly).... in Megacities, 3-5th 13
14 Methods Air Pollution Data sources (Response Variables): Air Quality Control Company (AQCC) 16 Department of Environment (DOE) 7 We ran the Amelia II program (10 times for each pollutant) 21 out of the 23 monitors were eligible for inclusion in the study in Megacities, 3-5th 15

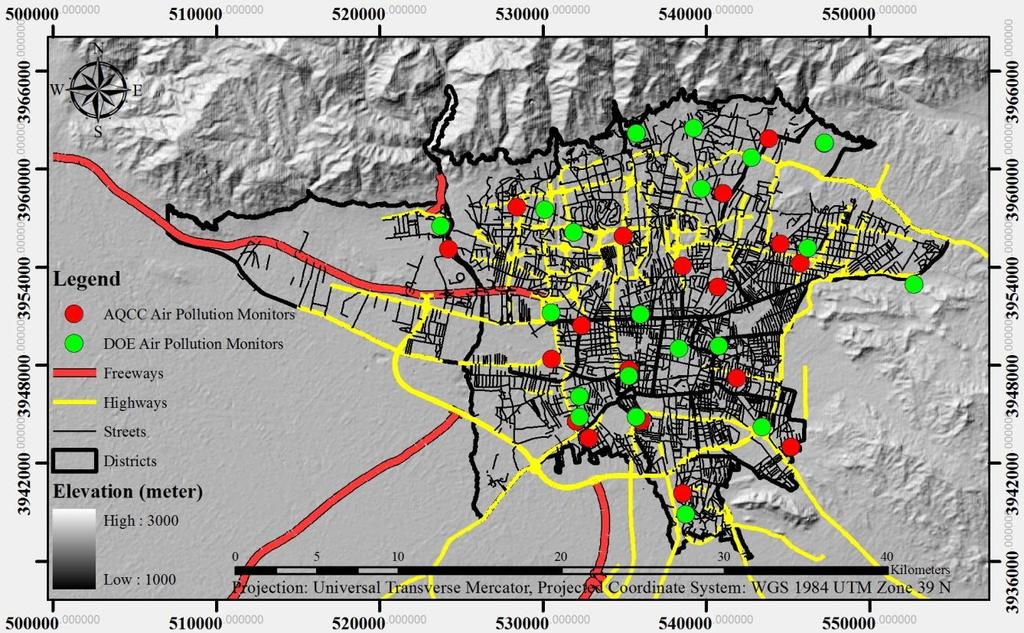
15 Methods 17 in Megacities, 3-5th
16 Methods Response variables: Annual-mean concentrations for PM 10 and SO 2 were averaged from January 01, 2010 to January 1, 2011 for all the monitors after imputation for missing data Predictor Variables: Geographic attributes that were compiled within GIS 18 in Megacities, 3-5th
17 Methods The mean of the 10 imputation-filled datasets was calculated Warmer and cooler seasons April through September October through March (Based on WHO guidelines for countries in the Northern hemisphere) 20
18 Methods 210 potentially predictive variables (PPVs) in six classes and 73 sub-classes Traffic Surrogates Land Use Distance Variables Population Density Product Variables Geographic Location 21
19 Methods Traffic Surrogates The vehicular network in buffers with different radii around the air pollution monitoring stations 22
20 Methods Land Use Ten land use types within buffers around the stations: Residential Green space Urban facilities Industrial/workshop Official/commercial Transportation Military Agriculture Arid/undeveloped Other 23
21 Methods Distance Variables The distance (and natural logarithm of the distance) from each station to all of the Traffic Surrogate and Land Use types, and to a variety of other features (Due to exponential decay in air pollutant concentrations with increasing distance from pollution sources) 24
22 Methods Population Density The total population; and the population excluding unemployed people and children less than five years of age 25
23 Methods Product Variables The products of variables in the Traffic Surrogates class divided by variables in the Distance Variables class 26
24 Methods Geographic Location The elevation of each monitoring site, obtained from a digital elevation model of Tehran in meters above sea level A slope variable 27
25 Methods The raw GIS inputs were all in vector format (Originating from the Japan International Cooperation Agency (JICA) and the Centre for Earthquake and Environmental Studies of Tehran) The final predictive variables were all in raster format with a horizontal resolution of 5 meters 28
26 Methods: Model development and diagnostics A step-by-step algorithm considered four key pieces of information: Consistency with a priori assumptions about the direction of the effect for each variable A p-value of < 0.1 Increases in R 2 for a leave-one-out crossvalidation (LOOCV) A multicollinearity index called the variance inflation factor (VIF) 29
27 Methods: Model development and diagnostics The algorithm was programmed as a function in the R statistical package A single variable linear regression model for each of the PPVs in the eligible pool (210 to begin) Models check for consistency (with a priori assumptions, p-value and the variable with the strongest LOOCV R 2 value 30
28 Methods: Model development and diagnostics All possible second variables were added to the retained single variable model, similarly In the third step, all possible third variables were added to the two variable model, similarly Each variable was also removed from the model, and the LOOCV R2 value was calculated 31
29 Methods: Model development and diagnostics If any of the resulting two variable models had a higher LOOCV R 2 value than the model elevated from the second step, the elevated model was replaced and the third step was restarted If not, the third step model with the highest LOOCV R 2 value was elevated to the fourth step This process was followed until the LOOCV R 2 value could no longer be increased by the addition of further variables 32
30 Methods: Model development and diagnostics - LOOCV First we built a model using 20 stations omitting the first one Then we estimated the level air pollution of omitted station (y) using the model (x) Then we built the model again, omitting the second station and using the remaining other 20 stations This process was repeated for all monitoring station The Pearson correlation coefficient and its square was used as an index 33
31 Mehtods: Model development and diagnostics Multicollinearity: If VIF greater than 10, that model was considered unacceptable Sequentially removing each variable from the available pool of variables stability check of the models: Minimum, maximum, and coefficient of variation for the set of coefficients for the LOOCV 34
32 Methods: Regression mapping Raster cells outside of the buffer zones as null All null values for the Distance Variables class were set to zero All null values for the Product Variables class were set to the maximum values for the layers The Raster Calculator of the ArcGIS Spatial Analyst extension was used A quantification limit (QL) for predictions at the low end of the concentration distributions, defined as the lowest measured concentration divided by square root of 2 Very high predictions were set to 120% of the maximum observed concentrations 35
33 Results Of the 210 variables generated, 19 (9%) were significantly predictive in one or more of the LUR models SO 2 Annual: 6 SO 2 cooler: 7 SO 2 warmer: 7 PM 10 annual:4 PM 10 cooler:5 PM 10 warmer:4 36
34 Results The adjusted R 2 ranged from 0.83 to 0.93 for SO 2 and ranged from 0.53 to 0.72 for PM 10 models respectively The R 2 values for the leave-one-out cross validations ranged from 0.61 to 0.82 for the SO 2 models, and from 0.48 to 0.63 for the PM 10 models 37
35 Results: Model stability The minimum and maximum of the LOOCV coefficients had the same direction for all variables in all models For SO 2, the maximum coefficients of variation for the LOOCV coefficients in the annual, cooler season, and warmer season models were 12.2%, 10.2%, and 17.9%, respectively For PM 10, the maximum coefficients of variation for the LOOCV coefficients in the annual, cooler season, and warmer season models were 10.8%, 10.4%, and 8.5%, respectively 39

36 Results: Estimated annual SO 2 and PM 10 concentrations from the final land use regression models 40
37 Limitations Relatively small sample size (usually monitoring stations have been used) Using LOOCR R 2 instead of Model adjusted R 2 (as the LOOCV tends to be less in models with lower monitoring stations) Using governmental monitoring stations (did not use location allocation approach) 41
38 Works in progress using LUR Deterioration of Multiple sclerosis Low birth weight Childhood Leukemia Breast cancer District specific life expectancy (in 22 districts) 42
39 Future works Construction of models for other criteria air pollutants Construction of models capturing both spatial and temporal variations (real time LUR models) Using location allocation approach 43
40 Aknowledgement This was part a MS thesis at Theran University of Medical Sciences We would like to express our appreciation to the organizers of this meeting Also appreciate kind cooperation of: Department of Environment Tehran Air quality Control Company Tehran Municipality And many other people and organizations who helped us 44
41 And Finally Thank you all for your attention and Appreciate any questions, comments or suggestions 46

42 47
Supplemental Information
 Supplemental Information Annual and seasonal spatial models for nitrogen oxides in Tehran, Iran Heresh Amini 1,2, Seyed Mahmood Taghavi-Shahri 3,4, Sarah B. Henderson 5,6, Vahid Hosseini 7, Hossein Hassankhany
Characterizing Spatial Patterns of Air Pollution
 Characterizing Spatial Patterns of Air Pollution Ryan Allen Assistant Professor Faculty of Health Sciences Simon Fraser University Workshop on Visualization and Communication of Climate Change Risk April
Multi-site Time Series Analysis. Motivation and Methodology
 Multi-site Time Series Analysis Motivation and Methodology SAMSI Spatial Epidemiology Fall 2009 Howard Chang hhchang@jhsph.edu 1 Epidemiology The study of factors affecting the health of human populations
Chapter 2 Case Study 1: Phenological Trends in Germany
 Chapter 2 Case Study 1: Phenological Trends in Germany Abstract The rise of air temperature as one result of climate change affects the developmental stages of plants. In Germany, systematic observation
USING GEOSTATISTIC ANALYSIS FOR PREDICTION OF SAR IN SOUTH OF IRAN
 USING GEOSTATISTIC ANALYSIS FOR PREDICTION OF SAR IN SOUTH OF IRAN 143 Jr. of Industrial Pollution Control 31(2)(2015) pp 143-148 EM International Printed in India. All rights reserved www.envirobiotechjournals.com
MEAN ANNUAL EXPOSURE OF CHILDREN AGED 0-4 YEARS TO ATMOSPHERIC PARTICULATE POLLUTION
 MEAN ANNUAL EXPOSURE OF CHILDREN AGED 0-4 YEARS TO ATMOSPHERIC PARTICULATE POLLUTION GENERAL CONSIDERATIONS Issues Type of indicator Rationale Issues in indicator design Respiratory disease Exposure (proximal)
SITE SELECTION FOR AQUACULTURE ACTIVITIES IN ABU DHABI
 2013 SITE SELECTION FOR AQUACULTURE ACTIVITIES IN ABU DHABI A multi-criteria GIS approach Document Control DOCUMENT CONTROL DOCUMENT ISSUE Project Number ---- Project Name / Title Site selection for Aquaculture
GIS Analysis of Groundwater Transport of Septic Tank Phosphorous in Lake Nebagamon, Wis.
 GIS Analysis of Groundwater Transport of Septic Tank Phosphorous in Lake Nebagamon, Wis. Andrew Austin-Petersen GIS in Water Resources Falls 2016 Introduction Lakes in Wisconsin have long been a source
Spatial and temporal patterns in air pollution in Pittsburgh: Traffic and point sources
 Spatial and temporal patterns in air pollution in Pittsburgh: Traffic and point sources Albert Presto Dept. of Mechanical Engineering Center for Atmospheric Particle Studies September 24, 2015 Acknowledgments
results. We hope this allows others to better interpret and replicate our findings.
 Supplementary Material This appendix is intended to provide a more detailed description of our data, analysis, and results. We hope this allows others to better interpret and replicate our findings. 1.
Chapter 3. Database and Research Methodology
 Chapter 3 Database and Research Methodology In research, the research plan needs to be cautiously designed to yield results that are as objective as realistic. It is the main part of a grant application
Table S1. Time and locations of the ESCAPE-measurement campaign.
 Supplementary Materials: Comparison of Land-Use Regression Modelling with Dispersion and Chemistry Transport Modelling to Assign Air Pollution Concentrations within the Ruhr Area Atmosphere 2016, 7, 48
Intra-urban Pollution Gradients and Public Health Impacts. Thomas Matte MARAMA NESCAUM NYSERDA - NARSTO Workshop November 12-13, 2008
 Intra-urban Pollution Gradients and Public Health Impacts Thomas Matte MARAMA NESCAUM NYSERDA - NARSTO Workshop November 12-13, 2008 Intra-urban air pollution gradients related to combustion sources Some
Short-Term Load Forecasting Under Dynamic Pricing
 Short-Term Load Forecasting Under Dynamic Pricing Yu Xian Lim, Jonah Tang, De Wei Koh Abstract Short-term load forecasting of electrical load demand has become essential for power planning and operation,
Air Pollution and Acute Respiratory Infections among
 Air Pollution and Acute Respiratory Infections among Children 0 4 Years of Age: an 18 Year Time Series Study Society of Toxicology Occupational and Public Health Specialty Sections October 30, 2015 Lyndsey
SPATIAL ANALYSIS OF POTENTIAL IMPACTS OF LOCAL FORESTRY ORDINANCES
 SPATIAL ANALYSIS OF POTENTIAL IMPACTS OF LOCAL FORESTRY ORDINANCES David R. Daversa, Stephen P. Prisley, and Michael J. Mortimer Department of Forestry, Virginia Tech, Blacksburg, VA 24061 ABSTRACT Local
Scoring Groundwater Infiltration & Sewage Exfiltration Risk in a Sanitary Sewage Collection System. Meredith S. Moore Advisor: Dr.
 Scoring Groundwater Infiltration & Sewage Exfiltration Risk in a Sanitary Sewage Collection System Meredith S. Moore Advisor: Dr. Barry Evans July 20, 2015 Contents List of Figures... 2 List of Tables...
Gasoline Consumption Analysis
 Gasoline Consumption Analysis One of the most basic topics in economics is the supply/demand curve. Simply put, the supply offered for sale of a commodity is directly related to its price, while the demand
APVI Solar Potential Tool Data and Calculations
 APVI Solar Potential Tool Data and Calculations J. K Copper and A. G Bruce (2014), School of Photovoltaic and Renewable Energy Engineering, University of New South Wales. The APVI Solar Potential Tool
SWAMPSCOTT, MA. Calculating Solar and Wind Renewable Energy Potential using GIS. Presented by: Rachel McCarter
 SWAMPSCOTT, MA Calculating Solar and Wind Renewable Energy Potential using GIS Presented by: Rachel McCarter Salem State University GPH 904: GIS Research Professor Dr. Marcos Luna 15 miles Northeast of
Spatial Distribution of Criteria Pollutants within Region 4
 Spatial Distribution of Criteria Pollutants within Region 4 Texas A&M University, Department of Civil Engineering Civil Engineering Application of GIS by Manasi Mahish CVEN658 12/5/2010 Instructor: Dr.
Spatial Extent of Mobile Source Air Pollution
 Spatial Extent of Mobile Source Air Pollution Ying Zhou, Sc.D. Harvard School of Public Health Northern Transportation and Air Quality Summit Baltimore, MD August 13 1, 28 1 Introduction Hot spot Spatial
Data Driven Generation Siting for Renewables Integration in Transmission Planning. Prepared by: Ty White, John Kuba, and Jason Thomas
 Data Driven Generation Siting for Renewables Integration in Transmission Planning Prepared by: Ty White, John Kuba, and Jason Thomas May 2014 Section 1.0 -- Background & Purpose Background As public policy
Comparisons of CMAQ and AURAMS modeling runs over coastal British Columbia
 Comparisons of CMAQ and AURAMS modeling runs over coastal British Columbia Robert Nissen Environment Canada Contact: robert.nissen@ec.gc.ca Collaborators: NW-AIRQUEST Meeting, Seattle, February 2, 2012
RECENT DEVELOPMENT IN EARTHQUAKE RISK MANAGEMENT PLANS AND PROGRAMS IN TEHRAN
 RECENT DEVELOPMENT IN EARTHQUAKE RISK MANAGEMENT PLANS AND PROGRAMS IN TEHRAN Maziar Hosseini 2 and Kambod Amini Hosseini 1 1 Assistance Professor of Islamic Azad University (South Branch) and president
Forest Stewardship Spatial Analysis Project Illinois Methodology March, 2007
 Forest Stewardship Spatial Analysis Project Illinois Methodology March, 2007 Project Summary Administered by the U.S. Forest Service and implemented by State forestry agencies, the Forest Stewardship Program
Calculating a Pollution Potential Index for Storm Water Runoff at the Watershed Scale Ranking watersheds for potential non-point pollution
 Calculating a Pollution Potential Index for Storm Water Runoff at the Watershed Scale Ranking watersheds for potential non-point pollution Philip Dougherty GISC 6387 7-27-2006 Introduction Non-point source
An integrative modeling approach for predicting exposures to traffic-related air pollution during commuting
 An integrative modeling approach for predicting exposures to traffic-related air pollution during commuting Extended Abstract #511 Ryan Michael *, Amy L. Stuart *, Getachew Dagne *, John Volckens, Jennifer
ASSESSMENT OF EXPOSURE TO TRAFFIC-RELATED AIR POLLUTION IN A LARGE URBAN AREA: IMPACTS OF INDIVIDUAL MOBILITY AND TRANSIT INVESTMENT SCENARIOS
 ASSESSMENT OF EXPOSURE TO TRAFFIC-RELATED AIR POLLUTION IN A LARGE URBAN AREA: IMPACTS OF INDIVIDUAL MOBILITY AND TRANSIT INVESTMENT SCENARIOS Maryam Shekarrizfard, McGill University Marianne Hatzopoulou,
THE BARNETT SHALE AND WATER RESOURCES
 THE BARNETT SHALE AND WATER RESOURCES aa Fracking and Texas Water Resources: A Case Study in the Barnett Shale Prepared by Dana Lazarus for GIS and Water Resources in Fall 2013 Page 1 of 26 Table of Contents
APPENDIX AVAILABLE ON THE HEI WEB SITE
 APPENDIX AVAILABLE ON THE HEI WEB SITE Research Report 178 National Particle Component Toxicity (NPACT) Initiative Report on Cardiovascular Effects Sverre Vedal et al. Section 1: NPACT Epidemiologic Study
Model Building Process Part 2: Factor Assumptions
 Model Building Process Part 2: Factor Assumptions Authored by: Sarah Burke, PhD 17 July 2018 Revised 6 September 2018 The goal of the STAT COE is to assist in developing rigorous, defensible test strategies
O3/PM2.5/Regional Haze Modeling Guidance Summary. Brian Timin EPA/OAQPS Western Met, Emissions, and AQ Modeling Workshop June 22, 2011
 O3/PM2.5/Regional Haze Modeling Guidance Summary Brian Timin EPA/OAQPS Western Met, Emissions, and AQ Modeling Workshop June 22, 2011 1 Ozone/PM2.5/Regional Haze Modeling Guidance Guidance on the use of
Interrelationships Between Urban Green Space, Air Pollution, and Health
 Interrelationships Between Urban Green Space, Air Pollution, and Health Jaime E. Hart, ScD Channing Division of Network Medicine, Brigham and Women s Hospital and Harvard Medical School Department of Environmental
Groundwater Flow Evaluation and Spatial Geochemical Analysis of the Queen City Aquifer, Texas
 Groundwater Flow Evaluation and Spatial Geochemical Analysis of the Queen City Aquifer, Texas Abstract The Queen City Aquifer is a saturated sandstone unit in the coastal plain of East Texas. The goals
The Spatial Distribution of Nitrogen Oxides in Hillsborough County, FL with Implications for the Social Distribution of Exposures
 The Spatial Distribution of Nitrogen Oxides in Hillsborough County, FL with Implications for the Social Distribution of Exposures Student Paper 5 Haofei Yu, Amy L. Stuart University of South Florida, 13201
6.1.2 Contaminant Trends
 margin analysis and the application of mass flux and mass discharge techniques (Appendix C). All of these methods are designed to assess changes in source loading and/or aquifer assimilative capacity over
DESIGNING STRATEGIES FOR OPTIMAL SPATIAL DISTRIBUTION OF WIND POWER
 DESIGNING STRATEGIES FOR OPTIMAL SPATIAL DISTRIBUTION OF WIND POWER by Dr Nikolaos S. Thomaidis Lecturer (under appointment) Dept of Economics, Aristotle University of Thessaloniki, GR Management and Decision
Associations of short-term exposure to air pollution with respiratory hospital admissions in Arak, Iran
 Vahedian et al. Journal of Environmental Health Science & Engineering (2017) 15:17 DOI 10.1186/s40201-017-0277-z RESEARCH ARTICLE Associations of short-term exposure to air pollution with respiratory hospital
eappendix. Indoor pollutant levels in the classroom
 Supplemental Digital Content Traffic-related air pollution and attention in primary school children: short-term association Jordi Sunyer, Prof, Elisabet Suades-González, MSc, Raquel García-Esteban, MSc,
Integration of GIS, Traffic Volume, Vehicular Speed and Road Grades Related-Air Pollution in Amman
 Proceedings of the 3 rd World Congress on Civil, Structural, and Environmental Engineering (CSEE 18) Budapest, Hungary April 8-10, 2018 Paper No. ICTE 115 DOI: 10.11159/icte18.115 Integration of GIS, Traffic
Understanding Washington, DC s Urban Forest through GIS Holli Howard, Casey Trees May, 2007
 Understanding Washington, DC s Urban Forest through GIS Holli Howard, Casey Trees May, 2007 With a mission to restore, enhance and protect the tree canopy of Washington, DC, Casey Trees has a set of ambitious
Dubuque, Iowa has become increasingly renowned for being a so-called poster child
 Background Dubuque, Iowa has become increasingly renowned for being a so-called poster child for sustainability in the Midwest. The re-invented river town along the Mississippi looks to incorporate renewable
EASIUR User s Guide Version 0.2
 EASIUR User s Guide Version 0.2 1 Introduction Jinhyok Heo and Peter J. Adams May 2015 The Estimating Air pollution Social Impact Using Regression (EASIUR) model (Heo 2015) predicts marginal social cost
Spatial-temporal variation of groundwater and land subsidence evolution in Beijing area
 doi:10.5194/piahs-372-7-2015 Author(s) 2015. CC Attribution 3.0 License. Spatial-temporal variation of groundwater and land subsidence evolution in Beijing area K. Lei 1, Y. Luo 1, B. Chen 2, M. Guo 3,
Developing Direct Demand AADT Forecasting Models for Small and Medium Sized Urban Communities
 International Journal of Traffic and Transportation Engineering 2016, 5(2): 27-31 DOI: 10.5923/j.ijtte.20160502.01 Developing Direct Demand AADT Forecasting Models for Small and Medium Sized Urban Communities
Paper No: o7130 Case Study: Odour Risk Management at the WTP, One of Australia s Largest & Most Unique WWTPs
 Paper No: o7130 Case Study: Odour Risk Management at the WTP, One of Australia s Largest & Most Unique WWTPs Josef Cesca, CH2M HILL Australia Pty Limited, jcesca@ch2mhill.com.au Amy Flanagan, CH2M HILL
Model the effect of four artificial recharge dams on the quality of groundwater using geostatistical methods in GIS environment, Oman
 Journal of Spatial Hydrology Fall Vol. 5, No. 2 Model the effect of four artificial recharge dams on the quality of groundwater using geostatistical methods in GIS environment, Oman Abstract William Bajjali,
APPRAISAL OF POLICY APPROACHES FOR EFFECTIVELY INFLUENCING PRIVATE PASSENGER VEHICLE FUEL CONSUMPTION AND ASSOCIATED EMISSIONS.
 Proceedings 28-29th August, ITRN2017 Dublin Dennehy: Evidence based analysis to guide private passenger vehicle policy decisions APPRAISAL OF POLICY APPROACHES FOR EFFECTIVELY INFLUENCING PRIVATE PASSENGER
A Better Way to Illustrate Atmospheric Dispersion in the Classroom
 A Better Way to Illustrate Atmospheric Dispersion in the Classroom Phil Dacunto and Mike Hendricks Department of Geography and Environmental Engineering United States Military Academy, West Point, NY Abstract.Students
Burden of disease from ambient air pollution for 2016 Description of method
 Burden of disease from ambient air pollution for 2016 Description of method v5 May 2018 The burden of disease (BoD) associated with ambient air pollution for the year 2016 is being estimated using methods
Application of a Transport and Emission Model in a Study of Air Pollution Exposure and Health Effects
 Application of a Transport and Emission Model in a Study of Air Pollution Exposure and Health Effects M. Shekarrizfard, M. Goldberg, and M. Hatzopoulou Dep. of Civil Engineering and Applied Mechanics,
VEHICLE PARTICULATE EMISSIONS ANALYSIS
 VEHICLE PARTICULATE EMISSIONS ANALYSIS Prepared for ARIZONA DEPARTMENT OF TRANSPORTATION TRANSPORTATION PLANNING DIVISION MPOs/COGs AIR QUALITY POLICY AND LOCAL PROGRAMS SECTION AND YUMA METROPOLITAN PLANNING
GIS in Water Resources Term Paper. Thomas Freeman
 GIS in Water Resources Term Paper Thomas Freeman A Study of the Temporal Relationship between Groundwater Levels and Precipitation in, FL Introduction is located on the eastern coast of Florida (Figure
EVALUATING THE ACCURACY OF 2005 MULTITEMPORAL TM AND AWiFS IMAGERY FOR CROPLAND CLASSIFICATION OF NEBRASKA INTRODUCTION
 EVALUATING THE ACCURACY OF 2005 MULTITEMPORAL TM AND AWiFS IMAGERY FOR CROPLAND CLASSIFICATION OF NEBRASKA Robert Seffrin, Statistician US Department of Agriculture National Agricultural Statistics Service
Learning Objectives. Module 7: Data Analysis
 Module 7: Data Analysis 2007. The World Bank Group. All rights reserved. Learning Objectives At the end of this module, participants should understand: basic data analysis concepts the relationship among
On the Relationship between ocean DMS and Solar Radiation
 On the Relationship between ocean DMS and Solar Radiation Gregory J. Derevianko, Curtis Deutsch, Alex Hall Department of Atmospheric and Oceanic Sciences University of California, Los Angeles Los Angeles,
Atmospheric Dispersion Modelling for Odour Impact: Practices, Issues & Recommendations
 Atmospheric Dispersion Modelling for Odour Impact: Practices, Issues & Recommendations Chris Scullion, Managing Consultant September 14-15, 2015 Toronto, ON trinityconsultants.com Odour Dispersion Modelling
Proceedings of the Eastern Asia Society for Transportation Studies, Vol.8, 2011
 Modeling of Traffic-Induced NO 2 Concentration to Predict the Indoor Air Quality in Houses near Major Road Adyati Pradini YUDISON Research Assistant Air and Waste Management Research Group Faculty of Civil
Air Pollution Estimation from Traffic Flows in Tehran Highways
 Current World Environment Vol. 7(1), 01-06 (2012) Air Pollution Estimation from Traffic Flows in Tehran Highways KEIVAN SAEB¹, MARYAM MALEKZADEH¹ and SAEED KARDAR² ¹Department of Environment, Tonekabon
Annual temperature reconstruction in the Eastern part of the Northeast China since A.D based on tree-ring width data
 Annual temperature reconstruction in the Eastern part of the Northeast China since A.D. 1765 based on tree-ring width data Hong Yin, Hongbin Liu, Lei Huang National Climate Center, China Sep. 19. 2012
Regression diagnostics
 Regression diagnostics Biometry 755 Spring 2009 Regression diagnostics p. 1/48 Introduction Every statistical method is developed based on assumptions. The validity of results derived from a given method
in the Americas and we tested whether this overlap is (a) higher than if the species had migrated
 higher than if the species had migrated") Supporting Information To test whether species richness seasonally tracks the environment because individual species do, we measured overlap between migratory species' environmental niches between two
Supporting Information To test whether species richness seasonally tracks the environment because individual species do, we measured overlap between migratory species' environmental niches between two
Improving Urban Mobility Through Urban Analytics Using Electronic Smart Card Data
 Improving Urban Mobility Through Urban Analytics Using Electronic Smart Card Data Mayuree Binjolkar, Daniel Dylewsky, Andrew Ju, Wenonah Zhang, Mark Hallenbeck Data Science for Social Good-2017,University
AIR DISPERSION MODELLING IN COASTAL AREAS WITH ROUGH TERRAIN, USING CALPUFF PRIME
 AIR DISPERSION MODELLING IN COASTAL AREAS WITH ROUGH TERRAIN, USING CALPUFF PRIME Marcia C. Parsons, Fracflow Consultants Inc., 154 Major s Path, St. John s, NL, Canada, A1A 5A1, Faisal Khan, Memorial
ACPD. Interactive comment. Lars Gidhagen et al.
 Atmos. Chem. Phys. Discuss., https://doi.org/10.5194/acp-2018-1094-ac1, 2019 Author(s) 2019. This work is distributed under the Creative Commons Attribution 4.0 License. on Experimental and model assessment
RAINFALL-RUNOFF SIMULATION IN AN EXPERIMENTAL BASIN USING GIS METHODS
 JOURNAL OF ENVIRONMENTAL HYDROLOGY The Electronic Journal of the International Association for Environmental Hydrology On the World Wide Web at http://www.hydroweb.com VOLUME 14 2006 RAINFALL-RUNOFF SIMULATION
How Urban Green Infrastructure Can Affect Air Pollution and Health
 How Urban Green Infrastructure Can Affect Air Pollution and Health Richard Baldauf U.S. Environmental Protection Agency Transportation, Air Quality and Health Symposium Austin, Texas February 20, 2019
A comparison of CALPUFF air quality simulation results with monitoring data for Krakow Poland
 A comparison of CALPUFF air quality simulation results with monitoring data for Krakow Poland John S. Irwin 1, Joanna Niedzialek 2, Jerzy Burzynski 3 1 Atmospheric Sciences Modeling Division (Mail Drop
Authors Response: We thank the committee for their thoughtful consideration of our manuscript. To cover the points above:
 RESPONSE TO COMMITTEE & REVIEWERS COMMENTS Manuscript ID BMJ.2017.039236 titled " Impacts of London's road traffic air and noise pollution on birth weight: a retrospective population-based cohort study."
Week 11: Collinearity
 Week 11: Collinearity Marcelo Coca Perraillon University of Colorado Anschutz Medical Campus Health Services Research Methods I HSMP 7607 2017 c 2017 PERRAILLON ARR 1 Outline Regression and holding other
REDD Methodological Module. Location and quantification of the threat of unplanned baseline deforestation
 REDD Methodological Module Location and quantification of the threat of unplanned baseline deforestation Version 1.0 April 2009 I. SCOPE, APPLICABILITY, DATA REQUIREMENT AND OUTPUT PARAMETERS Scope This
Interaction of weather and field variability on profitability in crop production
 Proceedings of the Integrated Crop Management Conference Proceedings of the 28th Annual Integrated Crop Management Conference Dec 1st, 12:00 AM Interaction of weather and field variability on profitability
Will Canadian Precipitation Analysis System improve precipitation estimates in Alberta?
 1 Will Canadian Precipitation Analysis System improve precipitation estimates in Alberta? Xinli Cai 1, Piyush Jain 1, Xianli Wang 2, Mike Flannigan 1 1 University of Alberta, Western Partnership of Wildland
Using Federal Environmental Data for Exposure Assessment in Epidemiologic Studies of Cancer
 Using Federal Environmental Data for Exposure Assessment in Epidemiologic Studies of Cancer Mary H. Ward, Ph.D. wardm@mail.nih.gov Occupational and Environmental Epidemiology Branch Division of Cancer
Sensitivity of air quality simulations in the Lower Fraser Valley of British Columbia to model parameterizations and emission sources
 Sensitivity of air quality simulations in the Lower Fraser Valley of British Columbia to model parameterizations and emission sources Robert Nissen, Paul Makar, Andrew Teakles, Junhua Zhang, Qiong Zheng,
CHAPTER 1 A CASE STUDY FOR REGRESSION ANALYSIS
 CHAPTER 1 AIR POLLUTION AND PUBLIC HEALTH: A CASE STUDY FOR REGRESSION ANALYSIS 1 2 Fundamental Equations Simple linear regression: y i = α + βx i + ɛ i, i = 1,, n Multiple regression: y i = p j=1 x ij
TOPIC #12: GENERAL PUBLIC EXPOSURES SYNOPSIS
 TOPIC #12: GENERAL PUBLIC EXPOSURES SYNOPSIS Prepared by T. Dan Bracken T. Dan Bracken, Inc. Portland, OR Purpose To characterize the EMF exposure of the general public. Introduction Exposure of the general
Evaluation of flood volume and inundation depth by GIS midstream of Chao Phraya River Basin, Thailand
 Sustainable Development, Vol. 2 1049 Evaluation of flood volume and inundation depth by GIS midstream of Chao Phraya River Basin, Thailand T. C. Cham, Y. Mitani, K. Fujii & H. Ikemi Graduate School of
impact Understanding the regulatory environment of climate change and the A P P E N D I X 1 of community design on greenhouse gas emissions.
 A P P E N D I X 1 Understanding the regulatory environment of climate change and the impact of community design on greenhouse gas emissions. Transportation, Planning, Land Use and Air Quality Conference
Source Characterization and Meteorology Retrieval Including Atmospheric Boundary Layer Depth Using a Genetic Algorithm
 Source Characteriation and Meteorology Retrieval Including Atmospheric Boundary Layer Depth Using a Genetic Algorithm Andrew J. Annunio*, Sue E Haupt, and George S. Young The Pennsylvania State University,
Problem Points Score USE YOUR TIME WISELY SHOW YOUR WORK TO RECEIVE PARTIAL CREDIT
 STAT 512 EXAM I STAT 512 Name (7 pts) Problem Points Score 1 40 2 25 3 28 USE YOUR TIME WISELY SHOW YOUR WORK TO RECEIVE PARTIAL CREDIT WRITE LEGIBLY. ANYTHING UNREADABLE WILL NOT BE GRADED GOOD LUCK!!!!
New HEI studies assessing health effects of low levels of air pollution Hanna Boogaard, Health Effects Institute
 New HEI studies assessing health effects of low levels of air pollution Hanna Boogaard, Health Effects Institute HEI Annual Conference, May 1-3, 2016 Teams Michael Brauer University of British Columbia
AERMOD Modeling of PM2.5 Impacts of the Proposed Highwood Generating Station
 AERMOD Modeling of PM2.5 Impacts of the Proposed Highwood Generating Station September 10, 2007 Prepared for Montana Environmental Information Center and Citizens for Clean Energy Prepared by Khanh T.
The tool, data, applications, and ideas
 The tool, data, applications, and ideas Esri User Conference July 11th, 2017 Walker Wieland, Research Scientist Office of Environmental Health Hazard Assessment California Environmental Protection Agency
Forestry Applications of LiDAR Data Funded by the Minnesota Environment and Natural Resources Trust Fund
 Conservation Applications of LiDAR Data Workshops funded by the Minnesota Environment and Natural Resources Trust Fund Conservation Applications of LiDAR Data Workshops funded by: Minnesota Environment
Chapter 5 FUTURE OZONE AIR QUALITY
 Chapter 5 FUTURE OZONE AIR QUALITY 5 FUTURE OZONE AIR QUALITY 5.1 INTRODUCTION AND SUMMARY Air quality models are used to predict ozone concentrations in future years. These models simulate the formation,
New Jersey Forest Stewardship Program Spatial Analysis Project Map Products And Data Layers Descriptions
 New Jersey Forest Stewardship Program Spatial Analysis Project 2007 Map Products And Data Layers Descriptions 01/07 NJ Forest Stewardship Program (FSP) Spatial Analysis Project (SAP) Methodology Project
Air Pollution Zoning based on Land use and Traffic of Vehicles
 Air Pollution Zoning based on Land use and Traffic of Vehicles Elnaz Irannezhad Transportation Planning Engineering, Iran University of Science and Technology elnaziran@gmail.com Seyed Hossein Mousavi
APPLICATION OF SEASONAL ADJUSTMENT FACTORS TO SUBSEQUENT YEAR DATA. Corresponding Author
 1 2 3 4 5 6 7 8 9 10 11 12 13 14 15 16 17 18 19 20 21 22 23 24 25 26 27 28 29 30 31 32 33 34 35 36 37 38 39 40 41 42 43 44 45 46 47 48 49 50 51 52 APPLICATION OF SEASONAL ADJUSTMENT FACTORS TO SUBSEQUENT
R-SQUARED RESID. MEAN SQUARE (MSE) 1.885E+07 ADJUSTED R-SQUARED STANDARD ERROR OF ESTIMATE
 1.885E+07 ADJUSTED R-SQUARED STANDARD ERROR OF ESTIMATE") These are additional sample problems for the exam of 2012.APR.11. The problems have numbers 6, 7, and 8. This is not Minitab output, so you ll find a few extra challenges. 6. The following information
These are additional sample problems for the exam of 2012.APR.11. The problems have numbers 6, 7, and 8. This is not Minitab output, so you ll find a few extra challenges. 6. The following information
Dynamics and Drivers of Land Cover & Land Use Changes in Bangladesh Integration of Satellite Data with Socioeconomic Dataset
 LC/LUC and Impacts on Environment in SSEA Intl. Regional Science Team Meeting Philippines, May 28-30, 2018 Dynamics and Drivers of Land Cover & Land Use Changes in Bangladesh Integration of Satellite Data
BUS105 Statistics. Tutor Marked Assignment. Total Marks: 45; Weightage: 15%
 BUS105 Statistics Tutor Marked Assignment Total Marks: 45; Weightage: 15% Objectives a) Reinforcing your learning, at home and in class b) Identifying the topics that you have problems with so that your
Minnesota Stewardship Spatial Analysis Project Methodology and Analysis documentation January 28, 2008
 Minnesota Stewardship Spatial Analysis Project Methodology and Analysis documentation January 28, 2008 Summary In the fall of 2004, Minnesota DNR and the U.S. Forest Service began working together to create
Location, Location, Location: the spatial influences on water entitlement selling in the southern Murray-Darling Basin. Outline
 Location, Location, Location: the spatial influences on water entitlement selling in the southern Murray-Darling Basin Juliane Haensch a, Sarah Ann Wheeler a,b, Alec Zuo a,b a Global Food Studies, University
Carbon in the Forest Biomass of Russia
 Carbon in the Forest Biomass of Russia Woods Hole Research Center R.A. Houghton Tom Stone Peter Schlesinger David Butman Oregon State University Olga Krankina Warren Cohen Thomas K. Maiersperger Doug Oetter
Prepared for Capital Area Council of Governments (CAPCOG) P.O. Box Austin, TX and
 P.O. Box Austin, TX and") Analysis of the Impact of Reductions in Anthropogenic NO x and VOC Emissions on Ozone Concentrations in the Austin Area using the Rider 8 Photochemical Modeling Episode for May 31-July 2, 2006 Prepared
Analysis of the Impact of Reductions in Anthropogenic NO x and VOC Emissions on Ozone Concentrations in the Austin Area using the Rider 8 Photochemical Modeling Episode for May 31-July 2, 2006 Prepared
Characterizing the Fire Threat to Wildland Urban Interface Areas in California
 Introduction Characterizing the Fire Threat to Wildland Urban Interface Areas in California This document outlines the procedures used to identify areas in California that pose significant threats from
APPENDIX H AIR DISPERSION MODELLING REPORT BY PROJECT MANAGEMENT LTD. (REF. CHAPTER 11 AIR QUALITY AND CLIMATIC FACTORS)
") 101050.22.RP.0001 A Environmental Impact Statement 15 th April 2005 APPENDIX H AIR DISPERSION MODELLING REPORT BY PROJECT MANAGEMENT LTD. (REF. CHAPTER 11 AIR QUALITY AND CLIMATIC FACTORS) S:\Projects\190900\101050
101050.22.RP.0001 A Environmental Impact Statement 15 th April 2005 APPENDIX H AIR DISPERSION MODELLING REPORT BY PROJECT MANAGEMENT LTD. (REF. CHAPTER 11 AIR QUALITY AND CLIMATIC FACTORS) S:\Projects\190900\101050
RELATION BETWEEN FOSSIL FUEL TRACE GAS EMISSIONS AND SATELLITE OBSERVATIONS OF NOCTURNAL LIGHTING
 RELATION BETWEEN FOSSIL FUEL TRACE GAS EMISSIONS AND SATELLITE OBSERVATIONS OF NOCTURNAL LIGHTING C.D. ELVIDGE', M.L. IMHOFF'', P.C. SUTTON''' 'NOAA National Geophysical Data Center cde@ngdc.noaa.gov ''