SITE SELECTION FOR AQUACULTURE ACTIVITIES IN ABU DHABI
|
|
|
- Sharleen Haynes
- 6 years ago
- Views:
Transcription


1 2013 SITE SELECTION FOR AQUACULTURE ACTIVITIES IN ABU DHABI A multi-criteria GIS approach
2 Document Control DOCUMENT CONTROL DOCUMENT ISSUE Project Number ---- Project Name / Title Site selection for Aquaculture Activities Name Signature Date Prepared by Hossam El Alkamy Submitted by Approved by Authorised for Issue by Issue Status Recommended Citation El Alkamy, H. (2013). Site selection for Aquaculture Activities in Abu Dhabi: A GIS Multi-criteria Approach, Internal Report, Environment Agency- Abu Dhabi, UAE File Reference Number DOCUMENT REVISION Revision No. Date Affected Pages Date of Change By 1- First Review 15/9/ /9/2013 Ayesha El Bloushi 2- Second Review 6/10/ /11/2013 By Anil Kumar Page i
3 CONTENTS INTRODUCTION... 1 CRITERIA FOR SELECTION... 1 DATASETS & ANALYSIS... 2 INLAND AQUACULTURE SUITABILITY ANALYSIS... 3 SEA-CAGE AQUACULTURE SUITABILITY ANALYSIS... 5 INTERTIDAL AQUACULTURE SUITABILITY ANALYSIS... 6 RESULTS... 7 CONCLUSION & RECOMMENDATION... 15
4 Site Selection for Aquaculture activities in Abu Dhabi A M U L T I - C R I T E R I A G I S A P P R O A C H INTRODUCTION Aquaculture industry is growing at a rapid rate in the Emirate of Abu Dhabi. The reason for this rapid growth could be attributed to the increase in population, together with increased nutritional demand, and associated over-exploitation of the local fish stock. The industry provides an obvious alternative solution for protein and is also considered as an activity that could provide opportunities for economic growth and entrepreneurship among the local community. It is against this backdrop that Environment Agency Abu Dhabi decided to undertake an analysis to select and prioritize areas suitable for aquaculture along the coast as well as inland areas. The selection approach involved analysis for three different types of aquaculture, namely inland aquaculture systems (ponds, raceways RAS), sea cages and intertidal aquaculture. Accordingly, there were three distinct analysis domains defined to enable the process of site selection leading to three sets of suitability predictors and classifications. For example, the distance to critical marine habitats such as mangrove, sea grass and coral reefs were considered when processing for coastal aquaculture, while these had no value when modeling for inland aquaculture suitability. The approach resulted in three sets of prioritized areas to be used for the purposes of the specified aquaculture activity. CRITERIA FOR SELECTION Distinct sets of criteria were selected for the three aquaculture activities under consideration. For inland aquaculture, the criteria identified were: Soil in Aquaculture sites should have low water infiltration or permeability characteristics (for pond systems). Avoid close proximity to urban residential areas (towns and cities), at least 3-5 Km away. Good Access and proximity to main highway and roads. Preferred to be within reach of water network and power grid. To avoid close proximity to high density wildlife areas. Favor areas with groundwater of high quality (low salinity, shallow water table) and avoid ground water depleted zones. For suspended sea cages, the main drive was to select areas where water depth is over 10 m meters, and avoiding areas close to sources of pollutants (mainly sewage outfalls) and sites of reoccurring harmful algal blooms. Thus the selection criteria identified were: Favor the depth of over 10 meters with the least favorable depth class being 0-5 meters. P a g e 1
5 Avoid proximity to discharge sources, at least 3 Km away from the nearest discharge outfall. Avoid proximity to reoccurring harmful algal bloom locations. Avoid proximity to heavy traffic shipping lanes. Shipping density of 0 vessel/km 2 during recording period of October October (This data was used due to non-availability of more recent data). Maintain socio-economic compatibility with ongoing marine activities, at least 2 Km from established Buhoor (traditional fishing right zones). Avoid Proximity to Marine Protected Areas (MPAs) and critical marine habitats - at least 2 Km away from known coral reefs, at least 3 Km from known ranges of large groups of marine mammals (Dugongs) and at least 4 Km away from known turtle nesting sites. For the intertidal type of aquaculture, a third set of criteria were identified. The main limiting factor for this type of aquaculture is the shore line. The shore lines of non-private islands were also included, and an analysis domain of 20 Km max from the nearest shore line was selected. Accordingly the selection criteria identified were: Favor areas that are at maximum of 2 Km away from nearest shoreline, while areas of 15 Km and beyond from being least favorable. Favor depth class of 0-5 meters while the least favorable depth class being 10 meters and deeper. Avoid proximity to discharge sources, at least 3 Km away from the nearest discharge outfall. Avoid proximity to reoccurring harmful algal blooms - at least 5 Km. Maintain socio-economic compatibility with ongoing marine activities, at least 2 Km from established Buhoor (traditional fishing right zones). Avoid proximity to Marine Protected Areas (MPAs) and critical marine habitats, at least 2 Km away from known coral reefs, and at least 4 Km away from known turtle nesting sites. DATASETS & ANALYSIS The analysis involved 3 separate domains where different criteria and layer weights were applied. The inland aquaculture suitability analyses were applied to an analysis domain that involved the main landmass of Abu Dhabi emirate excluding the islands. The sea cages category involved a domain incorporating the total marine territory of Abu Dhabi Emirate, excluding the terrestrial parts of the islands. Finally, the Intertidal category was prepared over a domain that comprised of a buffer area of 20 Km off of all Abu Dhabi shorelines including non-private islands. Map (1) shows the three domains of the analyses. All area calculation conducted in this analysis is done in ArcGIS 10.1 using XTOOLS 7.1 and in WGS84 World Mercator Projection. EAD s Environmental Database (EDB) holds rich geospatial data that was utilized in multi-criteria selection model. The selection process was applied, guided by the above listed criteria. For the inland aquaculture activities suitability, the utilized datasets included major roads, residential areas, wildlife centers, soils types and related data, and groundwater salinity & depth to water table. Page 2
) were used for the site suitability analysis for sea cages. Other data elements derived by interpolating the distance measured to the nearest feature of interest (e.g. nearest Buhoor area, coral reef etc.")
6 Inland Aquaculture Suitability Analysis Map 1) delineation of analyses domains for three aquaculture suitability classifications Additional datasets such as depth to sea floor (bathymetry (GEBCO-8 Grid)) were used for the site suitability analysis for sea cages. Other data elements derived by interpolating the distance measured to the nearest feature of interest (e.g. nearest Buhoor area, coral reef etc.) over a point grid spaced by 1Km were also used in the analysis. The method of analysis involved overlaying multiple raster grids representing the defined selection criteria in a weighted manner, to produce a measure of site suitability for each cell within the analysis extent. Weighted overlay is a process where all data has to be brought into a comparable format that allows for direct comparison. To achieve this objective, the datasets had to be converted to raster format at a comparable scale before applying the weighted overlay analysis. A grid of 1 Km spaced points of the analysis extent were used to assess proximity to roads, towns & cities and wildlife density areas using the NEAR function of ArcGIS Spatial Analyst. In addition a layer of soil characteristic of depth to hardpan was used as a proxy for permeability. Depth to Hardpan of 15,000 sites collected during the soil survey was interpolated using Inverse Distance Weighting (IDW) to produce a continuous surface of the property over the study domain. In order to run weighted overlaying, all raster explanatory layers had to be reclassified into one common scale. A scale of suitability ranks was deviced where the lowest grade1 being unsuitable, 4 barely suitable 7 moderately suitable and 10 being highly suitable. These classification tables are shown in Annex I for the three types of analyses. INLAND AQUACULTURE SUITABILITY ANALYSIS Raster of proximity to roads was reclassified into 4 categories on a scale of 1 10; 10 being the nearest to major roads and 1 being the farthest. The four classes were 1 farthest (least favorable), 4 and 7 in between and 10 being the nearest to roads (most favorable). The layer of depth to hardpan was reclassified into 10 categories with the shallow impermeable soil being classified as highly suitable (10) and deep soils of distant hardpan classified as (1). However, a minimum of 4m soil was maintained to allow for ponds excavation. Wildlife concentrations were treated differently to combine both the effect of proximity and the numbers of wildlife populations simultaneously. In other words, the proximity was transformed into a measure termed wildlife influence where the distance to nearest wildlife concentration is multiplied by the number of wildlife populations in that nearest wildlife concentration. The product is Page 3
")

7 then reclassified into the usual 1-10 classes with 1 being the least favorable (nearby / big wildlife population) and 10 being most favorable (distant/ small wildlife population). Maps 2 to 7 show the datasets used in the analysis for the required site selection purpose Map 2 Proximity to main Cities & towns Map 3 Proximty to Main Roads Map 4 Depth to Hardpan (permeability) Map 5 Influence of Wildlife concentrations Map 6 Groundwater level 2010 Map 7 Groundwater Salinity 2008 Analysis for suitability was done using the WEIGHTED OVERLAY function of ArcGIS Spatial Analyst 10. In each category of the aquaculture activities 2 rival scenarios were specified. The first scenario applies an equal weights approach were all the explanatory data layers are given equal influence towards a sum of 100%. In the second scenario, termed hereafter as the Adjusted Scenario, weights are modified in a Page 4
 in an endeavor to")
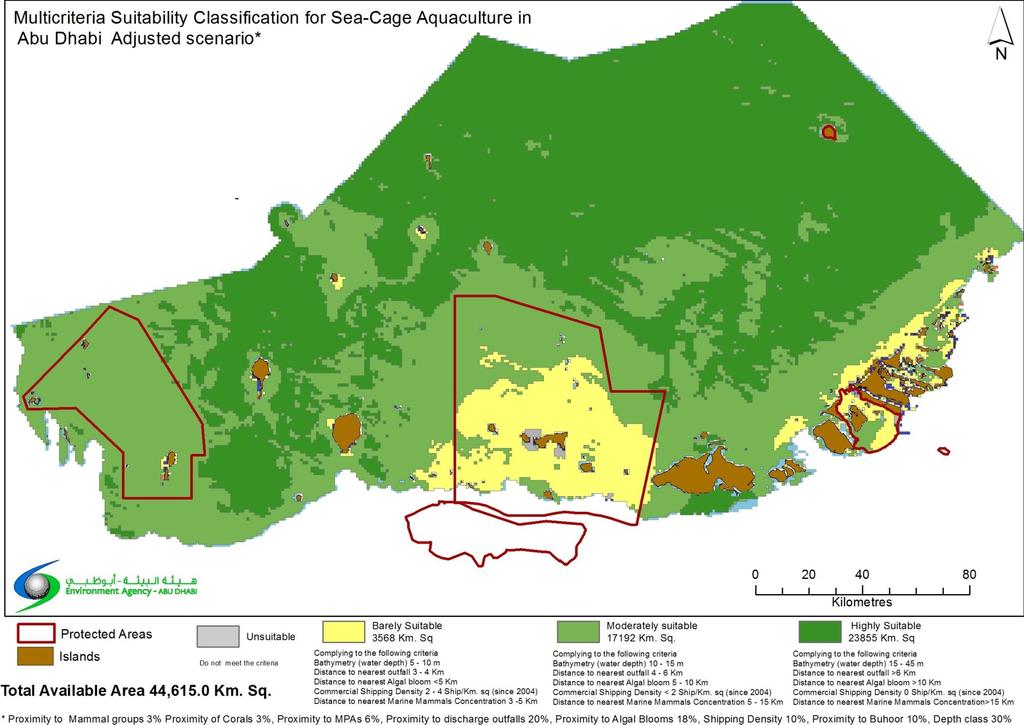
8 Sea-cage Aquaculture Suitability Analysis way to fulfill a certain rational or to derive the suitability classification process to favor areas of certain merits over others. For example, the adjusted scenario in the case of inland aquaculture was built to give higher influence to the layers of groundwater quality (both salinity and depth to water table) in an endeavor to select areas with high water quality, away from the depleted areas. This scenario is termed the Groundwater Conservation Scenario. The equal weights scenario in all cases is used as a general bench mark for the selection process while the adjusted scenario is usually considered as more favorable as it is derived from a management point of view or ecological sustainability rationale. The adjusted weights are shown in table (1) SEA-CAGE AQUACULTURE SUITABILITY ANALYSIS All involved rasters were reclassified into 4 categories on a scale of The four classes were 1 is least favorable, 4 and 7 in between and 10 being the most favorable. This is to provide a unified scale for weighted overlaying assessment. From a technical point of view, the most influential factors in this aquaculture activity are the depth and proximity to discharge outfalls. The ideal site would lie in depth band of 15 to 45 meters. The second consideration is to maintain quite a sufficient distance from pollutants. Thus a minimum distance of at least 3Km from the nearest discharge outfall is required. For the same reason, a minimum distance of 5Km from reoccurring harmful algal blooms is also specified. In addition to these three main considerations, avoidance of high shipping traffic, proximity to sensitive habitats and ecologically sensitive zones was observed by the incorporation of the other respective data layers as mentioned in the criteria section earlier. The analyses involved two scenarios for all categories, the first assuming equal weights for all involved datasets, while the second scenario (i.e. adjusted weight scenario), adopts the technical approach of emphasizing the role of some predictors in accordance with the inputs from aquaculture specialists and environmental regulators. This shift in emphasis of the predictor is controlled by assigning a biased weight within the modeling process. The equal and adjusted weights are shown in table (1). Scenarios: In the first scenario, all layers were given equal weights. Thus each layer was given a 12% or 11% weight in the analysis resulting in a total of 100%. While in the second scenario, adjusted weight scenario, emphasis was given to depth (bathymetry) changing its weight to 25%, and also enlarging the effect of proximity to discharge outfalls giving it higher weight of 15%. Maps 8 to 13 showing the datasets used in the analysis for the required site selection purpose. Map 8 Bathymetry dataset Map 9 Proximty to Buhoor Page 5

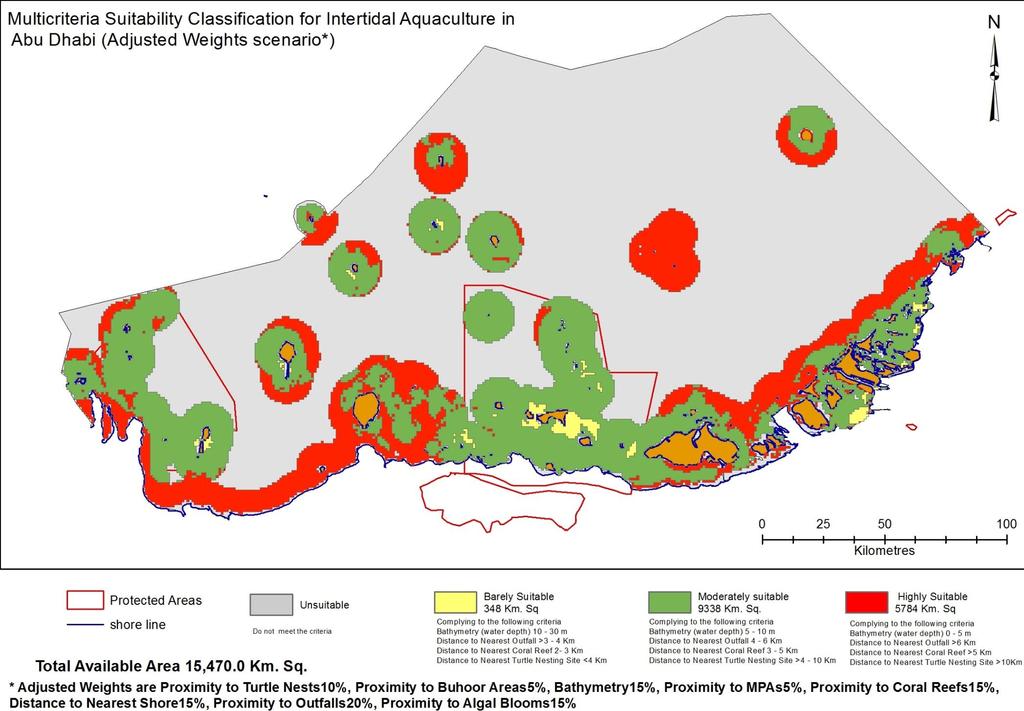
9 Map 10 Proximity to discharge outfalls mammals Map 11 Proximity to large groups of marine Map 12 Shipping Traffic density Map 13 Proximity to coral Reefs INTERTIDAL AQUACULTURE SUITABILITY ANALYSIS All involved rasters were reclassified into 4 categories on a scale of The four classes were 1 is least favorable, 4 and 7 in between and 10 being the most favorable. In this category again emphasis is given particular water depth band (0-5) in addition to avoiding sources of discharge and potential pollutants such as harmful algal blooms. These where the main drives in changing the weights from the equal weights scenario into the adjusted scenario for this category. Table (1) Scenario definition & weights of different data layers as used in the three selection scenarios tested. Data layer Equal Weights Adjusted Scenario Page 6
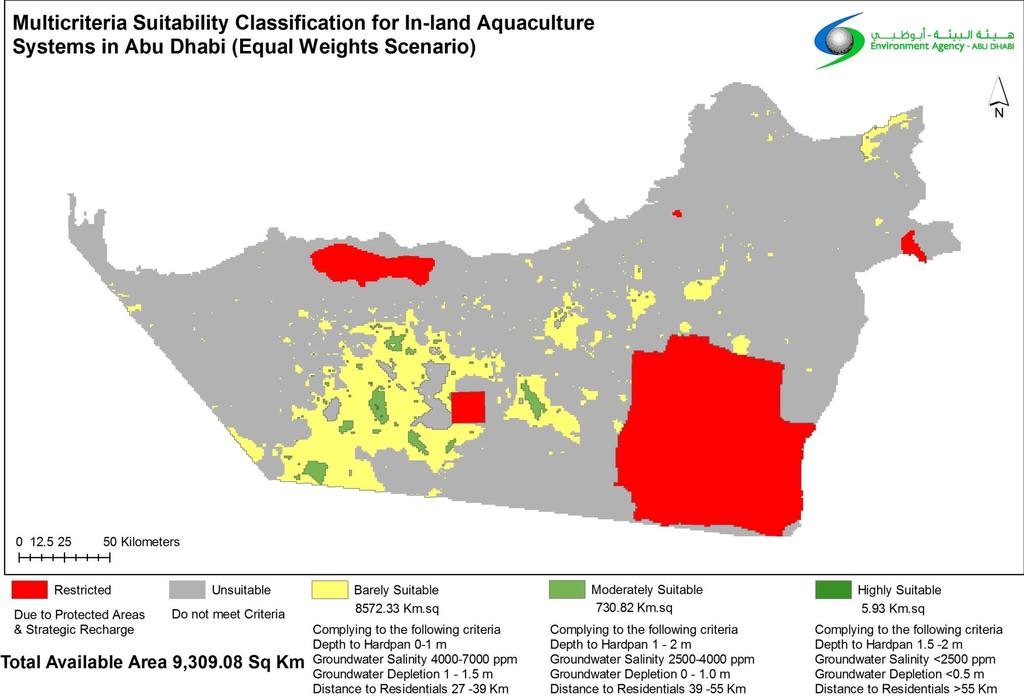
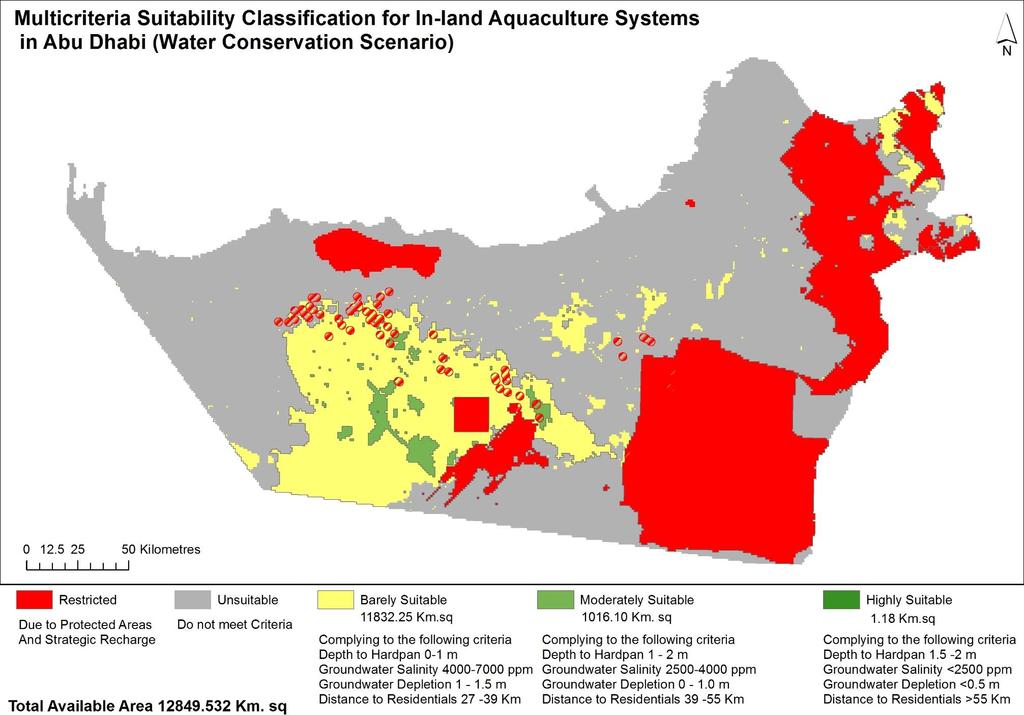
10 Inland Aquaculture Proximtiy to main Cities & towns 14% 10% Proximty to Main Roads (Access) 15% 10% Depth to Hardpan (permeability) 14% 10% Proximty to Wildlife concentrations 14% 10% Groundwater Salinity 14% 30% Depth to Ground water level 14% 20% Proximity to Protected Areas 15% 10% Total 100% 100% Proximity to big marine mammals (>10) 11% 3% Proximity to coral reefs 11% 3% Proximity to MPAs 11% 6% Proximity to discharge outfalls 11% 15% Sea-cage Aquaculture Proximity to Buhoor 11% 12% Distance to nearest shore line 11% 16% Shipping traffic density 11% 10% Bathymetry 12% 25% Proximity to reoccurring Algal Blooms 11% 10% Total 100% 100% Proximity to big marine mammals (>10) 11% 3% Proximity to coral reefs 11% 3% Proximity to MPAs 11% 6% Proximity to discharge outfalls 11% 15% Intertidal aquaculture Proximity to Buhoor 11% 12% Distance to nearest shore line 11% 16% Shipping traffic density 11% 10% Bathymetry 12% 25% Proximity to reoccurring Algal Blooms 11% 10% Total 100% 100% RESULTS The results for the three categories were quite different. Equal weights scenario for the inland ponds selected an area of 9309 Km 2 as suitable, over the different classes of suitability. Most of the suitable areas were allocated to the barely suitable class. However, these conditions where enhanced in the water Page 7
11 conservation scenario that involved relaxing the criteria for soil depth to hard pan and selecting for areas of higher water quality. This resulted in a higher total suitable area of 13,304 Km 2 and larger proportion being in the moderately suitable class rather than the barely suitable class. Spatially the two scenarios were fairly similar in how they allocated suitable regions. In case of the sea cages category both the equal weights scenario and the adjusted scenario allocated a relatively similar total area of suitable sites over the three suitability classes. Equal weights scenario resulted in 44,590 Km 2 while the adjusted scenario resulted in slightly higher 44,615 Km 2 suitable area. However, a major difference between the two scenarios is that much more of the suitable sites were classified as highly suitable in the adjusted model, compared to the equal weights model. In the intertidal category also, the area classified as suitable was enhanced by the adjusted approach compared to the equal weights approach where the suitable area increased from 10,470 Km 2 to 15,470 Km 2 an increase of approximately 30%. The greatest increase was observed in the moderately suitable class with a slight decrease in the highly suitable class. Table 2 lists the classified suitable areas in all categories and across all scenarios. Table 2 Outcomes of the different selection in 3 aquaculture categories scenarios Highly suitable (Km 2 ) Moderately suitable (Km2) Barely Suitable (Km2) Total suitable (Km2) Inland aquaculture Equal Weights Scenario Inland aquaculture Water Conservation Scenario Sea cage aquaculture Equal Weights Sea cage aquaculture Adjusted Scenario Intertidal aquaculture Equal Weights Scenario Intertidal aquaculture Adjusted Scenario , , , , , , Page 8
12 P a g e 9
13 Page 10

14 Page 11 Site Selection for Aquaculture activities in Abu Dhabi Results
15 Page 12

16 Page 13 Site Selection for Aquaculture activities in Abu Dhabi Results
17 Page 14
18 CONCLUSION & RECOMMENDATION It is recommended to use the outcome of the adjusted scenarios for all aquaculture categories over those of the equal weights scenarios. Equal weight scenarios are provided to serve as bench marks to assess the effect of adjusting the weights towards the preferable conditions of some parameters and how it would affect the suitability classification process when compared to equal weights classification. Terrestrial and Marine Protected Areas are treated differently in the course of this analysis. Terrestrial protected areas were treated as no go zones and were given a status of (Restricted) during the analysis. On the other hand, marine protected areas were not given the Restricted status and were included as available to select from in the suitability analysis. This differentiation was applied upon the request of the aquaculture domain experts in EAD. It is noticed that the inland adjusted scenario has yielded into more total suitable area compared to the equal weights scenario. This could be interpreted as due to the effect of demoting the weight of the layer Depth to Hardpan which affected the selection by the low availability of deep enough soil with suitable impermeable conditions. This was also an instruction from the domain experts in EAD to allow for more suitable sites where this drawback could be overcome by construction mitigations during the establishment of aquaculture farms by isolative lining of the ponds. In the intertidal category it is recognized that some relatively away from shore areas are given high suitability status versus those that are closer to shore line. This is evident in the areas near the urban mass of Abu Dhabi Island and some urban centers along the coast of the western region. This is mainly due to the effect of abundance of discharge outfalls in this vicinity which derived the selection algorithm away from these vicinities and away from the shore. P a g e 15
19 Annex 1A classes of favorability of different values in data layers in the Sea cages used in suitability analysis. Classes of distance to blooms (Km) Classes of distance to Turtles nests Km Class FROM TO OUT Class FROM TO Favorability Classes of distance to corals (Km) Classes of bathymetry sea cages Class FROM TO OUT Class FROM TO Favorability Classes of Proximity to MPAs Classes of distance to marine mammals (grp of +10) in Km Class FROM TO Favorability Class FROM TO Favorability Classes of Shipping Density Ship/Km.sq Classes of Distance to outfalls (in Km) Class FROM TO Favorability Class FROM TO Favorability Classes of Distance to Buhoor (in Km) Class FROM TO Favorability Page 16
20 Conclusion & Recommendation Annex 1B classes of favorability of different values in data layers in the Intertidal category suitability analysis. Classes of distance to blooms (Km) Classes of distance to Turtles nests Km Class FROM TO OUT Class FROM TO Favorability Classes of distance to corals (Km) Classes of Proximity to MPAs Class FROM TO OUT Class FROM TO Favorability Classes of bathymetry inter/sub-tidal (in meters) Classes of distance to marine mammals (grp of +10) in Km Class FROM TO Favorability Class FROM TO Favorability Distance to nearest shore (Km) Classes of Distance to outfalls (in Km) Class FROM TO Favorability Class FROM TO Favorability Classes of Distance to Buhoor (in Km) Class FROM TO Favorability Page 17
21 COPYRIGHT All rights reserved. No part of this report may be Reproduced in any material from (including photocopying or storing in any medium by electronic means) without The written permission of the copyright holds. Application for the copyright holders written permission to Reproduce any part of this publication should be addressed to the Environment Agency Abu Dhabi, in accordance with the international copyright Act 1956 and the UAE Federal Law No. (7) Of 2002, concerning copyrights and Neighboring rights, and person acting in contravention of this will be liable to criminal prosecution and civil claims for damages. Page 18
QUARTERLY REPORT OCT -DEC
 QUARTERLY REPORT OCT -DEC 7 01 INTRODUCTION Environment Agency - Abu Dhabi (EAD) publishes this quarterly Marine Water Quality (MWQ) report to provide an update on MWQ status during the quarter based on
WASTE CLASSIFICATION POLICY EAD-EQ-PR-P-01
 WASTE CLASSIFICATION POLICY EAD-EQ-PR-P-01 3 This publication is available for download in pdf format from the ''Resources'' at www.ead.ae ENVIRONMENT AGENCY ABU DHABI (EAD) 2016 All rights reserved. No
GIS Analysis of Groundwater Transport of Septic Tank Phosphorous in Lake Nebagamon, Wis.
 GIS Analysis of Groundwater Transport of Septic Tank Phosphorous in Lake Nebagamon, Wis. Andrew Austin-Petersen GIS in Water Resources Falls 2016 Introduction Lakes in Wisconsin have long been a source
ENVIRONMENT AGENCY ABU DHABI
 Marawah Marine Biosphere Reserve (MMBR), Abu Dhabi, UAE and the Extractive Industry: An Exemplary Model The 4th World Congress of Biosphere Reserves 14-17 March 2016 Lima, Peru CONTENT Why Presenting Marawah
QUARTERLY REPORT JAN-MAR
 QUARTERLY REPORT JAN-MAR 17 01 INTRODUCTION The Environment Agency - Abu Dhabi (EAD) publishes quarterly reports to present the status of air quality during three-month periods as it is monitored around
Theme: Climate action, agriculture waste management and pollution-free oceans
 Theme: Climate action, agriculture waste management and pollution-free oceans Ensuring healthy and productive waters The world s oceans and coasts support the livelihoods of billions of people around the
GROUNDWATER MONITORING ANNUAL SUMMARY REPORT
 GROUNDWATER MONITORING ANNUAL SUMMARY REPORT 2016 01 INTRODUCTION The Emirate of Abu Dhabi is located in an extreme arid region, with an average rain fall around 100 mm/year. Groundwater is considered
LME 20 Barents Sea. Contents 1/9. LME overall risk 2. Bordering countries: Norway, Russia, Svalbard LME Total area: 2,023,335 km 2
 Bordering countries: Norway, Russia, Svalbard LME Total area: 2,023,335 km 2 Contents LME overall risk 2 Productivity 2 Chlorophyll-A 2 Primary productivity 3 Sea Surface Temperature 3 Fish and Fisheries
Red Tide: A new threat to water resources in the Arabian Gulf Region
 Red Tide: A new threat to water resources in the Arabian Gulf Region Dr. Muthanna A. Al-Omar Head of Environmental Studies Department National Energy and Water Research Center Abu Dhabi Water & Electricity
6 TH. Most of the Earth Is Covered with Water (2) Most Aquatic Species Live in Top, Middle, or Bottom Layers of Water (1)
 Most Aquatic Species Live in Top, Middle, or Bottom Layers of Water (1)") A Healthy Coral Reef in the Red Sea MILLER/SPOOLMAN ESSENTIALS OF ECOLOGY 6 TH Chapter 8 Aquatic Biodiversity Fig. 8 1, p. 168 Most of the Earth Is Covered with Water (2) Aquatic life zones Saltwater life
A Healthy Coral Reef in the Red Sea MILLER/SPOOLMAN ESSENTIALS OF ECOLOGY 6 TH Chapter 8 Aquatic Biodiversity Fig. 8 1, p. 168 Most of the Earth Is Covered with Water (2) Aquatic life zones Saltwater life
Ocean Economy and Ocean Health in Thailand
 Ocean Economy and Ocean Health in Thailand THE EAST ASIAN SEAS CONGRESS 2015 Dr. Orapan Nabangchang Director of the Economy and Environment Institute of the Lower Mekong Sub-Region (EEI-LMS) and Dr. Nawarat
Forest Stewardship Spatial Analysis Project Illinois Methodology March, 2007
 Forest Stewardship Spatial Analysis Project Illinois Methodology March, 2007 Project Summary Administered by the U.S. Forest Service and implemented by State forestry agencies, the Forest Stewardship Program
Seagrass Health in Texas
 Seagrass Health in Texas A Comprehensive Monitoring Program Florida Museum of Natural History Harte Institute Florida Museum of Natural History Prepared by Susan E. Linn Marine Science Department University
Integrating Water Quality and Natural Filters into Maryland s Marine Spatial Planning Efforts
 Integrating Water Quality and Natural Filters into Maryland s Marine Spatial Planning Efforts Nicole Carlozo NOAA Coastal Management Fellow July 31, 2014 Watershed-scale restoration targeting helps direct
Freshwater ecosystems
 Aquatic Ecosystems Aquatic Ecosystems The types of organisms in an aquatic ecosystem are determined by the water s salinity. Salinity - Amount of salt in the water. Freshwater ecosystems do not have any
IN 0 TRO 1 DUCTION 1
 ANNUAL SUMMARY REPORT 2016 1 01 INTRODUCTION 1.1 //BACKGROUND This year marks the 5 th anniversary of the Annual Marine Water Quality Report and the 10 th anniversary of the implementation of the Environment
4 PROJECT ALTERNATIVES
 4 PROJECT ALTERNATIVES 4.1 Introduction In terms of the EIA Regulations published in Government Notice R543 of 2 August 2010 in terms of Section 24 of the National Environmental Management Act (Act No.
Assessing impacts of human use
 Norway Japan marine seminar 2012 Assessing impacts of human use Fisheries, aquaculture, shipping and energy exploitation in an integrated and ecosystem-based perspective By: Dr. Erik Olsen Head of research
OPERATIONAL GUIDLINES OF BOAD
 Coastal and Littoral Management 1. There is no precise definition of coastal areas. All definitions include coastal waters, marine waters and estuaries, and some portions of the land along the coast where
ECOLOGICAL ZONING AS A POLICY TOOL FOR SUSTAINABLE DEVELOPMENT AT THE LOCAL LEVEL
 ECOLOGICAL ZONING AS A POLICY TOOL FOR SUSTAINABLE DEVELOPMENT AT THE LOCAL LEVEL Candido A. Cabrido, Jr. School of Urban and Regional Planning, University of the Philippines, Diliman ECOLOGICAL ZONING
Chapter 6. Aquatic Biodiversity. Chapter Overview Questions
 Chapter 6 Aquatic Biodiversity Chapter Overview Questions Ø What are the basic types of aquatic life zones and what factors influence the kinds of life they contain? Ø What are the major types of saltwater
Isle of Wight Strategic Flood Risk Assessment MK2. Appendix P Newport
 Isle of Wight Strategic Flood Risk Assessment MK2 Appendix P June 2010 Isle of Wight Strategic Flood Risk Assessment Overview Please review this discussion in conjunction with the mapping provided in this
MARINE POLLUTION DEGRADATION MITIGATION MANAGEMENT IS ESSENTIAL FOR IMPROVING MARINE ENVIRONMENT
 MARINE POLLUTION DEGRADATION MITIGATION MANAGEMENT IS ESSENTIAL FOR IMPROVING MARINE ENVIRONMENT The health of the world s oceans and marine life is degrading rapidly as a result of excess human activities.
VEGETATIVE, WATER, FISH AND WILDLIFE RESOURCES POLICIES
 VEGETATIVE, WATER, FISH AND WILDLIFE RESOURCES POLICIES The County will: GOALS AND OBJECTIVES 1.1 Conserve, Enhance, Protect, Maintain and Manage Vegetative, Water, Fish and Wildlife Resources Promote
RESEARCH PRIORITIES FOR 2016
 National Environmental Science Programme RESEARCH PRIORITIES FOR 2016 Note that bolded dot points are considered high priority. CLEAN AIR AND URBAN LANDSCAPES: RESEARCH PRIORITIES Increasing our understanding
Aquaculture Evaluation
 Aquaculture Evaluation Species: Insert Species Analyst: Insert Analyst Region: Insert Region Date: Insert Date Seafood Watch defines sustainable seafood as from sources, whether fished or farmed, that
Paul Klarin Oregon Department of Land Conservation and Development 11/1/13
 Paul Klarin Oregon Department of Land Conservation and Development 11/1/13 Discussion Outline: How we got there Part Five Plan Policies and Procedures Framework Area Definition Standards Summary Marine
Conserving Marine Environment towards the Sustainability of Marine Resources for Food Security
 Conserving Marine Environment towards the Sustainability of Marine Resources for Food Security Wan Izatul Asma Wan Talaat Institute of Oceanography and Environment UNIVERSITI MALAYSIA TERENGGANU MALAYSIA
Chapter Concepts LIFE IN WATER. The Hydrologic Cycle. The Hydrologic Cycle
 Chapter Concepts Chapter 3 LIFE IN WATER The hydrologic cycle exchanges water among reservoirs The biology of aquatic environments corresponds broadly to variations in physical factors such as light, temperature,
A Long-term, Stakeholder-based Strategy for Gulf of Mexico Observing and Monitoring: The GCOOS Build-out Plan (BOP) V.2.0
 V.2.0") A Long-term, Stakeholder-based Strategy for Gulf of Mexico Observing and Monitoring: The GCOOS Build-out Plan (BOP) V.2.0 Stephanie Watson, Landry Bernard, Barbara Kirkpatrick, Chris Simoniello, and Stephan
A Long-term, Stakeholder-based Strategy for Gulf of Mexico Observing and Monitoring: The GCOOS Build-out Plan (BOP) V.2.0 Stephanie Watson, Landry Bernard, Barbara Kirkpatrick, Chris Simoniello, and Stephan
EXECUTIVE SUMMARY. Introduction
 Introduction In September 2003, Hillsborough County retained Ayres Associates Inc to update the Watershed Management Plan (WMP) for the Rocky/Brushy Creek watershed, which was originally prepared in 2001.
New Hampshire s Wildlife Habitat Conditions
 CHAPTER THREE New Hampshire s Wildlife Habitat Conditions Abstract Wildlife habitat condition was assessed for all 27 habitat types. NHFG developed a methodology to assess the relative ecological condition
Technical Guidance Document for Preliminary Environmental Review (PER)
") Technical Guidance Document for Preliminary Environmental Review (PER) EAD-EQ-PCE-TG-01 Signature on Original Environment Quality Sector * Corporate Management Representative Secretary General Originated
Technical Guidance Document for Preliminary Environmental Review (PER) EAD-EQ-PCE-TG-01 Signature on Original Environment Quality Sector * Corporate Management Representative Secretary General Originated
REPORT OF WORKING GROUP 3 AWARENESS AND PREPAREDNESS ACTIONS FOR AN INDIAN OCEAN TSUNAMI WARNING SYSTEM
 SC/IOC/2005/TSUNAMI/WORK/GP.3 International Coordination Meeting for the Development of a Tsunami Warning and Mitigation System for the Indian Ocean within a global framework UNESCO Headquarters, Paris,
Groundwater in Abu Dhabi
 Towards an Integrated Groundwater in Abu Dhabi Shaikha Al Hosani Execution Director, Environmental Quality Sector, Environment Agency Abu Dhabi Towards an Integrated Groundwater Management in Abu Dhabi
Estuary Adventures. Background. Objective
 Estuary Adventures Objective Students will work in groups to understand the concept of estuaries, their importance, and the role that density plays in the mixing of fresh and salt water. Students will
POTENTIAL FOR GEOLOGICAL CARBON SEQUESTRATION USING DEEP SALINE AQUIFERS IN THE ILLINOIS BASIN
 POTENTIAL FOR GEOLOGICAL CARBON SEQUESTRATION USING DEEP SALINE AQUIFERS IN THE ILLINOIS BASIN DECEMBER 4, 2015 GIS TERM PAPER Julien Botto Table of Contents Introduction... 2 Background... 3 Objective...
Climate of the Southeast United States. Variability, Change, Impacts, and Vulnerability
 Climate of the Southeast United States Variability, Change, Impacts, and Vulnerability 2013 Southeast Climate Consortium All rights reserved under International and Pan-American Copyright Conventions.
WORK PROGRAMME on CO-OPERATION IN THE FIELD OF CLIMATE CHANGE VULNERABILITY, RISK ASSESSMENT, ADAPTATION AND MITIGATION Between THE MINISTRY OF
 WORK PROGRAMME on CO-OPERATION IN THE FIELD OF CLIMATE CHANGE VULNERABILITY, RISK ASSESSMENT, ADAPTATION AND MITIGATION Between THE MINISTRY OF SCIENCE, TECHNOLOGY AND ENVIRONMENT OF THE REPUBLIC OF CUBA
Comparative Evaluation Option #1 & Option #2
 Comparative Evaluation Option #1 & Option #2 Option #1 Existing Landfill Approx. 47 metres/14 stories Proposed Layout Approx. 31 metres/9.5 stories Option #2 Existing Landfill Approx. 47 metres/14 stories
Aquaculture in Natura 2000
 Aquaculture in Natura 2000 Vedran Nikolić DG ENVIRONMENT Nature unit Aquaculture in motion 2015 Integrating Aquaculture Bruxelles, 16 th November 2015 7 th Environment Action Program Living well, within
A Salt Marsh Advancement Zone Assessment of Norwalk, Connecticut
 A Salt Marsh Advancement Zone Assessment of Norwalk, Connecticut Front cover image: Open space and unprotected parcels critical to the conservation of marsh advancement corridors in Norwalk; from the accompanying
WCS Recommendations for The Ocean Conference
 Fiji s Namena Marine Reserve Keith Ellenbogen WCS Recommendations for The Ocean Conference Background The United Nations will hold the high-level UN Conference to Support the Implementation of Sustainable
KWAZULU WAZULU-NATAL COASTAL VULNERABILITY INDEX. Summary Guide
 KWAZULU WAZULU-NATAL COASTAL VULNERABILITY INDEX Summary Guide Prepared by the Oceanographic Research Institute (ORI) for the Department of Agriculture and Environmental Affairs (DAEA) BACKGROUND Introduction
1.0 INTRODUCTION. 1.1 Rationale. DATE September 28, 2012 PROJECT No TO Jim Stevens, Director, Mackenzie Valley Highway GNWT, DOT
 DATE September 8, 0 PROJECT No. -0-000- TO Jim Stevens, Director, Mackenzie Valley Highway GNWT, DOT FROM Julia Krizan EMAIL Julia_Krizan@golder.com LAKE BATHYMETRY SURVEY FOR THE INUVIK TO TUKTOYAKTUK
Developing spatial information database for the targeted areas
 Developing spatial information database for the targeted areas 1 Table of Contents Jericho and Al- Auja (Palestine) 1 Background... 3 2 Monitoring the plant biomass using NDVI in Jericho and Al Auja...
Understanding Washington, DC s Urban Forest through GIS Holli Howard, Casey Trees May, 2007
 Understanding Washington, DC s Urban Forest through GIS Holli Howard, Casey Trees May, 2007 With a mission to restore, enhance and protect the tree canopy of Washington, DC, Casey Trees has a set of ambitious
 *~p fc ~^
 Climate: describes the average condition, including temperature and precipitation, over long periods in a given area
 Ch. 6 - Biomes Section 6.1: Defining Biomes Biome: a group of ecosystems that share similar biotic and abiotic conditions, large region characterized by a specific type of climate, plants, and animals
Sustainable resource management
 Harvesting marine resources sustainably ensures the long term profitability of fisheries and provides food security. Scientific survey data of Queen scallop densities in the waters around the Isle of Man.
Integrated Actions to Mitigate Environmental Risks in the Mediterranean Sea
 Integrated Actions to Mitigate Environmental Risks in the Mediterranean Sea Coastal Tourism Maritime Transport Socio-economic drivers Contribution to Gross Value Added (GVA) Fisheries and aquaculture Oil
610 Coastal & Marine Ecotourism
 610 Coastal & Marine Ecotourism The Sustainable Tourism Destination Management Program The George Washington University Copyright The George Washington University January 2007 All rights reserved No part
Catchment Scale Stormwater Volume and Pollutant Loading Analyses. Guidance for Municipal Stormwater Program Assessment and Prioritization
 Catchment Scale Stormwater Volume and Pollutant Loading Analyses Guidance for Municipal Stormwater Program Assessment and Prioritization May 2016 Catchment Scale Stormwater Volume and Pollutant Loading
A Salt Marsh Advancement Zone Assessment of Darien, Connecticut
 A Salt Marsh Advancement Zone Assessment of Darien, Connecticut Front cover image: Open space and unprotected parcels critical to the conservation of marsh advancement corridors in Darien; from the accompanying
MPA resilience to climate change Réserve Naturelle de Saint-Martin Saint-Martin - 28 Novembre 2013
 MPA resilience to climate change Réserve Naturelle de Saint-Martin Saint-Martin - 28 Novembre 2013 A TOTAL SUPERFICIE OF 3054 HA A terrestrial part of 154 ha classified in natural reserve and transferred
The Integrated Guidance Model
 There are currently a variety of guidelines developed by local and state programs managing shoreline development activities. These include the Virginia Marine Resources Commission guidelines for tidal
Multimetric Phytoplankton Index (MPI): description of the method and study cases in Mediterranean Sea.
: description of the method and study cases in Mediterranean Sea.") Multimetric Phytoplankton Index (MPI): description of the method and study cases in Mediterranean Sea. Chiara FACCA1, Fabrizio BERNARDI AUBRY2, Stefania FINOTTO2, Emanuele PONIS3, Francesco ACRI2, Adriano
Multimetric Phytoplankton Index (MPI): description of the method and study cases in Mediterranean Sea. Chiara FACCA1, Fabrizio BERNARDI AUBRY2, Stefania FINOTTO2, Emanuele PONIS3, Francesco ACRI2, Adriano
"The preparation and execution of the National Plan for the protection of the marine environment in the State of Kuwait"
 "The preparation and execution of the National Plan for the protection of the marine environment in the State of Kuwait" 1 Kuwait Environment Public Authority Content Why do we care about the marine environment?
LME 06 Southeast U.S. Continental Shelf
 LME 06 Southeast U.S. Continental Shelf Bordering countries: United States of America, Bahamas LME Total area: 303,029 km 2 List of indicators LME overall risk 2 Productivity Chlorophyll-A 2 2 Primary
HIGHLIGHTS ON RESEARCH ACTIVITIES AT KMFRI BY DR. ENOCK WAKWABI, DEPUTY DIRECTOR, KMFRI INLAND WATERS RESEARCH DIVISION, KMFRI HEADQUARTERS, MOMBASA.
 HIGHLIGHTS ON RESEARCH ACTIVITIES AT KMFRI BY DR. ENOCK WAKWABI, DEPUTY DIRECTOR, KMFRI INLAND WATERS RESEARCH DIVISION, KMFRI HEADQUARTERS, MOMBASA. KENYA KENYA MARINE AND FISHERIES RESEARCH INSTITUTE
Sand extraction Maasvlakte 2 Project: License, Environmental Impact Assessment and Monitoring.
 Sand extraction Maasvlakte 2 Project: License, Environmental Impact Assessment and Monitoring. Ad Stolk and Chris Dijkshoorn Ministry of Transport, Public Works and Water Management Rijkswaterstaat North
General. Climate Change Impacts and Adaptation in Vietnam. General. General 9/9/2009
 Impacts and Adaptation in Vietnam Nguyen Lanh Institute of Strategy and Policy on Natural Resources and Environment Aug. 2009 Vietnam is amongst the countries with the potential to be the most severely
This summary and the Report subsequently inform the recommended mitigation contained in Section 28 and will inform the Project conditions.
 18. Air The Project Air quality team prepared an Air Quality Assessment Report for the Project, which is included in Volume 3 (Part 1). The Report provides an assessment of air quality effects associated
Spatial analyses reveal conservation benefits for cold-water corals and sponges from small changes in a trawl fishery footprint
 The following supplements accompany the article Spatial analyses reveal conservation benefits for cold-water corals and sponges from small changes in a trawl fishery footprint Cory R. Lagasse*, Anders
Incorporating Ecosystem Services into Coastal and Watershed Management
 www.epa.gov/ecology ECOSYSTEM SERVICES RESEARCH PROGRAM ECOSYSTEM SERVICES RESEARCH PROGRAM BUILDING A SCIENTIFIC FOUNDATION FOR SOUND ENVIRONMENTAL DECISIONS Incorporating Ecosystem Services into Coastal
A Salt Marsh Advancement Zone Assessment of West Haven, Connecticut
 A Salt Marsh Advancement Zone Assessment of West Haven, Connecticut Front cover image: Open space and unprotected parcels critical to the conservation of marsh advancement corridors in West Haven; from
Introduction to GIS: Final Project. Developable Land Analysis for the Island of Hawai i. Professor Sally Hermansen
 Developable Land Analysis Bell et al. 1 Introduction to GIS: Final Project Developable Land Analysis for the Island of Hawai i Professor Sally Hermansen Kristina Bell, Alyson Char, Nicole Jang, and Camille
Isle of Wight Strategic Flood Risk Assessment MK2. Appendix E West Wight
 Isle of Wight Strategic Flood Risk Assessment MK2 Appendix E June 2010 Isle of Wight Strategic Flood Risk Assessment Overview The RDA is comprised of the towns of Totland and Freshwater and is classified
WHITE PAPER INTEGRATED ECOSYSTEM ASSESSMENTS
 WHITE PAPER INTEGRATED ECOSYSTEM ASSESSMENTS Background The NOAA 2005-2010 Strategic Plan highlights the importance of incorporating ecosystem principles in resource management. Specifically, a critical
Honorable Mayor and Members of the City Council. Watershed Management Plan and Measure M Recommendations
 Community Environmental Advisory Commission To: From: Honorable Mayor and Members of the City Council Community Environmental Advisory Commission Submitted by: Laura August, Chairperson, CEAC Subject:
TARGETING WATERSHEDS FOR RESTORATION ACTIVITIES IN THE CHESAPEAKE BAY WATERSHED. Technical Documentation October 4, 2002
 TARGETING WATERSHEDS FOR RESTORATION ACTIVITIES IN THE CHESAPEAKE BAY WATERSHED Technical Documentation October 4, 2002 Acknowledgements and Disclaimer This project was funded by the Chesapeake Bay Foundation,
Testimony of Shari T. Wilson, Secretary Maryland Department of the Environment. Before. The Senate Committee on Environment and Public Works
 Testimony of Shari T. Wilson, Secretary Maryland Department of the Environment Before The Senate Committee on Environment and Public Works The Clean Energy Jobs and American Power Act (S. 1733) Wednesday,
4/20/11. From the Everglades to the Florida Keys Ecology in Impacted Ecosystems. Learning Objectives. Some of the Impacts. Outline.
 4/2/11 Aquatic Systems & Environmental Health Learning Objectives From the Everglades to the Florida Keys Ecology in Impacted Ecosystems 1. Become familiar with some of the factors affecting aquatic ecosystem
SEAWATER DESALINATION Seawater Desalination: The King Abdullah Economic City Experience
 Subscribe to HDR Publications SEAWATER DESALINATION Seawater Desalination: The King Abdullah Economic City Experience By Pierre Kwan, PE - Senior Project Manager, Seattle, WA Satellite view of the Kingdom
Climate Change Adaptation Workshop For Planning Practitioners. National Climate Change Issues -- Setting the Scene
 Climate Change Adaptation Workshop For Planning Practitioners National Climate Change Issues -- Setting the Scene John Higgins Australian Greenhouse Office Department of the Environment and Heritage Source:
PUBLIC INFORMATION CENTRE
 June 24, 2014 PUBLIC INFORMATION CENTRE MUNICIPAL CLASS ENVIRONMENTAL ASSESSMENT SCHEDULE B MUNICIPAL SERVICES FOR THE MARY LAKE ESTATES SUBDIVISION Buildings Municipal Infrastructure Transportation Industrial
Tyler Archer December 4, 2012 NRS509 August GIS & Wind Turbine Siting
 Tyler Archer December 4, 2012 NRS509 August GIS & Wind Turbine Siting In a world with growing energy needs, maybe countries and power companies are looking to expand into alternative and renewable energies.
A Salt Marsh Advancement Zone Assessment of Clinton, Connecticut
 A Salt Marsh Advancement Zone Assessment of Clinton, Connecticut Front cover image: Open space and unprotected parcels critical to the conservation of marsh advancement corridors in Clinton; from the accompanying
Management of Marine Environment ENVS 590. Instructor Dr. Assad A. Al-Thukair
 Management of Marine Environment ENVS 590 Instructor Dr. Assad A. Al-Thukair Marine Environment Marine environment covers oceans, seas and coastal areas (including shores and estuaries). Estuary: is the
Aligning science and policy to conserve dugongs and their habitat
 Aligning science and policy to conserve dugongs and their habitat Ellen Hines, Ph.D. Associate Professor & Director Marine & Coastal Conservation & Spatial Planning Center, San Francisco State University
A Salt Marsh Advancement Zone Assessment of Stamford, Connecticut
 A Salt Marsh Advancement Zone Assessment of Stamford, Connecticut Front cover image: Open space and unprotected parcels critical to the conservation of marsh advancement corridors in Stamford; from the
1. Philippines Coastal & Marine Resources: An Introduction
 1. Philippines Coastal & Marine Resources: An Introduction Thousands of islands. With its thousands of. islands, the Philippines has one of the longest coastlines in the world estimated at 36,289 kilometers.
Ch. 7 Aquatic Ecology
 Ch. 7 Aquatic Ecology 1.Coral Reefs: the aquatic equal to the tropical rain forests 2.The two major aquatic life zones A. saltwater or marine (estuaries, coastlines, coral reefs, coastal marshes, mangrove
AP Environmental Science
 AP Environmental Science Types of aquatic life zones MARINE Estuaries coral reefs mangrove swamps neritic zone pelagic zone FRESHWATER lakes and ponds streams and rivers wetlands Distribution of aquatic
Update on Straits Pond
 Update on Straits Pond Presented to the Board of Selectmen July 27, 2017 Issues of Concern raised by citizens along Straits Pond: Midges (?) Offensive odor Excessive Algae Background: Straits Pond is a
4. Indicator number / code: 4
 Metadata Sheet Template Title: Indicator Number: Cluster: Rationale: Nutrient Pollution. 4. Indicator number / code: 4 Water Quality River nutrient pollution is caused mainly by agricultural activities
Blue Economy Status and Future. Growth
 Blue Economy Status and Future Presented at the FIG Working Week 2016, May 2-6, 2016 in Christchurch, New Zealand Growth Gordon Johnston 5 th May 2016 Introduction Definitions and Context Hydrography &
6 Risk assessment methodology
 Risk assessment methodology 6 Risk assessment methodology 6.1 Introduction INPEX has committed to a systematic risk assessment process as a means of achieving best practice in environmental management
HYDROSPHERE EOG REVIEW
 HYDROSPHERE EOG REVIEW 1 Why is fresh water in short supply on Earth? A. Most of it is frozen B. Most of it is polluted C. Most of it is in the atmosphere D. Most of it is trapped underground A. About
LME 34 Bay of Bengal 1/13. LME overall risk 2
 LME 34 Bay of Bengal Bordering countries: Bangladesh, India, Indonesia, Malaysia, Maldives, Myanmar, Sri Lanka, Thailand. LME Total area: 3,657,502 km 2 List of indicators LME overall risk 2 Productivity
PLANNING AND MANAGEMENT OF THE COASTAL AQUACULTURE THROUGH GIS TECHNIQUES
 PLANNING AND MANAGEMENT OF THE COASTAL AQUACULTURE THROUGH GIS TECHNIQUES M.Jayanthi, S.Thirumurthy, M.Samynathan, M.Duraisamy, M.Muralidhar and K.K.Vijayan ICAR- Central Institute of Brackishwater Aquaculture,
Submission on the draft terms of reference for Balaclava Island Coal Export Terminal project
 Submission on the draft terms of reference for Balaclava Island Coal Export Terminal project Name: Chantelle James Email: ccc@cqnet.com.au Michael Mc Cabe Organisation (if applicable): Capricorn Conservation
TEHRAN UNIVERSITY OF MEDICAL SCIENCES. SCHOOL OFPUBLIC HEALTH US Iran Symposium on Air Pollution in Megacities, 3-5th December
 TEHRAN UNIVERSITY OF MEDICAL SCIENCES SCHOOL OFPUBLIC HEALTH 1 Application of LUR model for chronic exposure estimation to SO 2 and PM 10 in Tehran, Iran Hasan Amini Seyed Mahmood Taghavi Shahri Sarah
What precisely does it mean to say that European countries are failing to meet their legal obligation under the Marine Directive?
 Brussels, 12 December 2018 Dear EU Ministers of the Environment, Clean, healthy and abundant seas by 2020. This is what European countries committed to achieve when they adopted the Marine Strategy Framework
The Great Barrier Reef
 AUSTRALIAN GREENS POLICY INITIATIVE Australia s Great Barrier Reef is the world s largest coral reef. It is one of the seven wonders of the natural world, comprising over 3,000 individual reef systems,
LBS : quantifying the role of ecosystems for mitigating impacts
 www.grid.unep.ch First LBS STAC Meeting LBS : quantifying the role of ecosystems for mitigating impacts Aruba, 5-7 June 2012 Peduzzi, PhD Global Change & Vulnerability Unit UNEP/GRID-Geneva UNEP/GRID-Geneva
Re: Environmental Impact Statement, Sea Mountain at Punalu`u
 November 16, 2006 Mr. Chris Yuen Hawaii Planning Dept. Aupuni Center, 101 Pauahi Street, Suite 3, Hilo, HI 96720 Re: Environmental Impact Statement, Sea Mountain at Punalu`u Mr. Yuen: I have been asked
CCAI Demonstration Projects in Viet Nam. Dr. Nguyen Anh Duc National CCAI Coordinator, Viet Nam National Mekong Committee
 1 CCAI Demonstration Projects in Viet Nam Dr. Nguyen Anh Duc National CCAI Coordinator, Viet Nam National Mekong Committee Outline Project: Preliminary Study on Climate Change Adaptation Plan in Kien Giang
Figure 1: map of East Asia showing land masses and water bodies. Source: PEMSEA
 Annex 1. Technical Background The Seas of East Asia1 The seas of East Asia are defined as the Yellow Sea, the East China Sea, the South China Sea, the Gulf of Thailand, the Sulu-Celebes (Sulawesi) Sea,
LME 32 Arabian Sea 1/13. LME overall risk 2
 LME 32 Arabian Sea Bordering countries: Bahrain, Djibouti, India, Iran, Iraq, Kuwait, Oman, Pakistan, Qatar, Saudi Arabia, Somalia, United Arab Emirates, Yemen. LME Total area: 3,950,421 km 2 List of indicators