Air Pollution. Audrey de Nazelle November
|
|
|
- Zoe Chase
- 6 years ago
- Views:
Transcription
1 Air Pollution Audrey de Nazelle November
2 2 weeks ago: Helen ApSimon on atmospheric sciences Today: taster on regulations, monitoring & modelling, and air pollution control In a few weeks: Susan Hodgson on health

3 3


4 London 1952 Smog Episode The Big Smoke

5 The big Smoke and the relationship between air quality and health Public awareness Environmental research Government regulation 1956 UK Clean Air Act (1 st Clean Air Act in the US: 1963)
6 EU Legislative framework Air quality (concentrations) objectives: Air Quality Directive (2008/50/EC): sets ambient standards Emissions targets: National Emission Ceiling Directive (2001/81/EC): for SO2, NOx, VOCs, NH3 Integrated pollution and prevention control Directive (2008/1/EC): requires permits with emission limit values and conditions based on Best Available Technique (BAT) for high pollution potential industrial and agricultural activities
7 Risk Assessment: - Hazard identification - Dose response - Exposure assessment - Risk characterization Human activity Sources/ emissions Concentrations Exposure / intake Health impacts Policies / interventions Full chain / Driver-Pressure-State-Impact-Response / source-receptor model, etc.
8 Air quality ambient standards Concentration limits set to protect public health and the environment Periodically reviewed given new scientific evidence EU: Limit values: legally binding Target values: to be attained where possible by taking all necessary measures not entailing disproportionate costs.
9 Pollutant EU limit values Concentration Averaging period Permitted exceedences each year 350 µg/m3 1 hour 24 Sulphur dioxide (SO 2 ) 125 µg/m3 24 hours 3 Nitrogen dioxide 200 µg/m3 1 hour 18 (NO 2 ) 40 µg/m3 1 year n/a Particulate Matter 50 µg/m3 24 hours 35 (PM 10 ) 40 µg/m3 1 year n/a Lead (Pb) 0.5 µg/m3 1 year n/a Maximum Carbon monoxide 10 mg/m3 daily 8 hour (CO) mean n/a Benzene 5 µg/m3 1 year n/a PM µg/m3* 1 year *Target value 2010, limit value Also new exposure reduction index: reduce up to 20% background concentration bet

10 Member states can use more stringent standards than the EU s

11 UK Department for Environment, Food and Rural Affairs (DEFRA) co-ordinates assessment and air quality plans for the UK as a whole. local authorities designate air quality management (LAQM) areas and develop action plans


12 Sources, effects, policies? Tools: Emission inventories, air pollution modelling, air pollution monitoring

13 National Atmospheric Emissions Inventory (NAEI) Emissions by sector Emissions factors Activity by sector

14 National Atmospheric Emissions Inventory reports

15 35% from tyre and brake wear 80% contribution from traffic sector London s Mayor Air Quality Strategy 2010
16 UK: Transport main source of pollution in 92% of all LAQMAs Source: Air Pollution in the UK 2011, DEFRA
17 Greater London PM2.5 emissions (%) Natural, 7.3% Public/ Domestic Combustion, 4.1% Power Generation, 4.8% Off-road Machinery, 8.5% Industry, 20.6% Other Transport, 3.6% Road Transport, 51.2% Background, 26.0% London Public/Domestic Combustion, 0.4% Local Road Transport, 11.1% London Other Transport, 0.9% London Road Transport, 7.4% London Off-road Machinery, 1.2% Regional Secondary Inorganic Aerosols, 12.2% London Power Generation, 0.0% London Industry, 0.9% London Natural, 0.6% London Secondary Inorganic Aerosols, 7.1% Regional Primary PM2.5, 4.7% Secondary Organic Aerosols, 5.2% European Contribution, 16.0% Shipping, 6.3% Roadside PM2.5 Concentration (%)
18 Greater London PM2.5 emissions (%) Natural, 7.3% Public/Domestic Combustion, 4.1% Industry, 20.6% Power Generation, 4.8% Road Transport, 51.2% Off-road Machinery, 8.5% Other Transport, 3.6%
19 Roadside PM2.5 Concentration (%) Transport < 25% Local Road Transport, 11.1% London London Other Public/Domestic Transport, 0.9% Combustion, 0.4% London Road Transport, 7.4% London Off-road Machinery, 1.2% London Power Generation, London 0.0% Industry, 0.9% London Natural, 0.6% London Secondary Inorganic Aerosols, 7.1% Regional Primary PM2.5, 4.7% Background, 26.0% Regional Secondary Inorganic Aerosols, 12.2% Secondary Organic Aerosols, 5.2% European Contribution, 16.0% Shipping, 6.3% About 30% London-based contributions
20 Modelling (concentrations) Regulatory purposes Environmental research Exposure assessment London s Mayor Air Quality Strategy 2010


21 Chemical transport large-scale models mathematical equations accounting for chemical and physical processes uses meteorology and emissions inventories Examples: CMAQ, CAMx, UAM
22 Physical and chemical processes: examples PM can be emitted primarily or formed through chemical and physical processes: SO2 emitted -> SO4 sulfate NH3 emitted -> NH4 Amonium NOx emitted -> NO3 nitrate NH4NO3 (NH4) 2 SO4 Secondary Particles (PM10, PM2.5) Ozone (O3) formation results from a complex set of reactions between VOCs, NOx and sunlight Ozone isopleth NO + VOCs NO 2 NO 2 + UV NO + O O + O2 O 3 NO 2 + VOCs PAN, etc NO + O3 --> NO2 + O2
23 Physical and chemical processes: examples

24 Dispersion models Applied to a receptor Mathematical equations to characterize physical dispersion (e.g. Gaussian plume) uses meteorology and emissions inventories Example: ADMS, AERMOD
25 Dispersion from a single source Unstable: light wind sunny convective mixing Neutral: strong wind mechanical mixing Inversion Stable:night light wind clear sky little mixing

26 Geostatistical /statistical models Interpolation, e.g. Kriging Land Use Regression model conc = b 0 + b 1 X 1 1+ b 2 X b k X k + E b 0 = Intercept X = Population density, road network, traffic volume, altitude b = regression coefficients E = error Briggs et al Use monitoring data (and land use data)
27 Trade-offs in choice of models (complexity, temporal and spatial scale, flexibility) For regulatory purposes future projections are needed hence more costly and complex chemical transport and dispersion models are used Increasingly land use regression models are used in the health field


 Exposure")
28 Monitoring Regulatory purposes (statutory monitoring network) Environmental research (including model validation) Exposure assessment


29 website: Monitoring: e.g. London Air Quality Network
30 Ambient air policy framework Monitoring stations used to demonstrate current compliance (or not) Models used to demonstrate future compliance (running policy scenarios) + compliance at unmonitored areas
31 Complexities of air pollution research and regulation Do limit values really reflect current knowledge? Are we targeting the right pollutants? Are we appropriately assessing exposures? Is the current framework allowing the most efficient means to abate air pollution and promote health?
32 On the choice of limit values Standards are developed based on scientific knowledge on health impacts of air pollution Epidemiology Toxicology
33 Air Quality Standards for annual PM2.5 concentration CAL WHO EPA EU

34 On health: results of APHECOM: compliance of WHO guidlens Exceeding WHO guideline in 25 European cities with 39 million inhabitants results in deaths per year Pascal et al. 2013; PM2.5 (µg/m3) Gain in life expectancy (months) from complying with WHO guideline
35 Do limit values really reflect current knowledge? See Review of evidence on health aspects of air pollution REVIHAAP WHO 2013 Are we targeting the right pollutants?
36 PM mass or composition? Trace metals, quinones, endotoxins, PAHs, black carbon inorganic secondary aerosols, primary and secondary organic aerosols? TOXICITY OF PM COMPONENTS? Kelly et al. HEI
37 PM mass or composition? Oxidative potential: the ability of PM to induce toxicity in biological systems (capacity to oxidize physiologically relevant molecules) London study found PM 10 at roadside locations have greater oxidative activity than PM 10 at background sites: likely due to tire and brake wear (indicated by presence of metals arsenic, barium, copper, iron, manganese, nickel, vanadium) Kelly et al. HEI

38 Particle sizes Nel et al, Science, 2005; 307:

39 Effect of different contaminants according to their size 39
40 Do limit values really reflect current knowledge? Are we targeting the right pollutants? Pollutants such as PM10, PM2.5, or NO2 are convenient to represent exposures in epidemiologic studies and as policy targets for the development of standards, but they are not necessarily the most health-relevant pollutants Are we appropriately assessing exposures?


41 Traditional approaches for assessing exposures in epemiologic research Air pollution: Fixed monitoring stations Air pollution modelling Typically assign home address exposure
 Personal, home indoor and home outdoor measurement Pregnant women in Barcelona Pollutants Measurement (N) Geometric Mean (GSD) Min - Max PM2.")
42 (Schembari et al Atmospheric Environment, 64: ) Personal, home indoor and home outdoor measurement Pregnant women in Barcelona Pollutants Measurement (N) Geometric Mean (GSD) Min - Max PM2.5 Personal (53) 24.1 (1.5) μg m -3 Indoor (54) 20.6 (1.6) Outdoor (52) 18.0 (1.6) NO x Personal (65) 61.9 (1.6) μg m -3 Indoor (65) 60.6 (1.7) Outdoor (65) 51.6 (1.6)
43 Exposure estimates for NO 2 Time spent in activities Home concentration (µg/m 3 ) Time weighted average concentration (µg/m 3 ) with Home Work Others InTransit Contribution to inhaled dose Mean Standard Deviation Time-weighted average concentration: accounts for activity patterns de Nazelle et al Environmental Pollution 176: Home Work Others InTransit
44 Exposure measurement error can lead to bias results in exposure-response modelling (epidemiology studies) In the current standard regulatory framework, limit values are compared to concentrations measured at monitoring stations do these represent exposures, and does this approach lead to greatest health benefits?
45 Public health benefits of limit value vs exposure reduction approach Exposure reduction across the whole population may have greater benefits than regulating high exposures using standards if there is no threshold of effect
46 Do limit values really reflect current knowledge? Are we targeting the right pollutants? Are we appropriately assessing exposures? Is the current framework allowing the most efficient means to abate air pollution and promote health?
47 Air pollution control
48 Air pollution control options Pollution dispersion Cleaner processes more efficient processes End-of-pipe (tail pipe): physical and/or chemical removal Regulatory schemes Consumer demand management


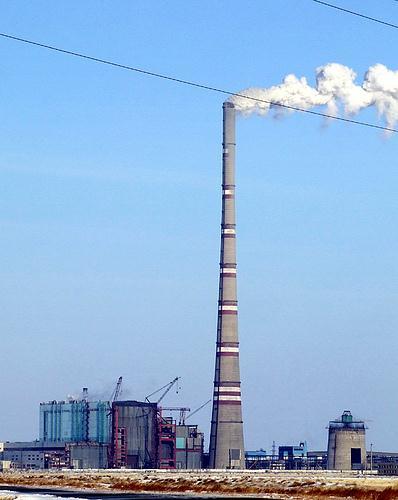
49 Chimneys help disperse pollutants

50 Improvement in Efficiency of UK Coal Fired Power Stations Less coal burned to produce the same amount of electricity Reduced atmos. Emissions (Assuming same electrical demand) Analysis of Engineering Cycles, RW Haywood
51 Relative quantity Use an intrinsically cleaner process Burn gas instead of coal Comparison of Station Emissions Old coal fired New gas fired CCGT Less pollutants to produce the same amount of electricity Electricity supplied (TWh) CO2 SO2 NOX HCL Dust Ash Description Reduced atmos. Emissions (Assuming same electrical demand) From 1992 on, decrease in use of coal and increase in gas use

 Using a chimney stove can reduce")
52 Cooking stoves Household air pollution from solid fuels is 4 th highest risk factor for disease burden worldwide (Lim et al Lancet vol 380) Using a chimney stove can reduce exposure to household woodsmoke by half Kirk Smith et al.
;")
53 Use an intrinsically cleaner process: Low-NOx burners; gas reburning (or gas recirculation); etc
54 End of Pipe Harmful substances to a store ORIGINAL DIRTY PROCESS Pipe POLLUTION CONTROL TECHNOLOGY Less Harmful substances to a store This will always be an added cost though may bring Reduction in pollution taxes Reduction in harmful substances to the environment
55 Removal: Physical, chemical or both Chemical process Physical process Convert gaseous pollutant to a solid Extract the solid using a technique for particles Physical process Physical process Dissolve the pollutant in a liquid Extract the liquid
")


56 Removing particles Baghouse (filter) system ESP: Electrostatic Precipitator Cyclones Wet vortex scrubber Baffle Chamber

57 Flue gas desulfurization A wet scrubber uses a limestone slurry to remove sulphur dioxide from flue gas Gypsum can be produced and marketed Common practice since turn of the century
58 Catalytic converters 1989 Euro 1 standard: effectively mandated fitting of 3-way catalysts to petrol vehicles (CO, Nox and NMVOCs) Reduces Nox by 80-90% Works best on hot engines, 5% fail
59 Some issues with vehicle emissions control Require engine to use more fuel than required otherwise Lower efficiency More emissions to capture (potentially) More carbon dioxide Can generate other pollutants Ammonia in catalytic converters Increase NO 2 emissions in diesel vehicles with particle traps Cat converters use palladium / platinum Significant increase in demand since cats mandated Environmental impacts in localities where these metal are mined
60 New European Driving Cycle (test cycle) Vehicles exceeded standards when tested on the road (vs test cycle) Average gaseous emissions during laboratory testing and on-road driving Weiss et al Atmospheric Environment 62:
61 Trends in emissions

62 Cold Winters UK Miners Strike Decline of Coal Reduction heavy industry Installation of FGD


63 UK Growth in road transport Catalytic Converters Euro standards Economic downturn Efficiency increases Decrease in Coal Use Low NOX burners Switch to Gas

64 UK
65 Non-purely technological approaches Regulatory schemes Taxes Emissions trading ( cap and trade market-based approach) Consumer demand management Encourage people or businesses to voluntarily change behaviours (and their demand for energy use, vehicle travel, etc)

66 Low emission zones Vehicles that do no meet a minimum standard are restricted from entering heavy diesel vehicles Sweden, Germany, Italy, Japan, Netherlands London is the largest (2008)

67 Light commercial vehicles (LCVs - 60% of freight in London LEZ) became subject to LEZ requirements for the first time in 2012 % Registered LCVs not meeting LEZ requirements LONDON LEZ National / other Mean PM10 concentration decreased by 13% in LEZ vs 7% decrease outside the LEZ Ellison et al./ Transportation Research Part D (2013) 25-33
68 London Congestion Charging Scheme * Introduced in February 2003 (22km 2 ) * Expanded in 2006 (42km 2 ) * 5 GBP initially, 8 GBP in 2005
69 London Congestion Charging Scheme 18% reduction in traffic volume and 30% reduction in congestion the first year Predicted (ie modelled): 20% reduction in NOx and PM10 emissions, 0.8 µg/m3 decrease in PM10 1.7ppb decrease in NOx, 0.3ppb increase in NO2 (all attributable to the CCS) Kelly et al HEI 155
70 London Congestion Charging Scheme Measurements? Kelly et al HEI % decrease in PM10 at background site and 10 to 25 % decrease in NO, but 2 to 20% increase in NO2 at background site Difficulties in attributing changes in air pollution due to competing impacts: Weather Construction Increase in diesel-powered buses and taxis Trends outside London or the centre of London and other changes in distant sources Number and location of air quality monitors Expected reductions in air pollution concentrations from local level schemes are necessarily relatively small.
71 Reductions in air pollution concentrations are possible, but assessing impacts of specific interventions in the real world is not easy.
72 Trade-offs and co-benefits of strategies to reduce ambient air pollution
73 Climate change: generally (overwhelmingly) a co-benefit from strategies to reduce ambient air pollution, but there are some trade-offs

74 Radiative forcing of climate change during the industrial era shown by emitted components from 1750 to IPCC Climate Change 2013: the Physical Science Basis
75 Purely technological solutions vs demand management? (e.g. reducing vehicle trips) Reduction in vehicle use leads to reductions in non-exhaust emissions and noise Woodcock et al. (2009) Comparison of GHG emission policy scenarios in London: death per million people scenario increased active travel lower carbon emission vehicles physical activity Air pollution Traffic mortality TOTAL Woodcock et al The Lancet, v3674, 9705:
76 Changes in deaths/year for transport scenarios in Barcelona scenario 20% in-city car trip reduction, all replaced by biking 20% in-out city car trip reduction, 20% replaced by biking physical activity Traffic mortality Air pollution travellers Air pollution General population* *PM2.5 % reduction Rojas-Rueda et al. Environment International 49 (2012)
77 Co-benefits? Trade-offs? Climate change Biodiversity Noise Physical activity Greenspace Traffic injuries Diet Etc Reduction in efficiency Cooling agents Air pollution inhalation Traffic injuries etc
78 Is the current framework allowing the most efficient means to abate air pollution and promote health?

79
Air pollution and cycling
 Air pollution and cycling Audrey de Nazelle Cycling towards a better Enfield: Health, Business and Travel 8 th April 2016 Enfield, UK Global Burden of Disease 2010: top risk factors # 9 worldwide # 10
An update from the UK: the CLEAN AIR STRATEGY
 An update from the UK: the CLEAN AIR STRATEGY 1. Slides from Defra presentation on the UK s Clean Air Strategy : under development with draft due in summer 2018 Focus on pollutants SO2, NOx, NH3, VOCs,
10. Air Pollution. Air pollution. policy issue indicator assessment. - - urban air quality exceedances for particulates
 Air pollution 73 1. Air Pollution policy issue indicator assessment human health: protecting the population against pollution exposures urban air quality exceedances for ground-level ozone - - urban air
Environmental Science 101 Air Resources. Fall Lecture Outline: Terms You Should Know: Learning Objectives: Reading Assignment:
 Environmental Science 101 Air Resources Fall 2012 1 Lecture Outline: 10. AIR POLLUTION A. The Atmosphere An Introduction B. Background Information About Air Pollution C. Six Principal Pollutants D. Air
GE 2211 Environmental Science and Engineering Unit III Air Pollution. M. Subramanian
 GE 2211 Environmental Science and Engineering Unit III Air Pollution M. Subramanian Assistant Professor Department of Chemical Engineering Sri Sivasubramaniya Nadar College of Engineering Kalavakkam 603
Clean Air Programme for Europe - update -
 Clean Air Programme for Europe - update - 04 July 2016 Thomas Henrichs European Commission DG ENV C.3 Air Topic of air pollution high in the public interest Source(s): Various online and print media Air
3/4/2014. Air Pollution. Chapter 15 Air Pollution and Stratospheric Ozone Depletion. Major Air Pollutants. Primary Pollutants
 Air Pollution Air pollution- the introduction of chemicals, particulate matter, or microorganisms into the atmosphere at concentrations high enough to harm plants, animals, and materials such as buildings,
Potential and Costs for Controlling Fine Particulate Emissions in Europe
 EXECUTIVE BODY FOR THE CONVENTION ON LONG-RANGE TRANSBOUNDARY AIR POLLUTION Steering Body to the Cooperative Programme for Monitoring and Evaluation of the Long-range Transmission of Air Pollutants in
4/12. There is so much pollution in the air now that if it weren t for our lungs there d be no place to put it all. Robert Orben
 4/12 There is so much pollution in the air now that if it weren t for our lungs there d be no place to put it all. Robert Orben Chapter 15 Air Pollution and Stratospheric Ozone Depletion Air Pollution
Lecture 4 Air Pollution: Particulates METR113/ENVS113 SPRING 2011 MARCH 15, 2011
 Lecture 4 Air Pollution: Particulates METR113/ENVS113 SPRING 2011 MARCH 15, 2011 Reading (Books on Course Reserve) Jacobson, Chapter 5, Chapter 8.1.9 Turco, Chapter 6.5, Chapter 9.4 Web links in following
Investigation of Fine Particulate Matter Characteristics and Sources in Edmonton, Alberta
 Investigation of Fine Particulate Matter Characteristics and Sources in Edmonton, Alberta Executive Summary Warren B. Kindzierski, Ph.D., P.Eng. Md. Aynul Bari, Dr.-Ing. 19 November 2015 Executive Summary
3 Air pollutant emissions
 3 Air pollutant 2 23 Key messages An assumed EU objective of 4 greenhouse gas emission reduction by 23 would lead to significant reductions of of air pollutants from fossil fuel. These reductions would
OUTDOOR AIR POLLUTION POLLUTANTS THAT AFFECT HEALTH
 OUTDOOR AIR POLLUTION POLLUTANTS THAT AFFECT HEALTH What is our air made of? Nitrogen 78% Oxygen 21% Water Vapor 0.01% at poles, 4% at tropics Argon less than 1% CO 2 0.038% Trace of particulates, CH 4
Cross-effects and total gas clean-up system lay-out
 Cross-effects and total gas clean-up system lay-out Gas clean-up for power plants and waste incinerators Effect of emission control on emissions and emission control for other species see: www.hut.fi/~rzevenho
Modelling national air quality strategy scenarios with UKIAM: Uncertainties emerging from the integration of multiple spatial scales.
 Modelling national air quality strategy scenarios with UKIAM: Uncertainties emerging from the integration of multiple spatial scales Tim Oxley, Helen ApSimon & Marios Valiantis Centre for Environmental
9th Period Environmental Science Chapter 15: The Atmosphere
 Section 15.1: Earth s Atmosphere 9th Period Environmental Science Chapter 15: The Atmosphere Properties of the Atmosphere: nitrogen, oxygen, water vapor and 1% other gases. air pressure is higher at the
Clean Air Policies in a European Context
 Clean Air Policies in a European Context OSLO, Norway 8 November 2016 Roald Wolters Unit Clean Air European Commission DG ENV.C.3 Topic of air pollution high in the public interest Sources: Various online
Sweden Air Quality Policies ??? Sweden Air Quality Policy Matrix Goals Status Current Policies & Programmes
 Sweden Air Quality Policies This document is based on research that UNEP conducted in 2015, in response to Resolution 7 of the UNEA 1. It describes country-level policies that impact air quality. Triple
Chapter 15 Air Pollution and Stratospheric Ozone Depletion
 Chapter 15 Air Pollution and Stratospheric Ozone Depletion Air Pollution Air pollution- the introduction of chemicals, particulate matter, or microorganisms into the atmosphere at concentrations high enough
Air quality in Belgium Road transport sector
 Air quality in Belgium Road transport sector Charlotte Vanpoucke Wetenschappelijk medewerker (VMM) bij de Intergewestelijke Cel voor het Leefmilieu (IRCEL) Belgian national debate on carbon pricing Brussels,
Exceedance of air quality standards
 Air quality in Europe (and particularly in the large urban areas) has improved in recent decades. However, it is estimated that in nearly all EU urban citizens were exposed to air pollution levels exceeding
Atmospheric Disperssion
 Atmospheric Disperssion Dispersion is the process by which contaminants move through the air and a plume spreads over a large area, thus reducing the concentration of the pollutants it contains. Atmospheric
Layers of the Atmosphere. Troposphere Stratosphere Mesosphere Thermosphere
 Air Pollution Layers of the Atmosphere Troposphere Stratosphere Mesosphere Thermosphere Troposphere Composition Sea level 17km Composition 78% Nitrogen 20% Oxygen Other 2%... Water vapor Argon gas Carbon
Air Pollution Chapter 21. Atmosphere as a Resource
 Air Pollution Chapter 21 Atmosphere as a Resource Atmospheric Composition Nitrogen 78.08% Oxygen 20.95% Argon 0.93% Carbon dioxide 0.04% Ecosystem services Blocks UV radiation Moderates the climate Redistributes
Chapter 17 Air and Air Pollution
 Chapter 17 Air and Air Pollution The Atmosphere Each layer characterized by abrupt changes in temperature, the result of differences in the absorption of incoming solar energy. Troposphere: Weather Breeder
Air Pollution Management and Modeling - Indian Perspective
 Air Pollution Management and Modeling - Indian Perspective GUFRAN BEIG Indian Institute of Tropical Meteorology, Pune - 411 008 (e-mail: beig@tropmet.res.in) 1 Contents Air Quality Concerns Current Statust
5. Health risk assessment of transport-related air pollution
 5. Health risk assessment of transport-related air pollution Birgit Kuna-Dibbert and Michal Krzyzanowski Identified health effects The evidence from accumulated research has enabled the assessment of the
Air Pollution in NJ: Past,Present and thoughts about the Future
 Air Pollution in NJ: Past,Present and thoughts about the Future By Paul J. Lioy Environmental and Occupational Health Sciences Institute Sponsored by UMDNJ Robert Wood Johnson Medical School And Rutgers
Jennings O Donovan & Partners Consulting Engineers Sligo
 8.0 AIR QUALITY 8.1 INTRODUCTION 8.1.1 Background Despite the ongoing deterioration in air quality on a national level due to the reliance on fossil fuel generated energy, Ireland as a whole is relatively
Chapter 15 Air Pollution and Stratospheric Ozone Depletion
 Chapter 15 Air Pollution and Stratospheric Ozone Depletion Friedland and Relyea Environmental Science for AP, second edition 2015 W.H. Freeman and Company/BFW AP is a trademark registered and/or owned
Chapter Overview. Chapter 3: Sources of Air Pollution 3-1. Role of Sources of Air Pollution in an Air Quality Management Program.
 3-1 Chapter 3: Sources of Air Pollution Chapter Overview Introduction Sources of Air Pollutants Biogenic Sources (naturally occurring sources) Anthropogenic Sources (man-made sources) Mobile Sources Stationary
ENVIRONMENTAL ISSUES EMISSIONS, POLLUTION CONTROL, ASSESSMENT AND MANAGEMENT
 ENVIRONMENTAL ISSUES EMISSIONS, POLLUTION CONTROL, ASSESSMENT AND MANAGEMENT Introduction Base Coal has a long and rich history of use in providing a source of light, transport, and electricity for industry
Air pollution health impact assessment: PM 2.5 exposures, sources and components
 Assessing the Climate and Health Co-Benefits of Clean Cooking Global Alliance for Clean Cookstoves / Environmental Defense Fund July 16th 17th 2015 Washington D.C. Air pollution health impact assessment:
Atmospheric Chemistry Air Pollution
 Atmospheric Chemistry Pontus Roldin Div. Nuclear Physics Dep. Physics Lund University Conflict between positive climate cooling effects and negative human health effects Are there good aerosol particles
Air pollution is caused by high concentrations of gases and particles emitted form combustion sources (vehicles, power plants, industries)
") AIR POLLUTION Clean Air Act & Criteria Pollutants 7.1-7.5 Motor Vehicle Emissions: 7.8 Indoor Air and Box Models: 7.12 Air Pollution Meteorology: 7.10 Gaussian Plume Modeling: 7.11 1 Air pollution is caused
AIR POLLUTION Clean Air Act & Criteria Pollutants 7.1-7.5 Motor Vehicle Emissions: 7.8 Indoor Air and Box Models: 7.12 Air Pollution Meteorology: 7.10 Gaussian Plume Modeling: 7.11 1 Air pollution is caused
Update on the Clean Air for Europe Programme
 Update on the Clean Air for Europe Programme 17 February 2016 Thomas Henrichs European Commission DG ENV C.3 Air Increasing awareness of air quality urgencies Source(s): Various online and print media
EU Air Quality Package "A Clean Air Programme for Europe"
 EU Air Quality Package "A Clean Air Programme for Europe" Daniela Buzica Widlowski European Commission, DG Environment, Air & Industrial Emission Unit Bern 1 October 2014 1 2 Main elements of the AQ package
What is air pollution?
 What is air pollution? An air pollutant is any substance in the air that could harm people. The main pollutants to affect us are carbon monoxide, nitrogen dioxide, ground level ozone, particulates, sulphur
CE 213A Introduction to Environmental Science
 CE 213A Introduction to Environmental Science Module D Air Pollution Dr. Anubha Goel FB 308, anubha@iitk.ac.in, x 7027 Nazaroff, Ch. 7 Air Pollution 2 Key Concepts Structure and composition of the atmosphere
Questions and answers on the EU Clean Air Policy Package
 EUROPEAN COMMISSION MEMO Brussels, 18 December 2013 Questions and answers on the EU Clean Air Policy Package 1. Why is air pollution a problem? Poor air quality is a major health risk, causing lung diseases,
1. The layer that contains most of the mass of the atmosphere is the. A. Stratosphere B. Troposphere C. Mesosphere D. Exosphere
 1. The layer that contains most of the mass of the atmosphere is the A. Stratosphere B. Troposphere C. Mesosphere D. Exosphere 2. Which of the following is a secondary pollutant? A. H 2 SO 4 B. O 3 C.
An Introduction to Air Quality
 An Introduction to Air Quality Learning Goals "We came all this way to explore the Moon, and the most important thing is that we discovered the Earth - William Anders After this lesson, you will be able
Air Quality Management in Tehran Paimaneh Hastaie Advisor to the Mayor of Tehran Exit on Environmental Affairs Next page Page 1 Tehran - IRAN
 Air Quality Management in Tehran Paimaneh Hastaie Advisor to the Mayor of Tehran on Environmental Affairs November 2000 Tehran - IRAN Page 1 Tehran is located at latitude 35 o 31` north and 51 o 19` longitude
The need for better control systems and fast technological renewal in small combustion appliances burning wood
 CONVENTION ON LONG-RANGE TRANSBOUNDARY AIR POLLUTION Expert Group on Techno-economic Issues (13th meeting) The need for better control systems and fast technological renewal in small combustion appliances
Acid deposition is the general term for acid coming down from the air
 6.4 Acid Deposition Acid deposition is the general term for acid coming down from the air 3 types of deposition Dry dry deposition comes down as ash or dry particles Wet wet deposition comes down as rain/snow
PRODUCTS OF COMBUSTION
 PRODUCTS OF COMBUSTION Some of the fuel (hydrocarbon) may not completely burn during combustion and therefore is released into the atmosphere along with the products. The products that are formed during
GLNG PROJECT - ENVIRONMENTAL IMPACT STATEMENT
 6 J:\Jobs\42626220\07 Deliverables\EIS\FINAL for Public Release\6. Values and Management of Impacts\6-8 Air Quality\06 08 Air Quality (Section 6.8) FINAL PUBLIC track.doc GLNG Project - Environmental Impact
What we do. About our facility. About Weir. Why what we do is important
 What we do About Weir About our facility Why what we do is important Weir Canada has been operating in Metro Vancouver since 2013 when we acquired the long established R. Wales Company. We are a leading
Saltsjöbaden 6, Göteborg, Sweden, March Clean Air in Cities Working Group report
 Saltsjöbaden 6, Göteborg, Sweden, 19-21 March 2018 Clean Air in Cities Working Group report Working Group coordinators: Laurence Rouil Roald Wolters Introduction Despite improvements over the last decade,
Improving the temporal profiles of emission input data for high resolution atmospheric transport modelling a case study for the UK
 Improving the temporal profiles of emission input data for high resolution atmospheric transport modelling a case study for the UK Stefan Reis, Centre for Ecoology & Hydrology Myriam Lang, Centre for Ecoology
Air Pollution. Air Pollution 3/11/2015. Our Atmosphere IS a Resource. March 10, 2015 Mr. Alvarez
 Air Pollution March 10, 2015 Mr. Alvarez Air Pollution Air Pollution- the introduction of chemicals, particulate matter or microorganisms into the atmosphere at concentrations high enough to harm plants,
Trends in Air Quality in Germany B A C K G R O U N D
 Trends in Air Quality in Germany B A C K G R O U N D IMPRINT Date: October 2009 Cover Photo: M. Isler / www.metair.ch Photos: p. 3 W. Opolka p. 4 www.imageafter.com p. 9 UBA / A. Eggert p.14 www.imageafter.com
Combatting Air Pollution Learning from Success in Germany
 For our Environment Roundtable National Clean Air Programme: Combatting Air Pollution in India 26 th November 2018, New Delhi Combatting Air Pollution Learning from Success in Germany Technical Session
Conclusions on the Clean Air Dialogue with Ireland
 13 th March 2017 Ireland has made significant progress in reducing air pollution and improving air quality, to the benefit of public health and welfare, the environment and its ecosystems, as well as reducing
Air Pollution Challenges in Cities and Contribution from Mobile Sources
 Air Pollution Challenges in Cities and Contribution from Mobile Sources ICCT TRUE Workshop, London 7-8th June David Carslaw University of York Ricardo Energy & Environment Outline of talk Brief historical
A MAJOR ROAD NETWORK FOR ENGLAND: SUPPORTING DOCUMENT 5 AIR QUALITY
 AIR QUALITY Introduction In recent times air quality has moved up the agenda of environmental impacts of road traffic and is now demanding urgent attention by policy-makers and planners. Current levels
Goals Status Current Policies & Programmes GENERAL OVERVIEW
 Malta Air Quality Catalogue This document is based on research that UNEP conducted in 2015, in response to Resolution 7 of the UNEA 1. It describes countrylevel policies that impact air quality. Triple
Spatial and temporal patterns in air pollution in Pittsburgh: Traffic and point sources
 Spatial and temporal patterns in air pollution in Pittsburgh: Traffic and point sources Albert Presto Dept. of Mechanical Engineering Center for Atmospheric Particle Studies September 24, 2015 Acknowledgments
Berlin s s Air Quality Strategy: pollution sources, measures and their expected effects
 Berlin s s Air Quality Strategy: pollution sources, measures and their expected effects Martin Lutz Senate Department for Urban Development, Berlin Directorate IX, Environment Policy a few facts about
The impacts of policies to meet the UK Climate Change Act target on air quality an explicit modelling study
 The impacts of policies to meet the UK Climate Change Act target on air quality an explicit modelling study Professor Martin Williams King s College London International Energy Workshop Cork 1 June 2016
AIR POLLUTION AND CHILD HEALTH PARLIAMENTARY COLLOQUIUM ON CLIMATE, AIR POLLUTION, ENERGY (IRP) AND HEALTH 14 NOVEMBER 2018
 AND HEALTH 14 NOVEMBER 2018") AIR POLLUTION AND CHILD HEALTH PARLIAMENTARY COLLOQUIUM ON CLIMATE, AIR POLLUTION, ENERGY (IRP) AND HEALTH 14 NOVEMBER 2018 Dr Diane Gray (MBChB, PhD) Red Cross War Memorial Children s Hospital (RCH),
AIR POLLUTION AND CHILD HEALTH PARLIAMENTARY COLLOQUIUM ON CLIMATE, AIR POLLUTION, ENERGY (IRP) AND HEALTH 14 NOVEMBER 2018 Dr Diane Gray (MBChB, PhD) Red Cross War Memorial Children s Hospital (RCH),
Ireland s environment 2012
 Ireland s environment 2012 Chapter 3 Air Quality & Transboundary Air Emissions Air quality in Ireland is of a high standard across the country and is among the best in Europe, meeting all EU air quality
Particulate Matter Science for Policy Makers: A. Ambient PM 2.5 EXECUTIVE SUMMARY MASS AND COMPOSITION RESPONSES TO CHANGING EMISSIONS
 Particulate Matter Science for Policy Makers: A NARSTO Assessment was commissioned by NARSTO, a cooperative public-private sector organization of Canada, Mexico and the United States. It is a concise and
LONDON ATMOSPHERIC EMISSIONS INVENTORY
 LONDON ATMOSPHERIC EMISSIONS INVENTORY Julius Mattai and David Hutchinson, Greater London Authority (julius.mattai@london.gov.uk and david.hutchinson@london.gov.uk) INTRODUCTION The London Atmospheric
Air pollution in the UK Since 1970 sulphur dioxide emissions have decreased by 95%, particulate matter by 73% and nitrogen oxides by 69%.
 Air Pollution Health Effects Public Information Service for Sussex Air pollution in the UK Since 1970 sulphur dioxide emissions have decreased by 95%, particulate matter by 73% and nitrogen oxides by 69%.
Modelling the effects of traffic emissions on the air quality
 Air Pollution XIII 49 Modelling the effects of traffic emissions on the air quality G. Genon & E. Brizio Turin Polytechnic, Italy Abstract European directives 1999/30/CE and 2000/69/CE set severe limits
12. EMISSIONS OF SULPHUR DIOXIDE
 Air Air quality is to a great extent influenced by combustion of fossil fuels, evaporation of volatile organic compounds and their photochemical reaction with other pollutants in the atmosphere. Pollutants
Mayor s Air Quality Strategy
 Mayor s Air Quality Strategy Sarah Legge Senior Policy Adviser - Air Quality Presentation to Citeair Conference 11 March 2005 Air Pollution Air pollution is estimated to bring forward 1,600 deaths and
London Road LAT Local Air Quality May Samuel Rouse MSc, Air Quality Brighton & Hove City Council
 London Road LAT Local Air Quality May 2017 Samuel Rouse MSc, Air Quality Brighton & Hove City Council Brighton and Hove in Numbers 600,000 people along the coastal strip One of highest population densities
A- 1: Emissions of pollutants into the atmospheric air. 2) Relevance for environmental policy... 3
 Relevance for environmental policy... 3") A- 1: Emissions of pollutants into the atmospheric air 1) General description... 2 1.1) Brief definition... 2 a) Emissions from stationary sources... 2 b) Emissions from mobile sources... 2 c) Total emissions...
A- 1: Emissions of pollutants into the atmospheric air 1) General description... 2 1.1) Brief definition... 2 a) Emissions from stationary sources... 2 b) Emissions from mobile sources... 2 c) Total emissions...
Outdoor Air Pollution. Primary vs. Secondary Air Pollutants
 Air Pollution Outdoor Air Pollution Primary vs. Secondary Air Pollutants Primary Pollutant a pollutant that is put directly into the air by human activity. Examples: CO, NOx, PM, SOx, VOCs Sources: Electricity
Building Capacities for the Improvement of the Air Quality
 Building Capacities for the Improvement of the Air Quality NOx - Basics Lima, 22.06.2016 Dr. Hubert Baier General Manager - Europe Names of nitrogen compounds Formula NO N 2 O NO 2 N 2 O 5 N 2 O 3 Systematic
Energy Production Systems Engineering
 Welcome to Energy Production Systems Engineering USF Polytechnic Engineering tom@thomasblairpe.com Session 10: Environmental Controls Spring 2012 Plant Environmental Control Systems Power plant Environmental
Air quality in stations
 Air quality in stations Introduction and the European legislative framework BONTINCK Willy, Head of the Environmental Department SNCB-HOLDING Presentation Air quality in indoor public areas (eg stations)
The History of Air Pollution Air pollution is not a new phenomenon.
 Name: April 14-18, 2014 Chapter 12, Air Section 1: What Causes Air Pollution? What Causes Air Pollution? is the contamination of the atmosphere by wastes from sources such as industrial burning and automobile
Ireland s Transboundary Gas Emissions
 1990-2016 March 2018 CONTENTS KEY HIGHLIGHTS... 3 Introduction and Background... 3 Ceilings and summary tables... 4 Sulphur Dioxide... 7 Nitrogen Oxides... 9 Ammonia...12 Non-Methane Volatile Organic Compound
Air Quality & Health. Our Atmosphere. ENVIR 202: Lesson No. 14. Lesson 14: Air Quality February 6, ENVIR 202: Population & Health 1
 ENVIR 202: Lesson No. 14 Air Quality & Health February 6, 2006 Chuck Treser University of Washington Program on the Environment ENVIR 202: Lesson 14 1 Our Atmosphere Spaceship Earth Protects Us Loss of
Air Pollution Sources Overview. Amy Roberts, Division Manager January 24, 2019
 Air Pollution Sources Overview Amy Roberts, Division Manager January 24, 2019 Types of Air Pollutants Criteria Pollutants Particulate Matter Nitrogen Dioxide Ozone Carbon Monoxide Lead Sulfur Dioxide Air
Living things in their environments
 Introduction: This lesson will provide children the opportunity to develop a greater understanding of living things, personal health and the health of the environment. The children will be encouraged to
Optimizing the Design of Air Pollution Control Measures to Improve Human Health
 Optimizing the Design of Air Pollution Control Measures to Improve Human Health James J. Schauer, PhD, PE, MBA Professor Impacts of Air Pollution Human Health Acute and Chronic impacts Human Welfare Visibility
ASSESSMENT ASSESSMENT TECHNIQUES PART 1 AIR QUALITY SUMMARY
 DESIGN MANUAL FOR ROADS AND BRIDGES VOLUME 11 SECTION 3 ENVIRONMENTAL ASSESSMENT ENVIRONMENTAL ASSESSMENT TECHNIQUES PART 1 AIR QUALITY SUMMARY This document gives guidance on methods for the assessment
A LOW EMISSION ZONE FOR LONDON.
 A LOW EMISSION ZONE FOR LONDON. Lucy Sadler 1, David Hutchinson 1, Paul Watkiss 2, David Carslaw 3. 1 Greater London Authority, City Hall, The Queen's Walk, London, SE1 2AA, UK lucy.sadler@london.gov.uk,
MODULE I. Learning Objectives
 MODULE I Learning Objectives To make the students aware of history of air pollution; definition of air pollution and various types of sources and classification of air pollutants. Lecture 1 Lecture 2 Lecture
PM2.5 NAAQS Implementation & Permitting in Georgia
 PM2.5 NAAQS Implementation & Permitting in Georgia Georgia Environmental Conference Jekyll Island, Georgia August 25, 2016 Brad James, P.E. Overview Current UFP Regulation (as PM 2.5 ) PM 2.5 NAAQS SIP
WELCOME TO PERIOD 12: CONSEQUENCES OF USING CHEMICAL ENERGY Homework #11 is due today.
 WELCOME TO PERIOD 12: CONSEQUENCES OF USING CHEMICAL ENERGY Homework #11 is due today. Midterm 1 grade curve: A 29-33: 17% (of 166 students) B 25-28: 34% C 20-24: 32% D 15-19: 14% E 0-14: 3% Average score
EU AMBIENT AIR QUALITY LEGISLATION PRESENT AND FUTURE. A. Kobe DG Environment, European Commission
 EU AMBIENT AIR QUALITY LEGISLATION PRESENT AND FUTURE A. Kobe DG Environment, European Commission ABSTRACT The Clean Air for Europe (CAFE) programme compiled the latest knowledge on the impacts of air
MEAN ANNUAL EXPOSURE OF CHILDREN AGED 0-4 YEARS TO ATMOSPHERIC PARTICULATE POLLUTION
 MEAN ANNUAL EXPOSURE OF CHILDREN AGED 0-4 YEARS TO ATMOSPHERIC PARTICULATE POLLUTION GENERAL CONSIDERATIONS Issues Type of indicator Rationale Issues in indicator design Respiratory disease Exposure (proximal)
Integrated Pollution Prevention and Control (IPPC) Reference Document on Best Available Techniques in the Cement and Lime Manufacturing Industries
 Reference Document on Best Available Techniques in the Cement and Lime Manufacturing Industries") EUROPEAN COMMISSION Integrated Pollution Prevention and Control (IPPC) Reference Document on Best Available Techniques in the December 2001 Executive Summary EXECUTIVE SUMMARY This Reference Document
EUROPEAN COMMISSION Integrated Pollution Prevention and Control (IPPC) Reference Document on Best Available Techniques in the December 2001 Executive Summary EXECUTIVE SUMMARY This Reference Document
Integrated Assessment Modelling in the UK: with a focus on the transport sector & NO2
 Integrated Assessment Modelling in the UK: with a focus on the transport sector & NO2 Helen ApSimon, Tim Oxley, Rosalind O Driscoll, Mike Holland and Audrey de Nazelle Imperial College, London NO2 Analysis
Non-exhaust emissions
 Non-exhaust emissions UK Department for Transport perspective November 2018 NRMM - The Legislative Changes 1 Duncan Kay International Vehicles Standards - DfT November 2018 NRMM - The Legislative Changes
Air pollution: Health impacts across UK and Sussex
 Air pollution: Health impacts across UK and Sussex Dr Sotiris Vardoulakis Group Leader, Air Pollution and Climate Change Centre for Radiation, Chemical & Environmental Hazards Environmental Sustainability
22/02/2017. Richard Smithers 1. Effects of pollutants from road traffic on natural habitats and risk to nature conservation sites Richard Smithers
 Effects of pollutants from road traffic on natural habitats and risk to nature conservation sites Richard Smithers Knowledge Leader (Ecosystems) 17 February 2017 Background Biodiversity 2020 identifies
Tananyag fejlesztés idegen nyelven
 Tananyag fejlesztés idegen nyelven Prevention of the atmosphere KÖRNYEZETGAZDÁLKODÁSI AGRÁRMÉRNÖKI MSC (MSc IN AGRO-ENVIRONMENTAL STUDIES) London smog Acid rain: the chemical process Lecture 14 Lessons
Air Pollution and Air Pollution Control. Air. Air
 Air Pollution and Air Pollution Control Air Troposphere ambient air nearest to Earth's surface weather occurs here Properties: approximately 80% of the atmosphere's mass 99% of its water vapor and aerosols
OUR NATION'S AIR STATUS AND TRENDS THROUGH 2015 WELCOME!
 Page 1 of 14 OUR NATION'S AIR STATUS AND TRENDS THROUGH 2015 WELCOME! The U.S. Environmental Protection Agency (EPA) is committed to protecting public health by improving air quality and reducing air pollution.
Cllr Vic Ient s Comments to the UK Government
 Cllr Victor S Ient s submission to the UK Government s (Defra) Air Quality dated 15 th June 2017 Summary (taken from the consultation document) Poor air quality is the largest environmental risk to public
Fact Sheet Series for Key Stages 2 & 3
 Atmosphere, Climate & Environment Information Programme, Manchester Metropolitan University Chester Street, Manchester M1 5GD Tel: 0161 247 1590 Fax: 0161 247 6332 E-Mail: @mmu.ac.uk Internet: http://www.ace.mmu.ac.uk/
Ambient Air Monitoring
 Ambient Air Monitoring At Shannon, Co. Clare 15 th March 2011 18 th July 2012 Contents Summary........ 3 Introduction........ 4 Time Period........ 5 Siting......... 5 Monitoring Methods....... 6 Results.........
Chapter 13. Air Pollution
 Chapter 13 Air Pollution Kuala Lumpur Beijing, China, 2008 Perspective Air pollution is not a new problem Pollution sources can be divided into two main classes 1. Created by Humans 2. Natural Pollution
Air quality in the vicinity of a governmental school in Kuwait
 Air Pollution XVI 237 Air quality in the vicinity of a governmental school in Kuwait E. Al-Bassam 1, V. Popov 2 & A. Khan 1 1 Environment and Urban Development Division, Kuwait Institute for Scientific