Great Keppel Island Resort EIS
|
|
|
- Branden Martin
- 6 years ago
- Views:
Transcription
1 Great Keppel Island Resort EIS For GKI Resort Pty Ltd Water Cycle Management Report 21 October 2011 Opus International Consultants (PCA) Pty Ltd ABN Level 1, 2 Mayneview Street, Milton, QLD 4064 PO Box 1703, Milton, QLD Water Cycle Management Report Great Keppel Island Resort EIS Revision E
2 Water Cycle Management Report Great Keppel Island Resort Revitalisation Plan TABLE OF CONTENTS EXECUTIVE SUMMARY INTRODUCTION PROJECT OVERVIEW LOCALITY OVERVIEW CURRENT AND PREVIOUS DEVELOPMENT SCOPE AND OBJECTIVES LEGISLATIVE REQUIREMENTS ENVIRONMENTAL PROTECTION ACT General Environmental Duty Environmentally Relevant Activities Environmental Protection Policies WATER ACT WATER SUPPLY (SAFETY & RELIABILITY) ACT PUBLIC HEALTH ACT COASTAL PROTECTION & MANAGEMENT ACT FISHERIES ACT EXISTING ENVIRONMENT TOPOGRAPHY GEOLOGY SOILS SURFACE WATER GROUNDWATER WATER QUALITY OBJECTIVES SURFACE WATER GROUNDWATER ANALYSIS EXISTING INFRASTRUCTURE WATER SUPPLY...44 N-B016 Table of Contents
3 Water Cycle Management Report Great Keppel Island Resort Revitalisation Plan Overview Historical Water Demands WASTEWATER TREATMENT & DISPOSAL Overview Environmental Licence Historical Wastewater Generation STORMWATER DRAINAGE OPTIONS ANALYSIS WATER SUPPLY WASTEWATER MANAGEMENT Sewerage Collection Wastewater Treatment Wastewater Effluent Reuse & Disposal STORMWATER MANAGEMENT - OPTIONS PROJECTED DEMAND PROJECTED OCCUPANCY ESTIMATED EQUIVALENT PERSONS PROJECTED WATER DEMAND Per Capita Water Demand Fire Fighting Water Demand Total Water Demand PROJECTED WASTEWATER FLOWS Per Capita Wastewater Flow Estimated Equivalent Persons Total Wastewater Flow WATER BALANCE WATER SUPPLY SOURCES Rainwater Collection Treated effluent Harvested Stormwater (Golf Course) Harvested Stormwater (Other Areas) Mainland Water Supply AVERAGE DEMAND & PEAKING FACTORS...79 N-B016 Table of Contents
4 Water Cycle Management Report Great Keppel Island Resort Revitalisation Plan 8.3 SUMMARY STAGING WATER SUPPLY SCHEME CONSTRUCTION (STAGE 1) OPERATION & CONSTRUCTION (POST-STAGE 1) Water Supply Source Treatment Standard Treatment Process Storage Distribution WASTEWATER TREATMENT & REUSE SCHEME CONSTRUCTION OPERATION & CONSTRUCTION (POST-STAGE 1) Wastewater Collection Treatment Standard Treatment Process Treated effluent Reuse MEDLI MODELLING MEDLI Input Values MEDLI Outputs MEDLI Summary EMERGENCY WET WEATHER DISCHARGE STORMWATER MANAGEMENT CATCHMENT OVERVIEW METHODOLOGY Stormwater Quantity Stormwater Quality OBJECTIVES & TARGETS Stormwater Quantity Stormwater Quality STORMWATER QUANTITY Surface Flow Rates Runoff Volumes N-B016 Table of Contents
5 Water Cycle Management Report Great Keppel Island Resort Revitalisation Plan Frequent Flow Management Putney Creek Mouth STORMWATER QUALITY Model Inputs & Assumptions Management Concepts Analysis Results Stormwater Quality Improvement Devices Post-Construction Monitoring POTENTIAL IMPACTS AND MITIGATION MEASURES OVERVIEW CONCLUSION BIBLIOGRAPHY APPENDIX A GKI RESORT REVITALISATION PLAN APPENDIX B CATCHMENT BOUNDARIES - PROPOSED APPENDIX C EXISTING WATER SUPPLY & WASTEWATER INFRASTRUCTURE APPENDIX D EXISTING ENVIRONMENTAL LICENCE (NO. CR0061) APPENDIX E WATER BALANCE SPREADSHEET APPENDIX F WATER SUPPLY SCHEME LAYOUT APPENDIX G WASTEWATER SCHEME LAYOUT APPENDIX H N-B016 Table of Contents
6 Water Cycle Management Report Great Keppel Island Resort Revitalisation Plan PRELIMINARY IRRIGATION MANAGEMENT PLAN APPENDIX I MEDLI SUMMARY OUTPUT DATA APPENDIX J STORMWATER QUANTITY ANALYSIS APPENDIX K STORMWATER QUALITY ANALYSIS APPENDIX L STORMWATER DRAWINGS APPENDIX M PRELIMINARY HAZARDOUS SUBSTANCE MANAGEMENT PLAN APPENDIX N PRELIMINARY STORMWATER QUALITY MAINTENANCE PLAN APPENDIX O PRELIMINARY EROSION AND SEDIMENT CONTROL MANAGEMENT PLAN N-B016 Table of Contents
7 Water Cycle Management Report Great Keppel Island Resort Revitalisation Plan LIST OF TABLES TABLE 3.1: Summary of Shallow Groundwater Aquifer Properties TABLE 4.1: Proposed Water Quality Objectives for Surface Waters TABLE 5.1: Licence Release Limits for Irrigation TABLE 5.2: Licence Release Limits for Ocean Outfall TABLE 7.1: Estimated Average & Maximum Occupancy for Great Keppel Island Resort TABLE 7.2: Equivalent Person Estimation for GKI Resort Revitalisation Plan TABLE 7.3: Estimated Internal Water Supply - Average Daily Demand Standard Water Fixtures and Water Saving Devices TABLE 7.4: Estimated Golf Course Irrigation Requirements TABLE 7.5: Comparison of Average Daily Water Demand with Peak Daily Water Demands TABLE 7.6: Estimated Monthly Wastewater Flows (@180L/EP/day) TABLE 8.1: Estimated Water Supply - Average Daily Demand 1 Bedroom Apartment with 2.2 EP/ Apartment, Water Saving Fixtures and RW Reuse TABLE 8.2: Estimated Water Supply - Average Daily Demand 2 or 3 Bedroom Apartment or Villa with 2.5 EP/ Apartment or Villa, Water Saving Fixtures and RW Reuse TABLE 8.3: Average Water Demand Over 12 Months TABLE 8.4: Peak Occupancy Month Water Demand TABLE 8.5: Peak Month Water Demand TABLE 8.6: Per Capita Demand and Peaking Factor Comparison TABLE 8.7: Summary of Staging TABLE 8.8: Growth in EP, Annual Domestic Water Demand and Wastewater Effluent Availability with Staging of the Project TABLE 10.1: Recommended Treatment & Water Quality Criteria for Municipal Uses 1 TABLE 10.2: Proposed Minimum Treated effluent Quality Criteria TABLE 10.3: Average Annual Rainfall & Pan Evaporation Percentile Totals TABLE 10.4: Estimated Monthly Wastewater Flows (@200L/EP/day) Adopted for MEDLI Modelling TABLE 10.5: Soil Water Characteristics Adopted in MEDLI Modelling TABLE 10.6: Soil Nutrient Characteristics Adopted in MEDLI Modelling TABLE 10.7: Summary of MEDLI Inputs & Outputs TABLE 10.8: Summary of MEDLI Outputs vs MODFLOW Inputs TABLE 10.9: Estimated Golf Course Irrigation Requirements Compared to Treated effluent Irrigation TABLE 11.1: Stormwater Catchment Characteristics TABLE 11.2: Catchment 5 (Peak Flow Rates from Catchment to Clam Bay) TABLE 11.3: Catchment 7 (Peak Flow Rates to Long Beach from GKI land and Catchments Downstream) TABLE 11.4: Catchment 8 (Peak Flow Rates to Fisherman s Beach from GKI land) TABLE 11.5: Catchment 9 (Peak Flow Rates at the Mouth of Putney Creek) 1 ANZECC (2006) Australian Guidelines for Water Recycling: Managing Health and Environmental Risks (Phase 1) Table 3.8 N-B016 Table of Contents
8 Water Cycle Management Report Great Keppel Island Resort Revitalisation Plan TABLE 11.6: Catchment 11 (Peak Flow Rates at the Mouth of Leeke s Creek) TABLE 11.7: Required Detention Basins Sizes for Each Catchment TABLE 11.8: Average Annual Volumes Estimated for Pre-Development & Post-Development TABLE 11.9: Frequent Flow Management - Comparison of Capture and Disposal Volume with Infiltration Capacity TABLE 11.10: Soil Characteristics in MUSIC Model TABLE 11.11: Stormwater Quality Improvement Devices - Minimum Sizing Requirements TABLE 12.1: Risk Assessment Matrix TABLE 12.2: Summary of Potential Water Supply, Wastewater & Stormwater Impacts and Proposed Mitigation Measures LIST OF FIGURES FIGURE 5-1: Monthly Water Produced, Effluent Treated & Guests plus Staff Data for 2006 FIGURE 5-2: Historical Monthly Water and Wastewater Demands for 2006 Data FIGURE 5-3: Historical Per Capita Water and Wastewater Demands for 2006 Data FIGURE 8.1: Summary of Water Supply Sources Relative to Water Demand FIGURE 9.1: GKI Resort Revitalisation Plan - Water Supply Schematic FIGURE 10.1: GKI Resort Revitalisation Plan - Wastewater Collection and Recycled Treated effluent Reuse Schematic FIGURE 10.2: Comparison of Nitrogen Leached Below the Soil Profile under No Irrigation and Proposed Irrigation Scheme FIGURE 10.3: Phosphorous Adsorption in Soil Profile over 53 years of Treated effluent Irrigation N-B016 Table of Contents
9
10 Water Cycle Management Report Great Keppel Island Resort Revitalisation Plan EXECUTIVE SUMMARY This Report has been prepared by Opus International Consultants (Opus) on behalf of GKI Resort Pty Ltd to provide an overview of proposed water cycle management strategies associated with the Great Keppel Island (GKI) Resort Revitalisation Plan, including addressing water supply, wastewater and stormwater management. The contents of this Report are to be included as part of the overall Environmental Impact Statement (EIS) prepared for the GKI Resort Revitalisation Plan. Specifically, this Report has been prepared to address parts of sections 2.5 and 3.4 of part B of the Terms of Reference for EIS Great Keppel Island Resort Project issued by the Queensland Coordinator-General and dated June 2011 and relevant requirements of the Guidelines for an Environmental Impact Statement for the Great Keppel Island Tourism and Marina Development, Queensland issued by the Australian Department of Sustainability, Environment, Water, Population and Communities (SEWPaC) in conjunction with the Great Barrier Reef Marine Park Authority (GBRMPA). The GKI Resort Revitalisation Plan proposes to create a low rise, eco-tourism resort on Great Keppel Island incorporating a new 250 suite, 4 or 5 star resort hotel at Fisherman s Beach; a new 250 berth, all-weather safe access marina facility at Putney Beach including a retail village; an 18-hole championship golf course; a new runway and airport terminal; 750 eco-tourism villas; 300 eco-tourism apartments; staff accommodation and sporting fields. As part of the GKI Resort Revitalisation Plan, a new GKI Research Centre and Biodiversity Conservation Fund (BCF) will be established, the original Leeke s Homestead will be restored and a significant proportion of the Island will be protected for conservation. Great Keppel Island is the largest island in the Keppel Island Group and is located approximately 12 km off the coast of Yeppoon on the Central Queensland coast. GKI is included within the Rockhampton Regional Council local government area. Until recently the Island has been occupied by a number of different commercial accommodation facilities ranging from camping ground style accommodation to resort level accommodation. The original GKI Resort was the main tourism resort located on the Island and comprised 190 guest rooms. These facilities were closed in early The Island is currently occupied by two backpackers facilities, 10 residential properties and 10 commercial premises. Access to the Island is currently via ferry and cruise ship services from the Rosslyn Bay / Keppel Bay Marina on the mainland. The proposed water cycle management strategy for the GKI Resort Revitalisation Plan as outlined in this Report has been developed in a holistic manner in accordance with the principles of water sensitive urban design and aims to: Minimise demand on limited water resources, particularly potable water supplies, by maximising water use efficiency and maximising the use of alternative water supplies (e.g. rainwater, treated effluent, harvested stormwater) for non-potable purposes; Maximise the beneficial reuse of wastewater and reduce the volume of wastewater requiring disposal; N-B016 Page 8
11 Water Cycle Management Report Great Keppel Island Resort Revitalisation Plan Ensure wastewater is adequately treated to a standard fit for purpose prior to reuse or disposal to reduce the risk of potential environmental and public health impacts; Ensure the collection, storage and reuse or disposal wastewater during construction and operation of the GKI Resort Revitalisation Plan does not adversely impact on the natural environment or communities on and off the Island; Ensure stormwater is adequately treated to reduce the risk of potential impacts on the environmental values of receiving waters; Ensure stormwater is managed to maintain existing hydrologic behaviour by providing appropriate detention where necessary to ensure non-worsening of peak discharge velocities; Ensure water cycle management infrastructure, including stormwater quality improvement devices, detention basins and treated effluent storages, is designed and located to integrate into the landscape to enhance visual, social, cultural and ecological values; and, Continually improve the process for managing water supply, wastewater and stormwater associated with the GKI Resort Revitalisation Plan by conducting regular audits to identify opportunities to reduce, reuse or recycle waste, including wastewater, and to prevent environmental harm. This Report acknowledges that valuable water resources on the Island were poorly managed during operation of the former GKI resort and outlines a strategy that will provide water security for the GKI Resort Revitalisation Plan while significantly reducing the potential for impacts on water resources in the future and enabling groundwater aquifers damaged in the past to be restored. Key elements of the proposed water cycle management strategy are described as follows: Water Supply and Storage: Total annual average water demand for operation of the GKI Resort Revitalisation Plan has been estimated to be 1,884kL/day of which 493 kl/day is required for internal purposes and 1,391 kl/day is required for external purposes, primarily comprising irrigation of the golf course and other landscaped areas. Peak occupancy is expected to occur in January and will result in an average daily internal water demand of 855 kl/day, which coincides with an average daily external water demand of 1,426 kl/day to equate to a total average water demand for January of 2,281 kl/day. Peak irrigation water demand is expected to occur in November and will result in an average external water demand of 1,942 kl/day, which coincides with an internal average daily water demand of 527 kl/day to equate to a total average water demand for November of 2,469 kl/day. The above water demand estimates are based on the use of water efficient fixtures and fittings, which will be installed throughout all resort and marina facilities. To calculate total water demands, an average domestic water demand of 228L/EP/day has been determined as appropriate for the GKI Resort Revitalisation Plan. A maximum design population of 3,973 EP has been estimated and includes approximately 3,000 EP within the Fisherman s Beach and Marina Precincts and approximately 1,000 EP within the Clam Bay Precinct. N-B016 Page 9
12 Water Cycle Management Report Great Keppel Island Resort Revitalisation Plan To meet estimated water demand during operation of the GKI Resort Revitalisation Plan it is proposed to maximise the use of treated effluent, and captured rainfall and stormwater runoff to reduce demand for valuable potable water supplies, while ensuring security of water supply by via connection to Council s mainland water supply network. Specifically, the following water supply sources will be used. Potable Water Supply All required potable water (i.e. drinking water) supply will be derived from Rockhampton Regional Council s municipal water supply scheme on the mainland (as operated by Fitzroy River Water for the Council) via a new water main to be installed within the Utility Services Corridor; During the design stage of the Project, the viability of increased rainwater reuse for apartments and villas will be investigated. This would involve UV disinfection of the potable use component. It is estimated that 100% of the demand for the apartments and villas would be available for the months of December to June inclusive and, in median rainfall years, up to 50% or more in the months of July to November inclusive. Non-Potable Internal Water Supply Primary water supply for non potable uses to toilets and laundries within all facilities will be derived from captured rainwater via roof runoff collected and stored in tanks and pumped back to the relevant fixtures. Where necessary, rainwater supply to these fixtures will be supplemented by top up from the main potable supply. Non-Potable External Water Supply Water supply for irrigation purposes will be provided from the following sources, in order of priority, and subject to availability: o o o o o Rainwater captured and stored from roof runoff to all facilities to be used for irrigation purposes adjacent to the respective facilities; Treated effluent derived from the Island-based WWTP(s) will provide the primary water supply for irrigation of the golf course along with irrigation of other landscaped areas where excess supply is available; Harvested stormwater runoff captured within the purpose-designed and built pond system incorporated into the golf course will be used to supplement treated effluent supplies for irrigation of the golf course; Additional purpose-designed and built stormwater harvesting systems may also be installed in other areas around the resort (subject to feasibility, final design and availability of sufficient water); and Any additional requirements for irrigation water supply, particularly for the golf course, would be sourced from the potable water supply via the mainland connection. A detailed water balance has been undertaken and demonstrates that: Rainwater reuse will account for between 3% and 9% of total water demand; N-B016 Page 10
13 Water Cycle Management Report Great Keppel Island Resort Revitalisation Plan Treated effluent reuse will account for between 16% and 28% of total water demand; and Harvested stormwater will account for between 4% and 13% of total water demand. Water derived from the mainland connection to Rockhampton Regional Council s water supply system will therefore be required to supply approximately 50% to 77% of the total water demand for this Project on average. During January, an average 645 kl/day will be required from the mainland water supply connection with a peak day mains water demand for January of 968 kl/day. During November, an average 1,436 kl/day will be required from the mainland water supply connection with a peak day mains water demand for November of 1,579 kl/day. The peak day demands assume a 1.5 peaking factor on the average domestic demand for the month and a 1.1 peaking factor on irrigation demand for the month. Although it is unlikely that the internal water demand and external water demand will coincide, it is recommended that sizing of the mainland water supply connection be based conservatively on such an occurrence. This approach to sizing of the mainland connection will avoid the need for possible augmentation of the main and associated seabed disturbance in the future and will ensure sufficient capacity is available to support the high early water requirements associated with establishment of the golf course, which coincides with low treated effluent production in the early stages of the Project. Emergency Water Supply In the event of a disruption to the potable water supply connection to the mainland, it is estimated that between 3-7 days of emergency potable water supply may be sourced from mainland water stored within reservoirs on the Island. In the event of an extended disruption to the mainland water supply connection, water restrictions will be imposed, additional potable water may be barged over from the mainland or consideration may need to be given to reducing guest occupancy and staffing to ensure that adequate water is available. Fire Fighting Water Supply Water supply for fire fighting will be provided by the provision of dedicated fire storage within the water storage reservoirs, fire pumps (if required following assessment in the detailed design stage) and the provision of fire hydrants and hose reels within the water reticulation system adjacent to the various buildings throughout the GKI Resort Revitalisation Plan. Construction Water Supply During Stage 1 of construction, water supply will be sourced from the existing groundwater bores installed within the Long Beach Aquifer. The maximum long term sustainable yield from the Long Beach Aquifer has recently been assessed by Douglas Partners (2011) as 100 kl/day, which could be drawn from two bores having a maximum extraction capacity of 50kL/day each. Estimated water demand for Stage 1 construction is approximately 5 ML/ annum for construction (say an average of 20 kl/day for 250 working days and, with a peaking factor of 2, a peak day of 40 kl/day) and up to 50 kl/day for domestic purposes for construction workers. Total Stage 1 construction water demand would thus peak at around 90 kl/day. This is within the sustainable yield of the Long Beach Aquifer. Once the mainland water supply connection is operational, no further extraction of groundwater resources is proposed for construction or operation of the resort. N-B016 Page 11
14 Water Cycle Management Report Great Keppel Island Resort Revitalisation Plan With the exception of treated effluent production, minimal treatment will be required for proposed water supply sources to be used on the Island. Treatment is likely to be limited to disinfection of groundwater supplies for Stage 1 construction and supplementary disinfection of mainland water supplies prior to storage on the Island due to the length of of the pipeline from the mainland. Key water supply infrastructure to be constructed for the GKI Resort Revitalisation Plan will include: A 16 km water supply main within the Utility Services Corridor extending from Council s water supply network along the Scenic Highway near Emu Park to the GKI water supply network at the Marina Precinct; Storage tank (to receive the mainland supply) and pumps adjacent to the Marina Precinct to pump to high level water storage tanks for distribution; Two potable water reticulation systems are proposed - one for the Fisherman s Beach and Marina Precincts and the other for the Clam Bay Precinct. Both systems will be serviced by high-level water storage tanks fed by trunk delivery mains from mainland supply. Some higher elevation accommodation facilities may require small booster pumps to deliver reticulated water supply; Rainwater tanks, stormwater harvesting ponds / tanks and treated effluent storage tanks for supply of non-potable water; and, Non-potable water reticulation systems to distribute treated effluent, harvested stormwater and collected rainwater for irrigation and other purposes. Wastewater, Treatment and Reuse A new wastewater treatment plant (WWTP) will be constructed on the Island to treat all sewage generated by the GKI Resort Revitalisation Plan. Up to two WWTPs may be constructed on the Island depending on the final layout and staging of the Project. The new WWTP(s) will have a total peak design capacity of approximately 4,000 EP. This is likely to include WWTP with a peak design capacity of approximately 3,000 EP for the Fisherman s Beach and Marina Precincts, which is expected to be constructed in at least two stages of 1500 EP each or possibly three stages of 1,000 EP each. A WWTP with a peak design capacity of approximately 1,000 EP may also be constructed for the Clam Bay Precinct, which is expected to be constructed in two stages of 500EP each. An average dry weather flow (ADWF) of 180L/EP/day has been estimated for the GKI Resort Revitalisation Plan, which is equivalent to the estimated internal water demand. However, an ADWF of 200L/EP/day has been adopted for modelling of treated effluent irrigation to ensure a conservative approach to sizing of the irrigation area and wet weather storage requirements in order to reduce the risk of potential environmental impacts. It is proposed that treated effluent produced by the Island-based WWTP will be beneficially reused for irrigation of the golf course and other landscaped areas. As the volume of treated effluent likely to be produced by the GKI Resort Revitalisation Plan is expected to be sufficient to only partially meet the irrigation requirements of the proposed golf course, no other forms of reuse (eg. toilet flushing) are considered feasible at this time. N-B016 Page 12
15 Water Cycle Management Report Great Keppel Island Resort Revitalisation Plan A comprehensive daily water and nutrient balance model has been undertaken for the proposed irrigation scheme based on over 50 years of site specific climatic data. This modelling has demonstrated that in most years, 100% of all treated effluent produced by the Island-based WWTP will be reused for irrigation of the golf course and other landscaped areas, assuming provision of at least 31 hectares of irrigation area and 37ML of wet weather storage. During extreme wet weather events expected to occur on average about once every 10 years, a small proportion of treated effluent may be discharged via an ocean outfall. The ocean outfall will be approximately 1,000 metres in length and will extend from Long Beach. The ocean outfall will be located and designed to achieve sufficient separation to sensitive uses and to provide for adequate dispersion in accordance with the requirements of the GBRMPA. To further reduce the frequency of overtopping and to provide a buffer against potential increases in rainfall intensity due to projected climate change impacts, it is proposed that a total wet weather storage capacity of 44ML will be provided. This equates to an additional 7 ML or approximately 20% more wet weather storage than considered in the modelling, which suggests that ocean discharge is actually likely to occur much less frequently than the once every 10 years shown by the modelling. The WWTP(s) will be designed to treat sewage generated by the Project to the following standard: Quality Characteristic Unit Release Limit Limit Type E. coli cfu/100ml <1 (<10) Median (95 th percentile) 5-day Biological Oxygen Demand mg/l <20 Median Turbidity NTU <2 (<5) Median (Maximum) Suspended Solids mg/l <5 Median Total Dissolved Solids mg/l <1,000 Median ph Range Total Nitrogen mg/l <20 Median Total Phosphorous mg/l <7 Median Free Chlorine Residual 1 mg/l Range The proposed treatment standard is consistent with the minimum water quality requirements specified for Municipal Use open spaces, sports grounds, golf courses, dust suppression, etc or unrestricted access and application under the Australian Water Quality Guidelines for Water Recycling: Managing Health and Environmental Risks (Phase 1) (ANZECC, 2006). Proposed total nitrogen and total phosphorous concentrations have been determined as appropriate based on a comprehensive assessment of the nutrient assimilation capacity of soils and vegetation within the proposed irrigation area. A range of treatment systems and processes are capable of achieving the above standard of treatment, with the preferred option to be selected at the design stage. Selection of the preferred treatment system will need to take into account the following factors: Proposed staging of the Project over 12 years, with associated progressive increases in sewage generation and treated effluent available for irrigation; Highly variable hydraulic loading associated with fluctuating occupancy over the year ranging from approximately 1,069 EP to 3,750 EP for the completed Project; N-B016 Page 13
16 Water Cycle Management Report Great Keppel Island Resort Revitalisation Plan Proximity of odour and noise sensitive receivers to the proposed WWTP(s) sites; and, The environmentally sensitive nature of the site, which requires a robust and reliable treatment system to ensure a consistent and high standard of treated effluent is produced so as to mitigate the potential for adverse impacts on public health and the environment. At this stage, a proprietary package treatment plant incorporating membrane bio-reactor (MBR) technology (or similar) combined with UV disinfection is considered the preferred option due to its proven ability to achieve the required standard of treatment, relatively small footprint, relatively enclosed treatment components to reduce odour and the capacity to install multiple parallel plants to facilitate staging and operational flexibility. Modelling of the proposed irrigation of treated effluent to the golf course and other landscaped areas demonstrates that proposed total nitrogen, total phosphorous and salinity levels will have no adverse impacts on soil quality or plant health within the irrigation area, and that nutrient levels in groundwater discharging to Leeke s Creek downstream of the irrigation area will not exceed relevant water quality objectives. Nutrient levels within treated effluent have also been assessed as achieving the required water quality objectives within a small mixing zone surrounding the ocean outfall based on possible emergency discharge events and are therefore unlikely to impact on ecological communities surrounding the outfall. Modelling of proposed treated effluent irrigation indicates that the proposed application of treated effluent will account for approximately 30-40% of the total annual irrigation requirements for tees, greens and fairways which are expected to account for approximately 50% of the total golf course area. Treated effluent will be used to meet 100% of the annual irrigation requirements for remaining areas of the golf course. Proposed wet weather storage will be provided as a series of ponds incorporated into the golf course design. Given the high standard of treatment, there is considered to be minimal risk to public health associated with these open storages provided they are appropriately managed. Wet weather storage ponds will be lined to prevent infiltration to groundwater due to the high permeability of natural soils. Stormwater runoff will be prevented from entering wet weather storage ponds to reduce the risk of overtopping. Additional stormwater harvesting ponds will be incorporated into the golf course design to collect surface runoff from recycled irrigation areas. Collected stormwater will be used to supplement irrigation water supplies, while the stormwater ponds will also assist in reducing the direct release of golf course runoff to natural waterways. The potential for cyano-bacterial growth within proposed wet weather storage and stormwater harvesting ponds is relatively low given that regular mixing and changes in level will occur as water is extracted for irrigation. Nevertheless, regular monitoring of water quality within these ponds will also be undertaken to enable early identification and treatment of any potential eutrophication likely to contribute to algal blooms. A preliminary treated effluent irrigation management plan has been developed for the GKI Resort Revitalisation Plan and outlines a range of routine procedures, environmental control measures, contingency plans, monitoring and reporting requirements to ensure ongoing operation of the treated effluent irrigation scheme does not have any adverse impacts on public or environmental health. N-B016 Page 14
17 Water Cycle Management Report Great Keppel Island Resort Revitalisation Plan Stormwater Drainage: In accordance with water sensitive urban design (WSUD) principles and best practice environmental stormwater management, stormwater drainage systems incorporated into the GKI Resort Revitalisation Plan will primarily utilise surface drainage techniques (such as grassed swales) rather than traditional underground piped drainage systems. This will minimise the need for significant excavation for installation of stormwater pipe trenches while also enabling stormwater drainage systems to be utilised as landscape features. The proposed stormwater strategy also aims to treat stormwater at the source using bio-retention filters that utilise native vegetation and natural sand materials. The bio-filters remove sediment and nutrients from stormwater before allowing the stormwater to infiltrate into the natural sandy soils mimicking the natural process of groundwater recharge through rainwater infiltration that occurs on the Island. The proposed stormwater management strategy developed for the GKI Resort Revitalisation Plan has been designed to comply with State Planning Policy (SPP) 4/10 - Healthy Waters (May 2011) and the draft Urban Stormwater - Queensland Best Practice Environment Management Guidelines To demonstrate compliance, existing and post-development hydrologic behaviour within catchments containing elements of the GKI Resort Revitalisation Plan has been analysed to determine changes to peak surface flow rates and annual runoff volumes resulting from the Project. To assess the potential impacts of stormwater runoff generated by the GKI Resort Revitalisation Plan on the surface water quality in receiving waters, modelling has been undertaken using MUSIC (Model for Urban Stormwater Improvement Conceptualisation) software. The Project will increase the area of impervious surfaces (roads, roofs and the like) and reduce the area of pervious surfaces within a number of drainage catchments on GKI. This change in the relativity of impervious area to pervious area will alter the proportions of rainfall volume that becomes surface runoff, groundwater or is lost through evapo-transpiration. Despite the proposed increase in impervious area within catchments containing elements of the GKI Resort Revitalisation Plan, modelling has demonstrated that post-development peak surface flow rates in waterways on the Island can be maintained at less than existing peak rates by installing suitably sized detention basins at appropriate locations within these catchments. As such, the Project is deemed to comply with the waterway stability objective of SPP 4/10, which requires that new developments manage flows such that the post-development one-year ARI event discharge rate within the downstream waterway is no greater than the pre-development peak one-year ARI event discharge rate. By mitigating peak surface flow rates in this manner, the potential for scouring and erosion in downstream waterways is significantly reduced. Detention structures will comprise low impact designs utilising low grassed or vegetated mounds enclosing open space that can be readily incorporated as part of the landscape design for the Project. Preliminary sizing of detention basins and bio-retention systems have been specified for each catchment to achieve the required levels of flow attenuation and pollutant reduction. Although the exact location and design of detention basins will need to be confirmed during detailed design stages, modelling undertaken to date indicates that detention requirements to mitigate post-development peak flow rates to, or below, pre-development levels are relatively small. As such, it is anticipated that the required detention basins can be readily integrated into landscaped elements of the GKI Resort Revitalisation Plan without requiring any significant increase in the Project footprint. N-B016 Page 15
18 Water Cycle Management Report Great Keppel Island Resort Revitalisation Plan Annual runoff volumes, and particularly the distribution of rainfall to surface flow, groundwater and evapo-transpiration, were analysed using continuous simulation analysis in the hydrologic module of MUSIC software. As would be expected, analysis suggests that generally, surface flow volumes will increase, flow volumes to groundwater will increase slightly, and evapo-transpiration volumes will decrease. It has been determined however, that installation of rainwater tanks to capture and reuse roof water and infiltration into the natural sandy soils from proposed detention basins and bio-retention systems will assist in mitigating annual runoff volumes to an acceptable level. The harvesting of stormwater runoff for irrigation water supply proposed as part of the water cycle management strategy will further contribute to reducing surface runoff volumes. To protect in-stream ecology of ephemeral freshwater waterways, SPP 4/10 also requires new development to manage the increase in the number of small runoff events that occur from impervious surfaces compared to natural vegetated surfaces. This objective is typically satisfied by capturing and managing the first 10mm of runoff from impervious surfaces each day. Only two of the catchments affected by the GKI Resort Revitalisation Plan discharge to ephemeral freshwater streams, these being Catchment 9, which discharges to Putney Creek and Catchment 11, which discharges to Leeke s Creek. The proposed bio-retention and detention structures in these two catchments intercept all runoff from impervious surfaces before it reaches the respective defined waterways. In both catchments, the daily infiltration capacity of the treatment structures far exceeds the volume of the first 10mm of rainfall on the respective impervious surfaces, thus significantly reducing the potential for any increase in the frequency of low flow events. Given the nature of the site and its environmental significance, it is important that stormwater quality improvement devices are robust and well proven. Best practice vegetated bio-retention systems, including bio-retention basins, swales and infiltration areas will be installed to remove gross pollutants, sediments and nutrients from stormwater flows prior to discharge. Across a large proportion of the site, subsoils comprise of high permeability sand. The permeability of the subsoils determined through geotechnical investigations has been shown to be similar to the design permeability of the filters used in bio-retention basins or swales and significantly higher than that of typical mainland soils. Bio-retention filtrate can therefore drain directly to the sandy substrate with no specific under-drainage pipes required in the bio-retention areas. This will significantly reduce or avoid the need for an extensive network of drainage pipes and associated trenching that would otherwise be required. As such, the extent of ground disturbance and vegetation clearing likely to be required for installation of the stormwater treatment will generally be limited to that required for installation of the stormwater treatment devices themselves. Infiltration of treated stormwater through the base of the bio-retention facilities will also contribute to recharge of groundwater resources mimicking the natural rainwater infiltration that occurs on the Island. It will also eliminate the concentration of drainage flows to a limited number of discharge points, which significantly reduces the potential for scouring and erosion. Modelling of stormwater runoff using MUSIC software demonstrates that proposed stormwater quality improvement measures will readily achieve required annual pollutant load reduction targets and will result in no worsening of stormwater pollutant concentrations compared to modelling of the predeveloped catchment. Although bio-retention systems are capable of removing gross pollutants such as litter, frequent removal of debris is required to maintain effectiveness. As such, to prevent litter from resort areas N-B016 Page 16
19 Water Cycle Management Report Great Keppel Island Resort Revitalisation Plan entering waterways where it may harm wildlife, specific gross pollutant traps will be installed as part of the stormwater treatment train in key locations where litter generation is most likely to be concentrated and where the risk of entering waterways is greatest (e.g. the Marina Precinct). Specific stormwater management measures will be provided in high risk areas likely to contain significant quantities or types of contaminants not consistent with the assumptions of the stormwater modelling described in this section. This includes, but may not be limited to, the golf course, and areas used for the storage and handling of hazardous substances (e.g. chemicals, fuels and oils), bulk waste storage areas and maintenance workshops. Stormwater management on the proposed golf course will consist of the following elements: Surface runoff from the proposed golf course will be diverted to stormwater harvesting ponds for reuse for irrigation of the golf course; Golf course runoff will be directed to the stormwater harvesting ponds through a series of grassed swales and/ or bio-retention basins to facilitate removal of gross pollutants (e.g. litter) sediment and nutrients prior to entering the stormwater harvesting ponds; Stormwater harvesting ponds will incorporate an overflow provided with appropriate scour protection and outletting to a grassed overland flow channel providing further treatment prior to ultimately discharging to Leeke s Creek; Stormwater will be prevented from draining into wet weather storage ponds containing recycled water; and, Monitoring of water quality within the stormwater harvesting ponds will be undertaken as part of the irrigation management plan proposed for the golf course to ensure water quality is fit for purpose. Stormwater management proposed for other high risk areas will be designed to prevent stormwater coming into contact with contaminants (e.g. use of perimeter diversion systems, sealing and covering of the area) and to prevent the release of contaminants accidentally spilled or leaked within the area (e.g. bunding). Any stormwater that does enter such areas would be collected and tested to ensure compliance with relevant water quality standards prior to disposal. A preliminary Hazardous Substance Storage Management Plan has also been prepared for such areas to mitigate potential impacts from the spillage or leakage of hazardous substances. To support the above stormwater quality improvement concepts, overall civil, landscape and architectural designs will incorporate appropriate surface shaping to facilitate surface flow transport systems and bio-retention requirements. As part of the stormwater management strategy for the site, it has also been proposed to permanently open the mouth of Putney Creek to tidal movements, which will increase fisheries productivity and flushing to prevent the formation of eutrophied conditions that may contribute to algal blooms and subsequent odour nuisance. To achieve this, a lined discharge channel will be constructed below the boardwalk and esplanade, with a sediment basin incorporated towards the upstream end of the new channel. This will reduce the potential for silting up of the marina basin thereby reducing the need for ongoing maintenance dredging. N-B016 Page 17
20 Water Cycle Management Report Great Keppel Island Resort Revitalisation Plan 1. INTRODUCTION This Report has been prepared by Opus International Consultants (Opus) on behalf of GKI Resort Pty Ltd to provide an overview of proposed water cycle management strategies associated with the Great Keppel Island (GKI) Resort Revitalisation Plan, including addressing water supply, wastewater and stormwater management. The contents of this Report are to be included as part of the overall Environmental Impact Statement (EIS) prepared for the GKI Resort Revitalisation Plan. The GKI Resort Revitalisation Plan has been developed in accordance with the principles of Water Sensitive Urban Design (WSUD). WSUD is a holistic approach to the planning and design of urban development that aims to minimise negative impacts on the natural water cycle and protect the health of aquatic ecosystems. It promotes the integration of stormwater, water supply and sewage management at the development scale. WSUD represents a fundamental change in the way urban development is conceived, planned, designed and built. Rather than using traditional approaches to impose a single form of urban development across all locations, WSUD considers ways in which urban infrastructure and the built form can be integrated with a site s natural features. In addition, WSUD seeks to optimise the use of water as a resource. The key principles of WSUD are to: Protect existing natural features and ecological processes; Maintain the natural hydrologic behaviour of catchments; Protect water quality of surface and ground waters; Minimise demand on the reticulated water supply system; Minimise sewage discharges to the natural environment; and Integrate water into the landscape to enhance visual, social, cultural and ecological values. This Water Cycle Management Report outlines a strategy to address water supply, wastewater and stormwater management aspects of the GKI Resort Revitalisation Plan in a holistic manner to demonstrate consistency with the above principles. 1.1 PROJECT OVERVIEW The GKI Resort Revitalisation Plan (refer to Appendix A GKI Resort Revitalisation Plan) proposes to create a low rise, eco-tourism resort on Great Keppel Island. The proposal involves: Demolition of the old resort and construction of a new 4 or 5 star resort hotel at Fisherman s Beach comprising 250 suites and day spa; Dredging activities for construction of the marina and re-nourishment of Putney Beach using dredge spoil; N-B016 Page 18
21 Water Cycle Management Report Great Keppel Island Resort Revitalisation Plan A new all-weather safe access marina facility at Putney Beach comprising 250 berths, a ferry terminal, emergency services facilities, yacht club, and dry dock storage; A retail village with a mix of cafes, restaurants and clothing shops around the marina; An 18-hole golf course, designed by Greg Norman Golf Course Design and including club house, integrated with essential habitats and ecological corridors, and located on previously disturbed grazing lands; New runway and airport facilities; 750 eco-tourism villas incorporating sustainable building design, rooftop solar panels and water tanks; 300 eco-tourism apartments incorporating sustainable building design, rooftop solar panels and water tanks; Installation of power, water and telecommunications connections between the Island and mainland; Associated service facilities and utilities (waste collection area, fire-fighting and emergency services hub, fuel, solar, wastewater treatment plant etc), including 200 bed staff accommodation facilities; Establishment of the GKI Research Centre and Biodiversity Conservation Fund (BCF) which will aim to deliver a better understanding of the surrounding marine and terrestrial environments and to actively undertake conservation works to enhance the natural environment; A new sports oval which can be used by resort guests and other GKI residents and visitors; and Restoration of the original Leeke s Homestead. It is envisaged that approximately 685 full time, part time and casual staff will be required once the resort is fully operational. Most operational staff will work standard shift hours and will be sourced from the Capricorn Region. The majority of staff will travel to the Island via ferry for each shift, before returning home to the mainland after their shifts. Up to approximately 300 staff on average are expected to utilise the new 200 bed staff accommodation facility to be provided on the Island as part of the GKI Resort Revitalisation Plan. The GKI Resort Revitalisation Plan will be constructed in stages, with Stage 1 involving construction of the Fisherman s Beach hotel and day spa, the marina facility including retail precinct, one hundred and fifty (150) apartments and internal infrastructure (power, water, sewerage, stormwater, roads). It is expected that Stage 1 will take approximately 18 months to construct at a cost of around $150 million. Completion of the GKI Resort Revitalisation Plan is expected to take 12 years, finishing around Construction workers will be ferried to and from the Island where possible and practical. It is envisaged that rooms at the old resort as well as other accommodation options on the Island will be utilised to provide accommodation on the Island for some construction workers. 1.2 LOCALITY OVERVIEW Great Keppel Island is located approximately 12 km off the coast of Yeppoon on the Central Queensland coast. GKI is included within the Rockhampton Regional Council local government area. N-B016 Page 19
22 Water Cycle Management Report Great Keppel Island Resort Revitalisation Plan GKI is the largest island in the Keppel Island Group, which comprises a group of sixteen islands, including North Keppel Island Corroboree Island Pumpkin Island Miall Island Middle Island Barren Island Halfway Island and Humpy Island. Apart from GKI and Pumpkin Island all of the other Keppel Islands are designated National Parks. The proposed GKI Resort Revitalisation Plan applies to the areas of GKI that are leased by GKI Resort Pty Ltd, which covers an area of approximately 900 hectares consisting of multiple land tenures. The GKI Resort Revitalisation Plan also includes Unallocated State Land to be developed for the marina and areas to accommodate utility service connections between GKI and the mainland. There are seventeen beaches on GKI and its natural environment offers a wide range of activities including swimming, diving, snorkelling and bushwalking. 1.3 CURRENT AND PREVIOUS DEVELOPMENT Until recently the Island has been occupied by a number of different commercial accommodation facilities ranging from camping ground style accommodation to resort level accommodation. The original GKI Resort was the main tourism resort located on the Island and comprised 190 guest rooms. These facilities were closed in early The Island is currently occupied by two backpackers facilities, ten residential properties and ten commercial premises. Access to the Island is currently via ferry and cruise ship services from the Rosslyn Bay / Keppel Bay Marina on the mainland. In the 1990s when the former GKI resort was operating, the average daily population on the Island (staff, residents, overnight and day visitors) was approximately 765 persons while the maximum possible daily population was approximately 2,600 persons (Foresight Partners, 2011). The peak daily population for the Island during operation of the former resort (i.e. 2,600 persons) is therefore comparable with the anticipated average daily population projected for the revitalised resort (i.e. 2,274 persons) (Foresight Partners, 2011). 1.4 SCOPE AND OBJECTIVES The purpose of this Report is to outline a water cycle management strategy to address water supply, wastewater and stormwater management associated with the demolition, construction and operation of the resort to ensure no adverse impacts on surrounding environments and communities. Specifically, the water cycle management strategy for the GKI Resort Revitalisation Plan aims to: Minimise demand on limited water resources, particularly potable water supplies, by maximising water use efficiency and maximising the use of alternative water supplies (e.g. rainwater, recycled water, harvested stormwater) for non-potable purposes; Maximise the beneficial reuse of wastewater and reduce the volume of wastewater requiring disposal; Ensure wastewater is adequately treated to a standard fit for purpose prior to reuse or disposal to reduce the risk of potential environmental and public health impacts; Ensure the collection, storage and reuse or disposal of wastewater during construction and operation of the GKI Resort Revitalisation Plan does not adversely impact on the natural environment or communities on and off the Island; N-B016 Page 20
23 Water Cycle Management Report Great Keppel Island Resort Revitalisation Plan Ensure stormwater is adequately treated to reduce the risk of potential impacts on the environmental values of receiving waters; Ensure stormwater is managed to maintain existing hydrologic behaviour by providing appropriate detention where necessary to ensure non-worsening of peak discharge velocities; Ensure water cycle management infrastructure, including stormwater quality improvement devices, detention basins and recycled water storages, is designed and located to integrate into the landscape to enhance visual, social, cultural and ecological values; and Continually improve the process for managing water supply, wastewater and stormwater associated with the GKI Resort Revitalisation Plan by conducting regular audits to identify opportunities to reduce, reuse or recycle waste, including wastewater, and to prevent environmental harm. This Report has been prepared to address parts of sections 2.5 and 3.4 of part B of the Terms of Reference for EIS Great Keppel Island Resort Project issued by the Queensland Coordinator- General and dated June 2011, which requires the following issues to be considered in the Environmental Impact Statement (EIS): 2.5 Associated Infrastructure Water supply and storage Provide information on the proposed water usage by the project, including details on: water supply design the ultimate supply required by full occupancy of the development the quality and quantity of all water supplied to the site during the construction and operational phases estimated water requirements and supply options for operation and maintenance of the golf course fire fighting flows required a site plan outlining actions to be taken in the event of failure of the main water supply potential for recycling of treated waste water if applicable, describe the methods to be employed to prevent/control cyano-bacterial growth in open water storages. Describe proposed sources of water supply given the implication of any approvals required under the Water Act Emphasis must be placed on demand and supply variability to demonstrate selfsufficiency of the project (e.g. during all stages of development and ongoing use, including reasonable predicted low rainfall). Estimated rates of supply from each source (average and maximum rates) must be given and proposed water conservation and management measures must be described. Determination of potable water demand must be made for the project, including the temporary demands during the construction period. Details must be provided of any existing town water supply to meet such requirements. Detail should also be provided to describe any proposed on site water storage and treatment for use by the site workforce during construction and operational phases. N-B016 Page 21
24 Water Cycle Management Report Great Keppel Island Resort Revitalisation Plan A description should be provided of how any onsite water supplies are to be treated, contaminated water is to be disposed of and any decommissioning requirements and timing of temporary water supply/ treatment infrastructure is to occur Stormwater drainage Describe the proposed stormwater drainage system, and the proposed disposal arrangements, including any off site services. The EIS must detail the sources of stormwater and the quantity, quality and location of discharge to watercourses including the Great Barrier Reef Marine Park. Provide details on the standard of proposed stormwater treatment systems, including examples of quality improvement devices (sediment removal, gross pollutant traps), the schedule and timing of stormwater release from potential discharge points (spread of flow and scour protection), and the maintenance regime for the stormwater treatment systems Waste The proposed management of solid and liquid wastes must be detailed with consideration given to the suitability of available waste disposal options. Particular attention must be given to the capacity of wastes to generate acidic, saline or sodic conditions. Liquid waste Describe the sewerage infrastructure required by the project, including: options proposed for wastewater treatment and the proposed system for odour control peak design capacity evaluation of the wastewater treatment system and associated infrastructure using equivalent persons determination of the potential emergency effluent storage that would be required in an extended rain event (50 and 100-year wet weather storage ARIs accounting for climate change) the proposed disposal and/or reuse of the treated effluent and the management of such use. An irrigation plan should be provided detailing where the use of treated effluent is likely. Details of the likely impacts of treated effluent on surface water and groundwater quality should also be provided the siting and maintenance regime for the system all waste streams including demolition and construction wastes. Note: Issues relating to solid wastes that are also covered by this section of the ToR have been addressed separately in the Waste Management Report prepared by Opus International Consultants (2011a). 3.4 Water resources Description of environmental values This section of the EIS should provide a description of the existing water resources that may be affected by the project in the context of environmental values as defined in such documents as the EP Act, Environmental Protection (Water) Policy 2009 [EPP (Water)], Australia and New Zealand Guidelines for Fresh and Marine Water Quality 2000, the EPA Queensland Water Quality Guidelines 2009, and any relevant local and regional guidelines. N-B016 Page 22
25 Water Cycle Management Report Great Keppel Island Resort Revitalisation Plan An indication of the quality and quantity of water resources in the vicinity of the project area should be given. This section should describe: existing surface and groundwater in terms of physical, chemical and biological characteristics, and the interaction between surface and groundwater the recharge and discharge areas for groundwater on and around the island existing surface drainage patterns, flows, history of flooding including extent, levels and frequency and present water uses. The environmental values of the surface waterways and ground water of the affected area should be described in terms of: values identified in the EPP (Water) physical integrity, fluvial processes and morphology, including riparian zone vegetation and form, if relevant any impoundments (e.g. dams, levees, weirs etc.) hydrology of waterways and groundwater sustainability, including both quality and quantity dependent ecosystems existing and other potential surface and groundwater users any Water Resource Plans relevant to the affected catchments possible discharge areas where the groundwater seeps into coastal waters. If the project is likely to use or affect local sources of groundwater, this section should provide a description of groundwater resources in the area in terms of: geology/stratigraphy aquifer type such as confined, unconfined depth to and thickness of the aquifers depth to water level and seasonal changes in levels groundwater flow directions (defined from water level contours) interaction with surface water possible sources of recharge potential exposure to pollution current access to groundwater resources in the form of bores, springs, ponds, including quantitative yield of water and locations of access water quality, especially salinity and nitrates. The groundwater assessment should also be consistent with relevant guidelines for the assessment of acid sulphate soils including spatial and temporal monitoring to accurately characterise baseline groundwater characteristics. Specific reference should be made to relevant legislation or water resource plans for the region. The review should also provide an assessment of the potential take of water from the aquifer and how current users and the aquifer itself and any connected aquifers will be affected by the take of water. The review should include a survey of existing groundwater supply facilities (bores, wells, or excavations) to the extent of any environmental harm. The information to be gathered for analysis is to include: location pumping parameters draw down and recharge at normal pumping rates seasonal variations (if records exist) of groundwater levels historical environmental health data on groundwater held by the Rockhampton Regional Council. N-B016 Page 23
26 Water Cycle Management Report Great Keppel Island Resort Revitalisation Plan A network of observation points which would satisfactorily monitor groundwater resources both before and after commencement of operations should be developed. The data obtained from the groundwater survey should be sufficient to enable specification of the major ionic species present in the groundwater, ph, electrical conductivity and total dissolved solids and relate to climate variation. If in the event of the need for a desalination plant this would require detailed hydrodynamic modelling of the brine plume and its affect on the natural environment Potential impacts and mitigation measures This section should assess potential impacts of the project on water resource environmental values identified in the previous section. It should also define and describe the objectives and practical measures for protecting or enhancing water resource environmental values, to describe how nominated quantitative standards and indicators may be achieved, and how the achievement of the objectives will be monitored, audited and managed. Discuss potential impacts from sewage treatment plant overflows and pump station overflows. Matters to be addressed should include: potential impacts on the flow and the quality of surface and ground waters from all phases of the project, with reference to their suitability for the current and potential downstream uses, including aquatic ecosystem protection and discharge licences implications of irrigation and maintenance of the golf course with fertilizers and pesticides, especially on groundwater quality and ultimate effects on surrounding coastal waters and sediments an assessment of all likely impacts on groundwater depletion or recharge regimes potential impacts of surface water flow on existing infrastructure, with reference to the EPP (Water) and the Water Act 2000 chemical and physical properties of any waste water including stormwater at the point of discharge into natural surface waters, including the toxicity of effluent to flora and fauna. Having regard to the requirements of the Environmental Protection (Water) Policy, the EIS must present the methods to avoid stormwater contamination and the means of containing, recycling, reusing, treating and disposing of stormwater potential impacts on other downstream receiving environments, if it is proposed to discharge water to a riverine system the results of a risk assessment for uncontrolled releases to water due to system or catastrophic failure, implications of such emissions for human health and natural ecosystems, and list strategies to prevent, minimise and contain impacts an assessment of the environmental and health impact of the discharges and the potential for any chemicals or toxins to bio-accumulate in the aquatic environment (both flora and fauna). Management strategies should be adequately detailed to demonstrate best practice management and that environmental values of receiving waters will be maintained to nominated water quality objectives. Monitoring programs, which will assess the effectiveness of management strategies for protecting water resources during the construction, operation and decommissioning of the project, should be described. Outline how these strategies are incorporated into appropriate sections of the EMP. Surface water and water courses The hydrological impacts of the proposal on surface water and water courses should be assessed, particularly with regard to stream diversions, scouring and erosion and changes to flooding levels and frequencies both upstream and downstream of the project. When flooding levels will be affected, modelling of afflux should be provided and illustrated with maps. N-B016 Page 24
27 Water Cycle Management Report Great Keppel Island Resort Revitalisation Plan The need or otherwise for licensing of any diversions, water impoundments, placement of fill or destruction of native vegetation within any water course, lake or spring under the Water Act 2000 and the Fisheries Act 1994 should be discussed. Water allocation and water sources, including impacts on existing water entitlements, including water harvesting, should be established in consultation with DERM. Wastewater treatment Reference should be made to the properties of the land disturbed and processing liquid wastes, the technology for settling suspended clays from contaminated water, and the techniques to be employed to ensure that contaminated water is contained and successfully treated on the site. In relation to water supply and usage, and wastewater disposal, the EIS should discuss anticipated flows of water to and from the proposal area. Where dams, weirs or ponds are proposed, the EIS should investigate the effects of predictable climatic extremes (storm events, floods and droughts allowing for climate change) on: the capacity of the water storages (dams, weirs, ponds), the ability of these storages to retain contaminants; the structural integrity of the containing walls; relevant operating regime and the quality of water contained, and flows and quality of water discharged. The design of all water storage facilities should follow the technical guidelines on site water management. Options for mitigation and the effectiveness of mitigation measures should be discussed with particular reference to sediment, acidity, salinity and other emissions of a hazardous or toxic nature to human health, flora or fauna. Groundwater The EIS should include an assessment of the potential environmental impact caused by the project (and its associated project components) to local groundwater resources, including the potential for groundwater induced salinity and contamination from use of pesticides and fertilisers on the golf course and other areas of the resort. The response of the groundwater resource to the progression and final cessation of the proposal should be described. An assessment should be undertaken of the impact of the project on the local ground water regime caused by the altered porosity and permeability of any land disturbance. Any potential for the project to impact on groundwater dependent vegetation and stygofauna should be assessed and described. Avoidance and mitigation measures should be described. Note: Parts of this section have been addressed separately in reports prepared by Douglas Partners, FRC Environmental and Water Technology. Where relevant to development of the water cycle management strategy, reference has been made to the pertinent information contained in these other reports. The Report also addresses relevant requirements of the Guidelines for an Environmental Impact Statement for the Great Keppel Island Tourism and Marina Development, Queensland issued by the Australian Department of Sustainability, Environment, Water, Population and Communities (SEWPaC) in conjunction with the Great Barrier Reef Marine Park Authority (GBRMPA). N-B016 Page 25
28 Water Cycle Management Report Great Keppel Island Resort Revitalisation Plan 2. LEGISLATIVE REQUIREMENTS 2.1 ENVIRONMENTAL PROTECTION ACT 1994 The Environmental Protection Act 1994 (EP Act), which is administered by the Department of Environment and Resource Management (DERM), was established with the purpose to protect Queensland s environment while allowing for development that improves the total quality of life, both now and in the future, in a way that maintains the ecological processes on which life depends (ecologically sustainable development). The EP Act utilises a number of mechanisms to achieve its objectives. These include: creating a general environmental duty, licensing environmentally relevant activities (ERAs); and issuing environmental protection policies General Environmental Duty All persons involved in the GKI Resort Revitalisation Plan, including establishment and operation of proposed water supply, wastewater and stormwater management schemes, are subject to a general environmental duty of care under sections 319 and 320 of the EP Act. Section 319 of the Act, which conveys the general environmental duty, states that a person must not carry out any activity that causes, or is likely to cause, environmental harm unless the person takes all reasonable and practicable measures to prevent or minimise the harm. Furthermore, section 320 of the Act requires than if any person, while carrying out an activity, becomes aware that serious or material environmental harm is caused or threatened by any person s act or omission in carrying out the activity, they must as soon as reasonably practicable after becoming aware of the event, notify their employer or give written notice to the administering authority of the event, its nature and the circumstances in which it happened Environmentally Relevant Activities Environmentally relevant activities are defined in schedule 2 of the Environmental Protection Regulation It is an offence to conduct an ERA without: A current development approval authorising the activity to be undertaken on the premises; and A current registration certificate authorising the person to undertake an ERA on the premises. The following environmentally relevant activities as defined under schedule 2 of the Environmental Protection Regulation 2008, are likely to be associated with the water cycle management aspects of the GKI Resort Revitalisation Plan: ERA 63(2)(c) Sewage treatment operating sewage treatment works, other than no release works, with a total peak design capacity of 1,500 to 4,000EP. As part of the waste management strategy for the GKI Resort Revitalisation Plan as described in the Waste Management Report prepared by Opus International Consultants (2011a) it is proposed that biosolids from the wastewater treatment plant will be stabilised and treated, along with other organic N-B016 Page 26
29 Water Cycle Management Report Great Keppel Island Resort Revitalisation Plan wastes, for use as a soil conditioner on the golf course and landscaped areas on the Island. This activity conforms to the definition of ERA 53 defined under schedule 2 of the Environmental Protection Regulation 2008 as follows: ERA 53 Composting and soil conditioner manufacturing - composting and soil conditioner manufacturing (the relevant activity) consists of manufacturing, from organic material or organic waste, 200t or more of compost or soil conditioners in a year. Prior to commencement of the activity, development approval will be required for the above ERAs under chapter 4 of the Environmental Protection Act The resort operator will also be required to obtain a registration certificate to operate the above ERAs Environmental Protection Policies EPPs hold the status of a regulation under the Environmental Protection Act EPPs set out environmental values that must be protected and provide for specific offences. As subordinate legislation to the EP Act, the EPPs bind all persons. The following EPPs have been declared and are relevant to this Project: Environmental Protection (Water) Policy 2009; Environmental Protection (Noise) Policy 2008; Environmental Protection (Air) Policy 2008; Environmental Protection (Waste Management) Policy 2000; and Environmental Protection (Waste Management) Regulation Consideration shall be given to these policies in developing environmental management plans for water cycle management aspects of the GKI Resort Revitalisation Plan. 2.2 WATER ACT 2000 The purpose of this Act is to advance sustainable management and efficient use of water and other resources by establishing a system for the planning, allocation and use of water, to ensure the delivery of sustainable and secure water supply and demand management in designated regions and to establish a framework for the establishment and operation of water authorities. Under the Act, a person must not take, supply or interfere with water to which the Act applies without a permit or other authorisation under the Act. A person also must not destroy vegetation, excavate or place fill within a watercourse, lake or spring without a permit or other authorisation under the Act. For the purpose of this Act, a watercourse is defined as: (1) A watercourse is a river, creek or other stream, including a stream in the form of an anabranch or a tributary, in which water flows permanently or intermittently, regardless of the frequency of flow events (a) in a natural channel, whether artificially modified or not; or (b) in an artificial channel that has changed the course of the stream. (2) A watercourse includes any of the following located in it (a) in-stream islands; (b) benches; N-B016 Page 27
30 Water Cycle Management Report Great Keppel Island Resort Revitalisation Plan (c) bars. (3) However, a watercourse does not include a drainage feature. Watercourses meeting the above definition that occur within areas to be developed for the GKI Resort Revitalisation Plan include, but may not be limited to, Leeke s Creek and Putney Creek. No taking of water from any surface watercourses requiring approval under the Water Act 2000 is proposed as part of the water cycle management strategy for the GKI Resort Revitalisation Plan. However, the extraction of groundwater from production bores within the Long Beach Aquifer for use during construction will require a water licence for taking water from an aquifer under section 206 of the Act. At this stage, no works involving destroying vegetation, excavating and placing fill are proposed to occur within Leeke s Creek. However, proposed drainage works around the mouth of Putney Creek associated with marina construction are likely to involve removal of vegetation, excavation and possible filling within a watercourse and may therefore require a Riverine Protection Permit under section 266 of the Act. Depending on the final design of these works, development approval for operational works may also be required under section 206 of the Act for interfering with the flow of water. 2.3 WATER SUPPLY (SAFETY & RELIABILITY) ACT 2008 The purpose of this Act is to provide for the safety and reliability of water supply by, amongst other things, establishing a regulatory framework for providing water and sewerage services in the State, including functions and powers of service providers; and providing a regulatory framework for providing recycled water and drinking water quality, primarily for protecting public health. The relevant recycled water provisions of the Water Supply (Safety and Reliability) Act 2008 commenced on 1 July 2008 and are administered by the Department of Environment and Resource Management (DERM). The primary aim of the recycled water provisions is to protect public health and for certain schemes known as critical recycled water schemes, to ensure continuity of operation of the scheme to meet the essential water supply needs of the community or industry. The Act requires that a recycled water provider must have either of the following before supplying recycled water unless they are covered by a transitional period: a recycled water management plan (RWMP) approved by the regulator; or an exemption from preparation of a RWMP granted by the regulator (refer to recycled water management plan exemption guidelines). Transitional periods about recycled water are specified in sections of the Act. Under the Act, a recycled water provider is defined as an entity that: (a) owns infrastructure for (i) the production and supply of recycled water other than coal seam gas water; or, (ii) the production and supply, or the supply only, of recycled water that is coal seam gas water; or (b) another entity, prescribed under a regulation, that owns infrastructure for the supply of recycled water other than coal seam gas water. N-B016 Page 28
31 Water Cycle Management Report Great Keppel Island Resort Revitalisation Plan The Act defines recycled water as: (a) any of the following that are intended to be reused: (i) sewage or effluent sourced from a service provider s sewerage; (ii) wastewater, other than water mentioned in subparagraph (i); or, (b) coal seam gas water that augments a supply of drinking water. Although the resort operator will own infrastructure used for supplying water or sewerage services, the operator of the resort is not considered to comprise a service provider as defined in the Act, on the basis that the service will be used only by the owner of the infrastructure (i.e. GKI Resort Pty Ltd) or the owner s guests or employees (e.g. resort guests). On the basis of the above, recycled water generated by the GKI Resort Revitalisation Plan is not considered to be covered by the Water Supply (Safety & Reliability) Act However, this may change depending on whether infrastructure owned by GKI Resort Pty Ltd is to be used to provide water and sewerage services for other private properties on the Island. 2.4 PUBLIC HEALTH ACT 2005 Pursuant to section 57F of the Public Health Act 2005, a recycled water provider has a general obligation to ensure the recycled water supply is fit for purpose. Although GKI Resort Pty Ltd is not considered to comprise a service provider or recycled water provider under the Water Supply (Safety & Reliability) Act 2008, and is therefore not subject to section 57F of this Act, the resort operator has a general duty of care to its staff and guests to ensure that recycled water generated and reused on site is fit for purpose and does not result in unacceptable risks to public health or the environment. The Public Health Regulation 2005 defines minimum water quality criteria that must be complied with for recycled water to be deemed fit for purpose for a range of recycled water reuse purposes. The water quality criteria specified in the Public Health Regulation 2005 relate specifically to the protection of public health and does not limit the requirement for recycled water quality to be suitable for its intended use in terms of preventing adverse environmental impacts. The Public Health Regulation 2005 does not specify minimum water quality criteria that must be complied with for reuse of recycled water for irrigation of a golf course and possibly other landscaped areas as proposed by the water cycle management strategy outlined in this Report. 2.5 COASTAL PROTECTION & MANAGEMENT ACT 1995 The purpose of this Act is to provide for the protection, conservation, rehabilitation and management of the coast, including its resources and biological diversity, which is to be achieving, amongst other things by preparing coastal management plans and declaring coastal management districts in the coastal zone as areas requiring special development controls and management practices. Works associated with the proposed water cycle management strategy as outlined in this Report, that are likely to require approval under the Coastal Protection and Management Act 1995, include, but may not be limited to: N-B016 Page 29
32 Water Cycle Management Report Great Keppel Island Resort Revitalisation Plan Construction of the mainland water supply connection within tidal waters and a Coastal Management District; Construction of the emergency ocean outfall for recycled water discharge during extreme wet weather events within tidal waters and a Coastal Management District; and Construction of stormwater drainage works within and around the marina, including works associated with the mouth of Putney Creek, which will occur within tidal waters and a Coastal Management District. These works will require development approval for operational works involving tidal works and works within a Coastal Management District. 2.6 FISHERIES ACT 1994 The main purpose of this Act is to provide for the use, conservation and enhancement of the community s fisheries resources and fish habitats in a way that seeks to apply and balance the principles of ecologically sustainable development. This is to be achieved through the management and protection of fish habitats; the management of commercial, recreational and indigenous fishing; the prevention, control and eradication of disease in fish; and the management of aquaculture. Works requiring approval under this Act include operational works in a declared fish habitat area, removal or damage of marine plants, or constructing a waterway barrier. Works associated with the proposed water cycle management strategy as outlined in this Report, that are likely to require approval under the Fisheries Act 1994, include, but may not be limited to: Construction of the mainland water supply connection, which is likely to require development approval for operational works involving the removal of marine plants (including mangroves); Construction of the emergency ocean outfall for recycled water discharge during extreme wet weather events, which is likely to require development approval for operational works involving the removal of marine plants; Construction of stormwater drainage works within and around the marina, including works associated with the mouth of Putney Creek, which is likely to require development approval for operational works involving the removal of marine plants; and Depending on the final location of proposed roads and detention basins, construction of any such infrastructure within waterways identified as supporting fish movement may involve constructing waterway barrier works requiring development approval for operational works. N-B016 Page 30
33 Water Cycle Management Report Great Keppel Island Resort Revitalisation Plan 3. EXISTING ENVIRONMENT 3.1 TOPOGRAPHY The topography of GKI is dominated by two (2) ridgelines aligned in a northwest to southeast direction across the Island. The southern ridgeline has a maximum elevation of approximately 175m AHD, while elevations along the northern ridgeline range between approximately 75m AHD at the north western extent up to 155m AHD in the south eastern extent. These ridgelines extend to the shoreline forming rocky headlands and cliffs. A series of sandy beaches exist between the rocky ridgelines and associated headlands. Coastal sand dunes characterised by a flat to slightly undulating topography exist between Wreck Bay and Butterfish Bay in the north eastern area of the Island as well as in the south western area of the Island between Long Beach, Fisherman s Beach and Putney Beach. A broad valley exists in the central area of the Island between the two (2) major ridgelines. This valley falls in a north westerly direction from an elevation of approximately 65m AHD at the rocky headland along Clam Bay down to sea level at Leeke s Beach. 3.2 GEOLOGY Reference to the Rockhampton 1:100,000 Geological Sheet (DNRW, 2006 in Douglas Partners, 2010) indicates that the underlying geology of GKI is primarily comprised of the Carboniferous aged Shoalwater Formation of the Curtis Island Group, which overlies the early Palaeozoic Wandilla Formation that is quite widespread along the adjacent mainland coastline. The major hills and slopes on GKI are formed of Late Palaeozoic quartzose, arenite and mudstone of the Shoalwater Formation. Geological mapping further indicates that within the three (3) main lower lying areas on the Island a thin layer of Quaternary deposits overlies the Carboniferous sequence. Within the north eastern part of the Island between Wrecks Bay and Butterfish Bay, and the south western part of the Island between Long Beach and Fisherman s Beach, this veneer of Quaternary sediments consists predominantly of coastal sand dunes and sand beach ridges, with foredune sands in the area around Putney Beach and Fisherman s Beach. The central western part of the Island within the drainage basin of Leeke s Creek is mapped as Quaternary aged fine-grained estuarine and alluvial deposits consisting of clay, silt, sandy mud and minor gravel. In addition to these sand units identified on geological mapping, reference to the Report on Preliminary Geotechnical Assessment for Proposed Great Keppel Island Resort, Great Keppel Island prepared by Douglas Partners (December 2010) indicates that an extensive coastal dune sand deposit also extends across the central part of the Island from Leeke s Beach towards Clam Bay, but falling short of extending the full width of the Island due to the presence of a rocky outcrop along the Clam Bay coastline. 3.3 SOILS Reference to the Report on Preliminary Geotechnical Assessment for Proposed Great Keppel Island Resort, Great Keppel Island prepared by Douglas Partners (December 2010) indicates that soils within N-B016 Page 31
34 Water Cycle Management Report Great Keppel Island Resort Revitalisation Plan the Fisherman s Beach Precinct and Clam Bay Precinct, which will contain the majority of water cycle management infrastructure, primarily comprise high permeability sand characterised by a saturated hydraulic conductivity (K sat ) of between 1.5m/day and 3.5m/day. These soils are further described as very loose, fine to medium grained sands, initially dark brown and grey near the surface, grading to light brown, orange-brown and light grey with depth. Some silt and small amounts of organic material comprising small rootlets occur within the topsoil layer, while shell fragments were occasionally encountered at various depths within the profile. According to Douglas Partners (2010), sandy soils within the Fisherman s Beach Precinct and Clam Bay Precinct are characterised by neutral to slightly acidic ph (ph = ). Laboratory analysis determined these soils fall within Emerson Class 6 and are therefore considered to have a Medium potential for erosion. 3.4 SURFACE WATER Great Keppel Island is the largest island in a group of sixteen (16) continental islands called the Keppel Island Group. The Keppel Island Group covers an area of 14.5 km 2 and is located at the southern end of the Great Barrier Reef, approximately 12km offshore of Yeppoon in Central Queensland and more than 200km inshore of the Outer Barrier Reef and the Swain Reef complex (FRC Environmental, 2011). Fifteen (15) of the islands in the Keppel Island Group, excluding Great Keppel Island are designated National Park. The Great Barrier Reef Marine Park surrounds the Keppel Island Group and together they form the Great Barrier Reef World Heritage Area, the world s largest reef and island archipelago. The Keppel Island Group is located directly offshore of the Fitzroy Basin, which is the largest river basin draining into the Great Barrier Reef. The islands lie in a shallow basin north of Keppel Bay, and are surrounded by a patchwork of fringing reefs (GBRMPA, 2007). A range of coastal ecosystems have been identified on and surrounding Great Keppel Island through surveys undertaken by FRC Environmental (2011). Surrounding the Island is a combination of coral reefs, seagrass meadows, soft sediment communities, while on the Island exist rocky shore communities, sandy beaches providing possible turtle nesting sites, and mangrove forests fringing Leeke s Creek and Putney Creek. Fourteen (14) distinct catchments for surface drainage have been identified on GKI. The location of the various drainage catchments identified on GKI is shown on the Catchment Plan contained in Appendix B Catchment Plan. The development areas proposed under the GKI Resort Revitalisation Plan fall within the following catchments: Putney Creek (discharging at Putney Beach); Leeke s Creek (discharging at Leeke s Beach); Clam Bay; Long Beach; and Fisherman s Beach. N-B016 Page 32
35 Water Cycle Management Report Great Keppel Island Resort Revitalisation Plan Waterways on the Island are largely ephemeral, flowing only during and shortly after storm events. In the lower reaches, gradients in the main waterways are relatively low and ponding can occur for periods after rain. There are no gauging facilities on any of the waterways and no historical flow records are available. A tidal wetland known as Leeke s Wetland is located behind Leeke s Beach. A wetland area also exists along Putney Creek near the mouth. Due to a combination of local wave action, and the relatively low and intermittent flows along Putney Creek, the Creek mouth is regularly blocked by the formation of a sandbar. However, during large storm events, the sandbar is flushed out allowing tidal flows into the lower reaches of the Creek. Eventually, wave action reconstructs the sandbar and the lower reaches revert to a brackish wetland until the next major storm event. Water quality surveys were undertaken at a number of sites on and surrounding GKI (as well as two mainland sites) by FRC Environmental (2011). Physico-chemical measurements were recorded for a total of thirty-one (31) sites, including: Three (3) sites within estuarine areas of Leeke s Creek, plus two (2) near-shore sites adjacent to the Leeke s Creek mouth; Eight (8) near-shore sites around Putney Point and Putney Beach; and Eighteen (18) off-shore sites within marine waters surrounding the Island. More detailed water quality sampling was also undertaken by FRC Environmental (2011) for twelve (12) sites around the Island including: Putney Creek; Fisherman s Beach; Leeke s Creek Mouth; Leeke s Beach; Marina (3 sites); The Spit; Clam Bay; Long Beach; Wreck Beach; and Passage Rocks. Water sampling was undertaken during the following seasons: Pre-wet 15 to 19 November 2010; Wet 17 to 21 January 2011; and Post-west 30 March to 2 April 2011, and 1 to 2 May A detailed description of existing water quality is contained in FRC Environmental (2011). However, a summary of key findings relevant to this Water Cycle Management Report is provided below: ph - slightly (typically within 0.2 ph units) below the relevant Queensland Water Quality Guidelines (QWQG) (DERM, 2009) trigger value range at several sites during the wet and postwet surveys, and near Fisherman s Beach (site WQ08 and WQ19) during the pre-wet survey; N-B016 Page 33
36 Water Cycle Management Report Great Keppel Island Resort Revitalisation Plan Dissolved oxygen - levels near the surface were often above the relevant QWQG trigger value range whereas levels at depth were often below the relevant range. Leeke s Creek tended to have lower dissolved oxygen levels than other sites; Turbidity - several sites exceeded the relevant QWQG trigger value during the wet and postwet surveys. Turbidity tended to be highest in Leeke s Creek but was also relatively high near Passage Rocks and Putney Point; Total suspended solids - exceeded the relevant QWQG trigger value at Leeke s Creek mouth in the post-wet survey and at Putney Creek in the pre-wet season survey. Concentrations were generally highest in the post-wet survey; Total nitrogen - exceeded the relevant QWQG trigger value at Putney Creek in the pre and post-wet surveys, and was particularly high in the pre-wet survey. In the pre-wet survey, sites at Fisherman s Beach, Leeke s Creek mouth, Marina 4 and The Spit also exceeded the relevant QWQG trigger value. In the post-wet survey, sites at Clam Bay, Marina 1 & 2, Passage Rocks and Wreck Beach also exceeded the relevant trigger value. In the wet survey, the Long Beach site exceeded the relevant trigger value; Total phosphorus - exceeded the relevant QWQG relevant trigger value at Putney Creek in the pre- and post-wet surveys, and was particularly high in the pre-wet survey. The concentration at each site in each survey exceeded the relevant QWQG trigger value, and concentrations were generally higher in the wet and post-wet survey than the pre-wet survey; Chlorophyll-a (an index of phytoplankton abundance) - offshore of The Spit was below the QWQG upper trigger value (2µg/L) throughout the recording period despite the concentration of nitrogen in nearby waters exceeding the QWQG upper trigger value prior to the survey, and the concentration of phosphorus exceeding the QWQG upper trigger value before and after the survey. The concentration of chlorophyll-a ranged from 0.3µg/L at 9pm on 22 February to 0.7µg/L at 7pm on 8 March and followed a cyclic pattern. The cyclic pattern reflects small phytoplankton blooms, which are related to environmental factors such as water temperature and nutrient availability; Heavy metals o o o o Total arsenic - below the laboratory detection limit at all sites during all surveys, except in Putney Creek during the pre-wet survey; Total copper - exceeded the relevant trigger value under the Australian and New Zealand Water Quality Guidelines for Fresh and Marine Waters (ANZECC Guidelines) (ANZECC & ARMCANZ, 2000) in Putney Creek and at the mainland sites in the postwet survey; Total zinc - exceeded the relevant trigger value under the ANZECC Guidelines at most sites in the post-wet survey, and was particularly high near The Spit and to a lesser extent in Putney Creek and at Kinka Beach; and Other metals and metalloids (cadmium, chromium, nickel, lead and mercury), total petroleum hydrocarbons, aromatic hydrocarbons and organochlorine pesticides were N-B016 Page 34
37 Water Cycle Management Report Great Keppel Island Resort Revitalisation Plan 3.5 GROUNDWATER below laboratory detection limits and / or relevant trigger values at all sites in all surveys. A series of groundwater studies have been undertaken on GKI by Douglas Partners (Douglas Partners, 2006; Douglas Partners, 2007; and Douglas Partners, 2011). These studies have identified shallow groundwater resources within the various sand dune deposits on the Island which have been described as: North East Aquifer associated with the dune sand deposits between Butterfish Bay and Wreck Beach; Long Beach Aquifer associated with the south eastern part of the coastal dune sand deposit extending from Long Beach to Fisherman s Beach / Putney Beach; Resort Aquifer associated with the north western part of the coastal dune sand deposit extending from Long Beach to Fisherman s Beach / Putney Beach; and Central Dune Aquifer associated with the north western part of alluvial sand deposit extending from Leeke s Beach almost through to Clam Bay. The Central Dune Aquifer was only recently identified through the investigations by Douglas Partners (2011), as this area was not previously considered likely to contain shallow groundwater resources based on geological mapping of the area identifying the presence of rock associated with the Shoalwater Formation rather than any extensive sand deposits. Assuming uniform and continuous extraction rates, the long term sustainable yields for these aquifers were estimated by Douglas Partners (2011) to be: North East Aquifer 270kL/day - extracted from 2 x 100kL/day and 1 x 70kL/day production bores located in the central part of the aquifer; Long Beach Aquifer 100kL/day - extracted from 2 x 50kL/day production bores; and Central Dune Aquifer 90kL/day extracted from 1 x 70kL/day and 1 x 20kL/day production bores. No assessment of sustainable yield from the Resort Aquifer was undertaken as this aquifer was not considered suitable for extraction due to high likelihood of further saltwater intrusion. A general description of each of the shallow aquifers identified on GKI by Douglas Partners (2011) is provided in Table 3.1. TABLE 3.1: Summary of Shallow Groundwater Aquifer Properties Attribute North East Aquifer Long Beach Aquifer Resort Aquifer Geology Well-sorted orangebrown, Well-sorted light Well-sorted light fine to medium orange-brown, fine orange-brown, fine grained sand over to medium grained to medium grained light grey-yellow, fine sand over light greyyellow, sand over light grey- to medium grained fine to yellow, fine to sand. medium grained medium grained Central Dune Aquifer Poorly-sorted fine to medium grained sand within some silty sand. N-B016 Page 35
38 Water Cycle Management Report Great Keppel Island Resort Revitalisation Plan Attribute North East Aquifer Long Beach Aquifer sand. Thickness 7.5m 21.5m 6m 17m 5m 18m (saturated) 5m 11m (saturated) Resort Aquifer sand. 6m 12m 2m 5m (saturated) Central Dune Aquifer 2.5m 17m 3m 10m (saturated) 270 kl/day 100 kl/day Not assessed. 90 L/day Aquifer Type Unconfined Unconfined Unconfined Unconfined Recharge Mainly rainfall Mainly rainfall Mainly rainfall Mainly infiltration of infiltration, some infiltration, some infiltration, some direct rainfall, some runoff from slopes to runoff from slopes to runoff from slopes to runoff from slopes to north and south northeast and northeast and northeast and (approx southwest (approx. southwest (approx. southwest, and ML/year) ML/year) ML/year). seepage from sands above bedrock along Clam Bay headland (approx ML/year). Direction of Flow Towards both Southeast towards West towards North west towards Butterfish Bay and Long Beach. Putney Beach and Leeke s Beach. Wreck Beach from a Fisherman s Beach. central mound. Hydraulic 21 m/day 20 m/day to m/day to m/day to 8 Conductivity m/day m/day m/day Long Term Sustainable Yield 1 Notes: 1. Assuming uniform & continuous extraction rates. No assessment of sustainable yield from the Resort Aquifer was undertaken as this aquifer was not considered suitable for extraction due to high likelihood of further saltwater intrusion. According to Douglas Partners (2011), nine (9) registered groundwater bores are listed on DERM s groundwater database on GKI. These bores are located within the former resort area pumping from the Resort Aquifer and near Long Beach pumping from the Long Beach Aquifer. Standing groundwater levels in these bores range between 1m and 9m below ground surface level. Groundwater quality monitoring undertaken by Douglas Partners (2011) describes groundwater quality within each of the shallow aquifers as: North East Aquifer: o fresh water, low dissolved salt content, slightly acidic within the central area to slightly alkaline near the beaches; o relatively high total hardness; o heavy metal levels below drinking water guidelines; and o considered suitable for potable / drinking water purposes. Long Beach Aquifer: o generally fresh water, with low dissolved salt content, slightly acidic; o heavy metal levels below drinking water guideline; o evidence of saltwater intrusion as indicated by high electrical conductivity and high alkalinity was recorded in the Long Beach Pump House Bore in 2006 & 2007, but more recent monitoring shows this bore appears to be recovering with a more acidic ph and much lower electrical conductivity in 2010; and N-B016 Page 36
39 Water Cycle Management Report Great Keppel Island Resort Revitalisation Plan o considered suitable for potable / drinking water purposes. Resort Aquifer: o generally fresh water, with low dissolved salt content and slightly acidic in the upper, central parts of the aquifer; o evidence of saltwater intrusion as indicated by high electrical conductivity and high alkalinity was recorded in monitoring bores near Fisherman s Beach in 2006 & 2007, but more recent monitoring for one of the bores in this area appears to show the aquifer is recovering with a more acidic ph and much lower electrical conductivity in 2010; and o no further chemical, physical or biological analysis undertaken as this aquifer was not considered suitable for extraction due to high likelihood of further saltwater intrusion. Central Dune Aquifer: o variable quality; o generally fresh water although slightly brackish in areas of silty sand and possibly more saline beneath the tidal wetland behind Leeke s Beach; o acidity slightly below drinking water guidelines; o chloride and hardness exceeded aesthetic levels of drinking water guidelines; o heavy metal levels generally within drinking water guidelines; and o suitability for potable / drinking water purposes dependent on extraction location. N-B016 Page 37
40 Water Cycle Management Report Great Keppel Island Resort Revitalisation Plan 4. WATER QUALITY OBJECTIVES Water quality objectives represent the quality of water required to sustain all the environmental values for a waterway and are used in waterway management. Environmental values are the specific values of a waterway determined by physical, biological, social, economic and historical features and these values are protected under the Environmental Protection (Water) Policy SURFACE WATER FRC Environmental (2011) has identified the following environmental values for surface waters within and surrounding the study area: Ecosystem protection (slightly to moderately disturbed) the intrinsic biological value of aquatic ecosystems that are affected adversely, to a relatively small but measurable degree, by human activity; Aquaculture and human consumption of aquatic foods; Primary recreation health of humans undertaking activities where there is a high probability of water being swallowed (e.g. swimming); Secondary recreation health of humans undertaking activities where there is a low probability of water being swallowed (e.g. boating and fishing); Visual recreation amenity of waterways for recreation that does not involve direct contact with the water (e.g. picnicking next to the waterway); and Cultural heritage indigenous and non-indigenous cultural heritage. Specific water quality objectives for coastal waters of the Fitzroy Catchment are discussed in the Draft Establishing Environmental Values, Water Quality Guideline and Water Quality Objectives for Fitzroy Basin Waters (DERM, 2010). These objectives have been derived from the relevant local, regional and national water quality guidelines, including: Water Quality Guidelines for the Great Barrier Reef Marine Park (GBRMPA, 2009); Queensland Water Quality Guidelines (QWQG) (DERM, 2009) - for coastal / inshore waters; and Australian and New Zealand Water Quality Guidelines for Fresh and Marine Waters (ANZECC & ARMCANZ, 2000) guidelines for Tropical Australia (Table 1.1, Table 1.2 and Table 1.3). Reference has therefore been made to each of these guidelines to determine appropriate water quality objectives for waters potentially impacted by water cycle management aspects of the GKI Resort Revitalisation Plan. Specifically, the following guidelines were considered most appropriate: Water quality objectives for estuarine sites in Leeke s Creek and Putney Creek have been based on: o o Trigger values for mid-estuarine waters of the Central Coast Queensland Region (slightly to moderately disturbed waters) from QWQG (DERM, 2009); and 99% protection trigger values from ANZECC & ARMCANZ (2000) as these values were most similar to the GBRMPA trigger values. N-B016 Page 38
41 Water Cycle Management Report Great Keppel Island Resort Revitalisation Plan Water quality objectives for marine sites adjacent to Great Keppel Island have been based on: o o Trigger values for open coastal waters of the Central Coast Queensland Region (slightly to moderately disturbed waters) from QWQG (DERM, 2009); and 99% protection trigger values from the ANZECC & ARMCANZ (2000) as these values were most similar to the GBRMPA trigger values. Based on these guidelines, the following water quality objectives have been developed for surface water quality: TABLE 4.1: Proposed Water Quality Objectives for Surface Waters Water Quality Units Parameter Marine Waters Leeke s Creek & Putney Creek Physico-chemical Temperature o C ph ph units Electrical Conductivity µs/cm Dissolved Oxygen % saturation Turbidity NTU Total Suspended Solids mg/l Total Nitrogen µg/l Total Phosphorous µg/l Chlorophyll-a µg/l 2 1 NA 2 Heavy Metals Arsenic µg/l Cadmium µg/l (5.5 4 ) (5.5 4 ) Chromium (Cr III) µg/l ( ) ( ) Chromium (Cr VI) µg/l (4.4 4 ) (4.4 4 ) Copper µg/l (1.3 4 ) (1.3 4 ) Lead µg/l (4.4 4 ) (4.4 4 ) Mercury µg/l (0.4 4 ) (0.4 4 ) Nickel µg/l 7 3 (70 4 ) 7 3 (70 4 ) Zinc µg/l 7 3 (15 4 ) 7 3 (15 4 ) Petroleum Hydrocarbons C6-C9 µg/l C10-C14 µg/l C15-C28 µg/l C29-C36 µg/l N-B016 Page 39
42 Water Quality Parameter Aromatic Hydrocarbons Units Marine Waters Water Cycle Management Report Great Keppel Island Resort Revitalisation Plan Leeke s Creek & Putney Creek Benzene µg/l (700 4 ) (700 4 ) Toluene µg/l Ethylbenzene µg/l m+p-xylene µg/l o-xylene µg/l Organochlorine Pesticides µg/l Aldrin µg/l alpha-bhc µg/l beta-bhc µg/l gamma-bhc µg/l delta-bhc µg/l cis-chlordane µg/l trans-chlordane µg/l p,p-ddd µg/l p,p-dde µg/l p,p-ddt µg/l Dieldrin µg/l alpha-endosulfan µg/l beta-endosulfan µg/l Endosulfan µg/l 5 3 ( ) and ( ) and 5 5 Endrin µg/l 4 3 (8 4 ) 4 3 (8 4 ) Endrin aldehyde µg/l Endrin ketone µg/l Heptachlor µg/l Heptachlor epoxide µg/l Hexachlorobenzene µg/l Methoxychlorobenzene µg/l Mirex µg/l Notes: 1. Queensland Water Quality Guidelines (DERM, 2009) for Open Coastal Waters (up to 20 km from the seaward edge of the enclosed coastal areas of the Fitzroy region) of the Central Coast Queensland Region (slightly to moderately disturbed waters). 2. Queensland Water Quality Guidelines (DERM, 2009) for Mid-Estuarine Waters of the Central Coast Queensland Region (in slightly to moderately disturbed waters). 3. Australian and New Zealand Water Quality Guidelines (ANZECC & ARMCANZ, 2000) for slightly to moderately disturbed waters (99% ecosystem protection). N-B016 Page 40
43 Water Cycle Management Report Great Keppel Island Resort Revitalisation Plan 4. Australian and New Zealand Water Quality Guidelines (ANZECC & ARMCANZ, 2000) for slightly to moderately disturbed waters (95% ecosystem protection). 5. Water Quality Guidelines for the Great Barrier Reef Marine Park (GBRMPA, 2009) Although there are no published water quality objectives to protect environmental values such as visual recreation and cultural heritage, the following guidelines typically apply: Visual recreation water should be free of: floating debris; oil and grease; substances that produce undesirable colour, odour, taste or foaming; and undesirable aquatic life such as algae or dense growth of attached plants or insects; and Cultural heritage protect or restore indigenous and non-indigenous cultural heritage, consistent with relevant policies and plans. 4.2 GROUNDWATER Current uses and environmental values of each of the shallow aquifers as described by Douglas Partners (2011) include: North East Aquifer: o o o No existing or proposed groundwater extraction bores known to be utilising this aquifer; Possible groundwater dependent ecosystems, including deep-rooted vegetation and marine ecosystems at Butterfish Bay and Wreck Bay potentially dependent on fresh water discharges from this aquifer; and Water quality suitable for raw drinking water (for human consumption), irrigation of crops, stock watering and groundwater dependent ecosystems. Long Beach Aquifer: o o o Although a number of groundwater extraction bores are installed within this aquifer, none of these bores are currently being utilised; Possible groundwater dependent ecosystems, including deep-rooted vegetation and marine ecosystems at Long Beach potentially dependent on fresh water discharges from this aquifer; and Water quality suitable for raw drinking water (for human consumption), irrigation of crops, stock watering and groundwater dependent ecosystems. Resort Aquifer: o o A number of groundwater extraction bores are installed within this aquifer but these are not currently used by GKI Resort Pty Ltd and are not known to be used currently by any other landowners on the Island; and Water quality suitable for raw drinking water (for human consumption), irrigation of crops and stock watering. Central Dune Aquifer: o No existing or proposed groundwater extraction bores known to be utilising this aquifer; N-B016 Page 41
44 Water Cycle Management Report Great Keppel Island Resort Revitalisation Plan o o Possible groundwater dependent ecosystems, including deep-rooted vegetation and marine ecosystems within the tidal wetlands and at Leeke s Beach potentially dependent on fresh water discharges from this aquifer; and Water quality suitable for raw drinking water (for human consumption), irrigation of crops, stock watering and groundwater dependent ecosystems. On the basis of the above, the following water quality objectives have been established for groundwater resources within the study area: Long Beach Aquifer: o o o A number of existing groundwater bores access this aquifer; These bores may potentially be used for supply of construction water for the GKI Resort Revitalisation Plan; and As such, water quality objectives for this aquifer are based on the Australian Drinking Water Guidelines (ADWG) (NHMRC, 2004). Resort Aquifer: o o o A number of existing groundwater bores access this aquifer; It is understood that these bores are not currently used by any local residents or businesses on the Island but they have historically been used for supply of drinking water to the former GKI resort and possibly Island residents; and As such, water quality objectives for this aquifer are conservatively based on the Australian Drinking Water Guidelines (ADWG) (NHMRC, 2004). Central Dune Aquifer: o o No groundwater extraction or use currently occurs or is proposed to occur from this aquifer; As such, water quality objectives for the purpose of assessing the proposed water cycle management scheme have been based on those established for the point of discharge or interaction between groundwater and surface waters, which comprises Leeke s Creek. As described above, WQOs for Leeke s Creek have been based on: Trigger values for mid-estuarine waters of the Central Coast Queensland Region (slightly to moderately disturbed waters) from QWQG (DERM, 2009); and 99% protection trigger values from ANZECC & ARMCANZ (2000) as these values were most similar to the GBRMPA trigger values. No groundwater extraction, storage or irrigation of recycled water, storage or handling of hazardous substances will occur within the catchment of the North East Aquifer. As such, no water quality objectives have been set for this aquifer. N-B016 Page 42
45 Water Cycle Management Report Great Keppel Island Resort Revitalisation Plan 4.3 ANALYSIS To assess potential impacts of the proposed water cycle management strategy on receiving water quality and demonstrate compliance with water quality objectives, a range of modelling has been undertaken using software approved by DERM, including: MEDLI Model for Effluent Disposal using Land Irrigation (Version 1.3); and MUSIC Model of Urban Stormwater Improvement Conceptualisation (Version 4). The results of this modelling are discussed in sections 10 and 11 of this Report, respectively. In addition to this, modelling of potential water quality impacts on the Central Dune Aquifer associated with irrigation of recycled water on the golf course has been undertaken by Douglas Partners using MODFLOW, which comprises a numerical, three-dimensional groundwater flow model developed by the United States Geological Survey (McDonald & Harbaugh, 1988 in Douglas Partners, 2011). Water Technology (2011) also describes the outcomes of dispersion modelling of possible emergency discharge of recycled water via ocean outfall. N-B016 Page 43
46 Water Cycle Management Report Great Keppel Island Resort Revitalisation Plan 5. EXISTING INFRASTRUCTURE 5.1 WATER SUPPLY Overview Prior to 2004, the former GKI resort relied exclusively on groundwater for its water supply needs. A series of groundwater bores have been commissioned and decommissioned throughout the resort complex since its inception for potable water supply and landscape irrigation. At present, the resort s groundwater bores have all been decommissioned with the exception of the back-up bore water pump located near Long Beach. Investigations conducted during the 1990s identified a range of issues with the Island s groundwater supply, including reduced water quality, mainly increased salinity, and extensive leaking of the reticulation system. From late 2004 until the closure of the former GKI resort in 2008, potable water was supplied by a reverse osmosis (RO) desalination plant leased and operated by a third party. The RO plant had a maximum daily capacity to produce 300kL of potable water per day. Two (2) seawater pumps provided raw water for the RO plant from intake pipes located off Fisherman s Beach. The RO permeate was then chlorinated and pumped via a rising main to a tank compound for storage. Reject brine, up to 490 kl per day from the RO process, was returned to the ocean via a pipeline discharging offshore from Putney Beach. In case of a malfunction of the RO plant or excessive demand backup water supply was provided by groundwater bores located adjacent to Long Beach. Potable water storage was provided by five (5) ground level tanks located within a compound on a hill above the Hillside Villas on the southwest side of the airstrip. The tank compound contains three (3), 27.5kL polypropylene tanks and two (2), 150kL pvc-lined panel tanks giving a total potable water storage volume of 382.5kL. From the tank compound, potable water was reticulated to the resort under gravity, with the exception of the Hillside Villas, which required a booster pump due to the higher elevations. Private properties surrounding the former GKI resort have also historically extracted groundwater from the same aquifer as the former resort, but also used, to a lesser degree, rainwater tanks. Most of these surrounding properties now rely almost exclusively on rainwater tanks. An indicative plan showing the location of water supply infrastructure servicing the former GKI resort is provided in Appendix C Existing Water Supply & Wastewater Infrastructure Historical Water Demands To establish historical water demands for the former GKI resort, reference has been made to data contained in the Great Keppel Island Water & Wastewater Infrastructure Audit Report dated 13 September 2007 and prepared by Sustainable Solutions International Pty Ltd (SSI). According to this report, the assumption was made based upon advice from resort management at the time that potable water was only used within the resort and was not used for any form of irrigation. N-B016 Page 44
47 Water Cycle Management Report Great Keppel Island Resort Revitalisation Plan SSI (2007) reported the following conclusions for the period between December 2004 and May 2007: Average water consumption by the resort was approximately 180kL/day; Average per capita water consumption was approximately 1,059L/person/day; Expected water consumption for the resort, based upon an assessment of the efficiency of existing fixtures and fittings and water demands compared to other similar resorts, was approximately 180 to 300 L/person/day; No direct correlation was established between water produced and guest population due to the wide variability of each of the data sets; and The water supply system was known to have significant leaks and water was frequently used to washdown hard surfaces around the resort. SSI (2007) further reports that the wastewater treatment plant servicing the former GKI resort, has a capacity to treat up to 248.5kL of effluent per day, based on a maximum design population of 710 persons per day at 350L/person/day. Peak water demand and effluent flows were recorded in January 2006 with 7,342kL of water produced by the desalination plant and 4,689kL of effluent treated at the wastewater treatment plant, which was related to approximately 9,200 person nights. During January 2006, there was a difference of 2,653kL (7,342kL 4,689kL) between water produced by the desalination plant and effluent treated by the wastewater treatment plant. This represents a 36% deficit between the volume of desalinated water produced and the volume of effluent treated. During 2006, SSI (2007) identified a 37% average annual deficit between the volume of desalinated water produced and the volume of effluent treated, with SSI (2007) attributing the losses to unidentified leaks in the reticulation system. Figure 5.1 provides a comparison of the total volume of desalinated water produced by the RO plant and the total volume of effluent treated at the wastewater treatment plant on the Island during 2006 along with an indication of approximate occupancy at the resort over this period as measured by the number of guests plus 100 staff. It should be noted that the volume of desalinated water produced during June 2006 was omitted from presentation of this data due to a malfunction of the water meter during that period. Figure 5.2 provides a comparison of the volume of desalinated water produced per capita and effluent treated per capita on a monthly basis derived from data for Although a direct relationship between the population, and water and sewage demands would generally be observed, no such correlation is evident in this instance. Rather, per capita water, and to a lesser degree sewage demands, are shown to vary widely over the year. Average annual per capita rates are shown on Figure 5.2 for comparison. To account for the lack of data relating to water produced in June, an average between May and July was assumed to produce the 1,069L/person/day, which is close to the 1,059L/person/day indicated by SSI (2007). Figure 5.2 also indicates that the volume of desalinated water produced per capita and effluent treated per capita was highest in May 2006, which corresponds to the lowest monthly population for the year. N-B016 Page 45
48 Water Cycle Management Report Great Keppel Island Resort Revitalisation Plan Desal/Treated Water (kl/month) Population (#) Monthly Water Produced, Effluent Treated & Guests plus Staff Data for /1/06 31/3/06 30/5/06 29/7/06 27/9/06 26/11/06 Desal Water Produced Treated Effluent Guest Staff FIGURE 5.1: Monthly Water Produced, Effluent Treated & Guests plus Staff Data for Historical Monthly Water and Wastewater Demands for 2006 Data 2, ,668.3 Average Annual Per Capita Water 1,800.0 Overnight Stays (#) , , , , Per Capita Consumption (L/person/day) 1000 Average Annual Per Capita Effluent Treated: 607 L/person/day Jan Apr May Jul Sep Nov Overnight Stays: Guest + Staff Per Capita Effluent Treated Per Capita Water Use FIGURE 5.2 : Historical Per Capita Water and Wastewater Demands for 2006 based on Monthly Data In order to better understand the relationship between water produced, effluent treated and population, the population figures were averaged out to 5,600 persons per month (67,200 person per year divided N-B016 Page 46
. Figure 5.3 shows that a peak water consumption rate of 1,311L/person/day occurred in January, which is 1.")
49 Water Cycle Management Report Great Keppel Island Resort Revitalisation Plan evenly over 12 months) and per capita consumption figures for 5,600 persons were calculated against the total volume of water produced and effluent treated (refer to Figure 5.3). Figure 5.3 shows that a peak water consumption rate of 1,311L/person/day occurred in January, which is 1.23 times the average per capita water consumption rate estimated to be 1,069L/person/day. As such, peak monthly water demand for the resort could generally be expected to be 1.23 times average annual demand. This compares with Table 5.4 Indicative Ranges of Overall Peaking Factors contained in Chapter 5 - Demand Flow and Projection of DERM s Planning Guidelines for Water Supply and Sewerage, which indicates a peak day factor of 1.5 to 1.7 for schemes with < 5,000 equivalent persons. The 1.23 peaking factor estimated is below this guideline, which may be attributable to the high base flow of unallocated water lost in the reticulation and the limited ability to vary water production from the RO process during reduced demand periods, which may have resulted in excess water being diverted to irrigation or overfilling the tank compound. Per Capita Water/Effluent Demand (L/person/day) 1, , , , , Historical Per Capita Water and Wastewater Demands for 2006 Data 1, , Average Annual Per Capita Effluent Treated: 607 L/person/day Average Annual Per Capita Water Demand: 1069L/person/day , , , , Average Monthly Population: 5,600 persons (Annual for 2006) Average Daily Population: persons (Annual for 2006) 31-Jan May Jul Oct-06 1, Per Capita Effluent Treated Per Capita Water Use FIGURE 5.3: Historical Per Capita Water and Wastewater Demands for 2006 based on Average Annual Data Figure 5.3 also shows that a peak wastewater generation rate of 837L/person/day occurred in January, which is 1.38 times the average per capita rate of wastewater generation of 607L/person/day. As such, peak monthly wastewater generation for the resort could generally be expected to be 1.38 times average annual production. If the assumption is made that the difference between water produced and effluent treated is due entirely to reticulation losses, then a maximum of 57% (607 / 1,069 x 100%) of water produced entered N-B016 Page 47
50 Water Cycle Management Report Great Keppel Island Resort Revitalisation Plan the wastewater system based on 2006 data. This figure could be lower if groundwater infiltration is considered to be entering the sewer reticulation system. Based upon these findings, it can be reasonably assumed that after reticulation losses, which are assumed to account for up to 43% of total water produced, guests and staff have historically consumed between 450 and 750L/person/day. 5.2 WASTEWATER TREATMENT & DISPOSAL Overview From late 2004 until closure of the former GKI resort in , wastewater from the resort was collected by gravity reticulation and pumped to a central wastewater treatment facility located on Lot 46 on LN2763, which is situated along the access road at the western end of the runway. According to SSI (2007), the wastewater treatment plant had the following operational design capabilities: Maximum Population: = 710 persons Per capita Flow Rate: = 350 L/person/day Maximum Daily Flow Rate: = 248 kl/day (based on 710 persons x 350 L/EP/day) BOD Load: = 137 kg/day (based on 710 persons x 193 g/ep/day) Total Suspended Solids Load: = 99.4 kg/day (based on 710 persons x 140g/EP/day) Air Requirement: = 250kg/day The treatment process for the existing wastewater treatment plant consisted of the following: Inflows of raw effluent passed through a static screen where gross solids were collected and transferred for storage in an adjacent bunded area; Screened liquid was then transferred to an old oxidation ditch that served as a balancing tank and was utilised for ph correction; Wastewater was then pumped to two (2) parallel treatment trains consisting of aeration, clarification and sludge aging: o o o o The nitrification / denitrification process was conducted in the aeration phase; Wastewater was then transferred to the two (2) clarifiers; Alum dosing was conducted in the clarifiers to precipitate phosphorus; and The settled sludge in the clarifiers was transferred to a sludge stabilisation tank. N-B016 Page 48
51 Water Cycle Management Report Great Keppel Island Resort Revitalisation Plan Clarified wastewater was then pumped to a Dyna sand filter; After being filtered, wastewater was then dosed with chlorine and stored in a 250kL treated effluent holding tank; and Backwash from the sand filter was returned to the balance tank for retreatment. Treated effluent within the 250kL holding tank was then metered and pumped to the golf course for irrigation with a portion being pumped to a 50kL holding tank above the Hillside Villas for irrigation of landscaped areas Environmental Licence The existing wastewater treatment plant that serviced the former GKI resort was licensed under the Environmental Protection Act 1994 for ERA 15(b) Sewage treatment operating a standard sewage treatment works having a peak design capacity to treat sewage of 100 or more equivalent persons but less than 1,500 equivalent persons (refer to Appendix D Existing Environmental Licence (No. CR0061). Licence No. CR0061 was granted to Great Keppel Island Resort Pty Limited by the former Environmental Protection Agency on 13 May 1998 and subsequently amended on 15 July 1998, shortly after the Environmental Protection Regulation 1998, which required such licences to be obtained, came into effect. Under the conditions of Licence No. CR0061, treated effluent discharged from the wastewater treatment plant servicing the former GKI resort was primarily required to be irrigated to land including the golf course and garden areas around the villas. A minimum land application area of 4.8 hectares was required to be provided for irrigation of treated effluent. Treated effluent used for irrigation of the golf course and gardens was required to comply with the effluent release limits in Table 5.1 below: TABLE 5.1: Existing Licence Release Limits for Irrigation Quality Characteristics Units Release Limit Limit Type 5-day Biochemical Oxygen Demand mg/l 20 Maximum Suspended Solids mg/l 30 Maximum ph ph Range Faecal Coliforms cfu/100ml 10 Maximum During periods when weather or soil conditions preclude the application of treated effluent to land licence conditions authorised the discharge of treated effluent to the ocean via an outfall pipeline. The ocean outfall pipeline extended into the ocean from between the northern end of Putney Beach and Half Tide Rocks. On a dry weather day, the licence conditions allowed for up to 250 cubic metres of treated effluent to be discharged while on a wet weather day, a maximum of 500 cubic metres was permitted to be discharged. Under the conditions contained in Schedule C of Environmental Licence No. CR001, treated effluent discharged from the ocean outfall was required to comply with the effluent quality release limits in Table 5.2 below: TABLE 5.2: Existing Licence Release Limits for Ocean Outfall N-B016 Page 49
52 Water Cycle Management Report Great Keppel Island Resort Revitalisation Plan Quality Characteristics Units Release Limit Limit Type 5-day Biochemical Oxygen Demand mg/l 20 Maximum 5-day Biochemical Oxygen Demand mg/l 5 90th Percentile Suspended Solids mg/l 30 Maximum Suspended Solids mg/l 5 90th Percentile ph ph Range Dissolved Oxygen mg/l 2 Minimum Ammonia Nitrogen mg/l 1 Maximum Total Phosphorus as P mg/l 7 Maximum Total Phosphorus as P mg/l 4 90th Percentile Free Residual Chlorine mg/l Range According to the previous resort operators, the ocean outfall was not often used with the preference being to maximise use of treated effluent for irrigation of the golf course and resort landscaping Historical Wastewater Generation As discussed in section above, an assessment of historical wastewater generation for the former GKI resort has been undertaken based on data contained in the Great Keppel Island Water & Wastewater Infrastructure Audit Report dated 13 September 2007 and prepared by Sustainable Solutions International Pty Ltd (SSI). According to SSI (2007), the wastewater treatment plant servicing the former GKI resort, has a capacity to treat up to kl of effluent per day, based on a maximum design population of 710 persons per day at 350 L/person/day. Peak wastewater generation was recorded in January 2006 with 4,689 kl of effluent treated at the wastewater treatment plant during the month. An average annual per capita wastewater generation rate of 607 L/person/day was estimated for the former resort based on available data from A peak wastewater generation rate of 837L/person per day was estimated based on available data from January The peak wastewater generation rate was determined to be 1.38 times the average per capita rate of wastewater generation of 607L/person/day. As such, peak monthly wastewater generation for the resort could generally be expected to be 1.38 times average annual production. 5.3 STORMWATER DRAINAGE Existing stormwater drainage within the existing resort area generally consists of the following: Stormwater runoff from the Fisherman s Beach area generally, including the existing resort and much of the airstrip, drains from the beachfront dune through the existing resort area to a detention basin located on the western side of the existing airstrip. Refer to Photo 5.1 below. Most of the detained water infiltrates into the sandy soil with overflow only expected to occur during very high rainfall events. Such overflow then drains to to Fisherman s Beach via the natural drain in Photo 5.2 below; and, A small area to the southern end of Fisherman s Beach drains directly to the beach via a small watercourse. Some scouring is evident in parts of the watercourse above the beach. However, N-B016 Page 50

. Photo 5.")
53 Water Cycle Management Report Great Keppel Island Resort Revitalisation Plan the beach sand is not eroded, indicating that the flow is not frequent and that the sand builds back up onto the beach area after storm flows. Refer to Photos 5.3 and 5.4 below. Photo 5.1: Resort Detention Basin (located to the western side of the existing airstrip). Photo 5.2: Overflow from Resort Detention Basin to Fisherman s Beach N-B016 Page 51
54 Water Cycle Management Report Great Keppel Island Resort Revitalisation Plan Photo 5.3: Stormwater drainage at southern end of Fisherman s Beach. Photo 5.4: View as in Photo 5.3 from further down the beach. N-B016 Page 52
55 Water Cycle Management Report Great Keppel Island Resort Revitalisation Plan 6. OPTIONS ANALYSIS A wide range of options are available for managing water supply, wastewater and stormwater drainage associated with the GKI Resort Revitalisation Plan. Each of these options has associated advantages and disadvantages in relation to social, economic and environmental aspects. The following sections provide an assessment of each of the options considered in developing the water cycle management framework for the GKI Resort Revitalisation Plan. The proposed water supply and wastewater management schemes are outlined in more detailed in sections 9 and 10, while the proposed stormwater management system is outlined in more detailed in section WATER SUPPLY Description/ Comment Advantages Disadvantages Conclusion Connection to Council s mainland reticulated water supply system. Installation of a 16km long water main within the Utility Services Corridor from an existing main located near the Scenic Highway at Emu Park to the proposed marina on GKI. Water will be treated to drinking water standard at Council s facilities on the mainland. Supplementary chlorination may be required prior to storage on the Island to provide an effective disinfection residual due to the relatively long transfer distance. Reliable - less prone to drought than Island sourced water due to relatively large capacity of watercourse providing extra buffering. Flexible - supply able to respond to fluctuations in demand due to capacity of water source. No direct discharges to the environment (i.e. compared to return brine from desalination plant). Relatively high capital cost associated with constructing mainland pipeline connection. Mainland connection potentially subject to damage causing disruption to supply during cyclonic events or boat anchor strike. This option is considered an important component of the water supply scheme in terms of achieving water security. No ongoing environmental disturbance (e.g. compared to groundwater extraction). Consistent water quality not prone to variation or contamination (e.g. by saline intrusion or surface activities such as effluent irrigation). Moderate energy consumption relative to other uses (i.e. lower than desalination but higher than other options due to pumping distances). Extraction and use of groundwater resources on GKI. Installation of groundwater supply bores to extract groundwater from the various dune sand aquifers on the Relatively high quality water source, requiring minimal treatment. Total available sustainable yield is insufficient to fully meet the total water demand requirements of This is not a preferred option to provide ongoing water supply during operation of the GKI Resort Revitalisation Plan due N-B016 Page 53
56 Water Cycle Management Report Great Keppel Island Resort Revitalisation Plan Description/ Comment Advantages Disadvantages Conclusion Island. Assuming uniform and continuous extraction rates, the long term sustainable yields for these aquifers were estimated by Douglas Partners (2011) to be: North East Aquifer 270kL/day - extracted from 2 x 100kL/day and 1 x 70kL/day production bores located in the central part of the aquifer; Long Beach Aquifer 100kL/day - extracted from 2 x 50kL/day production bores; and Central Dune Aquifer 90kL/day extracted from 1 x 70kL/day and 1 x 20kL/day production bores. The aquifer identified within the area of the former resort was not consider suitable for extraction due to poor water quality and potential for contamination from saline intrusion and surface activities. Groundwater resources are of high quality and generally consistent with drinking water guidelines, with treatment likely to be limited to disinfection by chlorination or UV. Low to moderate energy consumption, with pumping required for extraction and distribution. Readily able to be used in conjunction with other water supply sources. Long Beach aquifer already developed with existing bores. Existing groundwater bores able to be used to provide construction water supply prior to construction of additional water supply infrastructure. Relatively low capital and ongoing costs given production bores already exist within the Long Beach Aquifer and groundwater quality of high standard likely to require only minimal treatment infrastructure and costs. the GKI Resort Revitalisation Plan. Relatively remote location of potential borefields and supply points would require construction of significant lengths of new roads, power infrastructure and rising mains if this resource was fully developed, including clearing and disturbance within otherwise undisturbed parts of the Island. Reliability of groundwater supply dependent on rainfall and subsequent recharge of aquifers. Groundwater resources subject to possible contamination from surface activities such as effluent irrigation, fuel and chemical storage if not appropriately managed. Long term viability of groundwater resources uncertain due to possible effects of climate change, including increased risk of saline intrusion due to rising sea levels and decreased average annual rainfall. to the risk of saline intrusion and other water quality impacts, and the unreliability of supplies as a result of drought and climate change. However, short term, smallscale extraction from the existing production bores at Long Beach is a preferred option to provide water supply for Stage 1 of construction prior to establishing a mainland connection. Low level of community support due to historical over-extraction from Resort Aquifer. Installation of rainwater tanks for roof water collection and reuse. Installation of rainwater collection systems on all available rooftops for capture in rainwater storage tanks to reduce water demands from other supply sources. Installation of rainwater tank collection systems and reuse of collected rainwater for internal uses such as toilet flushing and washing machines is mandatory when connecting to mains water supply in Queensland. Rainwater quality is typically high, therefore no treatment is typically required for non-potable use while only minimal treatment (e.g. disinfection) is required for potable use. Very low energy consumption as water is largely collected and reused at its source with localised pumping only. Available yield is insufficient to fully meet the total water demand requirements of the GKI Resort Revitalisation Plan therefore cannot be relied upon as sole water supply source. Reliability of supply is dependent on rainfall and may therefore be limited during drought conditions. This option is considered an important component of the water supply scheme in terms of achieving the sustainability objectives of the GKI Resort Revitalisation Plan but cannot be relied upon as the sole water supply source due to susceptibility of supplies to drought and climate change. N-B016 Page 54
57 Water Cycle Management Report Great Keppel Island Resort Revitalisation Plan Description/ Comment Advantages Disadvantages Conclusion Collected rainwater may also be used for potable consumption provided adequate treatment, including disinfection by UV, chlorination or similar, is provided. Relatively low installation costs and minimal ongoing operational costs. Readily able to be used in conjunction with other water supply sources. Rainwater tanks can be installed above ground or underground, and are colocated with buildings & infrastructure thereby reducing the need to clear additional land for installation. Long term viability uncertain due to possible effects of climate change, including reduced average rainfall. Likely to be consistent with sustainability objectives of the GKI Resort Revitalisation Plan. Construction of water storage dam / weir on watercourses on GKI. Construction of dams / weirs to provide water storage by impounding stream flows on existing watercourses on the Island. Required treatment would likely involve: settlement of suspended solids; sand filtration to remove fines; flocculation to remove chemical contaminants; and disinfection by chlorination/ UV irradiation. May provide an alternative form of water supply on the Island that would enable the GKI Resort Revitalisation Plan to be self-sufficient in relation to water supply avoiding the need for a mainland connection. Fresh surface water resources on GKI are limited, with most watercourses being ephemeral only and conveying relatively low volumes of water. Water quality likely to require significant amount of treatment to meet drinking water standards. High energy consumption to treat and subsequently distribute water supplies. Reliability of supply is dependent on rainfall and may therefore be limited during drought conditions. This option is not a preferred component of the water supply scheme due to the potential environmental impacts, high treatment requirements and susceptibility to drought and climate change. Long term viability uncertain due to possible effects of climate change, including reduced average rainfall. Relatively high capital costs and ongoing operational costs for constructing and maintaining storages and associated treatment and distribution systems. N-B016 Page 55
58 Water Cycle Management Report Great Keppel Island Resort Revitalisation Plan Description/ Comment Advantages Disadvantages Conclusion Potential for contamination of water supply by activities such as effluent irrigation if occurring in storage catchments and not managed appropriately. Construction of storage would require removal of riparian vegetation and modification of in-stream habitats, including potential impacts on fish migration. Unlikely to be consistent with the sustainability objectives of the project. Harvesting of stormwater runoff from proposed golf course on GKI. Harvesting of stormwater runoff from the golf course area within ponds designed to provide water features on the course while also providing a water supply source for irrigation. No treatment would be required if used only for irrigation. Reduce the need to use other sources of water, including potable water from the mainland for irrigation. Ponds can be readily incorporated into the golf course to enhance the aesthetic appearance and provide challenging playing hazards. Water quality suitable for irrigation with no treatment required. Minimal distribution infrastructure required as stormwater is harvested and reused in the same area. Water quality not suitable for potable uses without significant treatment. Pond would require liners due to highly permeable / sandy soils. Open storages may require algal management to prevent harmful blooms if excessive nutrients are allowed to accumulate. Long term viability uncertain due to possible effects of climate change, including reduced average rainfall. This option is considered to comprise an important component of the water supply scheme as it provides an alternative source of irrigation water to potable water supplies from the mainland. Harvesting of golf course runoff will reduce the discharge of nutrients contained in effluent and fertilisers to natural waterways will enable beneficial reuse of these nutrients by irrigating collected runoff across the golf course. Installation of a desalination plant on GKI. Installation and operation of a May be used in conjunction Reverse Osmosis Desalination with other supply sources Plant based on GKI. to reduce demands from Desalinated water would then those sources but could require disinfection by also be designed to meet High energy consumption associated with reverse osmosis process and additional energy required to distribute around the Desalination is not considered to be a preferred option for water supply, largely due to high ongoing costs and energy consumption, and potential N-B016 Page 56
59 Water Cycle Management Report Great Keppel Island Resort Revitalisation Plan Description/ Comment Advantages Disadvantages Conclusion chlorination or UV irradiation. Waste brine would need to be discharged most likely via a return pipeline into the ocean. the full water supply demands of the GKI Resort Revitalisation Plan enabling the resort to be selfsufficient and independent of mainland supplies. Island. Highly saline brine is returned to the marine environment. Requires high level of maintenance and technical expertise to operate. environmental impacts associated with high salinity brine discharge to Marine Park. Relatively high capital and ongoing costs. Limited flexibility in managing water supply to respond to high level of fluctuation in demand. Barging water from mainland. Delivering water from mainland to GKI by barge. As the source water would be produced at Council s municipal water treatment plant, no additional treatment would be required. Could be used as a backup water supply following disruption to other water supplies (e.g. due to a cyclone event). Could be used during the construction phase of GKI Resort. Relatively low capital costs as no treatment infrastructure required, only Island-based storage and distribution infrastructure needed. High energy consumption required relative to volume of water delivered. Only relatively small quantities of water would be able to be delivered at any one time therefore unlikely to be sufficient to meet full demands of development - back-up supply only. High ongoing costs to purchase water from Council and shipping costs. This is not considered to be a preferred option for water supply, largely due to the high level of energy consumption relative to quantity of water delivered, which reduces overall sustainability of the water supply. However, this option may be viable as temporary supply during construction or after an emergency event such a cyclone. Limited reliability due to potential for barge to be delayed during adverse weather. 6.2 WASTEWATER MANAGEMENT Sewerage Collection Description/ Comment Advantages Disadvantages Conclusion Traditional Gravity System Conventional precast concrete manholes connected with upvc, HDPE and/or ductile iron/cement lined rubber jointed pipes which gravity feed to sewage pumping stations that deliver raw wastewater to the treatment works. Materials readily sourced from local providers. Long established, well understood construction methodology. Potentially high groundwater infiltration rates due to joints and high water table. System becomes progressively deeper to construct as the system increases with size. This is not a preferred option due to the potential for significant groundwater infiltration. N-B016 Page 57
60 Water Cycle Management Report Great Keppel Island Resort Revitalisation Plan Description/ Comment Advantages Disadvantages Conclusion Odour control may be required at sewage pumping station(s) unless sealed. NuSewer Low Leak System Similar to traditional gravity sewer in function. Pipes are made of welded polyethylene eliminating most joints, which reduces infiltration and root intrusion. Significantly lower groundwater infiltration compared to traditional sewer system resulting in lower treatment costs and energy consumption. Materials not as readily available as traditional systems. Requires some specialist knowledge for installation. This is the preferred option primarily on the basis of the low infiltration potential. System can accommodate vertical and horizontal bends, which reduces the number of manholes. Fewer manholes required as the pipes are flexible. Odour control may be required at sewage pumping station(s) unless sealed. As with traditional sewers, the pipes gravity feed to sewage pumping stations that deliver raw wastewater to the treatment works. Vacuum System A vacuum system collects sewage from buildings via gravity into a collection tank. A centralised vacuum chamber draws the sewage from the individual tanks along a shallow vacuum rising main towards the treatment works or a traditional sewage pumping station. Entire system is relatively shallow to construct. Few if any manholes required. Piping system can be installed within a narrow trench, which can bend around obstacles such as trees. Materials not as readily available as traditional systems. Requires specialist knowledge for installation and operation. System performs better on low topography due to the limit a vacuum can draw sewage uphill. This is not the preferred option largely due to the relatively steep topography of parts of the Island and the need for specialty materials and technical expertise for installation and maintenance. Individual grinders may be needed in collection tanks to reduce solids to a manageable size so as not to block the system. Odour control may be required at sewage pumping station(s) unless sealed. Pressure System A pressure system consists of a small collection tank at each building serviced by sewerage. Each tank is fitted with a small grinder pump that feeds a common rising main that discharges to treatment works or a sewage pumping station Entire system is relatively shallow to construct. Few if any manholes required. Piping system can be installed with a narrow trench, which can bend around obstacles such as trees. Requires some specialist knowledge of installation and operation. Greater chance of individual pump malfunction due to increased quantity to service every building. This is one of the preferred options in conjunction with the NuSewers: This option is recommended for low density areas such as the ecotourism villas; System reduces construction footprint and therefore vegetation clearing requirements; Individual grinders needed in collection tanks to N-B016 Page 58
61 Water Cycle Management Report Great Keppel Island Resort Revitalisation Plan Description/ Comment Advantages Disadvantages Conclusion reduce solids to a manageable size so as not to block the system; and Odour control may be required at sewage pumping station(s) Wastewater Treatment Description/ Comment Advantages Disadvantages Conclusion Pre-treatment and pump to mainland for treatment at Council WWTP. Rockhampton Regional Council has indicated their wastewater treatment and recycled water infrastructure has the capacity to accept all effluent from the GKI Resort Revitalisation Plan. In order to transfer wastewater approximately 16 kilometres back to the mainland for treatment, raw wastewater must be pre-treated to reduce the negative effects of hydrogen sulphide build-up due to septicity issues associated with long detention times. No treatment plant required on the Island. No issues with regard to effluent disposal including contamination of groundwater, ocean discharge of effluent. Increased potable water needed to make up for shortfall by not reusing any recycled water produced from Island-based treated wastewater. Increased risk of potential environmental impacts associated with accidental damage to pipeline resulting in relatively untreated wastewater discharge to the ocean. Hydrogen sulphide corrosion of infrastructure due to the long period of time it will take for wastewater to travel from GKI to the mainland treatment plant. This is not a preferred option due to the potential environmental impacts of accidental discharge of untreated wastewater and the lost opportunity to reuse treated wastewater to offset nonpotable water supplies on the Island. Relatively high ongoing cost to GKI Resort to provide at least primary treatment and pumping as well as ongoing charges for sewage treatment and purchase of potable water that could not be offset by reuse of recycled water use produced at Islandbased WWTP. Relatively high capital cost associated with constructing mainland pipeline connection. Mainland connection potentially subject to damage causing disruption to supply during cyclonic events or boat anchor strike. Does not fully reflect the self-sustainability N-B016 Page 59
62 Water Cycle Management Report Great Keppel Island Resort Revitalisation Plan Description/ Comment Advantages Disadvantages Conclusion Individual On-Site Treatment and Disposal Systems objectives of the GKI Resort Revitalisation Plan. Installation of individual treatment and disposal systems for each villa with separate onsite treatment and disposal systems to service core facilities such as the Fisherman s Beach Resort Precinct and Marina Precinct. Individual treatment would provide for easier staging of development. Many individual treatment units do not support the large-scale reuse of recycled water for irrigation of areas such as the golf course. Small-scale treatment units unlikely to achieve the same high level of treatment able to be achieved by a larger scale plant. This is not a preferred option due to the ongoing maintenance difficulties and costs, and the potential for water quality impacts due to lower standard of treatment. Many individual units with relatively high level of inspection and maintenance, including pump out of septic tanks. High risk of degradation of groundwater due to lower standard of treatment. Requires relatively large area of land near each villa and other facilities to contain treatment and disposal infrastructure. Single WWTP on GKI Installation of a single wastewater treatment plant servicing the entire GKI Resort. Preferred location would depend on providing buffers to sensitive receivers, and considering the proximity to wastewater sources and recycled water reuse sites. Only one wastewater treatment plant to license, operate, maintain and monitor. Larger treatment systems are typically more efficient than smaller treatment systems. Less time and fewer staff required to operate a single plant as opposed to multiple plants. A single plant would require multiple, expandable treatment trains to accommodate progressive increase in flows over the 12 year construction period (Note: Two or more parallel plants enable greater operational flexibility). This could be and is a viable option with the preferred location of the plant to be in the Clam Bay Precinct in close proximity to the recycled water irrigation area. Ensures consistent standard of treatment for all wastewater generated across the Island. A single WWTP would consume less energy than multiple WWTPs. Multiple WWTPs on GKI Installation of two wastewater treatment plants, including: One WWTP servicing the Fisherman s Beach and Provides greater flexibility to support staging of the development. Reduces the need to pump Double the ongoing licence fees and monitoring would be required for two WWTPs. Preferred option. However, with reuse of recycled water largely intended for the golf course, the single WWTP option is to be N-B016 Page 60
63 Water Cycle Management Report Great Keppel Island Resort Revitalisation Plan Description/ Comment Advantages Disadvantages Conclusion Marina Precincts - most likely located on the north eastern side of the airstrip within the vicinity of the facilities maintenance compound; and One WWTP servicing the Clam Bay Precinct - most likely located to the north west of the golf course. However, the exact location would depend on providing buffers to sensitive receivers. wastewater from Clam Bay Precinct to Fisherman s Beach Precinct or vice versa for treatment. Need to pump recycled water from Fisherman s Beach WWTP across to the Clam Bay Precinct for irrigation of the golf course. Treatment likely to be less efficient than a single plant due to the smaller size of each individual plant. Higher energy consumption than a single plant. further considered during the design phase. Wastewater Treatment Plant Options Sludge sedimentation and stabilisation / oxidation lagoons as follows: Grit chambers / screens to remove floating solid items and grit. Screened solids and grit disposed of at a licensed landfill facility on the mainland; Primary sedimentation tanks with collected sludge to sludge digestion tanks, sludge removed, dewatered, dried and used for landscaping, liquid from sludge process passed to the stabilisation lagoons; Robust system with minimal power requirement. Simple technology and low maintenance. Relatively low cost solution. With minimal power requirement, system is not significantly affected by power outages. System would need to be combined with a membrane or similar filtration system and disinfection in order to achieve the required recycled water quality for unrestricted use. Likely to require significant buffer (e.g. 500 to 800m) between plant and to tourist / residential facilities. Odour may be an issue from time to time. Requires relatively large area of land for plant. This option is not preferred on the basis that the treatment system is not likely to be capable of achieving the required recycled water quality. Stabilisation / oxidation lagoons for treatment of liquid from sedimentation tanks; Effluent from the stabilisation lagoons pumped to the golf course storage pond(s). Sludge sedimentation and oxidation ditches: Grit chambers / screens to remove floating solid items and grit. Screened solids and grit disposed of at a licensed landfill facility on the mainland; Primary sedimentation tanks with collected sludge to sludge digestion tanks, sludge removed, dewatered, dried Robust system with minimal power requirement. Simple technology and low maintenance. Relatively low cost solution. System would need to be combined with a membrane or similar filtration system and disinfection in order to achieve required recycled water quality for unrestricted use. Likely to require significant buffer (e.g. 500 to 800m) between plant and to tourist / residential facilities. Odour may be an issue from time to time. This option is not preferred on the basis that the treatment system is not likely to be capable of achieving the required recycled water quality. N-B016 Page 61
64 Water Cycle Management Report Great Keppel Island Resort Revitalisation Plan Description/ Comment Advantages Disadvantages Conclusion and used for landscaping, liquid from sludge process passed to the oxidation ditches; Requires relatively large land area for plant. Oxidation ditches for treatment of liquid from sedimentation tanks; Finishing lagoons; and Effluent from the finishing lagoons pumped to the golf course storage pond(s). Proprietary package treatment plants (MBR or similar): Grit chambers / screens (within package plant) to remove floating solid items and grit. Screened solids and grit disposed of at a licensed landfill facility on the mainland; Package plant with treatment and retention times to meet the required treatment standard for unrestricted reuse for irrigation of the golf course and ocean outfall. Note that the package treatment plants could be based on membrane bioreactor technology (MBR system) with UV disinfection after the plant. Package plant capable of producing recycled water quality suitable for irrigation of golf course with unrestricted access. Package plant capable of producing recycled water quality suitable for direct discharge via the ocean outfall. MBR technology is well proven and capable of producing high quality effluent. MBR type and other package plants generally have a small footprint (i.e. are compact and require minimal land area). Odour issues are generally low to non-existent allowing these plants to be located close to residential dwellings etc. Relatively higher cost than stabilisation lagoon or oxidation ditch systems above. Relatively high maintenance requirements needing specialist skills and knowledge. Relatively higher operating and maintenance costs than stabilisation lagoon or oxidation ditch systems above. Require substantial power for operation. This is the preferred option due to the smaller footprint, proven ability to produce high quality effluent and less odour generation issues. Effluent from the package plant pumped to the golf course storage pond(s), or, when required, direct to the ocean outfall Wastewater Effluent Reuse & Disposal Description/ Comment Advantages Disadvantages Conclusion 100% discharge of treated wastewater via ocean outfall. N-B016 Page 62
65 Water Cycle Management Report Great Keppel Island Resort Revitalisation Plan Description/ Comment Advantages Disadvantages Conclusion Discharge all treated wastewater to the ocean via an outfall pipeline extending from Long Beach. Avoids requirement for construction of large wet weather storage ponds. Requires fewer pumps than an irrigation / non-potable water supply system or mainland return rising main. Increased risk of potential impacts including cumulative impacts on water quality and ecological communities near the outfall due to reliance solely on the treatment plant to achieve required water quality as opposed to additional treatment achieved through assimilation of treated wastewater by plants and soils during irrigation. This option is not preferred primarily on the basis that it is inconsistent with the sustainability objectives of the GKI Resort Revitalisation Plan, which aims to maximise beneficial reuse wastewater and due to the increased risk of environmental harm. To achieve water quality objectives given volume and frequency of discharge, wastewater will require a very high level of nutrient removal, which typically involves significant energy consumption and / or use of chemical treatment processes. Does not achieve any beneficial reuse of water or nutrients contained in treated wastewater and is therefore not consistent with sustainability objectives of the GKI Resort Revitalisation Plan. Increased requirement for potable water sources to be used for non-potable purposes. Negative perception of ocean disposal by potential guests as well as within the broader community. 95% Reuse of recycled water for irrigation of golf course and other landscaped areas with 5% discharge of treated wastewater via ocean outfall Reuse of 95% of recycled water produced by an Island-based WWTP for irrigation of the golf course and other landscaped areas. Discharge up to 5% of treated wastewater to the ocean via an outfall pipeline extending from Long Beach. Assuming a 31 hectare irrigation area, this option would require a wet weather storage pond of approximately 13ML plus 2.6ML climate change buffer. Achieves 95% beneficial reuse of treated wastewater averaged over a 50 year period, which is consistent with DERM s general policy for sewage treatment plants involving effluent reuse. Provides a controlled point of release to the ocean in the event of wet weather storage reaching capacity as opposed to possible uncontrolled release to the environment from overtopping of wet weather storage. Due to the volume and frequency of discharge, subject to more detailed dispersion modelling, a greater level of nitrogen and phosphorus removal may be required compared to recycled water used for irrigation meaning multiple treatment trains could be needed. Not considered to maximise beneficial reuse of treated wastewater in accordance with the sustainability objectives of the GKI Resort This is not the preferred option largely on the basis that the level of reuse does not meet the sustainability objectives of the GKI Resort Revitalisation Plan. N-B016 Page 63
66 Water Cycle Management Report Great Keppel Island Resort Revitalisation Plan Description/ Comment Advantages Disadvantages Conclusion Requires only a relatively small wet weather storage (less land area and materials for lining) compared to irrigation schemes achieving a higher level of reuse. Revitalisation Plan. 100% Reuse recycled water for irrigation of golf course and other landscaped areas with, with emergency discharge Reuse of practically 100% of recycled water produced by an Island-based WWTP for irrigation of the golf course and other landscaped areas. Discharge only in extreme weather events (i.e. 1 in 10 year event) when treated wastewater may be discharged to the ocean via an outfall pipeline extending from Long Beach. Assuming a 31 hectare irrigation area, this option would require a wet weather storage pond of approximately 37ML plus approximately 7ML climate change buffer. Achieves practically 100% beneficial reuse of recycled water for irrigation of golf course and other landscaped areas. During extreme weather events the dispersion modelling of the outfall demonstrates water quality objectives can be achieved within small mixing zone based on same standard of nutrient removal proposed for reuse by irrigation (N=20mg/L, P=7mg/L) meaning multiple treatment trains are not required. Provides a controlled point of release to the ocean in the event of extreme weather storage reaching capacity as opposed to possible uncontrolled release to the environment from overtopping of wetweather storage. A small proportion of treated wastewater potentially remains unused (i.e. less than 1% averaged over 50 years). Capital costs associated with construction of irrigation infrastructure as well as outfall pipeline which will have limited use. This is the preferred option on the basis that it achieves the maximum reuse of recycled water while providing a feasible wet weather storage, and limiting discharge to the ocean to extreme wet weather events (i.e. 1 in 10 years on average) when water quality will likely be degraded by more significant land-based pollutant sources. Installation of non-potable water reticulation to enable use of recycled water for non-potable purposes such as toilet flushing, laundry and garden use. Installation of a network of third pipe or purple pipe reticulation to enable recycled water to be used for nonpotable internal purposes such as toilet flushing and laundry as well as external irrigation and washdown. Provides an alternative source of non-potable water supply to replace potable water demand for certain purposes, that is not dependent on rainfall as is the case for harvested stormwater runoff and roof water collection. Consistent with sustainability objectives of the GKI Resort Revitalisation Plan. High ongoing compliance costs associated with ongoing monitoring and reporting required for dual reticulation schemes to protect public health. The volume of recycled water produced would achieve only limited reduction in demand for potable water supplies, given that non-potable water supply for toilet flushing, washing machines, garden watering, car and boat washdown, can also be derived from rainwater harvesting. The availability of recycled water will be highly variable due to the fluctuating occupancies and therefore generation of wastewater effluent This option is not preferred due to the high establishment and ongoing maintenance / compliance costs and the relatively small proportion of recycled water that could be used for this purpose relative to the cost of the scheme. Note also, that the estimated quantity of effluent available can more readily and economically be used for Golf Course irrigation. N-B016 Page 64
67 Water Cycle Management Report Great Keppel Island Resort Revitalisation Plan Description/ Comment Advantages Disadvantages Conclusion associated with tourist facilities, and is therefore not considered to be a sufficiently reliable source of water for these types of non-potable purposes. Not all recycled water produced by the GKI Resort Revitalisation Plan could be reused for this purpose. As such, dual reticulation would need to be combined with an alternative reuse option such as irrigation. Significant ground disturbance and ongoing pumping costs / energy consumption would be associated with the extensive recycled water distribution and storage system required for a dual reticulation scheme. Achieves beneficial reuse of water component of recycled water only, not beneficial reuse of nutrients as occurs through irrigation to the golf course. 6.3 STORMWATER MANAGEMENT - OPTIONS No options discussion is made in relation to the stormwater component of this report. This is due to: The porous sandy soils on the Island in the areas of resort development; The sandy soils being similar to the material that would normally be sourced for drainage material under bio-retention basins and the like; The use of low impact grassed basins and swales, incorporated into the landscaping and effectively mimicing the natural processes on the Island, to form the stormwater drainage and stormwater treatment arrangements; Given the above, the obvious use of the existing soil material within the bio-retention and detention basins, swales etc. Refer also to the stormwater section 11. N-B016 Page 65
68 Water Cycle Management Report Great Keppel Island Resort Revitalisation Plan 7. PROJECTED DEMAND While the historical water and sewage demands estimated for the former GKI resort provide some relevant background data in relation to how the former resort managed its water resources, the historical demand figures are not considered relevant to calculation of future demands. This is particularly so given that the GKI Resort Revitalisation Plan proposes to: Completely rebuild and expand the resort facilities with an emphasis on sustainable water use; Provide rehabilitated or new water and sewerage infrastructure; Include the installation of various water efficiency measures; and Involve extensive reuse of rainwater. As such, the following sections describe the methodology used to calculate the total water supply and sewage demands for the GKI Resort Revitalisation Plan based on an estimated demand per person and an estimated number of persons for the resort at various occupancies. 7.1 PROJECTED OCCUPANCY Table 7.1 provides a summary of the expected number of staff and visitors, and average occupancy for the resort during operation as derived from the report entitled Forecast Economic Impacts - Proposed Revitalisation of Great Keppel Island, dated June 2011 and prepared by Foresight Partners Pty Ltd. TABLE 7.1: Estimated Average & Maximum Occupancy for GKI Resort Revitalisation Plan Use Units Average Occupancy Rate Persons / Occupied Unit Annual Person Assumes 285 staff occupying premises for an average of 48 weeks per year (285 staff x 7 days/week x 48 weeks = 95,760 annual person days). Days Average Person Days Max. Occupancy Rate Persons / Occupied Unit Annual Person Hotel Rooms % , % ,750 Villas % , % ,375 Apartments % , % ,750 Marina Berths % , % ,750 Day Visitors N/A N/A N/A 36, N/A N/A 36,500 Staff Accommodation Staff Commuting Days % ,760* % ,800 N/A N/A N/A 48, N/A N/A 48,000 Annual Total 829,960 2,274 1,544,925 Average per Day Average per Month 2,274 69,163 Maximum per Day 4,233 N-B016 Page 66
69 Water Cycle Management Report Great Keppel Island Resort Revitalisation Plan These occupancy rates have been adopted as the basis for calculating water supply and wastewater requirements for the GKI Resort Revitalisation Plan. The figure of 4,233 persons represents a theoretical maximum occupancy for the resort. Although the resort would have the capacity to accommodate this figure, it is unlikely to actually have such a population in reality. Therefore, this maximum capacity is considered for design purposes only. From historical data, the theoretical maximum daily population would occur in the month of January which corresponds to the annual summer school holiday period. In order to calculate water supply demands and wastewater flows, the number of persons estimated by Foresight Partners to be utilising the resort first need to be converted to Equivalent Persons (EP). EP is typically used as the primary population criteria for the design of water supply and sewerage schemes. An Equivalent Person (EP) is defined in DERM s Planning Guidelines for Water Supply & Sewerage Schemes (DERM, 2010) as: The water supply demand or the quantity and/or quality of sewage discharge for a person resident in a detached house. It is also applied to: The number of persons who would have a water demand equivalent to the establishment being considered. The number of persons who would contribute the same quantity and/or quality of domestic sewage as the establishment being considered. For non-residential developments such as that proposed by the GKI Resort Revitalisation Plan, the water supply and sewage demand for each activity is calculated in relation to the number of persons resident in a detached house who would have the same water demand or would generate the same amount of sewage as the activity proposed. For example, a person who commutes to the Island for work would not be expected to use as much water or generate as much sewage as a person or staff member living on the Island. This is basically because the commuting staff member will not prepare any meals or do any laundry, which generate significant water and sewage demand. As such, each person that is a commuting staff member would only be accounted for as a proportion of an EP, in this case 0.32 EP whereas a staff member resident on the Island would be accounted for as a whole EP or 1.0 EP. To determine the number of EP for retail and commercial activities, the gross floor area of the facility is typically used, as floor area is assumed to provide an indication of the number of persons that can use a facility. The following section provides an overview of the maximum number of EP associated with the proposed GKI Resort Revitalisation Plan. 7.2 ESTIMATED EQUIVALENT PERSONS Information derived from section 3.2 of the Forecast Economic Impacts Report prepared by Foresight Partners as presented in Table 7.1 above, has been used as the basis for an estimation of equivalent persons and for occupancy levels for the Project. Specifically, the number of persons per occupied unit estimated by Foresight Partners (2011) for proposed villas, apartments, hotel rooms etc have been adopted as the number EP for these N-B016 Page 67
70 Water Cycle Management Report Great Keppel Island Resort Revitalisation Plan components of the development on the basis that the nature of the activity is comparable to a residential activity so that a person staying in an apartment for example, could be expected to generate the same water supply and sewage demand as a person resident in a detached house. However, for other components of the development that are not residential in nature (e.g. retail) or where a more relevant reference to the number of EP exists for an activity, then an alternative number of EP has been adopted. In general, where the number of EP has not been derived directly from Foresight Partners (2011), the number of EP has been determine with reference to schedule D of the former Livingstone Shire Council (LSC) Planning Scheme Policy No.5 Development contributions for water supply and sewerage, June Note that while there has been a recent amalgamation of the local councils to form the Rockhampton Regional Council (RRC) (including the Livingstone Shire Council), the provisions of the LSC planning schemes are still current pending issue of an overall planning scheme for the RRC. Schedule D of the former LSC Planning Scheme Policy No.5 Development contributions for water supply and sewerage, June 2006 specifies maximum Equivalent Tenement (ET) densities for a range of uses. To convert an ET based on floor area to EP, the ET density is multiplied by 3 (i.e. equivalent to a tenement with an occupancy of 3 persons) as per the Livingstone Shire Council policy. Table 7.2 below presents the EP calculations adopted for the purpose of determining the water supply and sewage demands for the GKI Resort Revitalisation Plan. The following assumptions have been made within the EP calculations: Hotel all one bedroom, EPs as per occupancies projected by Foresight Partners (2011); Apartments 40% one bedroom, 40% two bedroom, 20% three bedroom and EPs as per occupancies projected by Foresight Partners (2011); Villas all three bedroom and EPs as per occupancies projected by Foresight Partners (2011); and Day Visitors - average of 100 per day as projected by Foresight Partners (2011). TABLE 7.2: Equivalent Person Estimation for GKI Resort Revitalisation Plan Area ET Factor EP / Unit or m 2 Unit No. or Area EP Fisherman's Beach Precinct Fisherman s Beach Hotel (250 rooms) Rooms all one bedroom 2.2 No Restaurant, Hotel, Licensed Premises m Retail Shops m Ecotourism Villas (383 villas) Assume 100% Short Term Accommodation three bedrooms 2.5 No Ecotourism Apartments (150 apartments) Assume 40% Short Term Accommodation - one bedroom 2.2 No Assume 40% Short Term Accommodation - two bedroom 2.5 No Assume 20% Short Term Accommodation - three bedroom 2.5 No Fisherman s Beach Resort N-B016 Page 68
71 Water Cycle Management Report Great Keppel Island Resort Revitalisation Plan Area ET Factor EP / Unit or m 2 Unit No. or Area EP Restaurants, Café, Fast Food m Retail Shops (including pro shop) m 2 1, Swimming Pool, Tennis Court & Gymnasium Staff Living on site - allow one bedroom unit - long term 1.5 No Living off site 0.32 No Day Visitors Assume 0.1 EP/ Visitor (noting also public area allowances) 0.1 No Allow nominal for public facilities 12 Airport Total Area = 3,500m 2, assume 1,000m 2 retail / commercial m 2 1, Marina Precinct: Marina Berths 1 No Yacht Club - Licensed Premises, Restaurant, Café m 2 1, Retail Shops m 2 6, Day Visitors Assume 0.1 EP/ Visitor (noting also public area allowances) 0.1 No 30 3 Ecotourism Apartments (150 apartments) Assume 40% Short Term Accommodation - one bedroom 2.2 No Assume 40% Short Term Accommodation - two bedroom 2.5 No Assume 20% Short Term Accommodation - three bedroom 2.5 No Clam Bay Precinct: Golf Clubhouse including Golf Day Visitors m 2 2, Ecotourism Villas (367 No.) Assume 100% Short Term Accommodation three bedroom 2.5 No TOTAL EP 3,973 Based on the above, the maximum projected population for design purposes for the GKI Resort Revitalisation Plan is estimated to be 3,973 EP. 7.3 PROJECTED WATER DEMAND Per Capita Water Demand Table 7.3 below provides a comparison of the estimated internal water demand for an EP in a typical household assuming standard fixtures and water saving devices. The water demands in the following table have been established based on experience with the individual fixtures and demonstrates the reduction in water demand that can be achieved by installing water saving devices. N-B016 Page 69
72 Water Cycle Management Report Great Keppel Island Resort Revitalisation Plan To reduce pressure on limited water resources, water saving devices will be installed in all buildings and facilities within the GKI Resort Revitalisation Plan and accordingly, the estimated internal demand assuming water saving devices are installed has been adopted for calculation of projected water demand. TABLE 7.3: Estimated Internal Water Supply - Average Daily Demand Standard Water Fixtures and Water Saving Devices Water Use Water Demand Standard Fixtures Water Demand Water Saving Devices L/EP/d L/EP/d Drinking/ Cooking Bathroom Toilets 30 (1) 30 (1) Laundry Hot Water Total Notes: 1. Assumes 6L/3L dual flush toilets for both standard and water saving fixture scenarios, as per minimum WELS 3 Star standard. Note that WELS 4 Star standard with 4.5/3L flush may also be considered. The above internal water demand figures are considered to provide an indication of the per capita water demand that would be expected for a 1 bedroom apartment with 2.2 EP/apartment and a 2 or 3 bedroom apartment or villa with 2.5 EP/apartment or villa proposed under the GKI Resort Revitalisation Plan assuming water saving devices are installed (i.e. reduced flush toilets, aerator faucets and shower-heads etc). For the purposes of determining an external water demand for a proposed 1 bedroom apartment with 2.2 EP/apartment and a 2 or 3 bedroom apartment or villa with 2.5 EP/apartment or villa, it has been assumed that approximately 40 L/EP/day may be required for garden watering. This is based on an assumption of approximately m 2 of garden per villa / apartment and an average irrigation rate of 30 mm/week for 26 weeks/year. An allowance of 8 L/EP/day has also been assumed for other external use such as hosing down hardscape. Based on the above estimated water demands for proposed villas and apartments, assuming installation of water saving devices, and assuming that this level of water demand per EP is reflected across all of the GKI Resort Revitalisation Plan, the average daily water demand per EP would be: 180 L/EP/day (internal demand); 48 L/EP/day (external demand); and 228 L/EP/day (total water demand). The adopted average daily water demand of 228 L/EP/day with water saving fixtures compares to the following: 137 to 194 L/person/day from the Draft Urban Water Use Study of South East Queensland (NRM, 2005) for a resort, hotel, motel unit with standard fixtures. The adopted figure of 228 L/EP/day thus includes a significant design contingency of 17.5 % (228 / 194 = 1.175) and / or N-B016 Page 70
73 Water Cycle Management Report Great Keppel Island Resort Revitalisation Plan is a reflection of the likely higher usage of water associated with the tropically located GKI Resort Revitalisation Plan. 540 L/person/day from the Livingstone Shire Planning Scheme based on 3 persons per ET. Note that this is for urban situations with larger housing lot sizes and thus more garden watering etc. 180 to 300 L/person/day estimated range derived from Great Keppel Island Water, Wastewater Infrastructure Audit Report, 13 September 2007 prepared by Sustainable Solutions International Pty Ltd. The median value was 250 L/person/day. 177 L/person/day for internal residential consumption Hummock Hill Island Feasibility Investigation, 11 July 2007 prepared by Cardno. In comparison, an internal water demand of 180L/EP/day out of the total 228L/EP/day is estimated for the GKI Resort Revitalisation Plan. 134 to 199 L/person/day from Draft Urban Water Use Study of Southeast Queensland (NMR, 2005) for Holiday Accommodation (houses, units, townhouses). The average daily water demand for each of the facilities within the GKI Resort Revitalisation Plan will be confirmed during the detailed design stage Fire Fighting Water Demand Fire fighting flows will be provided by the provision of dedicated fire storage within the water storage reservoirs, fire pumps (if required following assessment in the detailed design stage) and the provision of fire hydrants and hose reels within the water reticulation system adjacent to the various buildings. A fire flow of 25 L/sec with a minimum of 4 hours fire storage capacity (a total of 360 kl) would be proposed for all resort facilities. The fire fighting flow for the larger buildings such as the resort / core facilities will depend upon the final level of fire compartmentalisation provided through structural building design. The system will be assessed during the design stage to cater for fire flows commensurate with the level of fire compartmentalisation provided. It is anticipated that fire fighting services for the GKI Resort Revitalisation Plan will be: Similar to a small rural fire service with light vehicle(s), small tank and pumps for minor grass fires and hydrant hoses for use with the fixed hydrants in the reticulation system; and Operated by the maintenance staff supplemented by volunteers from the general resort staff, with appropriate training Total Water Demand The total water demand estimated for accommodation, commercial and retail components of the GKI Resort Revitalisation Plan is based on the average daily water demand of 228 L/EP/day determined in section multiplied by the number of equivalent persons (EP) as outlined in Table 7.2 and the occupancy projections as provided by Foresight Partners (2011). N-B016 Page 71
74 Water Cycle Management Report Great Keppel Island Resort Revitalisation Plan However, in addition to the internal and external water demands estimated for the core resort facilities as described above, an estimate of irrigation water supply requirements for the proposed golf course has also been made. Estimated rates of irrigation required to maintain the golf course based on average rainfall and evapo-transpiration have been provided by Greg Norman Golf Course Design. Irrigation at the rates specified by the golf course designer is only proposed for parts of the golf course comprising tees, greens and fairways rather than the entire golf course. As such, estimation of the total volume of irrigation water required is based on the rates specified by the golf course designer multiplied by the estimated area of tees, greens and fairways. Based on reference to a report published by the Environmental Institute of Golf (2006), it has been estimated that the area of tees, greens and fairways accounts for approximately 49% of the total area of maintained turf, which in this case, equates to 49% of 31 hectares or approximately 15.2 hectares. Table 7.4 provides a summary of the estimated irrigation water demand for the proposed golf course. TABLE 7.4: Estimated Golf Course Irrigation Requirements Month Irrigation Rate Required for Tees, Greens & Fairways (ML/ha/month) Total Volume of Irrigation Water Required for Tees, Greens & Fairways (15.2ha) (ML/month) January February March April May June July August September October November December Annual It should be noted that above irrigation demand is based on irrigating tees, greens and fairways at the full rate proposed by the golf course designer, which may be achieved using a combination of recycled water and other water supply sources. However, as the rate of irrigation is not as critical for other areas of golf course not comprising tees, greens and fairways, these areas will be irrigated using recycled water only at the rate determined to be sustainable through MEDLI modelling as discussed in section 10.3 so as to reduce the total demand for irrigation water supplies. Monthly water demand figures for the golf course and core resort facilities as described above have been used to formulate Appendix E - Water Balance Spreadsheets, which includes the following: Overall Water Balance Summary; and Monthly Water Balance - January to December. Table 7.5 summarises relevant average and peak water demand figures derived from Appendix E - Water Balance Spreadsheets. The sources of water proposed to meet this demand are discussed in section 8. N-B016 Page 72
75 Water Cycle Management Report Great Keppel Island Resort Revitalisation Plan TABLE 7.5: Comparison of Average Daily Water Demand with Peak Daily Water Demands Estimated Water Demand Internal External Total Average Daily Water Demand kl/day 1,391 kl/day 1,884 kl/day Peak Occupancy Month - Water Demand (January) kl/day 1,426 kl/day 2,281 kl/day Peak Month Water Demand (November) kl/day 1,942 kl/day 2,469 kl/day Maximum Internal & External Water Demand 855 kl/day 1,942 kl/day 2,797 kl/day Note: 1. Average over 12 months based on total water usage over 12 months assuming average occupancy from Appendix E - Water Balance Spreadsheets. 2. Peak Occupancy occurs in January with typical occupancies of 98% for the Hotel, Villas & Apartments and other facilities. Internal water demand is at its highest during this month, but total water demand is not at its highest as rainfall and availability of recycled water for irrigation reduce the demand for external irrigation water supplies. 3. Peak Monthly Water Demand occurs in November. Although typical occupancies are less than in January at only about 95% occupancy for the Hotel, 65% for Villas & Apartments and other facilities, total water demand is at its highest due to the demand for irrigation water supplies at the end of the typical dry season. It should be noted that there will always be a degree of uncertainty in relation to the actual water supply demand figures that should be used for water supply schemes both in terms of the expected occupancy and per capita water usage. This is not a unique issue for an island resort, but is exacerbated by the high variability in terms of occupancy. As such, the adopted water supply system will need to be designed with a degree of flexibility to account for these uncertainties. 7.4 PROJECTED WASTEWATER FLOWS Per Capita Wastewater Flow An Average Dry Weather Flow (ADWF) of 180 L/EP/day has been calculated for the GKI Resort Revitalisation Plan. The estimated ADWF of 180 L/EP/day is equivalent to the estimated internal water demand described in section Notwithstanding, preliminary assessment of recycled water reuse has been based on an ADWF of 200 L/EP/day. This is to ensure a conservative assessment of irrigation area and wet weather storage requirements for the recycled water irrigation scheme given the environmentally sensitive nature of the site. An ADWF of 200 L/EP/day is consistent with the ADWF used for calculating peak design capacity for ERA 63 - Sewerage treatment works under schedule 2, part 13, item 63 of the Environmental Protection Regulation Estimated Equivalent Persons The estimated EP for the purpose of establishing wastewater flows for the GKI Resort Revitalisation Plan is the same as for the water demand in Table 7.2. The maximum estimated EP for the GKI Resort Revitalisation Plan is 3,973 EP. As such, the proposed WWTP will conform to the definition of ERA 63(2)(c) which is defined in schedule 2 of the Environmental Protection Regulation 2008 as follows: ERA 63(2)(c) Sewage treatment operating sewage treatment works, other than no release works, with a total peak design capacity of 1,500 to 4,000EP. N-B016 Page 73
76 Water Cycle Management Report Great Keppel Island Resort Revitalisation Plan Total Wastewater Flow Based on an ADWF of 180 L/EP/day estimated for the Project in section and an estimated average number of equivalent persons per month as detailed in Appendix E - Water Balance Spreadsheets, the following average monthly wastewater flows have been estimated: TABLE 7.6: Estimated Monthly Wastewater Flows (@180L/EP/day) Month EP x Occupancy ADWF for 180 L/EP/day ML/day ML/month January February March April May June July August September October November December As can be seen from Table 7.6, the quantity of wastewater generated by the resort will vary significantly throughout the year depending on occupancy rates. It should be noted that while the above table represents the estimated ADWF for the Project, figures adopted for modelling of recycled water irrigation to land have been based on 200 L/EP/day to provide a conservative assessment of irrigation area and wet weather storage requirements. Details of monthly wastewater flows adopted for MEDLI modelling purposes are provided in section N-B016 Page 74
77 Water Cycle Management Report Great Keppel Island Resort Revitalisation Plan 8. WATER BALANCE 8.1 WATER SUPPLY SOURCES A number of water supply sources are available to meet the projected water demands of the GKI Resort Revitalisation Plan. The preferred water supply sources for operation of the resort as determined through the above options analysis, include: Potable Water Supply: Potable water sourced from Rockhampton Regional Council s water treatment facilities on the mainland. Non-Potable Water Supply: Treated effluent produced from treatment of sewage effluent at the Island-based WWTPs; Harvested stormwater runoff from the golf course; Harvested stormwater runoff from resort hardstand areas; Rainwater collected from roof areas; and Potable water sourced from Rockhampton Regional Council s water treatment facilities (to supplement above sources only). Groundwater resources are also available; however this resource has been identified for water supply to the Stage 1 construction only and will not form a fundamental component of the overall water supply strategy for the GKI Resort Revitalisation Plan during operation. The following section provides an estimate of the amount of water supply that is likely to be derived from each of the above sources to meet the total water demands of the project Rainwater Collection In accordance with the Queensland Development Code (QDC), once the facilities are connected to a mains water supply, such as is proposed by the mainland connection to Council water supply, rainwater collection and reuse for toilet flushing, laundry and external use is mandatory. As such, rainwater collected from roof areas will be used as the primary source of water supply for internal non-potable uses (e.g. toilet flushing, laundry) and some external non-potable uses (e.g. car and boat washdown, garden watering, hosing down of hardscape). Based on the estimated internal and external water demand figures determined for a 1 bedroom apartment with 2.2 EP/apartment and a 2 or 3 bedroom apartment or villa with 2.5 EP/apartment or villa assuming water saving devices are installed as described in section 7.3.1, it is estimated that the maximum potential volume of rainwater reuse for an apartment or villa would be approximately 79 L/EP/day out of a total water demand of 228L/EP/day. This 103L/EP/day includes the estimated rate of water consumption for toilets (30L/EP/day), laundry (25L/EP/day), garden watering (40L/EP/day) and other external use (8L/EP/day). N-B016 Page 75
78 Water Cycle Management Report Great Keppel Island Resort Revitalisation Plan Notwithstanding, the extent of rainwater use also depends on the availability of stored rainwater. The availability of stored rainfall depends on the amount of rainwater that can be collected, which depends primarily on the amount of rainfall, the roof area available for collection and the storage capacity of the rainwater tanks. During the design stage of the Project, the viability of increased rainwater reuse for apartments and villas will be investigated. This would involve UV disinfection of the potable use component. It is estimated that 100% of the demand for the apartments and villas would be available for the months of December to June inclusive and, in median rainfall years, up to 50% or more in the months of July to November inclusive. Tables 8.1 and 8.2 provide an estimate of the proportion of the total water demand for a 1 bedroom apartment and a 2 or 3 bedroom apartment or villa with water saving devices that could reasonably be met by rainwater reuse assuming a reasonable amount of rainwater tank storage is provided (not less than the minimum of 1,500 L/ toilet pan as per QDC). The rainwater reuse will be confirmed by detailed modelling in the final design stage of the project. TABLE 8.1: Estimated Water Supply - Average Daily Demand 1 Bedroom Apartment (2.2 EP) - Water Saving Fixtures and Rainwater (RW) Reuse Water Use Water Demand Water Saving Devices + Rainwater (RW) Reuse L/EP/day (External Supply) L/hh/day (@2.2 EP) (External Supply) L/EP/day (RW Reuse) L/hh/day (@2.2 EP) (RW Reuse) Drinking/ Cooking Bathroom Toilets 6 (1) (1) 53 Laundry 5 (1) (1) 44 Hot Water Subtotal (Internal) Garden watering 43 (2) 43 (2) Other (hosing down, boat washing 10 (2) 10 (2) etc) Subtotal (External) Subtotal (Internal & External) (3) Total / 2.2 EP/hh External Supply 160 Rainwater Reuse 68 Total Water Demand/ EP 228 L/EP/d Notes: 1. Assumes 80% from rainwater, 20% from external supply. 2. Assumes 50% from rainwater, 50% from external supply. Allows for 40m 2 garden area per apartment at average irrigation rate of 30 mm/week for 26 weeks/year. 3. At median 950 mm rainfall/ year, requires approx 58m 2 roof area (58m 2 x 950 mm/year / 365 = 150 L). TABLE 8.2: Estimated Water Supply - Average Daily Demand 2 or 3 Bedroom Apartment or Villa (2.5 EP) - Water Saving Fixtures and Rainwater (RW) Reuse Water Use Water Demand Water Saving Devices + Rainwater (RW) Reuse L/EP/day (external supply) L/hh/day (@2.5 EP/hh (external supply) Drinking/ Cooking L/EP/day (RW Reuse) L/hh/day (@2.5 EP/hh) (RW Reuse) Bathroom Toilets 6 (1) (1) 60 Laundry 5 (1) (1) 50 Hot Water Subtotal (Internal) N-B016 Page 76
79 Water Cycle Management Report Great Keppel Island Resort Revitalisation Plan Water Demand Water Saving Devices + Rainwater (RW) Reuse Water Use L/EP/day L/hh/day L/EP/day L/hh/day (external supply) (@2.5 EP/hh (RW Reuse) (@2.5 EP/hh) (external supply) (RW Reuse) Garden watering 48 (2) 48 (2) Other (hosing down, boat washing 12 (2) 12 (2) etc) Subtotal (External) Subtotal (Internal & External) (3) Total / 2.5 EP/hh External Supply 160 RW Reuse Supply 68 Total Water Demand/ EP 228 L/EP/d Notes: 1. Assumes 80% from rainwater, 20% from external supply. 2. Assumes 50% from rainwater, 50% from external supply. Allows for approximately 45m 2 garden area per apartment at average irrigation rate of 30 mm/week for 26 weeks/year. 3. At median 950 mm rainfall/ year, requires approx 65m 2 roof area (65m 2 x 950 mm/year / 365 = 170 L). Based on the above, it is estimated that approximately 68 L/EP/day or about 30% of total water demand for apartments and villas is likely to be met by rainwater reuse. This compares to a total potential rainwater reuse of 103 L/EP/day that could be achieved if sufficient rainfall, tank storage capacity and roof area was available to ensure enough rainwater was stored and available to meet demand throughout the year. For the other resort facilities, such as the hotel and retail / commercial components, which have limited roof area for rainwater collection relative to the numbers of occupants, it has been assumed that only approximately 28 L/EP/day or about 12% of total water demand is likely to be met by rainwater reuse. As the level of rainwater use depends largely on the availability of rainwater, it has also been assumed in the water balance calculations, that during lower rainfall months (i.e. July through to November), rainwater reuse for the apartments and villas may also be approximately 28 L/EP/day. Rainwater collected from roof areas of individual buildings / facilities will be stored in on-site tanks adjacent to the collection location. Rainwater tank storage will be plumbed back into the buildings / facilities for use in toilets and washing machines as well as connection to external hose cocks for rainwater use in garden watering and other external use (e.g. Hosing down of hardscape, boat washing). It is estimated that in an average rainfall year, approximately 35,000 kl/annum of rainwater could be collected from roof areas. This equates to an average of 2,916 kl/month or within the range between 1,388 kl/month during August up to 6,521 kl/month during January. Notwithstanding the variability, this rainwater reuse for non-potable purposes will significantly reduce the total volume of water required from the mainland supply. Although rainwater can also be used for potable purposes (e.g. drinking water) with only minor treatment (e.g. disinfection), at this stage it has been estimated based on roof areas available for collection and provision of a reasonable volume of storage, that sufficient rainwater supply for non-potable purposes only will be available. However, with additional storage and collection from an increased roof area, it may be possible to collect additional rainwater that may justify the installation of treatment systems to enable reuse of collected rainwater for potable uses, or alternatively, to extend the use of the collected roof water for non-potable uses. For the purpose of this water balance, a conservative approach to sourcing N-B016 Page 77
80 Water Cycle Management Report Great Keppel Island Resort Revitalisation Plan rainwater supplies has been adopted to ensure the capacity of the mainland connection required is not undersized Treated effluent Treated effluent produced from treatment of sewage effluent at the Island-based WWTPs will be used as the primary source of water supply for irrigation of the golf course. Although not expected, any excess recycled wastewater (if available) would be used for irrigation of other landscaped areas. Although the estimated wastewater flow (ADWF) for the GKI Resort Revitalisation Plan is 180 L/EP/day, to account for losses in the treatment process (e.g. water content in sludge), it has been conservatively assumed for the purpose of the water balance, that only about 95% or 171 L/EP/day of wastewater influent to the WWTP will be discharged from the WWTP as recycled water available for reuse. As such, during peak occupancy in January, the average daily volume of recycled water available is estimated to be approximately 641 kl/day. The daily volume of recycled water available on average over a year is estimated to be approximately 370 kl/day. It is estimated that up to 135,000 kl/annum of recycled water may be available for irrigation of the golf course. This equates to an average of about 11,250 kl/month or within the range between 5,668 kl/month during May up to 19,879 kl/month during January Harvested Stormwater (Golf Course) Harvested stormwater runoff from the golf course will be used as a supplementary source of water supply for irrigation of the golf course and other landscaped areas. Harvested stormwater runoff from the golf course will be collected in a series of ponds incorporated into the golf course and stored for reuse. It is estimated the amount of stormwater runoff collected could be up to approximately 43,000 kl/annum. This equates to an average of 3,853kL/month or within the range between 200 kl/month during September, which is characterised by very low rainfall and 7,010 kl/month during March, which is characterised by high rainfall on average. Actual quantities harvested will depend on the grading of the golf course and thus the extent of catchment area draining into the golf course ponds. These figures will need to be assessed in detail during the design stage to confirm the practicality of such runoff being collected and reused in the irrigation system. In addition to providing an alternative source of water to reduce demand from Council s potable water supply, harvesting of stormwater from the golf course will also enable runoff from the golf course to be monitored and where necessary, treated, prior to release to downstream waterways. Stormwater harvesting ponds will therefore be multi-purpose serving as water features enhancing the amenity of the golf course and surrounding villas while also providing a source of irrigation water supply and stormwater quality improvement. N-B016 Page 78
81 Water Cycle Management Report Great Keppel Island Resort Revitalisation Plan Harvested Stormwater (Other Areas) Harvested stormwater runoff from resort hardstand areas may be used as a source of water supply for irrigation of landscaping and washdown of hardscape areas around the resort, adjacent to areas of collection. During an average rainfall year, it is estimated that approximately 10,500 kl/annum could potentially be harvested from this source. This equates to an average of 875 kl/month or within the range between 200 kl/month during September, which is characterised by very low rainfall and up to 1,805 kl/month during March, which is characterised by high rainfall on average. The harvesting of stormwater from these areas will be assessed in detail during the design stage. Depending upon the practicalities and economics, it may be more beneficial to collect additional rainwater from roof water collection via larger storage tanks Mainland Water Supply Connection to Council s mainland water supply provides a reliable, flexible and secure high-quality water source for the GKI Resort Revitalisation Plan. Although a mainland connection has the potential to supply 100% of the Project s water demands, this approach would not be consistent with the sustainability objectives of the GKI Resort Revitalisation Plan, which aim to maximise water use efficiency and use of alternative water supplies for non-potable purposes to reduce pressure on limited water resources. As such, the mainland water supply connection will provide 100% of the total potable water demand for the Project but will only be used to supplement other available water supplies for non-potable purposes as described above. Potable water sourced from Rockhampton Regional Council s water treatment facilities on the mainland will therefore be used as the sole source of water supply for potable purposes such as drinking water, cooking and showers. The total volume of water derived from this source will depend on demand but is expected to range between an average of approximately 1,275 kl/day and a maximum peak of 2,270 kl/day, including water required for potable and non-potable purposes. Of this volume, on average approximately 397 kl/day (average throughout the year) to 645kL/day (average per day in peak demand month of January) will be required for internal purposes while approximately 494 kl/day (average throughout the year) to 1,436 kl/day (average per day in peak demand month of November) will be required for external purposes. Advice from Rockhampton Regional Council indicates that sufficient water is available from their facilities to meet the above demands projected for the GKI Resort Revitalisation Plan. However access and usage charges will apply. 8.2 AVERAGE DEMAND & PEAKING FACTORS The following Tables 8.3, 8.4 and 8.5 provide an assessment of average and peak water demands relative to the proportion of demand that is likely to be offset by alternative sources of water such as rainwater, harvested stormwater and recycled water as described above. This enables the total amount of water required from Council s mainland water supply network to be estimated. N-B016 Page 79
82 Water Cycle Management Report Great Keppel Island Resort Revitalisation Plan TABLE 8.3: Average Annual Water Demand Estimated Water Demand 1 Internal External Average Water Demand 493 kl/day 1,391 kl/day Less: Offset from collected rainwater reuse for toilets etc. (96 kl/day) Less: Offset from use of collected rainwater, harvested (513 kl/day) stormwater and recycled water for irrigation of the golf course and other landscaped areas. Subtotal 397 kl/day 878 kl/day Total Mains Water Requirement Annual Average / Day (= flow over 24 hours) 1,275 kl/day (=14.8 L/sec) Note: 1. Average over 12 months based on total water usage over 12 months with average occupancy from Appendix E - Water Balance Spreadsheets. TABLE 8.4: Peak Occupancy - Monthly Water Demand Estimated Water Demand for January 1 Internal External Average Water Demand for January 855 kl/day 1,426 kl/day Less: Offset from collected rainwater reuse for toilets etc. (210 kl/day) Less: Offset from use of collected rainwater, harvested (932 kl/day) stormwater and recycled water for irrigation of the golf course and other landscaped areas. Subtotal 645 kl/day 494 kl/day Internal Peak Day Water Demand (1.5 x Average) External Peak Day Water Demand (1.1 x Average) Total Mains Water Peak Day Requirement for January (= flow over 24 hours) 968 kl/day 543 kl/day 1,511 kl/day (=17.5 L/sec) Note: 1. Peak Occupancy occurs in January with typical occupancies of 98% for the Hotel, Villas & Apartments and other facilities. Internal water demand is at its highest during this month, but total water demand is not at its highest as rainfall and availability of recycled water for irrigation reduce the demand for external irrigation water supplies. TABLE 8.5: Peak Monthly Water Demand Estimated Water Demand for November 1 Internal External Average Water Demand for November 527 kl/day 1,942 kl/day Less: Offset from collected rainwater reuse for toilets etc. (66 kl/day) Less: Offset from use of collected rainwater, harvested (506 kl/day) stormwater and recycled water for irrigation of the golf course and other landscaped areas. Subtotal 461 kl/day 1,436 kl/day Internal Peak Day Water Demand (1.5 x Average) 691 kl/day External Peak Day Water Demand (1.1 x Average) 1,579 kl/day Total Mains Water Peak Day Requirement for November (= flow over 24 hours) 2270 kl/day (= 26.3 L/sec) Note: 1. Peak Monthly Water Demand occurs in November. Although typical occupancies are less than in January at only about 95% occupancy for the Hotel, 65% for Villas & Apartments and other facilities, total water demand is at its highest due to the demand for irrigation water supplies at the end of the typical dry season. N-B016 Page 80
83 Water Cycle Management Report Great Keppel Island Resort Revitalisation Plan While it is unlikely that the peak occupancy will coincide with peak landscaping use, it can be seen from the above tables that such a situation would give rise to a total water demand of 2,547 kl/day based on a peak internal water demand of 968 kl/day (from January) and a peak external water demand of 1,579 kl/day (from November). Although water demand calculations will need to be determined at the detailed design stage, for the purpose of this assessment it is considered appropriate that the maximum potential peak (i.e. 2,547 kl/day or 29.5 L/sec over 24 hours) be adopted for sizing of critical water supply infrastructure such as the mainland supply connection. This approach to sizing of the mainland connection will also ensure sufficient capacity is available to support the high early water requirements associated with establishment of the golf course during Stages 2 and 3 (i.e. over 2014 and 2015), which coincides with relatively low recycled water production in the early stages of the Project. TABLE 8.6: Per Capita Demand and Peaking Factor Comparison Source Reference Average Daily Demand Peaking Factor: Mean Day Maximum Month Peaking Factor: Maximum Day Maximum Month Livingstone Shire Council (LSC) Guidelines Median Value from SSI Report 250 Adopted Values for GKI Resort Revitalisation Plan Note: L/EP/day x AD L/EP/day x AD L/EP/day (internal) 220 (external) 1.2 *(1) *(2) Taking the peak month occupancy in Table 8.6 and average demand in Table 8.5 gives 1511 kl/day / 1275 kl/day = Taking the peak water usage month in Table 8.7 and average demand in Table 8.5 gives 2270 kl/day / 1275 kl/day = While these figures are less than the peaking factors from the former LSC guidelines, the very large water demand for the golf course has a large influence. Due to the fluctuating population typically expected for tourist resorts, the mean-day-maximum-month demand and maximum-day demand are expected to be higher than the peaking factors indicated in the former Livingstone Shire Council Guidelines. As indicated in the notes above, the high water demand for the golf course has a significant influence. Also, if the mainland connection is finally designed for the peak internal water demand of 968 kl/day (from January) and the peak external water demand of 1,579 kl/day (from November) resulting in a total potential peak demand of 2,547 kl/day, then the peaking factor will be 2,547 / 1,275 = SUMMARY Figure 8.1 illustrates the proportion of total water demand that can be met by the above water supply sources for the following scenarios: Annual Average Water Demand; Peak Occupancy (Internal) Water Demand Month (January); and N-B016 Page 81
84 Water Cycle Management Report Great Keppel Island Resort Revitalisation Plan Peak Irrigation (External) Water Demand Month (November). This graph illustrates that: Rainwater reuse contributes between 3% and 9% of total water demand; Treated effluent reuse contributes between 16% and 28% of total water demand; and Harvested stormwater contributes between 4% and 13% of total water demand. Water derived from the mainland connection to Rockhampton Regional Council s water supply system will therefore be required to supply approximately 50% to 77% of the total water demand for this project on average Volume (kl/day) Mainland Water Supply Recycled Water Reuse Harvested Stormwater Reuse 0 Annual Average Peak Occupancy Month - January (Peak Internal Water Demand) Peak Irrigation Month - November (Peak External Water Demand) Rainwater Reuse Average Daily Water Demand FIGURE 8.1: Summary of Water Supply Sources Relative to Water Demand 8.4 STAGING The proposed staging of infrastructure for the GKI Resort Revitalisation Plan is summarised as follows: TABLE 8.7: Summary of Proposed Staging Transport Infrastructure: Stage 1 Stage 1 Stage 1 Stage 1 Marina Facility Ferry Terminal Barge Facility Runway & Airport Terminal Mid 2012 to end 2013 Mid 2012 to end 2013 Mid 2012 to end 2013 Mid 2012 to end 2013 N-B016 Page 82
85 Water Cycle Management Report Great Keppel Island Resort Revitalisation Plan Stage 1 8 Roads Stage 1-8 Public Walkways/ Bicycle Tracks Services Infrastructure: Stage 1 Stage 1 Stage 1-7 Social Infrastructure: Stage 2 9 Stage 2 Stage 2 6 Stage1 Tourism Infrastructure: Stage 1 Stage 1 Stage 1 Stage 2 Stage 3 Stage 2-10 Golf Course: Stage 2 3 Stage 3 Power Supply to the Island Water Supply to the Island Wastewater Treatment Facilities Landscaping Sport & Recreation Oval Environmental Protection Research Centre/ Police Centre Fisherman s Beach Hotel & Spa Marina Retail Precinct Apartments St 1 (150) Apartments St 2 (75) Apartments St 3 (75) Villas Stage 1 to 10 (75 each) Golf Course Golf Course Facility Start 2013 to mid 2022 Start 2013 to mid 2022 Mid 2012 to end 2013 Mid 2012 to end 2013 Start 2013 to mid 2022 Start 2014 to end 2022 Start 2014 to mid 2014 Start 2014 to mid 2018 Early 2013 to late 2013 Mid 2012 to end 2013 Mid 2012 to end 2013 Mid 2012 to end 2013 Start 2014 to end 2014 Start 2015 to end 2015 Start 2104 to end 2023 Start 2014 to end 2015 Early 2015 to end 2015 The following table outlines the growth in the volume of water required from the mainland water supply and the volume of recycled water available for irrigation based on the proposed staging. TABLE 8.8: Expected Growth in Annual Water Demand and Treated effluent Availability based on Proposed Staging Stage / Completion By EP/ Stage Total EP Projected Annual Mains Water Demand 1 (ML/year) Cumulative Internal External Total Available Treated effluent 2 Cum. EP x 54.4% Stage 1 / by end Stage 2 / by mid Stage 3 / by end Stage 4 / by end Stage 5 / by end Stage 6 / by end Stage 7 / by end Stage 8 / by end Stage 9 / by end Stage 10 / by end Stage 11 / by end Note: 1. Demand is after completion of relevant stage with: Internal water demand prorated based average 397kL/day (from mains supply after rainwater reuse) from Table 8.3 x (365 / 1000) x cumulative EP / total 3,973 EP for completed Project. ML/ year N-B016 Page 83
86 Water Cycle Management Report Great Keppel Island Resort Revitalisation Plan External water demand based on average 878kL/day (after stormwater reuse and recycled water reuse) from Table 8.5 after Stage 3 with completion of golf course. Nominal allowances after Stages 1 and 2 for resort and marina landscaping etc. 2. Available effluent is based on 171 L/EP/day x (365 / 10 6 ) x cumulative EP x 54.4%. The 54.4 % factor is used as this is the average EP x Occupancy of 2,160 (from Appendix E - Water Balance Summary Spreadsheet) for the completed Project (2160 / 3973 = 54.4%). N-B016 Page 84
87 Water Cycle Management Report Great Keppel Island Resort Revitalisation Plan 9. WATER SUPPLY SCHEME Based on consideration of the available options as discussed in section 6.1, the water supply scheme proposed for the GKI Resort Revitalisation Plan is likely to consist of: 9.1 CONSTRUCTION (STAGE 1) Water supply for Stage 1 construction will be sourced from two (2) production bores installed within the Long Beach Aquifer. These bores will only be operational for a short period of time whilst the mains supply is brought across from the mainland. These bores will need to be equipped, possibly with solar operated pumping systems. The maximum continuous extraction rate per production bore is 50 kl/day (Douglas Partners, 2011), or a combined total of 100 kl/day for the aquifer. Stage 1 construction water supply is estimated at: 5 ML/annum for construction puposes. Allowing for, conservatively 250 working days this would give an average of 20 kl/day and, with a peaking factor of 2, a peak day of 40 kl/day; and, Up to 50 kl/day for domestic purposes for construction workers based on approximately 350 EP at a maximum demand of 150 L/EP/day (say, 250 EP for up to 250 construction workers in facilities on the Island 40 EP for messing facilities and 60 EP for up to 200 workers ferried to the Island each day). This is based on a maximum of 450 workers in Strage 1 as outlined in the Construction Report. The total estimated Stage 1 construction water demand is thus in the order of 70 kl/day (average) and 90 kl/day (peak). This may also be offset by rainwater collection, effluent reuse and stormwater harvesting. With a Stage 1 construction water supply demand of less than 100 kl/day estimated as outlined above, the existing production bores within the Long Beach Aquifer are expected to provide adequate water supply to meet the full demand for Stage 1 of construction. Construction water requirements are discussed in more detail in the Construction Report. 9.2 OPERATION & CONSTRUCTION (POST-STAGE 1) The proposed water supply scheme for the GKI Resort Revitalisation Plan has been designed to maximise water use efficiency and minimise pressure on mainland potable water supplies through: Installation of water efficient fixtures within all resort facilities; In accordance with the Queensland Development Code, collected rainwater will be used as the primary water supply for toilets, laundry and landscaping needs adjacent to buildings; Reuse of 100% of all recycled water produced by the Island-based WWTP in most years for irrigation of the golf course and possibly other landscaped areas where excess supplies are available, with less than 1% of recycled water produced over a 50 year period likely to be discharged to the ocean; and N-B016 Page 85
88 Water Cycle Management Report Great Keppel Island Resort Revitalisation Plan Harvesting of stormwater runoff from the golf course and possibly other areas around the resort where practicable, to supplement irrigation water supplies from other sources. At this stage, the proposed water supply scheme has not included estimated demand for other existing private development on the Island. However, consolidation of delivery of water supply services across the Island may provide a number of benefits, including providing greater reliability of supply in terms of quality and quantity of water available to existing residents and commercial operators. Given the relatively small water demands associated with existing development, it is considered feasible for existing development to be incorporated into the water supply scheme for the GKI Resort Revitalisation Plan without any significant modification of the proposed scheme. However, the implications for design and sizing of water supply, storage and distribution should private development be included would need to be confirmed at the detailed design stage along with negotiations between the relevant parties in relation to funding of the infrastructure and ongoing supply costs. The design of the water supply system will incorporate the following features: A 16km water main will be installed within the Utility Services Corridor to connect water supply infrastructure on GKI with Rockhampton Regional Council s existing water supply infrastructure located near the Scenic Highway at Emu Park on the mainland; Storage tank (to receive the mainland supply, incorporating disinfection system) and pumps will be installed adjacent to the Marina Precinct to pump to the high level water storage tanks described below; Two (2) potable water reticulation systems are proposed, including one servicing the Fisherman s Beach and Marina Precincts and the other servicing the Clam Bay Precinct. Both systems are proposed to be serviced by high-level water storage tanks fed by trunk delivery mains from the mainland supply via tank and pumps near the Marina Precinct. Some higher elevation accommodation facilities may require small booster pumps to deliver reticulated water supply; and, Potable water reticulation will be installed to service all resort accommodation, commercial and retail facilities, along with some landscaped areas such as the golf course to supplement irrigation supplies. A schematic outline of the water supply scheme is shown in Figure 9.1 below and a preliminary layout plan is shown in Appendix F Water Supply Scheme Layout. N-B016 Page 86

 WATER")

 FIGURE 9.")
89 Water Cycle Management Report Great Keppel Island Resort Revitalisation Plan RAINWATER TANKS ECO-TOURISM VILLAS Non-Potable Water Supplied from Rainwater Tanks Tanks topped-up by Mainland Supply MAINLAND SUPPLY (Treated Water Supply) WATER RESERVOIR ECO-TOURISM APARTMENTS RESORT FACILITIES STORMWATER CAPTURE TREATED EFFLUENT Wastewater treated to Class A+ equivalent standard GOLF COURSE IRRIGATION LANDSCAPE IRRIGATION (if effluent available) FIGURE 9.1: GKI Resort Revitalisation Plan - Water Supply Schematic N-B016 Page 87
90 Water Cycle Management Report Great Keppel Island Resort Revitalisation Plan Water Supply Source Sources of water supplies required for operation and remaining stages of construction after Stage 1 will comprise the following: Potable Water Supply All required potable water (i.e. drinking water) supply will be derived from Rockhampton Regional Council s municipal water supply scheme on the mainland via a new water main to be incorporated within the Utility Services Corridor; Non-Potable Internal Water Supply Primary water supply for non potable uses to toilets and laundries within all facilities will be derived from captured rainwater via roof runoff collected and stored in tanks and pumped back to the relevant fixtures. The capture and reuse of rainwater is in accordance with the Queensland Development Code. Where necessary, rainwater supply to these fixtures will be supplemented by top up from the main potable supply in accordance with the Queensland Development Code. Non-Potable External Water Supply Water supply for irrigation purposes will be provided from the following sources, in order of priority, and subject to availability: o o o o o Rainwater captured and stored from roof runoff to all facilities to be used for irrigation purposes adjacent to the respective facilities; Treated effluent derived from the Island-based WWTP(s) will provide the primary water supply for irrigation of the golf course along with irrigation of other landscaped areas where excess supply is available; Harvested stormwater runoff captured within the purpose-designed and built pond system incorporated into the golf course will be used to supplement recycled water supplies for irrigation of the golf course; Additional purpose-designed and built stormwater harvesting systems may also be installed in other areas around the resort (subject to feasibility, final design and availability of sufficient water); and Any additional requirements for irrigation water supply, particularly for the golf course, would be sourced from the potable water supply via the mainland connection. Emergency Water Supply In the event of a disruption to the potable water supply connection to the mainland the following contingency strategy is proposed: Stored potable water in reservoirs on the Island will be preserved by restricting water usage from this supply to essential purposes only (i.e. domestic use only). Assuming reservoirs are N-B016 Page 88
91 Water Cycle Management Report Great Keppel Island Resort Revitalisation Plan full and allowing for dedicated fire storage, at least 3 days storage at peak day demand of 968kL/day and at least 7 days storage at average day demand of 397kL/day would be available for domestic uses. With water restrictions in place, the number of days of supply should be able to be significantly extended; Suspend use of mainland water supply for irrigation and limit irrigation to use of recycled water and harvested stormwater; If required, arrange for additional potable water supplies to be transported by barge across from the mainland; and, Undertake remedial repairs to the mainland water supply connection. In the event of an extended disruption to the mainland water supply connection, consideration may need to be given to reducing guest occupancy and staffing to ensure that adequate water is available Treatment Standard DERM s Planning Guidelines for Water and Sewerage states that where there is a reticulated drinking water supply, water of drinking water quality should be used for human consumption, food preparation, utensil washing, oral hygiene and bathing (AS/NZS 3500, AS/NZS 4020, WSAA, 2002, Water Supply Code of Australia). As such, all potable water supplies to the GKI Resort Revitalisation Plan will be required to comply with the Australian Drinking Water Guidelines (NHMRC & NRMMC, 2004). In addition to the above, all water used for non-potable purposes will be monitored to ensure it is fit for purpose so as to minimise potential environmental and public health risks Treatment Process Potable water supply for the GKI Resort Revitalisation Plan will be sourced from Rockhampton Regional Council s municipal water supply system and will therefore comply with the Australian Drinking Water Guidelines at the source. However, due to the extended time that water will be stored within the 16km water main connection between the mainland and GKI, and within storage tanks on the Island disinfection by either chlorination or UV irradiation is likely to be required prior to the water entering the Island storage tanks to ensure bacterial levels comply with the Australian Drinking Water Guidelines at the point of supply. In order to minimise electricity consumption on the Island disinfection of the water supply by chlorination is preferred over the use UV irradiation, which requires high levels of ongoing energy inputs. The chlorination process would involve the supply of hypochlorite to the Island in the form of powder or solution and injection of a hypochlorite solution, by dosing pump, into the water supply adjacent to the high level water storage tanks. However, both systems would be reviewed in the final design stage. N-B016 Page 89
92 Water Cycle Management Report Great Keppel Island Resort Revitalisation Plan Storage Potable water storage on the Island will consist of the following: Storage tank (to receive the mainland supply) and pumps adjacent to the Marina Precinct to pump to high level water storage tanks; High level water storage tanks to serve the two (2) potable water reticulation systems: one for the Fisherman s Beach and Marina Precincts and the other for the Clam Bay Precinct. Both systems are proposed to be serviced by high-level water storage tanks fed by trunk delivery mains from the mainland supply via the tank and pumps adjacent to the Marina; The storage tank(s) for the Fisherman s Beach and Marina Precincts is likely to be in the order of 3 ML in size. This would allow for 0.36 ML of fire storage, as per section above, and around 3.5 days storage capacity at the January day peak domestic demand of 726 kl/day (75% of 968 kl/day) and around 8 days storage capacity at the annual average daily domestic demand of 298 kl/day (75% of 397 kl/day); and, The storage tank(s) for the Clam Bay Precincts is likely to be in the order of 1 ML in size. This would allow for 0.36 ML of fire storage, as per section above, and around 3.0 days storage capacity at the January day peak domestic demand of 242 kl/day (25% of 968 kl/day) and around 7 days storage capacity at the annual average daily domestic demand of 99 kl. Day (25% of 397 kl/day). Other water storage on the Island will include the following: Rainwater tanks associated with the collection and storage of roof water for reuse for nonpotable purposes (toilets, laundries, garden watering and washdown). Individual rainwater tanks will be provided for each apartment and villa (either proprietary above ground tanks or underground tanks built within the foundations under the buildings where space or amenity issues exist). Combined rainwater storage tanks will be provided for central core facilities including the hotel, as well as other commercial/ retail facilities such as the Marina Village, golf clubhouse and airport terminal; Underground or open surface storages for harvested stormwater. These could be open lined ponds, proprietary underground storage systems or purpose built underground tanks depending on space availability and amenity issues. Alternatively, if determined in final design to be more efficient and economic, larger tanks may be incorporated into the rainwater tanks to capture additional roof rainwater. This would generally be advantageous with roof rainwater being of higher quality than stormwater runoff from ground areas; Open lined storage ponds on the golf course for collection and reuse of stormwater runoff for irrigation purposes. These ponds will incorporate stormwater quality improvement to treat stormwater runoff from the golf course prior to discharge of captured stormwater not required for irrigation; and, N-B016 Page 90
93 Water Cycle Management Report Great Keppel Island Resort Revitalisation Plan An open lined storage pond for recycled water to provide balancing storage associated with the reuse of recycled water for irrigation of the golf course (and other areas if required). This pond system has been sized to balance the storage of inflow recycled water produced by the WWTP with the volume of water required for irrigation, such that recycled water will be stored during wet weather when soil conditions preclude irrigation Distribution Potable water distribution will consist of the following: Two (2) potable water reticulation systems are proposed, including one servicing the Fisherman s Beach and Marina Precincts and the other servicing the Clam Bay Precinct; Both systems are proposed to be serviced by high-level water storage tanks fed by trunk delivery mains from the mainland supply via tank and pumps near the Marina Precinct. Some higher elevation accommodation facilities may require small booster pumps to deliver reticulated water supply; and Potable water reticulation will be installed to service all resort accommodation, commercial and retail facilities, along with some landscaped areas such as the golf course to supplement irrigation supplies. N-B016 Page 91
94 10. WASTEWATER TREATMENT & REUSE SCHEME 10.1 CONSTRUCTION Water Cycle Management Report Great Keppel Island Resort Revitalisation Plan Although it is intended that the existing wastewater treatment plant that serviced the former GKI resort will be demolished and replaced with a new facility, the existing treatment plant shall temporarily be recommissioned to treat wastewater during the initial phases of construction prior to construction of the new treatment plant, which is scheduled to occur during Stage 1. Prior to being re-commissioned, the existing wastewater treatment plant will be refurbished to ensure it is capable of effectively treating sewage effluent generated during construction to the required standard to comply with the conditions of Licence No. CR0061, which it is understood remains current. The volume of sewage effluent expected to be generated during Stage 1 of construction prior to commissioning of the first stage of the new WWTP(s) is estimated to be up to approximately 50 kl/day for 350 EP at a maximum of 150 L/EP/day (say, 250 EP for up to 250 construction workers in facilities on the Island, 40 EP for messing facilities and 60 EP for up to 200 workers ferried to the Island each day). This is based on a maximum of 450 workers in Stage 1 as outlined in the Construction Report. As outlined in section 5.2 above, this is within the capacity and licence limits specified for the existing wastewater treatment plant. Treated effluent generated during Stage 1 of construction will be discharged via irrigation of a predesignated area, likely to include the area of the former golf course previously used for irrigation of recycled water, in accordance with the conditions of the existing environmental licence. Alternatively, it may also be partly used to assist with irrigation of disturbed areas of the new airstrip to assist with turf/ landscaping establishment OPERATION & CONSTRUCTION (POST-STAGE 1) Based on consideration of relevant options, the proposed wastewater treatment and reuse scheme for GKI Resort Revitalisation will likely consist of: A wastewater collection system comprised of: o o o A combination of traditional gravity sewers, but using the NuSewer or similar system to minimise groundwater infiltration (due to the high water table on the Island) and pumped systems where appropriate; A specialist proprietary pump out system for the marina berths; and Pumping stations for transfer of the wastewater, after collection, to the WWTP(s). Either two (2) WWTPs, including one (1) WWTP servicing the Fisherman s Beach and Marina Precincts and one (1) WWTP servicing the Clam Bay Precinct OR a single WWTP servicing all precincts within the GKI Resort Revitalisation Plan; All wastewater will be treated to a standard consistent with the minimum water quality requirements specified for Municipal Use open spaces, sports grounds, golf courses, dust suppression, etc or unrestricted access and application under the Australian Water Quality N-B016 Page 92
95 Water Cycle Management Report Great Keppel Island Resort Revitalisation Plan Guidelines for Water Recycling: Managing Health and Environmental Risks (Phase 1) (ANZECC, 2006), with nutrient levels reduced to 20mg/L of Total Nitrogen and 7mg/L of Total Phosphorous; In most years, 100% of all wastewater generated by the GKI Resort Revitalisation Plan and treated at the Island-based WWTP(s) will be used for irrigation of the golf course and possibly other landscaped areas around the resort; Wet weather storage ponds with a capacity of at least 44ML (including a 7ML storage buffer to account for potential increase in rainfall intensity due to climate change) will be provided, most likely in the form of open ponds incorporated into the golf course; and During extreme wet weather events, when soil conditions are unsuitable for irrigation and wet weather storage ponds reach capacity, a small proportion of recycled water may be discharged via an ocean outfall extending from Long Beach. Current modelling based on a 37 ML storage indicates that overtopping of the wet weather storage and subsequent ocean discharge may occur on average, once every 10 years. However, provision of an additional 20% storage capacity to account for climate change is likely to reduce this frequency further, particularly during the early years of the scheme. A schematic outline of the wastewater collection, treatment and reuse scheme is shown in Figure 10.1 below and a preliminary layout plan is shown in Appendix G Wastewater Scheme Layout. N-B016 Page 93
 STORMWATER CAPTURE FB Precinct Treated Effluent Holding Tank (unlikely to be required) CB Precinct Treated Effluent")
96 Water Cycle Management Report Great Keppel Island Resort Revitalisation Plan ECO-TOURISM VILLAS TOURISM APARTMENTS RESORT FACILITIES FISHERMAN S BEACH PRECINCT WWTP Wastewater Collected by Sewerage System CLAM BAY PRECINCT WWTP TREATED EFFLUENT WET WEATHER STORAGE PONDS (+44 ML) STORMWATER CAPTURE FB Precinct Treated Effluent Holding Tank (unlikely to be required) CB Precinct Treated Effluent Holding Tank (unlikely to be required) Discharge less than 1 in 10 years on average GOLF COURSE IRRIGATION LANDSCAPE IRRIGATION (if effluent available) OCEAN OUTFALL DIFFUSER FIGURE 10.1: Great Keppel Island Resort Revitalisation Plan - Wastewater Collection and Treated effluent Reuse Schematic N-B016 Page 94
97 Water Cycle Management Report Great Keppel Island Resort Revitalisation Plan Wastewater Collection Wastewater collection to deliver sewage from the generation source to the WWTP(s) is proposed as follows: Throughout the resort generally (unless listed below), a gravity system using NuSewers will be used due primarily to their lower infiltration rates compared to traditional sewers and the lower cost compared to a vacuum or pumped system. The NuSewers Design and Construction Specification, Queensland Urban Utilities, Sewerage Standards describes NuSewers as: NuSewers comprise fully welded PE pipes, fittings and maintenance shafts. The elimination of rubber ring joints will minimize groundwater infiltration and tree root intrusion reducing maintenance and sewage treatment costs. NuSewers are designed on the basis that inspection will be undertaken with CCTV equipment and blockages cleared using jet rodders. This approach allows the sewer alignment to include both horizontal and vertical curves minimising the number of maintenance access structures compared to a traditional sewer system. With NuSewers the majority of access structures will be PE maintenance shafts. However, manholes will be required for complex sewer junctions and at strategic locations for the removal of miscellaneous items that occasionally enter the sewer system. For Marina Apartments and any Apartments / Villas located on steep ground, either a NuSewer gravity system or individual unit grinder pump stations with small diameter common rising main following ground contours will be used. These individual units require less ground disturbance compared to traditional gravity sewers. These individual units will only be used as demand requires. For the Marina Berths, a specialised wastewater pump-out facility will be necessary within the Marina Precinct for the acceptance of wastewater pumped from berthed watercraft. New marina waste management facilities shall be provided in accordance with the Best Practice Guidelines for the Provision of Waste Reception Facilities at Ports, Marinas and Boat harbours in Australia and New Zealand (reference) and relevant legislation. In the event of power failure or equipment breakdown, the following contingency measures would apply within the collection system: The gravity sewer system would be unaffected up until the collection well of pumping stations; Any individual unit grinder pump stations (where installed to villas) would have a storage capacity within the pump collection well for at least 4 hours at ADWF. This would typically involve around 100 litres of storage within the collection well for each villa; Main pumping stations would be provided with: o 100% standby pumping capacity within the station to cover pump mechanical breakdown; N-B016 Page 95
98 Water Cycle Management Report Great Keppel Island Resort Revitalisation Plan o o o An alarm system to advise maintenance staff of power or mechanical failure; Capacity within the emergency back-up generator for the resort and / or provision (i.e. power bypass switch) within the pumping station to connect up an individual emergency generator brought to the pumping station to cover power failures; and Minimum of 2 hours storage capacity at ADWF within the pump station wet wells and contributing reticulation mains (and overflow storage if required with any overflow being returned to the wet well). Odour control within the collection system would be achieved by sealing of all manholes and pumping stations, thus containing any odours within the system Treatment Standard The proposed treatment standard has been determined in relation to the proposed uses of recycled water, which include: Irrigation of the golf course; Irrigation of other sporting fields and landscaped areas (where the availability of recycled water exceeds the sustainable irrigation requirements of the golf course); and Emergency discharge of recycled water during extreme wet weather events via ocean outfall. The Queensland Water Quality Guidelines for Treated effluent Schemes (DERM, 2008) does not specify any minimum water quality criteria for proposed recycled water uses such as irrigation of golf course, sporting fields and other landscaped areas. Rather, these Guidelines refer to various national and industry guidelines that could be used as a benchmark, including the Australian Guidelines for Water Recycling: Managing Health and Environmental Risks (Phase 1) (ANZECC, 2006) as well as various guidelines for use of recycled water for growing crops, dairy farming, beef cattle feedlots and piggeries, which are not relevant to the proposed scheme. Accordingly, consideration has been given to the recommended treatment processes, on-site controls and water quality objectives for recycled water used for purposes similar to the range of uses described above, as outlined in the Australian Guidelines for Water Recycling: Managing Health and Environmental Risks (Phase 1) (ANZECC, 2006). An extract from Table 3.8 of these Guidelines is provided in Table TABLE 10.1: Recommended Treatment & Water Quality Criteria for Municipal Uses 2 Log Reduction Targets Indicative Treatment Process Log Reductions Achievable by Treatment On-Site Preventative Measures Water Quality Objectives Municipal Use open spaces, sports grounds, golf courses, dust suppression, etc or unrestricted access and application Viruses = 5.0 Protozoa = 3.5 Bacteria = 4.0 Advanced treatment required such as: Secondary, Viruses = 5.0 Protozoa = 3.5 Bacteria = 4.0 No specific measures. To be determined on case-by-case basis. 2 ANZECC (2006) Australian Guidelines for Water Recycling: Managing Health and Environmental Risks (Phase 1) Table 3.8 N-B016 Page 96
99 Water Cycle Management Report Great Keppel Island Resort Revitalisation Plan Log Reduction Targets Indicative Treatment Process coagulation, filtration and disinfection Secondary, membrane filtration, UV light Log Reductions Achievable by Treatment On-Site Preventative Measures Water Quality Objectives Could include turbidity criteria for filtration, disinfectant Ct or dose (UV) Municipal Use with restricted access and application Viruses = 5.0 Protozoa = 3.5 Bacteria = 4.0 Secondary treatment with disinfection Viruses = Protozoa = 1.0 Bacteria = >6.0 Restrict public access during irrigation and one of the following: No access after irrigation, until dry (1-4 hours) Minimum 25-30m buffer to nearest point of public access Spray drift control (e.g. low-throw sprinklers, vegetation screening, anemometer switching E. coli <1 per 100mL BOD <20mg/L SS <30mg/L Disinfectant residual (e.g. minimum chlorine residual) or UV dose E. coli <100 per 100mL Municipal Use with enhanced restrictions on access and application Viruses = 5.0 Protozoa = 3.5 Bacteria = 4.0 Secondary treatment with >25 days lagoon detention or primary treatment with >50 days lagoon detention Secondary treatment Viruses = Protozoa = Bacteria = Viruses = Protozoa = Bacteria = Log reductions achieved by on-site preventative measures: Restrict public access during irrigation = 2.0 No access after irrigation, until dry (1-4 hours) = 1.0 Minimum 25-30m buffer to nearest point of public access = 1.0 Spray drift control = 1.0 Restrict public access during irrigation and combinations of the following: No access after irrigation, until dry (1-4 hours) Minimum 25-30m buffer to nearest point of public access Spray drift control (e.g. low-throw sprinklers, vegetation screening, anemometer BOD <20mg/L SS <30mg/L E. coli <1000 per 100mL N-B016 Page 97
100 Water Cycle Management Report Great Keppel Island Resort Revitalisation Plan Log Reduction Targets Indicative Treatment Process Log Reductions Achievable by Treatment On-Site Preventative Measures switching Log reductions achieved by on-site preventative measures: Water Quality Objectives Restrict public access during irrigation = 2.0 No access after irrigation, until dry (1-4 hours) = 1.0 Minimum 25-30m buffer to nearest point of public access = 1.0 Spray drift control = 1.0 In order to provide flexibility in irrigation scheduling and reduce potential risks to site users, it is proposed to adopt a standard of treatment generally consistent with that required for Municipal Use open spaces, sports grounds, golf courses, dust suppression, etc or unrestricted access and application. The above guidelines refer primarily to minimum recycled water quality criteria to protect public health. However, given the environmentally sensitive nature of GKI, it is also essential to ensure that recycled water used on the Island or discharged to the environment is treated to a suitable standard to adequately reduce potential environmental impacts. In particular, it is important to ensure that the level of nutrients such as nitrogen and phosphorous contained in recycled water, are compatible with the nutrient assimilation capacity of soils and plants within the irrigation areas. This will ensure maximum beneficial use of these essential nutrients whilst not resulting in excessive runoff or leaching of nutrients into surface or groundwater where such nutrients may result in eutrophication, possible algal blooms and subsequent de-oxygenation of waters that may impact on aquatic fauna. To determine appropriate nutrient limits for recycled water reused for irrigation on the Island modelling has been undertaken using the computer-based MEDLI (Model for Effluent Disposal using Land Irrigation) Version 1.30 program developed by the Department of Natural Resources & Mines. MEDLI is a DERM approved complex, daily time-step, hydrological and nutrient balance simulation model for effluent irrigation systems. The program incorporates historical climatic data for the locality, along with input parameters specific to each effluent irrigation system (i.e. effluent quality and quantity, land area, storage size, soil nutrient adsorption and vegetation nutrient uptake capacities) to assess the hydrological and nutrient balance of the system. The results of MEDLI modelling are discussed in more detail in section However, it is noted that the outcomes of the modelling indicate that irrigation of recycled water containing on average, 20 mg/l of nitrogen and 7 mg/l of phosphorous, will not result in any increase in nutrients in runoff or leaching from the irrigation area compared to modelling of existing conditions (i.e. no irrigation) within the proposed irrigation area. As recycled water may be discharged via an ocean outfall during extreme wet weather events when irrigation of the golf course and other landscaped areas is not required, consideration has also been given to the minimum water quality criteria for such discharges prescribed under section 135(4) of the N-B016 Page 98
101 Water Cycle Management Report Great Keppel Island Resort Revitalisation Plan Great Barrier Reef Marine Park Regulations These Regulations specify the following minimum effluent quality criteria for discharge of recycled water to the Great Barrier Reef Marine Park where no more than 5% of the total annual volume of effluent generated is discharged into the Marine Park: BOD5 = 20 mg/l (maximum); Suspended Solids = 30 mg/l (maximum); ph Range = ; Dissolved Oxygen = 2 mg/l (minimum); E.coli = <200 CFU/100mL (mean); E.coli = <1000 CFU/100mL (80th percentile); Total Oil and Grease = <10 mg/l (maximum); No visible slick or sign of oil or grease; and Effluent does not contain by-products of chlorine disinfection that may pollute water in a manner harmful to animals or plants in the Marine Park. In addition, GBRMPA s Policy for Sewage Discharges from Marine Outfalls to the Great Barrier Reef Marine Park (GBRMPA, 2005) indicates that the maximum load of Total Nitrogen and Total Phosphorous that can be discharged via a marine outfall into the Marine Park will be calculated based on tertiary equivalent nutrient concentrations of 5 mg/l for total nitrogen and 1 mg/l for total phosphorous. Based on the outcomes of MEDLI modelling, it is anticipated that emergency discharge via the ocean outfall will be required only about once every ten years on average. Averaged over the 53 year modelling period, the amount of recycled water discharged via the ocean outfall would equate to approximately 0.76 ML/year. Adopting a total nitrogen concentration of 20 mg/l and a total phosphorous concentration of 7 mg/l, this would result in the discharge of approximately 15.2 kg/year of nitrogen and 5.32 kg/year of phosphorous. In order to determine the maximum load of total nitrogen and total phosphorous that could be discharged via the ocean outfall in accordance with GBRMPA s Policy for Sewage Discharges from Marine Outfalls to the Great Barrier Reef Marine Park (GBRMPA, 2005), tertiary equivalent nutrient concentrations of 5mg/L for total nitrogen and 1mg/L for total phosphorous have been multiplied by the total amount of recycled water produced by the GKI Resort Revitalisation Plan which equates to approximately ML/year. On this basis, discharge of all recycled water generated by the project treated to a tertiary standard would result in the release of approximately kg/year of nitrogen and kg/year of phosphorous. As such, the total amount of nitrogen and phosphorous discharged assuming discharge only during extreme wet weather events (i.e. 1 in 10 years on average) at a concentration of 20 mg/l of total nitrogen and 7 mg/l of total phosphorous is less than 4% of the amount that would be released if all effluent generated by the GKI Resort Revitalisation Plan was treated to a tertiary standard of 5 mg/l of total nitrogen and 1 mg/l of total phosphorous and discharged via ocean outfall. N-B016 Page 99
102 Water Cycle Management Report Great Keppel Island Resort Revitalisation Plan On the basis of the above, it is proposed that all effluent generated by the GKI Resort Revitalisation Plan will be treated to comply with the minimum water quality criteria specified in Table TABLE 10.2: Proposed Minimum Treated effluent Quality Criteria Quality Characteristic Unit Release Limit Limit Type Monitoring Frequency E. coli cfu/100ml <1 (<10) Median (95 th percentile) Weekly 5-day Biological Oxygen Demand mg/l <20 Median Weekly Turbidity NTU <2 (<5) Median (Maximum) Continuous Suspended Solids mg/l <5 Median Weekly Total Dissolved Solids mg/l <1,000 Median Weekly ph Range Weekly Total Nitrogen mg/l <20 Median Monthly Total Phosphorous mg/l <7 Median Monthly Free Chlorine Residual 1 mg/l Range Continuous Note: 1. Only applies where chlorination is used for disinfection. Disinfection is not preferred where discharge to the ocean is likely to occur. The above standard of treatment is consistent with the specified water quality objectives for Municipal Use open spaces, sports grounds, golf courses, dust suppression, etc or unrestricted access and application as defined under the Australian Guidelines for Water Recycling: Managing Health and Environmental Risks (Phase 1) (ANZECC, 2006) and is considered to be suitable for the following recycled water reuse options: Irrigation of the golf course; Irrigation of other sporting fields and landscaped areas (where the availability of recycled water exceeds the sustainable irrigation requirements of the golf course); and, Emergency discharge of recycled water during extreme wet weather events via ocean outfall. It is anticipated that monitoring of recycled water quality will occur at the outlet of the WWTP(s) at the approximate frequencies listed in the Table 10.2 above to ensure recycled water quality achieves the above levels at discharge from the WWTP(s) Treatment Process Based on consideration of the available options as discussed in section 6.2, the preferred option for treatment of wastewater generated by the GKI Resort Revitalisation Plan is an Island-based WWTP(s). Treatment of wastewater on GKI may be undertaken using a single WWTP or multiple WWTPs. If two (2) wastewater treatment plants (WWTPs) are to be provided on the Island these would most likely be located as follows, subject to final design, plant selection and buffer zone requirements: A WWTP servicing the Marina Precinct and Fisherman s Beach Precinct (including marina facilities, hotel, apartments, villas, commercial / retail, airport terminal and staff accommodation) most likely located on the north eastern side of the airstrip within the vicinity of the facilities maintenance compound; and N-B016 Page 100
103 Water Cycle Management Report Great Keppel Island Resort Revitalisation Plan A WWTP servicing the Clam Bay Precinct most likely located to the north west of the golf course. If a single WWTP is to be provided on the Island this would most likely be located to the north west of the golf course, noting that this would be located in close proximity to the primary area of proposed recycled water irrigation. However, a site to the north west of the airport and near the maintenance facility would also be considered. This latter site would involve pumping of wastewater from the Clam Bay Precinct and then pumping of all effluent from the WWTP to the Golf Course storage pond. Another aspect to reviewed in the final design of the wastewater treatment facilities is the early completion of the Golf Course and associated facilities with villas in the Clam Bay Precinct not commencing until around 2017 according to the staging plans within the Construction Report. An option is to provide a temporary self contained package WWTP for the Golf Course facilities with effluent pumped to the storage pond. This temporary plant would then be removed from the Island once the villas came on line with the permanent connection to the main WWTP constructed. Selection of the preferred type of treatment system will need to take into account a range of factors including, but not limited to: The staging of the Project over 12 years (as summarised in section 8.4) and with the EP growth as indicated in Table 8.8 in that section; The variability of the hydraulic loading on the treatment system with the fluctuating occupancy over the year ranging (for the completed Project) from approximately 1,069EP to 3,750EP. The monthly variability of the hydraulic loading for the completed Project can be seen in Table 8.8 above; Potential for odour nuisance and requirements for buffer zones to prevent adverse impacts on the amenity of residential and tourist accommodation on the Island; and Ability to consistently achieve the high standard of treatment, including disinfection and nutrient removal, required to be fit for purpose for proposed recycled water reuse, to prevent potential public health impacts and to prevent contamination of groundwater aquifers, soils and water quality within the Great Barrier Reef Marine Park. A number of wastewater treatment processes and systems would be capable of achieving the required standard of treatment. Although the exact treatment process and system used will be determined at detailed design stage, one of the preferred options at this stage comprises a proprietary package treatment plant utilising membrane bio-reactor (MBR) or similar technology system. This type of system would incorporate: o Grit chambers/ screens to remove floating solid items and grit. Screened solids and grit would be collected and disposed of at a licensed landfill facility on the mainland; o Sedimentation/ sludge tanks contained within the package plant settled sludge directed to sludge digestion tanks (within the package plant), sludge removed, dewatered, dried and used for landscaping; N-B016 Page 101
104 Water Cycle Management Report Great Keppel Island Resort Revitalisation Plan o Liquid from sedimentation/ sludge processes is then passed through the bio-reactor membrane to remove suspended solids and solids returned to the sedimentation/ sludge tanks for re-processing; o Effluent passed through the bio-reactor membrane is then disinfected with UV to achieve an E. coli level of <1 cfu/100ml before being pumped to the wet weather storage pond(s) on the golf course; and o Treated effluent from the wet weather storage ponds is then irrigated across the golf course. Advantages and disadvantages of the above package plant system, compared to the other options assessed, are discussed in section 6.2. In the event of power failure or equipment breakdown, the following contingency measures would apply within the treatment system: As outlined in the Power and Commnications Report (AECOM 2011), there will be dedicated standby generator provision made for the WWTP(s). Primary power for the resort is also based on solar supply with the mainland power connection main as the next primary supply. Given the relatively high security of power supply for the WWTP(s), the risk of wastewater overflows is accordingly considered to be relatively low. Due to staging requirements and operational flexibility, treatment systems would involve duplication (or triplication) of treatment plant processes, thus allowing for one system to be out of service for short periods in the event of maintenance requirements (programmed maintenance being undertaken at low flow / low occupancy times) or emergency breakdown situations; and In the event of power failures, the package plants would be able to be designed to contain up to approximately 10 hours x ADWF within various components of the treatment plant and/ or within a separate bypass storage pond. After power is restored, the bypassed flow is then returned from the storage pond back through the package plant for treatment. The storage requirement (within the plant and/ or separate storage pond) would be 312 kl (10/ 24 hrs x 200 L/EP/day x occupancy). 10 hours storage should be more than sufficient time for maintenance staff to respond to system monitoring with warnings of overflows an any issues with the strating up of standby generators. In accordance with the DERM Guideline Framework for Managing Sewerage Infrastructure to Reduce Overflows & Environmental Impacts and noting the sensitive area of the Island within the GBMNP, there would be, as part of the contingency planning for the operation of the wastewater treatment: o o A 24/ 7 Emergency Response Plan incorporating remediation and clean up procedures investigation and improvement plans. Remediation and clean up in this case would be expected to mainly involve ensuring the return of any overflow from the storage pond and clean up of the storage pond area on completion; Due Diligence Practices in the design and operation including risk management principles to minimise the potential for overflows and environmental harm (including the features as outlined above, risk of overflows minimised with back up power generation), N-B016 Page 102
105 Water Cycle Management Report Great Keppel Island Resort Revitalisation Plan community exposure to overflows minimised with any overflow contained within the WWTP and associated overflow storage pond within the fenced WWTP compound; o Organisational management with clearly defined accountabilities within the maintenance hierarchy for the appropriate operational and maintenance aspects of the wastewater system, pumping stations, WWTP, back-up generators etc; and, o Reporting procedures as outlined. Odour issues are unlikely with a packaged plant such as MBR as the process components are effectively sealed within the plant. Odour issues may arise in the event of power failure when influent is diverted to temporary storage in open ponds adjacent to the plant. However, such events are expected to be rare with a number of treatment trains and back-up power being provided. Nevertheless, appropriate buffer distances should be provided between the WWTP and sensitive receivers to reduce the potential for odour nuisance Treated effluent Reuse Following consideration of the range of options available for reuse of recycled wastewater produced by the Island-based WWTP, the preferred reuse scheme consists of: Reuse of recycled water for irrigation primarily of the golf course, with any excess recycled water produced used for irrigation of other landscaped areas, preferably around the golf course villas to minimise the need for pumping recycled water across to the Fisherman s Beach Precinct; and During extreme wet weather events (i.e. 1 in 10 years on average), excess recycled wastewater may be discharged via an ocean outfall extending from Long Beach. As construction of the golf course will occur in Stage 2-3, commencing in 2014 or about 2 years after other components of the GKI Resort Revitalisation Plan, an alternative recycled water irrigation area will need to be provided in the early stages. It is anticipated that irrigation of recycled water to assist in establishing turf adjacent to the airstrip will occur during the early stages of the Project prior to construction of the golf course. Treated effluent may also be used in the early stages for irrigation within the turf nursery that is likely to be established to grow the turf required to construct the golf course. Although consideration was given to reuse of recycled water for other non-potable purposes within the resort (e.g. toilet flushing, washing machines, garden watering, washdown) through a dual reticulation system, this option was not considered preferable on the basis that: The volume of recycled water produced would achieve only limited reduction in demand for potable water supplies, given that non-potable water supply for toilet flushing, washing machines, garden watering, hardscape and boat washdown, will be derived from rainwater harvesting; The availability of recycled water will be highly variable due to the fluctuating occupancies and therefore generation of wastewater effluent associated with tourist facilities, and is therefore not considered to be a sufficiently reliable source of water for these types of non-potable purposes; In excess of 99% of recycled wastewater produced can be sustainably and beneficially reused for irrigation of the golf course thereby minimising the need to secure other water supply sources for this purpose; and N-B016 Page 103
106 Water Cycle Management Report Great Keppel Island Resort Revitalisation Plan Significant ground disturbance and ongoing pumping costs / energy consumption would be associated with the extensive recycled water distribution and storage system required for a dual reticulation scheme. Reuse of recycled water for irrigating landscaping, open spaces and sports fields has gained widespread use across Australia and other countries as a way to conserve valuable water resources. Given the limited availability of water resources on GKI and the relatively high irrigation water demands of the proposed golf course, the use of recycled wastewater to meet the irrigation demands for landscaping, and particularly the proposed golf course, is considered to comprise the most beneficial reuse for recycled wastewater produced from wastewater generated by the GKI Resort Revitalisation Plan. This view is supported by Technical Report 34 prepared for the CRC Reef Research Centre (Gallagher & Volker, 2004) with the statement referring to GBRMPA s sewage system requirements introduced in 1991, One of the principal strategies of the sewer management policy was encouragement to reuse effluent on the islands for irrigation of gardens, golf courses and other grasslands. Reuse of recycled wastewater for irrigation of the golf course and possibly other landscaped areas (where excess recycled water is available), not only reduces pressure on other water supply sources, but also enables the beneficial reuse of nutrients contained in the recycled wastewater to support plant growth within the irrigation area. Application of nutrients contained in recycled water to vegetation enables natural biological processes to be used to further reduce nitrogen and phosphorus components before potentially entering groundwater or surface water systems, rather than using chemical reaction processes within a treatment plant. Such chemical treatment processes typically require large inputs in terms of energy to achieve the levels of nutrient reduction that can be achieved by healthy vegetation. Application of nutrients contained in recycled water to vegetation also reduces the need to apply additional fertilisers, which are usually derived from synthetic or inorganic sources. While nutrients applied to the golf course and other landscaped areas are beneficial to plant growth within these areas, it is necessary to ensure that the amount of nutrients applied does not exceed the hydraulic and nutrient assimilation capacity of soils and plants within the irrigation area, otherwise nutrients may be leached into groundwater and ultimately surface water bodies. To determine the amount of nutrients contained in recycled water and the rate of application that can be sustainably applied to the irrigation area, a detailed water and nutrient balance has been undertaken as described in the following section. All recycled water irrigation will be undertaken in accordance with an approved irrigation management plan (refer to Appendix H - Preliminary Irrigation Management Plan) MEDLI MODELLING MEDLI Input Values To determine a sustainable strategy for application of recycled water for irrigation on the Island the computer-based MEDLI (Model for Effluent Disposal using Land Irrigation) Version 1.30 program developed by the former Department of Natural Resources & Mines was used. MEDLI is a DERM approved complex, daily time step, hydrological and nutrient balance simulation model for effluent irrigation systems. The program incorporates historical climatic data for the locality, along with input parameters specific to each effluent irrigation system (i.e. effluent quality and quantity, land area, N-B016 Page 104
107 Water Cycle Management Report Great Keppel Island Resort Revitalisation Plan storage size, soil nutrient adsorption and vegetation nutrient uptake capacities) to assess the hydrological and nutrient balance of the system. The objective of MEDLI modelling undertaken for this Project was to determine an appropriate standard of treatment, irrigation schedule, irrigation area and wet weather storage volume requirements to maximise the beneficial reuse of sewage effluent generated by the GKI Resort Revitalisation Plan without resulting in any adverse environmental or human health impacts. The MEDLI model simulates operation of the proposed irrigation system over a fifty-three (53) year period based on climatic data for the period between 1 January 1957 and 31 December Relevant inputs and outputs to the model are described in the following sections: Climate Fifty-three (53) years of historical climatic data has been compiled for GKI by DERM, including rainfall, pan evaporation, temperature and radiation data. A summary of average annual rainfall and pan evaporation data compiled for GKI over a fifty-three (53) year period is provided in Table 10.3 below. TABLE 10.3: Average Annual Rainfall & Pan Evaporation Percentile Totals Characteristics Average 10 th Percentile 50 th Percentile 90 th Percentile Rainfall (mm/year) 1, ,062 1,478 Pan Evaporation (mm/year) 1,848 1,715 1,837 1,997 Based on the above, it is estimated that an average rainfall deficit of 803mm/year may be expected to occur on GKI in a year characterised by average rainfall and evaporation. The minimum rainfall deficit that would be expected in a year of above average rainfall and below average evaporation would be 237 mm/year. The maximum rainfall deficit that would be expected in a year of below average rainfall and above average evaporation would be 1,309 mm/year. Irrigation scheduling adopted for MEDLI modelling has been developed with consideration of this rainfall deficit. The proposed irrigation scheme results in a total average annual rainfall of less than the average rainfall deficit of 803 mm/year, which suggests that recycled water irrigation, will only partially compensate for the natural rainfall deficit and supplementary irrigation sources other than recycled water may be required to maintain the golf course to the standard required for championship competition. Hydraulic Loading The following ADWF rates have been adopted for MEDLI modelling: TABLE 10.4: Estimated Monthly Wastewater Flows (@200L/EP/day) Adopted for MEDLI Modelling Month EP x Occupancy ADWF for 200 L/EP/day ML/day ML/month January 3, February 1, March 1, April 2, May 1, June 1, N-B016 Page 105
108 Water Cycle Management Report Great Keppel Island Resort Revitalisation Plan Month EP x Occupancy ADWF for 200 L/EP/day July 1, August 1, September 3, October 2, November 2, December 3, Effluent Concentrations The following effluent concentrations were input into the MEDLI model and are based on the proposed standard of treatment described in section 10.2 above: Total Nitrogen = 20 mg/l Total Phosphorous = 7 mg/l Total Dissolved Solids = 1,000 mg/l Electrical Conductivity = ds/m Soils Data Adjusted default soil properties for Sand have been adopted in the MEDLI modelling. The default properties of Sand contained within MEDLI were generally considered appropriate to use based on reference to soil profiles and properties identified through geotechnical investigations undertaken on the Island by Douglas Partners (Douglas Partners, 2010). Geotechnical investigations identified that soils within intended irrigation areas primarily comprise high permeability sands. Field testing of soil saturated hydraulic conductivity (K sat ), indicated that sands on GKI were characterised by significantly higher saturated hydraulic conductivity compared to default Sand properties contained within MEDLI. Accordingly, a modified soil type was created based on the default Sand by doubling the saturated hydraulic conductivity throughout the soil profile. Soil nutrient properties were also adjusted from the default Sand soil type. Soil organic nitrogen was increased from 350 mg/kg to 450 mg/kg to reflect the maximum soil organic nitrogen result recorded in samples of GKI sand collected during geotechnical investigations. Relatively low soil nitrate concentrations were recorded in sand samples collected on GKI, however the higher default figure of 7 mg/kg was adopted as the initial soil nitrate nitrogen. By adopting higher initial nitrogen concentrations for soils than actually occur on average across the irrigation area, a conservative approach has been taken. That is, advice from DERM suggests that increasing the initial soil organic nitrogen content can be used to simulate the application of slow release fertilisers within the irrigation area, which is otherwise not possible within MEDLI. A summary of the soil water and nutrient characteristics for the modified soil type Great Keppel Sand adopted in MEDLI modelling is provided in Table 10.5 and Table 10.6 below. N-B016 Page 106
109 Water Cycle Management Report Great Keppel Island Resort Revitalisation Plan TABLE 10.5: Soil Water Characteristics Adopted in MEDLI Modelling Properties Unit Soil Horizon Layer 1 Layer 2 Layer 3 Layer 4 Layer Thickness (mm) Air Dry Moisture Content (mm/layer) 4 Lower Storage Limit (mm/layer) Drained Upper Limit (mm/layer) Plant Available Water (mm) Capacity Saturated Water Content (mm/layer) Bulk Density (g/cm 3 ) Porosity (mm/layer) Saturated Hydraulic (mm/hour) Conductivity TABLE 10.6: Soil Nutrient Characteristics Adopted in MEDLI Modelling Properties Units Quantity Soil Nitrate mg/kg 7 Soil Organic Nitrogen mg/kg 450 Initial Soil Solution Phosphorus mg/l 0.01 Plant Default parameters for Continuous Coastal Couch Pasture were adopted from the MEDLI model as the majority of irrigation will occur on the proposed golf course. Advice from the golf course designer has confirmed that the turf on the course will consist of a range of Couch species. The default harvest trigger within the MEDLI model was adopted, which results in harvesting being triggered at a yield of 2800kg/ha of biomass. This is assumed to be a much higher harvest trigger than what will actually occur on the golf course, which is likely to be harvested (mowed) frequently in order to maintain manicured tees, greens and fairways. Harvesting removes excess biomass and the nutrients it contains from the irrigation area. Furthermore, following harvest, vegetative growth in the plant is stimulated which in turn stimulates the uptake of nutrients. By adopting a less frequent harvest trigger than is likely to occur, a conservative approach to removal of nutrients from the irrigation area has been modelled. Irrigation Scheduling Irrigation scenarios based on a fixed daily irrigation rate and a plant available water capacity (PAWC) trigger were tested to determine an appropriate regime for this reuse scheme. The following regimes were considered generally appropriate for the scheme: Irrigation triggered at 80% PAWC and irrigating up to 5.0mm beyond drained upper limit (DUL); and Irrigating 2mm, once per day. N-B016 Page 107
110 Water Cycle Management Report Great Keppel Island Resort Revitalisation Plan These irrigation regimes were determined to be appropriate on the basis that the resulting levels of nutrient leaching were generally consistent with modelled outputs of the site under no irrigation reflecting a non-worsening approach. Although MEDLI modelling indicates that irrigation of 2mm daily will not result in any increased leaching of nitrogen compared to a no irrigation scenario, irrigation of a fixed amount each day, including rain days, is not practical from an operational perspective wherein irrigation is more likely to be based on weather, plant and ground conditions. As such, an irrigation scheme based on triggering irrigation at approximately 80% PAWC and irrigating up to approximately 5mm beyond DUL was considered to comprise the most practical and sustainable irrigation regime for GKI based on available information. Irrigation Area Advice from Greg Norman Golf Course Design has indicated that the proposed championship golf course is likely to comprise a total area of maintained turf (including tees, greens, fairways and rough) of approximately 31 hectares. Accordingly, an irrigation area of 31 hectares was input into the MEDLI modelling. Fixed spray irrigation was selected as the irrigation method in MEDLI. Spray irrigators are likely to be the method used over the majority of the golf course due to the large areas requiring irrigation, although sub-surface / surface drippers or similar may be used within close proximity to sensitive receivers to reduce the potential for spray drift. Wet Weather Storage Pond The required volume of wet weather storage has been determined for a range of scenarios assuming a 31 hectare irrigation, including determining storage requirements for different irrigation regimes and reuse percentages. The various wet weather storage pond sizes determined through MEDLI modelling are discussed in the following section. However, for the preferred irrigation regime, which comprises a 31 hectare irrigation area and irrigating at 80% PAWC up to 5mm beyond DUL, the required wet weather storage to achieve no more than 1 overtopping event every 10 years on average is 37 ML. In order to cater for potential increases in rainfall intensity that may occur as a result of climate change, a total wet weather storage capacity of 44 ML has been recommended. This provides for an approximate 20% increase in wet weather storage capacity. This is considered more than adequate to account for a reasonable level of climate change induced increases in rainfall intensity, which is predicted to be in the order of 48% increase in rainfall intensity for a 2-hour event, 16% increase for a 24-hour event and 14% increase for a 72 hour event (Opus International Consultants, 2011b). Wet weather storage is likely to be provided as a series of ponds incorporated as water features within the proposed golf course. Wet weather storage should be provided separate to the stormwater harvesting ponds so as to reduce the risk of overtopping and enable monitoring of recycled water levels available for irrigation. Given that wet weather storage will most likely be incorporated into the golf course lake system, the pond has been modelled as being 100% exposed to evaporation and rainfall, with an average depth of 3 metres and a seepage rate of 0.1 mm/day. Given the sandy nature of soils on site, an artificial clay or synthetic liner will need to be incorporated into the pond design to achieve this seepage rate. Although multiple ponds may be constructed to provide wet weather storage, a single pond system has been modelled, as the MEDLI model assumes that effluent is only drawn from a single pond for reuse. N-B016 Page 108
111 Water Cycle Management Report Great Keppel Island Resort Revitalisation Plan Groundwater Part of the golf course overlies the Central Dune Sand Aquifer identified in the Douglas Partners Report on Assessment of Groundwater Resources dated May Other areas that may be used for irrigation of recycled water, although unlikely, overlie the Resort Aquifer identified by Douglas Partners. Both of these aquifers are unconfined dune sand aquifers. The thickness of the Resort Aquifer as identified by Douglas Partners is between 6m and 12m, and groundwater flows discharge to the ocean via Fisherman s Beach and Putney Beach. The thickness of the Central Dune Sand aquifer as identified by Douglas Partners is between 2.5m and 17m, and groundwater flows discharge to the ocean via Leeke s Creek and Leeke s Beach. Due to the limitations associated with the MEDLI groundwater model, the default groundwater parameters were used for the purpose of site assessment and modelling. These parameters assume an aquifer thickness of 10m which is within the range of aquifers located within the potential irrigation areas. The model also assumes a distance of 1000m between the irrigation area and location where nitrate concentration is calculated (i.e. location of discharge or extraction). Although the distance between the potential irrigation areas and discharge locations described above is less than 1000m, the model does not allow a lesser value to be entered. To counter this deficiency in the model, irrigation scenarios modelled have been developed to ensure no significant increase in the nutrient loads leached below the soil profile compared to a baseline or no irrigation scenario. Furthermore, relevant outputs from the MEDLI modelling relating to deep drainage and nutrient levels below the root zone, have been incorporated into groundwater pollutant models developed by Douglas Partners (2011) specific to the Central Dune Aquifer to assess potential impacts on groundwater quality and receiving waters MEDLI Outputs A copy of relevant MEDLI summary outputs discussed in this section are provided in Appendix I MEDLI Summary Output Data, including: MEDLI Summary Output (Baseline Scenario - No Irrigation); MEDLI Summary Output (Scenario 1 - Fixed Irrigation 2 mm/day); and MEDLI Summary Output (Scenario 2-80% PAWC Irrigation). A summary of key inputs and outputs from the MEDLI for these scenarios compared to a baseline or no irrigation scenario are provided in Table TABLE 10.7: Summary of MEDLI Inputs & Outputs MEDLI Summary Inputs & Outputs Hydraulic Loading: Effluent Quality Characteristics: Total Nitrogen Total Phosphorous Total Dissolved Salts Variable. As per Table 10.4 of Section mg/l 7 mg/l 1,000 mg/l N-B016 Page 109
112 Water Cycle Management Report Great Keppel Island Resort Revitalisation Plan MEDLI Summary Inputs & Outputs Volatile Solids Total Solids 0 mg/l 0 mg/l Irrigation Schedule: No Irrigation Scenario 1a (Fixed 2mm/day) Average Annual Rainfall (mm/year): Average Annual Pan Evaporation(mm/year): Scenario 1b (Fixed 2mm/day) Scenario 2a (80% PAWC) Scenario 2b (80% PAWC) Scenario 2d (80% PAWC) Irrigation Area (ha) Average Annual Irrigation (mm/year): Wet Weather Storage (ML) N/A % Reuse: 0 95% 100% 95% 100% 99% Average annual volume of N/A overtopping (ML/year): Runoff (mm/year): Deep Drainage (mm/year) Nitrogen added in irrigation (kg/ha/yr): Nitrogen removed by crop (kg/ha/yr): Leached nitrate (kg/ha/year): Concentration of nitrate in deep drainage (mg/l): Phosphorous added in irrigation (kg/ha/yr): Phosphorous removed by crop (kg/ha/yr): Leached phosphate (kg/ha/year) Average concentration of phosphate below root zone (mg/l): Reduction in crop yield due to salinity (%): Note: Results for the proposed scheme are highlighted grey. A discussion of relevant results is provided in the following sections. Reuse & Overtopping In general, DERM s policy for approving sewage treatment plants incorporating effluent reuse is for a minimum of 95% reuse to be achieved before consideration is given to discharging recycled water to the environment for disposal. In order to achieve 95% reuse based on a 31 hectare irrigation area and irrigating at 80% PAWC up to 5mm beyond DUL, a wet weather storage of 13 ML would be required. The modelling indicates that with 95% reuse and irrigating at 80% PAWC up to 5mm beyond DUL, the average volume of overtopping from wet weather storage ponds would be approximately 7.41 ML/year on average. This would result in overtopping occurring on approximately 167 days on average within every 10 year period. N-B016 Page 110
113 Water Cycle Management Report Great Keppel Island Resort Revitalisation Plan Despite the high standard of treatment proposed, this was not considered to be an acceptable level of overtopping on the basis of the potential impacts on marine environments surrounding the ocean outfall and also on the basis that it would result in the waste of a significant volume of recycled water that could otherwise potentially be beneficially used for irrigation of the golf course to offset the need for sourcing other water supplies. As such, consideration was given to a range of options to reduce the volume of overtopping and increase the percentage reuse, including: Increasing the irrigation area; Increasing the irrigation rate; and Increasing the volume of wet weather storage. Increased Irrigation Area The capacity to reduce overtopping of wet weather storage by increasing the irrigation area is constrained by the volume of recycled water available and the assimilation capacity of soils. Modelling of the preferred irrigation scheme based on triggering irrigation at 80% PAWC and irrigating up to 5mm beyond DUL indicates that increasing the irrigation area has minimal impact on reducing overtopping. Under this irrigation regime, irrigation will only be triggered when the soil in the irrigation area is dried to the point where the PAWC has decreased to 80%. As such, during rainy periods and for some time following the rainy periods, the soil will be too moist to trigger irrigation. As a result, when using a PAWC trigger, increasing the irrigation area will still only increase the amount of effluent that can be irrigated during dry periods meaning wet weather storage will still need to be sized to store all effluent generated on wet days. At approximately 31 hectares a balance has been achieved where all of the incoming effluent can be irrigated during a dry day. Increasing the irrigation area beyond this will not allow more effluent to be irrigated during a dry day, as no more incoming effluent is available to irrigate on those dry days. Increased Irrigation Rate Although increasing the rate of application may reduce the volume of overtopping, it also increases the risk of exceeding the capacity of soils to effectively assimilate nutrients, resulting in declining soil quality, impacting on plant growth and leaching of nutrients to groundwater. Altering the PAWC trigger limit to trigger irrigation at higher PAWC level will allow irrigation to occur when the soil is not quite as dry, thus increased irrigation can occur during wetter periods. However, adopting a higher PAWC trigger will result in soils staying wetter for longer and there will be an increased risk of nutrients leaching below the root zone of plants into underlying groundwater. Increasing the PAWC to trigger irrigation at higher than 80% tended to result in higher levels of nutrient leaching compared to the no irrigation scenario with minimal effect in reducing overtopping, and was therefore considered to be unacceptable in this instance. Furthermore, triggering irrigation when soil moisture content is still relatively high means that soils would be permanently saturated or near saturated, which has other implications for soil quality in terms of oxygen availability and microbial activity. N-B016 Page 111
114 Water Cycle Management Report Great Keppel Island Resort Revitalisation Plan Similarly, adopting a fixed irrigation rate higher than 2 mm/day was also shown to result in higher levels of nutrient leaching compared to the no irrigation scenario and was therefore not considered further in the modelling assessments. Increased Storage Compared to the frequency and amount of overtopping predicted to occur under a reuse scheme achieving 95% reuse, a more acceptable overtopping frequency was considered to be in the order of approximately once every 10 years. To achieve this, a minimum wet weather storage capacity of 37 ML was estimated to be required using MEDLI modelling and assuming irrigation occurs at 80% PAWC up to 5mm beyond DUL. Provision of a 37 ML storage reduces the average annual volume of overtopping from about 7.41 ML/year to 0.76 ML/year and the average number of days overtopping occurs in a 10-year period is reduced from approximately 167 days to 17 days, with the duration of each overtopping event being an average of about 10 days (refer to Figure 10.2). The percentage of recycled water reused increases from 95% up to in excess of 99% when the wet weather storage capacity is increased from 13 ML up to 37 ML. To achieve 100% reuse and avoid overtopping based on a 31 hectare irrigation area and irrigating at 80% PAWC up to 5 mm beyond DUL, a minimum 75 ML of wet weather storage capacity would be required. Compared to a 13 ML wet weather storage required to achieve 95% reuse, a 75 ML storage would require an additional land area of approximately 2 hectares to construct assuming an average depth of 3 metres with batters. Construction of a storage facility sized to achieve 100% reuse, would require a significant increase in the area of land and volume of materials required for this component of the project. Furthermore, the additional 62 ML of storage would be empty 95% of the time and would be required only during the most extreme rainfall events when water quality in receiving waters is already likely to be highly degraded from land-based sources of runoff Overtopping Volume (m3) /01/1957 1/01/1960 1/01/1963 1/01/1966 1/01/1969 1/01/1972 1/01/1975 1/01/1978 1/01/1981 1/01/1984 1/01/1987 1/01/1990 1/01/1993 1/01/1996 1/01/1999 1/01/2002 1/01/2005 1/01/2008 Date N-B016 Page 112
115 Water Cycle Management Report Great Keppel Island Resort Revitalisation Plan Figure 10.2: Overtopping Events Predicted Assuming Provision of 37ML Wet Weather Storage In comparison, the additional wet weather storage capacity required to increase reuse from 95% up to just over 99% and reduce the overtopping frequency to about once every 10 years, is only 24 ML which would require only an additional 0.8 ha of land to construct. Runoff The results of MEDLI modelling for the proposed irrigation scheme demonstrate that no runoff of irrigated effluent will occur. Furthermore, the average rate of runoff from the irrigation area predicted for the proposed irrigation scheme (6.0 mm/year) is approximately 60% lower than the runoff rate predicted for the area when no irrigation occurs (19.8 mm/year). This lower rate of runoff is likely to be due to enhanced evapo-transpiration rates within the irrigation area associated with improved plant cover and health. Deep Drainage The results of MEDLI modelling for the proposed irrigation scheme indicate that the average rate of deep drainage from the irrigation area predicted for the proposed irrigation scheme (446.1 mm/year) is only slightly higher (i.e. less than 5%) than the deep drainage rate predicted for the area when no irrigation occurs (426.2 mm/year). Nutrients Leaching of nutrients through the soil profile and below the root zone of plants occurs when the soil is oversaturated and the capacity of soils and plant matter to adsorb and uptake nutrients is exceeded. Sustainable irrigation of recycled water encourages healthy plant growth, often resulting in greater plant cover and health than systems relying solely on rainfall due to the presence of nutrients required for plant growth contained in recycled water. This is particularly the case where there is a significant annual rainfall deficit as occurs in this locality (i.e. average deficit of 803 mm/year). Healthy plant growth in turn supports enhanced uptake of nutrients and evapo-transpiration. Irrigation scheduling based on a PAWC trigger as adopted for the proposed irrigation scheme, is generally the most effective means to achieve healthy plant growth as this approach applies recycled water when water is needed by the plant. The results of MEDLI modelling for the proposed irrigation scheme indicate that the rate of nitrogen uptake by plant growth (105.4kg/ha/year) exceeds the amount of nitrogen applied by irrigation (69.6kg/ha/year). Furthermore, the amount of nitrogen leached below the root zone under the proposed irrigation scheme (2.4kg/ha/year) and the concentration of nitrogen in deep drainage (0.5mg/L) is substantially lower than for the baseline or no irrigation scenario (6.9kg/ha/year and 1.6mg/L respectively). Figure 10.3 below provides a comparison of the amount of nitrogen leached below the soil profile during the proposed irrigation scheme and with no irrigation. N-B016 Page 113
116 Water Cycle Management Report Great Keppel Island Resort Revitalisation Plan Proposed Irrigation Scheme No Irrigation Leached Nitrate (kg/ha) /01/1957 1/01/1959 1/01/1961 1/01/1963 1/01/1965 1/01/1967 1/01/1969 1/01/1971 1/01/1973 1/01/1975 1/01/1977 1/01/1979 1/01/1981 1/01/1983 1/01/1985 1/01/1987 1/01/1989 1/01/1991 1/01/1993 1/01/1995 1/01/1997 1/01/1999 1/01/2001 1/01/2003 1/01/2005 1/01/2007 1/01/2009 FIGURE 10.3: Comparison of Nitrogen Leached Below the Soil Profile under No Irrigation and Proposed Irrigation Scheme Date The results of MEDLI modelling for the proposed irrigation scheme indicate that the rate of phosphorous uptake by plant growth (24.4kg/ha/year) is less than the amount of phosphorous applied by irrigation (35.3kg/ha/year). However, the remaining phosphorous is largely adsorbed within the soil profile. Figure 10.4 below illustrates phosphorous adsorption within the soil profile over the life of the scheme and demonstrates that the phosphorous adsorption capacity of the soils will not be exceeded even after 50+ years of irrigation. The combination of plant uptake and soil adsorption ensure that the amount of phosphorous leached below the soil profile is comparable with the amount predicted with no irrigation. N-B016 Page 114
117 Water Cycle Management Report Great Keppel Island Resort Revitalisation Plan 1000 Phosphorous Adsorbed in Soil Profile (kg/ha) Date FIGURE 10.4: Irrigation Phosphorous Adsorption in Soil Profile over 53 years of Treated effluent Groundwater As noted above, MEDLI is generally not considered to be an effective tool for modelling potential impacts of effluent irrigation on groundwater quality where the groundwater discharge/ extraction point is located within 1000m of the irrigation area. In this instance, a small part of the irrigation area overlies the Central Dune Aquifer identified by Douglas Partners (2011). Although the proposed irrigation scheme has been designed to result in no worsening of nutrient leaching below the soil profile compared to a no irrigation scenario, further modelling of potential groundwater impacts has been undertaken by Douglas Partners using the MODFLOW groundwater model developed to simulate the Central Dune Aquifer. Further details on the modelling process are provided in Douglas Partners (2011). To model potential groundwater impacts, Douglas Partners incorporated the following outputs from the MEDLI modelling for the proposed irrigation scheme: TABLE 10.8: Summary of MEDLI Outputs vs MODFLOW Inputs Attribute MEDLI Output Data Data Used in MODFLOW Irrigation Area (within catchment of Central Dune Aquifer) 31 hectares 31 hectares Average Groundwater Recharge m 3 /year m 3 /year Average Nitrate Concentration of Groundwater Recharge 0.5 mg/l 0.55 mg/l 1 Average Phosphate Concentration Below Root Zone 0.0 mg/l 0.03 mg/l 1 N-B016 Page 115
118 Water Cycle Management Report Great Keppel Island Resort Revitalisation Plan Note: 1. Buffer added to MEDLI output data for conservative assessment of impacts. Groundwater pollutant modelling undertaken by Douglas Partners based on the above inputs from the proposed irrigation scheme, indicates that the concentrations of total nitrogen and total phosphorous within groundwater complies with the relevant water quality objectives of 0.3 mg/l of total nitrogen and mg/l of total phosphorous at the point of discharge into Leeke s Creek and associated tidal wetlands. As such, the proposed irrigation of recycled water containing an average concentration of 20 mg/l of nitrogen and 7 mg/l of phosphorous is not expected to result in any adverse impacts on water quality or environmental values associated with Leeke s Creek and associated tidal wetlands. In addition, groundwater pollutant modelling undertaken by Douglas Partners estimated that based on an average recharge rate 378.6m 3 /year, the concentrations of nitrogen and phosphorous leached below the soil profile must not exceed 0.65mg/L and 0.05mg/L respectively in order to comply with water quality objectives for Leeke s Creek. Golf Course Maintenance Assuming average effluent concentrations of 20 mg/l of total nitrogen and 7 mg/l of total phosphorous, the proposed recycled water scheme as described above, will apply the following amounts of nutrients to the irrigation area: Nitrogen = 69.9 kg/ha/year Phosphorous = 35.3 kg/ha/year Limited capability is available within MEDLI to simulate the application of fertilisers to an irrigation area. A number of conservative assumptions have however been incorporated into modelling of the proposed irrigation scheme to account for possible fertiliser application to some extent. This includes: Adopting higher than average initial soil nitrogen levels, which acts to simulate the application of a slow release fertiliser; and Adopting a harvest trigger that results in less frequent removal of grass clippings and other plant growth from the irrigation area than will actually occurred on a frequently mown golf course. To further consider the possible implications of fertiliser application within the proposed golf course irrigation area, initial effluent concentrations were increased substantially from 20 mg/l nitrogen up to 115 mg/l and from 7 mg/l phosphorous up to 25 mg/l. Modelling of effluent irrigation triggered at 80% PAWC up to 5 mm beyond DUL over a 31 hectare irrigation area resulted in the following: Nitrogen applied in irrigation: = kg/ha/year Phosphorous applied in irrigation: = 47.2 kg/ha/year Average Nitrate Concentration of Groundwater Recharge: = 0.6 mg/l Average Phosphate Concentration Below Root Zone: = 0.0 mg/l N-B016 Page 116
119 Water Cycle Management Report Great Keppel Island Resort Revitalisation Plan Average Groundwater Recharge: = m 3 /year As the concentrations of nitrogen and phosphorous leached below the soil profile are predicted to be less than the limits identified by Douglas Partners to achieve the required water quality objectives at Leeke s Creek, it is considered that up to approximately 115.4kg/ha/year of nitrogen and 47.2 kg/ha/year of phosphorous could be applied to the irrigation area either within effluent or applied fertilisers without impacting on water quality or environmental values within Leeke s Creek. It is recommended that these rates be used as a guide for managing fertiliser application on the proposed golf course, with records of all fertiliser application and recycled water irrigation to be maintained. Combined with regular monitoring of soils and groundwater that will be required under the conditions of development approval that will need to be obtained for the proposed wastewater treatment plant, this approach to fertiliser management is considered to substantially reduce the potential for maintenance of the proposed golf course to impact on water quality within Leeke s Creek and other downstream receiving waters. In addition to nutrients, the health of the plant cover also depends on the quantity of water available. The golf course designer has estimated the monthly volume of irrigation likely to be required to maintain the golf course based on average amounts of rainfall and evapo-transpiration rates. The average annual rate of recycled water applied for the proposed irrigation scheme has been compared to the required irrigation rate estimated for the golf course by the designer. Irrigation at the rates specified by the golf course designer is only proposed for parts of the golf course comprising tees, greens and fairways rather than the entire golf course. As such, estimation of the total volume of irrigation water required is based on the rates specified by the golf course designer multiplied by the estimated area of tees, greens and fairways. Based on reference to a report published by the Environmental Institute of Golf (2006), it has been estimated that the area of tees, greens and fairways accounts for approximately 49% of the total area of maintained turf, which in this case, equates to 49% of 31 hectares or approximately 15.2 hectares. In undertaking the water balance for this project, the irrigation water demand for the golf course assumes tees, greens and fairways are irrigated at the full rate proposed by the golf course designer using a combination of recycled water and other water supply sources. Irrigation of areas of golf course not comprising tees, greens and fairways will be irrigated using recycled water only at the rate determined to be sustainable through MEDLI modelling. Table 10.8 provides a summary of the estimated water demands and irrigation water supplies for the proposed golf course. TABLE 10.8: Estimated Golf Course Irrigation Requirements Compared to Treated effluent Irrigation Month Irrigation Rate Required for Tees, Greens & Fairways (ML/ha/month) Total Volume of Irrigation Water Required for Tees, Greens & Fairways (15.2ha) (ML/month) Treated effluent Irrigated to Tees, Greens & Fairways (ML/month) Irrigation Water Deficit for Tees, Greens & Fairways (ML/month) Treated effluent Irrigation of Remaining Golf Course (ML/month) January February N-B016 Page 117
120 Water Cycle Management Report Great Keppel Island Resort Revitalisation Plan Month Irrigation Rate Required for Tees, Greens & Fairways (ML/ha/month) Total Volume of Irrigation Water Required for Tees, Greens & Fairways (15.2ha) (ML/month) Treated effluent Irrigated to Tees, Greens & Fairways (ML/month) Irrigation Water Deficit for Tees, Greens & Fairways (ML/month) Treated effluent Irrigation of Remaining Golf Course (ML/month) March April May June July August September October November December Annual These results indicate that in addition to recycled water irrigation, between about 6.63 ML/month and ML/month of additional irrigation water is likely to be applied to the tees, greens and fairways. As noted in section 8.2 above, this additional water supply will be derived primarily from stormwater runoff harvested in ponds incorporated into the golf course and supplemented by water from the mains supply from the mainland MEDLI Summary Based on the above results, the preferred recycled water irrigation scheme based on proposed effluent quality characteristics and hydraulic loading consists of: Irrigation Area = 31 hectares Wet Weather Storage = 37 ML (plus 7 ML climate change buffer) Trigger irrigation at 80% PAWC and irrigate up to 5 mm beyond DUL. This scheme achieves over 99% reuse of recycled water generated by the GKI Resort Revitalisation Plan, with discharge from wet weather storages expected to occur only during extreme wet weather periods or approximately once every 10 years. To achieve 100% reuse, a minimum 75 ML (plus 15ML climate change buffer) wet weather storage would need to be provided. Construction of this additional storage volume would require significant amounts of additional land area (> 2 hectares) and earthworks, including associated vegetation clearing as well as the importation of significant quantities of material to reduce seepage in the natural sand soils. The proposed golf course is currently expected to comprise approximately 31 hectares of maintained turf that would be suitable for irrigation using recycled water. Depending on final design of the golf course, additional areas may be required for irrigation. In this case, landscaped gardens and turf surrounding ecotourism villas located within the same Clam Bay Precinct as the golf course would be the first preference for alternative irrigation area to minimise costs and energy consumption associated N-B016 Page 118
121 Water Cycle Management Report Great Keppel Island Resort Revitalisation Plan with pumping recycled water around the Island. However, landscaped gardens and turf within the Fisherman s Beach Precinct would also be acceptable for reuse of recycled water for irrigation if required being based on the same underlying soil type. In order to ensure the ongoing sustainability of the proposed recycled water irrigation scheme and to mitigate potential environmental and public health risks associated with the scheme, a Preliminary Irrigation Management Plan has been developed and is included in Appendix H - Preliminary Irrigation Management Plan EMERGENCY WET WEATHER DISCHARGE MEDLI modelling for the proposed recycled water irrigation scheme indicates that in excess of 99% of all recycled water generated by the GKI Resort Revitalisation Plan will be reused on the Island for irrigation of the golf course and possibly other landscaped garden and turf areas. During prolonged or extreme wet weather events, expected to occur approximately once every 10 years on average, wet weather storage ponds may reach capacity and a proportion of the recycled water may subsequently be discharged via an ocean outfall. The likelihood of ocean discharge occurring is expected to be somewhat less than the 1 in 10 years predicted by MEDLI given that the MEDLI modelling was based on provision of a 37ML wet weather storage. However, to account for potential increases in rainfall intensity that are predicted to occur as a result of climate change, it is proposed to provide 44ML wet weather storage or almost 20% more storage than considered in the MEDLI modelling. This is considered to be an extremely conservative approach to sizing of the wet weather storage given that although increased rainfall intensity is predicted to occur as a result of climate change, a decrease in average annual rainfall is also expected to occur meaning that: Irrigation is likely to be triggered more often based on a soil water deficit, resulting in more recycled water being used for irrigation and less recycled water going into wet weather storage; and Less direct rainfall will be captured by the open wet weather storage ponds providing more capacity for storage of recycled water. It is noted that the proposed wet weather discharge is significantly lower than the volume of discharge permitted under the environmental licence conditions for the existing wastewater treatment plant servicing the former GKI resort, which allowed for up to 250 m 3 per day of effluent to be discharged on dry weather days and up to 500 m 3 per day to be discharged on wet weather days. To determine the location of the proposed ocean outfall, consideration has been given to GBRMPA s Sewage Discharge Policy - Sewage Discharges from Marine Outfalls to the Great Barrier Reef Marine Park, March This policy states that: Marine outfalls should not be constructed: i. Within 50 metres of a permitted mooring or anchorage; or ii. Within 1000 metres of aquaculture operations, or an area regularly used for iii. swimming or other water-based activities, unless it can be demonstrated that there will be no adverse impacts on the operation or activities; or Within 1000 metres of sensitive N-B016 Page 119
122 Water Cycle Management Report Great Keppel Island Resort Revitalisation Plan environments, unless it can be demonstrated that there will be no adverse impacts on the protection of aquatic ecosystems. For a marine outfall to be approved the GBRMPA will require that: i. The outfall structure be of a design which optimises diffusion and dispersal; and ii. The design of the system includes consideration of water depth (deep water is preferred i.e. greater than 10 metres), current velocity, tidal range and proximity to reefs or other sensitive environments. A bathymetric survey has been conducted offshore to the south of Long Beach. This location was selected to provide adequate distance away from the shore, sufficient depth and exposure to offshore ocean currents to facilitate dispersion of recycled water. This location avoids identified coral reefs and has minimal impacts to existing seagrass beds (FRC Environmental, 2011). The proposed ocean outfall will comprise a pipeline of approximately 1,000 metres in length extending from Long Beach. The outfall will be located within an area of water at least 10 metres deep to ensure sufficient depth of water is available above the diffuser across the full tidal range. The outfall will incorporate a T-shaped diffuser comprising two (2) ports approximately 75mm diameter. Modelling of predicted dispersion of discharges from the ocean outfall has been undertaken by Water Technology and is contained in their report Great Keppel Island Resort Revitalisation Plan Coastal Environment Technical Report August Based on the estimated volume and duration of discharge events predicted by MEDLI modelling and assuming effluent nutrient concentrations of 20 mg/l for total nitrogen and 7 mg/l of total phosphorous, dispersion modelling by Water Technology has predicted that concentrations of total nitrogen and total phosphorous will reduce to below relevant trigger values within a small mixing zone in the immediate vicinity of the outfall. On this basis, the proposed emergency wet weather discharge of recycled water via an ocean outfall is not anticipated to have any significant impact on ecological communities near the outfall. N-B016 Page 120
123 Water Cycle Management Report Great Keppel Island Resort Revitalisation Plan 11. STORMWATER MANAGEMENT The following section describes the proposed strategy for managing stormwater quality and quantity associated with the GKI Resort Revitalisation Plan to prevent any adverse impacts on receiving waters. In accordance with water sensitive urban design (WSUD) principles and best practice environmental stormwater management, stormwater drainage systems incorporated into the GKI Resort Revitalisation Plan will primarily utilise surface drainage techniques (such as grassed swales) rather than traditional underground piped drainage systems. This will minimise the need for significant excavation for installation of stormwater pipe trenches while also enabling stormwater drainage systems to be utilised as landscape features. The proposed stormwater strategy also aims to treat stormwater at the source using bio-retention filters that utilise native vegetation and natural sand materials. The bio-filters remove sediment and nutrients from stormwater before allowing the stormwater to infiltrate into the natural sandy soils mimicking the natural process of groundwater recharge through rainwater infiltration that occurs on the Island CATCHMENT OVERVIEW As noted in Table 11.1, fourteen distinct drainage catchments have been identified on GKI. The extents of these catchments are shown on the Catchment Plan contained in Appendix B Catchment Plan. A summary of the catchment characteristics is provided below: TABLE 11.1: Stormwater Catchment Characteristics ID Location Catchment Area (Ha) Discharge Location 1 Eastern side of Discharges in a dispersed manner via headland between localised flow paths to the rocky shore. Secret Beach and No main waterway. Wreck Bay 2 Wreck Bay Wreck Beach 3 Wreck Bay Little Wreck Beach Discharges in a dispersed manner via localised flow paths to Wrecks Beach. No main waterway Discharges in a dispersed manner via localised flow paths to Little Wreck Beach. No main waterway. 4 Red Beach Discharges in a dispersed manner via localised flow paths to various small beaches / coves and Red Beach. No main waterway. 5 Clam Bay Discharges in a dispersed manner via localised flow paths to the small beaches of Clam Bay. No main waterway. 6 Southern side of Discharges in a dispersed manner via headland between localised flow paths to the rocky Wyndham Cove and shoreline of north eastern Long Beach. Long Beach No main waterway. 7 Long Beach Discharges in a dispersed manner along the eastern section of Long Proposed Development within Catchment Nil Nil Nil Nil Part of golf course and small number of ecotourism villas. Nil Small number of ecotourism villas and small N-B016 Page 121
124 Water Cycle Management Report Great Keppel Island Resort Revitalisation Plan ID Location Catchment Area (Ha) Discharge Location Beach. There are few recognisable flow paths. 8 Fisherman s Beach Discharges in a dispersed manner along the southern half of Fishermen's Beach. There are few recognisable flow paths. 9 Putney Creek Contains Putney Creek, which discharges at Putney Beach. 10 Leeke s Beach Contains Leeke's Creek, which discharges to Leeke s Beach through the existing wetland. 11 Central area between Clam Bay and Leeke s Beach 12 Ridgeline inland of Svendsen s Beach 13 Western side of headland at Secret Beach Discharges via Leeke s Creek in Catchment 10 to Leeke s Beach through the existing wetland Discharges in a dispersed manner via localised flow paths towards Svendsen s Beach via Catchment 10. No main waterway Discharges in a dispersed manner via localised flow paths to Secret Beach. No main waterway. 14 Marina Precinct The Marina Precinct is to be constructed along the existing beachfront at the northern end of Putney Beach. Proposed Development within Catchment part of airstrip. Resort hotel, ecotourism villas and apartments, sporting fields, Eco-apartments and villas, resort commercial / retail, staff accommodation, airport terminal and part of airstrip, and the facilities maintenance compound. Nil but downstream of Catchment 11. Majority of golf course including clubhouse commercial / retail and ecotourism villas. Nil Nil Marina retail / commercial and apartments. Stormwater modelling and analysis as described in this section, generally excludes land not leased or intended to be leased by GKI Resort Pty Ltd. As such, model catchments have been identified based on topographic boundaries, modified as necessary to exclude land not expected to be leased by GKI Resort Pty Ltd. As noted in Table 11.1, the development areas proposed under the GKI Resort Revitalisation Plan primarily fall within the following catchments: 5 - Clam Bay; 7 - Long Beach; 8 - Fisherman s Beach; 9 - Putney Creek; 10 - Leeke s Creek; 11 Central Clam Bay / Leeke s Beach (discharging via Leeke s Beach); and N-B016 Page 122
125 Water Cycle Management Report Great Keppel Island Resort Revitalisation Plan 14 Marina Precinct. No development work is proposed in the remaining catchments and no changes to runoff behaviour will occur in those areas as a result of the GKI Resort Revitalisation Plan. Accordingly, only Catchments 5, 7, 8, 9, 10, 11 and 14 have been modelled METHODOLOGY Stormwater Quantity Existing and post-development hydrologic behaviour within catchments containing elements of the GKI Resort Revitalisation Plan has been analysed using two main methods: Peak surface flow rates have been calculated using probabilistic methods outlined in Australian Rainfall and Runoff (Institution of Engineers Australia, 2001); and Annual runoff volumes, and particularly the distribution of rainfall to surface flow and groundwater flow, has been analysed using continuous simulation analysis in the hydrologic module of MUSIC software. Full details of these analyses are provided in Appendix J - Stormwater Quantity Analysis and are summarised in the sections below Stormwater Quality To assess the potential impacts of stormwater runoff generated by the GKI Resort Revitalisation Plan on the surface water quality in receiving waters, modelling has been undertaken using MUSIC (Model for Urban Stormwater Improvement Conceptualisation) software. MUSIC is a software tool that simulates the behaviour of stormwater in catchments and is the preferred tool for demonstrating the performance of stormwater quality treatment systems within urban areas. MUSIC modelling is used to quantify stormwater pollutant concentrations and average annual loads, and to assess the effectiveness of various stormwater quality improvement devices in reducing pollutant loads and concentrations. Subsequent pollutant load reductions and discharge concentrations can then be compared against relevant water quality objectives and guidelines to determine compliance. Detailed analysis results are provided in Appendix K - Stormwater Quality Analysis OBJECTIVES & TARGETS Stormwater Quantity The primary objectives for managing stormwater quantity have been derived from State Planning Policy (SPP) 4/10 - Healthy Waters (May 2011) and include: The waterway stability objective of SPP 4/10 requires that new developments manage flows such that the post-development one-year ARI event discharge rate within the downstream waterway is no greater than the pre-development peak one-year ARI event discharge rate; and N-B016 Page 123
126 Water Cycle Management Report Great Keppel Island Resort Revitalisation Plan To protect in-stream ecology of ephemeral freshwater waterways, SPP 4/10 requires new development to manage the increase in the number of small runoff events that occur from impervious surfaces compared to natural vegetated surfaces. This objective is typically satisfied by capturing and managing the first 10mm of runoff from impervious surfaces each day Stormwater Quality The primary objectives for managing stormwater quality have been derived from State Planning Policy (SPP) 4/10 - Healthy Waters (May 2011) and the draft Urban Stormwater - Queensland Best Practice Environment Management Guidelines 2009, which are the primary documents used in Queensland for the planning, design and assessment of stormwater management systems. SPP 4/10 (and supporting documents) nominates specific minimum stormwater pollutant load reductions required to be met by development throughout Queensland. The nominated minimums have been based on research and modelling work undertaken by a number of Australian organisations. The research has included operational testing of constructed stormwater quality management devices. Adopting predictive modelling techniques to quantify estimates of stormwater pollutant concentrations and loads from urban land surfaces, and the pollutant removal efficacy of current best practice stormwater treatment infrastructure, is now an accepted method for establishing best practice stormwater management complying with SPP 4/10. In recent years, significant research effort has been applied to develop modelling methods that can estimate the level of stormwater quality improvement necessary for a site to ensure that the defined WQOs and EVs for receiving waters can be achieved and protected. Currently, surface water quality modelling tools such as MUSIC, are only able to model and predict Total Suspended Solids (TSS), Total Phosphorous (TP), Total Nitrogen (TN) and Gross Pollutants (GP). Stormwater quality improvement objectives for the GKI Resort Revitalisation Plan have been derived from Table 2.1b of the draft Queensland Best Practice Environmental Management Guidelines. For the relevant region (Central Coast South), minimum target reductions in mean annual loads for the modelled pollutants are as follows: Suspended Solids (TSS) = 85% Total Phosphorus (TP) = 70% Total Nitrogen (TN) = 45% Gross Pollutants (GP) = 90% The target load reductions detailed in the draft Queensland Best Practice Environmental Management Guidelines were derived using a "diminishing returns" analysis balancing incremental community costs against improved environmental benefits. Whilst the target load reductions are not necessarily the maximum that can possibly be achieved, they have been derived following rigorous analysis. N-B016 Page 124
127 Water Cycle Management Report Great Keppel Island Resort Revitalisation Plan In addition to demonstrating compliance with pollutant load reduction targets as specified above, the analysis outlined in detail below demonstrates that the stormwater quality improvement methods proposed to achieve the nominated load reductions will also reduce modelled pollutant concentrations in runoff below those which presently exist. As such, the modelling predicts that the Project will result in no worsening of existing stormwater discharge quality predicted by the modelling STORMWATER QUANTITY Surface Flow Rates Peak surface flow rates were calculated using the Rational Method, generally as outlined in Book IV of Australian Rainfall and Runoff (Institution of Engineers Australia, 2001). Surface flow rates are directly related to the proportion of impervious surface in any catchment so an increased impervious area associated with new buildings and other hardstand surfaces such as roads, increases peak surface flow rates compared to natural pervious surfaces. Increased peak flow rates are of concern due to the increased potential for scouring and erosion that may occur where such flows are concentrated. Where surface flows are not concentrated and are discharged in a dispersed manner, the potential for scouring is generally not significantly increased. As surface flows from the Marina Precinct will discharge to the ocean without being concentrated in a channelised drainage line where scouring could occur, analysis of pre-development and postdevelopment peak flow rates from Catchment 14 Marina Precinct is not considered necessary. The waterway stability objective of SPP 4/10 requires that new developments manage flows such that the post-development one-year ARI event discharge within the downstream waterway is no greater than the pre-development peak one-year ARI event discharge. Generally, detention of surface runoff from developed areas is necessary to achieve this objective. Mitigating post-development flow rates to, or below, pre-development levels also mitigates post-development waterway flow velocities to, or below, pre-development levels. Maintaining existing flow velocities means there will be no adverse impact on scouring or erosion rates, potential flooding or in-stream habitat within downstream waterways. Tables 11.2 to 11.6 provide a comparison of pre-development and post-development peak flow rates in catchments containing elements of the GKI Resort Revitalisation Plan (except Catchment 14 Marina Precinct). The analysis indicates that the Project could potentially increase peak flow rates by amounts ranging from 0.5% (Catchment 5 Clam Bay) to 90.2% (Catchment 9 Putney Creek). To achieve non-worsening of peak flow rates and demonstrate compliance with the waterway stability objective of SPP 4/10, routing analyses have been undertaken to determine preliminary sizes of detention structures required. Details of the preliminary sizing of detention required for each catchment to achieve non-worsening of peak flow rates in downstream waterways is provided in Tables 11.2 to N-B016 Page 125
128 Water Cycle Management Report Great Keppel Island Resort Revitalisation Plan TABLE 11.2: Catchment 5 (Peak Flow Rates from Catchment to Clam Bay) Average Recurrence Interval (years) Pre-development Peak Discharge (m 3 /s) Post-development Peak Discharge - Unmitigated (m 3 /s) Postdevelopment Peak Discharge - Mitigated (m 3 /s) % Reduction in Peak Flow No worsening achieved? Yes Yes Yes Yes Yes Yes Yes TABLE 11.3: Catchment 7 (Peak Flow Rates to Long Beach from GKI Property & Catchments Downstream) Average Recurrence Interval (years) Pre-development Peak Discharge (m 3 /s) Post-development Peak Discharge - Unmitigated (m 3 /s) Postdevelopment Peak Discharge - Mitigated (m 3 /s) % Reduction in Peak Flow No worsening achieved? Yes Yes Yes Yes Yes Yes Yes TABLE 11.4: Catchment 8 (Peak Flow Rates to Fisherman s Beach from GKI Property). Average Recurrence Interval (years) Pre-development Peak Discharge (m 3 /s) Post-development Peak Discharge - Unmitigated (m 3 /s) Note: These flows are distributed over a wide beach frontage and are not concentrated at specific points. Similar to Catchment 14, Catchment 8 discharges via dispersed flows across Fisherman s Beach to the ocean, with no downstream waterway that might be impacted by discharge rate increases. As such, no detention is proposed within this catchment. This will be confirmed during the final design stage and, if necessary, detention basins designed and implemented. N-B016 Page 126
129 TABLE 11.5: Catchment 9 (Peak Flow Rates at the Mouth of Putney Creek) Average Recurrence Interval (years) Pre-development Peak Discharge (m 3 /s) Postdevelopment Peak Discharge - Unmitigated (m 3 /s) Water Cycle Management Report Great Keppel Island Resort Revitalisation Plan Postdevelopment Peak Discharge - Mitigated (m 3 /s) % Reduction in Peak Flow No worsening achieved? Yes Yes Yes Yes Yes Yes Yes TABLE 11.6: Catchment 11 (Peak Flow Rates at the Mouth of Leeke s Creek) Average Recurrence Interval (years) Pre-development Peak Discharge (m 3 /s) Postdevelopment Peak Discharge - Unmitigated (m 3 /s) Postdevelopment Peak Discharge - Mitigated (m 3 /s) % Reduction in Peak Flow No worsening achieved? Yes Yes Yes Yes Yes Yes Yes Table 11.7 below summarises the estimated size (volume and surface area) of required detention basins for each catchment. The surface area of each basin has been based on a maximum basin depth of 1.2m for a Q20 event. The nominated detention basin sizes mitigate all runoff events up to the 100 year recurrence interval. This significantly exceeds the requirements of SPP 4/10, which only requires flow mitigation up to the 1 year recurrence level. TABLE 11.7: Required Detention Basins Sizes for Each Catchment Catchment Basin Volume (ML) Basin Surface Area (Ha) Although the exact location and design of detention basins will need to be confirmed during detailed design stages, modelling undertaken to date indicates that detention requirements to mitigate postdevelopment peak flow rates to, or below, pre-development levels are relatively small. As such, it is anticipated that the required detention basins can be readily integrated into landscaped elements of the GKI Resort Revitalisation Plan without requiring any significant increase in the Project footprint. N-B016 Page 127
130 Water Cycle Management Report Great Keppel Island Resort Revitalisation Plan A number of areas within the GKI Resort Revitalisation Plan have been identified as suitable sites for detention structures. The approximate locations of suitable detention structures (Drawing No. R03) and typical details (Drawing No. R02) are contained in Appendix L - Stormwater Drawings. It is envisaged that detention structures will comprise low impact designs utilising relatively low grassed or vegetated mounds enclosing open space, which will be integrated with landscaped areas to provide multi-purpose stormwater management and landscape amenity. Detention structures will be located such that runoff from storm events exceeding the detention basin design event can bypass safely around the outside of the structure to reduce the risk of embankment collapse that could occur if ponds are allowed to overflow in an uncontrolled manner. Civil designs (building pads, roads, surface flow paths and piped networks) will direct stormwater runoff from catchments to the relevant detention basins, primarily though the use of overland flow paths consisting of grassed swales or similar to contribute further to stormwater quality improvement and environmental health as discussed in section Runoff Volumes Construction of buildings and infrastructure associated with the GKI Resort Revitalisation Plan will increase the total area of impervious surfaces on the Island and will decrease the area of pervious surfaces. This change in the relativity of impervious area to pervious area will alter the proportion of rainfall that becomes surface runoff, groundwater or is lost through evapo-transpiration. Annual runoff volumes, and particularly the distribution of rainfall to surface flow, groundwater and evapo-transpiration, have been analysed using continuous simulation analysis in the hydrologic module of MUSIC software. Table 11.8 below outlines the anticipated changes in average annual runoff volumes in the various catchments as a result of the proposed GKI Resort Revitalisation Plan. TABLE 11.8: Average Annual Volumes Estimated for Pre-Development & Post-Development Catchment Average annual volume to surface runoff (ML per year) Average annual volume to groundwater (ML per year) Average annual volume to evapotranspiration (ML per year) Average annual volume harvested from the roof water (ML per year) Pre- Post- Pre- Post- Pre- Post- Post The modelling suggests that the main change will comprise increases in surface runoff and groundwater recharge volumes in some catchments. The modelling suggests that installation of rainwater tanks to capture and reuse roof water from the ecotourism villas alone will remove approximately 19ML per annum from the volume that would otherwise become surface runoff. This is based on installation of 1,500 L of rainwater storage for each ecotourism villa. Given that it is proposed to provide rainwater capture and reuse on all core resort and marina facilities as described in section 9.2, the modelling provides an extremely conservative assessment of potential increases in stormwater runoff volumes. N-B016 Page 128
131 Water Cycle Management Report Great Keppel Island Resort Revitalisation Plan Furthermore, the modelling does not account for infiltration losses in the surface drainage and detention basin network, which could be expected to be relatively high given the permeability of the sandy soils on the Island. The harvesting of stormwater runoff for irrigation water supply proposed as part of the water cycle management strategy will also contributing to reducing surface runoff volumes. On this basis, it can reasonably be expected that actual surface runoff volumes discharging to the main waterways post-development will be somewhat less than the modelling predicts Frequent Flow Management To protect in-stream ecology of ephemeral freshwater waterways, SPP 4/10 requires development to manage the increase in the number of small runoff events that occur from impervious surfaces compared to natural vegetated surfaces. This objective is typically satisfied by capturing and managing the first 10mm of runoff from impervious surfaces each day. Geotechnical investigations undertaken on Great Keppel Island confirm that soils within the main precincts are sandy and characterised by high permeability, typically between 1.5m/day and 3.5m/day. Only two of the catchments affected by the GKI Resort Revitalisation Plan discharge to ephemeral freshwater streams, these being Catchment 9, which discharges to Putney Creek and Catchment 11, which discharges to Leeke s Creek. The proposed bio-retention and detention structures in these two catchments intercept all runoff from impervious surfaces before it reaches the respective defined waterways. In both catchments, the daily infiltration capacity of the treatment structures far exceeds the volume of the first 10mm of rainfall on the respective impervious surfaces. Table 11.9 below compares the required capture and disposal volume with the infiltration capacity of proposed treatment structures in each catchment. This comparison of capture and disposal volumes with infiltration capacity is conservative as it does not account for the additional infiltration that will occur from the surface drainage network. The comparison demonstrates that the proposed treatment structures provide more than sufficient capacity to manage frequent flows in accordance with SPP 4/10. TABLE 11.9: Frequent Flow Management - Comparison of Capture and Disposal Volume with Infiltration Capacity Catchment Total Impervious Area (ha) Required Daily Capture & Dispose Volume (ML) Area of Bio- Retention & Detention Structures (ha) Daily Disposal Capacity (ML) Ratio of Disposal Capacity to Requirement 9 Putney Creek Leeke s Creek N-B016 Page 129

132 Water Cycle Management Report Great Keppel Island Resort Revitalisation Plan Putney Creek Mouth Based on observations made during a site visit and discussions with local resident, Mr Gerry Christie, it is understood that the mouth of Putney Creek is regularly blocked by a sand bar (refer Photo 1). The sand bar is washed out occasionally by large storm runoff events and is then slowly rebuilt by normal wave processes on the beach. The sand bar effectively provides a sediment trap at the mouth of Putney Creek for smaller flow events (i.e. those that do not wash out the bar). When the bar is washed out, tidal flows are able to move in and out of the mouth until beach wave processes rebuild the bar and the wetland gradually reforms until the next large storm event. As a result, ecosystems present at the creek mouth are influenced by both periodic tidal and freshwater flows. Depending on the duration of the tidal / freshwater phases, observations made during a site visit indicate that dieback of more salt-tolerant vegetation may occur during prolonged periods of sand bar formation (refer Photos 2 and 3). Photo 11.1: Sand bar blockage of Putney Creek mouth observed during site visit (20 October 2010). N-B016 Page 130

. Photo 11.")

133 Water Cycle Management Report Great Keppel Island Resort Revitalisation Plan Photo 11.2: Vegetation near mouth of Putney Creek, showing apparent die-back of she-oaks (20 October 2010). Photo 11.3: Vegetation further inland of Putney Creek mouth compared to Photo 2, showing more extensive evidence of apparent die-back of she-oaks (20 October 2010). N-B016 Page 131
134 Water Cycle Management Report Great Keppel Island Resort Revitalisation Plan The natural hydrology of Putney Creek is believed to have been modified as a result of a number of previous land use activities, including but not limited to, construction of the existing runway, which it is understood, was built over semi-permanent waterholes and lagoons and blocked the natural drainage (CEPLA, 2011). Construction of the existing runway is likely to have modified flows within Putney Creek. However, it is uncertain whether past modification of flows has contributed to the current sand bar building process or whether this is a long standing natural process. Construction of the marina will prevent the sand bar building wave processes from occurring, which would likely result in the Putney Creek mouth opening up to tidal influence. However, this opening up of the creek mouth would also result in sediment deposition within the proposed marina basin. The Putney Creek mouth could therefore be treated in one of three general ways: Remove the bar and open the creek mouth so that the lower reaches of the creek will become tidal; OR Re-construct the creek mouth with an artificial bar (a weir set at the existing bar level) so that the creek at the mouth is always a freshwater wetland; OR Re-construct the mouth with a moveable artificial bar (a collapsible or moveable weir set normally at the existing bar level but designed to be lowered occasionally to allow occasional washing out). In relation to the above options, discussions with FRC Environmental, Chenoweth Environmental Planning and Landscape Architecture (CEPLA) and International Marina Consultants, identified that creation of an open tidal creek system was considered to be the most appropriate solution from both an ecological, amenity and maintenance perspective. By opening the creek mouth to regular tidal movement, fisheries productivity within the lower reaches of Putney Creek is expected to be increased significantly (FRC Environmental, 2011). Creation of a temporary or permanent barrier in an effort to replace the existing sand bar formation / removal process, would likely result in either permanent or temporary formation of a freshwater wetland system, which is likely to be less productive from a fisheries perspective. Given the levels of nutrients recorded within Putney Creek during water quality monitoring by FRC Environmental (2011), a closed system would likely be characterised by eutrophied conditions that could result in algal blooms with potential for consequent impacts on aquatic fauna and odour generation. For these reasons, opening of the Putney Creek mouth to reinstate what is likely to resemble the more natural hydrology prior to construction of the existing runway, would result in increased flushing and fisheries productivity. Accordingly, at the discharge point of Putney Creek into the marina, a permanent, lined, discharge channel will be established below the boardwalk and esplanade. The boardwalk and esplanade will bridge over the channel. A lined transition zone will be established within the channel upstream of the bridged area. Lining of the channel is required to prevent scouring, which would result in increased deposition of sediment within the marina basin. A range of options are available for lining the channel to prevent scouring with the preferred material to be selected on the basis of not only being able to reduce scour, but also to provide fisheries habitat and contribute to the aesthetics of the Marina Precinct. This may involve the use of placed rock, which will provide a relatively natural substrate for establishment of various encrusting marine species, as well as creating crevices and gaps to provide habitat and refuge for a wide range of marine flora and fauna. N-B016 Page 132
135 Water Cycle Management Report Great Keppel Island Resort Revitalisation Plan Based on advice from International Marina Consultants, a sediment basin has been incorporated into the proposed works at the Putney Creek mouth. The sediment basin will be constructed in the lined transition section of the channel. The sediment basin will reduce siltation within the marina thereby avoiding the need for ongoing maintenance dredging within the marina basin, which would result in ongoing disturbance of the marine environment. The design will include full provision for easy maintenance access by appropriate de-silting equipment STORMWATER QUALITY Model Inputs & Assumptions Rainfall and evaporation data from the Bureau of Meteorology s nearest recording (Site No Rockhampton) has been used in MUSIC modelling, with the adopted rainfall data sequence being in accordance with that required by the Urban Stormwater Queensland Best Practice Environmental Management Guidelines 2009 (i.e at 6 minute time steps). Soil characteristics adopted in the MUSIC have been calibrated in accordance with MUSIC calibration based on soil conditions using information from the geotechnical investigations (Douglas Partners, 2010) and are summarised as follows: TABLE 11.10: Soil Characteristics in MUSIC Model Soil Characteristic Calibrated Input Soil Storage Capacity 175 mm Field Capacity 75 mm Infiltration Capacity Coefficient - a 200 Infiltration Capacity Exponent - b 0.5 Initial Depth 50 mm Daily Recharge Rate 75% Daily Baseflow Rate 50% Daily Deep Seepage Rate 0% For the purpose of MUSIC modelling, it was assumed that rainwater from roof surfaces associated with the 750 proposed ecotourism villas only was capture d and reused. This provides a conservative assessment to modelling of potential stormwater quality impacts given that it is likely that rainwater capture and reuse will occur from the majority of roof surfaces within the GKI Resort Revitalisation Plan. The assumption of less roofwater capture and reuse conservatively overestimates the volume of runoff and thus pollutant loads in the modelling. Pollutant generation rates adopted for various land uses within the catchments containing elements of the GKI Resort Revitalisation Plan have been derived from the Southeast Queensland MUSIC Modelling Guidelines Version 1. Pollutant generation parameters for developed precincts within the GKI Resort Revitalisation Plan have been modelled using the Rural Residential pollutant export parameters derived from Table 3.9 of the Southeast Queensland MUSIC Modelling Guidelines Version 1. The pre-development scenario and undeveloped areas within the GKI Resort Revitalisation Plan have been modelled using the Forest pollutant export parameters derived from Table 3.9 of the Southeast Queensland MUSIC Modelling Guidelines Version 1. Full details of the extensive MUSIC analyses (including model structure and parameters) and results are included in Appendix K - Stormwater Quality Analyses. N-B016 Page 133
136 Water Cycle Management Report Great Keppel Island Resort Revitalisation Plan Management Concepts General Given the nature of the site and its environmental significance, it is important that stormwater quality improvement devices are robust and well proven. With that in mind, the choice of treatment devices has been limited to bio-retention basins, bio-retention swales and infiltration areas. These are all low impact structures and are key components of best practice water sensitive urban design. They are not visually intrusive and can generally be integrated with landscaping features. Maintenance requirements for such systems are not onerous and performance can be readily monitored by visual means. Wetland treatment systems are not considered to be desirable for treatment of stormwater runoff from the GKI Resort Revitalisation Plan, on the basis that: Wetland treatment systems typically require at least 10 times the surface area of a bio-retention basin to achieve the same reduction in pollutant loads and would therefore be likely to increase the development footprint; Wetland treatment systems are also more prone to problems that can reduce their effectiveness and attractiveness, including attraction of pests (i.e. Ibis); and Wetland treatment systems are often much more difficult to repair if required, due to accessibility issues for machinery within wet areas. Across a large proportion of the site, subsoils comprise of high permeability sand. The permeability of the subsoils determined through geotechnical investigations has been shown to be similar to the design permeability of the filters used in bio-retention basins or swales and significantly higher than that of typical mainland soils. Bio-retention filtrate can therefore drain directly to the sandy substrate with no specific under-drainage pipes required in the bio-retention areas. This will significantly reduce or avoid the need for an extensive network of drainage pipes and associated trenching that would otherwise be required. As such, the extent of ground disturbance and vegetation clearing likely to be required for installation of the stormwater treatment will generally be limited to that required for installation of the stormwater treatment devices themselves. Infiltration of treated stormwater through the base of the bio-retention facilities will also contribute to recharge of groundwater resources mimicking the natural rainwater infiltration that occurs on the Island. It will also eliminate the concentration of drainage flows to a limited number of discharge points, which significantly reduces the potential for scouring and erosion. An exception to this is the Marina Precinct where stormwater pollutant concentrations at the point of entry to the receiving water can be reduced by limiting the flow into the subsoils. Bio-retention basins in the Marina Precinct will have impermeable liners. As such, treated stormwater filtrate from these bioretention basins will be collected in under-drainage pipes and discharged into the marina rather than being discharged into the subsoil. Although bio-retention systems are capable of removing gross pollutants such as litter, frequent removal of debris is required to maintain effectiveness. In order to prevent litter from resort areas entering waterways where it may harm wildlife, specific gross pollutant traps will be installed as part of the stormwater treatment train in key locations where litter generation is most likely to be concentrated and where the risk of entering waterways is greatest (e.g. the Marina Precinct). N-B016 Page 134
137 Water Cycle Management Report Great Keppel Island Resort Revitalisation Plan Specific Concepts Hardstand Areas For hardstand areas (roads, paved and sealed areas, airstrip and apron, parking areas) surface runoff will drain off the sealed area in a dispersed flow via flush kerbs or the like, and into adjoining bioretention "cells". Where bio-retention cells are not able to be sited immediately adjacent to the sealed area, flows shall be directed to the relevant bio-retention cell via vegetated swales (as opposed to piped systems) wherever possible. Where piping is unavoidable, gully inlets should be sited in collector swales adjoining the sealed area, rather than in the sealed area itself. Ecotourism Villas For the ecotourism villas, roof runoff will be collected in gutters and piped to rainwater storage tanks for reuse. For the purpose of modelling, it has been assumed that 1,500L of storage tank is provided for each 200 m² of contributing roof area. Where provided, rainwater tanks will be plumbed to toilet fittings for flushing, washing machines and externally for landscape watering. In the event that tanks are empty due to a lack of rainwater, automatic switching valves or float arrangements in the storage tanks will allow potable mains water to be used until rainwater is available. All rainwater tank overflows will be directed to bio-retention cells. Where rainwater tanks are not provided, roof runoff is taken directly to the bio-retention cells for treatment prior to absorption into the natural underlying sandy soils. Although modelling has conservatively assumed that only the ecotourism villas will contain rainwater tank capture and reuse, it is likely that all other accommodation and commercial buildings within the GKI Resort Revitalisation Plan will also incorporate storage tanks for collection and reuse of rainwater as per the Queensland Development Code (QDC). In this case, a similar arrangement to the ecotourism villas will be established. Marina For the marina and associated retail wharf area, all roof surfaces and other sealed areas will be collected and treated in the manner described above for the ecotourism villas and hardstand areas. That is, unlike traditional approaches to stormwater management, runoff from these areas will be treated prior to discharge to the ocean. Golf Course Stormwater management on the proposed golf course will consist of the following elements: All surface runoff from the proposed golf course will be diverted to stormwater harvesting ponds for reuse for irrigation of the golf course; Golf course runoff will be directed to the stormwater harvesting ponds through a series of grassed swales and / or bio-retention basins to facilitate removal of gross pollutants (e.g. litter) sediment and nutrients prior to entering the stormwater harvesting ponds; N-B016 Page 135
138 Water Cycle Management Report Great Keppel Island Resort Revitalisation Plan Stormwater harvesting ponds will incorporate an overflow provided with appropriate scour protection and outletting to a grassed overland flow channel providing further treatment prior to ultimately discharging to Leeke s Creek; Stormwater will be prevented from draining into wet weather storage ponds containing recycled water for irrigation of the golf course; and Monitoring of water quality within the stormwater harvesting ponds will be undertaken as part of the irrigation management plan proposed for the golf course to ensure water quality is fit for purpose (refer Appendix H - Preliminary Irrigation Management Plan). High Risk Areas Specific stormwater management measures will be provided in high risk areas likely to contain significant quantities or types of contaminants not consistent with the assumptions of the stormwater modelling described in this section. This includes, but may not be limited to, areas used for the storage and handling of hazardous substances (e.g. chemicals, fuels and oils), bulk waste storage areas and maintenance workshops. In general, such areas will be designed to prevent stormwater coming into contact with contaminants (e.g. use of perimeter diversion systems, sealing and covering of the area) and to prevent the release of contaminants accidentally spilled or leaked within the area (e.g. bunding). Any stormwater that does enter such areas would be collected and tested to ensure compliance with relevant water quality standards prior to disposal. Further details are provided in Appendix M - Preliminary Hazardous Substance Management Plan and the Waste Management Report prepared by Opus International Consultants (2011a). To support the above stormwater quality improvement concepts, overall civil, landscape and architectural designs will incorporate appropriate surface shaping to facilitate surface flow transport systems and bio-retention requirements Analysis Results Detailed analysis results are provided in Appendix K - Stormwater Quality Analysis. The modelling and analysis results demonstrate that the proposed mitigation measures achieve two key results: Reductions in mean annual loads for modelled pollutants that exceed (i.e. are better than) than the target values specified in SPP 4/10 - Healthy Waters (refer to Table 11.11); and Modelled post-development pollutant concentrations at the point of discharge to receiving waters during flow events that are equal to or lower than the modelled concentrations at the same discharge points under the existing conditions (i.e. non-worsening) (refer to Table 11.12). A summary of mean annual load reduction results for each catchment is provided in Table below. N-B016 Page 136
139 Water Cycle Management Report Great Keppel Island Resort Revitalisation Plan Table 11.11: Summary of Mean Annual Pollutant Load Reduction Results Area Indicator Percent reduction target No treatment - mean annual load (kg year -1 ) Treated - mean annual load (kg year -1 ) Percent reduction modelled Complies? 5 TSS 85% % Yes TP 70% % Yes TN 45% % Yes GP 90% % Yes 7 TSS 85% % Yes TP 70% % Yes TN 45% % Yes GP 90% % Yes 8 TSS 85% % Yes TP 70% % Yes TN 45% % Yes GP 90% % Yes 9 TSS 85% % Yes TP 70% % Yes TN 45% % Yes GP 90% % Yes 11 TSS 85% % Yes TP 70% % Yes TN 45% % Yes GP 90% % Yes 14 TSS 85% % Yes TP 70% % Yes TN 45% % Yes GP 90% % Yes Table provides a comparison of pre-development and post-development (mitigated) stormwater runoff calculations and demonstrates no worsening of stormwater quality compared to the predevelopment scenario. Table 11.12: Comparison of Pre-Development and Post-Development Runoff Concentrations Catchment Indicator Existing (undeveloped) (mg/l) Developed (mitigated) (mg/l) Post-development concentrations are equal to or lower than existing? TSS (annual mean) Yes TP (annual median) Yes TN (annual median) Yes GP (annual median) Yes TSS (annual mean) Yes TP (annual median) Yes TN (annual median) Yes GP (annual median) Yes TSS (annual mean) Yes TP (annual median) Yes TN (annual median) Yes GP (annual median) Yes TSS (annual mean) Yes TP (annual median) Yes TN (annual median) Yes GP (annual median) Yes N-B016 Page 137
140 Water Cycle Management Report Great Keppel Island Resort Revitalisation Plan Catchment Indicator Existing (undeveloped) (mg/l) Developed (mitigated) (mg/l) Post-development concentrations are equal to or lower than existing? TSS (annual mean) Yes TP (annual median) Yes TN (annual median) Yes GP (annual median) Yes TSS (annual mean) Yes TP (annual median) Yes TN (annual median) Yes GP (annual median) Yes Stormwater Quality Improvement Devices Typical details of the proposed stormwater quality improvement structures are illustrated on drawing number R02 contained in Appendix L Stormwater Drawings. To enhance the overall environmental benefits, it is strongly recommended that a distributed or decentralised network of smaller bio retention "cells" should be provided, rather than larger, centralised catchment scale structures. Accordingly, sizing details have been provided in a "per unit" format. Table below details minimum sizing (area and depth) for stormwater quality management in the various catchments. As the detailed architectural, landscaping and civil engineering designs are developed, bio-retention structures for each specific contributing catchment area should be located in a distributed fashion throughout the developed areas to suit surface flow patterns and to enhance local landscaping. TABLE Stormwater Quality Improvement Devices - Minimum Sizing Requirements Area Bio-retention Basin Details per 1000m 2 of Catchment Area Filter Area (m 2 ) Surface Area (m 2 ) Extended Detention Depth (m) Relevant components of the stormwater quality improvement devices will be detailed generally in accordance with details and specifications contained in the Water Sensitive Urban Design Guidelines for South East Queensland (Healthy Waterways - Version 1 June 2006). N-B016 Page 138
141 Water Cycle Management Report Great Keppel Island Resort Revitalisation Plan Post-Construction Monitoring Operational testing of full-scale constructed stormwater quality management devices has shown that correctly designed and constructed devices actually perform better than is anticipated by modelling. Accordingly, provided that stormwater quality management devices are: modelled using appropriate software (MUSIC); detailed in accordance with the Water Sensitive Urban Design Technical Design Guidelines; and constructed as detailed; then no specific operational testing is necessary. As indicated earlier, the proposed stormwater quality improvement treatment train has been specifically chosen to be robust and with proven performance. That is: Performance monitoring is largely visual; Regular maintenance is generally limited to plant health checks and removal of sediments and litter; and Regular maintenance can largely be carried out by general landscaping maintenance personnel. A preliminary stormwater quality maintenance plan is included in Appendix H - Preliminary Stormwater Quality Maintenance Plan. N-B016 Page 139
142 Water Cycle Management Report Great Keppel Island Resort Revitalisation Plan 12. POTENTIAL IMPACTS AND MITIGATION MEASURES 12.1 OVERVIEW A risk assessment of potential environmental impacts associated with proposed water cycle management aspects of the GKI Resort Revitalisation Plan has been undertaken and is described in the following section, along with proposed mitigation measures to address each identified risk. A standard risk assessment matrix as presented in Table 12.1 has been used for the purpose of assessing risks associated with water supply, wastewater and stormwater drainage strategies proposed for the GKI Resort Revitalisation Plan. TABLE 12.1: Risk Assessment Matrix Consequences Probability Insignificant Minor Moderate Major Catastrophic Rare Low Low Low Low Medium Unlikely Low Low Medium Medium Medium Moderate Low Medium Medium High High Likely Low Medium High High Extreme Almost Certain Medium Medium High Extreme Extreme The following risk assessment has been based on the proposed water supply, wastewater and stormwater management strategies outlined in sections 9, 10 and 11 of this Report. A summary of potential impacts and proposed mitigation measures associated with water cycle management as part of the GKI Resort Revitalisation Plan is provided in Table 12.2 below. TABLE 12.2: Summary of Potential Water Supply, Wastewater & Stormwater Impacts and Proposed Mitigation Measures Potential Impact Risk Level (Unmitigated) Construction of Water Cycle Infrastructure Removal of vegetation for construction of water cycle infrastructure resulting in loss of habitat and increased risk of erosion and sedimentation of waterways. Risk Level (Mitigated) Mitigation Measures High Low Where possible, water cycle infrastructure requiring trenching will be co-located with other infrastructure (e.g. roads) to reduce the extent of vegetation clearing required. Proposed stormwater drainage systems N-B016 Page 140
143 Water Cycle Management Report Great Keppel Island Resort Revitalisation Plan Potential Impact Risk Level (Unmitigated) Risk Level (Mitigated) Mitigation Measures have been designed to maximise the use of surface flow paths (e.g. swales) for conveying stormwater from source to destination to reduce the need for installation of extensive underground piped drainage systems. Sandy subsoils will enable filtered stormwater from bio-retention treatment systems to infiltrate into natural soils to recharge groundwater and mimic the natural hydrologic system on the Island, which will also reduce the need for installation of extensive underground piped drainage systems. Rehabilitation of all areas cleared for construction of water cycle infrastructure will be provided in accordance with the requirements of relevant statutory authorities. Where necessary, environmental offsets will be provided for cleared vegetation in accordance with the relevant guidelines and policies for providing such offsets. Excavation and filling for construction of water cycle infrastructure resulting in increased risk of erosion and sedimentation of waterways. Low Low As noted above, the need for excavation and filling will be reduced by co-locating water cycle infrastructure with roads and other infrastructure, and utilising stormwater drainage systems that do not require extensive underground piped drainage networks. Best practice erosion and sediment control measures will be implemented for all works associated with construction of water cycle infrastructure. Rehabilitation of all disturbed areas will be provided in accordance with the requirements of relevant statutory authorities and will occur progressively throughout construction to minimise the duration of soil exposure to erosive forces. A preliminary erosion and sediment control plan has been prepared to outline a range of controls that should be implemented during construction of the GKI Resort Revitalisation Plan to reduce erosion and N-B016 Page 141
144 Water Cycle Management Report Great Keppel Island Resort Revitalisation Plan Potential Impact Risk Level (Unmitigated) Risk Level (Mitigated) Mitigation Measures sedimentation issues (refer to Appendix O - Preliminary Erosion and Sediment Control Plan). Disturbance of acid sulphate soils for construction of water cycle infrastructure (e.g. mainland water supply connection, emergency ocean outfall) resulting in release of acid discharge and heavy metals impacting on water quality and ecological communities. Stormwater diversion systems will be designed to prevent inundation of work sites and erosion and sediment control measures will be designed to remain effective during more intense rainfall events projected to occur as a result of climate change. A 20% buffer will be applied to maximum design flows to allow for a possible 16% increase in the intensity of a 24-hour rain event projected for 2070 (Opus International Consultants, 2011b). Medium Low Construction of water cycle infrastructure within areas containing potential acid sulphate soils shall be avoided as far as practicable through careful selection of infrastructure alignments in consultation with the relevant authorities and geotechnical advice. From initial geotechnical report, sandy soils are prevalent throughout the Island with low probability of acid sulphate soils. A potential source of acid sulphate soils would be in excavations in and near the tidal zone associated with the water pipeline and power/ communications cable. This will be minor in extent compared to the project size and can be managed as below. All construction works in areas containing potential acid sulphate soils will be undertaken in accordance with a site specific acid sulphate soil management prepared in accordance with SPP 2 / 02 Planning and Managing Development Involving Acid Sulphate Soils and the Queensland Acid Sulphate Soil Technical Manual. Construction of water cycle infrastructure within watercourses interfering with the flow of water and providing barriers to fish movement (e.g. pipeline and access road crossings, detention basins) resulting in decreased biodiversity. Medium Low The location of proposed roads and water cycle infrastructure will be selected to minimise the need for waterway crossings or where possible, will utilise existing crossings to avoid further interference. All works within waterways supporting the movement of fish and other aquatic fauna N-B016 Page 142
145 Water Cycle Management Report Great Keppel Island Resort Revitalisation Plan Potential Impact Risk Level (Unmitigated) Risk Level (Mitigated) Mitigation Measures should be designed in accordance with Fisheries Queensland s Self Assessable Codes for Temporary and Minor Waterway Barrier Works and other relevant design guidelines for maintaining fish passage through such structures. Construction of water cycle infrastructure in tidal waters (e.g. mainland water supply connection, emergency ocean outfall) resulting in disturbance of marine plants and benthic habitat and increased turbidity. High Medium Exact positioning of water cycle infrastructure within tidal waters will be determined in consultation with relevant authorities based on ecological assessments to determine the least impact alignment feasible. Preference will be given to the use of construction techniques and equipment that result in the minimum level of disturbance and footprint feasible. Best practice erosion and sediment control measures will be implemented for all works within tidal waters. Rehabilitation of all disturbed areas will be provided in accordance with the requirements of relevant statutory authorities. Where necessary, environmental offsets will be provided for all marine plant removal in accordance with the relevant guidelines and policies for providing such offsets. Operation of Water Supply Infrastructure Water consumption within resort facilities exceeds projected water demands resulting in increased supply costs, need for infrastructure upgrades and increased pressure on valuable water resources. Medium Low Regular water efficiency audits will be undertaken by the resort, approximately every 5 years, to ensure fixtures and fittings continue to achieve desired levels of water use efficiency and to identify any losses in the water supply system due to leakage or unauthorised connections. To enable monitoring of water usage and to inform water efficiency audits, flow meters will be installed on all water supply sources, including the mainland water supply connection, distribution systems for reuse of recycled water and harvested stormwater and groundwater production bores for Stage 1 construction. Records shall be kept of all water usage for at least N-B016 Page 143
146 Water Cycle Management Report Great Keppel Island Resort Revitalisation Plan Potential Impact Risk Level (Unmitigated) Risk Level (Mitigated) 5 years. Mitigation Measures Critical water supply infrastructure such as the mainland water supply connection will be sized using appropriate peaking factors considering potential internal demands associated with peak occupancy and peak irrigation demands associated with low rainfall periods. Regular awareness training shall be provided to all staff in relation to the importance of water use efficiency. Information shall be provided to guests through resort signage and other applications (e.g. Smartphone apps). Information relating to water usage by the GKI Resort Revitalisation Plan, including water supply sources used, will regularly be made available to the public through the resort s website or other means to demonstrate the resort s sustainability performance. Damage to mainland water supply connection resulting in disruption to water supply services on the Island. High Medium The main will be buried up to 1.2 m below the sea bed and signposted to ensure that the risk of physical damage (eg dragging of anchors etc) is minimised. In the event of damage to the mainland water supply connection, preservation of stored water will be a priority and water restrictions applied. Where necessary, potable water supplies may be transported to the Island by barge. In the event of extended disruption to the mainland water supply connection, consideration will be given to reducing guest occupancy and staffing to preserve the available water supply. Excessive extraction of groundwater resulting in lowering of water tables impacting on groundwater dependent ecosystems. Medium Low Groundwater will not be used as a primary source of water supply during operation of the GKI Resort Revitalisation Plan. Groundwater extraction from existing production bores within the Long Beach Aquifer will be used for Stage 1 N-B016 Page 144
147 Water Cycle Management Report Great Keppel Island Resort Revitalisation Plan Potential Impact Risk Level (Unmitigated) Risk Level (Mitigated) Mitigation Measures construction water supply only. Extraction from the Long Beach production bores will not exceed 100kL/day in accordance with the assessed sustainable yield, which is more than adequate to meet projected constructed water demands of up to 90 kl/day. Flow meters will be installed on these bores to monitor extraction and records will be kept to ensure the sustainable yield is not exceeded. No production bores will be installed in the Central Dune Aquifer or North West Aquifer. No extraction from existing bores within the Resort Aquifer will occur during any stage of the Project. Monitoring of groundwater levels and water quality will be undertaken for the GKI Resort Revitalisation Plan for any periods during which groundwater extraction and / or recycled water irrigation occur on the Island. Excessive extraction of Medium Low As above. groundwater resulting in lowering of water tables and saline intrusion, which could impact on availability of suitable water supply to other users. Operation of Wastewater Infrastructure Irrigation of recycled water resulting in runoff of nutrients causing contamination of surface water resources. Medium Low Proposed recycled water irrigation areas are located within sandy soils characterised by high permeability and therefore low likelihood of runoff. A detailed water and nutrient balance has been undertaken and based on the proposed irrigation regime, no direct runoff of recycled water will occur. Further, runoff rates predicted by MEDLI modelling for the proposed irrigation scheme will be less than predicted rates of runoff under no irrigation due to the enhanced rates of evapo-transpiration achieved by increased plant coverage supported by irrigation. Implementation of the proposed irrigation scheme in accordance with Appendix H - Preliminary Irrigation Management Plan N-B016 Page 145
148 Water Cycle Management Report Great Keppel Island Resort Revitalisation Plan Potential Impact Risk Level (Unmitigated) Risk Level (Mitigated) Mitigation Measures combined with the naturally low risk of runoff will therefore significantly reduce the risk of runoff from the irrigation area. Irrigation of recycled water resulting in excessive leaching of nutrients causing contamination of groundwater resources. High Low All recycled water will be treated to achieve a total nitrogen concentration of <20mg/L and a total phosphorous concentration of less than 7mg/L. A detailed water and nutrient balance has been undertaken and demonstrates that recycled water treated to the proposed standard will not result in leaching of nutrients in excess of the rates expected to occur naturally and will result in nitrogen and phosphorous concentrations in groundwater that comply with water quality objectives for discharge to Leeke s Creek and Wetland. Further modelling to roughly simulate application of fertilisers within the irrigation area has established an indicative sustainable load for nitrogen application of kg/ha/year and phosphorous application of 47.4 kg/ha/year. In conjunction with regular monitoring of soils and groundwater quality proposed in Appendix H - Preliminary Irrigation Management Plan, these indicative loads will be used as the basis for developing a golf course maintenance plan to reduce the risk of nutrients entering groundwater and surface water resources on and around the Island. Irrigation of recycled water resulting in raised water tables, saturation of soils and / or ponding within the irrigation area. Medium Low Proposed recycled water irrigation areas are located within sandy soils characterised by high permeability and therefore high rates of deep drainage and groundwater recharge. A detailed water and nutrient balance has been undertaken and based on the proposed irrigation regime, deep drainage rates would increase by less than 5% above deep drainage rates predicted by MEDLI modelling for the irrigation area under no irrigation scheme. N-B016 Page 146
149 Water Cycle Management Report Great Keppel Island Resort Revitalisation Plan Potential Impact Risk Level (Unmitigated) Risk Level (Mitigated) Mitigation Measures Implementation of the proposed irrigation scheme in accordance with Appendix H - Preliminary Irrigation Management Plan combined with the naturally low risk of ponding due to sandy soils will therefore significantly reduce the risk of these issues arising in the irrigation area. However, monitoring is also proposed under Appendix H - Preliminary Irrigation Management Plan to detect any changes in groundwater levels that may occur. Irrigation of recycled water resulting in decreased plant health and soil quality within the irrigation area due to excessive salinity. Medium Low All recycled water will be treated to achieve a maximum total dissolved solids level of 1,000mg/L. A detailed water and nutrient balance has been undertaken and demonstrates that recycled water treated to the proposed standard will not result in any impacts on plant health or soil quality. Implementation of the proposed irrigation scheme in accordance with Appendix H - Preliminary Irrigation Management Plan combined with the naturally sandy soils will therefore significantly reduce the risk of salinity issues arising in the irrigation area. However, monitoring is also proposed under Appendix H - Preliminary Irrigation Management Plan to detect any changes in groundwater levels that may occur. Exposure of the public to recycled water as a result of spray drift during recycled water irrigation causing nuisance or illness. High (Likely / Major) Low (Unlikely / Minor) All recycled water used for irrigation will be treated to a standard suitable for irrigation of public open space with unrestricted access in accordance with the Australian Guidelines for Water Recycling: Managing Health and Environmental Risks (Phase 1) (ANZECC, 2006), which is characterised by an E. coli level less than 1 cfu/100ml. However, in addition to this, to further reduce the risk of public exposure to recycled water, it is intended that irrigation of the golf course will primarily occur overnight when no players will be on the N-B016 Page 147
150 Water Cycle Management Report Great Keppel Island Resort Revitalisation Plan Potential Impact Risk Level (Unmitigated) Risk Level (Mitigated) course. Mitigation Measures The potential for spray drift into villas will be further reduced through the use of lowthrow sprinklers producing large droplet size, use of sub-surface or surface dripper systems instead of spray irrigation within metres of villas or other sensitive receivers and avoiding irrigation during windy conditions when prevailing winds are likely to spread spray drift beyond the boundaries of the irrigation area. Signage will be provided within recycled water irrigation areas notifying the public that recycled water is used and contact should be avoided. Exposure of the public to recycled water as a result of storage of recycled water in open ponds on the golf course causing illness. High Low All recycled water discharged to wet weather storage ponds will be treated to a standard suitable for irrigation of public open space with unrestricted access in accordance with the Australian Guidelines for Water Recycling: Managing Health and Environmental Risks (Phase 1) (ANZECC, 2006), which is characterised by an E. coli level less than 1 cfu/100ml. Signage will be provided around all wet weather storage ponds notifying the public that the storage contains recycled water and contact should be avoided. Access to the ponds for retrieval of balls etc will be further discouraged by planting of vegetation (e.g. sedges, reeds) around the perimeter of the ponds. Deterioration of water quality within recycled water storage ponds causing algal blooms and odour nuisance. Medium Low All recycled water discharged to wet weather storage ponds will be treated to a standard suitable for irrigation of public open space with unrestricted access in accordance with the Australian Guidelines for Water Recycling: Managing Health and Environmental Risks (Phase 1) (ANZECC, 2006). The proposed standard of treatment is characterised by relatively low levels of nutrients to reduce the potential for cyanobacterial and other algal blooms, and low N-B016 Page 148
151 Water Cycle Management Report Great Keppel Island Resort Revitalisation Plan Potential Impact Risk Level (Unmitigated) Risk Level (Mitigated) Mitigation Measures levels of organic matter that reduce the risk of odour generation. Regular maintenance of recycled water storage ponds will be carried out to control pests in accordance with relevant statutory requirements, including managing excessive wildlife populations, that may reduce water quality within the storage. Emergency discharge of recycled water via ocean outfall reducing water quality and impacting on ecological communities. The potential for algal blooms will be significantly reduced by maintaining regular turnover of water within the storage through inflows and outflows. Where necessary, additional mechanical aeration may be required. Medium Low All recycled water shall be treated to achieve a total nitrogen concentration of <20mg/L, a total phosphorous concentration of less than 7mg/L and an E. coli level less than 1 cfu/100ml. MEDLI modelling indicates that less than 1% of all recycled water produced will be discharged via ocean outfall over the life of the Project. MEDLI modelling based on provision of a 37ML wet weather storage pond also indicates that discharge will occur on average, once every ten years during extreme or prolonged wet weather events similar to those rain events that occurred in 1957, 1974, 1989 and To account for possible increases in rainfall intensity as a result of climate change, open recycled water storages shall incorporate an additional 7 ML storage buffer which equates to about a 20% increase in the storage requirements identified by MEDLI modelling to achieve 99% reuse of recycled water. This additional storage capacity will provide a buffer for storing additional rainfall from more intense rain events, prior to overtopping of ponds discharging via the ocean outfall. It is therefore likely that the actual frequency of discharge will be significantly less than once every 10 years. The location of the proposed ocean outfall pipeline for emergency discharge of N-B016 Page 149
152 Water Cycle Management Report Great Keppel Island Resort Revitalisation Plan Potential Impact Risk Level (Unmitigated) Risk Level (Mitigated) Mitigation Measures recycled water has been selected in accordance with GBRMPA requirements relating to separation to particular use areas and depth of water requirements and to maximise dispersion of possible pollutants. Modelling of pollutant dispersion by Water Technology (2011) indicates that water quality objectives will be achieved with only a relatively small mixing zone surrounding the outfall. Damage to ocean outfall pipeline preventing emergency discharge of recycled water when required resulting in uncontrolled overtopping of storage facilities. Medium Low Regular inspections of the ocean outfall pipeline will be conducted and any necessary repairs undertaken promptly to ensure it is available for use when required. In the extremely unlikely event that the ocean outfall pipeline is not available at a time when wet weather storage facilities reach capacity due to prolonged wet weather, to prevent uncontrolled overtopping of the storage facility, the level of recycled water contained within the storage will be reduced, in consultation with the relevant authorities, by irrigation to the designated irrigation area regardless of soil moisture levels. Generation of odour caused by operation of the sewage treatment plant and associated collection & storage systems causing nuisance at a sensitive place. High Low To reduce the potential for odours at the sewage treatment plant, a packaged plant such as MBR is proposed as the process components are effectively sealed within the plant. Odour issues may arise in the event of power failure when influent is diverted to temporary storage in open ponds adjacent to the plant; however such events are expected to be rare. Nevertheless, appropriate buffer distances will be provided between the WWTP and sensitive receivers to reduce the potential for odour nuisance. Odour control within the collection system would be achieved by sealing of all manholes and pumping stations, thus containing any odours within the system. N-B016 Page 150
153 Water Cycle Management Report Great Keppel Island Resort Revitalisation Plan Potential Impact Mechanical malfunction or electricity failure affecting the sewerage collection system resulting in release of untreated sewage to the environment. Risk Level (Unmitigated) Risk Level (Mitigated) Mitigation Measures High Low The gravity sewer system would be unaffected by a power outage up until the collection well of pumping stations. Any individual unit grinder pump stations will be designed with storage capacity within the pump collection well for 4 hours at ADWF to allow for repairs or back-up generators to be connected. Main pumping stations would be provided with 100% stand-by pumping capacity within the station to cover pump mechanical breakdown and an alarm system on separate power supply (e.g. solar panels) to advise maintenance staff of power or mechanical failure. Main pumping stations would also be provided with capacity within the emergency back-up generator for the resort and / or provision (i.e. power bypass switch) within the pumping station to connect up an individual emergency generator brought to the pumping station to cover power failures. A minimum of 2 hours storage capacity at ADWF would be provided within the pump station wet wells and contributing reticulation (and overflow storage if required). Mechanical malfunction of the sewerage treatment plant resulting in release of untreated sewage to the environment. High Low Due to staging requirements and operational flexibility, the treatment system would involve duplication (or triplication) of treatment plant processes. This will allow for one system to be out of service for short periods in the event of maintenance requirements (programmed maintenance being undertaken at low flow / low occupancy times) or emergency breakdown situations due to mechanical malfunction. Loss of electricity supply resulting in shutdown of sewerage collection and treatment systems resulting in release of untreated sewage to the environment. High Low The potential for electricity supply to the sewerage collection and treatment systems to be interrupted will be significantly reduced by the proposal to install solar panels on the Island to provide 100% of the Project s electricity supply needs. Given N-B016 Page 151
154 Water Cycle Management Report Great Keppel Island Resort Revitalisation Plan Potential Impact Risk Level (Unmitigated) Risk Level (Mitigated) Mitigation Measures the proposed installation of a mainland electricity supply connection as a back-up, sewerage collection and treatment systems will have access to dual electricity supply systems. Emergency back-up generators will be provided to the treatment plant(s). Electricity distribution around the Island is proposed to be provided underground thus significantly reducing the risk of damage during a cyclonic event. In the event of a power outage, the treatment plant would be designed to redirect incoming wastewater to a 0.4ML lined storage pond alongside the plant, which has been sized to contain up to peak occupancy of 3,750EP at ADWF for approximately 10 hours. This storage capacity has been determined to provide sufficient storage for the estimated time required to restore power or reduce occupancy of the resort to reduce incoming sewage. After power is restored, the bypassed flow would then be returned from the storage pond back through the plant for treatment. Back-up generators will be installed to maintain operation of critical components of the treatment plant such as pumping systems. Operation of Stormwater Infrastructure Increased peak discharge velocities causing scouring and erosion in downstream drainage lines and impacting on waterway stability. Increased frequency of small runoff events altering flow regimes and in-stream habitat within receiving waters, impacting on biodiversity. High Low The proposed stormwater management strategy for the site includes provision for detention within each catchment containing elements of the GKI Resort Revitalisation Plan (except Catchment 14 Marina Precinct as discussed in section 11). Proposed detention has been sized to ensure peak discharge flow rates do not exceed peak discharge flow rates for an undeveloped catchment. Medium Low Putney Creek and Leeke s Creek catchments are the only catchments containing elements of the GKI Resort Revitalisation Plan that contain ephemeral freshwater streams. N-B016 Page 152
155 Water Cycle Management Report Great Keppel Island Resort Revitalisation Plan Potential Impact Risk Level (Unmitigated) Risk Level (Mitigated) Mitigation Measures Due to the high permeability sandy soils in these catchments, infiltration from detention and bio-retention facilities will be high. The infiltration capacity of proposed detention and bio-retention facilities has been assessed as being sufficient to account for the first 10mm or first flush of rainfall from impervious surfaces. As such, the potential for an increase in frequency of small scale runoff events will be reduced in accordance with SPP 4/10 and therefore no significant alteration of instream habitats is expected to occur. Rainfall events exceed the design capacity of stormwater drainage systems resulting in flooding of buildings and other facilities, and possible flooding of neighbouring properties. Rainfall events exceed the design capacity of stormwater treatment systems resulting in release of untreated stormwater runoff Discharge of contaminated stormwater runoff from high risk areas to receiving waters impacting on water quality and environmental values. High Medium Stormwater drainage systems installed on the Island will be designed to manage flows up to a 1 in 100 year AEP storm event. To account of possible increases in rainfall intensity, stormwater infrastructure will be designed with an increased capacity sized to account for projected increases in rainfall intensity, including 48% increase for 2-hour event, 16% increase for 24-hour and 14% increase for 72-hour event. Medium Low As above, but note that in such extreme rainfall events, dilution will be significant factor in lowering risk associated with untreated stormwater releases. Medium Low High risk areas containing hazardous substances or other potentially toxic materials or activities will be designed to prevent stormwater flowing into potentially contaminated areas (e.g. diversion drains, roofing) and containing any stormwater collected in potentially contaminated areas (e.g. bunding). Collected stormwater from such areas would be tested prior to disposal at an approved location. Further management strategies for potentially contaminated areas are contained in Appendix M - Preliminary Hazardous Substances Management Plan and the Waste Management Report (Opus International Consultants, 2011a). Removal of sand bar at mouth of Medium Low All proposed works within the mouth of N-B016 Page 153
156 Water Cycle Management Report Great Keppel Island Resort Revitalisation Plan Potential Impact Putney Creek resulting in increased tidal exchange within the lower reaches of the channel, possibly altering riparian vegetation and in-stream flora and fauna. Risk Level (Unmitigated) Risk Level (Mitigated) Mitigation Measures Putney Creek will be undertaken in accordance with statutory requirements and based on comprehensive ecological assessments. Preliminary ecological advice indicates that opening up of the Putney Creek mouth to tidal movement will increase fisheries productivity and increase flushing that will reduce potential for creation of eutrophied conditions and odour nuisance. N-B016 Page 154
157 Water Cycle Management Report Great Keppel Island Resort Revitalisation Plan 13. CONCLUSION This Report outlines a holistic strategy for managing water supply, wastewater and stormwater aspects of the GKI Resort Revitalisation Plan consistent with the principles of water sensitive urban design. The proposed water cycle management strategy has been designed to: Protect existing natural features and ecological processes; Maintain the natural hydrologic behaviour of catchments; Protect water quality of surface and ground waters; Minimise demand on the reticulated water supply system; Minimise sewage discharges to the natural environment; and Integrate water into the landscape to enhance visual, social, cultural and ecological values. Water Supply Based on an evaluation of available water resources, the most suitable and sustainable means of providing water supply to the GKI Resort Revitalisation Plan will include a combination of the following: A mainland water supply connection via a new pipeline installed within the Utility Services Corridor; Installation of rainwater storage tanks for all resort buildings to capture and reuse roof water for non-potable purposes (e.g. toilet flushing, washing machines and garden watering); Installation of stormwater harvesting and storage facilities throughout resort area, and reuse of harvested stormwater for landscape irrigation and hardscape hose down (subject to further assessment in the design stage); Reuse of recycled water produced from effluent generated by the resort for irrigation of the golf course and possibly other landscaped areas; and Incorporation of stormwater harvesting ponds within the golf course to capture runoff and reuse for irrigation of the golf course. Substantial groundwater resources are available on the Island and have the potential to supply up to 36 percent of the total mains water demand for the GKI Resort Revitalisation Plan with a total combined maximum yield for all aquifers of 460kL/day, including a maximum yield of 270kL/day from the North East Aquifer alone. However, use of groundwater as a primary water supply source during operation was not considered appropriate due to the potential for saline intrusion as shown by the historically poor management of this resource on GKI. Rather, apart from short-term, small-scale use for Stage 1 construction water supply, groundwater aquifers will be allowed to recover from past overuse so as to provide a better quality and more sustainable resource for other Island users. Although desalination could potentially meet the full water demands of the Project and was used by the previous resort, operation of a desalination plant on the Island would significantly increase energy consumption and would involve discharge of highly saline brine into the Marine Park. As such, this N-B016 Page 155
158 Water Cycle Management Report Great Keppel Island Resort Revitalisation Plan water supply option was not considered to be consistent with the sustainability objectives of the GKI Resort Revitalisation Plan. Rainwater tanks are considered to be an integral component of the proposed water supply strategy for the GKI Resort Revitalisation Plan. Although not capable of supplying the total water demands of the Project, rainwater tanks comprise a relatively low energy, low cost, easy to maintain and sustainable method of supplying water to significantly reduce overall mains water supply requirements. Opportunities have also been identified within the GKI Resort Revitalisation Plan to capture and reuse stormwater runoff for irrigation of the golf course and landscaped areas. In addition to providing an additional source of irrigation water supply, harvesting of stormwater runoff from the golf course will assist in intercepting any residual fertilisers that may remain on the golf course enabling these nutrients to be reused via irrigation and preventing their release to natural waterways downstream. Wastewater The proposed strategy to manage wastewater generated by the GKI Resort Revitalisation Plan, will involve: A wastewater collection system utilising NuSewers and other similar technologies that are designed to minimise groundwater infiltration (due to the high water table on the Island), thus reducing treatment costs, along with sewage pumping stations (where required); An Island-based wastewater treatment plant (or treatment plants) designed to treat wastewater to a standard suitable for Municipal Use open spaces, sports grounds, golf courses, dust suppression, etc or unrestricted access and application under the Australian Water Quality Guidelines for Water Recycling: Managing Health and Environmental Risks (Phase 1) (ANZECC, 2006) with nutrient removal to achieve a total nitrogen concentration of 20mg/L and a total phosphorous concentration of 7mg/L; Beneficial reuse of almost 100% of recycled water produced by Island-based WWTPs for irrigation of the golf course (approximately 31 hectares) and possibly other landscaped areas around the resort; Emergency discharge of recycled water via an ocean outfall extending from Long Beach, during periods of extreme wet weather, which is expected to occur once every 10 years on average, resulting in less than 1% of total recycled water produced being discharged over a 50 year period; and A wet weather storage facility with a capacity of 44ML incorporating a 7ML buffer to account for projected increases in rainfall intensity as a result of climate change, which will be incorporated into the golf course design. Although the exact treatment system to be used for the Island-based WWTP(s) will be determined at a later design stage, a package treatment plant utilising MBR technology or similar is preferred as such systems are capable of achieving the required standard of treatment, have a relatively small footprint, can be almost fully sealed to reduce odour generation and allow for the installation of multiple parallel treatment plants to support staging of the Project and provide operational flexibility. N-B016 Page 156
159 Water Cycle Management Report Great Keppel Island Resort Revitalisation Plan A comprehensive water and nutrient balance has been modelled and demonstrates that the proposed recycled water irrigation scheme will not increase nutrient leaching or runoff rates compared to modelling of a no irrigation scenario. Modelling of nutrient concentrations in groundwater at the point of discharge to Leeke s Creek has demonstrated compliance with relevant water quality objectives. Modelling of possible emergency discharge of recycled water via ocean outfall has also demonstrated that nutrient levels will achieve compliance with relevant water quality objectives within a very small mixing zone and are therefore unlikely to impact on ecological communities. The high standard of treatment proposed for recycled water will not only mitigate potential impacts on the environment, but will also significantly reduce potential human health impacts should persons come into contact with recycled water. To further reduce this risk, additional controls have been proposed including the use of large droplet fixtures on spray irrigators, use of sub-surface or surface dripper systems in the vicinity of sensitive receivers, scheduling irrigation to occur at night and installing signage for all irrigation areas and recycled water storages. By maximising beneficial reuse of wastewater generated by the GKI Resort Revitalisation Plan and ensuring such reuse is undertaken in a manner to prevent adverse impacts on the environment or human health, the GKI Resort Revitalisation Plan will establish a benchmark in sustainable tourism development within the Great Barrier Reef Marine Park. Stormwater The proposed stormwater management strategy for the GKI Resort Revitalisation Plan has been designed to: Comply with the requirements of the State Planning Policy 4/10 Healthy Waters and the draft Urban Stormwater - Queensland Best Practice Environment Management Guidelines 2009, Minimise the use of underground piped drainage systems by utilising surface drainage techniques that reduce the need for extensive excavation while enabling drainage systems to be integrated into landscape design and reducing the concentration of drainage flows to a limited number of discharge points; Support the collection and reuse of rainwater from impervious roof surfaces to mitigate peak flow rates while also providing an alternative water supply for resort facilities; and, Support the harvesting of stormwater runoff from the golf course and possibly other areas around the resort, to reduce the potential discharge of pollutants while also providing an alternative water supply for irrigation. A series of detention basins and bio-retention systems will be installed throughout catchments containing the GKI Resort Revitalisation Plan to: Attenuate peak discharge flow rates to lower than existing levels for all standard average recurrence interval storm events from 1 year to 100 years; Facilitate infiltration of increased surface runoff volumes into highly permeable, sandy subsoils mimicking the natural groundwater recharge process that occurs on the Island; and N-B016 Page 157
160 Water Cycle Management Report Great Keppel Island Resort Revitalisation Plan Intercept and temporarily store surface flows from small runoff events so as to avoid any increase in the number of small runoff events discharging to ephemeral waterways that could potentially alter in-stream ecology. Detention structures will comprise low impact designs utilising low grassed or vegetated mounds enclosing open space that can be readily incorporated as part of the landscape design for the Project. Best practice vegetated bio-retention systems, including bio-retention basins, swales and infiltration areas will be installed to remove gross pollutants, sediments and nutrients from stormwater flows prior to discharge. Modelling demonstrates that proposed stormwater quality improvement measures will readily achieve required annual pollutant load reduction targets and will result in no worsening of stormwater pollutant concentrations compared to modelling of the pre-developed catchment. It has also been proposed to permanently open the mouth of Putney Creek to tidal movements, which will increase fisheries productivity and flushing to prevent the formation of eutrophied conditions that may contribute to algal blooms and subsequent odour nuisance. To achieve this, a lined discharge channel will be constructed below the boardwalk and esplanade, with a sediment basin incorporated towards the upstream end of the new channel. This will reduce the potential for silting up of the marina basin thereby reducing the need for ongoing maintenance dredging. N-B016 Page 158
161 Water Cycle Management Report Great Keppel Island Resort Revitalisation Plan 14. BIBLIOGRAPHY ANZECC and ARMCANZ (2000). Australian and New Zealand Guidelines for Fresh and Marine Water Quality, Primary Industries. Cooperative Research Centre for Water Quality and Treatment (2008). Guidance Manual for the Design and Installation of Urban Roofwater Harvesting Systems in Australia (Edition 1), Research Report 39 Foresight Partners Pty Ltd (2011). Forecast Economic Impacts report for Proposed Revitalisation of Great Keppel Island Livingstone Shire Council (2005). Planning Scheme Policy No. 5, Development Contributions for Water Supply and Sewerage SA Water (2006). Rainwater Plumbing Guide State of Queensland EPA (2005). Queensland Water Recycling Guidelines Sustainable Solutions International Pty. Ltd (2007). Great Keppel Island Water, Wastewater Infrastructure Audit Report Australian and New Zealand Environment and Conservation Council (1997). Best Practice Guidelines for the Provision of Waste Reception Facilities at Ports, Marinas and Boat Harbours in Australia and New Zealand Environmental Institute for Golf (2009). Nutrient Use and Management on U.S. Golf Courses, Golf Course Environmental Profile, Golf Course Superintendents Association of America. Lawrence, Kansas USA. Foresight Partners Pty Ltd (2011). Forecast Economic Impacts report for Proposed Revitalisation of Great Keppel Island Gallagher M, Volker R Numerical studies of nitrogen flows under effluent irrigated lawns on islands in the Great Barrier Reef. CRC Reef Research Centre Technical Report 34. CRC Reef Research Centre, Townsville. GBRMPA (2005). Sewage Discharges from Marine Outfalls to the Great Barrier Reef Marine Park, Sewage Discharge Policy Queensland Urban Utilities (2010), Sewerage Standards, NuSewers Design and Construction Specification Sustainable Solutions International Pty. Ltd (2007). Great Keppel Island Water, Wastewater Infrastructure Audit Report N-B016 Page 159
162 Water Cycle Management Report Great Keppel Island Resort Revitalisation Plan Australian and New Zealand Environment and Conservation Council (1997). Best Practice Guidelines for the Provision of Waste Reception Facilities at Ports, Marinas and Boat harbours in Australia and New Zealand Terms of Reference for an Environmental Impact Statement (EIS) - Great Keppel Island Resort Project - the Coordinator-General - June 2011 Guidelines for an Environmental Impact Statement for the Great Keppel Island Tourism and Marina Development, Queensland - Department of Sustainability, Environment, Water, Population and Communities and the Great Barrier Reef Marine Park Authority - February 2011 Great Keppel Island Revitalisation Plan - Initial Advice Statement - Humphreys Reynolds Perkins - August 2010 South-East Queensland Regional Plan Implementation Guideline No.7 - Water Sensitive Urban Design: Design Objectives for Urban Stormwater Management - November 2009 State Planning Policy 4/10 - Healthy Waters - Department of Environment and Resource Management 2010 State Planning Policy 4/10 Guideline - Healthy Waters - Department of Environment and Resource Management 2010 Queensland Water Quality Guidelines Department of Environment and Resource Management - Version 3 September 2009 DERM Guideline Framework for Managing Sewerage Infrastructure to Reduce Overflows & Environmental Impacts Draft National Guideline for Water Recycling (NRMMC & EPHC 2005) Water Quality Guidelines for the Great Barrier Reef Marine Park - Great Barrier Reef Marine Park Authority 2009 Queensland Urban Drainage Manual (QUDM) - Second Edition Australian Rainfall and Runoff - Engineers Australia 2001 MUSIC Modelling Guidelines for South East Queensland - Water by Design - version MUSIC Calibration Based On Soil Conditions Andrew Macleod July 2008 Water Sensitive Urban Design Technical Design Guidelines for the South-East Queensland - Healthy Waterways - version 1, June 2006 Report on Preliminary Geotechnical Assessment - Douglas Partners - December 2010 N-B016 Page 160
163 Water Cycle Management Report Great Keppel Island Resort Revitalisation Plan APPENDIX A GKI Resort Revitalisation Plan N-B016 Page 161

164 1 FISHERMAN S BEACH HOTEL & SPA 2 ECO - TOURISM VILLAS 3 ECO - TOURISM APARTMENTS 4 PARK 5 RUNWAY 6 AIRPORT TERMINAL 7 RUNWAY VILLAS 8 FERRY TERMINAL 9 RESEARCH & HISTORIC CENTRE 10 RETAIL SHOPS & TOURISM APARTMENTS 11 BARGE TERMINAL 12 GOLF COURSE 13 GOLF RESORT FACILITY 14 LEEKE S HOMESTEAD 15 STAFF ACCOMODATION 16 INDUSTRIAL COMPOUND PUBLIC ACCESS TRACKS REVITALISATION PLAN 2011 PUTNEY POINT 11 9 MARINA PRECINCT 10 PUTNEY BEACH 8 FISHERMAN S BEACH SHELVING BEACH MONKEY BEACH MONKEY POINT 1 3 LITTLE PENINSULA SVENDSEN S BEACH CHOCOLATE ROCKS LEEKE S BEACH FISHERMAN S BEACH PRECINCT LONG BEACH LITTLE MONKEY POINT ~ REVITALISATION PLAN BUTTERFISH BAY SANDHILL BEACH CLAM BAY PRECINCT 2 13 WYNDHAM COVE BIG PENINSULA SECRET BEACH 12 WRECK BEACH LITTLE WRECK BEACH CLAM BAY WRECK BAY RED BEACH COCONUT POINT PROJECT #: JULY 2011 BALD ROCK POINT
165 Water Cycle Management Report Great Keppel Island Resort Revitalisation Plan APPENDIX B Catchment Boundaries - Proposed N-B016 Page 162
166
167 Water Cycle Management Report Great Keppel Island Resort Revitalisation Plan APPENDIX C Existing Water Supply & Wastewater Infrastructure N-B016 Page 163
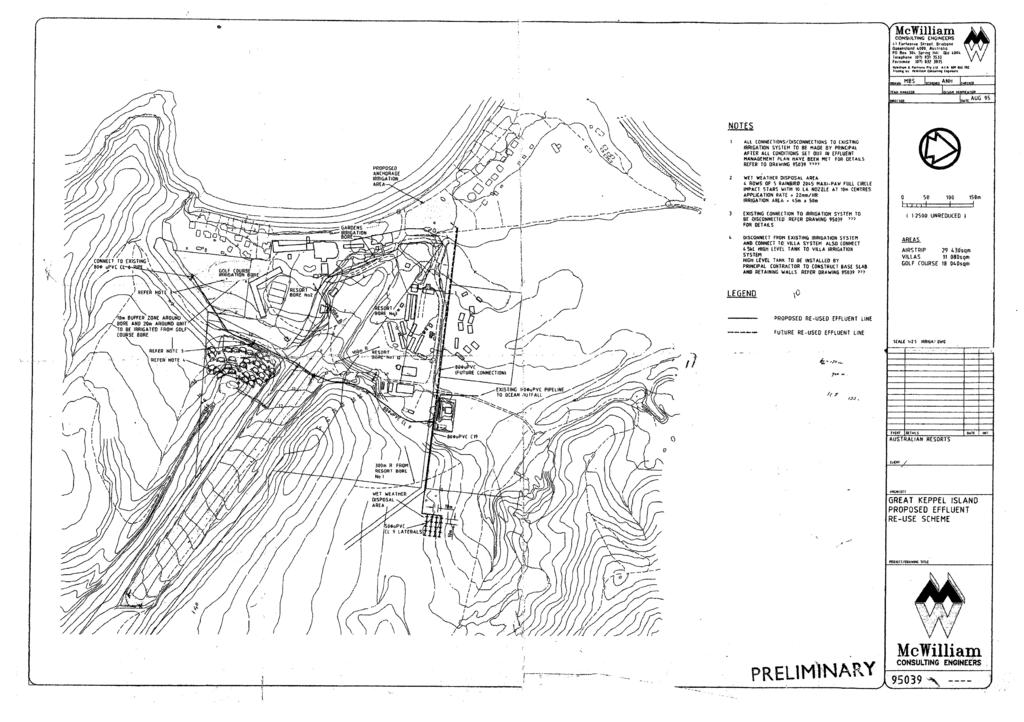
168
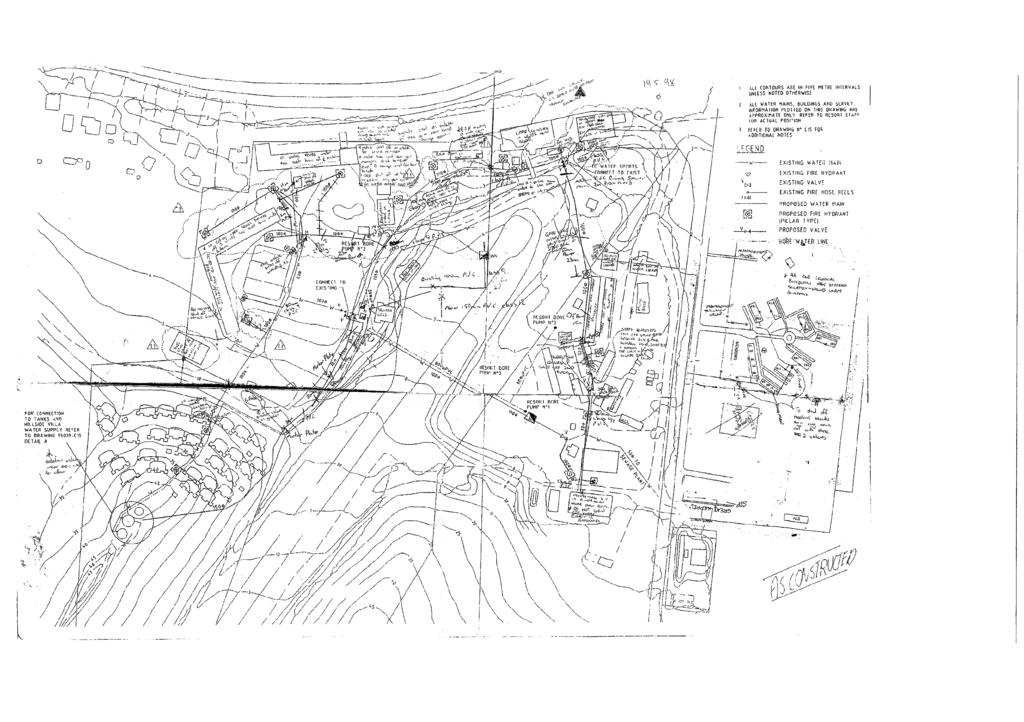
169
170 Water Cycle Management Report Great Keppel Island Resort Revitalisation Plan APPENDIX D Existing Environmental Licence (No. CR0061) N-B016 Page 164
171 FILE COPY ENVIRONMENT Environmental Protection Act 1gg4 Notice of Decision to Grant Application for Licence Amendment Section 49 Enquines to: Lynne Melvin Telephone: (07) Your reference: Our reference: L-LV/09 Mr Ronald Hancock Great! Keppel lsland Resort pty Limited PO Box 886 BUNDABERG QLD 4670 Dear Mr Chandler Re: Application to Amend Licence No. CR0061 by Great! Keppel lsland Resort pty Limited in respect of the carrying out of : 15(b) - Sewage treatment at premises/place on land descnbed as Lot 46, plan 1N2763 County of Livingstone, parish of Keppel located at Great Keppel lsland Your application to amend your licence No. cr0061 has been granted. A copy of the amended licence including the schedule of conditions is attached. The amended licence takes effect from 15 July 1998, although the original effective date of 13 May lggg still applies in relation to lodging the annual return and annual licence fees. Information relating to a review of the decision or appeals under this Act is printed at the back of this notice. \ \ trrl A t'.-i\oe\*{reit*- \ NigelHolmes Regional Manager (Environment) Delegate of Administering Authority Env i ro n m e ntal P rote cti o n Act o r\b-r \qg Version one
172 Environmental Protection Act 1gg4 Licence No. CROOG1 Section 45(1) Under the provisions of the Environmental Protection Act 1994 this environmental authoritv is issued: To: T/A GREAT! KEPPEL ISLAND RESORT PTY LIMITED GREAT KEPPEL ISLAND RESORT Address: PMB 8001 NORTH ROCKHAMPTON QLD 4701 in respect of carrying out the environmentally relevant activity/ies at the following place(s): 15(b) Sewage treatment - operating a standard sewage treatment works having a peakdesign capacity to treat sewage of 100 or more equivalent persons but less than 1500 equivalent persons at premises described as: Located at: Lot 46, plan 1N2763 County of Livingstone, parish of Keppel Great Keppel lsland This environmental authority is issued subjecto the conditionset out in the schedules attached to this environmental authority. The amendment to this licence takes effect from 15 July 19gg. The original licence took effect from 13 May tt, N '\ A.--l\g} \\ev,^,-- Nigel Holmes Regional Manager (Environment) Central Coast Delegate of Administering Authority Environmental Protection Act 1994 o r \c-r\rt
173 Licence No. cr0061 Licensee GREATI KEPPEL ISLAND RESORT PTY LTD Section 45(1) This environmental authority consists of the following schedules.- SCHEDULE A - GENEML CONDITIONS SCHEDULE B - AIR SCHEDULE C - WATER SCHEDULED - STORMWATER MANAGEMENT SCHEDULE - I.ANDAPPLICATION SCHEDULE F - NOISE SCHEDULE G - WASTE MANAGEMENT SCHEDULE H. MONITORING AND REPORTING SCHEDULE I - DEFINITIONS
174 Licence No. cr0061 Licensee GREAT! KEPPEL ISLAND RESORT PTY LTD Section 45(1) Access to Copy of Environmental Authority SCHEDULE A - GENEML CONDITIONS (A1) A copy of this environmental authority must be kept personnel in a location readity carrying accessible out to the activity. ( 2) Any record or document required to be kept by a condition of authority this environmental must be kept at the licensed place tor a perioo of at available least five years for.examination and be by an authorised person. For daily record and weekly retention records, requirements the of this condition will be satisfied records ir an/oairy are kept and for weekly a period of at leasthree (3) years and kept these in records the form are of then annual summaries after that perioo Alterations (A3) No change,.replacement or operation of any plant or equipment change, is permitted replacement if the or operation of the plani or equipment substantially increases, or increase, is likely to the risk of environmental harm above by that this environmental expressly provided authority. An example of a substantial increase in the risk of environmental of harm 10o/or is more an increase in the quantity of the contaminant to be released into the environment. Monitoring and Measurements (A4) All determinations. of the quality of contaminants released to measurement the environment and reporting and all of noise levels that are required authority by this must environmental be undertaken by a person or body possessing and qualifications approplate experience to perform the requiredeterminations and-the'reql-ireo measurements. (45) All instruments and devices used for the measurement parameter or monitoring under of any any condition of this environmental authority appropriately must be calibrated, operated and and maintained. Competency (Ao) The holder of this environmental authority shall ensure that maintenance the operation of and the licensed place is carried out oy or person under the supervision competent of a to operate and maintain the sewage treatment piant. END OF CONDITIONS FOR SCHEDULE A
175 Licence No. cr0061 Lrcensee GREATI KEPPEL ISI-AND RESORT PTY LTD Section 45(1) No conditions. SCHEDULE B. AIR END OF CONDITIONS FOR SCHEDULE B Release of Contaminants to Waters SCHEDULE C. WATER (c1) contaminants must not be directly or indirectly released from the licensed waters place or the bed to any and banks ol lnv waters eicept as permitted the under Stormwater this schedule Management or Schedule. (c2) contaminants..may only be released from the licensed place to weather any waters or soil when conditions preclude the application of contaminanti 's' 're t. rv i".j i"rlgnrt"o',, in Schedule E. (ca) The only contaminants permitted to be released from point the licensed place described at the release as between the northern end of Putney Beach a sewage and Half treatment ride Rocks is effluent. Release Point Details (c4) The release point must be submerged at ail times. (c5) All contaminants from release point must be released through a achieve suitable a diffuser minimum to initial dilution of S0 to 1. Quantity of Contaminants Released (co) The total quantity of contaminants released from release point day during must any not dry weather exceed 250 r cubic metres, and during a wet weather exceed day 500 must not cubic meters. Quality Characteristics of Release to Waters (c7) The release of contaminants to waters must comply, at the sampling monitoring and in situ poinvspecified in Schedule H, with ot the limits schedule,i".in"o C in Table 1 for each quality characteristic. "".n
176 Licence No. cr0061 Lrcensee GREAT! KEPPEL ISLAND RESORT Pry LTD Section 45(1) Pump Stations (c8) The only pump stations permitted to release contaminants to any listed waters berow are at those the corresponding overfrow rocations: (ca) Pump Station No. 1 Pump Station No. 2 Pump Station No. 3 near Reception grassed area adjacent to peanut pool near Supervisors quarters Pump stations whose failure would or would be likery to result in release a direct of or contaminants indirect to waters must be fitted with stand-by pumps failure and pump- alarms. SCHEDULE C TABLE 1. RELEASE QUALIW CHARACTERISTIC LIMITS QUALITYCffi RELEASE LIMIT TYPE LIMIT o-uay utocnemtcat oxygen Demand. (mq/l) 20 Maximum e-qay Etocnemtcat oxygen Demand. (mg/l) 5 90 percentile 30 Maximum ffi percentile ph. (ph Units) Range 'rp)urvr(] L/xygen. (mg/l) 2 Minimum 1 Maximum 7 Maximum I rrr,dr rlresprrorus rug4l 4 90 percentile Range END OF CONDITIONS FOR SCHEDULE C SCHEDULE D. STORMWATER MANAGEMENT (D1) Except as provided by the conditions of the stormwater Management the water Schedule schedule and of this environmental authority, the enviro-nmentatty activities retevant must be canied out by such practicable means necessary to prevent minimise the or contact of incident rainfail and stormwater runoff with contaminants, wastes or other and prevent or minimise the release or likelihood such of release contaminated of any runoffrom the licensed place
177 Licence No. cr0061 Licensee GREAT! KEPPEL ISLAND RESORT PTY LTD Section 45(1) Stormwater Management plan (D2) By l July 1998 the holder of this environmental authority implement must develop an and effective and appropriate stormwater Management plan details how the which holder of this environmental authority potential will manage the environmental actual and impacts resulting from the contamination licensed places. of stormwater at the (D3) The stormwater Management Plan must address at least the following matters: (l) prevention of incident stormwater and stormwater runoffrom wastes contacting or contaminants: (ii) diversion of upstream runoff away from areas containing wastes contaminants; or (iii) minimisation of the size of contaminated areas; (iv) cleaning of contaminated areas without *t"r; (vi) paving and roofing of contaminated areas. (D4) A copy of the stormwater Management Plan and any subsequent must be amendment kept at the licensed place and be available person for examination on by request. anauthorised END OF CONDITIONS FOR SCHEDULE D Release of Contaminants to Land SCHEDULE. LAND APPLICATION (E1) The defined contaminant release area is described as golf resort course, gardens villas and gardens in front of as marked on Mcwilliams consuttingngi;ers Plan c2, Job Great No. Keppelsland Infrastructure upgraoe, proposed use Scheme. Effluent Re- (E2) A minimum of 4'8 hectares of land must be provided for the contaminant rerease area. (E3) The contaminant disposal area must be maintained a proper condition and so efficient as to provide adequate assimilation, percolation, transpiration evaporation of and the released contaminants. (E4) spray from any release of contaminants to land must not of drift the licensed beyond place. the boundaries (E5) Notices warning the public not to used or drink the release of must contaminants be prominently to land displayed and must be maintained condition. a visible and legible
178 Licence No. cr0061 Licensee GREAT! KEPPEL ISLAND RESORT PTY LTD Section 45(1) (Eo) Pipelines and fittings for the release of contaminants to land must identified. be clearly standard water taps, hoses and cocks must not be fltted contaminant to release pipelines, and the contaminant release system must connected not be to other service pipelines. Lockable valves or removable handles be fitted must to the contaminant disposal areas. Quality of Contaminants Released to Land (E7) The contaminant release must comply, at the sampling poinus and in-situ measurement with each of the release limits specified in schedule E Table characteristic. 1 for each quality Wet Weather Conditions (E8) when weather conditions or soil conditions preclude the release of contarninants, contaminants the must not be released. SCHEDULE TABLE 1 - RELEASE QUALITY CHARACTERTSTIC LIMITS olallrycharaffiig RELEASE LIMIT Faecal Cotiform@ END OF CONDITIONS FOR SCHEDULE E SCHEDULE F. NOISE No conditions. END OF CONDITIONS FOR SCHEDULE F
179 Licence No. cr0061 Licensee GREAT! KEPPEL ISLAND RESORT PTY LTD Section 45(1) SCHEDULE G. WASTE MANAGEMENT General (G1) The holder of this environmentar authority must not: (i) allow waste to burn or be burned at or on the licensed place; nor (ii) remove waste from the licensed place and burn such waste elsewhere. END OF CONDTTIONS FOR SCHEDULE G Complaint Recording SCHEDULE H. MONITORING AND REPORTTNG (H1) All complaints received by the holder of this environmental authority retating to releases of contaminants from operations the licensed place ruit b" recorded and kept with the following details: (a)time, date and nature of complaint; (b)type of communication (terephone, retter, personar etc.); (c) name, contact address and contact telephone number of complainant (Note: if the complainant does not wish to be identified then 'Not identifiedi' is to be recorded); (d)response and investigation undertaken as a result of the complaint; (e)name of person responsibre for investigating compraint; and (f) action taken as a result of the complaint inv6stigation and signature of responsible person. Monitoring of Contaminant Releases (H2) The holder of this environmental authority is responsible for the making of determinations and keeping of records oi tne quality of the contaminants released for the quality characteristics, and at the frequency specified in Schedule H Table 2. Sampling and Monitoring point Details (H3) Determinations of the quality of released contaminants to check conformity with the release quality.characteristics specified in the Water Schedule and Land Application Schedule of this environmental authority must be undertaken at the sampling and in situ monitoring point described as: Sampling & Monitoring Point (S&MP)- the outlet pipe from the sewage treatment plant's effluent tank
180 Licence No. cr0061.licensee GREAT! KEPPEL ISLAND RESORT PTY LTD Section 45(1) Monitoring of Volume of Release (H4) The daily quantity of contaminants released must be determined by taking measurements from the meter at the ouilet from the effluent tank. (H5) Records must be kept of the results of all determinations of the daily quantity of contaminants released to land. Report Submission (H6) The holder of this environmental authority must ensure that the results of all monitoring performed in accordance with this environmental authority for the period covered by the return are submitted with the Annual Return. V ScheduleH-Table2 QUALITY CHARACTERISTIC DETERMINATION S-day Biochemictt Oxygen Total Phosphorus as p Faecal Coliforms. smsi100 ml) Incident Recording (H7) A record must be maintained of at leasthe following events: (a) the time, date and duration of equipment malfunctions where the failure of the equipment resulted in the release of contaminants reasonably likely to cause environmental harm; (b) any uncontrolled release of contaminants reasonably likely to cause environmental harm and (c) any emergency involving the release of contaminants reasonably likety to cause material or serious environmental harm requiring the use of fire iignting equipment. 't
181 Licence No.?R0061 Licensee GREAT! KEPPEL ISI-AND RESORT PTY LTD Section 45(1) Notification of Emergencies and Incidents (HB) Where the holder of this environmental authority has not given notification to the administering authority under section 37 of the Lnvironmental protection Act, as as practicable soon after becoming aware of any emergency or incident which results in release the of contaminants not in accordance, rea-sonably expected to be not in accordance with the conditions of this environmental authority, the holder of this environmental authority must notify the administering authority of the release by telephone or facsimile. (H9) Where the holder of this environmental authority has not given notification to the administering authority under section 37 of the Lnvironmental protection Act, the notification of emergencies or incidents as required by conditionumber (Hg) must include but not be limited to the following: (a) The holder of the environmental authority; (b) the location of the emergency or incident; (c) the number of the environmental authority; (d) the name and telephone number of the designated contact person; (e) the time of the release; (0 the time the holder of the environmental authority became aware of the release. (g) the suspected cause of the release: (h) the environmental harm and or environmental nuisance caused, threatened, or to be caused by the release; and (i) actions taken to prevent further any release and mitigate any environmental harm and or environmentar nuisance caused by the rerease. (H10) Where the holder of this environmental authority has not given notification to the administering authority under section 37 of the Lnvironmental protection Act, not more than 14 days following the initial notification of an emergency or incident, the holder of the environmental authority must provide written advice of the information supplied in accordance with conditionumber (Hg) in addition to: (a) proposed actions to prevent a recurrence of the emergency or incident; (b) outcomes of actions taken at the time to prevent or minimisenvironmental harm and or environmental nuisance. Exception Reporting (H11) The holder of this environmental authority must notify the administering authority in writing within 28 days of completion of analysis of any result of a monifolng program required by a condition of this environmental authority which indicates an exceedance of any limit specified in this environmental authority
182 Licence No. cr0061 Lrcensee GREATI KEPPEL ISI-AND RESORT PTY LTD Section 45(1) (H12) The written notification required by conditionumber (H11) above must inctude: (a) The full analysis results, and (b) Detairs of investigation or corrective actions taken, and (c) Any subsequent analysis. END OF CONDITIONS FOR SCHEDULE H SCHEDULE I. DEFINITIONS (11) (t2) (t3) (t4) (t5) (16) For the purposes of this environmental authority the following definitions apply: "mg/l'means milligrams per litre. "90th percentile" means that the measured values of the quality characteristic not be greater must than the release limit for any more than one out of five samples consecutive where the time interval between the taking of each consecutiv" less than.rrptu three is days. not "median" means the middle value, where half the data are smaller, are larger' and half lf the data the number of samples is even, the median is the arithmetic the two middle average values. of 'maximum" means that the measured varue of the quarity characteristic contaminant or must not be greater than the rerease rimit siated. 'minimum" means that the measured value of the quality characteristic must not or be contaminant less than the release limit stated 'range" means that the measured value of the quality characteristic must or not contaminant be greater than the higherelease limit stafed nor lower release than the limit lower stated. END OF CONDITIONS FOR SCHEDULE I
183 Water Cycle Management Report Great Keppel Island Resort Revitalisation Plan APPENDIX E Water Balance Spreadsheet N-B016 Page 165
184 Great Keppel Island - Resort Revitalisation Plan Appendix B.1 A Water Balance - Summary (With Irrigation to Full 31 Ha of Golf Course) Figures derived from spreadsheets for January to December inclusive (Appendices B.2 to B.13 refer). Month Days in Month Average Domestic Water Demand (kl/mth) EP x Occupancy (Total EP = 3,973) Total Domestic Water (kl) Mains Supply (kl) Rainwater Reuse (kl) Sewage Treatment Plant Outflow 95% x 180 L/EP/day Total Irrigation Requirement (kl/mth) Effluent Volume Available (kl/mth) SW Harvest Excluding Golf Course (kl/mth) Golf Course Irrigation Requirement (ML/mth) Golf Course Irrigation Requirement (ML/mth) Golf Course Stormwater Harvest (ML/mth) Golf Course Effluent Reuse *(2) ML/mth Net irrigation from mains supply (ML/mth) Submarine Pipe Line Flow Rate Peak Day Mains Water Required *(1) (kl/day) Flow Rate in Submarine Pipe Line (L/sec over 24 hrs) January February March April May June July August September October November December ANNUAL TOTAL Average *(2) Max amount = 31 ha x 60 mm/mth = 18.6 ML/mth. *(1) Average Domestic x Irrigation x 1.1 Great Keppel Island - Resort Revitalisation Plan Appendix B.1 B Water Balance - Summary (With Mains Water Irrigation to 49% x 31 Ha (= 15.2 Ha) of Tees, Fairways & Greens to Golf Course) Derived from Appendix B.1 A above with mains irrigation to rough areas of Golf Course deleted, Average Domestic Water Demand (kl/mth) Golf Course Irrigation Requirement (ML/mth) Submarine Pipe Line Flow Month Days in Month EP x Occupancy (Total EP = 3,973) Total Domestic Water (kl) Mains Supply (kl) Rainwater Reuse (kl) Sewage Treatment Plant Outflow 95% x 180 L/EP/day Total Irrigation Requirement( Excl Golf Course Rough Area) (kl/mth) Effluent Volume Available (kl/mth) SW Harvest Excluding Golf Course (kl/mth) Golf Course Irrigation Requirement (Excl Rough Area) (ML/mth) Golf Course Stormwater Harvest (ML/mth) Golf Course Effluent Reuse *(2) (Incl Rough Area) ML/mth Net irrigation from mains supply (Excl Rough Area) (ML/mth) Peak Day Mains Water Required *(1) (kl/day) Flow Rate in Submarine Pipe Line (L/sec over 24 hrs) January February March
185 April May June July August September October November December ANNUAL TOTAL Average EP *(2) Allows for effluent to 31 Ha *(1) Average Domestic x of golf course tees, fairways & Irrigation x 1.1 greens.
186 Great Keppel Island - Resort Revitalisation Plan Appendix B.2 Water Balance - Peak Occupancy/ Wet Month - January Area ET Factor EP/ Unit or m 2 Unit No. or Area EP Shop etc Area (m 2 ) Eco villa Eco Apartment January 31 Days 85.9 mm Median Rain Occupancy EP x Occupancy Average Domestic Water Demand (kl) Landscape Watering (kl) Catchments 7, 8 & 9: Fisherman's Beach Precinct Fishermans Beach Hotel Total Required Mains RW Reuse Rooms - One bedroom all rooms 2.2 No % Restaurant, hotel Licensed premises etc - Gross floor area m % Retail Shops m % Ecotourism Villas Assume 100% short term accommodation Three bedrooms 2.5 No % Ecotourism Apartments (150 No.) Assume 40% short term accommodation - One bedroom 2.2 No % Total Required Median Rainfall Effluent Reuse SW Harvested Balance from Mains Assume 40% short term accommodation - Two bedroom 2.5 No % Assume 20% short term accommodation - Three bedroom 2.5 No % Fishermans Beach Resort Restaurants, café, Fast Food etc Gross floor area m % Retail Shops including pro shop m2 1, ,500 98% Swimming pool, tennis court & Gymnasium 98% Staff Living on site - allow one bedroom unit - Long term 1.5 No % Living off site 0.32 No % Day Visitors Assume 0.1 EP/ Visitor (noting also public area allowances) 0.1 No % Allow nominal for facilities 12 98% Landscape Watering (assumed 3 30 mm/ week) Ha be a small amount available after use on Golf Course but use adjacent to Airport. Ha On Site Stormwater Reuse (say 5% x available 36,900 kl for Jan) kl 36, Mains Water Makeup (Balance of requirement) 0.0 Airport Total Area 3,500m2 allow 1,000m2 retail, etc m2 1, % Effluent Reuse (equiv to 2 mm/ day = ~60 mm/ mth). Small amount available after use on Golf Course. Ha Catchment 14 - Marina Precinct: Marina Berths 1 No % Yacht Club - Licensed premises, restaurants, café etc Gross floor area m2 1, ,000 60% Retail Shops m2 6, ,000 60% Day Visitors Assume 0.1 EP/ Visitor (noting also public area allowances) 0.1 No % Allow nominal for facilities 98% Marina Ecotourism Apartments (150 No.) Assume 40% short term accommodation - One bedroom 2.2 No % Assume 40% short term accommodation - Two bedroom 2.5 No % Assume 20% short term accommodation - Three bedroom 2.5 No %
187 Catchments 5 & 11 - Golf Course Precinct: Golf Clubhouse including Golf Day Visitors m2 2, ,500 98% Golf Course - Tees, Greens, Fairways (ex Golf Course Designer) (rainfall included in requirement) Effluent Reuse (@ maximum rate equiv to 2 mm/ day = ~60 mm/ mth) Ha On Site Stormwater Reuse (say 10% x available 51,100 kl for Jan) kl Mains Water Makeup (Balance of requirement) Ecotourism Villas Assume 100% short term accommodation Three bedrooms No % TOTAL Check TOTAL in kl/day Check available Effluent EP x Occupancy x 180x 95% (kl) (Note 5) Note 2 Note 1: Public areas EP = ET Factor x 3 (Ex Livingston Council Design Guideline) Total Water Required (kl) Note 2: Effluent Reuse nearly all required for 31 Ha at Golf Course, 100 % used up until Stage 8. Total Mains Water Required (kl) Note 3: Villas and Apartments, staff units l/p/day with 64 l/p/day from RW Reuse. Total Mains Water Required (kl/day) Note 4: Hotel and Core facilities l/p/day with 28 l/p/day from RW Reuse. Peaking Factor (Peak Demand/ Ave Demand) = 1.5 (Dom), 1.1 (Land) Note 5: Sewer flow/ EP = 136 L/p/d (ext supply) + 44 L/p/d (RW Reuse) = 180 L/p/d Peak Mains Water Required (kl/day) Mains Water Supply - Flow Rate over 24 Hours 17.5 L/sec Area ET Factor EP/ Unit or m 2 Unit No. or Area EP RW Tank Storage Rainwater Inflow January 31 Days 85.9 mm Median 3 kl/ unit Total Available Occupancy EP x Occupancy Average Domestic Water 228 L/EP/day (kl) Total Required Mains RW Reuse Potential for Rainwater Reuse to Apartments and Villas: Total Numbers of Eco-Tourism Apartments: Assume 40% short term accommodation - One bedroom 2.2 No % Assume 40% short term accommodation - Two bedroom 2.5 No % Assume 20% short term accommodation - Three bedroom 2.5 No % Total Numbers of Eco-Tourism Villas: Assume 100% short term accommodation Three bedrooms No % Total for Month (kl) Assumptions: Percentage Mains/ Reuse 11% 89% m 2 of roof to apartments and villas connected to rainwater reuse storage tanks. 2. Rainfall for calculation taken as median rain for month based on BOM Rainfall data. 3. Storage capacity assumed as 3000 L/ apartment or villa. 4. Rainfall capture assumed as follows: - 90 % with rainfall up to 50 mm/ mth; - 70 % with rainfall above 50 mm/ mth.
188 Great Keppel Island - Resort Revitalisation Plan Appendix B.3 Water Balance - February Area ET Factor EP/ Unit or m 2 Unit No. or Area EP Shop etc Area (m 2 ) Eco villa Eco Apartment February 28 Days mm Median Rain Occupancy EP x Occupancy Average Domestic Water Demand (kl) Landscape Watering (kl) Catchments 7, 8 & 9: Fisherman's Beach Precinct Fishermans Beach Hotel (Ex Foresight) Total Required Mains RW Reuse Rooms - One bedroom all rooms 2.2 No % Restaurant, hotel Licensed premises etc - Gross floor area m % Retail Shops m % Ecotourism Villas Assume 100% short term accommodation Three bedrooms 2.5 No % Ecotourism Apartments (150 No.) Assume 40% short term accommodation - One bedroom 2.2 No % Assume 40% short term accommodation - Two bedroom 2.5 No % Assume 20% short term accommodation - Three bedroom 2.5 No % Fishermans Beach Resort Restaurants, café, Fast Food etc Gross floor area m % Retail Shops including pro shop m2 1, ,500 56% Swimming pool, tennis court & Gymnasium 56% Staff Living on site - allow one bedroom unit - Long term 1.5 No % Living off site 0.32 No % Day Visitors Assume 0.1 EP/ Visitor (noting also public area allowances) 0.1 No % Allow nominal for facilities 12 56% Landscape Watering (assumed 3 30 mm/ week) Ha Total Required Median Rainfall Effluent Reuse SW Harvested Balance from Mains Effluent Reuse (equiv to 2 mm/ day = ~60 mm/ mth). All used on Golf Course. Ha On Site Stormwater Reuse (say 5% x available 35,800 kl for Feb) kl 35, Mains Water Makeup (Balance of requirement) 0.0 Airport Total Area 3,500m2 allow 1,000m2 retail, etc m2 1, % Effluent Reuse (equiv to 2 mm/ day = ~60 mm/ mth). All used on Golf Course. Ha Catchment 14 - Marina Precinct: Marina Berths 1 No % Yacht Club - Licensed premises, restaurants, café etc Gross floor area m2 1, ,000 22% Retail Shops m2 6, ,000 22% Day Visitors Assume 0.1 EP/ Visitor (noting also public area allowances) 0.1 No % Allow nominal for facilities 36% Marina Ecotourism Apartments (150 No.) Assume 40% short term accommodation - One bedroom 2.2 No % Assume 40% short term accommodation - Two bedroom 2.5 No % Assume 20% short term accommodation - Three bedroom 2.5 No % Catchments 5 & 11 - Golf Course Precinct: Golf Clubhouse including Golf Day Visitors m2 2, ,500 36%
189 Golf Course - Tees, Greens, Fairways (ex Golf Course Designer) (rainfall included in requirement) Effluent Reuse (@ maximum rate equiv to 2 mm/ day = ~60 mm/ mth) Ha On Site Stormwater Reuse (say 10% x available 46,600 kl for Feb) kl Mains Water Makeup (Balance of requirement) Ecotourism Villas Assume 100% short term accommodation Three bedrooms No % TOTAL TOTAL in kl/day Check available Effluent EP x Occupancy x 180 x 95% (kl) (Note 5) Note 1: Public areas EP = ET Factor x 3 (Ex Livingston Council Design Guideline) Total Water Required (kl) Note 2: Effluent Reuse fully required for Golf Course. Total Mains Water Required (kl) Note 3: Villas and Apartments, staff units l/p/day with 64 l/p/day from RW Reuse. Total Mains Water Required (kl/day) Note 4: Hotel and Core facilities l/p/day with 28 l/p/day from RW Reuse. Peaking Factor (Peak Demand/ Ave Demand) = 1.5 (Dom), 1.1 (Land) Note 5: Sewer flow/ EP = 136 L/p/d (ext supply) + 44 L/p/d (RW Reuse) = 180 L/p/d Peak Mains Water Required (kl/day) Mains Water Supply - Flow Rate over 24 Hours 10.3 L/sec Area ET Factor EP/ Unit or m 2 Unit No. or Area EP RW Tank Storage Rainwater Inflow February 28 Days mm Median 3 kl/ unit Total Available Occupancy EP x Occupancy Average Domestic Water 228 L/EP/day (kl) Total Required Mains RW Reuse Potential for Rainwater Reuse to Apartments and Villas: Total Numbers of Eco-Tourism Apartments: Assume 40% short term accommodation - One bedroom 2.2 No % Assume 40% short term accommodation - Two bedroom 2.5 No % Assume 20% short term accommodation - Three bedroom 2.5 No % Total Numbers of Eco-Tourism Villas: Assume 100% short term accommodation Three bedrooms No % Total for Month (kl) Assumptions: Percentage Mains/ Reuse 0% 100% m 2 of roof to apartments and villas connected to rainwater reuse storage tanks. 2. Rainfall for calculation taken as median rain for month based on BOM Rainfall data. 3. Storage capacity assumed as 3000 L/ apartment or villa. 4. Rainfall capture assumed as follows: - 90 % with rainfall up to 50 mm/ mth; - 70 % with rainfall above 50 mm/ mth.
190 Great Keppel Island - Resort Revitalisation Plan Appendix B.4 Water Balance - March Area ET Factor EP/ Unit or m 2 Unit No. or Area EP Shop etc Area (m 2 ) Eco villa Eco Apartment March 31 Days 75.5 mm Median Rain Occupancy EP x Occupancy Average Domestic Water Demand (kl) Landscape Watering (kl) Catchments 7, 8 & 9: Fisherman's Beach Precinct Fishermans Beach Hotel (Ex Foresight) Total Required Mains RW Reuse Rooms - One bedroom all rooms 2.2 No % Restaurant, hotel Licensed premises etc - Gross floor area m % Retail Shops m % Ecotourism Villas Assume 100% short term accommodation Three bedrooms 2.5 No % Ecotourism Apartments (150 No.) Assume 40% short term accommodation - One bedroom 2.2 No % Assume 40% short term accommodation - Two bedroom 2.5 No % Assume 20% short term accommodation - Three bedroom 2.5 No % Fishermans Beach Resort Restaurants, café, Fast Food etc Gross floor area m % Retail Shops including pro shop m2 1, ,500 42% Swimming pool, tennis court & Gymnasium 42% Staff Living on site - allow one bedroom unit - Long term 1.5 No % Living off site 0.32 No % Day Visitors Assume 0.1 EP/ Visitor (noting also public area allowances) 0.1 No % Allow nominal for facilities 12 56% Landscape Watering (assumed 3 30 mm/ week) Ha Total Required Median Rainfall Effluent Reuse SW Harvested Balance from Mains Effluent Reuse (equiv to 2 mm/ day = ~60 mm/ mth). All used on Golf Course. Ha On Site Stormwater Reuse (say 5% x available kl for Mar) kl 63, Mains Water Makeup (Balance of requirement) 0.0 Airport Total Area 3,500m2 allow 1,000m2 retail, etc m2 1, % Effluent Reuse (equiv to 2 mm/ day = ~60 mm/ mth). All used on Golf Course. Ha Catchment 14 - Marina Precinct: Marina Berths 1 No % Yacht Club - Licensed premises, restaurants, café etc Gross floor area m2 1, ,000 12% Retail Shops m2 6, ,000 12% Day Visitors Assume 0.1 EP/ Visitor (noting also public area allowances) 0.1 No % Allow nominal for facilities 42% Marina Ecotourism Apartments (150 No.) Assume 40% short term accommodation - One bedroom 2.2 No % Assume 40% short term accommodation - Two bedroom 2.5 No % Assume 20% short term accommodation - Three bedroom 2.5 No % Catchments 5 & 11 - Golf Course Precinct: Golf Clubhouse including Golf Day Visitors m2 2, ,500 42%
191 Golf Course - Tees, Greens, Fairways (ex Golf Course Designer) (rainfall included in requirement) Effluent Reuse (@ maximum rate equiv to 2 mm/ day = ~60 mm/ mth) Ha On Site Stormwater Reuse (say 10% x available 500 kl for Mar) kl Mains Water Makeup (Balance of requirement) Ecotourism Villas Assume 100% short term accommodation Three bedrooms No % TOTAL TOTAL in kl/day Check available Effluent EP x Occupancy x 180 x 95% (kl) (Note 5) Note 1: Public areas EP = ET Factor x 3 (Ex Livingston Council Design Guideline) Total Water Required (kl) Note 2: Effluent Reuse fully required for Golf Course. Total Mains Water Required (kl) Note 3: Villas and Apartments, staff units l/p/day with 64 l/p/day from RW Reuse. Total Mains Water Required (kl/day) Note 4: Hotel and Core facilities l/p/day with 28 l/p/day from RW Reuse. Peaking Factor (Peak Demand/ Ave Demand) = 1.5 (Dom), 1.1 (Land) Note 5: Sewer flow/ EP = 136 L/p/d (ext supply) + 44 L/p/d (RW Reuse) = 180 L/p/d Peak Mains Water Required (kl/day) Mains Water Supply - Flow Rate over 24 Hours 13.6 L/sec Area ET Factor EP/ Unit or m 2 Unit No. or Area EP RW Tank Storage Rainwater Inflow March 31 Days 75.4 mm Median 3 kl/ unit Total Available Occupancy EP x Occupancy Average Domestic Water 228 L/EP/day (kl) Total Required Mains RW Reuse Potential for Rainwater Reuse to Apartments and Villas: Total Numbers of Eco-Tourism Apartments: Assume 40% short term accommodation - One bedroom 2.2 No % Assume 40% short term accommodation - Two bedroom 2.5 No % Assume 20% short term accommodation - Three bedroom 2.5 No % Total Numbers of Eco-Tourism Villas: Assume 100% short term accommodation Three bedrooms No % Total for Month (kl) Assumptions: Percentage Mains/ Reuse 0% 100% m 2 of roof to apartments and villas connected to rainwater reuse storage tanks. 2. Rainfall for calculation taken as median rain for month based on BOM Rainfall data. 3. Storage capacity assumed as 3000 L/ apartment or villa. 4. Rainfall capture assumed as follows: - 90 % with rainfall up to 50 mm/ mth; - 70 % with rainfall above 50 mm/ mth.
192 Great Keppel Island - Resort Revitalisation Plan Appendix B.5 Water Balance - April Area ET Factor EP/ Unit or m 2 Unit No. or Area EP Shop etc Area (m 2 ) Eco villa Eco Apartment April 30 Days 60.4 mm Median Rain Occupancy EP x Occupancy Average Domestic Water Demand (kl) Landscape Watering (kl) Catchments 7, 8 & 9: Fisherman's Beach Precinct Fishermans Beach Hotel (Ex Foresight) Total Required Mains RW Reuse Rooms - One bedroom all rooms 2.2 No % Restaurant, hotel Licensed premises etc - Gross floor area m % Retail Shops m % Ecotourism Villas Assume 100% short term accommodation Three bedrooms 2.5 No % Ecotourism Apartments (150 No.) Assume 40% short term accommodation - One bedroom 2.2 No % Assume 40% short term accommodation - Two bedroom 2.5 No % Assume 20% short term accommodation - Three bedroom 2.5 No % Fishermans Beach Resort Restaurants, café, Fast Food etc Gross floor area m % Retail Shops including pro shop m2 1, ,500 51% Swimming pool, tennis court & Gymnasium 51% Staff Living on site - allow one bedroom unit - Long term 1.5 No % Living off site 0.32 No % Day Visitors Assume 0.1 EP/ Visitor (noting also public area allowances) 0.1 No % Allow nominal for facilities 12 66% Landscape Watering (assumed 3 30 mm/ week) Ha Total Required Median Rainfall Effluent Reuse SW Harvested Balance from Mains Effluent Reuse (equiv to 2 mm/ day = ~60 mm/ mth). All used on Golf Course. Ha On Site Stormwater Reuse (say 5% x available 36,100 kl for Apr) kl 36, Mains Water Makeup (Balance of requirement) Airport Total Area 3,500m2 allow 1,000m2 retail, etc m2 1, % Effluent Reuse (equiv to 2 mm/ day = ~60 mm/ mth). All used on Golf Course. Ha Catchment 14 - Marina Precinct: Marina Berths 1 No % Yacht Club - Licensed premises, restaurants, café etc Gross floor area m2 1, ,000 12% Retail Shops m2 6, ,000 12% Day Visitors Assume 0.1 EP/ Visitor (noting also public area allowances) 0.1 No % Allow nominal for facilities 51% Marina Ecotourism Apartments (150 No.) Assume 40% short term accommodation - One bedroom 2.2 No % Assume 40% short term accommodation - Two bedroom 2.5 No % Assume 20% short term accommodation - Three bedroom 2.5 No % Catchments 5 & 11 - Golf Course Precinct: Golf Clubhouse including Golf Day Visitors m2 2, ,500 51%
193 Golf Course - Tees, Greens, Fairways (ex Golf Course Designer) (rainfall included in requirement) Effluent Reuse (@ maximum rate equiv to 2 mm/ day = ~60 mm/ mth) Ha On Site Stormwater Reuse (say 10% x available 52,800 kl for Apr) kl Mains Water Makeup (Balance of requirement) Ecotourism Villas Assume 100% short term accommodation Three bedrooms No % TOTAL TOTAL in kl/day Check available Effluent EP x Occupancy x 180 x 95% (kl) (Note 5) Note 1: Public areas EP = ET Factor x 3 (Ex Livingston Council Design Guideline) Total Water Required (kl) Note 2: Effluent Reuse fully required for Golf Course. Total Mains Water Required (kl) Note 3: Villas and Apartments, staff units l/p/day with 64 l/p/day from RW Reuse. Total Mains Water Required (kl/day) Note 4: Hotel and Core facilities l/p/day with 28 l/p/day from RW Reuse. Peaking Factor (Peak Demand/ Ave Demand) = 1.5 (Dom), 1.1 (Land) Note 5: Sewer flow/ EP = 136 L/p/d (ext supply) + 44 L/p/d (RW Reuse) = 180 L/p/d Peak Mains Water Required (kl/day) Mains Water Supply - Flow Rate over 24 Hours 16.4 L/sec Area ET Factor EP/ Unit or m 2 Unit No. or Area EP RW Tank Storage Rainwater Inflow April 30 Days 60.4 mm Median 3 kl/ unit Total Available Occupancy EP x Occupancy Average Domestic Water 228 L/EP/day (kl) Total Required Mains RW Reuse Potential for Rainwater Reuse to Apartments and Villas: Total Numbers of Eco-Tourism Apartments: Assume 40% short term accommodation - One bedroom 2.2 No % Assume 40% short term accommodation - Two bedroom 2.5 No % Assume 20% short term accommodation - Three bedroom 2.5 No % Total Numbers of Eco-Tourism Villas: Assume 100% short term accommodation Three bedrooms No % Total for Month (kl) Assumptions: Percentage Mains/ Reuse 0% 100% m 2 of roof to apartments and villas connected to rainwater reuse storage tanks. 2. Rainfall for calculation taken as median rain for month based on BOM Rainfall data. 3. Storage capacity assumed as 3000 L/ apartment or villa. 4. Rainfall capture assumed as follows: - 90 % with rainfall up to 50 mm/ mth; - 70 % with rainfall above 50 mm/ mth.
194 Great Keppel Island - Resort Revitalisation Plan Appendix B.6 Water Balance - May Area ET Factor EP/ Unit or m 2 Unit No. or Area EP Shop etc Area (m 2 ) Eco villa Eco Apartment May 31 Days 78.8 mm Median Rain Occupancy EP x Occupancy Average Domestic Water Demand (kl) Landscape Watering (kl) Catchments 7, 8 & 9: Fisherman's Beach Precinct Fishermans Beach Hotel (Ex Foresight) Total Required Mains RW Reuse Rooms - One bedroom all rooms 2.2 No % Restaurant, hotel Licensed premises etc - Gross floor area m % Retail Shops m % Ecotourism Villas Assume 100% short term accommodation Three bedrooms 2.5 No % Ecotourism Apartments (150 No.) Assume 40% short term accommodation - One bedroom 2.2 No % Assume 40% short term accommodation - Two bedroom 2.5 No % Assume 20% short term accommodation - Three bedroom 2.5 No % Fishermans Beach Resort Restaurants, café, Fast Food etc Gross floor area m % Retail Shops including pro shop m2 1, ,500 34% Swimming pool, tennis court & Gymnasium 34% Staff Living on site - allow one bedroom unit - Long term 1.5 No % Living off site 0.32 No % Day Visitors Assume 0.1 EP/ Visitor (noting also public area allowances) 0.1 No % Allow nominal for facilities 12 34% Landscape Watering (assumed 3 30 mm/ week) Ha Total Required Median Rainfall Effluent Reuse SW Harvested Balance from Mains Effluent Reuse (equiv to 2 mm/ day = ~60 mm/ mth). All used on Golf Course. Ha On Site Stormwater Reuse (say 5% x available 73,200 kl for May) kl 73, Mains Water Makeup (Balance of requirement) 0.0 Airport Total Area 3,500m2 allow 1,000m2 retail, etc m2 1, % Effluent Reuse (equiv to 2 mm/ day = ~60 mm/ mth). All used on Golf Course. Ha Catchment 14 - Marina Precinct: Marina Berths 1 No % Yacht Club - Licensed premises, restaurants, café etc Gross floor area m2 1, ,000 7% Retail Shops m2 6, ,000 7% Day Visitors Assume 0.1 EP/ Visitor (noting also public area allowances) 0.1 No % Allow nominal for facilities 18% Marina Ecotourism Apartments (150 No.) Assume 40% short term accommodation - One bedroom 2.2 No % Assume 40% short term accommodation - Two bedroom 2.5 No % Assume 20% short term accommodation - Three bedroom 2.5 No % Catchments 5 & 11 - Golf Course Precinct: Golf Clubhouse including Golf Day Visitors m2 2, ,500 18%
195 Golf Course - Tees, Greens, Fairways (ex Golf Course Designer) (rainfall included in requirement) Effluent Reuse (@ maximum rate equiv to 2 mm/ day = ~60 mm/ mth) Ha On Site Stormwater Reuse (say 5% x available 128,800 kl for May) kl Mains Water Makeup (Balance of requirement) Ecotourism Villas Assume 100% short term accommodation Three bedrooms No % TOTAL TOTAL in kl/day Check available Effluent EP x Occupancy x 180 x 95% (kl) (Note 5) Note 1: Public areas EP = ET Factor x 3 (Ex Livingston Council Design Guideline) Total Water Required (kl) Note 2: Effluent Reuse fully required for Golf Course. Total Mains Water Required (kl) Note 3: Villas and Apartments, staff units l/p/day with 64 l/p/day from RW Reuse. Total Mains Water Required (kl/day) Note 4: Hotel and Core facilities l/p/day with 28 l/p/day from RW Reuse. Peaking Factor (Peak Demand/ Ave Demand) = 1.5 (Dom), 1.1 (Land) Note 5: Sewer flow/ EP = 136 L/p/d (ext supply) + 44 L/p/d (RW Reuse) = 180 L/p/d Peak Mains Water Required (kl/day) Mains Water Supply - Flow Rate over 24 Hours 12.8 L/sec Area ET Factor EP/ Unit or m 2 Unit No. or Area EP RW Tank Storage Rainwater Inflow May 31 Days 78.8 mm Median 3 kl/ unit Total Available Occupancy EP x Occupancy Average Domestic Water 228 L/EP/day (kl) Total Required Mains RW Reuse Potential for Rainwater Reuse to Apartments and Villas: Total Numbers of Eco-Tourism Apartments: Assume 40% short term accommodation - One bedroom 2.2 No % Assume 40% short term accommodation - Two bedroom 2.5 No % Assume 20% short term accommodation - Three bedroom 2.5 No % Total Numbers of Eco-Tourism Villas: Assume 100% short term accommodation Three bedrooms No % Total for Month (kl) Assumptions: Percentage Mains/ Reuse 0% 100% m 2 of roof to apartments and villas connected to rainwater reuse storage tanks. 2. Rainfall for calculation taken as median rain for month based on BOM Rainfall data. 3. Storage capacity assumed as 3000 L/ apartment or villa. 4. Rainfall capture assumed as follows: - 90 % with rainfall up to 50 mm/ mth; - 70 % with rainfall above 50 mm/ mth.
196 Great Keppel Island - Resort Revitalisation Plan Appendix B.7 Water Balance - June Area ET Factor EP/ Unit or m 2 Unit No. or Area EP Shop etc Area (m 2 ) Eco villa Eco Apartment June 30 Days 55 mm Median Rain Occupancy EP x Occupancy Average Domestic Water Demand (kl) Landscape Watering (kl) Catchments 7, 8 & 9: Fisherman's Beach Precinct Fishermans Beach Hotel (Ex Foresight) Total Required Mains RW Reuse Rooms - One bedroom all rooms 2.2 No % Restaurant, hotel Licensed premises etc - Gross floor area m % Retail Shops m % Ecotourism Villas Assume 100% short term accommodation Three bedrooms 2.5 No % Ecotourism Apartments (150 No.) Assume 40% short term accommodation - One bedroom 2.2 No % Assume 40% short term accommodation - Two bedroom 2.5 No % Assume 20% short term accommodation - Three bedroom 2.5 No % Fishermans Beach Resort Restaurants, café, Fast Food etc Gross floor area m % Retail Shops including pro shop m2 1, ,500 40% Swimming pool, tennis court & Gymnasium 40% Staff Living on site - allow one bedroom unit - Long term 1.5 No % Living off site 0.32 No % Day Visitors Assume 0.1 EP/ Visitor (noting also public area allowances) 0.1 No % Allow nominal for facilities 12 40% Landscape Watering (assumed 3 30 mm/ week) Ha Total Required Median Rainfall Effluent Reuse SW Harvested Balance from Mains Effluent Reuse (equiv to 2 mm/ day = ~60 mm/ mth). All used on Golf Course. Ha On Site Stormwater Reuse (say 5% x available 10,500 kl for Jun) kl 10, Mains Water Makeup (Balance of requirement) Airport Total Area 3,500m2 allow 1,000m2 retail, etc m2 1, % Effluent Reuse (equiv to 2 mm/ day = ~60 mm/ mth). All used on Golf Course. Ha Catchment 14 - Marina Precinct: Marina Berths 1 No % Yacht Club - Licensed premises, restaurants, café etc Gross floor area m2 1, ,000 10% Retail Shops m2 6, ,000 10% Day Visitors Assume 0.1 EP/ Visitor (noting also public area allowances) 0.1 No % Allow nominal for facilities 21% Marina Ecotourism Apartments (150 No.) Assume 40% short term accommodation - One bedroom 2.2 No % Assume 40% short term accommodation - Two bedroom 2.5 No % Assume 20% short term accommodation - Three bedroom 2.5 No % Catchments 5 & 11 - Golf Course Precinct: Golf Clubhouse including Golf Day Visitors m2 2, ,500 21%
197 Golf Course - Tees, Greens, Fairways (ex Golf Course Designer) (rainfall included in requirement) Effluent Reuse (@ maximum rate equiv to 2 mm/ day = ~60 mm/ mth) Ha On Site Stormwater Reuse (say 20% x available 12,800 kl for Jun) kl Mains Water Makeup (Balance of requirement) Ecotourism Villas Assume 100% short term accommodation Three bedrooms No % TOTAL TOTAL in kl/day Check available Effluent EP x Occupancy x 180 x 95% (kl) (Note 5) Note 1: Public areas EP = ET Factor x 3 (Ex Livingston Council Design Guideline) Total Water Required (kl) Note 2: Effluent Reuse fully required for Golf Course. Total Mains Water Required (kl) Note 3: Villas and Apartments, staff units l/p/day with 64 l/p/day from RW Reuse. Total Mains Water Required (kl/day) Note 4: Hotel and Core facilities l/p/day with 28 l/p/day from RW Reuse. Peaking Factor (Peak Demand/ Ave Demand) = 1.5 (Dom), 1.1 (Land) Note 5: Sewer flow/ EP = 136 L/p/d (ext supply) + 44 L/p/d (RW Reuse) = 180 L/p/d Peak Mains Water Required (kl/day) Mains Water Supply - Flow Rate over 24 Hours 12.4 L/sec Area ET Factor EP/ Unit or m 2 Unit No. or Area EP RW Tank Storage Rainwater Inflow June 30 Days 55 mm Median 3 kl/ unit Total Available Occupancy EP x Occupancy Average Domestic Water 228 L/EP/day (kl) Total Required Mains RW Reuse Potential for Rainwater Reuse to Apartments and Villas: Total Numbers of Eco-Tourism Apartments: Assume 40% short term accommodation - One bedroom 2.2 No % Assume 40% short term accommodation - Two bedroom 2.5 No % Assume 20% short term accommodation - Three bedroom 2.5 No % Total Numbers of Eco-Tourism Villas: Assume 100% short term accommodation Three bedrooms No % Total for Month (kl) Assumptions: Percentage Mains/ Reuse 0% 100% m 2 of roof to apartments and villas connected to rainwater reuse storage tanks. 2. Rainfall for calculation taken as median rain for month based on BOM Rainfall data. 3. Storage capacity assumed as 3000 L/ apartment or villa. 4. Rainfall capture assumed as follows: - 90 % with rainfall up to 50 mm/ mth; - 70 % with rainfall above 50 mm/ mth.
198 Great Keppel Island - Resort Revitalisation Plan Appendix B.8 Water Balance - July Area ET Factor EP/ Unit or m 2 Unit No. or Area EP Shop etc Area (m 2 ) Eco villa Eco Apartment July 31 Days 25 mm Median Rain Occupancy EP x Occupancy Average Domestic Water Demand (kl) Landscape Watering (kl) Catchments 7, 8 & 9: Fisherman's Beach Precinct Fishermans Beach Hotel (Ex Foresight) Total Required Mains RW Reuse Rooms - One bedroom all rooms 2.2 No % Restaurant, hotel Licensed premises etc - Gross floor area m % Retail Shops m % Ecotourism Villas Assume 100% short term accommodation Three bedrooms 2.5 No % Ecotourism Apartments (150 No.) Assume 40% short term accommodation - One bedroom 2.2 No % Assume 40% short term accommodation - Two bedroom 2.5 No % Assume 20% short term accommodation - Three bedroom 2.5 No % Fishermans Beach Resort Restaurants, café, Fast Food etc Gross floor area m % Retail Shops including pro shop m2 1, ,500 54% Swimming pool, tennis court & Gymnasium 54% Staff Living on site - allow one bedroom unit - Long term 1.5 No % Living off site 0.32 No % Day Visitors Assume 0.1 EP/ Visitor (noting also public area allowances) 0.1 No % Allow nominal for facilities 12 54% Landscape Watering (assumed 3 30 mm/ week) Ha Total Required Median Rainfall Effluent Reuse SW Harvested Balance from Mains Effluent Reuse (equiv to 2 mm/ day = ~60 mm/ mth). All used on Golf Course. Ha On Site Stormwater Reuse (say 5% x available 11,900 kl for Jul) kl 11, Mains Water Makeup (Balance of requirement) Airport Total Area 3,500m2 allow 1,000m2 retail, etc m2 1, % Effluent Reuse (equiv to 2 mm/ day = ~60 mm/ mth). All used on Golf Course. Ha Catchment 14 - Marina Precinct: Marina Berths 1 No % Yacht Club - Licensed premises, restaurants, café etc Gross floor area m2 1, ,000 7% Retail Shops m2 6, ,000 7% Day Visitors Assume 0.1 EP/ Visitor (noting also public area allowances) 0.1 No % Allow nominal for facilities 36% Marina Ecotourism Apartments (150 No.) Assume 40% short term accommodation - One bedroom 2.2 No % Assume 40% short term accommodation - Two bedroom 2.5 No % Assume 20% short term accommodation - Three bedroom 2.5 No % Catchments 5 & 11 - Golf Course Precinct: Golf Clubhouse including Golf Day Visitors m2 2, ,500 36%
199 Golf Course - Tees, Greens, Fairways (ex Golf Course Designer) (rainfall included in requirement) Effluent Reuse (@ maximum rate equiv to 2 mm/ day = ~60 mm/ mth) Ha On Site Stormwater Reuse (say 20% x available kl for Jul) kl Mains Water Makeup (Balance of requirement) Ecotourism Villas Assume 100% short term accommodation Three bedrooms No % TOTAL TOTAL in kl/day Check available Effluent EP x Occupancy x 180 x 95% (kl) (Note 5) Note 1: Public areas EP = ET Factor x 3 (Ex Livingston Council Design Guideline) Total Water Required (kl) Note 2: Effluent Reuse fully required for Golf Course. Total Mains Water Required (kl) Note 3: Villas and Apartments, staff units l/p/day with28 l/p/day (**)from RW Reuse. Total Mains Water Required (kl/day) Note 4: Hotel and Core facilities l/p/day with 28 l/p/day from RW Reuse. Peaking Factor (Peak Demand/ Ave Demand) = 1.5 (Dom), 1.1 (Land) Note 5: Sewer flow/ EP = 136 L/p/d (ext supply) + 44 L/p/d (RW Reuse) = 180 L/p/d Peak Mains Water Required (kl/day) ** Ref Note 3: Reduced from 64 l/p/day to 28 l/p/day due to low rainfall month. Mains Water Supply - Flow Rate over 24 Hours 14.2 L/sec Area ET Factor EP/ Unit or m 2 Unit No. or Area EP RW Tank Storage Rainwater Inflow July 31 Days 25 mm Median 3 kl/ unit Total Available Occupancy EP x Occupancy Average Domestic Water 228 L/EP/day (kl) Total Required Mains RW Reuse Potential for Rainwater Reuse to Apartments and Villas: Total Numbers of Eco-Tourism Apartments: Assume 40% short term accommodation - One bedroom 2.2 No % Assume 40% short term accommodation - Two bedroom 2.5 No % Assume 20% short term accommodation - Three bedroom 2.5 No % Total Numbers of Eco-Tourism Villas: Assume 100% short term accommodation Three bedrooms No % Total for Month (kl) Assumptions: Percentage Mains/ Reuse 45% 55% m 2 of roof to apartments and villas connected to rainwater reuse storage tanks. 2. Rainfall for calculation taken as median rain for month based on BOM Rainfall data. 3. Storage capacity assumed as 3000 L/ apartment or villa. 4. Rainfall capture assumed as follows: - 90 % with rainfall up to 50 mm/ mth; - 70 % with rainfall above 50 mm/ mth.
200 Great Keppel Island - Resort Revitalisation Plan Appendix B.9 Water Balance - August Area ET Factor EP/ Unit or m 2 Unit No. or Area EP Shop etc Area (m 2 ) Eco villa Eco Apartment August 31 Days 22.2 mm Median Rain Occupancy EP x Occupancy Average Domestic Water Demand (kl) Landscape Watering (kl) Catchments 7, 8 & 9: Fisherman's Beach Precinct Fishermans Beach Hotel (Ex Foresight) Total Required Mains RW Reuse Rooms - One bedroom all rooms 2.2 No % Restaurant, hotel Licensed premises etc - Gross floor area m % Retail Shops m % Ecotourism Villas Assume 100% short term accommodation Three bedrooms 2.5 No % Ecotourism Apartments (150 No.) Assume 40% short term accommodation - One bedroom 2.2 No % Assume 40% short term accommodation - Two bedroom 2.5 No % Assume 20% short term accommodation - Three bedroom 2.5 No % Fishermans Beach Resort Restaurants, café, Fast Food etc Gross floor area m % Retail Shops including pro shop m2 1, ,500 50% Swimming pool, tennis court & Gymnasium 50% Staff Living on site - allow one bedroom unit - Long term 1.5 No % Living off site 0.32 No % Day Visitors Assume 0.1 EP/ Visitor (noting also public area allowances) 0.1 No % Allow nominal for facilities 12 50% Landscape Watering (assumed 3 30 mm/ week) Ha Total Required Median Rainfall Effluent Reuse SW Harvested Balance from Mains Effluent Reuse (equiv to 2 mm/ day = ~60 mm/ mth). All used on Golf Course. Ha On Site Stormwater Reuse (say 5% x available 6900 kl for Aug) kl 6, Mains Water Makeup (Balance of requirement) Airport Total Area 3,500m2 allow 1,000m2 retail, etc m2 1, % Effluent Reuse (equiv to 2 mm/ day = ~60 mm/ mth). All used on Golf Course. Ha Catchment 14 - Marina Precinct: Marina Berths 1 No % Yacht Club - Licensed premises, restaurants, café etc Gross floor area m2 1, ,000 10% Retail Shops m2 6, ,000 10% Day Visitors Assume 0.1 EP/ Visitor (noting also public area allowances) 0.1 No % Allow nominal for facilities 33% Marina Ecotourism Apartments (150 No.) Assume 40% short term accommodation - One bedroom 2.2 No % Assume 40% short term accommodation - Two bedroom 2.5 No % Assume 20% short term accommodation - Three bedroom 2.5 No % Catchments 5 & 11 - Golf Course Precinct: Golf Clubhouse including Golf Day Visitors m2 2, ,500 33%
201 Golf Course - Tees, Greens, Fairways (ex Golf Course Designer) (rainfall included in requirement) Effluent Reuse (@ maximum rate equiv to 2 mm/ day = ~60 mm/ mth) Ha On Site Stormwater Reuse (say 30% x available 6,800 kl for Aug) kl Mains Water Makeup (Balance of requirement) Ecotourism Villas Assume 100% short term accommodation Three bedrooms No % TOTAL TOTAL in kl/day Check available Effluent EP x Occupancy x 180 x 95% (kl) (Note 5) Note 1: Public areas EP = ET Factor x 3 (Ex Livingston Council Design Guideline) Total Water Required (kl) Note 2: Effluent Reuse fully required for Golf Course. Total Mains Water Required (kl) Note 3: Villas and Apartments, staff units l/p/day with28 l/p/day (**)from RW Reuse. Total Mains Water Required (kl/day) Note 4: Hotel and Core facilities l/p/day with 28 l/p/day from RW Reuse. Peaking Factor (Peak Demand/ Ave Demand) = 1.5 (Dom), 1.1 (Land) Note 5: Sewer flow/ EP = 136 L/p/d (ext supply) + 44 L/p/d (RW Reuse) = 180 L/p/d Peak Mains Water Required (kl/day) ** Ref Note 3: Reduced from 64 l/p/day to 28 l/p/day due to low rainfall month. Mains Water Supply - Flow Rate over 24 Hours 16.5 L/sec Area ET Factor EP/ Unit or m 2 Unit No. or Area EP RW Tank Storage Rainwater Inflow August 31 Days 22.2 mm Median 3 kl/ unit Total Available Occupancy EP x Occupancy Average Domestic Water 228 L/EP/day (kl) Total Required Mains RW Reuse Potential for Rainwater Reuse to Apartments and Villas: Total Numbers of Eco-Tourism Apartments: Assume 40% short term accommodation - One bedroom 2.2 No % Assume 40% short term accommodation - Two bedroom 2.5 No % Assume 20% short term accommodation - Three bedroom 2.5 No % Total Numbers of Eco-Tourism Villas: Assume 100% short term accommodation Three bedrooms No % Total for Month (kl) Assumptions: Percentage Mains/ Reuse 47% 53% m 2 of roof to apartments and villas connected to rainwater reuse storage tanks. 2. Rainfall for calculation taken as median rain for month based on BOM Rainfall data. 3. Storage capacity assumed as 3000 L/ apartment or villa. 4. Rainfall capture assumed as follows: - 90 % with rainfall up to 50 mm/ mth; - 70 % with rainfall above 50 mm/ mth.
202 Great Keppel Island - Resort Revitalisation Plan Appendix B.10 Water Balance - Average Occupancy/ Dry Month - September Area ET Factor EP/ Unit or m 2 Unit No. or Area EP Shop etc Area (m 2 ) Eco villa Eco Apartment Average Month, say September 30 Days 20 mm Median Rain Occupancy EP x Occupancy Average Domestic Water Demand (kl) Landscape Watering (kl) Catchments 7, 8 & 9: Fisherman's Beach Precinct Fishermans Beach Hotel (Ex Foresight) Total Required Mains RW Reuse Rooms - One bedroom all rooms 2.2 No % Restaurant, hotel Licensed premises etc - Gross floor area m % Retail Shops m % Ecotourism Villas Assume 100% short term accommodation Three bedrooms 2.5 No % Ecotourism Apartments (150 No.) Assume 40% short term accommodation - One bedroom 2.2 No % Assume 40% short term accommodation - Two bedroom 2.5 No % Assume 20% short term accommodation - Three bedroom 2.5 No % Fishermans Beach Resort Restaurants, café, Fast Food etc Gross floor area m % Retail Shops including pro shop m2 1, ,500 93% Swimming pool, tennis court & Gymnasium 93% Staff Living on site - allow one bedroom unit - Long term 1.5 No % Living off site 0.32 No % Day Visitors Assume 0.1 EP/ Visitor (noting also public area allowances) 0.1 No % Allow nominal for facilities 12 93% Landscape Watering (assumed 3 30 mm/ week) Ha Total Required Median Rainfall Effluent Reuse SW Harvested Balance from Mains Effluent Reuse (equiv to 2 mm/ day = ~60 mm/ mth). All used on Golf Course. Airport Ha On Site Stormwater Reuse (say 5% x available 4000 kl for Sept) kl 4, Mains Water Makeup (Balance of requirement) Total Area 3,500m2 allow 1,000m2 retail, etc m2 1, % Effluent Reuse (equiv to 2 mm/ day = ~60 mm/ mth). All used on Golf Course. Ha Catchment 14 - Marina Precinct: Marina Berths 1 No % Yacht Club - Licensed premises, restaurants, café etc Gross floor area m2 1, ,000 26% Retail Shops m2 6, ,000 26% Day Visitors Assume 0.1 EP/ Visitor (noting also public area allowances) 0.1 No % Allow nominal for facilities 78% Marina Ecotourism Apartments (150 No.) Assume 40% short term accommodation - One bedroom 2.2 No % Assume 40% short term accommodation - Two bedroom 2.5 No % Assume 20% short term accommodation - Three bedroom 2.5 No % Catchments 5 & 11 - Golf Course Precinct:
203 Golf Clubhouse including Golf Day Visitors m2 2, ,500 78% Golf Course - Tees, Greens, Fairways (ex Golf Course Designer) (rainfall included in requirement) Effluent Reuse (@ maximum rate equiv to 2 mm/ day = ~60 mm/ mth) Ha On Site Stormwater Reuse (say max 40% x available 500 kl for Sept) kl Mains Water Makeup (Balance of requirement) Ecotourism Villas Assume 100% short term accommodation Three bedrooms No % TOTAL TOTAL in kl/day Check available Effluent EP x Occupancy x 180 x 95% (kl) (Note 5) Note 1: Public areas EP = ET Factor x 3 (Ex Livingston Council Design Guideline) Total Water Required (kl) Note 2: Effluent Reuse fully required for Golf Course. Total Mains Water Required (kl) Note 3: Villas and Apartments, staff units l/p/day with28 l/p/day (**)from RW Reuse. Total Mains Water Required (kl/day) Note 4: Hotel and Core facilities l/p/day with 28 l/p/day from RW Reuse. Peaking Factor (Peak Demand/ Ave Demand) = 1.5 (Dom), 1.1 (Land) Note 5: Sewer flow/ EP = 136 L/p/d (ext supply) + 44 L/p/d (RW Reuse) = 180 L/p/d Peak Mains Water Required (kl/day) ** Ref Note 3: Reduced from 64 l/p/day to 28 l/p/day due to low rainfall month. Mains Water Supply - Flow Rate over 24 Hours 23.8 L/sec Area ET Factor EP/ Unit or m 2 Unit No. or Area EP RW Tank Storage Rainwater Inflow September 30 Days 20 mm Median 3 kl/ unit Total Available Occupancy EP x Occupancy Average Domestic Water 228 L/EP/day (kl) Total Required Mains RW Reuse Potential for Rainwater Reuse to Apartments and Villas: Total Numbers of Eco-Tourism Apartments: Assume 40% short term accommodation - One bedroom 2.2 No % Assume 40% short term accommodation - Two bedroom 2.5 No % Assume 20% short term accommodation - Three bedroom 2.5 No % Total Numbers of Eco-Tourism Villas: Assume 100% short term accommodation Three bedrooms No % Total for Month (kl) Assumptions: Percentage Mains/ Reuse 79% 21% m 2 of roof to apartments and villas connected to rainwater reuse storage tanks. 2. Rainfall for calculation taken as median rain for month based on BOM Rainfall data. 3. Storage capacity assumed as 3000 L/ apartment or villa. 4. Rainfall capture assumed as follows: - 90 % with rainfall up to 50 mm/ mth; - 70 % with rainfall above 50 mm/ mth.
204 Great Keppel Island - Resort Revitalisation Plan Appendix B.11 Water Balance - October Area ET Factor EP/ Unit or m 2 Unit No. or Area EP Shop etc Area (m 2 ) Eco villa Eco Apartment October 31 Days 23.6 mm Median Rain Occupancy EP x Occupancy Average Domestic Water Demand (kl) Landscape Watering (kl) Catchments 7, 8 & 9: Fisherman's Beach Precinct Fishermans Beach Hotel (Ex Foresight) Total Required Mains RW Reuse Rooms - One bedroom all rooms 2.2 No % Restaurant, hotel Licensed premises etc - Gross floor area m % Retail Shops m % Ecotourism Villas Assume 100% short term accommodation Three bedrooms 2.5 No % Ecotourism Apartments (150 No.) Assume 40% short term accommodation - One bedroom 2.2 No % Assume 40% short term accommodation - Two bedroom 2.5 No % Assume 20% short term accommodation - Three bedroom 2.5 No % Fishermans Beach Resort Restaurants, café, Fast Food etc Gross floor area m % Retail Shops including pro shop m2 1, ,500 53% Swimming pool, tennis court & Gymnasium 53% Staff Living on site - allow one bedroom unit - Long term 1.5 No % Living off site 0.32 No % Day Visitors Assume 0.1 EP/ Visitor (noting also public area allowances) 0.1 No % Allow nominal for facilities 12 76% Landscape Watering (assumed 3 30 mm/ week) Ha Total Required Median Rainfall Effluent Reuse SW Harvested Balance from Mains Effluent Reuse (equiv to 2 mm/ day = ~60 mm/ mth). All used on Golf Course. Ha On Site Stormwater Reuse (say 5% x available 8,400 kl for Sept) kl 8, Mains Water Makeup (Balance of requirement) Airport Total Area 3,500m2 allow 1,000m2 retail, etc m2 1, % Effluent Reuse (equiv to 2 mm/ day = ~60 mm/ mth). All used on Golf Course. Ha Catchment 14 - Marina Precinct: Marina Berths 1 No % Yacht Club - Licensed premises, restaurants, café etc Gross floor area m2 1, ,000 14% Retail Shops m2 6, ,000 14% Day Visitors Assume 0.1 EP/ Visitor (noting also public area allowances) 0.1 No % Allow nominal for facilities 53% Marina Ecotourism Apartments (150 No.) Assume 40% short term accommodation - One bedroom 2.2 No % Assume 40% short term accommodation - Two bedroom 2.5 No % Assume 20% short term accommodation - Three bedroom 2.5 No % Catchments 5 & 11 - Golf Course Precinct: Golf Clubhouse including Golf Day Visitors m2 2, ,500 53%
205 Golf Course - Tees, Greens, Fairways (ex Golf Course Designer) (rainfall included in requirement) Effluent Reuse (@ maximum rate equiv to 2 mm/ day = ~60 mm/ mth) Ha On Site Stormwater Reuse (say 40% x available 1,000 kl for Oct) kl Mains Water Makeup (Balance of requirement) Ecotourism Villas Assume 100% short term accommodation Three bedrooms No % TOTAL TOTAL in kl/day Check available Effluent EP x Occupancy x 180 x 95% (kl) (Note 5) Note 1: Public areas EP = ET Factor x 3 (Ex Livingston Council Design Guideline) Total Water Required (kl) Note 2: Effluent Reuse fully required for Golf Course. Total Mains Water Required (kl) Note 3: Villas and Apartments, staff units l/p/day with28 l/p/day (**)from RW Reuse. Total Mains Water Required (kl/day) Note 4: Hotel and Core facilities l/p/day with 28 l/p/day from RW Reuse. Peaking Factor (Peak Demand/ Ave Demand) = 1.5 (Dom), 1.1 (Land) Note 5: Sewer flow/ EP = 136 L/p/d (ext supply) + 44 L/p/d (RW Reuse) = 180 L/p/d Peak Mains Water Required (kl/day) ** Ref Note 3: Reduced from 64 l/p/day to 28 l/p/day due to low rainfall month. Mains Water Supply - Flow Rate over 24 Hours 24.7 L/sec Area ET Factor EP/ Unit or m 2 Unit No. or Area EP RW Tank Storage Rainwater Inflow October 31 Days 23.6 mm Median 3 kl/ unit Total Available Occupancy EP x Occupancy Average Domestic Water 228 L/EP/day (kl) Total Required Mains RW Reuse Potential for Rainwater Reuse to Apartments and Villas: Total Numbers of Eco-Tourism Apartments: Assume 40% short term accommodation - One bedroom 2.2 No % Assume 40% short term accommodation - Two bedroom 2.5 No % Assume 20% short term accommodation - Three bedroom 2.5 No % Total Numbers of Eco-Tourism Villas: Assume 100% short term accommodation Three bedrooms No % Total for Month (kl) Assumptions: Percentage Mains/ Reuse 65% 35% m 2 of roof to apartments and villas connected to rainwater reuse storage tanks. 2. Rainfall for calculation taken as median rain for month based on BOM Rainfall data. 3. Storage capacity assumed as 3000 L/ apartment or villa. 4. Rainfall capture assumed as follows: - 90 % with rainfall up to 50 mm/ mth; - 70 % with rainfall above 50 mm/ mth.
206 Great Keppel Island - Resort Revitalisation Plan Appendix B.12 Water Balance - November Area ET Factor EP/ Unit or m 2 Unit No. or Area EP Shop etc Area (m 2 ) Eco villa Eco Apartment November 30 Days 30 mm Median Rain Occupancy EP x Occupancy Average Domestic Water Demand (kl) Landscape Watering (kl) Catchments 7, 8 & 9: Fisherman's Beach Precinct Fishermans Beach Hotel (Ex Foresight) Total Required Mains RW Reuse Rooms - One bedroom all rooms 2.2 No % Restaurant, hotel Licensed premises etc - Gross floor area m % Retail Shops m % Ecotourism Villas Assume 100% short term accommodation Three bedrooms 2.5 No % Ecotourism Apartments (150 No.) Assume 40% short term accommodation - One bedroom 2.2 No % Assume 40% short term accommodation - Two bedroom 2.5 No % Assume 20% short term accommodation - Three bedroom 2.5 No % Fishermans Beach Resort Restaurants, café, Fast Food etc Gross floor area m % Retail Shops including pro shop m2 1, ,500 65% Swimming pool, tennis court & Gymnasium 65% Staff Living on site - allow one bedroom unit - Long term 1.5 No % Living off site 0.32 No % Day Visitors Assume 0.1 EP/ Visitor (noting also public area allowances) 0.1 No % Allow nominal for facilities 12 65% Landscape Watering (assumed 3 30 mm/ week) Ha Total Required Median Rainfall Effluent Reuse SW Harvested Balance from Mains Effluent Reuse (equiv to 2 mm/ day = ~60 mm/ mth). All used on Golf Course. Ha On Site Stormwater Reuse (say 5% x available 11,100 kl for Nov) kl 11, Mains Water Makeup (Balance of requirement) Airport Total Area 3,500m2 allow 1,000m2 retail, etc m2 1, % Effluent Reuse (equiv to 2 mm/ day = ~60 mm/ mth). All used on Golf Course. Ha Catchment 14 - Marina Precinct: Marina Berths 1 No % Yacht Club - Licensed premises, restaurants, café etc Gross floor area m2 1, ,000 12% Retail Shops m2 6, ,000 12% Day Visitors Assume 0.1 EP/ Visitor (noting also public area allowances) 0.1 No % Allow nominal for facilities 65% Marina Ecotourism Apartments (150 No.) Assume 40% short term accommodation - One bedroom 2.2 No % Assume 40% short term accommodation - Two bedroom 2.5 No % Assume 20% short term accommodation - Three bedroom 2.5 No % Catchments 5 & 11 - Golf Course Precinct: Golf Clubhouse including Golf Day Visitors m2 2, ,500 65%
207 Golf Course - Tees, Greens, Fairways (ex Golf Course Designer) (rainfall included in requirement) Effluent Reuse (@ maximum rate equiv to 2 mm/ day = ~60 mm/ mth) Ha On Site Stormwater Reuse (say 30% x available 4,700 kl for Nov) kl Mains Water Makeup (Balance of requirement) Ecotourism Villas Assume 100% short term accommodation Three bedrooms No % TOTAL TOTAL in kl/day Check available Effluent EP x Occupancy x 180 x 95% (kl) (Note 5) Note 1: Public areas EP = ET Factor x 3 (Ex Livingston Council Design Guideline) Total Water Required (kl) Note 2: Effluent Reuse fully required for Golf Course. Total Mains Water Required (kl) Note 3: Villas and Apartments, staff units l/p/day with28 l/p/day (**)from RW Reuse. Total Mains Water Required (kl/day) Note 4: Hotel and Core facilities l/p/day with 28 l/p/day from RW Reuse. Peaking Factor (Peak Demand/ Ave Demand) = 1.5 (Dom), 1.1 (Land) Note 5: Sewer flow/ EP = 136 L/p/d (ext supply) + 44 L/p/d (RW Reuse) = 180 L/p/d Peak Mains Water Required (kl/day) ** Ref Note 3: Reduced from 64 l/p/day to 28 l/p/day due to low rainfall month. Mains Water Supply - Flow Rate over 24 Hours 26.3 L/sec Area ET Factor EP/ Unit or m 2 Unit No. or Area EP RW Tank Storage Rainwater Inflow November 30 Days 30 mm Median 3 kl/ unit Total Available Occupancy EP x Occupancy Average Domestic Water 228 L/EP/day (kl) Total Required Mains RW Reuse Potential for Rainwater Reuse to Apartments and Villas: Total Numbers of Eco-Tourism Apartments: Assume 40% short term accommodation - One bedroom 2.2 No % Assume 40% short term accommodation - Two bedroom 2.5 No % Assume 20% short term accommodation - Three bedroom 2.5 No % Total Numbers of Eco-Tourism Villas: Assume 100% short term accommodation Three bedrooms No % Total for Month (kl) Assumptions: Percentage Mains/ Reuse 60% 40% m 2 of roof to apartments and villas connected to rainwater reuse storage tanks. 2. Rainfall for calculation taken as median rain for month based on BOM Rainfall data. 3. Storage capacity assumed as 3000 L/ apartment or villa. 4. Rainfall capture assumed as follows: - 90 % with rainfall up to 50 mm/ mth; - 70 % with rainfall above 50 mm/ mth.
208 Great Keppel Island - Resort Revitalisation Plan Appendix B.13 Water Balance - December Area ET Factor EP/ Unit or m 2 Unit No. or Area EP Shop etc Area (m 2 ) Eco villa Eco Apartment Average Month, say December 31 Days mm Median Rain Occupancy EP x Occupancy Average Domestic Water Demand (kl) Landscape Watering (kl) Catchments 7, 8 & 9: Fisherman's Beach Precinct Fishermans Beach Hotel (Ex Foresight) Total Required Mains RW Reuse Rooms - One bedroom all rooms 2.2 No % Restaurant, hotel Licensed premises etc - Gross floor area m % Retail Shops m % Ecotourism Villas Assume 100% short term accommodation Three bedrooms 2.5 No % Ecotourism Apartments (150 No.) Assume 40% short term accommodation - One bedroom 2.2 No % Assume 40% short term accommodation - Two bedroom 2.5 No % Assume 20% short term accommodation - Three bedroom 2.5 No % Fishermans Beach Resort Restaurants, café, Fast Food etc Gross floor area m % Retail Shops including pro shop m2 1, ,500 92% Swimming pool, tennis court & Gymnasium 92% Staff Living on site - allow one bedroom unit - Long term 1.5 No % Living off site 0.32 No % Day Visitors Assume 0.1 EP/ Visitor (noting also public area allowances) 0.1 No % Allow nominal for facilities 12 92% Landscape Watering (assumed 3 30 mm/ week) Ha Total Required Median Rainfall Effluent Reuse SW Harvested Balance from Mains Effluent Reuse (equiv to 2 mm/ day = ~60 mm/ mth). All used on Golf Course. Ha On Site Stormwater Reuse (say 5% x available 36,000 kl for Dec) kl 36, Mains Water Makeup (Balance of requirement) 0.0 Airport Total Area 3,500m2 allow 1,000m2 retail, etc m2 1, % Effluent Reuse (equiv to 2 mm/ day = ~60 mm/ mth). All used on Golf Course. Ha Catchment 14 - Marina Precinct: Marina Berths 1 No % Yacht Club - Licensed premises, restaurants, café etc Gross floor area m2 1, ,000 48% Retail Shops m2 6, ,000 48% Day Visitors Assume 0.1 EP/ Visitor (noting also public area allowances) 0.1 No % Allow nominal for facilities 84% Marina Ecotourism Apartments (150 No.) Assume 40% short term accommodation - One bedroom 2.2 No % Assume 40% short term accommodation - Two bedroom 2.5 No % Assume 20% short term accommodation - Three bedroom 2.5 No % Catchments 5 & 11 - Golf Course Precinct: Golf Clubhouse including Golf Day Visitors m2 2, ,500 84%
209 Golf Course - Tees, Greens, Fairways (ex Golf Course Designer) (rainfall included in requirement) Effluent Reuse (@ maximum rate equiv to 2 mm/ day = ~60 mm/ mth) Ha On Site Stormwater Reuse (say 10% x available 41,200 kl for Dec) kl Mains Water Makeup (Balance of requirement) Ecotourism Villas Assume 100% short term accommodation Three bedrooms No % TOTAL TOTAL in kl/day Check available Effluent EP x Occupancy x 180 x 95% (kl) (Note 5) Note 1: Public areas EP = ET Factor x 3 (Ex Livingston Council Design Guideline) Total Water Required (kl) Note 2: Effluent Reuse fully required for Golf Course. Total Mains Water Required (kl) Note 3: Villas and Apartments, staff units l/p/day with 64 l/p/day from RW Reuse. Total Mains Water Required (kl/day) Note 4: Hotel and Core facilities l/p/day with 28 l/p/day from RW Reuse. Peaking Factor (Peak Demand/ Ave Demand) = 1.5 (Dom), 1.1 (Land) Note 5: Sewer flow/ EP = 136 L/p/d (ext supply) + 44 L/p/d (RW Reuse) = 180 L/p/d Peak Mains Water Required (kl/day) Mains Water Supply - Flow Rate over 24 Hours 18.6 L/sec Area ET Factor EP/ Unit or m 2 Unit No. or Area EP RW Tank Storage Rainwater Inflow December 31 Days mm Median 3 kl/ unit Total Available Occupancy EP x Occupancy Average Domestic Water 228 L/EP/day (kl) Total Required Mains RW Reuse Potential for Rainwater Reuse to Apartments and Villas: Total Numbers of Eco-Tourism Apartments: Assume 40% short term accommodation - One bedroom 2.2 No % Assume 40% short term accommodation - Two bedroom 2.5 No % Assume 20% short term accommodation - Three bedroom 2.5 No % Total Numbers of Eco-Tourism Villas: Assume 100% short term accommodation Three bedrooms No % Total for Month (kl) Assumptions: Percentage Mains/ Reuse 0% 100% m 2 of roof to apartments and villas connected to rainwater reuse storage tanks. 2. Rainfall for calculation taken as median rain for month based on BOM Rainfall data. 3. Storage capacity assumed as 3000 L/ apartment or villa. 4. Rainfall capture assumed as follows: - 90 % with rainfall up to 50 mm/ mth; - 70 % with rainfall above 50 mm/ mth.
210 Water Cycle Management Report Great Keppel Island Resort Revitalisation Plan APPENDIX F Water Supply Scheme Layout N-B016 Page 166
211
212 Water Cycle Management Report Great Keppel Island Resort Revitalisation Plan APPENDIX G Wastewater Scheme Layout N-B016 Page 167
213
214
215 Water Cycle Management Report Great Keppel Island Resort Revitalisation Plan APPENDIX H Preliminary Irrigation Management Plan N-B016 Page 168
216 Great Keppel Island Resort Revitalisation Plan Preliminary Irrigation Management Plan For GKI Resort Pty Ltd Revision A 15 September 2011 Opus International Consultants (PCA) Pty Ltd ABN Level 1, 2 Mayneview Street, Milton, QLD 4064 PO Box 1703, Milton, QLD Preliminary Irrigation Management Plan Great Keppel Island Resort Revitalisation Plan Revision A
217 Preliminary Irrigation Management Plan Great Keppel Island Resort Revitalisation Plan TABLE OF CONTENTS 1. INTRODUCTION PROJECT OVERVIEW PURPOSE ROLES & RESPONSIBILITIES ORGANISATIONAL STRUCTURE ROLES & RESPONSIBILITIES Resort Owner Resort Manager WWTP Operations Manager Grounds Maintenance Manager Site Personnel ROUTINE OPERATING PROCEDURES REUSE SCHEME OVERVIEW Wastewater Treatment Plant Hydraulic Loading Recycled Water Quality Irrigation Area Wet Weather Storage Ocean Outfall OPERATIONAL CONTROLS Irrigation Scheduling Distribution System Plant Harvesting Exclusion Zones Timing Restrictions Signage Wet Weather Storage / Stormwater Harvesting Ponds Stormwater Management MONITORING PROGRAM GENERAL N-B016 Table of Contents
218 Preliminary Irrigation Management Plan Great Keppel Island Resort Revitalisation Plan 4.2 MONITORING Recycled Water Quantity Recycled Water Quality Soil Groundwater Surface Water INSPECTIONS REPORTING ENVIRONMENTAL INCIDENTS GENERAL REQUIREMENTS ENVIRONMENTAL COMPLAINTS GENERAL REQUIREMENTS STAFF TRAINING & AWARENESS N-B016 Table of Contents
219
220 Preliminary Irrigation Management Plan Great Keppel Island Resort Revitalisation Plan 1. INTRODUCTION This preliminary Irrigation Management Plan (IMP) has been prepared by Opus International Consultants ( Opus ) on behalf of GKI Resort Pty Ltd to outline management strategies for the reuse of recycled water for irrigation as part of the Great Keppel Island (GKI) Resort Revitalisation Plan. The contents of this Plan are to be included as part of the overall Environmental Impact Statement (EIS) prepared for the GKI Resort Revitalisation Plan and will need to be updated to reflect the final design of the scheme and any relevant conditions of approval prior to implementation of the IMP. 1.1 PROJECT OVERVIEW The GKI Resort Revitalisation Plan will involve operation of a wastewater treatment plant (WWTP) or multiple WWTP(s) to treat sewage generated by the resort and marina facilities. Recycled water produced by the Island-based WWTP(s) will be used for irrigation of the proposed golf course and possibly other landscaped areas around the resort where sufficient recycled water supply is available. The proposed WWTP(s) will have a peak design capacity to treat an Average Dry Weather Flow (ADWF) of approximately 3,973 equivalent persons (EP) or approximately 794.6kL/day based on 200L/EP/day. Operation of the proposed WWTP(s) will conform to the definition of environmentally relevant activity (ERA) 63(2)(c), which is defined in schedule 2 of the Environmental Protection Regulation 2008 as follows: ERA 63(2)(c) Sewage treatment operating sewage treatment works, other than no release works, with a total peak design capacity of 1,500 to 4,000EP. Prior to commencement of the activity, development approval will be required for the above ERA under chapter 4 of the Environmental Protection Act The Resort Manager will also be required to obtain a registration certificate to operate the above ERA. 1.2 PURPOSE The purpose of this IMP is to outline the requirements for operation of the proposed recycled water irrigation scheme associated with the GKI Resort Revitalisation Plan to: Comply with relevant legislation and standards; Provide strategies to mitigate potential environmental and public health risks likely to be associated with reuse of recycled water for irrigation; and Establish a framework for addressing potential environmental and public health risks arising in the future. In this regard, the IMP will detail: Routine operating procedures to prevent or minimise environmental harm; Monitoring of the release of contaminants into the environment, including monitoring of environmental impact; Procedures for dealing with environmental incidents and complaints; N-B016 Page: 1
221 Preliminary Irrigation Management Plan Great Keppel Island Resort Revitalisation Plan Environmental reporting and maintenance of records; and Staff training and awareness of environmental issues. The IMP has been prepared to support the Environmental Impact Statement (EIS) prepared for the GKI Resort Revitalisation Plan and is based on an assessment of environmental aspects and associated impacts identified during the preliminary planning phase of the recycled water irrigation scheme. Environmental aspects (activities and works that are likely to have an environmental impact) need to be continuously identified over the life of the scheme. The IMP will need to be updated based on an assessment of environmental aspects and impacts during the detailed design phase of the recycled water irrigation scheme and to incorporate conditions of development approval under the Environmental Protection Act 1994 and other relevant legislation. The IMP will continue to evolve over the life of the scheme, taking into consideration the results of ongoing monitoring and / or the introduction of new technologies that reduce the risk of environmental harm. N-B016 Page: 2
222 Preliminary Irrigation Management Plan Great Keppel Island Resort Revitalisation Plan 2. ROLES & RESPONSIBILITIES 2.1 ORGANISATIONAL STRUCTURE The following chart identifies the main entities likely to be involved in operation of the recycled water irrigation scheme and the relationships between these entities. Administering Authority Department of Environment & Resource Management Other Relevant Authorities Great Barrier Reef Marine Park Authority Rockhampton Regional Council Resort Owner GKI Resort Pty Ltd Resort Manager WWTP Operations Manager Grounds Maintenance Manager Site Personnel Figure 1: Recycled Water Irrigation Scheme Organisational Structure 2.2 ROLES & RESPONSIBILITIES Resort Owner The Resort Owner shall be responsible for: Forwarding in a timely manner, all information and reports required by this IMP and the conditions of development approval to the Administering Authority; and Ensuring appropriate resources are planned and made available to enable effective implementation of this IMP and conditions of development approval. N-B016 Page: 3
223 Preliminary Irrigation Management Plan Great Keppel Island Resort Revitalisation Plan Resort Manager The Resort Manager shall be responsible for: Coordination of all operation and maintenance activities to ensure compliance with this IMP and conditions of development approval; Providing regular reports to the Resort Owner detailing condition, maintenance requirements and budgetary needs for ongoing operation of the WWTP(s) and recycled water irrigation scheme; Forwarding all information received from the WWTP Operations Manager relating to this IMP (e.g. log sheets, incident registers, complaint registers) to the Resort Owner; Ensuring that all personnel involved in operation of the WWTP and recycled water irrigation scheme are aware of their responsibilities under this IMP; Ensuring that all personnel responsible for operation and monitoring of the WWTP and recycled water irrigation scheme are adequately trained; Maintaining records to ensure compliance with this IMP and conditions of development approval; Updating the IMP to reflect any changes in legislation or standards; and Collation and preparation of all information and reports (e.g. annual returns, incidents, complaints and other notifiable events) required by this IMP and conditions of development approval for submission, through the Resort Owner, to the Administering Authority WWTP Operations Manager The WWTP Operation Manager shall be responsible for: Day to day operation of the WWTP; Maintaining all plant and equipment associated with the WWTP in a condition that ensures compliance with this IMP and conditions of development approval; Providing regular reports to the Resort Manager detailing the condition of all plant and equipment associated with the WWTP and recycled water irrigation scheme, and identifying any remedial works required to ensure compliance with this IMP and conditions of development approval; Providing regular reports to the Resort Manager detailing all maintenance activities conducted; Coordination of testing activities required by this IMP and conditions of development approval; Notifying the Grounds Maintenance Manager of any non-compliance with recycled water quality that may increase public health or environmental risks associated recycled water reuse; Forwarding the results of all monitoring of recycled water quality, soils, groundwater and surface waters required by this IMP and conditions of development approval to the Resort Manager; N-B016 Page: 4
224 Preliminary Irrigation Management Plan Great Keppel Island Resort Revitalisation Plan Ensuring that all personnel responsible for monitoring operation of the WWTP and recycled water irrigation scheme comply with the requirements of this IMP and conditions of development approval; and Reporting any incidents or complaints to the Resort Manager Grounds Maintenance Manager Day to day operation of the recycled water irrigation scheme; Maintaining all plant and equipment associated with the recycled water irrigation scheme in a condition that ensures compliance with this IMP and conditions of development approval; Providing regular reports to the WWTP Operations Manager detailing the condition of all plant and equipment associated with the recycled water irrigation scheme, and identifying any remedial works required to ensure compliance with this IMP and conditions of development approval; Providing regular reports to the WWTP Operations Manager detailing all maintenance activities conducted; Conducting testing activities associated with the recycled water irrigation scheme (ie. soil testing, surface and groundwater testing, etc) required by this IMP and conditions of development approval; Notifying the WWTP Operations Manager of any issues relating to possible non-compliance of recycled water quality or quantity; Forwarding the results of all recycled water irrigation monitoring (ie. soil testing, surface and groundwater testing, etc) required by this IMP and conditions of development approval to the WWTP Operations Manager; Ensuring that all personnel responsible for monitoring operation of the recycled water irrigation scheme comply with the requirements of this IMP and conditions of development approval; and Reporting any incidents or complaints to the WWTP Operations Manager Site Personnel All Site Personnel shall be responsible for: Reporting any incidents or complaints to the WWTP Operations Manager; and Complying with the general environmental duty. N-B016 Page: 5
225 Preliminary Irrigation Management Plan Great Keppel Island Resort Revitalisation Plan 3. ROUTINE OPERATING PROCEDURES 3.1 REUSE SCHEME OVERVIEW Wastewater Treatment Plant The proposed WWTP will have a peak design capacity to treat an Average Dry Weather Flow (ADWF) of approximately 3,973 equivalent persons (EP) or approximately 794.6kL/day based on 200L/EP/day. At this stage, it has not been confirmed whether a single WWTP or two WWTPs will be provided on the Island to service the GKI Resort Revitalisation Plan. This will be confirmed at detailed design stage based on the final layout and staging of the GKI Resort Revitalisation Plan, the type of treatment system to be used, land availability and buffer zone requirements. If two WWTPs are to be provided on the Island, these would most likely be located as follows: A WWTP with a total design capacity of approximately 3,000EP servicing the Marina Precinct and Fisherman s Beach Precinct most likely located on the north eastern side of the airstrip within the vicinity of the facilities maintenance compound; and A WWTP with a total design capacity of approximately 1,000EP servicing the Clam Bay Precinct most likely located to the north west of the golf course. If a single WWTP is to be provided on the Island this would most likely be located in one of the above locations. A number of wastewater treatment processes and systems would be capable of achieving the required standard of treatment. Although the exact treatment process and system used will be determined at detailed design stage, one of the preferred options at this stage comprises a membrane bio-reactor (MBR) or similar system with UV disinfection. The advantages of this type of treatment system are: Relatively compact treatment system requiring a much smaller footprint than other systems; Proven ability to consistently produce the high quality of recycled water required; Largely enclosed / sealed treatment components to reduce potential odour nuisance; and Capacity to operate multiple treatment plants in parallel to assist with staging and to provide the operational flexibility needed given the likely fluctuation of hydraulic loading Hydraulic Loading An Average Dry Weather Flow (ADWF) of 180 L/EP/day has been calculated for the GKI Resort Revitalisation Plan. However, preliminary assessment of recycled water reuse has been based on an ADWF of 200 L/EP/day. This is to ensure a conservative assessment of irrigation area and wet weather storage requirements for the recycled water irrigation scheme given the environmentally sensitive nature of the site. Wastewater generation and therefore the availability of recycled water for irrigation will vary considerably over the year due to fluctuations in occupancy rates at the resort and marina facilities. Although the theoretical maximum design population for the GKI Resort Revitalisation Plan is estimated to be N-B016 Page: 6
226 Preliminary Irrigation Management Plan Great Keppel Island Resort Revitalisation Plan approximately 3,973 EP, it is estimated that the actual design population will range between approximately 1,069 EP/day in May up to 3,750 EP/day in January. The recycled water irrigation scheme has been designed on the basis of the monthly wastewater generation rates summarised in Table 1, which have been calculated for the GKI Resort Revitalisation Plan based on expected occupancy rates and an ADWF of 200L/EP/day. TABLE 1: Estimated Monthly Wastewater Flows Adopted for MEDLI Modelling Month Average Occupancy (EP/day) ADWF for 200 L/EP/day ML/day ML/month January 3, February 1, March 1, April 2, May 1, June 1, July 1, August 1, September 3, October 2, November 2, December 3, Recycled Water Quality The WWTP will be designed to treat all wastewater generated by the GKI Resort Revitalisation Plan to the standard specified in Table 2. TABLE 2: Proposed Minimum Recycled Water Quality Criteria Release Quality Characteristic Unit Limit Limit Type Monitoring Frequency E. coli cfu/100ml <1 (<10) Median (95 th percentile) Weekly 5-day Biological Oxygen Demand mg/l <20 Median Weekly Turbidity NTU <2 (<5) Median (Maximum) Continuous Suspended Solids mg/l <5 Median Weekly Total Dissolved Solids mg/l <1,000 Median Weekly ph Range Weekly Total Nitrogen mg/l <20 Median Monthly Total Phosphorous mg/l <7 Median Monthly 1 Free Chlorine Residual mg/l Range Continuous Note: 1. Only applies where chlorination is used for disinfection. Disinfection is not preferred where discharge to the ocean is likely to occur. The above standard of treatment is consistent with the minimum water quality requirements for Municipal Use open spaces, sports grounds, golf courses, dust suppression, etc or unrestricted access and application as defined under the Australian Guidelines for Water Recycling: Managing Health and Environmental Risks (Phase 1) (ANZECC, 2006). Total nitrogen and total phosphorous concentrations have been determined as appropriate based on modelling of the nutrient assimilation capacity of soils and vegetation within the proposed irrigation area. N-B016 Page: 7
227 Preliminary Irrigation Management Plan Great Keppel Island Resort Revitalisation Plan Monitoring of recycled water quality will occur at the outlet of the WWTP(s) at the approximate frequencies listed in the Table 2 above to ensure recycled water quality achieves the above levels at discharge from the WWTP(s). The proposed recycled water quality is considered to be suitable for the following recycled water reuse options: Irrigation of the golf course; Irrigation of other sporting fields and landscaped areas (where the availability of recycled water exceeds the sustainable irrigation requirements of the golf course); and Emergency discharge of recycled water during extreme wet weather events via ocean outfall. Although the Australian Guidelines for Water Recycling: Managing Health and Environmental Risks (Phase 1) (ANZECC, 2006) indicates that recycled water complying with the above minimum criteria is suitable for Municipal Use open spaces, sports grounds, golf courses, dust suppression, etc or unrestricted access and application without the need for any additional on-site preventive measures to reduce the risk associated with potentially harmful pathogens, a number of additional on-site control measures have been conservatively specified in Section 3.2 to further mitigate potential risks Irrigation Area Location & Size The primary recycled water irrigation area will comprise the 18-hole championship golf course to be designed by Greg Norman Golf Course Design and located within the Clam Bay Precinct. Greg Norman Golf Course Design has indicated that the proposed championship golf course is likely to comprise a total area of maintained turf (including tees, greens, fairways and rough) of approximately 31 hectares. MEDLI modelling of the proposed recycled water irrigation scheme has demonstrated that provision of a minimum irrigation area of 31 hectares will enable the operation of a sustainable and beneficial recycled water irrigation scheme. Depending on final design of the golf course, additional areas may be required for irrigation. In this case, landscaped gardens and turf surrounding ecotourism villas located within the same Clam Bay Precinct as the golf course would be the first preference for alternative irrigation areas to minimise costs and energy consumption associated with pumping recycled water around the Island. However, landscaped gardens and turf within the Fisherman s Beach Precinct would also be acceptable for reuse of recycled water for irrigation if required being based on the same underlying soil type. As construction of the golf course will occur in Stage 2-3, commencing in 2014 or about 2 years after other components of the GKI Resort Revitalisation Plan, an alternative recycled water irrigation area will need to be provided in the early stages. It is anticipated that irrigation of recycled water to assist in establishing turf adjacent to the airstrip will occur during the early stages of the Project prior to construction of the golf course. Recycled water may also be used in the early stages for irrigation within the turf nursery that is likely to be established to grow the turf required to construct the golf course. Reuse of recycled wastewater for irrigation of the golf course and possibly other landscaped areas (where excess recycled water is available), not only reduces pressure on other water supply sources, but also enables the beneficial reuse of nutrients contained in the recycled wastewater to support plant growth within the irrigation area. Application of nutrients contained in recycled water to vegetation enables natural biological processes to be used to further reduce nitrogen and phosphorus components before potentially N-B016 Page: 8
228 Preliminary Irrigation Management Plan Great Keppel Island Resort Revitalisation Plan entering groundwater or surface water systems, rather than using chemical reaction processes within a treatment plant. Such chemical treatment processes typically require large inputs in terms of energy to achieve the levels of nutrient reduction that can be achieved by healthy vegetation. Application of nutrients contained in recycled water to vegetation also reduces the need to apply additional fertilisers, which are usually derived from synthetic or inorganic sources. Soil Properties The proposed recycled water irrigation scheme is based on soil properties within the proposed irrigation area being generally comprised of high permeability sand, as identified within the Clam Bay Precinct and Fisherman s Beach Precinct through geotechnical investigations undertaken on GKI by Douglas Partners (Douglas Partners, 2010). A summary of soil water and nutrient characteristics adopted for MEDLI modelling of the proposed recycled water irrigation scheme is provided in Table 3 and Table 4 below. TABLE 3: Soil Water Characteristics Adopted in MEDLI Modelling Properties Unit Soil Horizon Layer 1 Layer 2 Layer 3 Layer 4 Layer Thickness (mm) Air Dry Moisture Content (mm/layer) 4 Lower Storage Limit (mm/layer) Drained Upper Limit (mm/layer) Plant Available Water (mm) Capacity Saturated Water Content (mm/layer) Bulk Density (g/cm 3 ) Porosity (mm/layer) Saturated Hydraulic (mm/hour) Conductivity TABLE 4: Soil Nutrient Characteristics Adopted in MEDLI Modelling Properties Units Quantity Soil Nitrate mg/kg 7 Soil Organic Nitrogen mg/kg 450 Initial Soil Solution Phosphorus mg/l 0.01 In the event that substantially different soil types or properties are encountered within proposed irrigation areas during later design stages, re-modelling will need to be undertaken to ensure the proposed irrigation regime is appropriate for the soil water and nutrient assimilation capacity of soils within the irrigation area. Plant Properties The proposed recycled water irrigation scheme is based on plant properties within the proposed irrigation area being generally comprised of a continuous pasture of coastal couch. Greg Norman Golf Course Design has indicated that where possible, existing grass species (preferably couch) already growing on the Island will primarily be used for establishment of the proposed golf course. In the event that substantially different plant types occur within proposed irrigation areas, re-modelling will need to be undertaken to ensure the proposed irrigation regime is appropriate for the water and nutrient assimilation capacity of plants within the irrigation area. N-B016 Page: 9
229 Preliminary Irrigation Management Plan Great Keppel Island Resort Revitalisation Plan Wet Weather Storage The proposed recycled water irrigation scheme is based on the provision of a minimum 37ML wet weather storage plus an additional 7ML or about 20% capacity to provide a buffer for potential increases in rainfall intensity associated with projected climate change. This is considered to be an extremely conservative approach to sizing of the wet weather storage given that although increased rainfall intensity is predicted to occur as a result of climate change, a decrease in average annual rainfall is also expected to occur meaning that: Irrigation is likely to be triggered more often based on a soil water deficit, resulting in more recycled water being used for irrigation and less recycled water going into wet weather storage; and Less direct rainfall will be captured by the open wet weather storage ponds providing more capacity for storage of recycled water. Wet weather storage is likely to be provided as a series of ponds incorporated as water features within the proposed golf course. Wet weather storage should be provided separate to the stormwater harvesting ponds so as to reduce the risk of overtopping and enable monitoring of recycled water levels available for irrigation. Given the sandy nature of soils on site, an artificial clay or synthetic liner will need to be incorporated into the pond design to achieve a seepage rate in the order of 0.1mm/day to prevent contamination of groundwater Ocean Outfall The proposed recycled water irrigation scheme is expected to beneficially use 100% of all recycled water generated by the GKI Resort Revitalisation Plan in most years. However, during prolonged or extreme wet weather events, expected to occur approximately once every 10 years on average, wet weather storage ponds may reach capacity and a proportion of the recycled water may subsequently be discharged via an ocean outfall. The likelihood of ocean discharge occurring is expected to be somewhat less than the 1 in 10 years predicted by MEDLI modelling given that the modelling was based on provision of a 37ML wet weather storage rather than provision of a 44ML wet weather storage as proposed to account of predicted climate change. The exact location of the ocean outfall will be determined at detailed design stage taking into account the requirements of GBRMPA s Sewage Discharge Policy - Sewage Discharges from Marine Outfalls to the Great Barrier Reef Marine Park, March 2005, which states that: Marine outfalls should not be constructed: i. Within 50 metres of a permitted mooring or anchorage; or ii. Within 1000 metres of aquaculture operations, or an area regularly used for iii. swimming or other water-based activities, unless it can be demonstrated that there will be no adverse impacts on the operation or activities; or Within 1000 metres of sensitive environments, unless it can be demonstrated that there will be no adverse impacts on the protection of aquatic ecosystems. For a marine outfall to be approved the GBRMPA will require that: N-B016 Page: 10
230 Preliminary Irrigation Management Plan Great Keppel Island Resort Revitalisation Plan i. The outfall structure be of a design which optimises diffusion and dispersal; and ii. The design of the system includes consideration of water depth (deep water is preferred i.e. greater than 10 metres), current velocity, tidal range and proximity to reefs or other sensitive environments. At this stage, the proposed ocean outfall will comprise a pipeline of approximately 1,000 metres in length extending from Long Beach. This location was selected to provide adequate distance away from the shore, sufficient depth and exposure to offshore ocean currents to facilitate dispersion of recycled water, and to avoid identified coral reefs and seagrass beds as far as practicable. The outfall will be located within an area of water at least 10 metres deep to ensure sufficient depth of water is available above the diffuser across the full tidal range. The outfall will incorporate a T-shaped diffuser comprising two (2) ports approximately 75mm diameter. Modelling of predicted dispersion of discharges from the ocean outfall has been undertaken by Water Technology and is contained in their report Great Keppel Island Resort Revitalisation Plan Coastal Environment Technical Report August Based on the estimated volume and duration of discharge events predicted by MEDLI modelling and assuming recycled water nutrient concentrations of 20 mg/l for total nitrogen and 7 mg/l of total phosphorous, dispersion modelling by Water Technology has predicted that concentrations of total nitrogen and total phosphorous will reduce to below relevant water quality objectives within a small mixing zone in the immediate vicinity of the outfall. On this basis, the proposed emergency wet weather discharge of recycled water via an ocean outfall is not anticipated to have any significant impact on ecological communities near the outfall. 3.2 OPERATIONAL CONTROLS Irrigation Scheduling While nutrients applied to the golf course and other landscaped areas are beneficial to plant growth within these areas, it is necessary to ensure that the amount of nutrients applied does not exceed the hydraulic and nutrient assimilation capacity of soils and plants within the irrigation area, otherwise nutrients may be leached into groundwater and ultimately surface water bodies. A detailed water and nutrient balance has been undertaken to determine the amount of nutrients contained in recycled water and the rate of application that can be sustainably applied to the irrigation area. Based on MEDLI modelling, it is recommended that irrigation occurs in response to low soil moisture conditions. This will maximise the beneficial reuse of recycled water while also reducing the potential for runoff and leaching of nutrients that could potentially contaminate waterways. The irrigation schedule adopted in MEDLI modelling is based on irrigation being triggered at 80% PAWC and irrigating up to 5.0mm beyond drained upper limit (DUL). This irrigation regime was determined to be appropriate on the basis that the resulting levels of nutrient leaching were generally consistent with modelled outputs of the site under no irrigation reflecting a non-worsening approach. Irrigating only when soil moisture is low, combined with the naturally permeable sandy soils, also reduces the potential for causing runoff or ponding of recycled water within irrigation areas. Soil moisture probes should be installed throughout the recycled water irrigation areas to monitor soil moisture conditions so that irrigation occurs generally in accordance with the above schedule. N-B016 Page: 11
231 Preliminary Irrigation Management Plan Great Keppel Island Resort Revitalisation Plan Distribution System The recycled water irrigation system will be designed, implemented and maintained to ensure that recycled water is distributed evenly across the entire irrigation area so as to avoid exceeding the water and nutrient assimilation capacity of soils and plants within certain parts of the irrigation area or not fully utilising available recycled water at the rate required to prevent overflow of the wet weather storage ponds. Due to the large size of the irrigation area, an above ground distribution system such as fixed pivot sprinklers is proposed to distribute recycled water for irrigation over the majority of the golf course. An above ground distribution system is preferred due to the ease of maintenance and it enables easy identification of any faults that could result in failure of the irrigation system to distribute recycled water evenly across the irrigation area. The use of sprinklers able to distribute recycled water over large areas also reduces the number of system parts and components, thereby reducing maintenance requirements and costs. Low-throw sprinklers will be used along with irrigation fittings that produce large size droplets to reduce the potential for spray drift into sensitive receivers (eg. villas). However, where irrigation is proposed within 25 to 30 metres of sensitive receivers, pressure compensated sub-surface or surface drippers are proposed to further reduce the potential for spray drift. To the maximum extent possible, the irrigation system will be designed to incorporate gravity feed, thereby reducing reliance on pumps, which are more likely to breakdown and require additional maintenance Plant Harvesting The recycled water irrigation area will primarily comprise golf course. As such, regular mowing, trimming and green keeping activities will occur to maintain a quality playing surface by encouraging a healthy coverage of grass. Maintaining healthy grass coverage is important in order to maximise the nutrient uptake in the irrigation area. It is therefore important to ensure that all areas used for recycled water irrigation area are regularly maintain to encourage healthy plant growth. It is also recommended that as part of maintenance activities, all grass clippings should be removed from recycled water irrigation areas to reduce the potential for accumulation of excess nutrients. Removal of excess biomass in grass clippings also removes from the irrigation area the nutrients contained within these grass clippings. In addition, vegetative growth in plants is stimulated following harvesting, which in turn stimulates the uptake of nutrients Exclusion Zones Although the MEDLI modelling indicates that no surface ponding or runoff of recycled water should occur as a result of the proposed recycled irrigation scheme, it is recommended that recycled water irrigation be avoided in the following areas: No recycled water irrigation shall occur on slopes >6%; No recycled water irrigation shall occur within 30 metres of the high bank of a natural waterway; No recycled water irrigation shall occur within 30 metres of an existing groundwater bore; No recycled water irrigation shall occur on land inundated by a Q100 flood / storm surge event; and No recycled water irrigation shall occur within any area containing remnant native vegetation. N-B016 Page: 12
232 Preliminary Irrigation Management Plan Great Keppel Island Resort Revitalisation Plan Implementation of the above exclusion zones will reduce the potential for contamination of surface water and groundwater resources by enabling additional filtration of nutrients and other pollutants to occur as runoff / drainage passes through sandy soils and plant cover within the buffer zones. Excluding recycled water irrigation from areas of remnant native vegetation will avoid impacts on native vegetation communities that may not be adapted to higher soil moisture and nutrient levels associated with areas irrigated with recycled water Timing Restrictions Although the Australian Guidelines for Water Recycling: Managing Health and Environmental Risks (Phase 1) (ANZECC, 2006) indicates that recycled water complying with the above minimum criteria is suitable for Municipal Use open spaces, sports grounds, golf courses, dust suppression, etc or unrestricted access and application without the need for any additional on-site preventive measures to reduce the risk associated with potentially harmful pathogens, a conservative approach to irrigation is recommended such that recycled water irrigation will generally be restricted to times when public access is least likely. This will generally occur during night time hours between about 9pm to 6am. Irrigation should commence as early as possible within this period to allow sufficient time for infiltration or drying to occur to further reduce potential exposure to the recycled water Signage Notices must be prominently displayed on all recycled water irrigation areas, warning the public that the area is irrigated with recycled water and not to use or drink the recycled water. Similar signage should also be placed around the perimeter of recycled water storage ponds to discourage access to these ponds for retrieval of golf balls etc. These notices must be maintained in a visible and legible condition and be in compliance with AS1319- Safety signs for the occupational environment Wet Weather Storage / Stormwater Harvesting Ponds Only recycled water complying with the minimum water quality criteria specified in Table 2 should be discharged into the wet weather storage ponds to reduce the potential for odour generation and excessive nutrient levels causing algal blooms. Regular turnover of water stored within wet weather storage and stormwater harvesting ponds through inflows and extraction for irrigation will significantly reduce the potential for cyano-bacterial and other algal blooms. However, additional mechanical aeration may be considered during detailed design stage to provide further mixing within these storages. The use of fertilisers within the immediate vicinity of stormwater harvesting ponds should be minimised to prevent runoff containing high levels of nutrients entering storage ponds. Regular visual and water quality monitoring of open storage ponds shall be undertaken to enable early identification of conditions that may support an algal bloom so that preventative action, such as destratification of the water column, can be taken. Planting of floating native aquatic plants within open storage ponds will also assist with uptake of nutrients reducing potential for algal blooms. Planting of vegetation, such as native sedges or reeds, around the perimeter of wet weather storage ponds is recommended to discourage public access to these facilities while also further assisting with the removal of nutrients that may cause algal blooms. N-B016 Page: 13
233 Preliminary Irrigation Management Plan Great Keppel Island Resort Revitalisation Plan Management of pests shall be undertaken as necessary in accordance with the requirements of relevant authorities to control any excessive wildlife that could potentially reduce water quality within open storages Stormwater Management Stormwater diversion systems will be installed to divert surface runoff around recycled water irrigation areas. This will prevent upstream surface runoff from coming into contact with potential contaminants (eg. nutrients) within irrigated areas, and will also ensure that soils within the irrigation area are not absorbing additional water not accounted for in the modelling. Diversion systems will also be used to prevent stormwater from draining into wet weather storage ponds containing recycled water for irrigation of the golf course so as to reduce the likelihood of recycled water storages overtopping. Stormwater runoff from golf course areas used for recycled water irrigation has the potential to collect residual nutrients and other contaminants from the surface of the irrigation area. As such, all surface runoff from the proposed golf course will be diverted to stormwater harvesting ponds for reuse for irrigation of the golf course. Golf course runoff will be directed to the stormwater harvesting ponds through a series of grassed swales and / or bio-retention basins to facilitate removal of gross pollutants (e.g. litter) sediment and nutrients prior to entering the stormwater harvesting ponds. Stormwater harvesting ponds will incorporate an overflow provided with appropriate scour protection and outletting to a grassed overland flow channel providing further treatment prior to ultimately discharging to Leeke s Creek. N-B016 Page: 14
234 Preliminary Irrigation Management Plan Great Keppel Island Resort Revitalisation Plan 4. MONITORING PROGRAM 4.1 GENERAL A monitoring program shall be developed for the recycled water irrigation scheme to ensure that the nominated operational procedures and environmental controls are effective in minimising the risks to public health and the surrounding environment typically associated with the reuse of recycled water for irrigation of public open spaces. The monitoring program shall include: Monitoring of the quality and quantity of recycled water discharged from the WWTP; Monitoring of soils within recycled water irrigation areas; Monitoring of groundwater within, up-gradient and down-gradient of the recycled water irrigation area; Monitoring of surface waters within, upstream and downstream of recycled water irrigation areas; and Monitoring of water quality within wet weather storage ponds containing recycled water and stormwater harvesting ponds collecting runoff from areas used for recycled water irrigation. Proposed monitoring frequencies and contaminants to be monitored are specified in the following sections. 4.2 MONITORING Recycled Water Quantity A flow meter shall be installed at the discharge point of the WWTP(s). The volume of recycled water discharged to wet weather storage ponds should be recorded daily Recycled Water Quality Sampling of recycled water discharged from the WWTP shall be undertaken from the overflow of the final effluent holding tanks and shall be conducted in accordance with the DERM s Water Quality Sampling Manual. The quality of recycled water discharged to wet weather storage ponds should be monitored at frequencies specified in Table 5. N-B016 Page 15
235 Preliminary Irrigation Management Plan Great Keppel Island Resort Revitalisation Plan TABLE 5: Proposed Recycled Water Quality Monitoring Frequency Quality Characteristic Monitoring Frequency Soil E. coli Weekly 5-day Biological Oxygen Demand Weekly Turbidity Suspended Solids Total Dissolved Solids ph Total Nitrogen Total Phosphorous Free Chlorine Residual 1 Continuous Weekly Weekly Weekly Monthly Monthly Continuous Note: 1. Only applies where chlorination is used for disinfection. Disinfection is not preferred where discharge to the ocean is likely to occur. Soil monitoring sites will be determined prior to commencing recycled water irrigation. The location of soil monitoring sites will include: A site within the recycled water irrigation area; and A reference site located within an area not irrigated using recycled water and consisting of the same soil type as occurs in the irrigation area. Baseline monitoring of soils will occur before recycled water irrigation commences and once for each sampling event during the lifetime of the irrigation scheme. A monitoring event will most likely be required once every 6 months after commencement. Depending on the outcomes of initial monitoring, after 2 years the Administering Authority may reduce the monitoring frequency to an annual occurrence. The soil quality characteristics that may be monitored include: ph Electrical conductivity Available phosphorus Available potassium Total nitrogen Total cations Cation exchange capacity Exchangeable sodium percentage Chloride Trace elements Heavy metals Organic carbon All sample analyses will be undertaken by a laboratory holding appropriate certification from the National Association Testing Authority (NATA) for the relevant analyses. N-B016 Page 16
236 Preliminary Irrigation Management Plan Great Keppel Island Resort Revitalisation Plan Compliance shall be determined with reference to the conditions of development approval and comparison of soil quality within areas irrigated and not irrigated with recycled water to detect any deterioration in soil quality that may be attributable to recycled water irrigation Groundwater Groundwater monitoring bores shall be installed at the following general locations: A site within the recycled water irrigation area; A reference site located within an area not irrigated using recycled water and hydraulically upgradient of the recycled water irrigation area; and A receptor site located within an area not irrigated using recycled water and hydraulically down-gradient of the recycled water irrigation area. Groundwater monitoring bores shall be constructed in accordance with the Agriculture and Resource Management Council of Australia and New Zealand manual Minimum Construction Requirements for Water Bores in Australia, Edition 2, Revised September Baseline monitoring of groundwater will occur before recycled irrigation commences and once for each sampling event during the lifetime of the irrigation scheme. A monitoring event will most likely be required once every 6 months after commencement. Depending on the outcomes of initial monitoring, after 2 years the Administering Authority may reduce the monitoring frequency to an annual occurrence. The groundwater quality characteristics that may be monitored include: ph Electrical conductivity Total nitrogen Ammonia Nitrite Nitrate Total phosphorus E.coli Biochemical Oxygen Demand For each monitoring event, the standing water level and groundwater bore depth shall also be recorded. All sampling and analysis of groundwater samples will be undertaken in accordance with the latest edition of DERM s Water Quality and Sampling Manual and AS 5667:1998 Water Quality Sampling Guidance on sampling of groundwaters. All sample analyses will be undertaken by a laboratory holding appropriate certification from the National Association Testing Authority (NATA) for the relevant analyses. Compliance shall be determined with reference to the conditions of development approval and relevant water quality objectives established for the receiving waters. N-B016 Page 17
237 Preliminary Irrigation Management Plan Great Keppel Island Resort Revitalisation Plan Surface Water Surface water quality monitoring sites shall be established at the following general locations: A site within Leeke s Creek located downstream of the recycled water irrigation area; and A site within Leeke s Creek located upstream of the recycled water irrigation area. Baseline monitoring of surface water will occur before recycled irrigation commences and once for each sampling event during the lifetime of the irrigation scheme. A monitoring event will most likely be required once every 3 months after commencement. Depending on the outcomes of initial monitoring, after 2 years the Administering Authority may reduce the monitoring frequency to once every 6 months. Surface water quality characteristics that may be monitored include: ph Electrical conductivity Total nitrogen Ammonia Nitrite Nitrate Total phosphorus E.coli Biochemical Oxygen Demand Chlorophyll a All sampling and analysis of surface water samples will be undertaken in accordance with the latest edition of DERM s Water Quality and Sampling Manual. All sample analyses will be undertaken by a laboratory holding appropriate certification from the National Association Testing Authority (NATA) for the relevant analyses. Compliance shall be determined with reference to the conditions of development approval and relevant water quality objectives established for the receiving waters. 4.3 INSPECTIONS In addition to monitoring requirements outlined the above, weekly inspections of all irrigation areas shall be conducted by the Grounds Maintenance Manager (or delegate) for evidence of: Excessive irrigation rates resulting in ponding across the irrigation area or runoff beyond the boundaries of the irrigation area; Inadequate treatment of recycled water resulting in decreased plant health or decreased soil condition; Damage to the recycled water irrigation distribution system; Recycled water levels within wet weather storage ponds approaching capacity; and N-B016 Page 18
238 Preliminary Irrigation Management Plan Great Keppel Island Resort Revitalisation Plan Damage to any stormwater diversion drains that may result in stormwater entering wet weather storage ponds. 4.4 REPORTING Records shall be kept by the Resort Manager and retained for at least 5 years for: All sampling and analysis results from recycled water discharges and flow records; All sampling and analysis results from monitoring of soils within the irrigation area; All sampling and analysis results from monitoring of groundwater within, up-gradient and down-gradient of the recycled water irrigation area; All sampling and analysis results from monitoring of surface waters within, upstream and downstream of recycled water irrigation areas; All environmental incident and complaints reporting; and All maintenance carried on components of the recycled water irrigation scheme, including the WWTP. N-B016 Page 19
239 Preliminary Irrigation Management Plan Great Keppel Island Resort Revitalisation Plan 5. ENVIRONMENTAL INCIDENTS 5.1 GENERAL All environmental incidents must be fully reported as quickly as possible to ensure that effective action is taken to prevent environmental harm, and to identify probable causes so that corrective action can be taken to prevent a recurrence or more serious event. This procedure details the requirements associated with immediate action, investigation, reporting, corrective action, follow-up actions and training for environmental incidents. 5.2 REQUIREMENTS Should an environmental incident occur, immediate action shall be taken to contain the effects of the incident and reduce the overall level of environmental impact associated with the incident. In the event of a major incident, the Resort Manager shall notify relevant statutory authorities (eg. DERM, GBRMPA) within 24 hours of the incident occurring. Information to be provided with the incident report must include the following: The name of the holder of the Registration Certificate; The location of the emergency or incident; The number of the Registration Certificate; The name and telephone of the designated contact person for the Registration Certificate; The time of the release; The time the holder of the Registration Certificate became aware of the release; The suspected cause of the release; An initial assessment of the environmental harm and or environmental nuisance caused, threatened, or suspected to be caused by the release; and Actions taken to prevent any further release and mitigate any environmental harm and / or environmental nuisance caused by the release. The Resort Manager will also be responsible for notifying emergency response services (e.g. fire services) as soon as practicable after becoming aware of any emergency or incident resulting in the release of contaminants not in accordance with conditions of the approval. An incident form is to be completed by the Resort Manager for all incidents. Corrective actions should be initiated immediately and will be determined by the Resort Manager in consultation with the WWTP Operations Manager, Grounds Maintenance Manager and relevant authorities. N-B016 Page 20
240 Preliminary Irrigation Management Plan Great Keppel Island Resort Revitalisation Plan 6. ENVIRONMENTAL COMPLAINTS 6.1 GENERAL As part of sound environmental practice, it is important to maintain relationships with the community and minimise environmental impacts associated with site operations. In this regard, it is essential that any written or verbal complaints made by members of the public or organisations are dealt with immediately, particularly those that relate to issues which have potential to cause environmental harm. All complaints must be documented and measures taken to investigate and address the offending matter as quickly as possible. This procedure details the requirements associated with the investigation, reporting, corrective action, and follow-up actions associated with public complaints. 6.2 REQUIREMENTS An Environmental Complaints Register shall be established and maintained for the recycled water irrigation scheme by the Resort Manager. All public complaints received shall be addressed in the following manner: All complaints shall be registered immediately with the following details: o Time, date and nature of complaint; o Type of communication (telephone, letter, personal etc); o Name, contact address and contact telephone number of complainant (Note: if the complainant does not wish to be identified then Not Identified to be recorded); o Response and investigation undertaken as a result of the complaint; o Name of person responsible for investigating complaint; and o Action taken as a result of the complaint investigation and signature of responsible person. The Resort Manager shall initiate an investigation to determine the nature and cause of the complaint; The Resort Manager in consultation with the WWTP Operations Manager and Grounds Maintenance Manager shall initiate action to correct any procedure, work practice or condition, which resulted in the complaint being made. Any complaint that has a potential for significant adverse effect on the environment shall be dealt with immediately; The Resort Manager shall report back to the complainant within 2 business days of the complaint or the initial findings of the investigations, the action to be taken and the expected completion date; The Resort Manager shall advise the complainant when all investigations and corrective actions are complete, and update the Environmental Complaint Register; and Records of all complaints received shall be kept for a minimum of five (5) years. N-B016 Page 21
241 Preliminary Irrigation Management Plan Great Keppel Island Resort Revitalisation Plan 7. STAFF TRAINING & AWARENESS The IMP will only be successful if those responsible for operation of the recycled water irrigation scheme are aware of the potential impacts, requirements and mitigation procedures necessary to minimise environmental impact. The Resort Manager shall be responsible for ensuring that initial and ongoing training is provided to ensure all personnel involved in the operation and maintenance of the recycled water irrigation scheme are aware of their environmental obligations, in particular the following: Awareness of environmental issues relevant to the site and recycled water irrigation scheme; Obligations under the Environmental Protection Act 1994 and associated legislation; Specific conditions of development approval relating to the site; and Incident and complaint reporting procedures detailed in this IMP. Records shall be maintained of all training undertaken by personnel involved in operation of the recycled water irrigation scheme. N-B016 Page 22
242 Water Cycle Management Report Great Keppel Island Resort Revitalisation Plan APPENDIX I MEDLI Summary Output Data N-B016 Page 169
243 Baseline Model Output.txt ***************************************** SUMMARY OUTPUT MEDLI Version 1.30 Data Set: GKI Scenario Baseline Run Date: 25/08/11 Time:08:22:34.42 ***************************************** GENERAL INFORMATION ******************* Title: GKI Resort Revitalisation Plan Subject: Scenario Baseline Client: GKI Resorts Pty Ltd User: Mark Farrey Time: Thu Aug 25 08:21: Comments: Dry Run - 31ha RUN PERIOD ********** Starting Date 1/ 1/1957 Ending Date 31/12/2009 Run Length 53 years 0 days CLIMATE INFORMATION ******************* Enterprise site: Great Keppel Island Weather station: keppel_23.20s_150.95e (Interpola deg S deg E ANNUAL TOTALS 10 Percentile 50 percentile 90 Percentile Rainfall mm/year Pan Evap mm/year MONTHLY Jan Feb Mar Apr May Jun Jul Aug Sep Oct Nov Dec Year Rainfall (mm) Pan Evap (mm) Ave Max Temp DegC Ave Min Temp DegC Rad (MJ/m2/day) MONTHLY IRRIGATION ****************** Irrigation (mm) SOIL PROPERTIES *************** Soil type: Great Keppel Island Sand SOIL WATER PROPERTIES Layer 1 Layer 2 Layer 3 Layer 4 Bulk Density (g/cm3) Porosity (mm/layer) Saturated Water Content (mm/layer) Drained Upper Limit (mm/layer) Lower Storage Limit (mm/layer) Air Dry Moisture Content (mm/layer) 4.0 Layer Thickness (mm) Profile Max Rootzone Total Saturated Water Content (mm) Total Drained Upper Limit (mm) Total Lower Storage Limit (mm) Total Air Dry Moisture Content (mm) Total Depth (mm) Maximum Plant Available Water Capacity 55.5 Saturated Hydraulic Conductivity At Surface (mm/hr) Page 1
244 Baseline Model Output.txt Limiting (mm/hr) 20.0 RUNOFF Runoff curve No II 70.0 SOIL EVAPORATION CONA (mm/day^0.5) 4.5 URITCH (mm) 10.0 AVERAGE WASTE STREAM ******************** Other waste stream (All values relate to influent after any screening and recycling, if applicable). Inflow Volume (ML/year) Nitrogen (tonne/year) 3.2 Phosphorus (tonne/year) 1.1 Salinity (tonne/year) Nitrogen Concentration (mg/l) 20.0 Phosphorus Concentration (mg/l) 7.0 Salinity (mg/l) Salinity (ds/m) 4.3 WASTE STREAM DETAILS (for last inflow event): Nitrogen Concentration (mg/l) 20.0 Phosphorus Concentration (mg/l) 7.0 TDS Concentration (mg/l) Salinity (ds/m) 1.6 IRRIGATION WATER **************** Irrigation triggered every 1 days Irrigating upto upper storage limit + 0 mm AREA Total Irrigation Area (ha) 31.0 VOLUMES Total Irrigation (ML/year) 0.0 Minimum Volume Irrigated by Pump (ML/ha/day) 0.0 Maximum Volume Irrigated by Pump (ML/ha/day) 0.0 Maximum Vol. Available For Shandying (ML/yr) 0.0 IRRIGATION CONCENTRATIONS Average salinity of Irrigation (ds/m) 0.0 Average salinity of Irrigation (mg/l) 0.0 Average Nitrogen Conc of Irrigation Before ammonia loss (mg/l) 0.0 After ammonia loss (mg/l) 0.0 Average Phosphorus Conc of Irrigation (mg/l) 0.0 FRESH WATER USAGE ***************** Irrigation (shandying) water (ML/yr) Avg volume of fresh water used (ML/yr) Annual allocation (ML/yr) N/A POND INFORMATION Page 2
245 **************** POND GEOMETRY Baseline Model Output.txt Pond 1 Final pond volume (ML) 37.0 Final liquid volume (ML) 37.0 Final sludge volume (ML) 0.0 Average pond volume (ML) 36.9 Average active volume (ML) 36.9 Maximum pond volume (ML) 37.0 Minimum allowable pond volume (ML) 0.0 Average pond depth (m) 3.0 Pond depth at outlet (m) 3.0 Maximum water surface area (m2 x1000) 13.0 Pond catchment area (m2 x1000) 13.5 Pond footprint length (m) Pond footprint width (m) POND WATER BALANCE Inflow of Effluent to pond system (ML/yr) Recycle Volume from pond system (ML/yr) 0.0 Rain water added to pond system (ML/yr) 14.1 Evaporation loss from pond system (ML/yr) 16.8 Seepage loss from pond system (ML/yr) 0.5 Irrigation from last pond (ML/yr) 0.0 Volume of overtopping (ML/yr) Sludge accumulated (ML/yr) 0.0 Sludge accumulated (t DM/yr) 0.0 Sludge removed (ML/yr) 0.0 No of desludging events every 10 years 0.0 Increase in pond water volume (ML/yr) 0.7 OVERTOPPING EVENTS Volume of overtopping (ML/yr) No. of days pond overtops per 10 years Average Length of overtopping events (days) % Reuse No. of overtopping events every 10 years > 0 ML 0.19 > ML* > ML > ML > ML > 10 ML > 20 ML > 50 ML * Volume equivalent to 1 mm depth of water No. periods/year without irrigable effluent 0.0 Average Length of such periods (days) 0.0 POND NITROGEN BALANCE Nitrogen Added by Effluent (tonne/yr) 3.2 Irrig. from pond (ML/yr) 0.0 Nitrogen removed by Irrigation (tonne/yr) 0.0 Nitrogen removed by Volatilisation(tonne/yr) 0.9 Nitrogen removed by Seepage (tonne/yr) 0.0 Nitrogen accumulated in Sludge (tonne/yr) 0.0 Nitrogen lost by Overtopping (tonne/yr) 2.2 Nitrogen involved in Recycling (tonne/yr) 0.0 Increase in pond Nitrogen (tonne/yr) 0.0 POND PHOSPHORUS BALANCE Phosphorus Added by Effluent (tonne/yr) 1.1 Irrig. from pond (ML/yr) 0.0 Phosphorus removed by Irrigation (tonne/yr) 0.0 Phosphorus removed by Seepage (tonne/yr) 0.0 Phosphorus accumulated in Sludge (tonne/yr) 0.0 Phosphorus lost by Overtopping (tonne/yr) 1.1 Phosphorus involved in Recycling (tonne/yr) 0.0 Increase in pond Phosphorus (tonne/yr) 0.0 POND SALINITY BALANCE Page 3
246 Baseline Model Output.txt Salinity Added by Effluent (tonne/yr) Salinity removed by Irrigation (tonne/yr) 0.0 Salinity removed by Seepage (tonne/yr) 1.3 Salinity lost by Overtopping (tonne/yr) Salinity involved in Recycling (tonne/yr) 0.0 Increase in pond Salinity (tonne/yr) 1.7 POND CONCENTRATIONS Pond 1 Average Nitrogen Conc of Pond Liquid (mg/l) 14.0 Average Phosphorus Conc of Pond Liquid(mg/L) 7.1 Average TDS Conc of Pond Liquid (mg/l) Average Salinity of Pond Liquid (ds/m) 4.4 Average Potassium Conc of Pond Liquid (mg/l) 0.0 (On final day of simulation) Nitrogen Conc of Pond Liquid (mg/l) 15.7 Phosphorus Conc of Pond Liquid (mg/l) 7.6 TDS Conc of Pond Liquid (mg/l) EC of Pond Liquid (ds/m) 3.7 Potassium Conc of Pond Liquid (mg/l) 0.0 REMOVED SLUDGE - NUTRIENT & SALT CONCENTRATIONS Nitrogen in removed Sludge (db) (kg/tonne) 0.0 Phosphorus in removed Sludge (db) (kg/tonne) 0.0 Salt in removed Sludge (db) (kg/tonne) 0.0 Potassium in removed Sludge (db) (kg/tonne) 0.0 REMOVED SLUDGE - NUTRIENT & SALT MASSES Nitrogen in removed Sludge (tonne/yr) 0.0 Phosphorus in removed Sludge (tonne/yr) 0.0 Salt in removed Sludge (mass bal.)(tonne/yr) 0.0 Salt in removed Sludge (tonne/yr) 0.0 Potm. in removed Sludge (mass bal.)(tonne/yr 0.0 Potassium in removed Sludge (tonne/yr) 0.0 LAND DISPOSAL AREA ****************** WATER BALANCE (Initial soil water assumed to be at field capacity) (Irrigated up to % of field capacity) Rainfall (mm/year) Irrigation Area (ha) 31.0 Irrigation (mm/year) 0.0 Soil Evaporation (mm/year) Transpiration (mm/year) Runoff (mm/year) 19.8 Drainage (mm/year) Change in soil moisture (mm/year) 0.3 ANNUAL TOTALS Year Rain Irrig Sevap Trans Runoff Drain Change (mm) (mm) (mm) (mm) (mm) (mm) (mm) Page 4
247 Baseline Model Output.txt NUTRIENT BALANCE NITROGEN Total N irrigated from ponds (kg/ha/year) 0.0 % of Total as ammonium 80.0 Nitrogn lost by ammonia volat.(kg/ha/year) 0.0 Deep Drainage (mm/year) Nitrogen added in irrigation (kg/ha/year) 0.0 Nitrogen added in seed (kg/ha/year) 0.8 Nitrogen removed by crop (kg/ha/year) 31.7 Denitrification (kg/ha/year) 0.3 Leached NO3-N (kg/ha/year) 6.9 Change in soil organic-n (kg/ha/year) Change in soil solution NH4-N (kg/ha/year) 0.0 Change in soil solution NO3-N (kg/ha/year) -2.9 Change in adsorbed NH4-N (kg/ha/year) 0.0 Initial soil organic-n (kg/ha) Final soil organic-n (kg/ha) 89.3 Initial soil inorganic-n (kg/ha) Final soil inorganic-n (kg/ha) 2.8 Average N03-N conc in the root zone (mg/l) 1.6 Average N03-N conc below root zone (mg/l) 2.2 Average N03-N conc of deep drainage (mg/l) 1.6 PHOSPHORUS Phosphorus added in irrigatn (kg/ha/year) 0.0 % of Total as phosphate Phosphorus added in seed (kg/ha/year) 0.1 Phosphorus removed by crop (kg/ha/year) 0.1 Leached PO4-P (kg/ha/year) 0.0 Change in dissolved PO4-P (kg/ha/year) 0.0 Change in adsorbed PO4-P (kg/ha/year) 0.0 Average P04-P conc in the root zone (mg/l) 0.0 Average P04-P conc below root zone (mg/l) 0.0 Page 5
248 SOIL P STORAGE LIFE Baseline Model Output.txt Year YearNo. Tot P stored P leached in year kg/ha kg/ha PLANT Plant species: Coastal couch grass (Cynodon dac PLANT WATER USE Irrigation (mm/year) 0. Totl Irrigation Area(ha) 31.0 Pan coefficient (%) 1.0 Maximum crop coefficient (%) 0.8 Average Plant Cover (%) 34. Average Plant Total Cover (%) 47. Average Plant Rootdepth (mm) 334. Average Plant Available Water Capacity (mm) 45. Page 6
249 Baseline Model Output.txt Average Plant Available Water (mm) 26. Yield produced per unit transp. (kg/ha/mm) 9. PLANT NUTRIENT UPTAKE Dry Matter Yield (Shoots) (kg/ha/yr) Net nitrogen removed by plant (kg/ha/yr) 31. Shoot Concn (%DM) 1.02 Net phosphorus removed by plant (kg/ha/yr) 0. Shoot Concn (%DM) AVERAGE MONTHLY GROWTH STRESS (0=no stress, 1=full stress) Month Yield Nitr Temp Water Water kg/ha Defic Logging >>> NO-PLANT EVENTS <<< %Days due to temperature stress 0.9 %Days due to water stress 15.6 %Days due to nitrogen stress 2.3 No. of forced harvests per year 1.3 No. of normal harvests per year 0.7 SALINITY Salt tolerance - plant species: tolerant Average EC of Irrigation Water (ds/m) 0.0 Irrigation (mm/year) 0.0 Average EC of Rainwater (ds/m x10) 0.3 Rainfall (mm/year) >>>No salinity calculations<<< No. of years chosen for running averages 5 GROUNDWATER ************ Average Groundwater Recharge (m3/day) Average Nitrate-N Conc of Recharge (mg/l) 1.6 Thickness of the Aquifer (m) 10.0 Distance (m) from Irrigation Area to where Nitrate-N Conc in Groundwater is Calculated Concentration of NITRATE-N in Groundwater (mg/l) Year Depth Below Water Table Surface 0.0 m 5.0 m 9.0 m Page 7
250 Baseline Model Output.txt Last ACKNOWLEDGMENTS *************** This run brought to you courtesy of: MEDLIEXE.EXE : bytes Fri Mar 12 10:26: CRCPROJ.EXE : bytes Wed Apr 28 15:18: GRAPHS.EXE: No details found GRAPHS.EXE : 2617 bytes Wed Apr 28 15:18: OTHER INDUSTRY INPUT PARAMETERS - DATA SUMMARY Nature of Industry: STP wastestream >>> Dryland run! <<< 1 file(s) copied UNCONDITIONAL FINISH Page 8
251 Model 1a.txt ***************************************** SUMMARY OUTPUT MEDLI Version 1.30 Data Set: GKI Scenario 1a-95% 2mm 31ha Run Date: 25/08/11 Time:08:54:45.77 ***************************************** GENERAL INFORMATION ******************* Title: GKI Resort Revitalisation Plan Subject: Scenario 1a - 2mm Irrigation Client: GKI Resorts Pty Ltd User: Mark Farrey Time: Thu Aug 25 08:50: Comments: 2mm/day. Irrigation Area = 31ha. Wet Weather Storage = 0.6ML (95% reuse). N = 20mg/L, P = 7mg/L. RUN PERIOD ********** Starting Date 1/ 1/1957 Ending Date 31/12/2009 Run Length 53 years 0 days CLIMATE INFORMATION ******************* Enterprise site: Great Keppel Island Weather station: keppel_23.20s_150.95e (Interpola deg S deg E ANNUAL TOTALS 10 Percentile 50 percentile 90 Percentile Rainfall mm/year Pan Evap mm/year MONTHLY Jan Feb Mar Apr May Jun Jul Aug Sep Oct Nov Dec Year Rainfall (mm) Pan Evap (mm) Ave Max Temp DegC Ave Min Temp DegC Rad (MJ/m2/day) MONTHLY IRRIGATION ****************** Irrigation (mm) SOIL PROPERTIES *************** Soil type: Great Keppel Island Sand SOIL WATER PROPERTIES Layer 1 Layer 2 Layer 3 Layer 4 Bulk Density (g/cm3) Porosity (mm/layer) Saturated Water Content (mm/layer) Drained Upper Limit (mm/layer) Lower Storage Limit (mm/layer) Air Dry Moisture Content (mm/layer) 4.0 Layer Thickness (mm) Profile Max Rootzone Total Saturated Water Content (mm) Total Drained Upper Limit (mm) Total Lower Storage Limit (mm) Total Air Dry Moisture Content (mm) Total Depth (mm) Maximum Plant Available Water Capacity 55.5 Saturated Hydraulic Conductivity Page 1
252 Model 1a.txt At Surface (mm/hr) Limiting (mm/hr) 20.0 RUNOFF Runoff curve No II 70.0 SOIL EVAPORATION CONA (mm/day^0.5) 4.5 URITCH (mm) 10.0 AVERAGE WASTE STREAM ******************** Other waste stream (All values relate to influent after any screening and recycling, if applicable). Inflow Volume (ML/year) Nitrogen (tonne/year) 3.2 Phosphorus (tonne/year) 1.1 Salinity (tonne/year) Nitrogen Concentration (mg/l) 20.0 Phosphorus Concentration (mg/l) 7.0 Salinity (mg/l) Salinity (ds/m) 4.3 WASTE STREAM DETAILS (for last inflow event): Nitrogen Concentration (mg/l) 20.0 Phosphorus Concentration (mg/l) 7.0 TDS Concentration (mg/l) Salinity (ds/m) 1.6 IRRIGATION WATER **************** Irrigation triggered every 1 days Irrigating a fixed amount of 2 mm AREA Total Irrigation Area (ha) 31.0 VOLUMES Total Irrigation (ML/year) Minimum Volume Irrigated by Pump (ML/ha/day) 0.0 Maximum Volume must be full irrig. requiremt Maximum Vol. Available For Shandying (ML/yr) 0.0 IRRIGATION CONCENTRATIONS Average salinity of Irrigation (ds/m) 4.3 Average salinity of Irrigation (mg/l) Average Nitrogen Conc of Irrigation Before ammonia loss (mg/l) 20.0 After ammonia loss (mg/l) 16.8 Average Phosphorus Conc of Irrigation (mg/l) 7.0 FRESH WATER USAGE ***************** Irrigation (shandying) water (ML/yr) Avg volume of fresh water used (ML/yr) Annual allocation (ML/yr) N/A Page 2
253 POND INFORMATION **************** POND GEOMETRY Model 1a.txt Pond 1 Final pond volume (ML) 0.0 Final liquid volume (ML) 0.0 Final sludge volume (ML) 0.0 Average pond volume (ML) 0.0 Average active volume (ML) 0.0 Maximum pond volume (ML) 0.6 Minimum allowable pond volume (ML) 0.0 Average pond depth (m) 2.3 Pond depth at outlet (m) 3.0 Maximum water surface area (m2 x1000) 0.3 Pond catchment area (m2 x1000) 0.4 Pond footprint length (m) 19.0 Pond footprint width (m) 19.0 POND WATER BALANCE Inflow of Effluent to pond system (ML/yr) Recycle Volume from pond system (ML/yr) 0.0 Rain water added to pond system (ML/yr) 0.4 Evaporation loss from pond system (ML/yr) 0.3 Seepage loss from pond system (ML/yr) 0.0 Irrigation from last pond (ML/yr) Volume of overtopping (ML/yr) 7.1 Sludge accumulated (ML/yr) 0.0 Sludge accumulated (t DM/yr) 0.0 Sludge removed (ML/yr) 0.0 No of desludging events every 10 years 0.0 Increase in pond water volume (ML/yr) 0.0 OVERTOPPING EVENTS Volume of overtopping (ML/yr) 7.15 No. of days pond overtops per 10 years Average Length of overtopping events (days) % Reuse No. of overtopping events every 10 years > 0 ML > 0 ML* 2 > ML 1 > ML 1 > ML 9.81 > 10 ML > 20 ML > 50 ML * Volume equivalent to 1 mm depth of water No. periods/year without irrigable effluent 0.0 Average Length of such periods (days) 0.0 POND NITROGEN BALANCE Nitrogen Added by Effluent (tonne/yr) 3.2 Irrig. from pond (ML/yr) Nitrogen removed by Irrigation (tonne/yr) 3.0 Nitrogen removed by Volatilisation(tonne/yr) 0.0 Nitrogen removed by Seepage (tonne/yr) 0.0 Nitrogen accumulated in Sludge (tonne/yr) 0.0 Nitrogen lost by Overtopping (tonne/yr) 0.1 Nitrogen involved in Recycling (tonne/yr) 0.0 Increase in pond Nitrogen (tonne/yr) 0.0 POND PHOSPHORUS BALANCE Phosphorus Added by Effluent (tonne/yr) 1.1 Irrig. from pond (ML/yr) Phosphorus removed by Irrigation (tonne/yr) 1.1 Phosphorus removed by Seepage (tonne/yr) 0.0 Phosphorus accumulated in Sludge (tonne/yr) 0.0 Phosphorus lost by Overtopping (tonne/yr) 0.1 Phosphorus involved in Recycling (tonne/yr) 0.0 Increase in pond Phosphorus (tonne/yr) 0.0 POND SALINITY BALANCE Page 3
254 Model 1a.txt Salinity Added by Effluent (tonne/yr) Salinity removed by Irrigation (tonne/yr) Salinity removed by Seepage (tonne/yr) 0.0 Salinity lost by Overtopping (tonne/yr) 17.7 Salinity involved in Recycling (tonne/yr) 0.0 Increase in pond Salinity (tonne/yr) 0.0 POND CONCENTRATIONS Pond 1 Average Nitrogen Conc of Pond Liquid (mg/l) 4.0 Average Phosphorus Conc of Pond Liquid(mg/L) 7.0 Average TDS Conc of Pond Liquid (mg/l) Average Salinity of Pond Liquid (ds/m) 4.4 Average Potassium Conc of Pond Liquid (mg/l) 0.0 (On final day of simulation) Nitrogen Conc of Pond Liquid (mg/l) 4.0 Phosphorus Conc of Pond Liquid (mg/l) 7.0 TDS Conc of Pond Liquid (mg/l) EC of Pond Liquid (ds/m) 1.6 Potassium Conc of Pond Liquid (mg/l) 0.0 REMOVED SLUDGE - NUTRIENT & SALT CONCENTRATIONS Nitrogen in removed Sludge (db) (kg/tonne) 0.0 Phosphorus in removed Sludge (db) (kg/tonne) 0.0 Salt in removed Sludge (db) (kg/tonne) 0.0 Potassium in removed Sludge (db) (kg/tonne) 0.0 REMOVED SLUDGE - NUTRIENT & SALT MASSES Nitrogen in removed Sludge (tonne/yr) 0.0 Phosphorus in removed Sludge (tonne/yr) 0.0 Salt in removed Sludge (mass bal.)(tonne/yr) 0.0 Salt in removed Sludge (tonne/yr) 0.0 Potm. in removed Sludge (mass bal.)(tonne/yr 0.0 Potassium in removed Sludge (tonne/yr) 0.0 LAND DISPOSAL AREA ****************** WATER BALANCE (Initial soil water assumed to be at field capacity) (Irrigated up to 3.53% of field capacity) Rainfall (mm/year) Irrigation Area (ha) 31.0 Irrigation (mm/year) Soil Evaporation (mm/year) 53.7 Transpiration (mm/year) Runoff (mm/year) 6.1 Drainage (mm/year) Change in soil moisture (mm/year) -0.4 ANNUAL TOTALS Year Rain Irrig Sevap Trans Runoff Drain Change (mm) (mm) (mm) (mm) (mm) (mm) (mm) Page 4
255 Model 1a.txt NUTRIENT BALANCE NITROGEN Total N irrigated from ponds (kg/ha/year) 97.1 % of Total as ammonium 80.0 Nitrogn lost by ammonia volat.(kg/ha/year) 15.5 Deep Drainage (mm/year) Nitrogen added in irrigation (kg/ha/year) 81.6 Nitrogen added in seed (kg/ha/year) 0.1 Nitrogen removed by crop (kg/ha/year) Denitrification (kg/ha/year) 0.1 Leached NO3-N (kg/ha/year) 2.8 Change in soil organic-n (kg/ha/year) Change in soil solution NH4-N (kg/ha/year) 0.0 Change in soil solution NO3-N (kg/ha/year) -2.9 Change in adsorbed NH4-N (kg/ha/year) 0.0 Initial soil organic-n (kg/ha) Final soil organic-n (kg/ha) Initial soil inorganic-n (kg/ha) Final soil inorganic-n (kg/ha) 0.0 Average N03-N conc in the root zone (mg/l) 0.4 Average N03-N conc below root zone (mg/l) 1.8 Average N03-N conc of deep drainage (mg/l) 0.6 PHOSPHORUS Phosphorus added in irrigatn (kg/ha/year) 34.0 % of Total as phosphate Phosphorus added in seed (kg/ha/year) 0.0 Phosphorus removed by crop (kg/ha/year) 26.1 Leached PO4-P (kg/ha/year) 0.1 Change in dissolved PO4-P (kg/ha/year) 0.0 Change in adsorbed PO4-P (kg/ha/year) 7.9 Average P04-P conc in the root zone (mg/l) 0.2 Average P04-P conc below root zone (mg/l) 0.0 Page 5
256 Model 1a.txt SOIL P STORAGE LIFE Year YearNo. Tot P stored P leached in year kg/ha kg/ha PLANT Plant species: Coastal couch grass (Cynodon dac PLANT WATER USE Irrigation (mm/year) 486. Totl Irrigation Area(ha) 31.0 Pan coefficient (%) 1.0 Maximum crop coefficient (%) 0.8 Average Plant Cover (%) 81. Average Plant Total Cover (%) 94. Average Plant Rootdepth (mm) 754. Page 6
257 Model 1a.txt Average Plant Available Water Capacity (mm) 54. Average Plant Available Water (mm) 35. Yield produced per unit transp. (kg/ha/mm) 9. PLANT NUTRIENT UPTAKE Dry Matter Yield (Shoots) (kg/ha/yr) Net nitrogen removed by plant (kg/ha/yr) 117. Shoot Concn (%DM) 1.24 Net phosphorus removed by plant (kg/ha/yr) 26. Shoot Concn (%DM) 0.28 AVERAGE MONTHLY GROWTH STRESS (0=no stress, 1=full stress) Month Yield Nitr Temp Water Water kg/ha Defic Logging >>> NO-PLANT EVENTS <<< %Days due to temperature stress 0.2 %Days due to water stress 0.4 %Days due to nitrogen stress 0.0 No. of forced harvests per year 0.2 No. of normal harvests per year 6.4 SALINITY Salt tolerance - plant species: tolerant Average EC of Irrigation Water (ds/m) 4.3 Irrigation (mm/year) Average EC of Rainwater (ds/m x10) 0.3 Rainfall (mm/year) Average EC of Infiltrated water (ds/m) 1.4 Av. water-upt-weightd rootzone EC(dS/m s.e.) 1.4 EC soil soln (FC) at base of rootzone (ds/m) 5.8 Deep Drainage (mm/year) Reduction in Crop yield due to Salinity (%) 0.0 Percentage of yrs that crop yld falls below 90% of potential because of soil salinity 0.0 Period ECrootzone ECbase Rel Yield sat ext in situ (ds/m) (ds/m) (%) Page 7
258 Model 1a.txt GROUNDWATER ************ Average Groundwater Recharge (m3/day) Average Nitrate-N Conc of Recharge (mg/l) 0.6 Thickness of the Aquifer (m) 10.0 Distance (m) from Irrigation Area to where Nitrate-N Conc in Groundwater is Calculated Concentration of NITRATE-N in Groundwater (mg/l) Year Depth Below Water Table Surface 0.0 m 5.0 m 9.0 m Last ACKNOWLEDGMENTS *************** This run brought to you courtesy of: MEDLIEXE.EXE : bytes Fri Mar 12 10:26: CRCPROJ.EXE : bytes Wed Apr 28 15:18: GRAPHS.EXE: No details found GRAPHS.EXE : 2617 bytes Wed Apr 28 15:18: OTHER INDUSTRY INPUT PARAMETERS - DATA SUMMARY Nature of Industry: STP wastestream Page 8
259 Model 1a.txt 1 file(s) copied UNCONDITIONAL FINISH Page 9
260 Model 1b.txt ***************************************** SUMMARY OUTPUT MEDLI Version 1.30 Data Set: GKI Scenario 1b-100% 2mm 31ha Run Date: 25/08/11 Time:09:05:09.94 ***************************************** GENERAL INFORMATION ******************* Title: GKI Resort Revitalisation Plan Subject: Scenario 1b - 2mm Irrigation Client: GKI Resorts Pty Ltd User: Mark Farrey Time: Thu Aug 25 08:57: Comments: 2mm/day. Irrigation Area = 31ha. Wet Weather Storage = 9ML (100% reuse). N = 20mg/L, P = 7mg/L. RUN PERIOD ********** Starting Date 1/ 1/1957 Ending Date 31/12/2009 Run Length 53 years 0 days CLIMATE INFORMATION ******************* Enterprise site: Great Keppel Island Weather station: keppel_23.20s_150.95e (Interpola deg S deg E ANNUAL TOTALS 10 Percentile 50 percentile 90 Percentile Rainfall mm/year Pan Evap mm/year MONTHLY Jan Feb Mar Apr May Jun Jul Aug Sep Oct Nov Dec Year Rainfall (mm) Pan Evap (mm) Ave Max Temp DegC Ave Min Temp DegC Rad (MJ/m2/day) MONTHLY IRRIGATION ****************** Irrigation (mm) SOIL PROPERTIES *************** Soil type: Great Keppel Island Sand SOIL WATER PROPERTIES Layer 1 Layer 2 Layer 3 Layer 4 Bulk Density (g/cm3) Porosity (mm/layer) Saturated Water Content (mm/layer) Drained Upper Limit (mm/layer) Lower Storage Limit (mm/layer) Air Dry Moisture Content (mm/layer) 4.0 Layer Thickness (mm) Profile Max Rootzone Total Saturated Water Content (mm) Total Drained Upper Limit (mm) Total Lower Storage Limit (mm) Total Air Dry Moisture Content (mm) Total Depth (mm) Maximum Plant Available Water Capacity 55.5 Saturated Hydraulic Conductivity Page 1
261 Model 1b.txt At Surface (mm/hr) Limiting (mm/hr) 20.0 RUNOFF Runoff curve No II 70.0 SOIL EVAPORATION CONA (mm/day^0.5) 4.5 URITCH (mm) 10.0 AVERAGE WASTE STREAM ******************** Other waste stream (All values relate to influent after any screening and recycling, if applicable). Inflow Volume (ML/year) Nitrogen (tonne/year) 3.2 Phosphorus (tonne/year) 1.1 Salinity (tonne/year) Nitrogen Concentration (mg/l) 20.0 Phosphorus Concentration (mg/l) 7.0 Salinity (mg/l) Salinity (ds/m) 4.3 WASTE STREAM DETAILS (for last inflow event): Nitrogen Concentration (mg/l) 20.0 Phosphorus Concentration (mg/l) 7.0 TDS Concentration (mg/l) Salinity (ds/m) 1.6 IRRIGATION WATER **************** Irrigation triggered every 1 days Irrigating a fixed amount of 2 mm AREA Total Irrigation Area (ha) 31.0 VOLUMES Total Irrigation (ML/year) Minimum Volume Irrigated by Pump (ML/ha/day) 0.0 Maximum Volume must be full irrig. requiremt Maximum Vol. Available For Shandying (ML/yr) 0.0 IRRIGATION CONCENTRATIONS Average salinity of Irrigation (ds/m) 4.3 Average salinity of Irrigation (mg/l) Average Nitrogen Conc of Irrigation Before ammonia loss (mg/l) 19.6 After ammonia loss (mg/l) 16.4 Average Phosphorus Conc of Irrigation (mg/l) 7.0 FRESH WATER USAGE ***************** Irrigation (shandying) water (ML/yr) Avg volume of fresh water used (ML/yr) Annual allocation (ML/yr) N/A Page 2
262 POND INFORMATION **************** POND GEOMETRY Model 1b.txt Pond 1 Final pond volume (ML) 1.1 Final liquid volume (ML) 1.1 Final sludge volume (ML) 0.0 Average pond volume (ML) 0.5 Average active volume (ML) 0.5 Maximum pond volume (ML) 9.0 Minimum allowable pond volume (ML) 0.0 Average pond depth (m) 0.3 Pond depth at outlet (m) 3.0 Maximum water surface area (m2 x1000) 3.3 Pond catchment area (m2 x1000) 3.6 Pond footprint length (m) 59.7 Pond footprint width (m) 59.7 POND WATER BALANCE Inflow of Effluent to pond system (ML/yr) Recycle Volume from pond system (ML/yr) 0.0 Rain water added to pond system (ML/yr) 3.7 Evaporation loss from pond system (ML/yr) 3.6 Seepage loss from pond system (ML/yr) 0.1 Irrigation from last pond (ML/yr) Volume of overtopping (ML/yr) 0.0 Sludge accumulated (ML/yr) 0.0 Sludge accumulated (t DM/yr) 0.0 Sludge removed (ML/yr) 0.0 No of desludging events every 10 years 0.0 Increase in pond water volume (ML/yr) 0.0 OVERTOPPING EVENTS Volume of overtopping (ML/year) Average Length of overtopping events (days) % Reuse No. of overtopping events per 10 years No. periods/year without irrigable effluent 0.0 Average Length of such periods (days) 0.0 POND NITROGEN BALANCE Nitrogen Added by Effluent (tonne/yr) 3.2 Irrig. from pond (ML/yr) Nitrogen removed by Irrigation (tonne/yr) 3.1 Nitrogen removed by Volatilisation(tonne/yr) 0.1 Nitrogen removed by Seepage (tonne/yr) 0.0 Nitrogen accumulated in Sludge (tonne/yr) 0.0 Nitrogen lost by Overtopping (tonne/yr) 0.0 Nitrogen involved in Recycling (tonne/yr) 0.0 Increase in pond Nitrogen (tonne/yr) 0.0 POND PHOSPHORUS BALANCE Phosphorus Added by Effluent (tonne/yr) 1.1 Irrig. from pond (ML/yr) Phosphorus removed by Irrigation (tonne/yr) 1.1 Phosphorus removed by Seepage (tonne/yr) 0.0 Phosphorus accumulated in Sludge (tonne/yr) 0.0 Phosphorus lost by Overtopping (tonne/yr) 0.0 Phosphorus involved in Recycling (tonne/yr) 0.0 Increase in pond Phosphorus (tonne/yr) 0.0 POND SALINITY BALANCE Salinity Added by Effluent (tonne/yr) Salinity removed by Irrigation (tonne/yr) Salinity removed by Seepage (tonne/yr) 0.3 Salinity lost by Overtopping (tonne/yr) 0.0 Salinity involved in Recycling (tonne/yr) 0.0 Increase in pond Salinity (tonne/yr) 0.0 POND CONCENTRATIONS Pond 1 Page 3
263 Model 1b.txt Average Nitrogen Conc of Pond Liquid (mg/l) 18.2 Average Phosphorus Conc of Pond Liquid(mg/L) 6.9 Average TDS Conc of Pond Liquid (mg/l) Average Salinity of Pond Liquid (ds/m) 4.2 Average Potassium Conc of Pond Liquid (mg/l) 0.0 (On final day of simulation) Nitrogen Conc of Pond Liquid (mg/l) 17.7 Phosphorus Conc of Pond Liquid (mg/l) 6.8 TDS Conc of Pond Liquid (mg/l) EC of Pond Liquid (ds/m) 1.5 Potassium Conc of Pond Liquid (mg/l) 0.0 REMOVED SLUDGE - NUTRIENT & SALT CONCENTRATIONS Nitrogen in removed Sludge (db) (kg/tonne) 0.0 Phosphorus in removed Sludge (db) (kg/tonne) 0.0 Salt in removed Sludge (db) (kg/tonne) 0.0 Potassium in removed Sludge (db) (kg/tonne) 0.0 REMOVED SLUDGE - NUTRIENT & SALT MASSES Nitrogen in removed Sludge (tonne/yr) 0.0 Phosphorus in removed Sludge (tonne/yr) 0.0 Salt in removed Sludge (mass bal.)(tonne/yr) 0.0 Salt in removed Sludge (tonne/yr) 0.0 Potm. in removed Sludge (mass bal.)(tonne/yr 0.0 Potassium in removed Sludge (tonne/yr) 0.0 LAND DISPOSAL AREA ****************** WATER BALANCE (Initial soil water assumed to be at field capacity) (Irrigated up to 3.65% of field capacity) Rainfall (mm/year) Irrigation Area (ha) 31.0 Irrigation (mm/year) Soil Evaporation (mm/year) 54.1 Transpiration (mm/year) Runoff (mm/year) 6.1 Drainage (mm/year) Change in soil moisture (mm/year) -0.4 ANNUAL TOTALS Year Rain Irrig Sevap Trans Runoff Drain Change (mm) (mm) (mm) (mm) (mm) (mm) (mm) Page 4
264 Model 1b.txt NUTRIENT BALANCE NITROGEN Total N irrigated from ponds (kg/ha/year) 99.5 % of Total as ammonium 80.0 Nitrogn lost by ammonia volat.(kg/ha/year) 15.9 Deep Drainage (mm/year) Nitrogen added in irrigation (kg/ha/year) 83.6 Nitrogen added in seed (kg/ha/year) 0.1 Nitrogen removed by crop (kg/ha/year) Denitrification (kg/ha/year) 0.1 Leached NO3-N (kg/ha/year) 2.8 Change in soil organic-n (kg/ha/year) Change in soil solution NH4-N (kg/ha/year) 0.0 Change in soil solution NO3-N (kg/ha/year) -2.9 Change in adsorbed NH4-N (kg/ha/year) 0.0 Initial soil organic-n (kg/ha) Final soil organic-n (kg/ha) Initial soil inorganic-n (kg/ha) Final soil inorganic-n (kg/ha) 0.0 Average N03-N conc in the root zone (mg/l) 0.4 Average N03-N conc below root zone (mg/l) 1.8 Average N03-N conc of deep drainage (mg/l) 0.6 PHOSPHORUS Phosphorus added in irrigatn (kg/ha/year) 35.6 % of Total as phosphate Phosphorus added in seed (kg/ha/year) 0.0 Phosphorus removed by crop (kg/ha/year) 26.7 Leached PO4-P (kg/ha/year) 0.1 Change in dissolved PO4-P (kg/ha/year) 0.0 Change in adsorbed PO4-P (kg/ha/year) 8.9 Average P04-P conc in the root zone (mg/l) 0.2 Average P04-P conc below root zone (mg/l) 0.0 SOIL P STORAGE LIFE Year YearNo. Tot P stored P leached in year kg/ha kg/ha Page 5
265 Model 1b.txt PLANT Plant species: Coastal couch grass (Cynodon dac PLANT WATER USE Irrigation (mm/year) 509. Totl Irrigation Area(ha) 31.0 Pan coefficient (%) 1.0 Maximum crop coefficient (%) 0.8 Average Plant Cover (%) 81. Average Plant Total Cover (%) 94. Average Plant Rootdepth (mm) 754. Average Plant Available Water Capacity (mm) 54. Average Plant Available Water (mm) 35. Yield produced per unit transp. (kg/ha/mm) 9. PLANT NUTRIENT UPTAKE Dry Matter Yield (Shoots) (kg/ha/yr) Net nitrogen removed by plant (kg/ha/yr) 119. Shoot Concn (%DM) 1.25 Net phosphorus removed by plant (kg/ha/yr) 27. Shoot Concn (%DM) 0.28 Page 6
266 Model 1b.txt AVERAGE MONTHLY GROWTH STRESS (0=no stress, 1=full stress) Month Yield Nitr Temp Water Water kg/ha Defic Logging >>> NO-PLANT EVENTS <<< %Days due to temperature stress 0.2 %Days due to water stress 0.4 %Days due to nitrogen stress 0.0 No. of forced harvests per year 0.2 No. of normal harvests per year 6.5 SALINITY Salt tolerance - plant species: tolerant Average EC of Irrigation Water (ds/m) 4.3 Irrigation (mm/year) Average EC of Rainwater (ds/m x10) 0.3 Rainfall (mm/year) Average EC of Infiltrated water (ds/m) 1.4 Av. water-upt-weightd rootzone EC(dS/m s.e.) 1.4 EC soil soln (FC) at base of rootzone (ds/m) 5.8 Deep Drainage (mm/year) Reduction in Crop yield due to Salinity (%) 0.0 Percentage of yrs that crop yld falls below 90% of potential because of soil salinity 0.0 Period ECrootzone ECbase Rel Yield sat ext in situ (ds/m) (ds/m) (%) Page 7
267 Model 1b.txt GROUNDWATER ************ Average Groundwater Recharge (m3/day) Average Nitrate-N Conc of Recharge (mg/l) 0.6 Thickness of the Aquifer (m) 10.0 Distance (m) from Irrigation Area to where Nitrate-N Conc in Groundwater is Calculated Concentration of NITRATE-N in Groundwater (mg/l) Year Depth Below Water Table Surface 0.0 m 5.0 m 9.0 m Last ACKNOWLEDGMENTS *************** This run brought to you courtesy of: MEDLIEXE.EXE : bytes Fri Mar 12 10:26: CRCPROJ.EXE : bytes Wed Apr 28 15:18: GRAPHS.EXE: No details found GRAPHS.EXE : 2617 bytes Wed Apr 28 15:18: OTHER INDUSTRY INPUT PARAMETERS - DATA SUMMARY Nature of Industry: STP wastestream 1 file(s) copied UNCONDITIONAL FINISH Page 8
268 Model 2a.txt ***************************************** SUMMARY OUTPUT MEDLI Version 1.30 Data Set: GKI Scenario 2a-95% PAWC 31ha Run Date: 25/08/11 Time:08:02:04.14 ***************************************** GENERAL INFORMATION ******************* Title: GKI Resort Revitalisation Plan Subject: Scenario 2a - 80% PAWC Irrigatio Client: GKI Resorts Pty Ltd User: Mark Farrey Time: Thu Aug 25 08:01: Comments: 80%PAWC-5mm beyond DUL. Irrigation Area = 31ha. Wet Weather Storage = 13ML (95% reuse). N = 20mg/L, P = 7mg/L. RUN PERIOD ********** Starting Date 1/ 1/1957 Ending Date 31/12/2009 Run Length 53 years 0 days CLIMATE INFORMATION ******************* Enterprise site: Great Keppel Island Weather station: keppel_23.20s_150.95e (Interpola deg S deg E ANNUAL TOTALS 10 Percentile 50 percentile 90 Percentile Rainfall mm/year Pan Evap mm/year MONTHLY Jan Feb Mar Apr May Jun Jul Aug Sep Oct Nov Dec Year Rainfall (mm) Pan Evap (mm) Ave Max Temp DegC Ave Min Temp DegC Rad (MJ/m2/day) MONTHLY IRRIGATION ****************** Irrigation (mm) SOIL PROPERTIES *************** Soil type: Great Keppel Island Sand SOIL WATER PROPERTIES Layer 1 Layer 2 Layer 3 Layer 4 Bulk Density (g/cm3) Porosity (mm/layer) Saturated Water Content (mm/layer) Drained Upper Limit (mm/layer) Lower Storage Limit (mm/layer) Air Dry Moisture Content (mm/layer) 4.0 Layer Thickness (mm) Profile Max Rootzone Total Saturated Water Content (mm) Total Drained Upper Limit (mm) Total Lower Storage Limit (mm) Total Air Dry Moisture Content (mm) Total Depth (mm) Maximum Plant Available Water Capacity 55.5 Saturated Hydraulic Conductivity Page 1
269 Model 2a.txt At Surface (mm/hr) Limiting (mm/hr) 20.0 RUNOFF Runoff curve No II 70.0 SOIL EVAPORATION CONA (mm/day^0.5) 4.5 URITCH (mm) 10.0 AVERAGE WASTE STREAM ******************** Other waste stream (All values relate to influent after any screening and recycling, if applicable). Inflow Volume (ML/year) Nitrogen (tonne/year) 3.2 Phosphorus (tonne/year) 1.1 Salinity (tonne/year) Nitrogen Concentration (mg/l) 20.0 Phosphorus Concentration (mg/l) 7.0 Salinity (mg/l) Salinity (ds/m) 4.3 WASTE STREAM DETAILS (for last inflow event): Nitrogen Concentration (mg/l) 20.0 Phosphorus Concentration (mg/l) 7.0 TDS Concentration (mg/l) Salinity (ds/m) 1.6 IRRIGATION WATER **************** Irrigation triggered when plant available water falls to (%PAWC) 80.0 Irrigating upto upper storage limit + 5 mm AREA Total Irrigation Area (ha) 31.0 VOLUMES Total Irrigation (ML/year) Minimum Volume Irrigated by Pump (ML/ha/day) 0.0 Maximum Volume must be full irrig. requiremt Maximum Vol. Available For Shandying (ML/yr) 0.0 IRRIGATION CONCENTRATIONS Average salinity of Irrigation (ds/m) 4.3 Average salinity of Irrigation (mg/l) Average Nitrogen Conc of Irrigation Before ammonia loss (mg/l) 18.6 After ammonia loss (mg/l) 15.7 Average Phosphorus Conc of Irrigation (mg/l) 7.0 FRESH WATER USAGE ***************** Irrigation (shandying) water (ML/yr) Avg volume of fresh water used (ML/yr) Annual allocation (ML/yr) N/A Page 2
270 POND INFORMATION **************** POND GEOMETRY Model 2a.txt Pond 1 Final pond volume (ML) 3.5 Final liquid volume (ML) 3.5 Final sludge volume (ML) 0.0 Average pond volume (ML) 2.7 Average active volume (ML) 2.7 Maximum pond volume (ML) 13.0 Minimum allowable pond volume (ML) 0.0 Average pond depth (m) 0.8 Pond depth at outlet (m) 3.0 Maximum water surface area (m2 x1000) 4.7 Pond catchment area (m2 x1000) 5.0 Pond footprint length (m) 70.8 Pond footprint width (m) 70.8 POND WATER BALANCE Inflow of Effluent to pond system (ML/yr) Recycle Volume from pond system (ML/yr) 0.0 Rain water added to pond system (ML/yr) 5.2 Evaporation loss from pond system (ML/yr) 5.4 Seepage loss from pond system (ML/yr) 0.2 Irrigation from last pond (ML/yr) Volume of overtopping (ML/yr) 7.4 Sludge accumulated (ML/yr) 0.0 Sludge accumulated (t DM/yr) 0.0 Sludge removed (ML/yr) 0.0 No of desludging events every 10 years 0.0 Increase in pond water volume (ML/yr) 0.1 OVERTOPPING EVENTS Volume of overtopping (ML/yr) 7.41 No. of days pond overtops per 10 years Average Length of overtopping events (days) % Reuse No. of overtopping events every 10 years > 0 ML > 5 ML* > ML > ML 8.68 > ML 4.53 > 10 ML 1.70 > 20 ML 1.13 > 50 ML * Volume equivalent to 1 mm depth of water >>> NO-IRRIGATION EVENTS <<< %Days rain prevents irrigation 26.5 %Days water demand too small to trigger irr No. periods/year without irrigable effluent 0.0 Average Length of such periods (days) 0.0 POND NITROGEN BALANCE Nitrogen Added by Effluent (tonne/yr) 3.2 Irrig. from pond (ML/yr) Nitrogen removed by Irrigation (tonne/yr) 2.8 Nitrogen removed by Volatilisation(tonne/yr) 0.2 Nitrogen removed by Seepage (tonne/yr) 0.0 Nitrogen accumulated in Sludge (tonne/yr) 0.0 Nitrogen lost by Overtopping (tonne/yr) 0.1 Nitrogen involved in Recycling (tonne/yr) 0.0 Increase in pond Nitrogen (tonne/yr) 0.0 POND PHOSPHORUS BALANCE Phosphorus Added by Effluent (tonne/yr) 1.1 Irrig. from pond (ML/yr) Phosphorus removed by Irrigation (tonne/yr) 1.1 Phosphorus removed by Seepage (tonne/yr) 0.0 Phosphorus accumulated in Sludge (tonne/yr) 0.0 Page 3
271 Model 2a.txt Phosphorus lost by Overtopping (tonne/yr) 0.0 Phosphorus involved in Recycling (tonne/yr) 0.0 Increase in pond Phosphorus (tonne/yr) 0.0 POND SALINITY BALANCE Salinity Added by Effluent (tonne/yr) Salinity removed by Irrigation (tonne/yr) Salinity removed by Seepage (tonne/yr) 0.4 Salinity lost by Overtopping (tonne/yr) 20.7 Salinity involved in Recycling (tonne/yr) 0.0 Increase in pond Salinity (tonne/yr) 0.1 POND CONCENTRATIONS Pond 1 Average Nitrogen Conc of Pond Liquid (mg/l) 16.6 Average Phosphorus Conc of Pond Liquid(mg/L) 6.7 Average TDS Conc of Pond Liquid (mg/l) Average Salinity of Pond Liquid (ds/m) 4.3 Average Potassium Conc of Pond Liquid (mg/l) 0.0 (On final day of simulation) Nitrogen Conc of Pond Liquid (mg/l) 17.5 Phosphorus Conc of Pond Liquid (mg/l) 6.6 TDS Conc of Pond Liquid (mg/l) EC of Pond Liquid (ds/m) 1.5 Potassium Conc of Pond Liquid (mg/l) 0.0 REMOVED SLUDGE - NUTRIENT & SALT CONCENTRATIONS Nitrogen in removed Sludge (db) (kg/tonne) 0.0 Phosphorus in removed Sludge (db) (kg/tonne) 0.0 Salt in removed Sludge (db) (kg/tonne) 0.0 Potassium in removed Sludge (db) (kg/tonne) 0.0 REMOVED SLUDGE - NUTRIENT & SALT MASSES Nitrogen in removed Sludge (tonne/yr) 0.0 Phosphorus in removed Sludge (tonne/yr) 0.0 Salt in removed Sludge (mass bal.)(tonne/yr) 0.0 Salt in removed Sludge (tonne/yr) 0.0 Potm. in removed Sludge (mass bal.)(tonne/yr 0.0 Potassium in removed Sludge (tonne/yr) 0.0 LAND DISPOSAL AREA ****************** WATER BALANCE (Initial soil water assumed to be at field capacity) (Irrigated up to 40.90% of field capacity) Rainfall (mm/year) Irrigation Area (ha) 31.0 Irrigation (mm/year) Soil Evaporation (mm/year) 35.7 Transpiration (mm/year) Runoff (mm/year) 6.0 Drainage (mm/year) Change in soil moisture (mm/year) -0.5 ANNUAL TOTALS Year Rain Irrig Sevap Trans Runoff Drain Change (mm) (mm) (mm) (mm) (mm) (mm) (mm) Page 4
272 Model 2a.txt NUTRIENT BALANCE NITROGEN Total N irrigated from ponds (kg/ha/year) 90.1 % of Total as ammonium 80.0 Nitrogn lost by ammonia volat.(kg/ha/year) 14.4 Deep Drainage (mm/year) Nitrogen added in irrigation (kg/ha/year) 75.7 Nitrogen added in seed (kg/ha/year) 0.1 Nitrogen removed by crop (kg/ha/year) Denitrification (kg/ha/year) 0.1 Leached NO3-N (kg/ha/year) 2.1 Change in soil organic-n (kg/ha/year) Change in soil solution NH4-N (kg/ha/year) 0.0 Change in soil solution NO3-N (kg/ha/year) -2.9 Change in adsorbed NH4-N (kg/ha/year) 0.0 Initial soil organic-n (kg/ha) Final soil organic-n (kg/ha) 96.9 Initial soil inorganic-n (kg/ha) Final soil inorganic-n (kg/ha) 0.0 Average N03-N conc in the root zone (mg/l) 0.2 Average N03-N conc below root zone (mg/l) 1.6 Average N03-N conc of deep drainage (mg/l) 0.5 PHOSPHORUS Phosphorus added in irrigatn (kg/ha/year) 33.9 % of Total as phosphate Phosphorus added in seed (kg/ha/year) 0.0 Phosphorus removed by crop (kg/ha/year) 24.9 Page 5
273 Model 2a.txt Leached PO4-P (kg/ha/year) 0.1 Change in dissolved PO4-P (kg/ha/year) 0.0 Change in adsorbed PO4-P (kg/ha/year) 9.0 Average P04-P conc in the root zone (mg/l) 0.2 Average P04-P conc below root zone (mg/l) 0.0 SOIL P STORAGE LIFE Year YearNo. Tot P stored P leached in year kg/ha kg/ha PLANT Plant species: Coastal couch grass (Cynodon dac PLANT WATER USE Irrigation (mm/year) 484. Totl Irrigation Area(ha) 31.0 Page 6
274 Model 2a.txt Pan coefficient (%) 1.0 Maximum crop coefficient (%) 0.8 Average Plant Cover (%) 81. Average Plant Total Cover (%) 95. Average Plant Rootdepth (mm) 759. Average Plant Available Water Capacity (mm) 55. Average Plant Available Water (mm) 38. Yield produced per unit transp. (kg/ha/mm) 9. PLANT NUTRIENT UPTAKE Dry Matter Yield (Shoots) (kg/ha/yr) Net nitrogen removed by plant (kg/ha/yr) 112. Shoot Concn (%DM) 1.20 Net phosphorus removed by plant (kg/ha/yr) 25. Shoot Concn (%DM) 0.27 AVERAGE MONTHLY GROWTH STRESS (0=no stress, 1=full stress) Month Yield Nitr Temp Water Water kg/ha Defic Logging >>> NO-PLANT EVENTS <<< %Days due to temperature stress 0.2 %Days due to water stress 0.6 %Days due to nitrogen stress 0.0 No. of forced harvests per year 0.2 No. of normal harvests per year 6.3 SALINITY Salt tolerance - plant species: tolerant Average EC of Irrigation Water (ds/m) 4.3 Irrigation (mm/year) Average EC of Rainwater (ds/m x10) 0.3 Rainfall (mm/year) Average EC of Infiltrated water (ds/m) 1.4 Av. water-upt-weightd rootzone EC(dS/m s.e.) 1.4 EC soil soln (FC) at base of rootzone (ds/m) 6.0 Deep Drainage (mm/year) Reduction in Crop yield due to Salinity (%) 0.0 Percentage of yrs that crop yld falls below 90% of potential because of soil salinity 0.0 Period ECrootzone ECbase Rel Yield sat ext in situ (ds/m) (ds/m) (%) Page 7
275 Model 2a.txt GROUNDWATER ************ Average Groundwater Recharge (m3/day) Average Nitrate-N Conc of Recharge (mg/l) 0.5 Thickness of the Aquifer (m) 10.0 Distance (m) from Irrigation Area to where Nitrate-N Conc in Groundwater is Calculated Concentration of NITRATE-N in Groundwater (mg/l) Year Depth Below Water Table Surface 0.0 m 5.0 m 9.0 m Last ACKNOWLEDGMENTS *************** This run brought to you courtesy of: MEDLIEXE.EXE : bytes Fri Mar 12 10:26: CRCPROJ.EXE : bytes Wed Apr 28 15:18: GRAPHS.EXE: No details found GRAPHS.EXE : 2617 bytes Wed Apr 28 15:18: Page 8
276 Model 2a.txt OTHER INDUSTRY INPUT PARAMETERS - DATA SUMMARY Nature of Industry: STP wastestream 1 file(s) copied UNCONDITIONAL FINISH Page 9
277 Model 2b.txt ***************************************** SUMMARY OUTPUT MEDLI Version 1.30 Data Set: GKI Scenario 2b-100% PAWC 31ha Run Date: 29/08/11 Time:15:20:49.44 ***************************************** GENERAL INFORMATION ******************* Title: GKI Resort Revitalisation Plan Subject: Scenario 2b - 80% PAWC Irrigatio Client: GKI Resorts Pty Ltd User: Mark Farrey Time: Mon Aug 29 15:18: Comments: 80%PAWC-5mm beyond DUL. Irrigation Area = 31ha. Wet Weather Storage = 75ML (100% reuse). N = 20mg/L, P = 7mg/L. RUN PERIOD ********** Starting Date 1/ 1/1957 Ending Date 31/12/2009 Run Length 53 years 0 days CLIMATE INFORMATION ******************* Enterprise site: Great Keppel Island Weather station: keppel_23.20s_150.95e (Interpola deg S deg E ANNUAL TOTALS 10 Percentile 50 percentile 90 Percentile Rainfall mm/year Pan Evap mm/year MONTHLY Jan Feb Mar Apr May Jun Jul Aug Sep Oct Nov Dec Year Rainfall (mm) Pan Evap (mm) Ave Max Temp DegC Ave Min Temp DegC Rad (MJ/m2/day) MONTHLY IRRIGATION ****************** Irrigation (mm) SOIL PROPERTIES *************** Soil type: Great Keppel Island Sand SOIL WATER PROPERTIES Layer 1 Layer 2 Layer 3 Layer 4 Bulk Density (g/cm3) Porosity (mm/layer) Saturated Water Content (mm/layer) Drained Upper Limit (mm/layer) Lower Storage Limit (mm/layer) Air Dry Moisture Content (mm/layer) 4.0 Layer Thickness (mm) Profile Max Rootzone Total Saturated Water Content (mm) Total Drained Upper Limit (mm) Total Lower Storage Limit (mm) Total Air Dry Moisture Content (mm) Total Depth (mm) Maximum Plant Available Water Capacity 55.5 Saturated Hydraulic Conductivity Page 1
278 Model 2b.txt At Surface (mm/hr) Limiting (mm/hr) 20.0 RUNOFF Runoff curve No II 70.0 SOIL EVAPORATION CONA (mm/day^0.5) 4.5 URITCH (mm) 10.0 AVERAGE WASTE STREAM ******************** Other waste stream (All values relate to influent after any screening and recycling, if applicable). Inflow Volume (ML/year) Nitrogen (tonne/year) 3.2 Phosphorus (tonne/year) 1.1 Salinity (tonne/year) Nitrogen Concentration (mg/l) 20.0 Phosphorus Concentration (mg/l) 7.0 Salinity (mg/l) Salinity (ds/m) 1.6 WASTE STREAM DETAILS (for last inflow event): Nitrogen Concentration (mg/l) 20.0 Phosphorus Concentration (mg/l) 7.0 TDS Concentration (mg/l) Salinity (ds/m) 1.6 IRRIGATION WATER **************** Irrigation triggered when plant available water falls to (%PAWC) 80.0 Irrigating upto upper storage limit + 5 mm AREA Total Irrigation Area (ha) 31.0 VOLUMES Total Irrigation (ML/year) Minimum Volume Irrigated by Pump (ML/ha/day) 0.0 Maximum Volume must be full irrig. requiremt Maximum Vol. Available For Shandying (ML/yr) 0.0 IRRIGATION CONCENTRATIONS Average salinity of Irrigation (ds/m) 1.6 Average salinity of Irrigation (mg/l) Average Nitrogen Conc of Irrigation Before ammonia loss (mg/l) 14.7 After ammonia loss (mg/l) 12.3 Average Phosphorus Conc of Irrigation (mg/l) 7.2 FRESH WATER USAGE ***************** Irrigation (shandying) water (ML/yr) Avg volume of fresh water used (ML/yr) Annual allocation (ML/yr) N/A Page 2
279 POND INFORMATION **************** POND GEOMETRY Model 2b.txt Pond 1 Final pond volume (ML) 4.2 Final liquid volume (ML) 4.2 Final sludge volume (ML) 0.0 Average pond volume (ML) 7.6 Average active volume (ML) 7.6 Maximum pond volume (ML) 75.0 Minimum allowable pond volume (ML) 0.0 Average pond depth (m) 0.3 Pond depth at outlet (m) 3.0 Maximum water surface area (m2 x1000) 26.0 Pond catchment area (m2 x1000) 26.6 Pond footprint length (m) Pond footprint width (m) POND WATER BALANCE Inflow of Effluent to pond system (ML/yr) Recycle Volume from pond system (ML/yr) 0.0 Rain water added to pond system (ML/yr) 27.8 Evaporation loss from pond system (ML/yr) 31.4 Seepage loss from pond system (ML/yr) 0.9 Irrigation from last pond (ML/yr) Volume of overtopping (ML/yr) 0.0 Sludge accumulated (ML/yr) 0.0 Sludge accumulated (t DM/yr) 0.0 Sludge removed (ML/yr) 0.0 No of desludging events every 10 years 0.0 Increase in pond water volume (ML/yr) 0.1 OVERTOPPING EVENTS Volume of overtopping (ML/year) Average Length of overtopping events (days) % Reuse No. of overtopping events per 10 years >>> NO-IRRIGATION EVENTS <<< %Days rain prevents irrigation 26.5 %Days water demand too small to trigger irr No. periods/year without irrigable effluent 0.0 Average Length of such periods (days) 0.0 POND NITROGEN BALANCE Nitrogen Added by Effluent (tonne/yr) 3.2 Irrig. from pond (ML/yr) Nitrogen removed by Irrigation (tonne/yr) 2.2 Nitrogen removed by Volatilisation(tonne/yr) 0.9 Nitrogen removed by Seepage (tonne/yr) 0.0 Nitrogen accumulated in Sludge (tonne/yr) 0.0 Nitrogen lost by Overtopping (tonne/yr) 0.0 Nitrogen involved in Recycling (tonne/yr) 0.0 Increase in pond Nitrogen (tonne/yr) 0.0 POND PHOSPHORUS BALANCE Phosphorus Added by Effluent (tonne/yr) 1.1 Irrig. from pond (ML/yr) Phosphorus removed by Irrigation (tonne/yr) 1.1 Phosphorus removed by Seepage (tonne/yr) 0.0 Phosphorus accumulated in Sludge (tonne/yr) 0.0 Phosphorus lost by Overtopping (tonne/yr) 0.0 Phosphorus involved in Recycling (tonne/yr) 0.0 Increase in pond Phosphorus (tonne/yr) 0.0 POND SALINITY BALANCE Salinity Added by Effluent (tonne/yr) Salinity removed by Irrigation (tonne/yr) Salinity removed by Seepage (tonne/yr) 0.9 Salinity lost by Overtopping (tonne/yr) 0.0 Page 3
280 Model 2b.txt Salinity involved in Recycling (tonne/yr) 0.0 Increase in pond Salinity (tonne/yr) 0.1 POND CONCENTRATIONS Pond 1 Average Nitrogen Conc of Pond Liquid (mg/l) 9.8 Average Phosphorus Conc of Pond Liquid(mg/L) 5.9 Average TDS Conc of Pond Liquid (mg/l) Average Salinity of Pond Liquid (ds/m) 1.3 Average Potassium Conc of Pond Liquid (mg/l) 0.0 (On final day of simulation) Nitrogen Conc of Pond Liquid (mg/l) 10.6 Phosphorus Conc of Pond Liquid (mg/l) 5.5 TDS Conc of Pond Liquid (mg/l) EC of Pond Liquid (ds/m) 1.2 Potassium Conc of Pond Liquid (mg/l) 0.0 REMOVED SLUDGE - NUTRIENT & SALT CONCENTRATIONS Nitrogen in removed Sludge (db) (kg/tonne) 0.0 Phosphorus in removed Sludge (db) (kg/tonne) 0.0 Salt in removed Sludge (db) (kg/tonne) 0.0 Potassium in removed Sludge (db) (kg/tonne) 0.0 REMOVED SLUDGE - NUTRIENT & SALT MASSES Nitrogen in removed Sludge (tonne/yr) 0.0 Phosphorus in removed Sludge (tonne/yr) 0.0 Salt in removed Sludge (mass bal.)(tonne/yr) 0.0 Salt in removed Sludge (tonne/yr) 0.0 Potm. in removed Sludge (mass bal.)(tonne/yr 0.0 Potassium in removed Sludge (tonne/yr) 0.0 LAND DISPOSAL AREA ****************** WATER BALANCE (Initial soil water assumed to be at field capacity) (Irrigated up to 40.59% of field capacity) Rainfall (mm/year) Irrigation Area (ha) 31.0 Irrigation (mm/year) Soil Evaporation (mm/year) 37.2 Transpiration (mm/year) Runoff (mm/year) 6.1 Drainage (mm/year) Change in soil moisture (mm/year) -0.5 ANNUAL TOTALS Year Rain Irrig Sevap Trans Runoff Drain Change (mm) (mm) (mm) (mm) (mm) (mm) (mm) Page 4
281 Model 2b.txt NUTRIENT BALANCE NITROGEN Total N irrigated from ponds (kg/ha/year) 72.6 % of Total as ammonium 80.0 Nitrogn lost by ammonia volat.(kg/ha/year) 11.6 Deep Drainage (mm/year) Nitrogen added in irrigation (kg/ha/year) 60.9 Nitrogen added in seed (kg/ha/year) 0.1 Nitrogen removed by crop (kg/ha/year) 96.8 Denitrification (kg/ha/year) 0.1 Leached NO3-N (kg/ha/year) 2.3 Change in soil organic-n (kg/ha/year) Change in soil solution NH4-N (kg/ha/year) 0.0 Change in soil solution NO3-N (kg/ha/year) -2.9 Change in adsorbed NH4-N (kg/ha/year) 0.0 Initial soil organic-n (kg/ha) Final soil organic-n (kg/ha) 93.2 Initial soil inorganic-n (kg/ha) Final soil inorganic-n (kg/ha) 0.0 Average N03-N conc in the root zone (mg/l) 0.2 Average N03-N conc below root zone (mg/l) 1.4 Average N03-N conc of deep drainage (mg/l) 0.5 PHOSPHORUS Phosphorus added in irrigatn (kg/ha/year) 35.4 % of Total as phosphate Phosphorus added in seed (kg/ha/year) 0.0 Phosphorus removed by crop (kg/ha/year) 23.3 Leached PO4-P (kg/ha/year) 0.1 Change in dissolved PO4-P (kg/ha/year) 0.0 Change in adsorbed PO4-P (kg/ha/year) 12.0 Average P04-P conc in the root zone (mg/l) 0.3 Average P04-P conc below root zone (mg/l) 0.0 SOIL P STORAGE LIFE Year YearNo. Tot P stored kg/ha P leached in year kg/ha Page 5
282 Model 2b.txt PLANT Plant species: Coastal couch grass (Cynodon dac PLANT WATER USE Irrigation (mm/year) 494. Totl Irrigation Area(ha) 31.0 Pan coefficient (%) 1.0 Maximum crop coefficient (%) 0.8 Average Plant Cover (%) 82. Average Plant Total Cover (%) 95. Average Plant Rootdepth (mm) 759. Average Plant Available Water Capacity (mm) 55. Average Plant Available Water (mm) 39. Yield produced per unit transp. (kg/ha/mm) 8. PLANT NUTRIENT UPTAKE Page 6
283 Model 2b.txt Dry Matter Yield (Shoots) (kg/ha/yr) Net nitrogen removed by plant (kg/ha/yr) 97. Shoot Concn (%DM) 1.14 Net phosphorus removed by plant (kg/ha/yr) 23. Shoot Concn (%DM) 0.27 AVERAGE MONTHLY GROWTH STRESS (0=no stress, 1=full stress) Month Yield Nitr Temp Water Water kg/ha Defic Logging >>> NO-PLANT EVENTS <<< %Days due to temperature stress 0.2 %Days due to water stress 0.4 %Days due to nitrogen stress 0.0 No. of forced harvests per year 0.2 No. of normal harvests per year 5.8 SALINITY Salt tolerance - plant species: tolerant Average EC of Irrigation Water (ds/m) 1.6 Irrigation (mm/year) Average EC of Rainwater (ds/m x10) 0.3 Rainfall (mm/year) Average EC of Infiltrated water (ds/m) 0.5 Av. water-upt-weightd rootzone EC(dS/m s.e.) 0.5 EC soil soln (FC) at base of rootzone (ds/m) 2.2 Deep Drainage (mm/year) Reduction in Crop yield due to Salinity (%) 0.0 Percentage of yrs that crop yld falls below 90% of potential because of soil salinity 0.0 Period ECrootzone ECbase Rel Yield sat ext in situ (ds/m) (ds/m) (%) Page 7
284 Model 2b.txt GROUNDWATER ************ Average Groundwater Recharge (m3/day) Average Nitrate-N Conc of Recharge (mg/l) 0.5 Thickness of the Aquifer (m) 10.0 Distance (m) from Irrigation Area to where Nitrate-N Conc in Groundwater is Calculated Concentration of NITRATE-N in Groundwater (mg/l) Year Depth Below Water Table Surface 0.0 m 5.0 m 9.0 m Last ACKNOWLEDGMENTS *************** This run brought to you courtesy of: MEDLIEXE.EXE : bytes Fri Mar 12 10:26: CRCPROJ.EXE : bytes Wed Apr 28 15:18: GRAPHS.EXE: No details found GRAPHS.EXE : 2617 bytes Wed Apr 28 15:18: OTHER INDUSTRY INPUT PARAMETERS - DATA SUMMARY Nature of Industry: STP wastestream 1 file(s) copied UNCONDITIONAL FINISH Page 8
285 Model 2d.txt ***************************************** SUMMARY OUTPUT MEDLI Version 1.30 Data Set: GKI Scenario 2d- PAWC 31ha 1in10 Run Date: 25/08/11 Time:08:09:49.03 ***************************************** GENERAL INFORMATION ******************* Title: GKI Resort Revitalisation Plan Subject: Scenario 2d - 80% PAWC Irrigatio Client: GKI Resorts Pty Ltd User: Mark Farrey Time: Thu Aug 25 08:08: Comments: 80%PAWC-5mm beyond DUL. Irrigation Area = 31ha. Wet Weather Storage = 37ML (1in10year overflow). N = 20mg/L, P = 7mg/L. RUN PERIOD ********** Starting Date 1/ 1/1957 Ending Date 31/12/2009 Run Length 53 years 0 days CLIMATE INFORMATION ******************* Enterprise site: Great Keppel Island Weather station: keppel_23.20s_150.95e (Interpola deg S deg E ANNUAL TOTALS 10 Percentile 50 percentile 90 Percentile Rainfall mm/year Pan Evap mm/year MONTHLY Jan Feb Mar Apr May Jun Jul Aug Sep Oct Nov Dec Year Rainfall (mm) Pan Evap (mm) Ave Max Temp DegC Ave Min Temp DegC Rad (MJ/m2/day) MONTHLY IRRIGATION ****************** Irrigation (mm) SOIL PROPERTIES *************** Soil type: Great Keppel Island Sand SOIL WATER PROPERTIES Layer 1 Layer 2 Layer 3 Layer 4 Bulk Density (g/cm3) Porosity (mm/layer) Saturated Water Content (mm/layer) Drained Upper Limit (mm/layer) Lower Storage Limit (mm/layer) Air Dry Moisture Content (mm/layer) 4.0 Layer Thickness (mm) Profile Max Rootzone Total Saturated Water Content (mm) Total Drained Upper Limit (mm) Total Lower Storage Limit (mm) Total Air Dry Moisture Content (mm) Total Depth (mm) Maximum Plant Available Water Capacity 55.5 Saturated Hydraulic Conductivity Page 1
286 Model 2d.txt At Surface (mm/hr) Limiting (mm/hr) 20.0 RUNOFF Runoff curve No II 70.0 SOIL EVAPORATION CONA (mm/day^0.5) 4.5 URITCH (mm) 10.0 AVERAGE WASTE STREAM ******************** Other waste stream (All values relate to influent after any screening and recycling, if applicable). Inflow Volume (ML/year) Nitrogen (tonne/year) 3.2 Phosphorus (tonne/year) 1.1 Salinity (tonne/year) Nitrogen Concentration (mg/l) 20.0 Phosphorus Concentration (mg/l) 7.0 Salinity (mg/l) Salinity (ds/m) 4.3 WASTE STREAM DETAILS (for last inflow event): Nitrogen Concentration (mg/l) 20.0 Phosphorus Concentration (mg/l) 7.0 TDS Concentration (mg/l) Salinity (ds/m) 1.6 IRRIGATION WATER **************** Irrigation triggered when plant available water falls to (%PAWC) 80.0 Irrigating upto upper storage limit + 5 mm AREA Total Irrigation Area (ha) 31.0 VOLUMES Total Irrigation (ML/year) Minimum Volume Irrigated by Pump (ML/ha/day) 0.0 Maximum Volume must be full irrig. requiremt Maximum Vol. Available For Shandying (ML/yr) 0.0 IRRIGATION CONCENTRATIONS Average salinity of Irrigation (ds/m) 4.3 Average salinity of Irrigation (mg/l) Average Nitrogen Conc of Irrigation Before ammonia loss (mg/l) 16.6 After ammonia loss (mg/l) 13.9 Average Phosphorus Conc of Irrigation (mg/l) 7.1 FRESH WATER USAGE ***************** Irrigation (shandying) water (ML/yr) Avg volume of fresh water used (ML/yr) Annual allocation (ML/yr) N/A Page 2
287 POND INFORMATION **************** POND GEOMETRY Model 2d.txt Pond 1 Final pond volume (ML) 3.8 Final liquid volume (ML) 3.8 Final sludge volume (ML) 0.0 Average pond volume (ML) 5.7 Average active volume (ML) 5.7 Maximum pond volume (ML) 37.0 Minimum allowable pond volume (ML) 0.0 Average pond depth (m) 0.5 Pond depth at outlet (m) 3.0 Maximum water surface area (m2 x1000) 13.0 Pond catchment area (m2 x1000) 13.5 Pond footprint length (m) Pond footprint width (m) POND WATER BALANCE Inflow of Effluent to pond system (ML/yr) Recycle Volume from pond system (ML/yr) 0.0 Rain water added to pond system (ML/yr) 14.1 Evaporation loss from pond system (ML/yr) 15.4 Seepage loss from pond system (ML/yr) 0.4 Irrigation from last pond (ML/yr) Volume of overtopping (ML/yr) 0.8 Sludge accumulated (ML/yr) 0.0 Sludge accumulated (t DM/yr) 0.0 Sludge removed (ML/yr) 0.0 No of desludging events every 10 years 0.0 Increase in pond water volume (ML/yr) 0.1 OVERTOPPING EVENTS Volume of overtopping (ML/yr) 0.76 No. of days pond overtops per 10 years Average Length of overtopping events (days) % Reuse No. of overtopping events every 10 years > 0 ML 1.70 > ML* 1.70 > ML 0.94 > ML 0.94 > ML 0.38 > 10 ML 0.19 > 20 ML 0.19 > 50 ML * Volume equivalent to 1 mm depth of water >>> NO-IRRIGATION EVENTS <<< %Days rain prevents irrigation 26.5 %Days water demand too small to trigger irr No. periods/year without irrigable effluent 0.0 Average Length of such periods (days) 0.0 POND NITROGEN BALANCE Nitrogen Added by Effluent (tonne/yr) 3.2 Irrig. from pond (ML/yr) Nitrogen removed by Irrigation (tonne/yr) 2.6 Nitrogen removed by Volatilisation(tonne/yr) 0.6 Nitrogen removed by Seepage (tonne/yr) 0.0 Nitrogen accumulated in Sludge (tonne/yr) 0.0 Nitrogen lost by Overtopping (tonne/yr) 0.0 Nitrogen involved in Recycling (tonne/yr) 0.0 Increase in pond Nitrogen (tonne/yr) 0.0 POND PHOSPHORUS BALANCE Phosphorus Added by Effluent (tonne/yr) 1.1 Irrig. from pond (ML/yr) Phosphorus removed by Irrigation (tonne/yr) 1.1 Phosphorus removed by Seepage (tonne/yr) 0.0 Phosphorus accumulated in Sludge (tonne/yr) 0.0 Page 3
288 Model 2d.txt Phosphorus lost by Overtopping (tonne/yr) 0.0 Phosphorus involved in Recycling (tonne/yr) 0.0 Increase in pond Phosphorus (tonne/yr) 0.0 POND SALINITY BALANCE Salinity Added by Effluent (tonne/yr) Salinity removed by Irrigation (tonne/yr) Salinity removed by Seepage (tonne/yr) 1.2 Salinity lost by Overtopping (tonne/yr) 2.0 Salinity involved in Recycling (tonne/yr) 0.0 Increase in pond Salinity (tonne/yr) 0.1 POND CONCENTRATIONS Pond 1 Average Nitrogen Conc of Pond Liquid (mg/l) 13.1 Average Phosphorus Conc of Pond Liquid(mg/L) 6.4 Average TDS Conc of Pond Liquid (mg/l) Average Salinity of Pond Liquid (ds/m) 4.1 Average Potassium Conc of Pond Liquid (mg/l) 0.0 (On final day of simulation) Nitrogen Conc of Pond Liquid (mg/l) 14.1 Phosphorus Conc of Pond Liquid (mg/l) 6.1 TDS Conc of Pond Liquid (mg/l) EC of Pond Liquid (ds/m) 1.4 Potassium Conc of Pond Liquid (mg/l) 0.0 REMOVED SLUDGE - NUTRIENT & SALT CONCENTRATIONS Nitrogen in removed Sludge (db) (kg/tonne) 0.0 Phosphorus in removed Sludge (db) (kg/tonne) 0.0 Salt in removed Sludge (db) (kg/tonne) 0.0 Potassium in removed Sludge (db) (kg/tonne) 0.0 REMOVED SLUDGE - NUTRIENT & SALT MASSES Nitrogen in removed Sludge (tonne/yr) 0.0 Phosphorus in removed Sludge (tonne/yr) 0.0 Salt in removed Sludge (mass bal.)(tonne/yr) 0.0 Salt in removed Sludge (tonne/yr) 0.0 Potm. in removed Sludge (mass bal.)(tonne/yr 0.0 Potassium in removed Sludge (tonne/yr) 0.0 LAND DISPOSAL AREA ****************** WATER BALANCE (Initial soil water assumed to be at field capacity) (Irrigated up to 47.53% of field capacity) Rainfall (mm/year) Irrigation Area (ha) 31.0 Irrigation (mm/year) Soil Evaporation (mm/year) 35.6 Transpiration (mm/year) Runoff (mm/year) 6.0 Drainage (mm/year) Change in soil moisture (mm/year) -0.5 ANNUAL TOTALS Year Rain Irrig Sevap Trans Runoff Drain Change (mm) (mm) (mm) (mm) (mm) (mm) (mm) Page 4
289 Model 2d.txt NUTRIENT BALANCE NITROGEN Total N irrigated from ponds (kg/ha/year) 82.9 % of Total as ammonium 80.0 Nitrogn lost by ammonia volat.(kg/ha/year) 13.3 Deep Drainage (mm/year) Nitrogen added in irrigation (kg/ha/year) 69.6 Nitrogen added in seed (kg/ha/year) 0.1 Nitrogen removed by crop (kg/ha/year) Denitrification (kg/ha/year) 0.1 Leached NO3-N (kg/ha/year) 2.4 Change in soil organic-n (kg/ha/year) Change in soil solution NH4-N (kg/ha/year) 0.0 Change in soil solution NO3-N (kg/ha/year) -2.9 Change in adsorbed NH4-N (kg/ha/year) 0.0 Initial soil organic-n (kg/ha) Final soil organic-n (kg/ha) 95.0 Initial soil inorganic-n (kg/ha) Final soil inorganic-n (kg/ha) 0.0 Average N03-N conc in the root zone (mg/l) 0.2 Average N03-N conc below root zone (mg/l) 1.4 Average N03-N conc of deep drainage (mg/l) 0.5 PHOSPHORUS Phosphorus added in irrigatn (kg/ha/year) 35.3 % of Total as phosphate Phosphorus added in seed (kg/ha/year) 0.0 Phosphorus removed by crop (kg/ha/year) 24.4 Page 5
290 Model 2d.txt Leached PO4-P (kg/ha/year) 0.1 Change in dissolved PO4-P (kg/ha/year) 0.0 Change in adsorbed PO4-P (kg/ha/year) 10.9 Average P04-P conc in the root zone (mg/l) 0.2 Average P04-P conc below root zone (mg/l) 0.0 SOIL P STORAGE LIFE Year YearNo. Tot P stored P leached in year kg/ha kg/ha PLANT Plant species: Coastal couch grass (Cynodon dac PLANT WATER USE Irrigation (mm/year) 500. Totl Irrigation Area(ha) 31.0 Page 6
291 Model 2d.txt Pan coefficient (%) 1.0 Maximum crop coefficient (%) 0.8 Average Plant Cover (%) 82. Average Plant Total Cover (%) 95. Average Plant Rootdepth (mm) 760. Average Plant Available Water Capacity (mm) 55. Average Plant Available Water (mm) 39. Yield produced per unit transp. (kg/ha/mm) 8. PLANT NUTRIENT UPTAKE Dry Matter Yield (Shoots) (kg/ha/yr) Net nitrogen removed by plant (kg/ha/yr) 105. Shoot Concn (%DM) 1.17 Net phosphorus removed by plant (kg/ha/yr) 24. Shoot Concn (%DM) 0.27 AVERAGE MONTHLY GROWTH STRESS (0=no stress, 1=full stress) Month Yield Nitr Temp Water Water kg/ha Defic Logging >>> NO-PLANT EVENTS <<< %Days due to temperature stress 0.2 %Days due to water stress 0.4 %Days due to nitrogen stress 0.0 No. of forced harvests per year 0.2 No. of normal harvests per year 6.1 SALINITY Salt tolerance - plant species: tolerant Average EC of Irrigation Water (ds/m) 4.3 Irrigation (mm/year) Average EC of Rainwater (ds/m x10) 0.3 Rainfall (mm/year) Average EC of Infiltrated water (ds/m) 1.4 Av. water-upt-weightd rootzone EC(dS/m s.e.) 1.4 EC soil soln (FC) at base of rootzone (ds/m) 6.0 Deep Drainage (mm/year) Reduction in Crop yield due to Salinity (%) 0.0 Percentage of yrs that crop yld falls below 90% of potential because of soil salinity 0.0 Period ECrootzone ECbase Rel Yield sat ext in situ (ds/m) (ds/m) (%) Page 7
292 Model 2d.txt GROUNDWATER ************ Average Groundwater Recharge (m3/day) Average Nitrate-N Conc of Recharge (mg/l) 0.5 Thickness of the Aquifer (m) 10.0 Distance (m) from Irrigation Area to where Nitrate-N Conc in Groundwater is Calculated Concentration of NITRATE-N in Groundwater (mg/l) Year Depth Below Water Table Surface 0.0 m 5.0 m 9.0 m Last ACKNOWLEDGMENTS *************** This run brought to you courtesy of: MEDLIEXE.EXE : bytes Fri Mar 12 10:26: CRCPROJ.EXE : bytes Wed Apr 28 15:18: GRAPHS.EXE: No details found GRAPHS.EXE : 2617 bytes Wed Apr 28 15:18: Page 8
293 Model 2d.txt OTHER INDUSTRY INPUT PARAMETERS - DATA SUMMARY Nature of Industry: STP wastestream 1 file(s) copied UNCONDITIONAL FINISH Page 9
294 Water Cycle Management Report Great Keppel Island Resort Revitalisation Plan APPENDIX J Stormwater Quantity Analysis N-B016 Page 170
295 J.1 SURFACE FLOW RATES J.1.1 Analysis Peak surface flow rates were calculated using the Rational Method, generally as outlined in Book 4 Section 1 of Australian Rainfall and Run-Off. Intensity/frequency/duration curves were generated using the algebraic procedures outlined in Book II of Australian Rainfall and Run-Off. Statistical parameters were extracted from the detailed maps in Australian Rainfall and Run-off, Volume 2. Adopted parameters are as follows: 2 i 1 = i 12 = i 72 = i 1 = i 12 = i 72 = 8.99 G = 0.21 F2 = 4.24 F50 = Times of concentration in each catchment were estimated using the Bransby-Williams equation and confirmed using estimated average stream velocities. Table J1.1.1 below details the adopted time of concentration for each catchment. Due to the extensive vegetated areas in each catchment, it is not currently anticipated that post-development times of concentration will vary from predevelopment values. Table J1.1.1 Times of Concentration Catchment Catchment length (km) Adopted time of concentration (minutes) Run-off coefficients were estimated using the methods outlined in the Queensland Urban Drainage Manual based on the respective fractions impervious of each catchment. Table J1.1.2 below details the adopted run-off coefficients (both predevelopment and post-development) for each catchment. N-B016 Page 2
296 Table J1.1.2 Fractions Impervious Catchment Catchment area (Ha) Fraction impervious Predevelopment Post-development Tables J1.1.3 to J1.1.7 below outline the existing peak surface flow rates in the various catchments. Table J1.1.3 Catchment 5 (peak flow rates from catchment to Clam Bay) Average recurrence Pre-development interval (years) peak discharge (m 3 /s) Table J1.1.4 Catchment 7 (peak flow rates to Long Beach from GKI land and catchments downstream) Average recurrence Pre-development interval (years) peak discharge (m 3 /s) Table J1.1.5 Catchment 8 (peak flow rates to Fisherman s Beach from GKI land) Average recurrence interval (years) Pre-development peak discharge (m 3 /s) N-B016 Page 3
297 Table J1.1.6 Catchment 9 (peak flow rates at the mouth of Putney Creek) Average recurrence Pre-development interval (years) peak discharge (m 3 /s) Table J1.1.7 Catchment 11 (peak flow rates at the mouth of Leeke s Creek) Average recurrence Pre-development interval (years) peak discharge (m 3 /s) J.1.2 Mitigation The analyses showed that the proposed development would potentially increase peak flow rates by amounts ranging from 0.5% (Catchment 5 Clam Bay) to 90.2% (Catchment 9 Putney Creek). The waterway stability objective of SPP 4/10 requires that a development manage flows such that the postdevelopment one-year ARI event discharge within the downstream waterway is no greater than the predevelopment peak one-year ARI event discharge. Generally, detention of surface run-off is necessary to achieve this objective. A number of areas within the development have been identified as suitable sites for detention structures. Routing analyses have been undertaken to determine preliminary sizes of detention structures to mitigate postdevelopment peak flow rates to pre-development levels. Detention structures will be low impact designs utilising relatively low grassed or vegetated mounds enclosing open space. Structures will be sited so that run-off from storm events exceeding the detention basin design event can bypass safely around the outside of the structure. Civil designs (building pads, roads, surface flow paths and piped networks) will direct run-off from catchments to the relevant detention basins. Drawing number R03 identifies approximate locations of suitable detention structures. Typical details are provided in drawing number R02. N-B016 Page 4
298 Table J1.2.1 below outlines the estimated size (volume and surface area) of each basin. The flooding has been based on a maximum basin depth (Q100) of 1.2m. The nominated basins mitigate all runoff events up to the 100 year recurrence interval (which is significantly more than is required by SPP 4/10). Catchment 8 discharges directly to the ocean at Fishermans Beach and there is no downstream waterway which might be impacted by discharge rate increases. No detention is proposed in that catchment. Table A1.2.1 Detention Basins Catchment Basin Volume (ML) Basin Surface Area (Ha) Although specific details of infrastructure layouts and the like are not yet available, the modelling shows that detention requirements to mitigate post-development peak flow rates to, or below, pre-development levels are relatively small. It is not anticipated that any siting difficulties will be identified during detailed design. Calculated mitigated post-development peak flow rates in the various catchments are outlined in Tables J1.2.2 to J1.2.6 below. Table J1.2.2 Catchment 5 (peak flow rates from catchment to Clam Bay) Average recurrence interval (years) Pre-development peak discharge (m 3 /s) Post-development peak discharge - unmitigated (m 3 /s) Post-development peak discharge - mitigated (m 3 /s) % reduction in peak flow yes yes yes yes yes yes yes No worsening achieved? Table J1.2.3 Catchment 7 (peak flow rates to Long Beach from GKI land and catchments downstream) Average recurrence Pre-development interval (years) peak discharge (m 3 /s) Post-development peak discharge - unmitigated (m 3 /s) Post-development peak discharge - mitigated (m 3 /s) % reduction in peak flow No worsening achieved? yes yes yes yes yes yes yes N-B016 Page 5
299 Table J1.2.4 Catchment 8 (peak flow rates to Fisherman s Beach from GKI land). Note that these flows are distributed over a wide beach frontage and are not concentrated at specific points. Average recurrence interval (years) Pre-development peak discharge (m 3 /s) Post-development peak discharge - unmitigated (m 3 /s) Table J1.2.5 Catchment 9 (peak flow rates at the mouth of Putney Creek) Average recurrence interval (years) Pre-development peak discharge (m 3 /s) Post-development peak discharge - unmitigated (m 3 /s) Post-development peak discharge - mitigated (m 3 /s) % reduction in peak flow yes yes yes yes yes yes yes No worsening achieved? Table J1.2.6 Catchment 11 (peak flow rates at the mouth of Leeke s Creek) Average recurrence interval (years) Pre-development peak discharge (m 3 /s) Post-development peak discharge - unmitigated (m 3 /s) Post-development peak discharge - mitigated (m 3 /s) % reduction in peak flow No worsening achieved? yes yes yes yes yes yes yes J.2 RUN-OFF VOLUMES Annual run-off volumes, and particularly the distribution of rainfall to surface flow and groundwater, have been analysed using continuous simulation analysis in the hydrologic module of MUSIC software. The algorithm adopted in MUSIC to generate runoff is based on a simplified rainfall-runoff model developed by Chiew et al. (1997). The model is described in general terms below (an extract from the MUSIC manual). All rainfall on the impervious area becomes runoff once a small storage capacity or initial loss is exceeded. The initial loss storage is emptied each day. Pervious areas are modelled using one soil moisture store and one groundwater store. Rainfall on the pervious part of the catchment is subject to infiltration, with the infiltration rate of the soil being defined as an exponential N-B016 Page 6
300 function of the soil moisture storage. The infiltration rate is at a maximum when the soil moisture store is empty, and gradually decreases to a minimum when the soil moisture store is full. Runoff from the pervious area occurs when the rainfall exceeds the infiltration rate of the soil (infiltration excess runoff) and when the soil moisture store has reached its maximum capacity (soil saturation excess runoff). Evapotranspiration is subtracted from the soil moisture store. It is dependent on the amount of water in the soil store and the areal potential evapotranspiration rate. Soil moisture recharges groundwater whenever the soil moisture store exceeds field capacity. Recharge is calculated as a constant percentage of the storage above field capacity. Baseflow from groundwater is simulated using a linear recession of the groundwater store. Table J2.1 below outlines the anticipated changes in annual run-off volumes in the various catchments as a result of the proposed development. Table J2.1 Average Annual Volumes Catchment Average annual volume to surface run-off (ML per year) Average annual volume to groundwater (ML per year) Average annual volume to evapotranspiration (ML per year) Predevelopment Average annual volume harvested from the roof water (ML per year) Predevelopment Postdevelopment Predevelopment Postdevelopment Postdevelopment Postdevelopment J.2.1 Mitigation The modelling suggests that the main impact will be increases in surface run-off and groundwater recharge volumes in some catchments. The modelling suggests that rainwater tanks capturing roof water for reuse will remove some 19 ML per annum from the volume which would otherwise become surface run-off. If necessary, additional surface storage (harvesting rainwater for irrigation purposes) or infiltration zones to direct surface stormwater run-off to groundwater could be provided. Note that these calculations ignore infiltration losses in the surface drainage and detention basin network. Given the relatively high permeability of the sandy soils on the island, it can be expected that actual surface runoff volumes discharging to the main waterways will be less than the modelling suggests. J3 FREQUENT FLOW MANAGEMENT To protect in-stream ecology of ephemeral freshwater waterways, the SPP 4/10 requires development to manage the increase in the number of small runoff events which occur from impervious surfaces compared to natural vegetated surfaces. The objective is satisfied by capturing and managing the first 10mm of runoff from impervious surfaces each day. N-B016 Page 7
301 The geotechnical testing has shown that Great Keppel Island soils are very sandy, with high permeability, typically exceeding 100mm/day. Only two of the catchments impacted by the development discharge to ephemeral freshwater streams Catchment 9 to Putney Creek, and Catchment 11 to Leeke s Creek. The proposed bio-retention and detention structures in these two catchments intercept all runoff from impervious surfaces before it reaches the respective defined waterways. In both catchments, the daily infiltration capacity of the treatment structures far exceeds the volume of the first 10mm of rainfall on the respective impervious surfaces. Table below compares the required capture and dispose volume with the infiltration capacity of the treatment structures in each catchment. The comparison amply demonstrates the capacity of the water sensitive designs proposed to manage frequent flows in accordance with the SPP. Table Frequent Flow Management - Comparison of capture and dispose volume with infiltration capacity. 9 Putney Creek 11 Leeke s Creek Catchment Total impervious area (Ha) Required daily capture and dispose volume (ML) Area of bio-retention and detention structures (Ha) Daily disposal capacity (ML) Ratio of disposal capacity to requirement Note that this tabulation is conservative as it ignores the additional infiltration of the surface drainage network. N-B016 Page 8
302 Water Cycle Management Report Great Keppel Island Resort Revitalisation Plan APPENDIX K Stormwater Quality Analysis N-B016 Page 171
303 K1. WATER QUALITY OBJECTIVES Environmental values and water quality objectives for the area are generally outlined in "Water Quality Guidelines for the Great Barrier Reef Marine Park", published by the Great Barrier Reef Marine Park Authority (2009). The Queensland Water Quality Guidelines 2009 outline trigger values for a number of physicochemical indicators for subregional coastal areas. Within that guideline, the section relevant to Great Keppel Island is that relating to the Central Coast Queensland region. Table 3.2.1b details specific regional guideline values for waters of that region within the Great Barrier Reef Marine Park. Nominated values are: Amm N: 4mg/L Oxid N: 3mg/L Particulate N: 0.020mg/L Total N: 0.140mg/L FiltR P: 6mg/L Particulate P: 28mg/L Total P: 0.020mg/L Chl-a: 045mg/L TSS: 2.0mg/L Turb: 1 NTU Secchi: 10m ph: DO: (% sat) Typically, EVs and WQOs form the basis for defining the required water quality in receiving waters. However, they are guideline or trigger values and most are not something which can be readily modelled or predicted. In recent years, significant research effort has been applied to develop modelling methods which can estimate the level of stormwater quality improvement necessary for a site to ensure that receiving water WQOs can be met and EVs protected. Currently, surface water quality modelling tools are only able to model and predict TSS, TP, TN and GP. In Queensland, available research and model development has culminated in the implementation of State Planning Policy 4/10 Healthy Waters (May 2011) and the draft "Urban Stormwater - Queensland Best Practice Environment Management Guidelines 2009". N-B016 Page 10
304 SPP 4/10 (and supporting documents) nominates specific minimum stormwater pollutant load reductions required to be met by development in areas throughout Queensland. The nominated minimums have been based on research and modelling work undertaken by number of Australian organisations. The target load reductions were derived using a "diminishing returns" analysis balancing incremental community costs against improved environmental benefits. Whilst the target load reductions are not necessarily the maximum which can possibly be achieved, they have been derived following rigorous analysis. The analysis outlined in detail below demonstrates that the methods proposed to achieve the nominated load reductions will also reduce modelled pollutant concentrations in run-off below those which presently exist. Adopting predictive modelling techniques to quantify estimates of stormwater pollutant concentrations and loads from urban land surfaces, and the pollutant removal efficacy of current best practice stormwater treatment infrastructure is now an accepted method for establishing best practice stormwater management complying with SPP 4/10. K2. ANALYSIS METHODS Surface water quality impacts have been examined using MUSIC modelling software to quantify stormwater pollutant concentrations and average annual loads and to assess and establish appropriate stormwater management methods. MUSIC is state of the art modelling software, widely adopted in the industry and well accepted by assessing authorities. Design stormwater quality improvement objectives were taken from the draft Queensland Best Practice Environmental Management Guidelines (Table 2.1b). For the relevant region (Central Coast South), minimum target reductions in mean annual loads for the modelled pollutants are as follows: suspended solids (TSS) - 85% total phosphorus (TP) - 70% total nitrogen (TN) - 45% gross pollutants (GP) - 90%. K3. MODEL NETWORK Subcatchment details are available in Tables K5.1 and K5.2. These should be read together with Drawing R01. K4. MODEL PARAMETERS K4.1 Meteorological data from the Bureau of Meteorology recording station nearest the site (39083 Rockhampton) has been used. The rainfall data sequence adopted is that required by the Urban Stormwater Queensland Best Practice Environmental Management Guidelines 2009 ( at 6 minute time steps). N-B016 Page 11
305 K4.2 Evapotranspiration data for Great Keppel Island was obtained from the Bureau of Meteorology. The following table outlines the evapotranspiration data adopted for the MUSIC model. Table K4.2.1 Evapotranspiration Data Month Jan Feb Mar Apr May Jun Jul Aug Sep Oct Nov Dec Evapotranspiration (mm/month) K4.3 Soil characteristics were calibrated for the soils present at Great Keppel Island. The calibration was undertaken using MUSIC calibration based on soil conditions by Andrew Macleod. The following soil characteristics were adopted from the technical paper for a sandy soil texture and included in the MUSIC model. Table K4.3.1 Soil Characteristics Soil Characteristic Calibrated Input Soil Storage Capacity 175 mm Field Capacity 75 mm Infiltration Capacity Coefficient - a 200 Infiltration Capacity Exponent - b 0.5 Initial Depth 50 mm Daily Recharge Rate 75% Daily Baseflow Rate 50% Daily Deep Seepage Rate 0% K4.4 Where rainwater tanks are provided, toilet flush was estimated using the MUSIC Modelling Guidelines for South East Queensland. The facilities were assumed to incorporate full water saving devices with the following water usage: 25L per person per day; and a seven day week. The following shows the daily number of staff, patrons and guests used in the toilet flush estimation: Eco Villas 938 staff, patrons and guests K4.5 Landscape usage was estimated using the Brisbane City Council Landscape Irrigation Design Guideline. K4.6 Model parameters for source node pollutant generation and treatment node characteristics were taken directly from the appropriate sections of the MUSIC modelling Guidelines without modification. The parameters recommended in the guideline originated from testing of stormwater run-off sampled in "normal" mainland urban areas. Since Great Keppel Island has no nearby industry and few hydrocarbon powered vehicles (which are the main sources of airborne pollution in mainland urban areas) these pollutant generation parameters will be very conservative for the Great Keppel Island MUSIC model. N-B016 Page 12
306 It is likely therefore that stormwater quality modelling (particularly that of pollutant concentrations) will predict higher values than those which will actually occur. K4.7 Specific parameters used in the "developed" model scenario are summarised in Table K4.7.1 below. Table K4.7.1 MUSIC node parameters (developed scenario) Catchment Roads 2 Catchment Name: Rainfall Station: ET Station: Start Date: End Date: Modelling Time Step: Total Area (ha): Impervious (%): Rainfall Threshold (mm/day): Soil Storage Capacity (mm): Initial Storage (% of Capacity): Field Capacity (mm): Infiltration Capacity Coeff. a: Infiltration Capacity Exp. b: Initial Depth (mm): Daily Recharge Rate (%): Daily Baseflow Rate (%): Daily Deep Seepage Rate (%): Base Flow Conc. Parameters TSS TP TN N-B016 GKI Resort Developed ROCKHAMPTON User-defined monthly PET 01/01/ :00 AM 01/12/ :54 PM 6 Minutes Stormflow Conc. Parameters TSS TP TN N-B016 Page 13
307 Roads 3 Total Area (ha): Impervious (%): Rainfall Threshold (mm/day): Soil Storage Capacity (mm): Initial Storage (% of Capacity): Field Capacity (mm): Infiltration Capacity Coeff. a: Infiltration Capacity Exp. b: Initial Depth (mm): Daily Recharge Rate (%): Daily Baseflow Rate (%): Daily Deep Seepage Rate (%): Base Flow Conc. Parameters TSS TP TN Roads 4 Stormflow Conc. Parameters TSS TP TN Total Area (ha): Impervious (%): Rainfall Threshold (mm/day): Soil Storage Capacity (mm): Initial Storage (% of Capacity): Field Capacity (mm): Infiltration Capacity Coeff. a: Infiltration Capacity Exp. b: Initial Depth (mm): Daily Recharge Rate (%): Daily Baseflow Rate (%): Daily Deep Seepage Rate (%): Base Flow Conc. Parameters N-B016 Page 14
308 TSS TP TN Roads 5 Stormflow Conc. Parameters TSS TP TN Total Area (ha): Impervious (%): Rainfall Threshold (mm/day): Soil Storage Capacity (mm): Initial Storage (% of Capacity): Field Capacity (mm): Infiltration Capacity Coeff. a: Infiltration Capacity Exp. b: Initial Depth (mm): Daily Recharge Rate (%): Daily Baseflow Rate (%): Daily Deep Seepage Rate (%): Base Flow Conc. Parameters TSS TP TN N-B016 Page 15
309 Roads 7 Stormflow Conc. Parameters TSS TP TN Total Area (ha): Impervious (%): Rainfall Threshold (mm/day): Soil Storage Capacity (mm): Initial Storage (% of Capacity): Field Capacity (mm): Infiltration Capacity Coeff. a: Infiltration Capacity Exp. b: Initial Depth (mm): Daily Recharge Rate (%): Daily Baseflow Rate (%): Daily Deep Seepage Rate (%): Base Flow Conc. Parameters TSS TP TN Stormflow Conc. Parameters TSS TP N-B016 Page 16
310 Roads 8 GKI Land TN Total Area (ha): Impervious (%): Rainfall Threshold (mm/day): Soil Storage Capacity (mm): Initial Storage (% of Capacity): Field Capacity (mm): Infiltration Capacity Coeff. a: Infiltration Capacity Exp. b: Initial Depth (mm): Daily Recharge Rate (%): Daily Baseflow Rate (%): Daily Deep Seepage Rate (%): Base Flow Conc. Parameters TSS TP TN Roads 8 Other Land Stormflow Conc. Parameters TSS TP TN Total Area (ha): Impervious (%): Rainfall Threshold (mm/day): Soil Storage Capacity (mm): Initial Storage (% of Capacity): Field Capacity (mm): N-B016 Page 17
311 Infiltration Capacity Coeff. a: Infiltration Capacity Exp. b: Initial Depth (mm): Daily Recharge Rate (%): Daily Baseflow Rate (%): Daily Deep Seepage Rate (%): Base Flow Conc. Parameters TSS TP TN Roads 9 GKI Land Stormflow Conc. Parameters TSS TP TN Total Area (ha): Impervious (%): Rainfall Threshold (mm/day): Soil Storage Capacity (mm): Initial Storage (% of Capacity): Field Capacity (mm): Infiltration Capacity Coeff. a: Infiltration Capacity Exp. b: Initial Depth (mm): Daily Recharge Rate (%): Daily Baseflow Rate (%): Daily Deep Seepage Rate (%): Base Flow Conc. Parameters TSS TP N-B016 Page 18
312 TN Roads 9 Other Land Stormflow Conc. Parameters TSS TP TN Total Area (ha): Impervious (%): Rainfall Threshold (mm/day): Soil Storage Capacity (mm): Initial Storage (% of Capacity): Field Capacity (mm): Infiltration Capacity Coeff. a: Infiltration Capacity Exp. b: Initial Depth (mm): Daily Recharge Rate (%): Daily Baseflow Rate (%): Daily Deep Seepage Rate (%): Base Flow Conc. Parameters TSS TP TN Stormflow Conc. Parameters TSS N-B016 Page 19
313 Roads 11 TP TN Total Area (ha): Impervious (%): Rainfall Threshold (mm/day): Soil Storage Capacity (mm): Initial Storage (% of Capacity): Field Capacity (mm): Infiltration Capacity Coeff. a: Infiltration Capacity Exp. b: Initial Depth (mm): Daily Recharge Rate (%): Daily Baseflow Rate (%): Daily Deep Seepage Rate (%): Base Flow Conc. Parameters TSS TP TN Stormflow Conc. Parameters TSS TP TN N-B016 Page 20
314 Roads 14 Total Area (ha): Impervious (%): Rainfall Threshold (mm/day): Soil Storage Capacity (mm): Initial Storage (% of Capacity): Field Capacity (mm): Infiltration Capacity Coeff. a: Infiltration Capacity Exp. b: Initial Depth (mm): Daily Recharge Rate (%): Daily Baseflow Rate (%): Daily Deep Seepage Rate (%): Base Flow Conc. Parameters TSS TP TN Pervious Ground 5 Stormflow Conc. Parameters TSS TP TN Total Area (ha): Impervious (%): Rainfall Threshold (mm/day): Soil Storage Capacity (mm): Initial Storage (% of Capacity): Field Capacity (mm): Infiltration Capacity Coeff. a: Infiltration Capacity Exp. b: Initial Depth (mm): Daily Recharge Rate (%): Daily Baseflow Rate (%): Daily Deep Seepage Rate (%): N-B016 Page 21
315 Base Flow Conc. Parameters TSS TP TN Pervious Ground 7 Stormflow Conc. Parameters TSS TP TN Total Area (ha): Impervious (%): Rainfall Threshold (mm/day): Soil Storage Capacity (mm): Initial Storage (% of Capacity): Field Capacity (mm): Infiltration Capacity Coeff. a: Infiltration Capacity Exp. b: Initial Depth (mm): Daily Recharge Rate (%): Daily Baseflow Rate (%): Daily Deep Seepage Rate (%): Base Flow Conc. Parameters TSS TP TN N-B016 Page 22
316 0.39 Pervious Ground 8 GKI Land Stormflow Conc. Parameters TSS TP TN Total Area (ha): Impervious (%): Rainfall Threshold (mm/day): Soil Storage Capacity (mm): Initial Storage (% of Capacity): Field Capacity (mm): Infiltration Capacity Coeff. a: Infiltration Capacity Exp. b: Initial Depth (mm): Daily Recharge Rate (%): Daily Baseflow Rate (%): Daily Deep Seepage Rate (%): Base Flow Conc. Parameters TSS TP TN Stormflow Conc. Parameters TSS TP N-B016 Page 23
317 Pervious Ground 8 Other Land TN Total Area (ha): Impervious (%): Rainfall Threshold (mm/day): Soil Storage Capacity (mm): Initial Storage (% of Capacity): Field Capacity (mm): Infiltration Capacity Coeff. a: Infiltration Capacity Exp. b: Initial Depth (mm): Daily Recharge Rate (%): Daily Baseflow Rate (%): Daily Deep Seepage Rate (%): Base Flow Conc. Parameters TSS TP TN Pervious Ground 9 GKI Land Stormflow Conc. Parameters TSS TP TN Total Area (ha): Impervious (%): Rainfall Threshold (mm/day): Soil Storage Capacity (mm): Initial Storage (% of Capacity): N-B016 Page 24
318 Field Capacity (mm): Infiltration Capacity Coeff. a: Infiltration Capacity Exp. b: Initial Depth (mm): Daily Recharge Rate (%): Daily Baseflow Rate (%): Daily Deep Seepage Rate (%): Base Flow Conc. Parameters TSS TP TN Pervious Ground 9 Other Land Stormflow Conc. Parameters TSS TP TN Total Area (ha): Impervious (%): Rainfall Threshold (mm/day): Soil Storage Capacity (mm): Initial Storage (% of Capacity): Field Capacity (mm): Infiltration Capacity Coeff. a: Infiltration Capacity Exp. b: Initial Depth (mm): Daily Recharge Rate (%): Daily Baseflow Rate (%): Daily Deep Seepage Rate (%): Base Flow Conc. Parameters TSS N-B016 Page 25
319 TP TN Pervious Ground 11 Stormflow Conc. Parameters TSS TP TN Total Area (ha): Impervious (%): Rainfall Threshold (mm/day): Soil Storage Capacity (mm): Initial Storage (% of Capacity): Field Capacity (mm): Infiltration Capacity Coeff. a: Infiltration Capacity Exp. b: Initial Depth (mm): Daily Recharge Rate (%): Daily Baseflow Rate (%): Daily Deep Seepage Rate (%): Base Flow Conc. Parameters TSS TP TN Stormflow Conc. Parameters N-B016 Page 26
320 Impervious Ground 9 GKI Land TSS TP TN Total Area (ha): Impervious (%): Rainfall Threshold (mm/day): Soil Storage Capacity (mm): Initial Storage (% of Capacity): Field Capacity (mm): Infiltration Capacity Coeff. a: Infiltration Capacity Exp. b: Initial Depth (mm): Daily Recharge Rate (%): Daily Baseflow Rate (%): Daily Deep Seepage Rate (%): Base Flow Conc. Parameters TSS TP TN Stormflow Conc. Parameters TSS TP TN N-B016 Page 27
321 Roof Not Tanked 3 Total Area (ha): Impervious (%): Rainfall Threshold (mm/day): Soil Storage Capacity (mm): Initial Storage (% of Capacity): Field Capacity (mm): Infiltration Capacity Coeff. a: Infiltration Capacity Exp. b: Initial Depth (mm): Daily Recharge Rate (%): Daily Baseflow Rate (%): Daily Deep Seepage Rate (%): Base Flow Conc. Parameters TSS TP TN Stormflow Conc. Parameters TSS TP TN N-B016 Page 28
322 Roof Tanked 5 Total Area (ha): Impervious (%): Rainfall Threshold (mm/day): Soil Storage Capacity (mm): Initial Storage (% of Capacity): Field Capacity (mm): Infiltration Capacity Coeff. a: Infiltration Capacity Exp. b: Initial Depth (mm): Daily Recharge Rate (%): Daily Baseflow Rate (%): Daily Deep Seepage Rate (%): Base Flow Conc. Parameters TSS TP TN Roof Tanked 7 Stormflow Conc. Parameters TSS TP TN Total Area (ha): Impervious (%): Rainfall Threshold (mm/day): Soil Storage Capacity (mm): Initial Storage (% of Capacity): Field Capacity (mm): Infiltration Capacity Coeff. a: Infiltration Capacity Exp. b: Initial Depth (mm): Daily Recharge Rate (%): Daily Baseflow Rate (%): Daily Deep Seepage Rate (%): Base Flow Conc. Parameters N-B016 Page 29
323 TSS TP TN Roof Tanked 8 GKI Land Stormflow Conc. Parameters TSS TP TN Total Area (ha): Impervious (%): Rainfall Threshold (mm/day): Soil Storage Capacity (mm): Initial Storage (% of Capacity): Field Capacity (mm): Infiltration Capacity Coeff. a: Infiltration Capacity Exp. b: Initial Depth (mm): Daily Recharge Rate (%): Daily Baseflow Rate (%): Daily Deep Seepage Rate (%): Base Flow Conc. Parameters TSS TP TN N-B016 Page 30
324 Roof Not Tanked 8 GKI Land Stormflow Conc. Parameters TSS TP TN Total Area (ha): Impervious (%): Rainfall Threshold (mm/day): Soil Storage Capacity (mm): Initial Storage (% of Capacity): Field Capacity (mm): Infiltration Capacity Coeff. a: Infiltration Capacity Exp. b: Initial Depth (mm): Daily Recharge Rate (%): Daily Baseflow Rate (%): Daily Deep Seepage Rate (%): Base Flow Conc. Parameters TSS TP TN Stormflow Conc. Parameters TSS TP N-B016 Page 31
325 Roof Tanked 8 Other Land TN Total Area (ha): Impervious (%): Rainfall Threshold (mm/day): Soil Storage Capacity (mm): Initial Storage (% of Capacity): Field Capacity (mm): Infiltration Capacity Coeff. a: Infiltration Capacity Exp. b: Initial Depth (mm): Daily Recharge Rate (%): Daily Baseflow Rate (%): Daily Deep Seepage Rate (%): Base Flow Conc. Parameters TSS TP TN Stormflow Conc. Parameters TSS TP TN N-B016 Page 32
326 Roof Tanked 9 GKI Land Total Area (ha): Impervious (%): Rainfall Threshold (mm/day): Soil Storage Capacity (mm): Initial Storage (% of Capacity): Field Capacity (mm): Infiltration Capacity Coeff. a: Infiltration Capacity Exp. b: Initial Depth (mm): Daily Recharge Rate (%): Daily Baseflow Rate (%): Daily Deep Seepage Rate (%): Base Flow Conc. Parameters TSS TP TN Roof Not Tanked 9 GKI Land Stormflow Conc. Parameters TSS TP TN Total Area (ha): Impervious (%): Rainfall Threshold (mm/day): Soil Storage Capacity (mm): Initial Storage (% of Capacity): Field Capacity (mm): Infiltration Capacity Coeff. a: Infiltration Capacity Exp. b: Initial Depth (mm): Daily Recharge Rate (%): Daily Baseflow Rate (%): Daily Deep Seepage Rate (%): Base Flow Conc. Parameters N-B016 Page 33
327 TSS TP TN Roof Tanked 9 Other Land Stormflow Conc. Parameters TSS TP TN Total Area (ha): Impervious (%): Rainfall Threshold (mm/day): Soil Storage Capacity (mm): Initial Storage (% of Capacity): Field Capacity (mm): Infiltration Capacity Coeff. a: Infiltration Capacity Exp. b: Initial Depth (mm): Daily Recharge Rate (%): Daily Baseflow Rate (%): Daily Deep Seepage Rate (%): Base Flow Conc. Parameters TSS TP TN N-B016 Page 34
328 Roof Tanked 11 Stormflow Conc. Parameters TSS TP TN Total Area (ha): Impervious (%): Rainfall Threshold (mm/day): Soil Storage Capacity (mm): Initial Storage (% of Capacity): Field Capacity (mm): Infiltration Capacity Coeff. a: Infiltration Capacity Exp. b: Initial Depth (mm): Daily Recharge Rate (%): Daily Baseflow Rate (%): Daily Deep Seepage Rate (%): Base Flow Conc. Parameters TSS TP TN Stormflow Conc. Parameters TSS TP N-B016 Page 35
329 Roof Not Tanked 11 TN Total Area (ha): Impervious (%): Rainfall Threshold (mm/day): Soil Storage Capacity (mm): Initial Storage (% of Capacity): Field Capacity (mm): Infiltration Capacity Coeff. a: Infiltration Capacity Exp. b: Initial Depth (mm): Daily Recharge Rate (%): Daily Baseflow Rate (%): Daily Deep Seepage Rate (%): Base Flow Conc. Parameters TSS TP TN Stormflow Conc. Parameters TSS TP TN N-B016 Page 36
330 Roof Not Tanked 14 Total Area (ha): Impervious (%): Rainfall Threshold (mm/day): Soil Storage Capacity (mm): Initial Storage (% of Capacity): Field Capacity (mm): Infiltration Capacity Coeff. a: Infiltration Capacity Exp. b: Initial Depth (mm): Daily Recharge Rate (%): Daily Baseflow Rate (%): Daily Deep Seepage Rate (%): Base Flow Conc. Parameters TSS TP TN Ocean 14 Stormflow Conc. Parameters TSS TP TN Total Area (ha): Impervious (%): Rainfall Threshold (mm/day): Soil Storage Capacity (mm): Initial Storage (% of Capacity): Field Capacity (mm): Infiltration Capacity Coeff. a: Infiltration Capacity Exp. b: Initial Depth (mm): Daily Recharge Rate (%): Daily Baseflow Rate (%): Daily Deep Seepage Rate (%): Base Flow Conc. Parameters N-B016 Page 37
331 TSS TP TN Rainwater Tank 5 Rainwater Tank 7 Stormflow Conc. Parameters TSS TP TN Low Flow Bypass (m3/sec): High Flow Bypass (m3/sec): Volume Below Overflow (kl): Depth Above Overflow (m): Surface Area (m2): Overflow Pipe Diameter (mm): Use Stored Water: Annual Demand (kl/yr) scaled by daily (PET Rain): Daily Demand (kl/day): Orifice Discharge Coeff.: Number of CSTR Cells: TSS k (m/yr): TSS C* (mg/l): TP k (m/yr): TP C* (mg/l): TN k (m/yr): TN C* (mg/l): Low Flow Bypass (m3/sec): High Flow Bypass (m3/sec): Volume Below Overflow (kl): Depth Above Overflow (m): Surface Area (m2): Overflow Pipe Diameter (mm): Use Stored Water: Annual Demand (kl/yr) scaled by daily (PET Yes Yes N-B016 Page 38
332 Rainwater Tank 8 Rainwater Tank 9 Rainwater Tank 11 Rain): Daily Demand (kl/day): Orifice Discharge Coeff.: Number of CSTR Cells: TSS k (m/yr): TSS C* (mg/l): TP k (m/yr): TP C* (mg/l): TN k (m/yr): TN C* (mg/l): Low Flow Bypass (m3/sec): High Flow Bypass (m3/sec): Volume Below Overflow (kl): Depth Above Overflow (m): Surface Area (m2): Overflow Pipe Diameter (mm): Use Stored Water: Annual Demand (kl/yr) scaled by daily (PET Rain): Daily Demand (kl/day): Orifice Discharge Coeff.: Number of CSTR Cells: TSS k (m/yr): TSS C* (mg/l): TP k (m/yr): TP C* (mg/l): TN k (m/yr): TN C* (mg/l): Low Flow Bypass (m3/sec): High Flow Bypass (m3/sec): Volume Below Overflow (kl): Depth Above Overflow (m): Surface Area (m2): Overflow Pipe Diameter (mm): Use Stored Water: Annual Demand (kl/yr) scaled by daily (PET Rain): Daily Demand (kl/day): Orifice Discharge Coeff.: Number of CSTR Cells: TSS k (m/yr): TSS C* (mg/l): TP k (m/yr): TP C* (mg/l): TN k (m/yr): TN C* (mg/l): Low Flow Bypass (m3/sec): High Flow Bypass (m3/sec): Volume Below Overflow (kl): Depth Above Overflow (m): Surface Area (m2): Overflow Pipe Diameter (mm): Use Stored Water: Annual Demand (kl/yr) scaled by daily (PET Rain): Daily Demand (kl/day): Orifice Discharge Coeff.: Number of CSTR Cells: TSS k (m/yr): Yes Yes Yes N-B016 Page 39
333 Bioretention 5 Bioretention 5A TSS C* (mg/l): TP k (m/yr): TP C* (mg/l): TN k (m/yr): TN C* (mg/l): Low Flow Bypass (m3/sec): High Flow Bypass (m3/sec): Extended Detention Depth (m): Surface Area (m2): Filter Area (m2): Unlined Filter Media Perimeter (m): Filter Depth (m): TN Content of Filter Media (mg/kg): Sat. Hydraulic Con. (mm/hr): Proportion of Organic Material in Filter (%): Orthophosphate Content of Filter Media (mg/kg): Is basin lined? Vegetated with effective nutrient removal plants? Overflow Weir Width (m): Underdrain Present: Submerged Zone With Carbon Present: Submerged Zone Depth (m): Exfiltration Rate (mm/hr): Weir Coefficient: Voids Ratio: Number of CSTR Cells: TSS k (m/yr): TSS C* (mg/l): TP k (m/yr): TP C* (mg/l): TN k (m/yr): TN C* (mg/l): Low Flow Bypass (m3/sec): High Flow Bypass (m3/sec): Extended Detention Depth (m): Surface Area (m2): Filter Area (m2): Unlined Filter Media Perimeter (m): Filter Depth (m): TN Content of Filter Media (mg/kg): Sat. Hydraulic Con. (mm/hr): Proportion of Organic Material in Filter (%): Orthophosphate Content of Filter Media (mg/kg): Is basin lined? Vegetated with effective nutrient removal plants? Overflow Weir Width (m): Underdrain Present: Submerged Zone With Carbon Present: Submerged Zone Depth (m): Exfiltration Rate (mm/hr): Weir Coefficient: Voids Ratio: Number of CSTR Cells: TSS k (m/yr): TSS C* (mg/l): <5% <55 No Yes 2.49 No Yes <5% <55 No Yes 3.20 No Yes N-B016 Page 40
334 Bioretention 5B Bioretention 7 TP k (m/yr): TP C* (mg/l): TN k (m/yr): TN C* (mg/l): Low Flow Bypass (m3/sec): High Flow Bypass (m3/sec): Extended Detention Depth (m): Surface Area (m2): Filter Area (m2): Unlined Filter Media Perimeter (m): Filter Depth (m): TN Content of Filter Media (mg/kg): Sat. Hydraulic Con. (mm/hr): Proportion of Organic Material in Filter (%): Orthophosphate Content of Filter Media (mg/kg): Is basin lined? Vegetated with effective nutrient removal plants? Overflow Weir Width (m): Underdrain Present: Submerged Zone With Carbon Present: Submerged Zone Depth (m): Exfiltration Rate (mm/hr): Weir Coefficient: Voids Ratio: Number of CSTR Cells: TSS k (m/yr): TSS C* (mg/l): TP k (m/yr): TP C* (mg/l): TN k (m/yr): TN C* (mg/l): Low Flow Bypass (m3/sec): High Flow Bypass (m3/sec): Extended Detention Depth (m): Surface Area (m2): Filter Area (m2): Unlined Filter Media Perimeter (m): Filter Depth (m): TN Content of Filter Media (mg/kg): Sat. Hydraulic Con. (mm/hr): Proportion of Organic Material in Filter (%): Orthophosphate Content of Filter Media (mg/kg): Is basin lined? Vegetated with effective nutrient removal plants? Overflow Weir Width (m): Underdrain Present: Submerged Zone With Carbon Present: Submerged Zone Depth (m): Exfiltration Rate (mm/hr): Weir Coefficient: Voids Ratio: Number of CSTR Cells: TSS k (m/yr): TSS C* (mg/l): TP k (m/yr): <5% <55 No Yes No Yes <5% <55 No Yes No Yes N-B016 Page 41
335 Bioretention 7A Bioretention 7B TP C* (mg/l): TN k (m/yr): TN C* (mg/l): Low Flow Bypass (m3/sec): High Flow Bypass (m3/sec): Extended Detention Depth (m): Surface Area (m2): Filter Area (m2): Unlined Filter Media Perimeter (m): Filter Depth (m): TN Content of Filter Media (mg/kg): Sat. Hydraulic Con. (mm/hr): Proportion of Organic Material in Filter (%): Orthophosphate Content of Filter Media (mg/kg): Is basin lined? Vegetated with effective nutrient removal plants? Overflow Weir Width (m): Underdrain Present: Submerged Zone With Carbon Present: Submerged Zone Depth (m): Exfiltration Rate (mm/hr): Weir Coefficient: Voids Ratio: Number of CSTR Cells: TSS k (m/yr): TSS C* (mg/l): TP k (m/yr): TP C* (mg/l): TN k (m/yr): TN C* (mg/l): Low Flow Bypass (m3/sec): High Flow Bypass (m3/sec): Extended Detention Depth (m): Surface Area (m2): Filter Area (m2): Unlined Filter Media Perimeter (m): Filter Depth (m): TN Content of Filter Media (mg/kg): Sat. Hydraulic Con. (mm/hr): Proportion of Organic Material in Filter (%): Orthophosphate Content of Filter Media (mg/kg): Is basin lined? Vegetated with effective nutrient removal plants? Overflow Weir Width (m): Underdrain Present: Submerged Zone With Carbon Present: Submerged Zone Depth (m): Exfiltration Rate (mm/hr): Weir Coefficient: Voids Ratio: Number of CSTR Cells: TSS k (m/yr): TSS C* (mg/l): TP k (m/yr): TP C* (mg/l): <5% <55 No Yes No Yes <5% <55 No Yes No Yes N-B016 Page 42
336 Bioretention 8 Bioretention 8A TN k (m/yr): TN C* (mg/l): Low Flow Bypass (m3/sec): High Flow Bypass (m3/sec): Extended Detention Depth (m): Surface Area (m2): Filter Area (m2): Unlined Filter Media Perimeter (m): Filter Depth (m): TN Content of Filter Media (mg/kg): Sat. Hydraulic Con. (mm/hr): Proportion of Organic Material in Filter (%): Orthophosphate Content of Filter Media (mg/kg): Is basin lined? Vegetated with effective nutrient removal plants? Overflow Weir Width (m): Underdrain Present: Submerged Zone With Carbon Present: Submerged Zone Depth (m): Exfiltration Rate (mm/hr): Weir Coefficient: Voids Ratio: Number of CSTR Cells: TSS k (m/yr): TSS C* (mg/l): TP k (m/yr): TP C* (mg/l): TN k (m/yr): TN C* (mg/l): Low Flow Bypass (m3/sec): High Flow Bypass (m3/sec): Extended Detention Depth (m): Surface Area (m2): Filter Area (m2): Unlined Filter Media Perimeter (m): Filter Depth (m): TN Content of Filter Media (mg/kg): Sat. Hydraulic Con. (mm/hr): Proportion of Organic Material in Filter (%): Orthophosphate Content of Filter Media (mg/kg): Is basin lined? Vegetated with effective nutrient removal plants? Overflow Weir Width (m): Underdrain Present: Submerged Zone With Carbon Present: Submerged Zone Depth (m): Exfiltration Rate (mm/hr): Weir Coefficient: Voids Ratio: Number of CSTR Cells: TSS k (m/yr): TSS C* (mg/l): TP k (m/yr): TP C* (mg/l): TN k (m/yr): <5% <55 No Yes No Yes <5% <55 No Yes No Yes N-B016 Page 43
337 Bioretention 8B Bioretention 9 TN C* (mg/l): Low Flow Bypass (m3/sec): High Flow Bypass (m3/sec): Extended Detention Depth (m): Surface Area (m2): Filter Area (m2): Unlined Filter Media Perimeter (m): Filter Depth (m): TN Content of Filter Media (mg/kg): Sat. Hydraulic Con. (mm/hr): Proportion of Organic Material in Filter (%): Orthophosphate Content of Filter Media (mg/kg): Is basin lined? Vegetated with effective nutrient removal plants? Overflow Weir Width (m): Underdrain Present: Submerged Zone With Carbon Present: Submerged Zone Depth (m): Exfiltration Rate (mm/hr): Weir Coefficient: Voids Ratio: Number of CSTR Cells: TSS k (m/yr): TSS C* (mg/l): TP k (m/yr): TP C* (mg/l): TN k (m/yr): TN C* (mg/l): Low Flow Bypass (m3/sec): High Flow Bypass (m3/sec): Extended Detention Depth (m): Surface Area (m2): Filter Area (m2): Unlined Filter Media Perimeter (m): Filter Depth (m): TN Content of Filter Media (mg/kg): Sat. Hydraulic Con. (mm/hr): Proportion of Organic Material in Filter (%): Orthophosphate Content of Filter Media (mg/kg): Is basin lined? Vegetated with effective nutrient removal plants? Overflow Weir Width (m): Underdrain Present: Submerged Zone With Carbon Present: Submerged Zone Depth (m): Exfiltration Rate (mm/hr): Weir Coefficient: Voids Ratio: Number of CSTR Cells: TSS k (m/yr): TSS C* (mg/l): TP k (m/yr): TP C* (mg/l): TN k (m/yr): TN C* (mg/l): <5% <55 No Yes No Yes <5% <55 No Yes No Yes N-B016 Page 44
338 Bioretention 9A Bioretention 9B Low Flow Bypass (m3/sec): High Flow Bypass (m3/sec): Extended Detention Depth (m): Surface Area (m2): Filter Area (m2): Unlined Filter Media Perimeter (m): Filter Depth (m): TN Content of Filter Media (mg/kg): Sat. Hydraulic Con. (mm/hr): Proportion of Organic Material in Filter (%): Orthophosphate Content of Filter Media (mg/kg): Is basin lined? Vegetated with effective nutrient removal plants? Overflow Weir Width (m): Underdrain Present: Submerged Zone With Carbon Present: Submerged Zone Depth (m): Exfiltration Rate (mm/hr): Weir Coefficient: Voids Ratio: Number of CSTR Cells: TSS k (m/yr): TSS C* (mg/l): TP k (m/yr): TP C* (mg/l): TN k (m/yr): TN C* (mg/l): Low Flow Bypass (m3/sec): High Flow Bypass (m3/sec): Extended Detention Depth (m): Surface Area (m2): Filter Area (m2): Unlined Filter Media Perimeter (m): Filter Depth (m): TN Content of Filter Media (mg/kg): Sat. Hydraulic Con. (mm/hr): Proportion of Organic Material in Filter (%): Orthophosphate Content of Filter Media (mg/kg): Is basin lined? Vegetated with effective nutrient removal plants? Overflow Weir Width (m): Underdrain Present: Submerged Zone With Carbon Present: Submerged Zone Depth (m): Exfiltration Rate (mm/hr): Weir Coefficient: Voids Ratio: Number of CSTR Cells: TSS k (m/yr): TSS C* (mg/l): TP k (m/yr): TP C* (mg/l): TN k (m/yr): TN C* (mg/l): <5% <55 No Yes No Yes <5% <55 No Yes No Yes Bioretention 9C Low Flow Bypass (m3/sec): 0 N-B016 Page 45
339 Bioretention 11 Bioretention 11A High Flow Bypass (m3/sec): Extended Detention Depth (m): Surface Area (m2): Filter Area (m2): Unlined Filter Media Perimeter (m): Filter Depth (m): TN Content of Filter Media (mg/kg): Sat. Hydraulic Con. (mm/hr): Proportion of Organic Material in Filter (%): Orthophosphate Content of Filter Media (mg/kg): Is basin lined? Vegetated with effective nutrient removal plants? Overflow Weir Width (m): Underdrain Present: Submerged Zone With Carbon Present: Submerged Zone Depth (m): Exfiltration Rate (mm/hr): Weir Coefficient: Voids Ratio: Number of CSTR Cells: TSS k (m/yr): TSS C* (mg/l): TP k (m/yr): TP C* (mg/l): TN k (m/yr): TN C* (mg/l): Low Flow Bypass (m3/sec): High Flow Bypass (m3/sec): Extended Detention Depth (m): Surface Area (m2): Filter Area (m2): Unlined Filter Media Perimeter (m): Filter Depth (m): TN Content of Filter Media (mg/kg): Sat. Hydraulic Con. (mm/hr): Proportion of Organic Material in Filter (%): Orthophosphate Content of Filter Media (mg/kg): Is basin lined? Vegetated with effective nutrient removal plants? Overflow Weir Width (m): Underdrain Present: Submerged Zone With Carbon Present: Submerged Zone Depth (m): Exfiltration Rate (mm/hr): Weir Coefficient: Voids Ratio: Number of CSTR Cells: TSS k (m/yr): TSS C* (mg/l): TP k (m/yr): TP C* (mg/l): TN k (m/yr): TN C* (mg/l): Low Flow Bypass (m3/sec): High Flow Bypass (m3/sec): <5% <55 No Yes 36 No Yes <5% <55 No Yes No Yes N-B016 Page 46
340 Bioretention 11B Bioretention 14 Extended Detention Depth (m): Surface Area (m2): Filter Area (m2): Unlined Filter Media Perimeter (m): Filter Depth (m): TN Content of Filter Media (mg/kg): Sat. Hydraulic Con. (mm/hr): Proportion of Organic Material in Filter (%): Orthophosphate Content of Filter Media (mg/kg): Is basin lined? Vegetated with effective nutrient removal plants? Overflow Weir Width (m): Underdrain Present: Submerged Zone With Carbon Present: Submerged Zone Depth (m): Exfiltration Rate (mm/hr): Weir Coefficient: Voids Ratio: Number of CSTR Cells: TSS k (m/yr): TSS C* (mg/l): TP k (m/yr): TP C* (mg/l): TN k (m/yr): TN C* (mg/l): Low Flow Bypass (m3/sec): High Flow Bypass (m3/sec): Extended Detention Depth (m): Surface Area (m2): Filter Area (m2): Unlined Filter Media Perimeter (m): Filter Depth (m): TN Content of Filter Media (mg/kg): Sat. Hydraulic Con. (mm/hr): Proportion of Organic Material in Filter (%): Orthophosphate Content of Filter Media (mg/kg): Is basin lined? Vegetated with effective nutrient removal plants? Overflow Weir Width (m): Underdrain Present: Submerged Zone With Carbon Present: Submerged Zone Depth (m): Exfiltration Rate (mm/hr): Weir Coefficient: Voids Ratio: Number of CSTR Cells: TSS k (m/yr): TSS C* (mg/l): TP k (m/yr): TP C* (mg/l): TN k (m/yr): TN C* (mg/l): Low Flow Bypass (m3/sec): High Flow Bypass (m3/sec): Extended Detention Depth (m): <5% <55 No Yes No Yes <5% <55 No Yes No Yes N-B016 Page 47
341 Bioretention 14A Bioretention 14B Surface Area (m2): Filter Area (m2): Unlined Filter Media Perimeter (m): Filter Depth (m): TN Content of Filter Media (mg/kg): Sat. Hydraulic Con. (mm/hr): Proportion of Organic Material in Filter (%): Orthophosphate Content of Filter Media (mg/kg): Is basin lined? Vegetated with effective nutrient removal plants? Overflow Weir Width (m): Underdrain Present: Submerged Zone With Carbon Present: Submerged Zone Depth (m): Exfiltration Rate (mm/hr): Weir Coefficient: Voids Ratio: Number of CSTR Cells: TSS k (m/yr): TSS C* (mg/l): TP k (m/yr): TP C* (mg/l): TN k (m/yr): TN C* (mg/l): Low Flow Bypass (m3/sec): High Flow Bypass (m3/sec): Extended Detention Depth (m): Surface Area (m2): Filter Area (m2): Unlined Filter Media Perimeter (m): Filter Depth (m): TN Content of Filter Media (mg/kg): Sat. Hydraulic Con. (mm/hr): Proportion of Organic Material in Filter (%): Orthophosphate Content of Filter Media (mg/kg): Is basin lined? Vegetated with effective nutrient removal plants? Overflow Weir Width (m): Underdrain Present: Submerged Zone With Carbon Present: Submerged Zone Depth (m): Exfiltration Rate (mm/hr): Weir Coefficient: Voids Ratio: Number of CSTR Cells: TSS k (m/yr): TSS C* (mg/l): TP k (m/yr): TP C* (mg/l): TN k (m/yr): TN C* (mg/l): Low Flow Bypass (m3/sec): High Flow Bypass (m3/sec): Extended Detention Depth (m): Surface Area (m2): <5% <55 Yes Yes Yes No <5% <55 Yes Yes Yes No N-B016 Page 48
342 Pond 14 Forest 1 Filter Area (m2): Unlined Filter Media Perimeter (m): Filter Depth (m): TN Content of Filter Media (mg/kg): Sat. Hydraulic Con. (mm/hr): Proportion of Organic Material in Filter (%): Orthophosphate Content of Filter Media (mg/kg): Is basin lined? Vegetated with effective nutrient removal plants? Overflow Weir Width (m): Underdrain Present: Submerged Zone With Carbon Present: Submerged Zone Depth (m): Exfiltration Rate (mm/hr): Weir Coefficient: Voids Ratio: Number of CSTR Cells: TSS k (m/yr): TSS C* (mg/l): TP k (m/yr): TP C* (mg/l): TN k (m/yr): TN C* (mg/l): Low Flow Bypass (m3/sec): High Flow Bypass (m3/sec): Extended Detention Depth (m): Surface Area (m2): Permanent Pool Volume (cubic meters): Exfiltration Rate (mm/hr): Evaporative Loss as % of PET: Equivalent Pipe Diameter (mm): Overflow Weir Width (m): Orifice Discharge Coefficient: Weir Coefficient: Number of CSTR Cells: TSS k (m/yr): TSS C* (mg/l): TP k (m/yr): TP C* (mg/l): TN k (m/yr): TN C* (mg/l): Total Area (ha): Impervious (%): Rainfall Threshold (mm/day): Soil Storage Capacity (mm): Initial Storage (% of Capacity): Field Capacity (mm): Infiltration Capacity Coeff. a: Infiltration Capacity Exp. b: Initial Depth (mm): Daily Recharge Rate (%): Daily Baseflow Rate (%): Daily Deep Seepage Rate (%): <5% <55 Yes Yes Yes No Base Flow Conc. Parameters TSS N-B016 Page 49
343 TP TN Forest 2 Stormflow Conc. Parameters TSS TP TN Total Area (ha): Impervious (%): Rainfall Threshold (mm/day): Soil Storage Capacity (mm): Initial Storage (% of Capacity): Field Capacity (mm): Infiltration Capacity Coeff. a: Infiltration Capacity Exp. b: Initial Depth (mm): Daily Recharge Rate (%): Daily Baseflow Rate (%): Daily Deep Seepage Rate (%): Base Flow Conc. Parameters TSS TP TN N-B016 Page 50
344 Forest 3 Stormflow Conc. Parameters TSS TP TN Total Area (ha): Impervious (%): Rainfall Threshold (mm/day): Soil Storage Capacity (mm): Initial Storage (% of Capacity): Field Capacity (mm): Infiltration Capacity Coeff. a: Infiltration Capacity Exp. b: Initial Depth (mm): Daily Recharge Rate (%): Daily Baseflow Rate (%): Daily Deep Seepage Rate (%): Base Flow Conc. Parameters TSS TP TN Stormflow Conc. Parameters TSS TP N-B016 Page 51
345 Forest 4 TN Total Area (ha): Impervious (%): Rainfall Threshold (mm/day): Soil Storage Capacity (mm): Initial Storage (% of Capacity): Field Capacity (mm): Infiltration Capacity Coeff. a: Infiltration Capacity Exp. b: Initial Depth (mm): Daily Recharge Rate (%): Daily Baseflow Rate (%): Daily Deep Seepage Rate (%): Base Flow Conc. Parameters TSS TP TN Forest 5 Stormflow Conc. Parameters TSS TP TN Total Area (ha): Impervious (%): Rainfall Threshold (mm/day): Soil Storage Capacity (mm): Initial Storage (% of Capacity): N-B016 Page 52
346 Field Capacity (mm): Infiltration Capacity Coeff. a: Infiltration Capacity Exp. b: Initial Depth (mm): Daily Recharge Rate (%): Daily Baseflow Rate (%): Daily Deep Seepage Rate (%): Base Flow Conc. Parameters TSS TP TN Forest 6 Stormflow Conc. Parameters TSS TP TN Total Area (ha): Impervious (%): Rainfall Threshold (mm/day): Soil Storage Capacity (mm): Initial Storage (% of Capacity): Field Capacity (mm): Infiltration Capacity Coeff. a: Infiltration Capacity Exp. b: Initial Depth (mm): Daily Recharge Rate (%): Daily Baseflow Rate (%): Daily Deep Seepage Rate (%): Base Flow Conc. Parameters TSS N-B016 Page 53
347 TP TN Forest 7 GKI Land Stormflow Conc. Parameters TSS TP TN Total Area (ha): Impervious (%): Rainfall Threshold (mm/day): Soil Storage Capacity (mm): Initial Storage (% of Capacity): Field Capacity (mm): Infiltration Capacity Coeff. a: Infiltration Capacity Exp. b: Initial Depth (mm): Daily Recharge Rate (%): Daily Baseflow Rate (%): Daily Deep Seepage Rate (%): Base Flow Conc. Parameters TSS TP TN N-B016 Page 54
348 Forest 7 Other Land Stormflow Conc. Parameters TSS TP TN Total Area (ha): Impervious (%): Rainfall Threshold (mm/day): Soil Storage Capacity (mm): Initial Storage (% of Capacity): Field Capacity (mm): Infiltration Capacity Coeff. a: Infiltration Capacity Exp. b: Initial Depth (mm): Daily Recharge Rate (%): Daily Baseflow Rate (%): Daily Deep Seepage Rate (%): Base Flow Conc. Parameters TSS TP TN Stormflow Conc. Parameters TSS TP N-B016 Page 55
349 Forest 8 GKI Land TN Total Area (ha): Impervious (%): Rainfall Threshold (mm/day): Soil Storage Capacity (mm): Initial Storage (% of Capacity): Field Capacity (mm): Infiltration Capacity Coeff. a: Infiltration Capacity Exp. b: Initial Depth (mm): Daily Recharge Rate (%): Daily Baseflow Rate (%): Daily Deep Seepage Rate (%): Base Flow Conc. Parameters TSS TP TN Forest 8 Other Land Stormflow Conc. Parameters TSS TP TN Total Area (ha): Impervious (%): Rainfall Threshold (mm/day): Soil Storage Capacity (mm): Initial Storage (% of Capacity): Field Capacity (mm): N-B016 Page 56
350 Infiltration Capacity Coeff. a: Infiltration Capacity Exp. b: Initial Depth (mm): Daily Recharge Rate (%): Daily Baseflow Rate (%): Daily Deep Seepage Rate (%): Base Flow Conc. Parameters TSS TP TN Forest 9 GKI Land Stormflow Conc. Parameters TSS TP TN Total Area (ha): Impervious (%): Rainfall Threshold (mm/day): Soil Storage Capacity (mm): Initial Storage (% of Capacity): Field Capacity (mm): Infiltration Capacity Coeff. a: Infiltration Capacity Exp. b: Initial Depth (mm): Daily Recharge Rate (%): Daily Baseflow Rate (%): Daily Deep Seepage Rate (%): Base Flow Conc. Parameters TSS N-B016 Page 57
351 TP TN Forest 9 Other Land Stormflow Conc. Parameters TSS TP TN Total Area (ha): Impervious (%): Rainfall Threshold (mm/day): Soil Storage Capacity (mm): Initial Storage (% of Capacity): Field Capacity (mm): Infiltration Capacity Coeff. a: Infiltration Capacity Exp. b: Initial Depth (mm): Daily Recharge Rate (%): Daily Baseflow Rate (%): Daily Deep Seepage Rate (%): Base Flow Conc. Parameters TSS TP TN N-B016 Page 58
352 Forest 10 Stormflow Conc. Parameters TSS TP TN Total Area (ha): Impervious (%): Rainfall Threshold (mm/day): Soil Storage Capacity (mm): Initial Storage (% of Capacity): Field Capacity (mm): Infiltration Capacity Coeff. a: Infiltration Capacity Exp. b: Initial Depth (mm): Daily Recharge Rate (%): Daily Baseflow Rate (%): Daily Deep Seepage Rate (%): Base Flow Conc. Parameters TSS TP TN Stormflow Conc. Parameters TSS TP N-B016 Page 59
353 Forest 11 TN Total Area (ha): Impervious (%): Rainfall Threshold (mm/day): Soil Storage Capacity (mm): Initial Storage (% of Capacity): Field Capacity (mm): Infiltration Capacity Coeff. a: Infiltration Capacity Exp. b: Initial Depth (mm): Daily Recharge Rate (%): Daily Baseflow Rate (%): Daily Deep Seepage Rate (%): Base Flow Conc. Parameters TSS TP TN Forest 12 Stormflow Conc. Parameters TSS TP TN Total Area (ha): Impervious (%): Rainfall Threshold (mm/day): Soil Storage Capacity (mm): Initial Storage (% of Capacity): Field Capacity (mm): Infiltration Capacity Coeff. a: N-B016 Page 60
354 Infiltration Capacity Exp. b: Initial Depth (mm): Daily Recharge Rate (%): Daily Baseflow Rate (%): Daily Deep Seepage Rate (%): Base Flow Conc. Parameters TSS TP TN Forest 13 Stormflow Conc. Parameters TSS TP TN Total Area (ha): Impervious (%): Rainfall Threshold (mm/day): Soil Storage Capacity (mm): Initial Storage (% of Capacity): Field Capacity (mm): Infiltration Capacity Coeff. a: Infiltration Capacity Exp. b: Initial Depth (mm): Daily Recharge Rate (%): Daily Baseflow Rate (%): Daily Deep Seepage Rate (%): Base Flow Conc. Parameters TSS N-B016 Page 61
355 TP TN Stormflow Conc. Parameters TSS TP TN K4.8 Specific parameters used in the existing model scenario are summarised in Table K4 below. Table K4 MUSIC node parameters (existing scenario) Catchment Roads 2 Catchment Name: Rainfall Station: ET Station: Start Date: End Date: Modelling Time Step: Total Area (ha): Impervious (%): Rainfall Threshold (mm/day): Soil Storage Capacity (mm): Initial Storage (% of Capacity): Field Capacity (mm): Infiltration Capacity Coeff. a: Infiltration Capacity Exp. b: Initial Depth (mm): Daily Recharge Rate (%): Daily Baseflow Rate (%): Daily Deep Seepage Rate (%): Base Flow Conc. Parameters TSS TP N-B016 GKI Resort Existing ROCKHAMPTON User-defined monthly PET 01/01/ :00 AM 01/12/ :54 PM 6 Minutes N-B016 Page 62
356 TN Roads 3 Stormflow Conc. Parameters TSS TP TN Total Area (ha): Impervious (%): Rainfall Threshold (mm/day): Soil Storage Capacity (mm): Initial Storage (% of Capacity): Field Capacity (mm): Infiltration Capacity Coeff. a: Infiltration Capacity Exp. b: Initial Depth (mm): Daily Recharge Rate (%): Daily Baseflow Rate (%): Daily Deep Seepage Rate (%): Base Flow Conc. Parameters TSS TP TN Stormflow Conc. Parameters TSS 2.26 N-B016 Page 63
357 Roads 4 TP TN Total Area (ha): Impervious (%): Rainfall Threshold (mm/day): Soil Storage Capacity (mm): Initial Storage (% of Capacity): Field Capacity (mm): Infiltration Capacity Coeff. a: Infiltration Capacity Exp. b: Initial Depth (mm): Daily Recharge Rate (%): Daily Baseflow Rate (%): Daily Deep Seepage Rate (%): Base Flow Conc. Parameters TSS TP TN Stormflow Conc. Parameters TSS TP TN N-B016 Page 64
358 Roads 5 Total Area (ha): Impervious (%): Rainfall Threshold (mm/day): Soil Storage Capacity (mm): Initial Storage (% of Capacity): Field Capacity (mm): Infiltration Capacity Coeff. a: Infiltration Capacity Exp. b: Initial Depth (mm): Daily Recharge Rate (%): Daily Baseflow Rate (%): Daily Deep Seepage Rate (%): Base Flow Conc. Parameters TSS TP TN Roads 7 Stormflow Conc. Parameters TSS TP TN Total Area (ha): Impervious (%): Rainfall Threshold (mm/day): Soil Storage Capacity (mm): Initial Storage (% of Capacity): Field Capacity (mm): Infiltration Capacity Coeff. a: Infiltration Capacity Exp. b: Initial Depth (mm): Daily Recharge Rate (%): Daily Baseflow Rate (%): Daily Deep Seepage Rate (%): Base Flow Conc. Parameters N-B016 Page 65
359 TSS TP TN Roads 8 GKI Land Stormflow Conc. Parameters TSS TP TN Total Area (ha): Impervious (%): Rainfall Threshold (mm/day): Soil Storage Capacity (mm): Initial Storage (% of Capacity): Field Capacity (mm): Infiltration Capacity Coeff. a: Infiltration Capacity Exp. b: Initial Depth (mm): Daily Recharge Rate (%): Daily Baseflow Rate (%): Daily Deep Seepage Rate (%): Base Flow Conc. Parameters TSS TP TN N-B016 Page 66
360 Roads 8 Other Land Stormflow Conc. Parameters TSS TP TN Total Area (ha): Impervious (%): Rainfall Threshold (mm/day): Soil Storage Capacity (mm): Initial Storage (% of Capacity): Field Capacity (mm): Infiltration Capacity Coeff. a: Infiltration Capacity Exp. b: Initial Depth (mm): Daily Recharge Rate (%): Daily Baseflow Rate (%): Daily Deep Seepage Rate (%): Base Flow Conc. Parameters TSS TP TN Stormflow Conc. Parameters TSS TP N-B016 Page 67
361 Roads 9 GKI Land TN Total Area (ha): Impervious (%): Rainfall Threshold (mm/day): Soil Storage Capacity (mm): Initial Storage (% of Capacity): Field Capacity (mm): Infiltration Capacity Coeff. a: Infiltration Capacity Exp. b: Initial Depth (mm): Daily Recharge Rate (%): Daily Baseflow Rate (%): Daily Deep Seepage Rate (%): Base Flow Conc. Parameters TSS TP TN Roads 9 Other Land Stormflow Conc. Parameters TSS TP TN Total Area (ha): Impervious (%): Rainfall Threshold (mm/day): Soil Storage Capacity (mm): Initial Storage (% of Capacity): Field Capacity (mm): N-B016 Page 68
362 Infiltration Capacity Coeff. a: Infiltration Capacity Exp. b: Initial Depth (mm): Daily Recharge Rate (%): Daily Baseflow Rate (%): Daily Deep Seepage Rate (%): Base Flow Conc. Parameters TSS TP TN Roads 11 Stormflow Conc. Parameters TSS TP TN Total Area (ha): Impervious (%): Rainfall Threshold (mm/day): Soil Storage Capacity (mm): Initial Storage (% of Capacity): Field Capacity (mm): Infiltration Capacity Coeff. a: Infiltration Capacity Exp. b: Initial Depth (mm): Daily Recharge Rate (%): Daily Baseflow Rate (%): Daily Deep Seepage Rate (%): Base Flow Conc. Parameters TSS TP N-B016 Page 69
363 TN Pervious Ground 8 GKI Land Stormflow Conc. Parameters TSS TP TN Total Area (ha): Impervious (%): Rainfall Threshold (mm/day): Soil Storage Capacity (mm): Initial Storage (% of Capacity): Field Capacity (mm): Infiltration Capacity Coeff. a: Infiltration Capacity Exp. b: Initial Depth (mm): Daily Recharge Rate (%): Daily Baseflow Rate (%): Daily Deep Seepage Rate (%): Base Flow Conc. Parameters TSS TP TN Stormflow Conc. Parameters TSS N-B016 Page 70
364 Pervious Ground 8 Other Land TP TN Total Area (ha): Impervious (%): Rainfall Threshold (mm/day): Soil Storage Capacity (mm): Initial Storage (% of Capacity): Field Capacity (mm): Infiltration Capacity Coeff. a: Infiltration Capacity Exp. b: Initial Depth (mm): Daily Recharge Rate (%): Daily Baseflow Rate (%): Daily Deep Seepage Rate (%): Base Flow Conc. Parameters TSS TP TN Stormflow Conc. Parameters TSS TP TN N-B016 Page 71
365 Pervious Ground 9 GKI Land Total Area (ha): Impervious (%): Rainfall Threshold (mm/day): Soil Storage Capacity (mm): Initial Storage (% of Capacity): Field Capacity (mm): Infiltration Capacity Coeff. a: Infiltration Capacity Exp. b: Initial Depth (mm): Daily Recharge Rate (%): Daily Baseflow Rate (%): Daily Deep Seepage Rate (%): Base Flow Conc. Parameters TSS TP TN Pervious Ground 9 Other Land Stormflow Conc. Parameters TSS TP TN Total Area (ha): Impervious (%): Rainfall Threshold (mm/day): Soil Storage Capacity (mm): Initial Storage (% of Capacity): Field Capacity (mm): Infiltration Capacity Coeff. a: Infiltration Capacity Exp. b: Initial Depth (mm): Daily Recharge Rate (%): Daily Baseflow Rate (%): Daily Deep Seepage Rate (%): N-B016 Page 72
366 Base Flow Conc. Parameters TSS TP TN Pervious Ground 11 Stormflow Conc. Parameters TSS TP TN Total Area (ha): Impervious (%): Rainfall Threshold (mm/day): Soil Storage Capacity (mm): Initial Storage (% of Capacity): Field Capacity (mm): Infiltration Capacity Coeff. a: Infiltration Capacity Exp. b: Initial Depth (mm): Daily Recharge Rate (%): Daily Baseflow Rate (%): Daily Deep Seepage Rate (%): Base Flow Conc. Parameters TSS TP TN N-B016 Page 73
367 0.39 Roof Not Tanked 3 Stormflow Conc. Parameters TSS TP TN Total Area (ha): Impervious (%): Rainfall Threshold (mm/day): Soil Storage Capacity (mm): Initial Storage (% of Capacity): Field Capacity (mm): Infiltration Capacity Coeff. a: Infiltration Capacity Exp. b: Initial Depth (mm): Daily Recharge Rate (%): Daily Baseflow Rate (%): Daily Deep Seepage Rate (%): Base Flow Conc. Parameters TSS TP TN Stormflow Conc. Parameters TSS TP N-B016 Page 74
368 Roof Not Tanked 7 TN Total Area (ha): Impervious (%): Rainfall Threshold (mm/day): Soil Storage Capacity (mm): Initial Storage (% of Capacity): Field Capacity (mm): Infiltration Capacity Coeff. a: Infiltration Capacity Exp. b: Initial Depth (mm): Daily Recharge Rate (%): Daily Baseflow Rate (%): Daily Deep Seepage Rate (%): Base Flow Conc. Parameters TSS TP TN Roof Not Tanked 8 GKI Land Stormflow Conc. Parameters TSS TP TN Total Area (ha): Impervious (%): Rainfall Threshold (mm/day): Soil Storage Capacity (mm): Initial Storage (% of Capacity): N-B016 Page 75
369 Field Capacity (mm): Infiltration Capacity Coeff. a: Infiltration Capacity Exp. b: Initial Depth (mm): Daily Recharge Rate (%): Daily Baseflow Rate (%): Daily Deep Seepage Rate (%): Base Flow Conc. Parameters TSS TP TN Roof Not Tanked 8 Other Land Stormflow Conc. Parameters TSS TP TN Total Area (ha): Impervious (%): Rainfall Threshold (mm/day): Soil Storage Capacity (mm): Initial Storage (% of Capacity): Field Capacity (mm): Infiltration Capacity Coeff. a: Infiltration Capacity Exp. b: Initial Depth (mm): Daily Recharge Rate (%): Daily Baseflow Rate (%): Daily Deep Seepage Rate (%): Base Flow Conc. Parameters TSS N-B016 Page 76
370 TP TN Roof Not Tanked 9 GKI Land Stormflow Conc. Parameters TSS TP TN Total Area (ha): Impervious (%): Rainfall Threshold (mm/day): Soil Storage Capacity (mm): Initial Storage (% of Capacity): Field Capacity (mm): Infiltration Capacity Coeff. a: Infiltration Capacity Exp. b: Initial Depth (mm): Daily Recharge Rate (%): Daily Baseflow Rate (%): Daily Deep Seepage Rate (%): Base Flow Conc. Parameters TSS TP TN Stormflow Conc. Parameters N-B016 Page 77
371 Roof Not Tanked 9 Other Land TSS TP TN Total Area (ha): Impervious (%): Rainfall Threshold (mm/day): Soil Storage Capacity (mm): Initial Storage (% of Capacity): Field Capacity (mm): Infiltration Capacity Coeff. a: Infiltration Capacity Exp. b: Initial Depth (mm): Daily Recharge Rate (%): Daily Baseflow Rate (%): Daily Deep Seepage Rate (%): Base Flow Conc. Parameters TSS TP TN Stormflow Conc. Parameters TSS TP TN N-B016 Page 78
372 Roof Not Tanked 11 Total Area (ha): Impervious (%): Rainfall Threshold (mm/day): Soil Storage Capacity (mm): Initial Storage (% of Capacity): Field Capacity (mm): Infiltration Capacity Coeff. a: Infiltration Capacity Exp. b: Initial Depth (mm): Daily Recharge Rate (%): Daily Baseflow Rate (%): Daily Deep Seepage Rate (%): Base Flow Conc. Parameters TSS TP TN Roof Tanked 11 Stormflow Conc. Parameters TSS TP TN Total Area (ha): Impervious (%): Rainfall Threshold (mm/day): Soil Storage Capacity (mm): Initial Storage (% of Capacity): Field Capacity (mm): Infiltration Capacity Coeff. a: Infiltration Capacity Exp. b: Initial Depth (mm): Daily Recharge Rate (%): Daily Baseflow Rate (%): N-B016 Page 79
373 Daily Deep Seepage Rate (%): Base Flow Conc. Parameters TSS TP TN Ocean 14 Stormflow Conc. Parameters TSS TP TN Total Area (ha): Impervious (%): Rainfall Threshold (mm/day): Soil Storage Capacity (mm): Initial Storage (% of Capacity): Field Capacity (mm): Infiltration Capacity Coeff. a: Infiltration Capacity Exp. b: Initial Depth (mm): Daily Recharge Rate (%): Daily Baseflow Rate (%): Daily Deep Seepage Rate (%): Base Flow Conc. Parameters TSS TP TN N-B016 Page 80
374 Pond 14 Rainwater Tank 11 Forest 1 Stormflow Conc. Parameters TSS TP TN Low Flow Bypass (m3/sec): High Flow Bypass (m3/sec): Extended Detention Depth (m): Surface Area (m2): Permanent Pool Volume (cubic meters): Exfiltration Rate (mm/hr): Evaporative Loss as % of PET: Equivalent Pipe Diameter (mm): Overflow Weir Width (m): Orifice Discharge Coefficient: Weir Coefficient: Number of CSTR Cells: TSS k (m/yr): TSS C* (mg/l): TP k (m/yr): TP C* (mg/l): TN k (m/yr): TN C* (mg/l): Low Flow Bypass (m3/sec): High Flow Bypass (m3/sec): Volume Below Overflow (kl): Depth Above Overflow (m): Surface Area (m2): Overflow Pipe Diameter (mm): Use Stored Water: Annual Demand (kl/yr): Daily Demand (kl/day): Orifice Discharge Coeff.: Number of CSTR Cells: TSS k (m/yr): TSS C* (mg/l): TP k (m/yr): TP C* (mg/l): TN k (m/yr): TN C* (mg/l): Total Area (ha): Impervious (%): No N-B016 Page 81
375 Rainfall Threshold (mm/day): Soil Storage Capacity (mm): Initial Storage (% of Capacity): Field Capacity (mm): Infiltration Capacity Coeff. a: Infiltration Capacity Exp. b: Initial Depth (mm): Daily Recharge Rate (%): Daily Baseflow Rate (%): Daily Deep Seepage Rate (%): Base Flow Conc. Parameters TSS TP TN Forest 2 Stormflow Conc. Parameters TSS TP TN Total Area (ha): Impervious (%): Rainfall Threshold (mm/day): Soil Storage Capacity (mm): Initial Storage (% of Capacity): Field Capacity (mm): Infiltration Capacity Coeff. a: Infiltration Capacity Exp. b: Initial Depth (mm): Daily Recharge Rate (%): Daily Baseflow Rate (%): Daily Deep Seepage Rate (%): N-B016 Page 82
376 Base Flow Conc. Parameters TSS TP TN Forest 3 Stormflow Conc. Parameters TSS TP TN Total Area (ha): Impervious (%): Rainfall Threshold (mm/day): Soil Storage Capacity (mm): Initial Storage (% of Capacity): Field Capacity (mm): Infiltration Capacity Coeff. a: Infiltration Capacity Exp. b: Initial Depth (mm): Daily Recharge Rate (%): Daily Baseflow Rate (%): Daily Deep Seepage Rate (%): Base Flow Conc. Parameters TSS TP TN N-B016 Page 83
377 Forest 4 Stormflow Conc. Parameters TSS TP TN Total Area (ha): Impervious (%): Rainfall Threshold (mm/day): Soil Storage Capacity (mm): Initial Storage (% of Capacity): Field Capacity (mm): Infiltration Capacity Coeff. a: Infiltration Capacity Exp. b: Initial Depth (mm): Daily Recharge Rate (%): Daily Baseflow Rate (%): Daily Deep Seepage Rate (%): Base Flow Conc. Parameters TSS TP TN Stormflow Conc. Parameters TSS TP N-B016 Page 84
378 Forest 5 TN Total Area (ha): Impervious (%): Rainfall Threshold (mm/day): Soil Storage Capacity (mm): Initial Storage (% of Capacity): Field Capacity (mm): Infiltration Capacity Coeff. a: Infiltration Capacity Exp. b: Initial Depth (mm): Daily Recharge Rate (%): Daily Baseflow Rate (%): Daily Deep Seepage Rate (%): Base Flow Conc. Parameters TSS TP TN Forest 6 Stormflow Conc. Parameters TSS TP TN Total Area (ha): Impervious (%): Rainfall Threshold (mm/day): N-B016 Page 85
379 Soil Storage Capacity (mm): Initial Storage (% of Capacity): Field Capacity (mm): Infiltration Capacity Coeff. a: Infiltration Capacity Exp. b: Initial Depth (mm): Daily Recharge Rate (%): Daily Baseflow Rate (%): Daily Deep Seepage Rate (%): Base Flow Conc. Parameters TSS TP TN Forest 7 GKI Land Stormflow Conc. Parameters TSS TP TN Total Area (ha): Impervious (%): Rainfall Threshold (mm/day): Soil Storage Capacity (mm): Initial Storage (% of Capacity): Field Capacity (mm): Infiltration Capacity Coeff. a: Infiltration Capacity Exp. b: Initial Depth (mm): Daily Recharge Rate (%): Daily Baseflow Rate (%): Daily Deep Seepage Rate (%): Base Flow Conc. Parameters N-B016 Page 86
380 TSS TP TN Forest 7 Other Land Stormflow Conc. Parameters TSS TP TN Total Area (ha): Impervious (%): Rainfall Threshold (mm/day): Soil Storage Capacity (mm): Initial Storage (% of Capacity): Field Capacity (mm): Infiltration Capacity Coeff. a: Infiltration Capacity Exp. b: Initial Depth (mm): Daily Recharge Rate (%): Daily Baseflow Rate (%): Daily Deep Seepage Rate (%): Base Flow Conc. Parameters TSS TP TN N-B016 Page 87
381 0.220 Forest 8 GKI Land Stormflow Conc. Parameters TSS TP TN Total Area (ha): Impervious (%): Rainfall Threshold (mm/day): Soil Storage Capacity (mm): Initial Storage (% of Capacity): Field Capacity (mm): Infiltration Capacity Coeff. a: Infiltration Capacity Exp. b: Initial Depth (mm): Daily Recharge Rate (%): Daily Baseflow Rate (%): Daily Deep Seepage Rate (%): Base Flow Conc. Parameters TSS TP TN Stormflow Conc. Parameters TSS TP N-B016 Page 88
382 Forest 8 Other Land TN Total Area (ha): Impervious (%): Rainfall Threshold (mm/day): Soil Storage Capacity (mm): Initial Storage (% of Capacity): Field Capacity (mm): Infiltration Capacity Coeff. a: Infiltration Capacity Exp. b: Initial Depth (mm): Daily Recharge Rate (%): Daily Baseflow Rate (%): Daily Deep Seepage Rate (%): Base Flow Conc. Parameters TSS TP TN Forest 9 GKI Land Stormflow Conc. Parameters TSS TP TN Total Area (ha): Impervious (%): Rainfall Threshold (mm/day): Soil Storage Capacity (mm): N-B016 Page 89
383 Initial Storage (% of Capacity): Field Capacity (mm): Infiltration Capacity Coeff. a: Infiltration Capacity Exp. b: Initial Depth (mm): Daily Recharge Rate (%): Daily Baseflow Rate (%): Daily Deep Seepage Rate (%): Base Flow Conc. Parameters TSS TP TN Forest 9 Other Land Stormflow Conc. Parameters TSS TP TN Total Area (ha): Impervious (%): Rainfall Threshold (mm/day): Soil Storage Capacity (mm): Initial Storage (% of Capacity): Field Capacity (mm): Infiltration Capacity Coeff. a: Infiltration Capacity Exp. b: Initial Depth (mm): Daily Recharge Rate (%): Daily Baseflow Rate (%): Daily Deep Seepage Rate (%): Base Flow Conc. Parameters TSS N-B016 Page 90
384 TP TN Forest 10 Stormflow Conc. Parameters TSS TP TN Total Area (ha): Impervious (%): Rainfall Threshold (mm/day): Soil Storage Capacity (mm): Initial Storage (% of Capacity): Field Capacity (mm): Infiltration Capacity Coeff. a: Infiltration Capacity Exp. b: Initial Depth (mm): Daily Recharge Rate (%): Daily Baseflow Rate (%): Daily Deep Seepage Rate (%): Base Flow Conc. Parameters TSS TP TN N-B016 Page 91
385 Forest 11 Stormflow Conc. Parameters TSS TP TN Total Area (ha): Impervious (%): Rainfall Threshold (mm/day): Soil Storage Capacity (mm): Initial Storage (% of Capacity): Field Capacity (mm): Infiltration Capacity Coeff. a: Infiltration Capacity Exp. b: Initial Depth (mm): Daily Recharge Rate (%): Daily Baseflow Rate (%): Daily Deep Seepage Rate (%): Base Flow Conc. Parameters TSS TP TN Stormflow Conc. Parameters TSS TP N-B016 Page 92
386 Forest 12 TN Total Area (ha): Impervious (%): Rainfall Threshold (mm/day): Soil Storage Capacity (mm): Initial Storage (% of Capacity): Field Capacity (mm): Infiltration Capacity Coeff. a: Infiltration Capacity Exp. b: Initial Depth (mm): Daily Recharge Rate (%): Daily Baseflow Rate (%): Daily Deep Seepage Rate (%): Base Flow Conc. Parameters TSS TP TN Forest 13 Stormflow Conc. Parameters TSS TP TN Total Area (ha): Impervious (%): Rainfall Threshold (mm/day): Soil Storage Capacity (mm): Initial Storage (% of Capacity): N-B016 Page 93
387 Field Capacity (mm): Infiltration Capacity Coeff. a: Infiltration Capacity Exp. b: Initial Depth (mm): Daily Recharge Rate (%): Daily Baseflow Rate (%): Daily Deep Seepage Rate (%): Base Flow Conc. Parameters TSS TP TN Forest 14 Stormflow Conc. Parameters TSS TP TN Total Area (ha): Impervious (%): Rainfall Threshold (mm/day): Soil Storage Capacity (mm): Initial Storage (% of Capacity): Field Capacity (mm): Infiltration Capacity Coeff. a: Infiltration Capacity Exp. b: Initial Depth (mm): Daily Recharge Rate (%): Daily Baseflow Rate (%): Daily Deep Seepage Rate (%): Base Flow Conc. Parameters TSS N-B016 Page 94
388 TP TN Stormflow Conc. Parameters TSS TP TN K5. Catchments The following tabulations set out the subcatchment details. Table K5.1 MUSIC subcatchment details - Developed case scenario Subcatchment Total area (ha) Impervious area (ha) Fraction Impervious Forest % Forest % Forest % Forest % Forest % Forest % Forest 7GKI Land % Forest 7 Other Land % Forest 8 GKI Land % Forest 8 Other Land % Forest 9 GKI Land % Forest 9 Other land % Forest % Forest % Forest % Forest % Roads % Roads % Roads % N-B016 Page 95
389 Subcatchment Total area (ha) Impervious area (ha) Fraction Impervious Roads % Roads % Roads 8 GKI Land % Roads 8 Other Land % Roads 9 GKI Land % Roads 9 Other Land % Roads % Roads % Roof Not Tanked % Roof Tanked % Roof Tanked % Roof Tanked 8 GKI Land % Roof Not Tanked 8 GKI Land % Roof Tanked 8 Other Land % Roof Tanked 9 GKI Land % Roof Not Tanked 9 GKI Land % Roof Tanked 9 Other Land % Roof Tanked % Roof Not Tanked % Roof Not Tanked % Ocean % Pervious Ground % Pervious Ground % Pervious Ground 8 GKI Land % Pervious Ground 8 Other Land % Pervious Ground 9 GKI Land % Pervious Ground 9 Other Land % Pervious Ground % Impervious Ground 9 GKI Land % N-B016 Page 96
390 Table K5.2 MUSIC subcatchment details existing case scenario Subcatchment Total area (ha) Impervious area (ha) Fraction impervious Forest % Forest % Forest % Forest % Forest % Forest % Forest 7 GKI Land % Forest 7 Other Land % Forest 8 GKI Land % Forest 8 Other Land % Forest 9 GKI Land % Forest 9 Other Land % Forest % Forest % Forest % Forest % Forest % Roads % Roads % Roads % Roads % Roads % Roads 8 GKI Land % Roads 8 Other Land % Roads 9 GKI Land % Roads 9 Other Land % Roads % Roof Not Tanked % Roof Not Tanked % Roof Not Tanked 8 GKI Land % Roof Not Tanked 8 Other Land % Roof Not Tanked 9 GKI Land % Roof Not Tanked 9 Other Land % Roof Not Tanked % Roof Tanked % Ocean % Pervious Ground 8 GKI Land % Pervious Ground 8 Other Land % Pervious Ground 9 GKI Land % Pervious Ground 9 Other Land % Pervious Ground % Table K5.3 below shows estimated demand from the roof subcatchments for toilet flushing and landscaping. Table K5.3 MUSIC- roof harvest reuse (developed case scenario) Subcatchment Roof area (ha) Estimated annual usage toilet flush (kl/year) Estimated annual usage landscape irrigation (kl/year) Roof Tanked Roof Tanked Roof Tanked 8 GKI Land Roof Tanked 9 GKI Land Roof Tanked N-B016 Page 97
391 K.6 Bio-retention Basin Details Typical details of the proposed stormwater quality improvement structures are illustrated on drawing number R02 in Appendix C. Table K6.1 below details minimum sizing (area and depth) for stormwater quality management in the various catchments. To enhance the overall environmental benefits, it is strongly recommended that a distributed or decentralised network of smaller bio retention "cells" should be provided, rather than larger, centralised catchment scale structures. Accordingly, sizing details are provided in a "per unit" format and should be prorated to suit the specific contributing catchment areas as the detailed architectural, landscaping and civil engineering designs are developed. It is anticipated that specific structures will be located in a distributed fashion throughout the developed areas to suit surface flow patterns and to enhance local landscaping. Table K6.1 Stormwater Quality Improvement Devices - minimum sizing requirements Area Filter Area (m 2 ) Bio-retention Basin Details per 1000m 2 of Catchment Area Surface Area (m 2 ) Extended Detention (m) To ensure that actual operational performance matches the modelling and preliminary sizing, relevant components of the stormwater quality improvement devices must be detailed generally in accordance with details and specifications contained in the Water Sensitive Urban Design Guidelines for South East Queensland (Healthy Waterways - Version 1 June 2006). K7. Results K7.1 Average annual pollutant load reductions The analysis shows that the load-based treatment objectives outlined in SPP 4/10 are exceeded. A comparative summary of the mean annual load reduction results is detailed below in Table K9. N-B016 Page 98
392 Table K7.1.1 Average Annual Pollutant Load Reduction Area Indicator Percent reduction target No treatment - mean annual load (kg year -1 ) Treated - mean annual load (kg year -1 ) Percent reduction modelled Complies? 5 TSS 85% % Yes TP 70% % Yes TN 45% % Yes GP 90% % Yes 7 TSS 85% % Yes TP 70% % Yes TN 45% % Yes GP 90% % Yes 8 TSS 85% % Yes TP 70% % Yes TN 45% % Yes GP 90% % Yes 9 TSS 85% % Yes TP 70% % Yes TN 45% % Yes GP 90% % Yes 11 TSS 85% % Yes TP 70% % Yes TN 45% % Yes GP 90% % Yes 14 TSS 85% % Yes TP 70% % Yes TN 45% % Yes GP 90% % Yes K7.2 Pollutant concentrations The MUSIC engine can also report modelled pollutant concentrations at each time step. However, MUSIC concentration results cannot be compared directly to defined receiving water WQOs. Receiving water WQOs are mean or median values of discrete samples in a continuum which is always present - the ocean. By comparison, stormwater run-off is an intermittent occurrence interspersed with longer periods of zero flow. Modelled pollutant concentrations are mean or median values occurring during these discrete, and relatively rare, flow events within the confines of the waterway and prior to dilution at a receiving water (in this case, the ocean). Modelled concentration results should be read with caution and are best viewed comparing pre-development and post-development (mitigated) concentrations. The following tabulation provides that comparison. (In calculating modelled means or medians, time steps with zero flow have been excluded.) N-B016 Page 99
393 Table K7.2.1 Modelled Runoff Concentrations Catchment Indicator Existing (undeveloped) (mg/l) Developed (mitigated) (mg/l) Post-development concentrations are equal to or lower than existing? TSS (annual mean) Yes TP (annual median) Yes TN (annual median) Yes GP (annual median) Yes TSS (annual mean) Yes TP (annual median) Yes TN (annual median) Yes GP (annual median) Yes TSS (annual mean) Yes TP (annual median) Yes TN (annual median) Yes GP (annual median) Yes TSS (annual mean) Yes TP (annual median) Yes TN (annual median) Yes GP (annual median) Yes TSS (annual mean) Yes TP (annual median) Yes TN (annual median) Yes GP (annual median) Yes TSS (annual mean) Yes TP (annual median) Yes TN (annual median) Yes GP (annual median) Yes K8. Conclusions The modelling and analysis results demonstrate that the proposed mitigation measures achieve two key results: reductions in mean annual loads for modelled pollutants which exceed (ie are better than) the target values defined in SPP 4/10 Healthy Waters; and modelled post-development pollutant concentrations at the point of discharge to the receiving waters during flow events which are equal to or lower than the modelled concentrations at the same discharge points under the existing conditions. N-B016 Page 100
394 Water Cycle Management Report Great Keppel Island Resort Revitalisation Plan APPENDIX L Stormwater Drawings N-B016 Page 172
395 Page 102 N-B016
396 Page 103 N-B016
397 Page 104 N-B016
398 Water Cycle Management Report Great Keppel Island Resort Revitalisation Plan APPENDIX M Preliminary Hazardous Substance Management Plan N-B016 Page 173
399 Great Keppel Island Resort Revitalisation Plan Preliminary Hazardous Substance Management Plan For GKI Resort Pty Ltd Revision A 15 September 2011 Opus International Consultants (PCA) Pty Ltd ABN Level 1, 2 Mayneview Street, Milton, QLD 4064 PO Box 1703, Milton, QLD Preliminary Hazardous Substance Management Plan Great Keppel Island Resort Revitalisation Plan Revision A
400 Preliminary Hazardous Substance Management Plan Great Keppel Island Resort Revitalisation Plan TABLE OF CONTENTS 1. GENERAL CONSTRUCTION OPERATION OBJECTIVES MANAGEMENT MEASURES RESPONSIBILITY MONITORING & REPORTING GENERAL CONSTRUCTION OPERATION... 3 N-B016 Table of Contents
401
402 Preliminary Hazardous Substance Management Plan Great Keppel Island Resort Revitalisation Plan 1. GENERAL The spillage or leakage of hazardous substances transported, used, stored or disposed of during the construction and operational phases of the GKI Resort Revitalisation Plan has the potential to contaminate soils, surface waters and groundwater and impact on vegetation, fauna, soil and water quality. Hazardous substances likely to be stored on site will vary throughout construction and operational phases of the project, and may include: 1.1 Construction Diesel for use in generators, construction vehicles, plant and equipment; Other fuels and oils used in vehicles and equipment; and, Waste oils, batteries, paints, thinners and solvents. 1.2 Operation Diesel (or biodiesel) for standby generators; Other fuels and oil for use in resort vehicles (including tour boats, maintenance vehicles) and for maintenance and operation of aircraft associated with the new runway and airport facilities; Chemicals used in the operation of the wastewater treatment plant(s); Chemicals and fertilisers used for maintenance of the golf course, sporting fields and landscaped areas; Paints, solvents, thinners etc used during general resort maintenance; and Chemicals used for cleaning during operation of the resort 2. Objectives The objectives of this Hazardous Substance Management Plan are: To prevent the degradation of water quality as a result of storage, handling and disposal of hazardous substances (including chemicals and fuel); and To prevent the contamination of soil as a result of storage, handling and disposal of hazardous substances (including chemicals and fuel). 3. Management Measures Hazardous substances (including dangerous goods and hazardous materials) present inherent environmental risks in storage, use and disposal. Wherever possible, non-hazardous alternatives shall be used; Only the minimum essential stocks of items such as chemicals and fuels are to be stored on site at any one time; Refuelling of vehicles during construction and operation of the resort shall occur only within a designated bunded hardstand area provided with a stormwater containment system to prevent discharge of any leaks of spills to surrounding soil or water bodies; N-B016 Page: 1
403 Preliminary Hazardous Substance Management Plan Great Keppel Island Resort Revitalisation Plan Spill kits shall be kept on site at all times. Spill kits are to be located where hazardous substances are stored and used. All site personnel (including contractors) are to be trained in the use of spill kits; The Material Safety Data Sheets (MSDS) for all hazardous substances stored or handled on site are to be kept on site and are to be made readily available to personnel. MSDS shall be kept up-to-date at all times. Hazardous substances and materials must only be handled by trained personnel and in accordance with the relevant MSDS; All hazardous substances and materials must be stored and transported in accordance with the relevant MSDS and relevant Australian Standards and Dangerous Goods regulations, if applicable; All hazardous substances and materials shall be stored in a manner that prevents or minimises the impact of any accidental spills or releases. Hazardous substance storage areas shall be designed and constructed in accordance with AS1940:2004 Storage and Handling of Flammable and Combustible Liquids; Any stormwater captured within bunded areas used for the storage or handling of wastes or other hazardous materials shall be pumped out and disposed of at an appropriately licensed facility. Regular inspections shall be undertaken for stormwater drainage systems in areas used for the storage or handling of wastes and other hazardous materials to ensure all drains are free of litter and operating at optimum efficiency; All hazardous substance storage areas shall be located at least 50 metres from any watercourse or drainage line; If any potentially dangerous wastes (ie. hazardous materials, soils contaminated by paints, fuels, oil, etc) are encountered during the project, the location and details of the waste must be reported to the Project Manager (Construction) or Resort Manager (Operation); Where hazardous waste is to be removed from the site, the waste must only be transported by an operator licensed under the Environmental Protection Act Waste tracking documentation must be completed upon dispatch of the waste off-site and records kept on file; Any leakage or spillage of hazardous substances will trigger immediate spill response and clean up procedures, and repair or improvement of storage areas and/or equipment; Where the storage or handling of hazardous substances does not comply with this Plan, additional training shall be provided to site personnel involved; Any complaint and/or environmental incident will trigger corrective actions immediately; and, All corrective actions shall be approved by the Project Manager (Construction) or Resort Manager (Operation) and shall be developed in consultation with the relevant regulatory authorities where appropriate. 4. Responsibility The Project Manager shall be responsible for implementation and enforcement of the Hazardous Substance Management Plan during construction, with compliance to be audited on a regular basis; and The Resort Manager shall be responsible for implementation and enforcement of the Hazardous Substance Management Plan during operation of the resort facilities. N-B016 Page: 2
404 Preliminary Hazardous Substance Management Plan Great Keppel Island Resort Revitalisation Plan 5. Monitoring & Reporting 5.1 General All complaints or environmental incidents relating to the storage, handling and disposal of hazardous substances must be recorded in an appropriate complaints register, which shall be kept for inspection by DERM and GBRMPA on request. 5.2 Construction Daily inspections of the construction site shall be undertaken by the Site Supervisor to ensure hazardous substances are being stored and used in accordance with this Plan and applicable MSDS. Records of inspections shall be provided to the Project Manager and kept for inspection by DERM and GBRMPA on request. 5.3 Operation Weekly inspections of the hazardous substance storage areas shall be undertaken by the Resort Manager, or a delegated person, to ensure hazardous substances are being stored and used in accordance with this EMP and applicable MSDS. Records of inspections shall be kept for inspection by DERM and GBRMPA on request. N-B016 Page: 3
405 Water Cycle Management Report Great Keppel Island Resort Revitalisation Plan APPENDIX N Preliminary Stormwater Quality Maintenance Plan N-B016 Page 174

406 Great Keppel Island Resort EIS For GKI Resort Pty Ltd Stormwater Quality Maintenance Plan 30 August 2011 Opus International Consultants (PCA) Pty Ltd ABN Russell Street, Toowoomba QLD 4350 PO Box 2279, Toowoomba, QLD 4350 P F Report Great KeppeI Island Resort EIS Stormwater Quality Maintenance Plan
407 Great Keppel Island Resort EIS Stormwater Quality Maintenance Plan TABLE OF CONTENTS 1. GENERAL AIMS AND OBJECTIVES DISTINCT PHASES CONSTRUCTION OPERATION MAINTENANCE ACTIONS CONSTRUCTION PHASE OPERATIONAL PHASE Bio-retention Basins MAINTENANCE SCHEDULE BIO-RETENTION BASINS MANAGEMENT STRUCTURE RESPONSIBILITIES ONGOING MONITORING RECORD KEEPING AND REPORTING NON-COMPLIANCE PROCEDURES PERSONNEL TRAINING WASTE MANAGEMENT REVIEW AND UPDATE... 8 APPENDIX D CHECKLIST - FULL SIZE (FOR COPYING AND DISTRIBUTION)... 9 N-B016 Table of Contents
408
409 Great Keppel Island Resort EIS Stormwater Quality Maintenance Plan 1. GENERAL The spillage or leakage of hazardous substances transported, used, stored or disposed of during the construction and operational phases of the GKI Resort Revitalisation Plan has the potential to contaminate soils, surface waters and groundwater and impact on vegetation, fauna, soil and water quality. Hazardous substances likely to be stored on site will vary throughout construction and operational phases of the project, and may include: 1.1 CONSTRUCTION Diesel for use in generators, construction vehicles, plant and equipment; Other fuels and oils used in vehicles and equipment; and, Waste oils, batteries, paints, thinners and solvents. 1.2 OPERATION Diesel (or biodiesel) for standby generators; Other fuels and oil for use in resort vehicles (including tour boats, maintenance vehicles) and for maintenance and operation of aircraft associated with the new runway and airport facilities; Chemicals used in the operation of the wastewater treatment plant(s); Chemicals and fertilisers used for maintenance of the golf course, sporting fields and landscaped areas; Paints, solvents, thinners etc used during general resort maintenance; and Chemicals used for cleaning during operation of the resort 2. OBJECTIVES The objectives of this Hazardous Substance Management Plan are: To prevent the degradation of water quality as a result of storage, handling and disposal of hazardous substances (including chemicals and fuel); and To prevent the contamination of soil as a result of storage, handling and disposal of hazardous substances (including chemicals and fuel). 3. MANAGEMENT MEASURES Hazardous substances (including dangerous goods and hazardous materials) present inherent environmental risks in storage, use and disposal. Wherever possible, non-hazardous alternatives shall be used; Only the minimum essential stocks of items such as chemicals and fuels are to be stored on site at any one time; Refuelling of vehicles during construction and operation of the resort shall occur only within a designated bunded hardstand area provided with a stormwater containment system to prevent discharge of any leaks of spills to surrounding soil or water bodies; N-B016 Page 1
410 Great Keppel Island Resort EIS Stormwater Quality Maintenance Plan Spill kits shall be kept on site at all times. Spill kits are to be located where hazardous substances are stored and used. All site personnel (including contractors) are to be trained in the use of spill kits; The Material Safety Data Sheets (MSDS) for all hazardous substances stored or handled on site are to be kept on site and are to be made readily available to personnel. MSDS shall be kept up-to-date at all times. Hazardous substances and materials must only be handled by trained personnel and in accordance with the relevant MSDS; All hazardous substances and materials must be stored and transported in accordance with the relevant MSDS and relevant Australian Standards and Dangerous Goods regulations, if applicable; All hazardous substances and materials shall be stored in a manner that prevents or minimises the impact of any accidental spills or releases. Hazardous substance storage areas shall be designed and constructed in accordance with AS1940:2004 Storage and Handling of Flammable and Combustible Liquids; Any stormwater captured within bunded areas used for the storage or handling of wastes or other hazardous materials shall be pumped out and disposed of at an appropriately licensed facility. Regular inspections shall be undertaken for stormwater drainage systems in areas used for the storage or handling of wastes and other hazardous materials to ensure all drains are free of litter and operating at optimum efficiency; All hazardous substance storage areas shall be located at least 50 metres from any watercourse or drainage line; If any potentially dangerous wastes (ie. hazardous materials, soils contaminated by paints, fuels, oil, etc) are encountered during the project, the location and details of the waste must be reported to the Project Manager (Construction) or Resort Manager (Operation); Where hazardous waste is to be removed from the site, the waste must only be transported by an operator licensed under the Environmental Protection Act Waste tracking documentation must be completed upon dispatch of the waste off-site and records kept on file; Any leakage or spillage of hazardous substances will trigger immediate spill response and clean up procedures, and repair or improvement of storage areas and/or equipment; Where the storage or handling of hazardous substances does not comply with this Plan, additional training shall be provided to site personnel involved; Any complaint and/or environmental incident will trigger corrective actions immediately; and, All corrective actions shall be approved by the Project Manager (Construction) or Resort Manager (Operation) and shall be developed in consultation with the relevant regulatory authorities where appropriate. 4. RESPONSIBILITY The Project Manager shall be responsible for implementation and enforcement of the Hazardous Substance Management Plan during construction, with compliance to be audited on a regular basis; and The Resort Manager shall be responsible for implementation and enforcement of the Hazardous Substance Management Plan during operation of the resort facilities. N-B016 Page 2
411 Great Keppel Island Resort EIS Stormwater Quality Maintenance Plan 5. MONITORING & REPORTING 5.1 GENERAL All complaints or environmental incidents relating to the storage, handling and disposal of hazardous substances must be recorded in an appropriate complaints register, which shall be kept for inspection by DERM and GBRMPA on request. 5.2 CONSTRUCTION Daily inspections of the construction site shall be undertaken by the Site Supervisor to ensure hazardous substances are being stored and used in accordance with this Plan and applicable MSDS. Records of inspections shall be provided to the Project Manager and kept for inspection by DERM and GBRMPA on request. 5.3 OPERATION Weekly inspections of the hazardous substance storage areas shall be undertaken by the Resort Manager, or a delegated person, to ensure hazardous substances are being stored and used in accordance with this EMP and applicable MSDS. Records of inspections shall be kept for inspection by DERM and GBRMPA on request. 1. GENERAL 1.1 AIMS AND OBJECTIVES The stormwater quality maintenance plan is to ensure that the stormwater quality improvement devices and techniques adopted for this site perform as anticipated throughout the life of the Project. 1.2 DISTINCT PHASES Stormwater quality management for this site has two distinct phases - construction and operation. This maintenance plan addresses the management of the quality improvement devices in each phase. 1.3 CONSTRUCTION During the construction phase, the most significant water quality objective is the management of suspended solids. Temporary erosion and sediment control such as silt fences and sediment basins, if required, will be utilised during the construction phase. Additional stormwater quality improvement devices to manage the operational phase will be constructed as part of the proposed development. It is important that these devices are either not constructed, or are constructed and blanked off, until after completion of all the ground disturbing activities. Post construction stormwater quality improvement devices are not intended to deal with the high sediment loads typically encountered in storm events during the construction phase. Catch drains and silt fences will be constructed and moved as required during the ground disturbing activities on site to ensure that any sediment laden run-off is contained and redirected. Silt fences should be placed along catch drains to slow flow, reduce scour and capture sediment. N-B016 Page 3
412 Great Keppel Island Resort EIS Stormwater Quality Maintenance Plan Silt fences must be installed downstream of all disturbed areas and stockpile sites. The Preliminary Erosion & Sediment Control Guideline in Appendix H addresses the construction phase in further detail. 1.4 OPERATION During the operational phase, the most significant pollutants for a tourist resort development of this type are litter, nutrients and fine solids from erosion. 2. MAINTENANCE ACTIONS 2.1 CONSTRUCTION PHASE Maintenance revolves around ensuring inlet erosion protection (where provided) is operating as designed and monitoring sediment and debris accumulation. Sand bags are to be placed around any gully inlets to stop silt entering gullies until construction phase activities are complete. Debris removal is an ongoing maintenance function. Inspection and removal of debris should be done regularly, but debris should be removed whenever it is observed on the site. Silt fences and other erosion control measures must be inspected after all significant rainfall events. Collected material should be removed and any damaged areas or control measures should be replaced or repaired immediately. 2.2 OPERATIONAL PHASE Bio-retention Basins Bio-retention basins treat run-off by filtering it through vegetation and then passing run-off vertically through a filtration media which filters the run-off. Surface flows are conveyed through overflow pits or bypass paths to protect the filter media surface from high velocities that can dislodge collected pollutants or scour vegetation. On this site, bio-retention basin outlets will generally be to the porous sub-soils. Besides vegetative filtration, treatment relies upon detention and soil filtration. Vegetation is the key to maintaining the porosity of the soil media in the bio-retention system and a strong healthy growth of vegetation is critical to its performance. The potential for riling and erosion along the basin component of the system needs to be carefully monitored during the establishment stage of the system. The most intensive period of maintenance is during plant establishment (first one to two years) when weed removal and replanting may be required. It is also the time when large loads of sediments could affect plant growth. Other components of the system that require careful consideration are the inlet points. These can be prone to scour and build up of litter. Any field inlet pits require routine inspections to ensure structural integrity and that they are free of blockages with debris. N-B016 Page 4
413 Great Keppel Island Resort EIS Stormwater Quality Maintenance Plan Sediment accumulation needs to be monitored. Should excessive sediment build up, it will affect plant health and require removal before it reduces the infiltration rate of the filter media. Similarly, debris removal is an ongoing maintenance function. Inspection and removal of debris should be done regularly, but debris should be removed whenever it is observed on the site. Maintenance of basin areas includes: Removal of sediment build-up; Removal of debris; Repairing any damage to basin surface profiles resulting from scour or rill erosion; Regular watering/irrigation of vegetation until plants are established and actively growing; Vegetation pest monitoring and control; Removal and management of invasive weeds and removal and replacement of plants that may have died. Resetting (i.e. complete reconstruction) of bio-retention basins will be required if the system fails to drain adequately after tilling of the surface. Inspections are recommended following large storm events to check for scour and other damage. 3. MAINTENANCE SCHEDULE 3.1 BIO-REMEDIATION BASINS The bio-reremediation basin maintenance checklist should be used whenever an inspection is conducted and to be kept as a record of the asset condition and quantity of removed pollutants over time. A copy of such a check list is included in Attachment 1 and repeated below for ease of reference. BIO-REREMEDIATION BASIN MAINTENANCE CHECK LIST Inspection frequency: Location: Description: Site visit by: 1-6 monthly Date of visit: Inspection items: Y N Action required (details) Sediment accumulation at inflow points? Litter within basin? Erosion at inlet or other key structures? Traffic damage present? Evidence of dumping (eg building waste)? Vegetation condition satisfactory (density, weeds etc)? Watering of vegetation required? Replanting required? N-B016 Page 5
414 Great Keppel Island Resort EIS Stormwater Quality Maintenance Plan Trimming/weeding required? Clogging of drainage points (sediment or debris)? Evidence of ponding? Damage/vandalism to structures present? Surface clogging visible? Resetting of system required? Comments: Bio-remediation basins should be checked after any significant run-off event, at least monthly until vegetation has fully established, and at least six monthly after that. 4. MANAGEMENT STRUCTURE Management of the Stormwater Quality Maintenance Plan will be the responsibility of the following people: Site Manager; Site Staff (Reporting to the Site Manager); Subcontractors (Reporting to the Site Manager). 5. RESPONSIBILITIES The Site Manager has overall responsibility for all operational aspects on site. The Manager will ensure that the requirements of the Stormwater Quality Maintenance Plan are implemented. The Manager will ensure that all site staff are familiar with the Stormwater Quality Maintenance Plan and their responsibilities contained within the plan. The Site Manager will also ensure that resources are allocated to meet the requirements of the maintenance plan. Site staff will undertake site inspections and identify any potential maintenance issues. They will identify resources required for the implementation of the maintenance plan and let the Site Manager know what they are. Site staff will be required to implement control actions as necessary and will be allocated resources as required. Site staff will co-ordinate and refer any environmentally related issues or complaints to the Site Manager. Audits of the maintenance plan will be undertaken by the site staff on behalf of the Site Manager and reports prepared on relevant issues. Compliance or non-compliance with the maintenance plan will be reported to all personnel and subcontractors engaged in the Project. 6. ONGOING MONITORING Internal audits will be carried out to verify compliance with the stormwater quality maintenance program defined by this plan. The audit will also encompass work carried out by suppliers and subcontractors. The audit program will be managed by the Site Manager who will either undertake the audit personally or make arrangements for the audits to be carried out by appropriately trained site staff. N-B016 Page 6
415 Great Keppel Island Resort EIS Stormwater Quality Maintenance Plan The Site Manager will maintain a forward schedule of all audits planned, maintain records of audits, and ensure that corrective actions are properly implemented. Audits will, among other things, determine whether periodic inspections and monitoring are being undertaken and if there are any issues with meeting specified guidelines. Audits will be carried out at approximately annual intervals. 7. RECORD KEEPING AND REPORTING The Site Manager will maintain a record of all audits undertaken. The site staff who undertake the regular maintenance inspections will complete inspection check sheets to show that inspections have taken place and as a record of any non-conformances which had been noted. Check sheets will be filed and archived. 8. NON-COMPLIANCE PROCEDURES As soon as it is recognised that any stormwater quality management device is defective and requires repair or reinstatement, the inspecting staff member will advise the Site Manager who will inspect the defective item to review the extent of repair or rectification required. Repairs will then be carried out as required. A register of non-conformances will be established for active and resolved non-conformances. 9. PERSONNEL TRAINING All personnel who will be involved in the maintenance of the stormwater quality management devices or who will be carrying out activities which might impact adversely on the devices will undergo an environmental management training session. The session will be run by the Site Manager before staff commence work on site or before they commence activities which might impact on the stormwater quality devices. The initial session will be introductory only and will not deal with specific activities. Its intent is to ensure that everyone is aware of the purpose of the stormwater quality management devices and the potential consequences of damage or inadequate maintenance. An additional detailed session will be held for those staff specifically engaged in the maintenance of the stormwater quality management devices. This session will review in detail the work to be carried out in maintaining and monitoring the condition of the stormwater quality improvement devices. 10. WASTE MANAGEMENT Debris and litter will be disposed of in accordance with the Waste Management Plan. Contaminated sediments will be removed and disposed of by an approved waste disposal contractor in accordance with the Waste Management Plan. N-B016 Page 7
416 Great Keppel Island Resort EIS Stormwater Quality Maintenance Plan 11. REVIEW AND UPDATE This maintenance plan will be reviewed and updated as required. Record sheets from the regular internal audits will be used to identify any part of the maintenance plan which needs to be modified or updated. N-B016 Page 8
417 Great Keppel Island Resort EIS Stormwater Quality Maintenance Plan ATTACHMENT 1 Bio-Retention Basin Maintenance Checklist N-B016 Page 9
418 Great Keppel Island Resort EIS Stormwater Quality Maintenance Plan BIO-REMEDIATION BASIN MAINTENANCE CHECK LIST Inspection frequency: Location: Description: Site visit by: 1 to 6 monthly Date of visit: Inspection Items Y N Action required (details) Sediment accumulation at inflow points? Litter within basin? Erosion at inlet or other key structures? Traffic damage present? Evidence of dumping (eg building waste)? Vegetation condition satisfactory (density, weeds etc)? Watering of vegetation required? Replanting required? Trimming/weeding required? Clogging of drainage points (sediment or debris)? Evidence of ponding? Damage/vandalism to structures present? Surface clogging visible? Resetting of system required? Comments: N-B016 Page 10
419 Water Cycle Management Report Great Keppel Island Resort Revitalisation Plan APPENDIX O Preliminary Erosion and Sediment Control Management Plan N-B016 Page 175
 Pty Ltd ABN 89 096 110")

420 Great Keppel Island Resort Revitalisation Plan Preliminary Erosion and Sediment Control Management Plan For GKI Resort Pty Ltd Revision A 15 September 2011 Opus International Consultants (PCA) Pty Ltd ABN Level 1, 2 Mayneview Street, Milton, QLD 4064 PO Box 1703, Milton, QLD Preliminary Erosion and Sediment Control Management Plan Great Keppel Island Resort Revitalisation Plan Revision A
Great Keppel Island Resort EIS
 Great Keppel Island Resort EIS For GKI Resort Pty Ltd Waste Management Report 20 October 2011 Opus International Consultants (PCA) Pty Ltd ABN 89 096 110 262 Level 1, 2 Mayneview Street, Milton, QLD 4064
Water sensitive urban design. Developing design objectives for urban development in South East Queensland
 Water sensitive urban design Developing design objectives for urban development in South East Queensland Version 2-8 November 2007 Contents Contents......... ii Executive Summary............1 1 Introduction.........1
Masters Geelong Stormwater Management Plan
 ` Masters Geelong Job Number: CG111748 ABN 47 106 610 913 150 Oxford Street, Collingwood Victoria 3066 Australia Telephone: 03 8415 7777 Facsimile: 03 8415 7788 International: +61 3 8415 7777 victoria@cardno.com.au
The Role of Pervious Paving in Meeting the Requirements of the Auckland Unitary Plan
 The Role of Pervious Paving in Meeting the Requirements of the Auckland Unitary Plan Nick Vigar Waterways Planning Team Manager Auckland Council Healthy Waters Outline Stormwater management under the Air,
GROUND WATER. Practice Note # water. sensitive. urban. design \ \ \ \ \ \ \ \ \ \ \ \ \ \ \ \ \ \ \ \ \ \ \ \ \ \ \ \
 2013 water. sensitive. urban. design \ \ \ \ \ \ \ \ \ \ \ \ \ \ \ \ \ \ \ \ \ \ \ \ \ \ \ \ Practice Note #8 GROUND Water Smart design is the effective planning, design and building of homes, subdivisions,
Sustainable management of Christchurch's waterways and wetlands using stormwater soakage disposal
 Impacts of Urban Growth on Surface Water and Groundwater Quality (Proceedings of IUGG 99 Symposium HS5, Birmingham, July 1999). IAHS Publ. no. 259, 1999. 365 Sustainable management of Christchurch's waterways
(No. of pages excluding this page = 10)
") SPECIALIST CONSULTANT STUDIES 3-65 BIG ISLAND MINING PTY LTD (No. of pages excluding this page = 10) Ltd BIG ISLAND MINING PTY LTD 3-66 SPECIALIST CONSULTANT STUDIES This page has intentionally been left
SPECIALIST CONSULTANT STUDIES 3-65 BIG ISLAND MINING PTY LTD (No. of pages excluding this page = 10) Ltd BIG ISLAND MINING PTY LTD 3-66 SPECIALIST CONSULTANT STUDIES This page has intentionally been left
The MASMA and Sustainable Drainage Systems
 RLD 512 LANDSCAPE HYDROLOGY The MASMA and Sustainable Drainage Systems Dr Naser Ghani PhD, P.Eng, MIEM, MASCE, MACEM anaser@usm.my www.hbp.usm.my/naser ROOM 104 E49 MASMA The main focus of Urban Storm
Urban Geology Spring 2011
 Urban Geology Spring 2011 Gowanus Canal Historical use New York City Water pollution Sewage treatment plants Eutrophication Combined sewage outflows (CSO) Remediation Sustainability Gowanus Canal today
Overview of Water Policy Challenges for Victoria. Dr Peter Coombes
 Overview of Water Policy Challenges for Victoria Dr Peter Coombes Insights from investigations into integrating urban drainage into water cycle management Working with Engineers Australia on this task
Mauritius Green Building Handbook. Water. Introduction. Water and buildings. Llewellyn van Wyk Principal Researcher Built Environment CSIR
 Mauritius Green Building Handbook Water Llewellyn van Wyk Principal Researcher Built Environment CSIR Introduction Water scarcity is without doubt one of the greatest threats to the human species and has
Integrated Water Management Developer Guidance
 WESTERN WATER Western Water Whole-of-water-cycle Strategy Integrated Water Management Developer Guidance Edition 1, 2018 For more information call 1300 650 422 or visit us at WesternWater.com.au Development
Points. To encourage and recognise the minimisation of peak stormwater flows and the protection of receiving waters from pollutants.
 Points Available 3 Aim of Credit To encourage and recognise the minimisation of peak stormwater flows and the protection of receiving waters from pollutants. Credit Criteria Up to three points are available.
PROPONENT COMMITMENTS
 PROPONENT S The below table outlines a consolidated list of Proponent Commitments, which have been presented throughout the EIS. In addition to these commitments, it is implicit that the Proponent will
Draft Greater Sydney Region Plan
 Draft Greater Sydney Region Plan Submission_id: 31236 Date of Lodgment: 13 Dec 2017 Origin of Submission: Online Organisation name: HARC Organisation type: Industry First name: Russell Last name: Beatty
Two Case Studies of Stormwater Harvesting: The Coburg and Merrifield Projects, Victoria, Australia
 Two Case Studies of Stormwater Harvesting: The Coburg and Merrifield Projects, Victoria, Australia J. McGrath*, G. Wilson**, D. Elliott**, J. Baumann*, H. Wahjudi* * Dalton Consulting Engineers, 255 Whitehorse
Wetland Design Manual. Supporting document: Wetland form and function
 Wetland Design Manual Supporting document: Wetland form and function Table of contents Contents Water Sensitive Urban Design... 3 Protection of waterways... 3 Management of stormwater in urban landscapes...
Storm Water Management
 Storm Water Management Policy September 2014 2 Sustainable drainage feature designed to control and manage flows through a series of check dams 3 Document Name: Storm Water Management Controlled Copy No:
Modelling and sizing evapotranspiration fields to manage urban. stormwater excess: reducing surface runoff volume
 Modelling and sizing evapotranspiration fields to manage urban stormwater excess: reducing surface runoff volume Emma James* 1, Peter Breen 2, Sara Lloyd 3 and Courtney Henderson 4 *Presenting Author Surface
CANBERRA AIRPORT 2016 WATER MANAGEMENT PLAN. Canberra Airport Water Management Plan
 CANBERRA AIRPORT 2016 WATER MANAGEMENT PLAN Canberra Airport 1 2016 Water Management Plan 1 Introduction Canberra Airport is located in a catchment which has been modified over time through the installation
Managed Aquifer Recharge (MAR) Practical Techniques for the Caribbean
 Practical Techniques for the Caribbean") Managed Aquifer Recharge (MAR) Practical Techniques for the Caribbean Scope of Presentation What is MAR? Antigua and Barbuda water resources issues Why promote MAR? MAR: Techniques MAR: Design criteria
Managed Aquifer Recharge (MAR) Practical Techniques for the Caribbean Scope of Presentation What is MAR? Antigua and Barbuda water resources issues Why promote MAR? MAR: Techniques MAR: Design criteria
The SuDS Manual Frequently asked questions
 The SuDS Manual Frequently asked questions 1. Is source control still a requirement of the new SuDS Manual? Yes. Source control components are fundamental elements of a SuDS scheme. The benefits of source
City of Texarkana, Arkansas. Storm Water Pollution
 City of Texarkana, Arkansas Storm Water Pollution STORM WATER GUIDE What is Storm Water Pollution? Stormwater can provide a toxic discharge which can enter into a lake, river or coastal water system. As
STORMWATER HARVESTING, AN INNOVATIVE WAY OF MEETING THE CATCHMENT WIDE NEEDS OF THE BUILT AND SOCIAL ENVIRONMENTS
 STORMWATER HARVESTING, AN INNOVATIVE WAY OF MEETING THE CATCHMENT WIDE NEEDS OF THE BUILT AND SOCIAL ENVIRONMENTS Bronwyn Rhynd, CPEng, MIPENZ, IntPE ABSTRACT Catchment wide stormwater management objectives
Works, services and infrastructure code
 9.4.11 Works, services infrastructure code 9.4.11.1 Application (1) This code applies to assessable development identified as requiring assessment against the Works, services infrastructure code by the
ECONOMIES & MANAGEMENT OF IMPACTS
 5. ECONOMIES & MANAGEMENT OF IMPACTS CHAPTER 5 CHAPTER 5 CONTENTS 5. Economies and Management of Impacts 970 5.1 Economy...970 5.1.1 Description of Affected Local and Regional Economies...970 5.1.2 Potential
URBAN WORKSHOP BLACK WATER TREATMENT COMMISSIONING REPORT JANUARY 2007
 URBAN WORKSHOP BLACK WATER TREATMENT COMMISSIONING REPORT JANUARY 2007 The Urban Workshop 50 Lonsdale Street Melbourne, VIC 3000 The Urban Workshop is a 34 storey commercial office building with adjacent
SCHEDULE 4 TO CLAUSE THE SPECIAL USE ZONE. Shown on the planning scheme map as SUZ4. GOULBURN VALLEY HARNESS AND GREYHOUND RACING PRECINCT
 --/--/--- Proposed C199 SCHEDULE 4 TO CLAUSE 37.01 THE SPECIAL USE ZONE Shown on the planning scheme map as SUZ4. GOULBURN VALLEY HARNESS AND GREYHOUND RACING PRECINCT Purpose General To facilitate use,
RE: AGL Energy Limited Newcastle Gas Storage Facility Storm Water Management Peer Review Part 1: Design Modelling
 30 th January 2011 Level 22, 101 Miller Street North Sydney, NSW 2060 Attn: Ms Arianna Henty/Alex Kennedy-Clark Dear Arianna/Alex, RE: AGL Energy Limited Newcastle Gas Storage Facility Storm Water Management
Armstrong Creek West Precinct. Review of Stormwater Management Strategy
 Armstrong Creek West Precinct Review of Stormwater Management Strategy 31 October 2011 Report by: Valerie Mag, B.E. Civil (Hons), M. Eng. Sci. Stormy Water Solutions stormywater@optusnet.com.au Ph 9511
Chapter 3 Previous Studies
 Chapter 3 Previous Studies The Vista Grande stormwater conveyance system and watershed area has been evaluated in a number of reports and studies for the CCSF, the Daly City and San Mateo County over the
Innovative design and solutions for mine water management on an alluvial floodplain
 Water Resources Management IV 43 Innovative design and solutions for mine water management on an alluvial floodplain B. Tite 1 & T. Reedman 2 1 Water Section, PB, Australia 2 Environment and Communications
4. Ponds and infiltration BMPs can achieve 60 to 100% removal efficiencies for sediment.
 Landscape BMPs For the purposes of this project, preventive measures have been categorized into two categories: landscape BMPs and source prevention BMPs. Landscape BMPs includes both vegetative practices
Planning Considerations for Stormwater Management in Alberta. R. D. (Rick) Carnduff, M. Eng., P. Eng. February 20, 2013.
 Carnduff, M. Eng., P. Eng. February 20, 2013.") Planning Considerations for Stormwater Management in Alberta R. D. (Rick) Carnduff, M. Eng., P. Eng. February 20, 2013 Photo Optional Purpose The purpose of urban stormwater management is to provide solutions
Planning Considerations for Stormwater Management in Alberta R. D. (Rick) Carnduff, M. Eng., P. Eng. February 20, 2013 Photo Optional Purpose The purpose of urban stormwater management is to provide solutions
9.3.9 Industry uses code
 9.3.9 Industry uses code 9.3.9.1 Application (1) This code applies to accepted development and assessable development identified as requiring assessment against the Industry uses code by the tables of
Appendix C. Water balance report. Googong Township water cycle project. Environmental Assesment
 Appendix C Water balance report Googong Township water cycle project Environmental Assesment November 2010 A1081402 Rev 7 FEBRUARY 2010 This document has been prepared specifically for Canberra Investment
CHAPTER 7: guidance. categories: Pollutant Removal. Jordan Lake watershed) Cisterns. Bioretention Areas. Green Roofs. Dry. Proprietary Devices
 Cisterns. Bioretention Areas. Green Roofs. Dry. Proprietary Devices") CHAPTER 7: TOOLBOXES A. Water Quality BMP Toolbox The Water Quality BMP Toolbox is intended for use by Town off Cary staff and citizens for guidance regarding implementation of traditional, non-traditional,
CHAPTER 7: TOOLBOXES A. Water Quality BMP Toolbox The Water Quality BMP Toolbox is intended for use by Town off Cary staff and citizens for guidance regarding implementation of traditional, non-traditional,
Shingle Creek Watershed Management Commission Wetland 639W Outlet Modifications Summary Feasibility Report
 Shingle Creek Watershed Management Commission Wetland 639W Outlet Modifications Summary Feasibility Report The proposed project is the modification of the outlet of Wetland 27-0639W to reduce phosphorus
Municipal Stormwater Management Plan Prepared For The Borough of Cape May Point By Van Note-Harvey Associates VNH File No.
 Municipal Stormwater Management Plan Prepared For The Borough of Cape May Point By Van Note-Harvey Associates 2005 VNH File No. 35317-210-21 Table of Contents Introduction... 3 Goals... 3 Storm water Discussion...
E4. Other discharges of contaminants
 E4. Other discharges of contaminants E4.1. Background The following provisions are regional provisions and apply to discharges of contaminants onto or into land and/or into water that are not otherwise
Let Them Count An Argument for Inclusion of the Impact of. Household Rainwater Tanks When Designing an Urban Drainage. Network
 Let Them Count An Argument for Inclusion of the Impact of Household Rainwater Tanks When Designing an Urban Drainage Network L.Strauch* 1 *Presenting Author Household rainwater tanks are currently an optional
Paraprofessional Training Session 1
 Paraprofessional Training Session 1 Part 2: Stormwater Basics November 26, 2012 Rutgers University, Cook Campus Christopher C. Obropta, Ph.D., P.E. Extension Specialist in Water Resources Associate Professor
ORDINANCE # 854. Stormwater Management / Operation and Maintenance Requirements
 ORDINANCE # 854 Stormwater Management / Operation and Maintenance Requirements Section 1. Purpose and Authority In accordance with the provisions of Chapters 98, 124, 126, 440, 444, and 446h of the General
Taking the pain out of the treatment train: continuous simulation modelling for integrated water management
 Engineers & Consultants Taking the pain out of the treatment train: continuous simulation modelling for integrated water management Stu Farrant & Reuben Ferguson, Morphum Environmental Limited Abstract
E1. Water quality and integrated management
 E1. Water quality and integrated management E1.1. Introduction The National Policy Statement for Freshwater Management, the New Zealand Coastal Policy Statement and this Plan seek to improve the integrated
Refer to Chapter 3.0 (Description of Development) for a detailed site and development description.
 for a detailed site and development description.") 7. WATER: HYDROGEOLOGY & HYDROLOGY 7.1 Introduction This chapter of the EIAR comprises of an assessment of the likely impact of the proposed development on the surrounding surface water and hydrogeological
7. WATER: HYDROGEOLOGY & HYDROLOGY 7.1 Introduction This chapter of the EIAR comprises of an assessment of the likely impact of the proposed development on the surrounding surface water and hydrogeological
E. STORMWATER MANAGEMENT
 E. STORMWATER MANAGEMENT 1. Existing Conditions The Project Site is located within the Lower Hudson Watershed. According to the New York State Department of Environmental Conservation (NYSDEC), Lower Hudson
Appendix 9 - Engineering Performance Standards
 Appendix 9 - Engineering Performance Standards A9.1 Introduction A9.1.1 This Appendix contains standards that apply to the subdivision of land. It is referred to in the Subdivision Rules for the Living,
Section 1 - Introduction
 VERSION 1.0 Stormwater Solutions for Residential Sites Section 1 - Introduction Prepared for EcoWater Solutions A Department of Waitakere City Council 113 Central Park Drive Henderson WAITAKERE CITY November
USING WSUD TO RESOLVE COMPETING OBJECTIVES: A CASE STUDY OF A SUSTAINABLE INDUSTRIAL DEVELOPMENT. Abstract
 USING WSUD TO RESOLVE COMPETING OBJECTIVES: A CASE STUDY OF A SUSTAINABLE INDUSTRIAL DEVELOPMENT R Wiese 1 M Brown 1,M Liebman 1 1 STORM_CONSULTING, rod@stormconsulting.com.au Abstract Located within the
Implementing Stormwater Management through Split-Flow Drainage Design
 Implementing Stormwater Management through Split-Flow Drainage Design Stuart Patton Echols PhD, ASLA, RLA Assistant Professor - Department of Landscape Architecture 210 Engineering Unit D Center for Watershed
DESIGN BULLETIN #16/2003 (Revised July 2007) Drainage Guidelines for Highways Under Provincial Jurisdiction in Urban Areas.
 Drainage Guidelines for Highways Under Provincial Jurisdiction in Urban Areas.") Drainage Guidelines for Highways Under Provincial Jurisdiction in Urban Areas. July 2007 Update to Design Bulletin #16/2003: Added under Design Criteria Culverts of 600mm diameter are commonly used to
Drainage Guidelines for Highways Under Provincial Jurisdiction in Urban Areas. July 2007 Update to Design Bulletin #16/2003: Added under Design Criteria Culverts of 600mm diameter are commonly used to
4.3 WATER RESOURCES ALTERNATIVE A PREFERRED CASINO-RESORT PROJECT SURFACE WATER
 4.3 WATER RESOURCES 4.3.1 ALTERNATIVE A PREFERRED CASINO-RESORT PROJECT SURFACE WATER This section discusses potential direct and indirect impacts associated with the development of Alternative A on surface
POTABLE WATER SUPPLY DEFINITIONS
 Definitions POTABLE WATER SUPPLY DEFINITIONS AQUIFER. A porous, water-bearing geologic formation. Generally restricted to materials capable of yielding an appreciable supply of water. BASIN. A natural
Lesson W9 Wastewater and CSOs
 Lesson W9 Wastewater and CSOs Where Does our Water Go When We Flush it Down the Drain? When you flush your toilet or wash your dishes, where does the water go? We learned that only 2-3% of the water used
Appendix A: Project Characteristics
 Gorgon Fourth Train Expansion Proposal Appendix A: Project Characteristics Appendices Project Characteristics A Key Characteristics table has been prepared to describe the elements of the Foundation Project
PART HYDRAULIC, WATER QUALITY AND ENGINEERING. > Stormwater Management Plan prepared by Cardno > Electrical Report prepared by Cardno
 PART 6 HYDRAULIC, WATER QUALITY AND ENGINEERING > Stormwater Management Plan prepared by Cardno > Electrical Report prepared by Cardno STORMWATER MANAGEMENT PLAN PREPARED BY CARDNO Stormwater Management
Presenter: Kylie Evans 9 October 2014
 Presenter: Kylie Evans 9 October 2014 Tamworth Sewerage Augmentation Scheme The Tamworth Sewerage Augmentation Scheme has two major components: Westdale Wastewater Treatment Plant Tamworth Effluent Reuse
LEED Credits. How FieldTurf Can Contribute To Obtaining
 How FieldTurf Can Contribute To Obtaining LEED Credits AlternaScapes, Inc. 2231 Whitfield Park Ave Sarasota, FL 34243 Phone: 941-753-3312 Toll Free: 800-445-2944 Fax: 941-753-3314 Email: info@justlikegrass.com
WSUD On-site Detention in xprafts 2013
 WSUD On-site Detention in xprafts 2013 Content 1. Introduction of ODS 2. General a. Impervious Area b. Pervious Area Capture c. Average Allotment Density d. Developed Area/Total Area 3. On-site Detention
Our Eastern Shore Groundwater Part IV Groundwater Quality on the Eastern Shore: How safe is our groundwater and are there ways we can protect it?
 Our Eastern Shore Groundwater Part IV Groundwater Quality on the Eastern Shore: How safe is our groundwater and are there ways we can protect it? Britt McMillan, Malcolm Pirnie, Inc. Mercury Venus Mars
CEAA ENVIRONMENTAL ENVIRONMENTAL IMPACT ASSESSMENT AMBASSADOR BRIDGE ENHANCEMENT PROJECT. Replacement Span and Plaza Expansion APPENDIX E
 Ambassador Bridge Enhancement Project CEAA ENVIRONMENTAL ENVIRONMENTAL IMPACT ASSESSMENT AMBASSADOR BRIDGE ENHANCEMENT PROJECT Replacement Span and Plaza Expansion APPENDIX E DRAFT EROSION AND SEDIMENT
MARINE POLLUTION DEGRADATION MITIGATION MANAGEMENT IS ESSENTIAL FOR IMPROVING MARINE ENVIRONMENT
 MARINE POLLUTION DEGRADATION MITIGATION MANAGEMENT IS ESSENTIAL FOR IMPROVING MARINE ENVIRONMENT The health of the world s oceans and marine life is degrading rapidly as a result of excess human activities.
DOORNVALLEI EXT 5 & 6
 DOORNVALLEI EXT 5 & 6 Proposed township establishment on portion 107 the farm Doornkloof 391 JR Sewer Pipe Crossings - Sesmylspruit Construction Method Statement April 2016 Revision 3 PREPARED FOR: PREPARED
Water Resources on PEI: an overview and brief discussion of challenges
 Water Resources on PEI: an overview and brief discussion of challenges Components: Components and links Atmospheric water Surface water (including glacial water) Groundwater Links: Precipitation (atm(
DRAFT REPORT: Paynes Road PSP Drainage Review
 DRAFT REPORT: Paynes Road PSP Drainage Review November 2014 Document history Revision: Revision no. 01 Author/s Penny Clark Dan O Halloran Checked Jonathon McLean Approved Jonathon McLean Distribution:
FUNCTIONAL SERVICING AND STORMWATER MANAGEMENT STUDY 405 TWEEDSMUIR AVENUE
 FUNCTIONAL SERVICING AND STORMWATER MANAGEMENT STUDY FOR CITY OF OTTAWA PROJECT NO.: 11-532 FOR TABLE OF CONTENTS 1.0 INTRODUCTION... 1 1.1 Existing Conditions... 2 1.2 Required Permits / Approvals...
Sustainability Criteria for the Design of Stormwater Drainage Systems for the 21 st Century
 Sustainability Criteria for the Design of Stormwater Drainage Systems for the 21 st Century R. Kellagher 1 and H. Udale-Clarke 1 * 1 HR Wallingford Ltd., Howbery Park, Wallingford. Oxfordshire, OX10 8BA,
The environmental objectives and Programme of Measures of the River Basin Management Plan. The case of Cyprus. Iacovos Papaiacovou
 The environmental objectives and Programme of Measures of the River Basin Management Plan The case of Cyprus Iacovos Papaiacovou General Manager Sewerage Board of Limassol Amathus www.sbla.com.cy The island
MUSIC Parameters for use within the City of Greater Geelong
 MUSIC Parameters for use within the City of Greater Geelong Introduction The following MUSIC Guidelines have been developed by Parsons Brinckerhoff (PB) for the City of Greater Geelong for use in modelling
SCRCA SECTION 28 WETLAND POLICY
 April 21, 2016 SCRCA SECTION 28 WETLAND POLICY SCRCA Policies and Procedures of Administration of Section 28 Regulations Wetland Policies Definitions section (Source: Section 28 CA Act) Development means:
THE STUDY ON INTEGRATED URBAN DRAINAGE IMPROVEMENT FOR MELAKA AND SUNGAI PETANI IN MALAYSIA FINAL REPORT
 THE GOVERNMENT OF MALAYSIA PRIME MINISTER S DEPARTMENT ECONOMIC PLANNING UNIT THE STUDY ON INTEGRATED URBAN DRAINAGE IMPROVEMENT FOR MELAKA AND SUNGAI PETANI IN MALAYSIA FINAL REPORT VOL. 5: TECHNICAL
ENVIRONMENTAL GUIDELINES FOR PREPARATION OF AN ENVIRONMENT MANAGEMENT PLAN. Environment Protection Authority, ACT May 2009
 ENVIRONMENTAL GUIDELINES FOR PREPARATION OF AN ENVIRONMENT MANAGEMENT PLAN Environment Protection Authority, ACT May 2009 ISBN-13: 978-0-642-60494-1 ISBN-10: 0-642-60494-0 Australian Capital Territory,
Stormwater design considerations
 Stormwater design considerations Manage the small and frequent rainfall events first Bill Till Supervising Engineer Urban Water Management Stormwater management information Decision Process for Stormwater
Nuriootpa (Sturt Highway Service Centre) DPA The Barossa Council Appendices. Appendix C - Herriot Consulting Engineering Assessment
 DPA The Barossa Council Appendices. Appendix C - Herriot Consulting Engineering Assessment") Nuriootpa (Sturt Highway Service Centre) DPA The Barossa Council Appendices Appendix C - Herriot Consulting Engineering Assessment 4th May 2018 C1803-002 Rocland Estate Lot 147 Sturt Highway, Nuriootpa
Nuriootpa (Sturt Highway Service Centre) DPA The Barossa Council Appendices Appendix C - Herriot Consulting Engineering Assessment 4th May 2018 C1803-002 Rocland Estate Lot 147 Sturt Highway, Nuriootpa
Stormwater Management in Your Backyard: Stormwater 101
 Stormwater Management in Your Backyard: Stormwater 101 Gregory Rusciano Program Associate, Water Resources Rutgers Cooperative Extension New Jersey Sea Grant Extension Program How much water do we have?
Understanding the State Planning Policy July 2017 Changes to state interest statements, policies and assessment benchmarks
 Understanding the State Planning Policy July 2017 Changes to state statements, policies and assessment benchmarks This fact sheet outlines the key policy changes to the state statements, policies and assessment
Storm Water Management Pollution and Treatment
 7th EWA Bruxells Conference 25.10.2011 Effektive Urban Wastewater Treatment Theo G. Schmitt, University of Kaiserslautern Storm Water Management Pollution and Treatment 10.11.2011-2 Overview Major Storm
Temporary Watercourse Crossing: Fords
 Temporary Watercourse Crossing: Fords DRAINAGE CONTROL TECHNIQUE Low Gradient Velocity Control Short Term Steep Gradient Channel Lining Medium-Long Term Outlet Control Soil Treatment Permanent [1] [1]
Final report. Date published: May PUBLISHED BY Meat and Livestock Australia Limited Locked Bag 991 NORTH SYDNEY NSW 2059
 Final report Project code: P.PIP.0459 Date published: May 2015 PUBLISHED BY Meat and Livestock Australia Limited Locked Bag 991 NORTH SYDNEY NSW 2059 Feasibility of using alternative storm water treatment
WASA Quiz Review. Chapter 2
 WASA Quiz Review Chapter 2 Question#1 What is surface runoff? part of the water cycle that flows over land as surface water instead of being absorbed into groundwater or evaporating Question #2 What are
Parlee Beach Water Quality Summary
 Parlee Beach Water Quality Summary Introduction This document presents a summary of the report of the Steering Committee for the Parlee Beach Water Quality project. The Committee was comprised of representatives
AT A GLANCE. Cairns Shipping Development Project. Revised Draft Environmental Impact Statement Fact Sheet July 2017.
 Cairns Shipping Development Project Revised Draft Environmental Impact Statement Fact Sheet July 2017 AT A GLANCE > An additional 70 cruise ships into Port of Cairns each year by 2031 > Project design
Modelling a Combined Sewage and Stormwater Flood Detention Basin
 Modelling a Combined Sewage and Stormwater Flood Detention Basin A. Pugh B.E. (Hons), Member A.W.A. Sales and Support Manager, Wallingford Software Pty Ltd, Australia S. Ratcliffe B.Sc(Hons), Grad Dip
OPTIMISING WASTEWATER TREATMENT AND REUSE MOUNT ISA A CASE STUDY
 OPTIMISING WASTEWATER TREATMENT AND REUSE MOUNT ISA A CASE STUDY Grant Pedersen, Mark Thomas, Ian Ho, Nigel Tse Harrison Grierson Consultants ABSTRACT This paper promotes a holistic approach to wastewater
Stormwater Attenuation Systems Sustainable Drainage Solutions for Domestic & Commercial Applications
 Environmental Stormwater Attenuation Systems Sustainable Drainage Solutions for Domestic & Commercial Applications Sustainable, Reliable, Affordable Stormwater Attenuation Systems Sustainable Drainage
Water Quality and Pollution
 Chapter 6 Water Quality and Pollution Guiding Principles: Chapter 4 details all the guiding principles relevant to the overall management of the Harbour. Whilst all should be given some consideration the
dairyshed effluent Western Australia Code of Practice for DAIRY Western Funded by Dairy Australia and your dairy service levy
 Code of Practice for dairyshed effluent Western Australia Funded by Dairy Australia and your dairy service levy Western DAIRY BACKGROUND The Western Australian dairy industry recognises the importance
Temporary Watercourse Crossing: Culverts
 Temporary Watercourse Crossing: Culverts DRAINAGE CONTROL TECHNIQUE Low Gradient Velocity Control Short Term Steep Gradient Channel Lining Medium-Long Term Outlet Control Soil Treatment Permanent Symbol
CHAPTER 6. EFFLUENT DISCHARGE/REUSE ALTERNATIVES
 CHAPTER 6. EFFLUENT DISCHARGE/REUSE ALTERNATIVES This chapter presents discharge and treatment alternatives for treatment plant effluent (effluent or final effluent) within the Pt. Hadlock sewer service
Environmental Sustainability Destination Action Plan
 Sustainability Destination Action Plan . T (02)64594100 F (02) 64594101 W www.thredbo.com.au PO Box 92 Thredbo NSW 2625 Australia ABN 95000139015 (incorporated in NSW) Document version: Final Author: Bryce
Nonpoint Source Storm Water Management Plan
 Nonpoint Source Storm Water Management Plan Christine Pomeroy Dept. of Civil & Environnmental Eng. University of Utah Carl Adams Watershed Protection Utah Division of Water Quality Definitions Nonpoint
Alternative water sources and Integrated water management
 Service delivery Alternative water sources and Integrated water management Strategic Goals Our Aim Contribute to a more sustainable, prosperous, liveable and healthy community by planning and delivering
Water Sensitive Urban Design. Engineering procedures for stormwater management in Tasmania
 Water Sensitive Urban Design Engineering procedures for stormwater management in Tasmania a Acknowledgments This manual was produced with support from the Tasmanian Government Living Environment Program,
Stormwater Management Practice Notes. District Plan Change 22 (Decision Notice Version)
") Stormwater Management Practice Notes for District Plan Change 22 (Decision Notice Version) Stormwater Management Practice Notes List of Practice Notes Stormwater Management Practice Notes: NSC 01: Stormwater
Stormwater Management Practice Notes for District Plan Change 22 (Decision Notice Version) Stormwater Management Practice Notes List of Practice Notes Stormwater Management Practice Notes: NSC 01: Stormwater
Preliminary Drainage Analysis
 Preliminary Drainage Analysis Tanimura and Antle Employee Housing Town of Spreckels County of Monterey, California LIB150205 May 29, 2015 Prepared For: Tanimura and Antle Produce Prepared By: 9699 Blue
Environmental Management System
 Environmental Management System Moreton Bay Research Station (MBRS) Water Management Program 1. Program Scope The Water Management Program incorporates all the water used throughout the Moreton Bay Research
Sanibel Golf Course Fertilizer and Lake Management Recommendations Annual Report Card. July This report was specifically prepared for:
 Sanibel Golf Course Fertilizer and Lake Management Recommendations Annual Report Card July 2012 This report was specifically prepared for: The Dunes Golf and Tennis Club Introduction Stormwater runoff
A. TABLE OF CONTENTS ENVIRONMENTAL IMPACT STATEMENT
 A. TABLE OF CONTENTS TABLE OF CONTENTS PAGE ii TABLE OF CONTENTS FOLDER 1 OF 14 List of Abbreviations... Tab B Glossary of Terms... Tab C Summary of changes to Queensland Government Departments... Tab
FACTSHEET INTRODUCTION. help rebalance the water cycle, mitigate the effects of climate change and improve human health and livelihoods.
 1 FACTSHEET INTRODUCTION World Water Day, on 22 March every year, is about focusing attention on the importance of water. This year s theme, Nature for Water, explores nature-based solutions (NBS) to the