Air Quality Updating and Screening Assessment
|
|
|
- Camron Richard Stephens
- 6 years ago
- Views:
Transcription
1 Report Air Quality Updating and Screening Assessment A report produced for the London Borough of Hillingdon Version 1 May 2006 ED
2 AEAT/ENV/R/2220 Title Customer Air Quality Updating and Screening Assessment for the London Borough of Hillingdon The London Borough of Hillingdon Customer reference Confidentiality, copyright reproduction and This document has been prepared by AEA Technology plc in connection with a contract to supply goods and/or services and is submitted only on the basis of strict confidentiality. The contents must not be disclosed to third parties other than in accordance with the terms of the contract. File reference ED Report number AEAT/ENV/R/2220 Report status Unrestricted AEA Technology Environment and Energy Gemini Building Harwell Didcot Oxon. OX11 0QJ Telephone Facsimile AEA Technology is the trading name of AEA Technology plc AEA Technology is certificated to ISO9001 Name Signature Date Authors Anne Wagner 30/05/2006 Reviewed by Jim McGinlay 30/05/2006 Approved by Jim McGinlay 30/05/2006 ii
3 AEAT/ENV/R/2220 Executive Summary The UK Government published its strategic policy framework for air quality management in 1995 establishing national strategies and policies on air quality which culminated in the Environment Act, The Air Quality Strategy 1 provides a framework for air quality control through air quality management and air quality standards. These and other air quality standards 1 and their objectives 2 have been enacted through the Air Quality Regulations in 1997, 2000 and The Environment Act 1995 requires Local Authorities to undertake air quality reviews. In areas where an air quality objective is not anticipated to be met, Local Authorities are required to establish Air Quality Management Areas and implement action plans to improve air quality. The first and second round of air quality review and assessments have been completed by the London Borough of Hillingdon. The Local Authority are now required to proceed to the third round of review and assessment in which sources of emissions to air are reassessed to identify whether the situation has changed since the second round, and if so, what impact this may have on predicted exceedences of the air quality objectives. The third round of review and assessment is to be undertaken in two steps. The first step is an Updating and Screening Assessment, which updates the Stage 1 and 2 review and assessments previously undertaken for all pollutants identified in the Air Quality Regulations. Where a significant risk of exceedence is identified for a pollutant it will be necessary for the local authority to proceed to a Detailed Assessment, equivalent to the previous Stage 3 assessments. Where a local authority does not need to undertake a Detailed Assessment, a progress report is required instead. This report is equivalent to an Updating and Screening Assessment for the London Borough of Hillingdon as outlined in the Government s published guidance. This Updating and Screening Assessment has concluded that the London Borough of Hillingdon is not required to carry out a Detailed Review and Assessment for carbon monoxide, benzene, 1,3- butadiene, lead, nitrogen dioxide or sulphur dioxide and PM Refers to standards recommended by the Expert Panel on Air Quality Standards. Recommended standards are set purely with regard to scientific and medical evidence on the effects of the particular pollutants on health, at levels at which risks to public health, including vulnerable groups, are very small or regarded as negligible. 2 Refers to objectives in the Strategy for each of the eight pollutants. The objectives provide policy targets by outlining what should be achieved in the light of the air quality standards and other relevant factors and are expressed as a given ambient concentration to be achieved within a given timescale. iii
4 AEAT/ENV/R/2220 The general approach taken in this Updating and Screening Assessment was to: Identify the conclusions of the last round of review and assessment for each of the seven pollutants included in the air quality regulations; Identify significant sources of emissions to air for the seven pollutants included in the air quality regulations, including major roads and industrial plant; Identify new sources not previously considered in the first round of review and assessment; Identify any sources for which emissions have changed significantly since the last round of review and assessment; Identify and interpret the significance of air quality monitoring data made available since the last round of review and assessment; Assess the risk of exceedences of the air quality objectives in locations where relative public exposure may exist using screening models and nomograms; and Where necessary, identify locations and pollutants for which further detailed assessment of air quality will be required. A checklist identifying the considerations in this report is shown at the end of each chapter and in Appendix 5. iv
5 AEAT/ENV/R/2220 Acronyms and definitions used in this report AADTF ADMS AQDD AQMA AQS AP AURN CO d.f. DETR defra DMRB EA EPA EPAQS EU GIS HA HDV HGV kerbside LA LAEI Limit Value NAEI NO 2 NO x NRTF ppb r receptor roadside SD SO 2 TEMPRO Annual Average Daily Traffic Flow an atmospheric dispersion model an EU directive (part of EU law) - Common Position on Air Quality Daughter Directives, commonly referred to as the Air Quality Daughter Directive Air Quality Management Area Air Quality Strategy Action Plan Automatic Urban and Rural Network (defra funded network) Carbon monoxide degrees of freedom (in statistical analysis of data) Department of the Environment Transport and the Regions (now defra) Department of the Environment, Food and Rural Affairs Design Manual for Roads and Bridges Environment Agency Environmental Protection Act Expert Panel on Air Quality Standards (UK panel) European Union Geographical Information System Highways Agency Heavy Duty Vehicles (includes buses, coaches and lorries). Heavy Goods Vehicles 0 to 1 m from the kerb Local Authority London Atmospheric Emissions Inventory An EU definition for an air quality standard of a pollutant listed in the air quality directives National Atmospheric Emissions Inventory Nitrogen dioxide Oxides of nitrogen National Road Traffic Forecast parts per billion the correlation coefficient (between two variables) In the context of this study, the relevant location where air quality is assessed or predicted (for example, houses, hospitals and schools) 1 to 5 m from the kerb standard deviation (of a range of data) Sulphur dioxide A piece of software produced by the DfT used to forecast traffic flow increases v
6 AEAT/ENV/R/2220 Contents 1 INTRODUCTION TO THE UPDATING AND SCREENING ASSESSMENT PURPOSE OF THE UPDATING AND SCREENING ASSESSMENT OVERVIEW OF APPROACH TAKEN RELEVANT DEFRA DOCUMENTATION USED POLLUTANTS CONSIDERED IN THIS REPORT STRUCTURE OF THE REPORT The difference between standards and objectives in the UK AQS THE UK AIR QUALITY STRATEGY NATIONAL AIR QUALITY STANDARDS TIMESCALES TO ACHIEVE THE OBJECTIVES FOR THE POLLUTANTS IN AIR QUALITY STRATEGY AIR QUALITY REVIEWS THE APPROACHES AND EXPECTED OUTCOMES LOCATIONS THAT THE REVIEW AND ASSESSMENT MUST CONCENTRATE ON INFORMATION USED TO SUPPORT THIS ASSESSMENT CONCLUSIONS FROM THE SECOND ROUND OF REVIEW AND ASSESSMENT OF AIR QUALITY FOR THE LONDON BOROUGH OF HILLINGDON PROPOSED DEVELOPMENTS WHICH MAY AFFECT AIR QUALITY ROAD TRAFFIC DATA Fraction of HDVs Traffic growth Distance from the centre of the road to the kerbside and to the receptors PART A AND B PROCESSES AMBIENT MONITORING Diffusion tubes Continuous monitoring UPDATING AND SCREENING ASSESSMENT FOR CARBON MONOXIDE THE NATIONAL PERSPECTIVE STANDARD AND OBJECTIVE FOR CARBON MONOXIDE CONCLUSIONS OF THE SECOND ROUND OF REVIEW AND ASSESSMENT FOR CARBON MONOXIDE SCREENING ASSESSMENT OF CARBON MONOXIDE BACKGROUND CONCENTRATIONS FOR CARBON MONOXIDE SCREENING ASSESSMENT OF MONITORING DATA SCREENING ASSESSMENT OF VERY BUSY ROADS CONCLUSIONS FOR CARBON MONOXIDE CONCENTRATIONS IN THE LONDON BOROUGH OF HILLINGDON AREA 12 5 UPDATING AND SCREENING ASSESSMENT FOR BENZENE THE NATIONAL PERSPECTIVE STANDARD AND OBJECTIVE FOR BENZENE CONCLUSIONS OF THE SECOND ROUND OF REVIEW AND ASSESSMENT FOR BENZENE SCREENING ASSESSMENT OF BENZENE BACKGROUND CONCENTRATIONS FOR BENZENE SCREENING ASSESSMENT OF MONITORING DATA vi
7 AEAT/ENV/R/ SCREENING ASSESSMENT OF VERY BUSY ROADS SCREENING ASSESSMENT OF INDUSTRIAL SOURCES SCREENING ASSESSMENT OF PETROL STATIONS SCREENING ASSESSMENT OF FUEL STORAGE DEPOTS CONCLUSIONS FOR BENZENE CONCENTRATIONS IN THE LONDON BOROUGH OF HILLINGDON UPDATING AND SCREENING ASSESSMENT FOR 1,3-BUTADIENE THE NATIONAL PERSPECTIVE STANDARD AND OBJECTIVE FOR 1,3-BUTADIENE CONCLUSIONS OF THE SECOND ROUND OF REVIEW AND ASSESSMENT FOR 1,3-BUTADIENE SCREENING ASSESSMENT OF 1,3-BUTADIENE BACKGROUND CONCENTRATIONS FOR 1,3-BUTADIENE SCREENING ASSESSMENT OF MONITORING DATA SCREENING ASSESSMENT OF INDUSTRIAL SOURCES CONCLUSIONS FOR 1,3-BUTADIENE CONCENTRATIONS IN THE LONDON BOROUGH OF HILLINGDON AREA 19 7 UPDATING AND SCREENING ASSESSMENT FOR LEAD THE NATIONAL PERSPECTIVE STANDARD AND OBJECTIVE FOR LEAD CONCLUSIONS OF THE SECOND ROUND OF REVIEW AND ASSESSMENT FOR LEAD SCREENING ASSESSMENT OF LEAD SCREENING ASSESSMENT OF MONITORING DATA SCREENING ASSESSMENT OF INDUSTRIAL SOURCES CONCLUSIONS FOR LEAD CONCENTRATIONS IN THE LONDON BOROUGH OF HILLINGDON UPDATING AND SCREENING ASSESSMENT FOR NITROGEN DIOXIDE INTRODUCTION STANDARDS AND OBJECTIVES FOR NITROGEN DIOXIDE CONCLUSIONS OF THE FIRST AND SECOND ROUND OF REVIEW AND ASSESSMENT FOR NITROGEN DIOXIDE SCREENING ASSESSMENT OF NITROGEN DIOXIDE BACKGROUND CONCENTRATIONS FOR NITROGEN DIOXIDE SCREENING ASSESSMENT OF MONITORING DATA Diffusion tube monitoring Automatic Monitoring SCREENING ASSESSMENT OF ROAD TRAFFIC SOURCES Street Canyons Busy Junctions SCREENING ASSESSMENT OF INDUSTRIAL SOURCES SCREENING ASSESSMENT OF OTHER TRANSPORT SOURCES Bus Stations Airports Railways CONCLUSIONS FOR NITROGEN DIOXIDE CONCENTRATIONS IN THE LONDON BOROUGH OF HILLINGDON 29 9 UPDATING AND SCREENING ASSESSMENT FOR SULPHUR DIOXIDE INTRODUCTION STANDARD AND OBJECTIVE FOR SULPHUR DIOXIDE vii
8 AEAT/ENV/R/ CONCLUSIONS OF THE SECOND ROUND OF REVIEW AND ASSESSMENT FOR SULPHUR DIOXIDE SCREENING ASSESSMENT OF SULPHUR DIOXIDE BACKGROUND CONCENTRATIONS FOR SULPHUR DIOXIDE SCREENING ASSESSMENT OF MONITORING DATA SCREENING ASSESSMENT OF INDUSTRIAL SOURCES Small Boilers SCREENING ASSESSMENT OF DOMESTIC SOURCES Domestic coal burning SCREENING ASSESSMENT OF OTHER TRANSPORT SOURCES Railways CONCLUSIONS FOR SULPHUR DIOXIDE CONCENTRATIONS IN THE LONDON BOROUGH OF HILLINGDON UPDATING AND SCREENING ASSESSMENT FOR PM THE NATIONAL PERSPECTIVE STANDARD AND OBJECTIVE FOR PM CONCLUSIONS OF THE SECOND ROUND OF REVIEW AND ASSESSMENT FOR PM SCREENING ASSESSMENT OF PM BACKGROUND CONCENTRATIONS FOR PM SCREENING ASSESSMENT OF MONITORING DATA SCREENING ASSESSMENT OF ROAD TRAFFIC SOURCES Busy Junctions Street Canyons SCREENING ASSESSMENT OF INDUSTRIAL SOURCES SCREENING ASSESSMENT OF FUGITIVE AND UNCONTROLLED SOURCES Quarries and landfill sites Domestic solid fuel burning SCREENING ASSESSMENT OF OTHER TRANSPORT SOURCES Airports CONCLUSIONS FOR PM10 CONCENTRATIONS IN THE LONDON BOROUGH OF HILLINGDON CARBON MONOXIDE BENZENE ,3-BUTADIENE LEAD NITROGEN DIOXIDE SULPHUR DIOXIDE PM SUMMARY AND RECOMMENDATIONS APPENDICES Appendix 1 Appendix 2 Appendix 3 Appendix 4 Appendix 5 Monitoring Data DMRB output List of Part A processes in Hillingdon Descriptions of selected models and tools Report Checklist viii
9 AEAT/ENV/R/ Introduction to the Updating and Screening Assessment This section outlines the purpose of this Updating and Screening Assessment and the scope of the assessment. 1.1 PURPOSE OF THE UPDATING AND SCREENING ASSESSMENT The first and second rounds of air quality review and assessments is now complete and all local authorities should have completed all necessary stages. Where the likelihood of exceedences of air quality objectives have been identified in areas of significant public exposure, an air quality management area should have been declared, followed by a Further (formerly Stage 4 ) Assessment, and the formulation of an action plan to eliminate exceedences. Local authorities are now required to proceed to the third round of review and assessment in which sources of emissions to air are reassessed to identify whether the situation has changed since the previous rounds of review and assessment, and if so, what impact this may have on predicted exceedences of the air quality objectives. Such changes might include significant traffic growth on a major road, which had not been foreseen, construction of a new industrial plant with emissions to air, or significant changes in the emissions of an existing plant. The third round of review and assessment is to be undertaken in two steps. The first step is an Updating and Screening Assessment, which updates the last 2 review and assessments previously undertaken for all pollutants identified in the Air Quality Regulations. Where a significant risk of exceedence is identified for a pollutant it will be necessary for the local authority to proceed to a Detailed Assessment, equivalent to the previous Stage 3 assessments. Where a local authority does not need to undertake a Detailed Assessment, a progress report is required instead. 1.2 OVERVIEW OF APPROACH TAKEN The general approach taken to this Updating and Screening Assessment was to: Identify the conclusions of the last round of review and assessment for each of the seven pollutants included in the air quality regulations; Identify significant sources of emissions to air for the seven pollutants included in the air quality regulations, including major roads and industrial plant; Identify new sources not previously considered in the first two rounds of review and assessment; Identify any sources for which emissions have changed significantly since the last round of review and assessment; Identify and interpret the significance of air quality monitoring data made available since the last round of review and assessment; Assess the risk of exceedences of the air quality objectives in locations where relative public exposure may exist using screening models and nomograms; and Where necessary, identify locations and pollutants for which further detailed assessment of air quality will be required. 1
10 AEAT/ENV/R/ RELEVANT DEFRA DOCUMENTATION USED This report takes into account the guidance in LAQM.TG(03), published January 2003 and the subsequent update published in January POLLUTANTS CONSIDERED IN THIS REPORT All pollutants included in the Air Quality Regulations for the purposes of Review and Assessment have been considered in this report (Table 1.1). 1.5 STRUCTURE OF THE REPORT The report is structured as follows: Chapter 1 summarises the aims of the updating and screening assessment, the approach adopted for the assessment, as well as relevant background information for Hillingdon, and relevant emissions-to-air sources; Chapter 2 The UK Air Quality Strategy Chapter 3 summarises the information used to support this assessment, identifies data used in support of this assessment and highlights significant changes in emissions to air within the borough since the second round of review and assessment; Chapters 4-10 present the review and assessment for each of the seven pollutants included in the Air Quality Regulations; Chapter 11 presents conclusions and recommendations for further work, where required, for each of the seven pollutants; Chapter 12 presents the references and acknowledgements The Objectives of the Air Quality strategy are shown in Table
11 AEAT/ENV/R/2220 Table 1.1 Objectives included in the Air Quality Regulations 2000 and (Amendment) Regulations 2002 for the purpose of Local Air Quality Management Pollutant Benzene Air Quality Objective Concentration Measured as Date to be achieved by All authorities µg/m 3 running annual mean Authorities in England and Wales only Authorities in Scotland and Northern Ireland only a 5.00 µg/m 3 annual mean µg/m 3 running annual mean ,3-Butadiene 2.25 µg/m 3 running annual mean Carbon monoxide Authorities in England, Wales and Northern Ireland only a maximum daily 10.0 mg/m 3 running 8-hour mean Authorities in Scotland only Lead 0.5 µg/m mg/m 3 running 8-hour mean µg/m 3 annual mean annual mean Nitrogen dioxide b 200 µg/m 3 not to be exceeded more than 18 times a year Particles (PM 10 ) (gravimetric) c All authorities 40 µg/m 3 50 µg/m 3 not to be exceeded more than 35 times a year 40 µg/m 3 Authorities in Scotland 50 µg/m 3 not to be only d exceeded more than 7 times a year 18 µg/m 3 1 hour mean annual mean 24 hour mean annual mean 24 hour mean annual mean Sulphur dioxide 350 µg/m 3 not to be exceeded more than 24 times a year 125 µg/m 3 not to be exceeded more than 3 times a year 266 µg/m 3 not to be exceeded more than 35 times a year 1 hour mean 24 hour mean 15 minute mean a. Air Quality (Northern Ireland) Regulations b. The objectives for nitrogen dioxide are provisional. c. Measured using the European gravimetric transfer sampler or equivalent. d. These 2010 Air Quality Objectives for PM10 apply in Scotland only, as set out in the Air Quality (Scotland) Amendment Regulations
12 AEAT/ENV/R/ The difference between standards and objectives in the UK AQS Air quality standards (in the UK AQS) are the concentrations of pollutants in the atmosphere that can broadly be taken to achieve a certain level of environmental quality. The standards are based on assessment of the effects of each pollutant on human health including the effects on sensitive subgroups. The standards have been set at levels to avoid significant risks to health. The objectives of the UK air quality policy are framed on the basis of the recommended standards. The objectives are based on the standards, but take into account feasibility, practicality, and the costs and benefits of fully complying with the standards. Specific objectives relate either to achieving the full standard or, where use has been made of a short averaging period, objectives are sometimes expressed in terms of percentile compliance. The use of percentiles means that a limited number of exceedences of the air quality standard over a particular timescale, usually a year, are permitted. This is to account for unusual meteorological conditions or particular events such as November 5th. For example, if an objective is to be complied with at the 99.9th percentile, then 99.9% of measurements at each location must be at or below the level specified. 3
13 AEAT/ENV/R/ The UK Air Quality Strategy 2.1 NATIONAL AIR QUALITY STANDARDS The Government prepared the Air Quality Strategy for England, Scotland, Wales and Northern Ireland for consultation in August It was published in January 2000 (DETR, 2000) with an addendum issued in February The Air Quality Strategy uses national air quality standards to enable air quality to be measured and assessed. These also provide the means by which objectives and timescales for the achievement of objectives can be set. These standards and associated specific objectives to be achieved between 2003 and 2010 are shown in Table 1.1. The table shows the standards in mass concentrations (µg m-3 or mg m-3) with the number of exceedences that are permitted (where applicable) and the equivalent percentile. 2.2 TIMESCALES TO ACHIEVE THE OBJECTIVES FOR THE POLLUTANTS IN AIR QUALITY STRATEGY In most local authorities in the UK, objectives were (or will be) met for most of the pollutants within the timescale of the objectives shown in Table 1.1. It is important to note that the objectives for NO 2 remain provisional. The Government has recognised the problems associated with achieving the standard for ozone and this will not therefore be a statutory requirement. Ozone is a secondary pollutant and transboundary in nature and it is recognised that local authorities themselves can exert little influence on concentrations when they are the result of regional primary emission patterns. 2.3 AIR QUALITY REVIEWS THE APPROACHES AND EXPECTED OUTCOMES Technical Guidance has been issued in Review and Assessment: Technical Guidance LAQM.TG (03)1 to enable air quality to be monitored, modelled, reviewed and assessed in an appropriate and consistent fashion. This updating and screening assessment has considered the procedures set out in this technical guidance. The primary objective of undertaking a review of air quality is to identify any areas that are unlikely to meet national air quality objectives and ensure that air quality is considered in local authority decision-making processes. The complexity and detail required in a review depends on the risk of failing to achieve air quality objectives and it has been proposed therefore that reviews should be carried out in two steps. Both steps of review and assessment may be necessary and every authority is expected to undertake at least a first stage review and assessment of air quality in their authority area. The steps are briefly described in Table
14 AEAT/ENV/R/2220 Table 2.1 Brief details of steps in the third Round of the Air Quality Review and Assessment process Level Assessment of Objective Approach Updating Screening and To identify those matters that have changed since the last review and assessment, which might lead to a risk of an air quality objective being exceeded Use a checklist to identify significant changes that require further consideration. Where such changes are identified, than apply simple screening tools to decide whether there is sufficient risk of an exceedence of an objective to justify a Detailed Assessment Detailed Assessment To provide an accurate assessment of the likelihood of an air quality objective being exceeded at locations with relevant exposure. This should be sufficiently detailed to allow the designation or amendment of any necessary AQMAs Use quality-assured monitoring and validated modelling methods to determine current and future pollutant concentrations in areas where there is a significant risk of exceeding an air quality objective. Annual reports Progress Local authorities should prepare annual air quality Progress Reports between subsequent rounds of reviews and assessments. The concept is that this will ensure continuity in the LAQM process. The precise format of the progress report is left up to the local authority to decide, but guidance on what it should cover is available in LAQM.PRG(03) 5, published in It is envisaged that these Progress Reports could be useful for the compilation of annual state of the environment reports that many authorities already prepare. The current deadline for completion of updating and screening assessments is April 2006, and for detailed assessments April
15 AEAT/ENV/R/ LOCATIONS THAT THE REVIEW AND ASSESSMENT MUST CONCENTRATE ON For the purpose of review and assessment, the authority should focus their work on locations where members of the public are likely to be exposed over the averaging period of the objective. Table 2.2 summarises the locations where the objectives should and should not apply. Table 2.2 Typical locations where the objectives should and should not apply Averaging Period Pollutants Objectives should apply at Objectives should not generally apply at Annual mean 1,3 Butadiene Benzene Lead Nitrogen dioxide Particulate Matter (PM 10) All background locations where members of the public might be regularly exposed. Building facades of offices or other places of work where members of the public do not have regular access. Building facades of residential properties, schools, hospitals, libraries etc. Gardens of residential properties. Kerbside sites (as opposed to locations at the building facade), or any other location where public exposure is expected to be short term 24 hour mean and 8-hour mean Carbon monoxide Particulate Matter (PM 10) Sulphur dioxide All locations where the annual mean objective would apply. Kerbside sites (as opposed to locations at the building facade), or any other location where public exposure is expected to be short term. Gardens of residential properties. 1 hour mean Nitrogen dioxide Sulphur dioxide All locations where the annual mean and 24 and 8-hour mean objectives apply. Kerbside sites where the public would not be expected to have regular access. Kerbside sites (e.g. pavements of busy shopping streets). Those parts of car parks and railway stations etc. which are not fully enclosed. Any outdoor locations to which the public might reasonably be expected to have access. 15 minute mean Sulphur dioxide All locations where members of the public might reasonably be exposed for a period of 15 minutes or longer. It is unnecessary to consider exceedences of the objectives at any location where public exposure over the relevant averaging period would be unrealistic. Locations should also represent non-occupational exposure. 6
16 AEAT/ENV/R/ Information used to support this assessment This section lists the key information used in this review and assessment. 3.1 CONCLUSIONS FROM THE SECOND ROUND OF REVIEW AND ASSESSMENT OF AIR QUALITY FOR THE LONDON BOROUGH OF HILLINGDON The London Borough of Hillingdon has completed the following review and assessments of air quality to date: Stage 1: The report recommended that further examination was required for nitrogen dioxide, PM 10, sulphur dioxide and carbon monoxide. Stage 2: Further assessment of nitrogen dioxide, PM 10, sulphur dioxide and carbon monoxide were carried out as recommended in the Stage 1 Review and Assessment. The report concluded that the air quality objectives for NO 2, PM 10, CO and SO 2 would not be met in Hillingdon and that a stage 3 assessment was required. Stage 3: Detailed modelling of nitrogen dioxide, PM 10, carbon monoxide and sulphur dioxide were carried out. The report concluded that the annual mean nitrogen dioxide and 24 hour mean PM 10 objectives would not be met in the borough and that an air quality management area should be declared. Stage 4: Further modelling and source apportionment were undertaken in the form of a stage 4 assessment. As a result, the London Borough of Hillingdon has declared an air quality management area and developed an action plan Review and Assessment: The report concluded the strategy objectives for nitrogen dioxide are not likely to be achieved by There is a need to progress to a detailed review and assessment for this pollutant as an AQMA had already been declared for this area during the previous round of Assessment. However DEFRA and the GLA advised that a full Detailed Assessment was not required at this stage. The main area of difference from previous review and assessment work was the release of a new Heathrow Emission Inventory by BAA Heathrow. Given the release of the Aviation White Paper and its recommendations to refine air quality modelling around Heathrow, L B Hillingdon are waiting to use the recommendations from this process before proceeding with modelling. It is concluded that the strategy objectives for PM10 as a result of road transport emission are not likely to be achieved by 2004 or However, modelling around the major road corridors showed that the exceedences were confined to the major road corridors and there was no relevant public exposure. The 2010 objectives are not yet in legislation Progress Report: During 2004, the annual mean standard for NO 2 was exceeded at both roadside and background sites within the Borough These results support the earlier decision to declare an AQMA (Air Quality Management Area) across the southern half of the Borough, and to adopt the AQAP based on the exposure of parts of the Hillingdon population to these levels of NO 2. 7

17 AEAT/ENV/R/2220 Figure 1 shows the AQMA in the London Borough of Hillingdon Description: Area from the Chiltern-Marylebone railway line and then east along the railway line to the southern borough boundary. Pollutants Declared: Nitrogen dioxide (NO 2 ) 8
18 AEAT/ENV/R/ PROPOSED DEVELOPMENTS WHICH MAY AFFECT AIR QUALITY Any new developments in the local authority area, or outside the LA that may impact on local air quality need to be considered. Key considerations should include: o Industry There are no significant industrial developments planned in the London Borough of Hillingdon or the neighbouring authorities. o Housing and redevelopment There are no known confirmed housing and redevelopment schemes planned in the London Borough of Hillingdon or the neighbouring authorities. Road Network changes The Highways Agency is planning an improvement to Junction 4 of the M4 which, according to Highways Agency, may have slight beneficial effects to the local air quality as it will be designed to reduce queuing. This issue should be considered in the next round of Update and Screening Assessment. Consultations with surrounding Boroughs regarding new Part As/PartBs/developments showed that there are no new Part As/PartBs/developments, which might likely have an impact on the air quality in Hillingdon Borough Council There are no significant industrial, housing or road transport development schemes planned in Hillingdon, which will be completed in the timescale relevant to the air quality objectives within the current round of review and assessment ( ). The next round will need to include: The current widening of the M25 may affect future traffic levels around the south of Hillingdon on the M4 and M25. At this stage there are insufficient data (traffic count data) available for a more detailed analysis. Thus, this issue should be picked up during the next round of Update and Screening Assessment as the widening of the M25 may cause increasing traffic flow. The construction of Terminal 5 is currently underway (Phase 1 of Terminal 5 development) and has planning conditions attached to it for the suppression of dust and particulate matter. The terminal is due to be operational by A full years data from the associated monitoring stations is not yet fully ratified for Thus, the analysis is based on 2004 figures. Close to the Hillingdon boundary at Colnbrook, a new incinerator, which is a plant Part A process, has been granted permission which could result in increased emissions. This will not be fully operational until The extension of N3 car park at Longford has been agreed and will be operational end of A planning application has been agreed for a 2300 space car park within Heathrow airport boundary with an operational date of RAF Northolt proposed development to expand the site is due to start in 2007 and will be completed in Air Quality Assessments have been performed for these planned developments and the proposed sources should be assessed in the next round of Review and Assessment. 3.3 ROAD TRAFFIC DATA This section summarises the information used in this report; more detailed information is given in Section 7.7. Data were collated from a range of sources, including: Data provided by the London Borough of Hillingdon from the London Atmospheric Emissions Inventory 2003 Data held in the National Atmospheric Emissions Inventory (NAEI, 2004). 9
19 AEAT/ENV/R/2220 Where no average speed data were available, estimated speeds were used near receptors and junctions. Speeds slower than the national speed limits have been assigned to sections of roads in areas close to junctions and adjustments made to take account of congestion Fraction of HDVs Percentages of Cars, LGVs, HGV and buses were available from the London Atmospheric Emissions Inventory. For other road links, the percentage of HDVs was calculated from the data held in the 2004 National Atmospheric Emissions Inventory Traffic growth Traffic projections for 2010 were obtained from the London Atmospheric Emissions Inventory (LAEI). No data were available for 2005 and so a conservative estimate was taken and data for 2003 were used. For 2005, growth factors from NRTF were used Distance from the centre of the road to the kerbside and to the receptors Initially a minimum distance for the receptor to the road was assumed. This therefore tests the road contribution to receptors as a worst-case scenario. Where any problems were identified the distances of receptors from the road were then taken from digital landline maps of the Council area. This strategy is a conservative approach. 3.4 PART A AND B PROCESSES There are Part A and Part B Industrial processes in the Borough of Hillingdon. A full list of Part A processes is given in Appendix AMBIENT MONITORING Diffusion tubes Diffusion tube monitoring was carried out at 19 locations for NO 2 and 5 Location for Benzene in the London Borough of Hillingdon. Analysis and preparation of the tubes has been carried out by Casella Stanger using 50% TEA in Acetone. In addition three diffusion tubes were co-located with each continuous monitor in the borough Continuous monitoring There is continuous monitoring of nitrogen dioxide, PM 10, sulphur dioxide and carbon monoxide at West Drayton (Appendix 1), Heathrow Airport and London Harlington. Continuous monitoring of nitrogen dioxide and PM 10 is also carried out at Hillingdon Hospital, South Ruislip, and Hillingdon Oxford Avenue. 10
20 AEAT/ENV/R/ Updating and Screening Assessment for Carbon Monoxide 4.1 THE NATIONAL PERSPECTIVE The main source of carbon monoxide in the United Kingdom is road transport, which accounted for 49% of total releases in Annual emissions of carbon monoxide have been falling steadily since the 1970s, and are expected to continue to do so. Current projections indicate that road transport emissions will decline by a further 53% between 2000 and Existing policies will be sufficient to reduce maximum daily 8-hour mean concentrations of carbon monoxide below 10 mgm -3 by about STANDARD AND OBJECTIVE FOR CARBON MONOXIDE The Government and the Devolved Administrations have been adopted an 8-hour running mean concentration of 11.6 mgm -3 as the air quality standard for carbon monoxide. The new objective has been set at a slightly tighter level of 10 mgm -3 as a maximum daily running 8-hour mean concentration had to be achieved by the end of 2003, bringing it into line with the second Air Quality Daughter Directive limit value. 4.3 CONCLUSIONS OF THE SECOND ROUND OF REVIEW AND ASSESSMENT FOR CARBON MONOXIDE The following conclusions were given for carbon monoxide in the earlier stages of Review and Assessment for the London Borough of Hillingdon Carbon monoxide was assessed in Stage 3 of the second round of the Review and Assessment process. The report concluded that the air quality objectives for carbon monoxide would be met in the London Borough of Hillingdon. 4.4 SCREENING ASSESSMENT OF CARBON MONOXIDE The Technical Guidance LAQM TG (03) requires assessment of carbon monoxide to consider the following sources, data or locations: Monitoring Data Very Busy Roads (Table A2.1) These are described in the following sections. 4.5 BACKGROUND CONCENTRATIONS FOR CARBON MONOXIDE The average background carbon monoxide concentration estimated from the UK background maps ( was 0.29 mgm -3 in 2005 with a maximum concentration of 0.35mgm -3 in The predicted average value for 2010 is 0.20 mgm -3 with a maximum concentration of mgm -3 in SCREENING ASSESSMENT OF MONITORING DATA There is continuous monitoring of carbon monoxide at West Drayton, Harlington (LH0 AURN) and Heathrow Airport (LH2) in the borough. In 2005 concentrations were well below the 10 mg/m 3 objective as a maximum daily eight hour mean (table 4.6 and 4.7). 11
21 AEAT/ENV/R/2220 The monitoring station in West Drayton is in a suburban area close to the M4. Table 3.6 below shows the annual mean CO concentrations over the past 6 years for Hillingdon. Table 4.1 Annual mean CO concentrations Year Annual Mean CO (mg m -3 ) Exceedence of 8 hour running mean > 10 mg m No No No No No No Table 4.2 Maximum rolling 8 hour mean CO concentration in µgm -3 between and Site Code Site Type Site Name Result (µgm-3) LH0 Urban background Harlington - AURN 2.68 µgm -3 LH2 Urban background Heathrow Airport 2.45 µgm SCREENING ASSESSMENT OF VERY BUSY ROADS The guidance document LAQM TG (03) requires assessment of CO only at very busy roads (See Box 2.2 in the Guidance) where the 2003 background concentration is expected to be above 1mgm -3. The maximum predicted background CO concentration in the borough in 2005 is 0.35mgm -3. Consequently, the CO objective is met in the London Borough of Hillingdon. 4.8 CONCLUSIONS FOR CARBON MONOXIDE CONCENTRATIONS IN THE LONDON BOROUGH OF HILLINGDON AREA There are no areas in the London Borough of Hillingdon where the estimated background CO concentration in 2005 or predicted values for 2010 are greater than 1mgm -3. A detailed assessment is not required for carbon monoxide in the London Borough of Hillingdon. Item Response Monitoring data Monitoring data indicates no exceedence of the objective for CO Very busy roads or junctions in built-up areas No very busy roads, and background concentration is below the threshold Updating and Screening Assessment Summary Checklist for Carbon Monoxide 12
22 AEAT/ENV/R/ Updating and Screening Assessment for Benzene 5.1 THE NATIONAL PERSPECTIVE The main sources of benzene emissions in the UK are petrol-engined vehicles, petrol refining, and the distribution and uncontrolled emissions from petrol station forecourts without vapour recovery systems. A number of policy measures already in place, or planned for future years, will continue to reduce emissions of benzene. Since January 2000, EU legislation has reduced the maximum benzene content of petrol to 1%, from a previous upper limit of 5%. The European Auto-Oil programme will further reduce emissions for cars and light-duty vehicles, and emissions of benzene from the storage and distribution of petrol are controlled by vapour recovery systems. Forecasts based on national mapping suggest that the policy measures currently in place will achieve the 2003 objective at all urban background and roadside/kerbside locations. Whilst the 2010 objectives are expected to be met at all urban background, and most roadside locations, there is the possibility for some remaining exceedences, which will require additional measures at a local level. 5.2 STANDARD AND OBJECTIVE FOR BENZENE The Government and the Devolved Administrations adopted a running annual mean concentration of µgm -3 as the air quality standard for benzene, with an objective for the standard to have been achieved by the end of However, in light of the health advice from EPAQS and the Department of Health s Committee on Carcinogenicity of Chemicals in Food, Consumer Products and the Environment (COC) to reduce concentrations of benzene in air to as low a level as possible, additional tighter objectives have also been set. The additional objective is for an annual mean of 5 µgm -3 to be achieved by the end of 2010 in England and Wales. In Scotland and Northern Ireland, a running annual mean of 3.25 µgm -3 has been adopted as an additional objective, to be achieved by the end of CONCLUSIONS OF THE SECOND ROUND OF REVIEW AND ASSESSMENT FOR BENZENE The following conclusions were given for benzene in of the 2003 Review and Assessment Report for the London Borough of Hillingdon. Benzene was assessed in Stage 1 of the first round of the Review and Assessment process. The report concluded that the air quality objectives for benzene would be met in the London Borough of Hillingdon. 5.4 SCREENING ASSESSMENT OF BENZENE The Technical Guidance LAQM.TG (03) requires assessment of benzene to consider the following sources, data or locations: Monitoring Data Very Busy Roads or Junctions in Built-up Areas Industrial Sources Petrol Stations Major Fuel Storage Depots (Petroleum only) These are described in the following sections. 13
23 AEAT/ENV/R/ BACKGROUND CONCENTRATIONS FOR BENZENE The average background benzene concentration estimated from the UK background maps ( was 0.6 µgm -3 in 2005 with a maximum concentration of 0.8µgm -3. In 2010 an average of 0.5µgm -3 and maximum of 0.7µgm -3 are expected. 5.6 SCREENING ASSESSMENT OF MONITORING DATA There has been monitoring of benzene by diffusion tubes at five sites in Hillingdon since November Data is available up until December This is sufficient to demonstrate that the risk of exceedence of the objectives is negligible. A summary of the results is shown in Table 4.6 below. Table 5.1 Average benzene concentrations recorded by diffusion tubes in Hillingdon between January 2005 and December 2005 (µg/m 3 ). Location Easting (X) Northing (Y) Site type Annual mean concentration AURN Monitoring Station S 1.5 South Ruislip Monitoring Station R 2.0 Citizens Advice, High Street, Ruislip B 2.0 Hillingdon Hospital Monitoring R 1.9 Station Brendon Close, Harlington B 1.7 The results show that where monitoring is taking place there are no exceedences of the running annual mean objective of µg/m 3 to have been achieved by 31 st December 2003 or the annual mean of 5 µg/m 3 to be achieved by Please see figure 4.6 for a map of the monitoring locations. All monitoring Stations are within the AQMA except the station at Citizens Advice, High Street, Ruislip. 14
24 19 M4 - ho us es at Ke at sw a ye tc AEAT/ENV/R/2220 Figure 2 Locations of benzene diffusion tubes in the London Borough of Hillingdon # # # # Hillingdon benzene diffusion tubes Hillingdon Roads Housing Kerb Centre of lane # N W E # S Kilometers 15
25 AEAT/ENV/R/ SCREENING ASSESSMENT OF VERY BUSY ROADS The guidance document LAQM.TG (03) requires assessment of benzene only at very busy roads where the 2010 background concentrations are expected to be above 2 µgm -3. In the London Borough of Hillingdon background concentrations in 2010 are not expected to exceed 0.7 µgm -3 (see section 4.5). Therefore, no further assessment is required for this source. 5.8 SCREENING ASSESSMENT OF INDUSTRIAL SOURCES The Guidance LAQM.TG (03) lists the following processes as significant potential sources of benzene: Part A (The number provided in brackets is the percentage of total emissions from all UK plant in this sector to the total UK Part A emissions) Petroleum processes (73) Petrochemical processes (2) Carbonisation processes (12) Cement/lime manufacture (7) Gasification processes (5) Part B Processes for the storage and unloading of petrol at terminals The part A and B processes in the London Borough of Hillingdon and neighbouring authorities have been checked against Tables A2.181 and A2.182 respectively in the Technical guidance. None of these processes are operating in Hillingdon Borough Council or have the potential to emit benzene. 5.9 SCREENING ASSESSMENT OF PETROL STATIONS There are petrol stations in Hillingdon authorised as Part B processes. The guidance requires petrol stations to be considered only if they are near a busy road, i.e. with more than 30,000 vehicles per day, a throughput greater than 2 million litres and a relevant exposure within 10m of the pumps. Petrol stations with Stage 2 recovery systems can be ignored. It is not thought that any of the petrol stations in the London Borough of Hillingdon fulfil the criteria necessary to warrant a detailed assessment therefore a detailed assessment for benzene is not required SCREENING ASSESSMENT OF FUEL STORAGE DEPOTS There are no major fuel storage depots in the London Borough of Hillingdon CONCLUSIONS FOR BENZENE CONCENTRATIONS IN THE LONDON BOROUGH OF HILLINGDON There are no significant industrial sources of benzene in the London Borough of Hillingdon. Also, monitoring of benzene in 2005 indicates that the 2003 and 2010 objective for benzene is likely to be met in the London Borough of Hillingdon. 16
26 AEAT/ENV/R/2220 Updating and Screening Assessment Summary Checklist for Benzene Item Monitoring data outside an AQMA Monitoring data within an AQMA Very busy roads or junctions in built up areas New industrial sources. Industrial sources with substantially increased emissions, or new relevant exposure Response Benzene diffusion tubes indicated no exceedence of benzene at any of the monitoring locations No AQMAs for benzene in area Hillingdon does not host any roads that are classified as very busy according to the criteria given in the guidance None present None present Petrol stations None meeting the criteria with relevant exposure Major fuel storage depots (petrol only) None A detailed assessment is, therefore, not required for benzene in the London Borough of Hillingdon. 17
27 AEAT/ENV/R/ Updating and Screening Assessment for 1,3- Butadiene 6.1 THE NATIONAL PERSPECTIVE The main source of 1,3-butadiene in the United Kingdom is emissions from motor vehicle exhausts. 1,3-butadiene is also an important industrial chemical and is handled in bulk at a small number of industrial premises. Maximum running annual mean concentrations of 1,3-butadiene measured at all urban background/centre and roadside locations in the national network are already well below the 2003 objective of 2.25 µgm -3. The increasing numbers of vehicles equipped with three way catalysts will significantly reduce emissions of 1,3-butadiene in future years. Recently agreed further reductions in vehicle emissions and improvements to fuel quality are expected to further reduce emissions of 1,3-butadiene from vehicle exhausts. 6.2 STANDARD AND OBJECTIVE FOR 1,3-BUTADIENE The Government and the Devolved Administrations adopted a maximum running annual mean concentration of 2.25 µgm -3 as an air quality standard for 1,3-butadiene. The objective is for the standard to have been achieved by the end of CONCLUSIONS OF THE SECOND ROUND OF REVIEW AND ASSESSMENT FOR 1,3-BUTADIENE The following conclusions were given for 1,3-butadiene in the 2003 of Review and Assessment Report for Hillingdon: Estimated background concentrations and data from national monitoring stations indicate that the objective for 1,3-butadiene is likely to be achieved by the end of There are no industrial processes, current or proposed, in Hillingdon that have the potential to emit 1,3-butadiene. A detailed assessment is not required for 1,3-butadiene in the London Borough of Hillingdon. Emissions from vehicles are expected to decrease over the relevant period. National policy measures are expected to deliver the national air quality objective for 1,3-butadiene by the end of SCREENING ASSESSMENT OF 1,3-BUTADIENE The Technical Guidance LAQM.TG (03) requires assessment of 1,3-butadiene to consider the following sources, data or locations: Monitoring Data New Industrial Sources Existing Industrial Sources with Significantly Increased Emissions These are described in the following sections. 6.5 BACKGROUND CONCENTRATIONS FOR 1,3-BUTADIENE The average background 1,3-butadiene concentration estimated from the UK background maps ( was 0.3µgm -3 in 2005 with a maximum concentration of 0.4µgm -3. In 2010, the average is predicted at 0.2µgm -3 and the maximum 0.3µgm
28 AEAT/ENV/R/ SCREENING ASSESSMENT OF MONITORING DATA No monitoring of 1,3-butadiene has been undertaken in the London Borough of Hillingdon. 6.7 SCREENING ASSESSMENT OF INDUSTRIAL SOURCES The Guidance LAQM TG. (03) lists the following processes as significant potential sources of 1,3- butadiene: Part A (percentage of total emissions from all UK plant in this sector to the UK total in brackets) Petroleum processes (2) Petrochemical processes (95) Organic chemical manufacture (3) Part B Rubber processes The part A and B processes have been checked against Tables A2.181 and A2.182 in the Technical Guidance. There are no other industrial processes, in neighbouring areas that have the potential to emit 1,3-butadiene. Within Slough BC, close to the Hillingdon boundary at Colnbrook, a new incinerator, which is a plant Part A process, has been granted permission which could result in increased emissions. However, this will not be fully operational until Air Quality Assessments have been performed for these planned developments but there are no additional data or other information available for further assessments. The proposed sources should be assessed in the next round of Review and Assessment. 6.8 CONCLUSIONS FOR 1,3-BUTADIENE CONCENTRATIONS IN THE LONDON BOROUGH OF HILLINGDON AREA Estimated background concentrations and data from national monitoring stations indicate that the objective for 1,3-butadiene is likely to be achieved by the end of There are no industrial processes, current or proposed, in Hillingdon that have the potential to emit 1,3-butadiene. Updating and Screening Assessment Summary Checklist for 1,3-butadiene Item Response Monitoring data None background maps indicate below the objective New industrial sources. Industrial sources with substantially increased emissions, or new relevant exposure None present Energy to waste incinerator at Colnbrook A detailed assessment is not required for 1,3-butadiene in the London Borough of Hillingdon. 19
29 AEAT/ENV/R/ Updating and Screening Assessment for Lead 7.1 THE NATIONAL PERSPECTIVE The agreement reached between the European Parliament and the Environment Council on the Directive on the Quality of Petrol and Diesel Fuels (part of the Auto-Oil Programme) has led to the ban on sales of leaded petrol in the United Kingdom with effect from 1 January Emissions of lead are now restricted to a variety of industrial activities, such as battery manufacture, pigments in paints and glazes, alloys, radiation shielding, tank lining and piping. Detailed assessments of the potential impact of lead emissions from industrial processes have been undertaken by the Government and the Devolved Administrations, based upon both monitoring and sector analysis studies. The former has included a 12-month monitoring survey in the vicinity of 30 key industrial sites in the UK, which has been used to supplement information already provided from the non-automatic monitoring networks. These monitoring data have generally indicated no exceedences of the 2004 or 2008 objectives, although locations in proximity to non-ferrous metal production and foundry processes were deemed to be at risk. 7.2 STANDARD AND OBJECTIVE FOR LEAD The Government and the Devolved Administrations adopted an annual mean concentration of 0.5 µgm -3 as the air quality standard for lead, with an objective for the standard to have been achieved by the end of In addition, a lower air quality objective of 0.25 µgm -3 to be achieved by the end of 2008 has also been set. 7.3 CONCLUSIONS OF THE SECOND ROUND OF REVIEW AND ASSESSMENT FOR LEAD The following conclusions were given for lead in 2003 Review and Assessment Report for the London Borough of Hillingdon. The report concluded that the air quality objectives for Lead would be met in the London Borough of Hillingdon. 7.4 SCREENING ASSESSMENT OF LEAD The Technical Guidance LAQM TG (03) requires assessment of lead to consider the following sources, data or locations: Monitoring Data outside an AQMA New Industrial Sources Existing Industrial Sources with Significantly Increased Emissions These are described in the following sections. 7.5 SCREENING ASSESSMENT OF MONITORING DATA No monitoring of lead has been undertaken in the London Borough of Hillingdon. 7.6 SCREENING ASSESSMENT OF INDUSTRIAL SOURCES The Guidance LAQM.TG (03) lists the following processes as significant potential sources of lead: Part A (percentage of total emissions from all UK plant in this sector to the UK total in brackets) Iron and steel (37) Non-ferrous metals (23) Manufacture of organic chemicals (35) 20
30 AEAT/ENV/R/2220 Part B Non-ferrous metal furnaces Electrical furnaces Blast cupolas Aluminium processes Zinc Processes Copper processes Lead glass manufacture The part A and B processes have been checked against Tables A2.181 and A2.182 in the Technical guidance. New Pro Foundries and Harvern Form Foundries have the potential to emit lead. However, there has been no substantial change in their emissions since the last review and assessment was carried out and therefore no further assessment is required. There are no industrial processes, current or proposed, in neighbouring areas that have the potential to emit lead. 7.7 CONCLUSIONS FOR LEAD CONCENTRATIONS IN THE LONDON BOROUGH OF HILLINGDON Emissions of lead from industrial processes in Hillingdon are not likely to exceed the objectives for lead to be achieved in 2004 and Updating and Screening Assessment Summary Checklist for Lead Item Response Monitoring data None New industrial sources. Industrial sources with substantially increased emissions, or new relevant exposure None None A detailed assessment is not required for lead in the London Borough of Hillingdon. 21
31 AEAT/ENV/R/ Updating and Screening Assessment for Nitrogen Dioxide 8.1 INTRODUCTION The principal source of NO x emissions is road transport, which accounted for about 40% of total UK emissions in Major roads carrying large volumes of high-speed traffic (such as motorways and other primary routes) are a predominant source, as are conurbations and city centres with congested traffic. Within most urban areas, the contribution of road transport to local emissions will be much greater than for the national picture. Meeting the annual mean objective in 2005, and the limit value in 2010, is expected to be considerably more demanding than achieving the 1-hour objective. National studies have indicated that the annual mean objective is likely to be achieved at all urban background locations outside of London by 2005, but that the objective may be exceeded more widely at roadside sites throughout the UK in close proximity to busy road links. Projections for 2010 indicate that the EU limit value may still be exceeded at urban background sites in London, and at roadside locations in other cities. 8.2 STANDARDS AND OBJECTIVES FOR NITROGEN DIOXIDE The Government and the Devolved Administrations adopted two Air Quality Objectives for nitrogen dioxide, as an annual mean concentration of 40 µgm -3, and a 1-hour mean concentration of 200 µgm -3 not to be exceeded more than 18 times per year. The objectives are to be achieved by the end of CONCLUSIONS OF THE FIRST AND SECOND ROUND OF REVIEW AND ASSESSMENT FOR NITROGEN DIOXIDE The following conclusions were given for nitrogen oxides in the 2003 Review and Assessment reports for the London Borough of Hillingdon: The conclusion of that report was that it was likely that air quality objectives for NO 2 would not be met in Hillingdon. An Air Quality Management Area (AQMA) has already been declared after the first round of Review and Assessment, in accordance with regulations, covering the southern 2/3 of the Borough. A detailed assessment was required for nitrogen dioxide for Heathrow Airport including the bus station at Heathrow and for various road traffic sources. Given the release of the Aviation White Paper and the commitment given by DfT to refine the Heathrow Emissions Inventory and modelling of air quality around Heathrow, L B Hillingdon, on advice from DEFRA will use outputs from this process to inform future review and assessment work with regards to Heathrow. 22
32 AEAT/ENV/R/ SCREENING ASSESSMENT OF NITROGEN DIOXIDE The Technical Guidance LAQM TG.(03) requires assessment of nitrogen dioxide to consider the following sources, data or locations: Monitoring data outside an AQMA Monitoring data within an AQMA Narrow congested streets with residential properties close to the kerb Junctions Busy streets where people may spend 1-hour or more close to traffic Roads with high flow of buses and/or HGVs New roads constructed or proposed since first round of review and assessment Roads close to the objective during the first round of review and assessment Roads with significantly changed traffic flows Bus Stations New industrial sources Industrial sources with substantially increased emissions Aircraft These are evaluated in the following sections. 8.5 BACKGROUND CONCENTRATIONS FOR NITROGEN DIOXIDE The average background nitrogen dioxide concentration estimated from the UK background maps ( In 2005 the estimated annual average of NO 2 was 27 µgm -3 with a maximum of 43,5 µgm -3. In 2010 the predicted estimated average of NO 2 is 24 µgm -3 with a maximum of 41 µgm SCREENING ASSESSMENT OF MONITORING DATA Diffusion tube monitoring Nitrogen dioxide was measured at 19 sites in the London Borough of Hillingdon (details in Appendix 1) by diffusion tubes. The Citizens Advice site is outside the AQMA. Diffusion tubes can under or over read and if possible should be referred to continuous measurements. This may be done in two ways: either by using results from tubes co-located with a continuous analyser or by using the results from studies carried out nationwide and collated by UWE (2006). There has been diffusion tubes co-located with the continuous monitors at the South Ruislip Monitoring Station, Hillingdon Hospital monitoring station and the AURN site. Both South Ruislip and the Hillingdon Hospital are roadside sites. The AURN site is in a suburban location. The Hillingdon Hospital site will not be used due to poor data capture. The following table shows the bias calculation using the _DifTPAB spreadsheet 3. Table 8.6.1A Bias calculation. Concentrations are shown in µg/m 3. Name of monitoring site Average conc. recorded by cont. monitor from Jan Dec 2005 Average conc. recorded by diffusion tubes from Jan Dec 2005 South Ruislip (roadside) AURN site (suburban) Bias
33 AEAT/ENV/R/2220 The figures shown in the above table have been used to bias correct the diffusion tube results in Hillingdon. The two factors are in very good agreement with each other. The diffusion tubes have been corrected by multiplying with as the more conservative factor of the two to represent a worst-case scenario. Table 8.6.1D shows a comparison of the Hillingdon Bias Adjustment factor calculation and factors from other nearby London Boroughs and the overall UWE factor, using the same Laboratory (Gradko, 50% TEA in Acetone). UWE didn t provide a 2005 bias adjustment factor for the London Borough of Hillingdon, only an overall factor for 2005 (1.18). As there is a large discrepancy between the overall UWE fact (1.18) and the two locally ones, measured factors in Hillingdon, will be used (see Table 8.6.1D). The Guidance LAQM.TG (03) provides factors to project forward concentrations, based on the concentrations measured in recent years. The following factors have been used in this assessment for nitrogen dioxide: Roadside 2005 to / Background 2005 to / The measurement data for January December 2005 (the latest 12 month period available) is shown in Table 8.6.1C below. Results are only shown where there are more than 9 months of data available as recommended in TG (03). Appendix 1 provides data for other years where available and a breakdown on a monthly basis. Table 8.6.1C Diffusion tube measurements in the London Borough of Hillingdon between January 2005 and December 2005 corrected for bias and predictions for All results are in µ/gm -3. Location Site Type Annual average 2005 unadjusted Annual average bias adjusted 2005 Uncertainty Prediction for Hayes End Drive B / Uxbridge Day Nursery R / Citizens Advice Bureau B / Hillingdon Primary School R / Colham Avenue R / Cowley Mill Road B / Warren Road B / Harold Avenue B / Phelps Way B / Cranford Lane B / Brendan Close B / Bomber Close B / Harmonsworth Green B / Heathrow Close B / North Hyde Gardens, 35.4 Hayes R / Sipson Road, Sipson R / Hatch Lane, Sipson R / Pinglestone Close, 27.1 Sipson R / Sipson Road, Sipson R / R Roadside B background Note: Figures in bold denote a predicted exceedence of the NO 2 annual mean objective. 6 Diffusion tubes show an exceedence in 2005 of the annual mean nitrogen dioxide objective when corrected for bias. All diffusion tubes are within close distance to residential receptors (within 10m) and located within the already existing AQMA. An action plan has been developed. In 2010, no diffusion tube location shows a predicted exceedence of the annual mean nitrogen dioxide objective. 24
34 AEAT/ENV/R/2220 Table 8.6.1D Comparison of bias adjustment factors. All results are in µ/gm -3. Location Site Type Annual average 2005 unadjusted LB Hillingdon (0.985) Annual average bias adjusted 2005 Overall UWE (1.18) LB Richmond (1.19) Hammersmith and Fulham (0.88) 83 Hayes End Drive B Uxbridge Day Nursery R Citizens Advice Bureau B Hillingdon Primary R School 4 Colham Avenue R Cowley Mill Road B Warren Road B Harold Avenue B Phelps Way B Cranford Lane B Brendan Close B Bomber Close B Harmonsworth Green B Heathrow Close B North Hyde Gardens, R Hayes 370 Sipson Road, R Sipson 34 Hatch Lane, Sipson R Pinglestone Close, R Sipson 486 Sipson Road, R Sipson R Roadside B background Note: Figures in bold denote a predicted exceedence of the NO 2 annual mean objective Automatic Monitoring There has been continuous monitoring at six locations in the London Borough of Hillingdon for nitrogen dioxide. The chemiluminescence monitors are located at Hillingdon Hospital, South Ruislip, Oxford Avenue, London Hillingdon at West Drayton, London Harlington and Heathrow Airport ( The concentrations recorded by the monitors are shown in Table below. Results for five of the six stations are provisional to the QA/QC standards used in the DEFRA network by ERG, King s College London. Data for West Drayton have not been fully ratified after 01/07/2005 4, Data for Hillingdon Hospital have not been fully ratified after 09/09/2005 5, Data for South Ruislip have not been fully ratified after 22/02/2005 6, Data for Oxford Avenue have not been fully ratified after 29/07/ Data for Heathrow Airport have not been fully ratified after 01 Jan
35 AEAT/ENV/R/2220 Table Concentrations recorded by continuous monitors in the London Borough of Hillingdon between January 2005 and December All results are in µgm -3. Location Site Type Annual average 2005 Number of exceedences of hourly mean Prediction for 2010 Hillingdon Hospital R South Ruislip R West Drayton (AURN S site) Harlington (AURN site) B Heathrow Airport B S/B suburban/background R roadside Data from the monitoring station at Oxford Avenue were not used due to a data capture rate of less then 75% for the chosen time span. This site has only been in full operation since March The concentrations recorded at three sites (South Ruislip, West Drayton (AURN site), Heathrow Airport) show that it is likely that the annual mean NO 2 objective in 2005 was exceeded. South Ruislip, West Drayton (AURN site) is within close distance (within10m) to residential receptors and located within the already existing AQMA. There are no relevant receptors close to the site located at Heathrow Airport. 8.7 SCREENING ASSESSMENT OF ROAD TRAFFIC SOURCES Traffic flow data for 2010 was taken from the 2003 LAEI. For 2005 traffic flow was estimated using growth factors provided by NRTF. Table 8.7A & B show predicted nitrogen dioxide concentrations in 2005 and 2010 calculated using DMRB for roads in the London Borough of Hillingdon. Predicted 2010 emissions in table 8.7B are based on roads showing an exceedence in 2005 or show emissions close to the 2004 air quality objective. All roads in the LAEI have been assessed, covering most of the main roads within Hillingdon Borough Council area, such as narrow congested streets with residential properties close to the kerb, busy streets where people spend an hour or more close to traffic, roads with a high proportion of HGVs and buses, roads close to the objective in the last round and those with significantly changed traffic flows. Table 8.7A Predicted nitrogen dioxide concentrations in 2005 calculated using DMRB for roads/junctions in the London Borough of Hillingdon (µgm -3 ). Receptor Road name AADTF % HDV Distance from nearest receptor (m) Annual average speed (km/h) Predicted annual mean NO 2 concentration M M A A A A A M A A A A A A A A A
36 AEAT/ENV/R/ A A M A A A A WESTERN AVENUE A40(T) WESTERN AVENUE A40(T) Note: a distance to road centre of 2.5 m was modelled as a worst-case scenario. Where an exceedence was found, the area was remodelled with actual distances. Speed data were taken from the LAEI Those roads / junctions where the annual mean NO 2 concentration in 2005 is predicted to be greater then 40µg/m 3 are shown in bold. Table 8.7B Predicted nitrogen dioxide concentrations in 2010 calculated using DMRB for roads/ junctions in the London Borough of Hillingdon (µgm -3 ). Receptor Road name AADTF % HDV Distance from nearest receptor (m) Annual average speed (km/h) Predicted annual mean NO 2 concentration A A A A M A A A A A M M Note: a distance to road centre of 2.5 m was modelled as a worst-case scenario. Where an exceedence was found, the area was remodelled with actual distances. Speed data were taken from the LAEI Those roads / junctions where the annual mean NO 2 concentration in 2005 is predicted to be greater then 40µg/m 3 are shown in bold. The DMRB model indicates that the 2005 objective of 40 µgm-3 is likely to be exceeded at receptors near the M25 and M4 motorways and the A4 at Heathrow Airport. In 2010, predicted values show 2 exceedences for NO 2 (at receptors close to the A4 (between A3044 and A408/ Heathrow Airport) and M25). All locations indicating exceedences are located within the already existing AQMA Street Canyons The DMRB model may significantly under-predict concentrations of nitrogen dioxide alongside urban city-centre roads classified as street canyons. In this context a street canyon may be described as a relatively narrow street with buildings on either sides, where the height of the buildings is generally greater than the width of the road. To avoid missing potential exceedences of the objective in such locations the predicted annual mean NO 2 road traffic component concentration, in the local output sheet of DMRB, is increased by a factor of 2, to take account of the model under-prediction. This is then added to the background to give total concentration (as advised in TG. (03)). There are no street canyon locations in the London Borough of Hillingdon Busy Junctions Annual average NO 2 concentrations at the busiest road junctions in the London Borough of Hillingdon have been estimated for 2005 and 2010 using DMRB (See Table 8.7A & B above). 27
37 AEAT/ENV/R/ SCREENING ASSESSMENT OF INDUSTRIAL SOURCES The Guidance LAQM TG (03) lists the following processes as significant potential sources of nitrogen dioxide: Part A (the number provided in brackets is the percentage of total emissions from all UK plant in this sector to the UK Part A total) Iron and steel (19) Petroleum processes (16) Combustion processes (34) Cement/lime manufacture (9) Carbonisation (6) Gasification (4) Inorganic chemicals (4) Part B Glass manufacture Industrial sources were assessed in rounds one and two. None of the sources were shown to be a problem in terms of the NO 2 objectives. New sources that are due to come into operation within since the last round of Review and Assessment are: Warehouse and Distribution development with 150 residential dwellings covering 57400m 2 with an predicted 0.1µg/m -3 increase in annual mean NO 2 at Stockley Bypass. Phase 1 of Terminal 5 development is due to open in 2008 (construction phase has moved from earthworks movements to fitting out operation which are potentially less dust generating). close to the Hillingdon boundary at Colnbrook, a new incinerator, which is a plant Part A process, has been granted permission which could result in increased emissions. This will not be fully operational until Proposed projects that have the potential to emit significant quantities of NO2: Extension of N3 car park at Longford with a predicated 0.08 µg/m -3 increase in mean annual NO space car park within Heathrow airport boundary with an operational date of 2007 RAF Northolt proposal to increase site, which predicted a 1.63 µg/m -3 increase in NO 2 in 2011 at nearest receptor point Air Quality Assessments have been performed for these planned developments but there are no additional data or other information available for further assessments. The proposed sources should be assessed in the next round of Review and Assessment. All of them are located within the AQMA. 8.9 SCREENING ASSESSMENT OF OTHER TRANSPORT SOURCES Bus Stations The bus station at Heathrow airport has 455,900 9 movements per annum. A flow of 1000 per day is given in the Guidance as the level requiring further investigation. Further investigation in USA requires the use of DMRB to predict the NO 2 annual mean at relevant locations. When DMRB is applied to this bus station an annual average NO 2 concentration of 41µg/m 3 is obtained. The DMRB screening model does not estimate the hourly concentrations. However, the guidance states that if 9 Source: Transport for London 28
38 AEAT/ENV/R/2220 the annual mean does not exceed 40 µg/m 3, then there should be no more than 18 hours above 200 µg/m 3 (the objective to be achieved by 31 st December 2005). In this case, DMRB predicts an annual mean concentration of 41 µg/m 3. Heathrow Airport is located within the already existing AQMA and a detailed assessment is not necessary. The bus station at Hatton Cross is estimated to have 364, bus movements a year. This averages out at 999 bus movements per day. This is just below the threshold set out in the guidance for requiring further assessment (1000 movements a day) and therefore Hillingdon Borough Council do not need to proceed for to a detailed assessment for this source. When DMRB is applied to this bus station an annual average NO 2 concentration of 39µg/m3 is obtained, which does not exceed 40 µg/m Airports Heathrow airport is located within the London Borough of Hillingdon. It will have total equivalent passenger throughput in 2005 greater than 5 million passengers per annum (mppa). The Air pollution Report which has been carried out within the airport boundary (LHR2) shows that an annual mean nitrogen dioxide value of 55 µg/m 3 in 2004, indicating an exceedence of the annual mean nitrogen dioxide objective of 40 µg/m 3. According to the Guidance (LAQM.TG (03) Update January 2006) airports with a predicated total equivalent passenger throughput more than 5 mppa should proceed to a Detailed Assessment for NO 2. However Heathrow Airport is located in the already existing AQMA and thus a detailed assessment is not necessary Railways Latest modelling sent out by ERG of the LAEI showed exceedences of NO 2 by trains using the Paddington to South West route. This should be taken into consideration during the next round of Update and Screening Assessment CONCLUSIONS FOR NITROGEN DIOXIDE CONCENTRATIONS IN THE LONDON BOROUGH OF HILLINGDON Predicted concentrations of nitrogen dioxide indicate that the annual average objective is likely to be exceeded in 2005 in various locations in the borough. This has been confirmed by the diffusion tube and continuous monitoring. Updating and Screening Assessment Summary Checklist for Nitrogen Dioxide Item Monitoring data outside an AQMA Monitoring data within an AQMA Narrow congested streets with residential properties close to the kerb Junctions. Busy streets where people may spend 1-hour or more close to traffic Roads with high flow of buses and/or HGVs. New roads constructed or proposed since the previous round of R&A Response Monitoring data (Citizens Advice Bureau) indicates no exceedence of the objective for NO 2 Some exceedences within AQMA No street canyon located in the London Borough of Hillingdon DMRB indicates exceedences at locations close to the M4, M25, A3044. All locations are within the AQMA. DMRB indicates exceedences at 6 locations close to the M4, M25, A3044. All locations are within the AQMA. DMRB indicates exceedences at M25, M4. All locations are within the AQMA. No major road changes (except for motorway M4, junction 4 improvement) 10 Source: Transport for London 11, Air Pollution Report HEATHROW LHR 2 01 January to 31 December 2004,
39 AEAT/ENV/R/2220 round of R&A Roads with significantly changed traffic flows, or new relevant exposure Bus Stations New industrial sources. Industrial sources with substantially increased emissions, or new relevant exposure Aircraft DMRB indicates no exceedences There are more than 1000 bus movements per day, but there are currently no residential properties within 10m of the bus station. Heathrow Terminal 5, Warehouse and Distribution development, Colnbrook new incinerator None present Heathrow Airport is above the 5mppa threshold. All location showing exceedences are with the already existing AQMA and thus Hillingdon is not required to proceed to a detailed assessment for NO 2. 30
40 AEAT/ENV/R/ Updating and Screening Assessment for Sulphur Dioxide 9.1 INTRODUCTION The main source of sulphur dioxide in the United Kingdom is power stations, which accounted for more than 69% of emissions in There are also significant emissions from other industrial combustion sources. Domestic sources now only account for 3% of emissions, but can be locally much more significant. Road transport currently accounts for less than 1% of emissions. Local exceedences of the objectives (principally the 15-minute mean objective) may occur in the vicinity of small combustion plant (less than 20 MW) which burn coal or oil, in areas where solid fuels are the predominant form of domestic heating, and in the vicinity of major ports. 9.2 STANDARD AND OBJECTIVE FOR SULPHUR DIOXIDE The Government and the Devolved Administrations have adopted a 15-minute mean of 266 µgm -3 as an air quality standard for sulphur dioxide, with an objective for the standard not to be exceeded more than 35 times in a year by the end of Additional objectives have also been set which are equivalent to the EU limit values specified in the First Air Quality Daughter Directive. These are for a 1-hour mean objective of 350 µgm -3, to be exceeded no more than 24 times per year, and a 24-hour objective of 125 µgm -3, to be exceeded no more than 3 times per year, to be achieved by the end of CONCLUSIONS OF THE SECOND ROUND OF REVIEW AND ASSESSMENT FOR SULPHUR DIOXIDE The following conclusions were given for SO 2 in the 2003 of Review and Assessment Report for the London Borough of Hillingdon There are no significant industrial or domestic sources of sulphur dioxide in the London Borough of Hillingdon that are expected to exceed the SO 2 objectives. A detailed assessment is not required for sulphur dioxide. 9.4 SCREENING ASSESSMENT OF SULPHUR DIOXIDE The Technical Guidance LAQM.TG (03) requires assessment of sulphur dioxide to consider the following sources, data or locations: Monitoring data within an AQMA Monitoring data outside an AQMA New industrial sources Industrial sources with substantially increased emissions Areas of domestic coal burning Small boilers (>5MW (thermal) burning coal or oil Shipping Railway Locomotives These are evaluated in the following sections. 9.5 BACKGROUND CONCENTRATIONS FOR SULPHUR DIOXIDE The estimated average background sulphur dioxide concentration taken from the UK background maps ( for 2001 was 5.9 µgm -3, the maximum concentration was 33 µgm
41 AEAT/ENV/R/ SCREENING ASSESSMENT OF MONITORING DATA There is continuous monitoring of sulphur dioxide at the West Drayton site. A comparison with the SO 2 objectives is shown in Table 8.6 below. Table 9.6 Comparison with the SO 2 objectives at West Drayton in 2005 Pollutant Objective Result Objective achieved Sulphur dioxide No more than 24 occurrences of 0 YES hourly mean >132ppb Sulphur dioxide No more than 3 days where daily 0 YES mean >47ppb Sulphur dioxide No more than 35 occurrences of 15min mean >100ppb 0 YES Note: Sulphur Dioxide achieved a capture rate less than 75% for the year 2005 (44%). Results may not be representative of the full year and should be used for guidance only. 9.7 SCREENING ASSESSMENT OF INDUSTRIAL SOURCES The Guidance LAQM.TG (03) lists the following processes as significant potential sources of sulphur dioxide: Part A (percentage of total emissions from all UK plant in this sector to the UK Part A total in brackets) Iron and steel (9) Petroleum processes (15) Combustion processes (45) Cement/lime manufacture (3) Carbonisation (10) Non-ferrous metals (7) Ceramic Production (9) Part B Combustion plant mwth Furnaces mwth Copper processes Refractory goods Glass manufacture Roadstone coating There are no new industrial sources or sources with substantially increased emissions in the London Borough of Hillingdon since the last review was completed Small Boilers No small boiler processes were identified by the London Borough of Hillingdon greater than 5MW which are relevant to this assessment. 9.8 SCREENING ASSESSMENT OF DOMESTIC SOURCES Domestic coal burning There is no data for domestic coal burning available but solid fuel use continues to decline throughout the area. It believed that there are no areas with over 100 houses using these fuels in a 500m x 500m square. 32
42 AEAT/ENV/R/ SCREENING ASSESSMENT OF OTHER TRANSPORT SOURCES Railways According to information supplied there are no areas where railway engines are run for more than 15 minutes continuously and where members of the public might be exposed CONCLUSIONS FOR SULPHUR DIOXIDE CONCENTRATIONS IN THE LONDON BOROUGH OF HILLINGDON There are no significant industrial or domestic sources of sulphur dioxide in the London Borough of Hillingdon that are expected to exceed the SO 2 objectives. Updating and Screening Assessment Summary Checklist for Sulphur Dioxide Item Monitoring data outside an AQMA Monitoring data within an AQMA New industrial sources. Industrial sources with substantially increased emissions, or new relevant exposure Areas of domestic coal burning Response Monitoring data indicates no exceedences of any of the objectives No AQMAs declared for SO2 None present None present Not relevant Small Boilers (thermal). Shipping > 5 MW None identified Not relevant Railway Locomotives Not relevant A detailed assessment is not required for sulphur dioxide. 33
43 AEAT/ENV/R/ Updating and Screening Assessment for PM THE NATIONAL PERSPECTIVE National UK emissions of primary PM 10 have been estimated as totalling tonnes in The main sources of primary PM 10 are road transport (all road transport emits PM10, but diesel vehicles emit a greater mass of particulate per vehicle kilometre), stationary combustion (domestic coal combustion has traditionally been the major source of particulate emissions in the UK) and industrial processes (including bulk handling, construction, mining and quarrying). Emissions of PM10 from the UK have declined since This is due mainly to the reduction in coal use. The Government established the Airborne Particles Expert Group (APEG) to advise on sources of PM 10 in the UK and current and future ambient concentrations. Their conclusions were published in January 1999 (APEG, 1999). APEG concluded that a significant proportion of the current annual average PM 10 is due to the secondary formation of particulate sulphates and nitrates, resulting from the oxidation of sulphur and nitrogen oxides. These are regional scale pollutants and the annual concentrations do not vary greatly over a scale of tens of kilometres. There are also natural or semi-natural sources such as wind-blown dust and sea salt particles. The impact of local urban sources is superimposed on this regional background. Such local sources are generally responsible for winter episodes of hourly mean concentrations of PM 10 above 100 µg m -3 associated with poor dispersion. However, it is clear that many of the sources of PM 10 are outside the control of individual local authorities and the estimation of future concentrations of PM 10 are in part dependent on predictions of the secondary particle component STANDARD AND OBJECTIVE FOR PM 10 The Government and the Devolved Administrations have adopted two Air Quality Objectives for fine particles (PM10), which are equivalent to the EU Stage 1 limit values in the first Air Quality Daughter Directive. The objectives are 40 µgm-3 as the annual mean, and 50 µgm-3 as the fixed 24-hour mean to be exceeded on no more than 35 days per year, to have been achieved by the end of In addition there is an objective of 50 µgm-3 as the fixed 24-hour mean to be exceeded on no more than 7 days per year and 20 µgm-3 as the annual mean to be achieved by the end of The objectives are based upon measurements carried out using the European gravimetric transfer reference sampler or equivalent. It should be noted that the objectives for 2010, based on the Stage 2 EU Limit Values have not been included in the Air Quality Regulations for England, and local authorities are not currently required to assess against them. In addition, they were the subject of the European Commission s recent review of the First Daughter Directive. The Commission is currently consulting on a new consolidated Directive on Ambient Air Quality, which is likely to see changes to the above Limit Values, though the nature of these changes cannot be confirmed at this time CONCLUSIONS OF THE SECOND ROUND OF REVIEW AND ASSESSMENT FOR PM 10 The following conclusions were given for PM 10 in the 2003 Review and Assessment Report for the London Borough of Hillingdon: The DMRB screening model indicated that the annual mean objective for PM 10 will be not met in 2004, and that exceedences of the 2010 objective are very likely. It is not yet possible to declare an AQMA for the 2010 PM 10 objective, as it is not yet in regulation. Therefore it is advised that the London Borough of Hillingdon proceed to a Detailed Assessment for this source based on the 2004 objective. It is also recommended that 34
44 AEAT/ENV/R/2220 they bear in mind the possibility of having to comply with the 2010 objective and how this may affect their monitoring strategies in the region. A detailed assessment is also required for PM 10 from Heathrow Airport. Given the conclusions for nitrogen dioxide regarding the review of the Heathrow Emissions Inventory by DfT, LB Hillingdon will use the outputs from this process for future review and assessment work of PM SCREENING ASSESSMENT OF PM 10 The Technical Guidance LAQM.TG (03) requires assessment of PM 10 to consider the following sources, data or locations: Monitoring data outside an AQMA Monitoring data within an AQMA Junctions Roads with high flow of buses and/or HGVs New roads constructed or proposed since first round of review and assessment Roads close to the objective during the first round of review and assessment Roads with significantly changed traffic flows New industrial sources Industrial sources with substantially increased emissions Areas with domestic solid fuel burning Quarries, landfill sites, opencast coal, handling of dusty cargoes at ports etc Aircraft These are evaluated in the following sections BACKGROUND CONCENTRATIONS FOR PM 10 The estimated average background and maximum PM 10 concentrations estimated from the UK background maps ( in µgm -3 are: Table 10.5 Estimated Current and Future Background PM 10 Concentrations in the London Borough of Hillingdon Background PM 10 (µg/m 3 ) Average Maximum SCREENING ASSESSMENT OF MONITORING DATA Monitoring for PM 10 has been undertaken at 4 locations in the London Borough of Hillingdon. A comparison with the objectives is shown in Table 10.6 below. This monitoring is based on TEOM instrumentation, which was multiplied by 1.3 to derive estimated gravimetric concentrations. Table 10.6 Comparison of 2005 PM 10 data with the 2004 objectives. Site Pollutant Objective Result 2004 Objective achieved Hillingdon - AURN PM 10 Particulate Annual Mean less than 40µg/m 3 27 YES Hillingdon - AURN PM 10 Particulate No more than 35 days where 13 YES daily mean >50µg/m 3 South Ruislip PM 10 Particulate Annual Mean less than 40µg/m 3 28 YES South Ruislip PM 10 Particulate No more than 35 days where daily mean >50µg/m 3 16 YES Hillingdon Hospital PM 10 Particulate Annual Mean less than 40µg/m 3 27 YES Hillingdon Hospital PM 10 Particulate No more than 35 days where 10 YES 35
45 AEAT/ENV/R/2220 daily mean >50µg/m 3 Harlington - AURN PM 10 Particulate Annual mean less than 40ug/m3 25 YES Harlington - AURN PM 10 Particulate No more than 35 days where daily mean >50ug/m3 3 YES Heathrow LHR2 PM 10 Particulate Annual Mean less than 40µg/m 3 30 YES Heathrow LHR2 PM 10 Particulate No more than 35 days where daily mean >50µg/m 3 19 YES 10.7 SCREENING ASSESSMENT OF ROAD TRAFFIC SOURCES Traffic flow data were taken from manual and automatic traffic count data in the London Atmospheric Emission Inventory. The results of the DMRB modelling are shown in Table 10.7 below. Both the annual mean and 24 hour mean PM 10 results are presented for Results are also shown for All the roads provided in the LAEI have been assessed using DMRB, covering most of the roads within Hillingdon Borough Council borough. Therefore this will cover roads with a high proportion of HGVs / buses, roads that have significantly changed traffic flows since the last assessment, roads close to the PM 10 objectives in the last assessment and any new roads. Table 10.7 Predicted PM 10 concentrations in 2005 and 2010 calculated using DMRB for roads in the London Borough of Hillingdon (µgm -3 ). Road Name Receptor Distance AADT combined veh/day Annual average speed (km/h) Predicted annual mean PM 10 concentration in 2005 Predicted number of exceedences of 24 hr objective in 2005 Predicted annual mean PM 10 concentration in 2010 Predicted number of exceedences of 24 hr objective in 2010 M , A A A A A , A , A , A , M A , A , A , A , A , A , A A , A , A , A , A A , A , M A ,
46 AEAT/ENV/R/2220 A , A , A , A WESTERN AVENUE A40(T) ,16 30, Note: a distance to road centre of 2 m was modelled as a worst-case scenario but was then refined to actual distances where exceedences were located. Speed data was taken from the LAEI The DMRB run shows no exceedences of the annual or 24 hour 2004 air quality objective. There is the possibility of exceeding the annual mean 2010 objective of 23µg m -3. The following items from the checklist for PM 10 have also been considered: Roads with a high flow of buses and/or HGVs were considered in the above screening assessment for road transport sources. New roads constructed or proposed since the last round of review and assessment no new roads have been constructed, except M4, Junction 4 improvements. Roads close to the objective during the last round of review and assessment there were no roads that were close to the objective during the last round of review and assessment. Roads with significantly changed traffic flows or new, relevant exposure changes to the traffic flows since the last round of review and assessment have been considered in the above screening assessment Busy Junctions Annual average PM 10 concentrations at the busiest road junctions in the London Borough of Hillingdon have been estimated for 2005 and 2010 using DMRB (See Table 10.7 above) Street Canyons The DMRB model may significantly under-predict concentrations of nitrogen dioxide alongside urban city-centre roads classified as street canyons but there is no clear evidence that this is the case for PM 10 (Section 8.32 TG (04)) and therefore no correction should be made for PM 10 in street canyons. It is not thought that there are any street canyon environments in the London Borough of Hillingdon SCREENING ASSESSMENT OF INDUSTRIAL SOURCES The Guidance LAQM TG (03) lists the following processes as significant potential sources of PM 10 : Part A (percentage of total emissions from all UK plant in this sector to the UK total in brackets) Iron and steel (61) Petroleum processes (4) Combustion processes (13) Cement/lime manufacture (7) Carbonisation (2) Gasification (4) Non-ferrous metals (4) Fertilizer production Part B Combustion plant mwth Furnaces mwth Coal and coke processes Quarry Process Roadstone coating Rubber processes China and clay processes Coating powder Coil coating New sources that started operating since the last round of Review and Assessment are: 37
47 AEAT/ENV/R/2220 Warehouse and Distribution development with 150 residential dwellings covering 57400m 2 with a predicted 0.4µg/m -3 increase in annual mean PM 10 at Stockley Bypass. Phase 1 of Terminal 5 development is due to open in 2008 (constriction phase has moved from earthworks movements to fitting out operation which are potentially less dust generating). Close to the Hillingdon boundary at Colnbrook, a new incinerator, which is a plant Part A process, has been granted permission which could result in increased emissions. This will not be fully operational until Proposed projects with that have the potential to emit significant quantities of PM 10 : Extension of N3 car park at Longford with a predicated 0.07 µg/m -3 increase in mean annual PM space car park within Heathrow airport boundary with an operational date of RAF Northolt proposal to increase site, which predicted a 0.75µg/m -3 increase in PM 10 in 2011 at nearest receptor point Air Quality Assessments have been performed for these planned developments but there are no additional data or other information available for further assessments. The proposed sources should be assessed in the next round of Review and Assessment SCREENING ASSESSMENT OF FUGITIVE AND UNCONTROLLED SOURCES Quarries and landfill sites There are no recorded quarries or landfill sites with relevant locations for public exposure within 200m Domestic solid fuel burning There are no data for domestic coal burning available but solid fuel use continues to decline throughout the area. It is believed that there are no areas with 50 or more houses using these fuels in a 500m square SCREENING ASSESSMENT OF OTHER TRANSPORT SOURCES Airports Heathrow airport lies within the London Borough of Hillingdon. There is relevant exposure within 500 metres of the airport boundary and there are predicted to be 67.7 million 12 passengers per annum in There is considerable construction work at the airport due to the construction of terminal five. This development has planning conditions attached to it for the suppression of dust and particulate matter. The 2004 Air Pollution Report HEATHROW LHR 2 shows that the 2004 PM 10 objective of was met in 2004 (Table 10.8). Table 10.8 PM 10 concentrations in 2004 taken from the 2004 Air Pollution Report HEATHROW LHR 2 (µgm -3 ) 2004 Average 21 µg/m -3 Maximum daily mean 57 µg/m -3 Exceedences of daily mean > 50 µg m-3 12 days
48 AEAT/ENV/R/ CONCLUSIONS FOR PM10 CONCENTRATIONS IN THE LONDON BOROUGH OF HILLINGDON The DMRB screening model indicates that the 2004 annual mean objective for PM 10 will be met in 2005, and that exceedences of the 2010 objective are very likely. It is not yet possible to declare an AQMA for the 2010 PM 10 objective, as it is not yet in regulation. It is also recommended that they bear in mind the possibility of having to comply with the 2010 objective and how this may affect their monitoring strategies in the region. Updating and Screening Assessment Summary Checklist for PM 10 Item Monitoring data outside an AQMA Monitoring data within an AQMA Busy roads and junctions in Scotland Junctions. Roads with high flow of buses and/or HGVs. New roads constructed or proposed since last round of R&A Roads with significantly changed traffic flows, or new relevant exposure. Roads close to the objective during the second round of Review and Assessment New industrial sources. Industrial sources with substantially increased emissions, or new relevant exposure Areas of domestic solid fuel burning Quarries / landfill sites / opencast coal / handling of dusty cargoes at ports etc. Aircraft Response Monitoring data indicates no exceedences No AQMAs declared for PM 10 Not in Scotland Junctions assessed using DMRB exceedences of the 24-hour mean objective M25 and A4 no exceedences of annual or the 24 hour mean objective No major road changes (except for M4, junction 4 improvement) All roads assessed using DMRB with up to date traffic data. All roads assessed using DMRB with up to date traffic data. There were no roads close to the objective in the last updating and screening assessment Heathrow Terminal 5, Warehouse and Distribution development, Colnbrook new incinerator None present None present None present Heathrow Airport is above the 5mppa threshold. No exceedences. No detailed assessment is required for PM 10 for Hillingdon. 39
49 AEAT/ENV/R/2220 Conclusions CARBON MONOXIDE It is concluded that the strategy objectives for carbon monoxide are likely to have been achieved by There is no need to progress to a detailed review and assessment for this pollutant. BENZENE It is concluded that the strategy objectives for benzene are likely to have been achieved by There is no need to progress to a detailed review and assessment for this pollutant. 1,3-BUTADIENE It is concluded that the strategy objectives for 1,3-Butadiene are likely to have been achieved by There is no need to progress to a detailed review and assessment for this pollutant. LEAD It is concluded that the strategy objectives for lead are likely to have been achieved by There is no need to progress to a detailed review and assessment for this pollutant. NITROGEN DIOXIDE It is concluded that the strategy objectives for nitrogen dioxide are not likely to have been achieved by All locations exceeding the NO 2 objective are within the already existing AQMA, thus there is a no need to progress to a detailed review and assessment for this pollutant. SULPHUR DIOXIDE It is concluded that the strategy objectives for sulphur dioxide are likely to have been achieved by 2004/5. There is no need to progress to a detailed review and assessment for this pollutant. PM 10 It is concluded that the strategy objectives for PM 10 from road transport are not likely to be exceeded by 2005 as a result of road transport. The 2010 assessment indicates likely exceedences but this is for information purposes only as at the present time as the 2010 objectives are not in the Regulations. There is no need to progress to a detailed review and assessment for this pollutant. SUMMARY AND RECOMMENDATIONS For all pollutants apart from NO 2 the air quality objectives are predicted to be met within the London Borough of Hillingdon. All locations exceeding the NO 2 objective are within the already existing AQMA, thus there is a no need to progress to a detailed review and assessment for this pollutants. 40
50 AEAT/ENV/R/2220 References Part IV of the Environment Act Local Air Quality Management. LAQM.TG (03) January DETR (2000b) The Air Quality Strategy for England, Scotland, Wales and Northern Ireland. Department of the Environment, Transport and the Regions. Cm 4548, SE 2000/3, NIA 7. Design Manual for Roads and Bridges. Highways Agency 2003 LAQM. TG(03). Part IV of the Environment Act Local Air Quality Management. Technical Guidance. CERC (2002). Air quality modelling for west London: Hillingdon, Hounslow, Spelthorne and Slough. August LAQM.TG(03) Update. January 2006 The Air Quality Regulations (2000) and The Air Quality (England) Amendment Regulations DETR (2000) The Air Quality Strategy for England, Scotland, Wales and Northern Ireland. Department f the Environment, Transport and the Regions. Cm 4548, SE 2000/3, NIA 7 Maps of Estimated Ambient Air Pollution in 2001 and Projections for Other Years. EA (1998b) Guidance for estimating the air quality impact of stationary sources. Guidance Note 24. Environment Agency, Air Pollution Report HEATHROW LHR 2 01 January to 31 December 2004,
51 Appendices CONTENTS Appendix 1 Appendix 2 Appendix 3 Appendix 4 Appendix 5 Monitoring Data DMRB output List of Part A processes in Hillingdon Descriptions of selected models and tools Report Checklist åéíåéå
52 Appendix 1 Monitoring data CONTENTS Diffusion tube data (Monthly results) Continuous monitoring Station åéíåéå
53 Table A1 Diffusion Tube data (unadjusted), provided by the London Borough of Hillingdon LOCATION TUBE REF 83 Hayes End Drive HD Uxbridge Day HD Nursery Barra Hall (now HD Church Walk) Uxbridge HD Technical College Citizens Advice HD Bureau Hillingdon HD Primary School Colham HD Avenue Cowley Mill HD Road Warren Road HD Harlequin Close HD Harold Avenue HD Phelps Way HD Cranford HD Lane Brendan Close HD Bomber Close HD Harmonsworth HD Green Heathrow Close HD GRID REF TYPE JAN 05 FEB 05 MAR 05 APR 05 MAY 05 JUNE 05 B R B R B R R B B B B B B B B B JULY 05 AUG 05 SEP 05 OCT 05 NOV 05 DEC 05 ANNUAL MEAN ug/m3 B åéíåéå
54 LOCATION AURN Monitoring Station AURN Monitoring Station AURN Monitoring Station South Ruislip Monitoring Station South Ruislip Monitoring Station South Ruislip Monitoring Station Hillingdon Hospital Monitoring Station Hillingdon Hospital Monitoring Station Hillingdon Hospital Monitoring Station 1 North Hyde Gardens, Hayes 370 Sipson Road, Sipson 34 Hatch Lane, Sipson 28 Pinglestone Close, Sipson 486 Sipson Road, Sipson TUBE REF HD HD HD HD HD HD HD HD HD HD HD HD HD HD GRID REF TYPE JAN 05 FEB 05 MAR 05 APR 05 MAY 05 JUNE 05 S S S R R R R R R R R R R JULY 05 AUG 05 SEP 05 OCT 05 NOV 05 DEC 05 ANNUAL MEAN ug/m3 R åéíåéå
55 NO 2 Diffusion Tubes location åéíåéå

56 Continuous Monitoring Stations The monitoring station at West Drayton is within a self-contained, air-conditioned housing located on an open grass area approximately 2.5 metres from the kerb of a residential road. The site is bordered on three sides by residential roads and on the fourth by the busy M4 motorway, approximately 30 metres distance. The manifold inlet is approximately 3 metres high. The general area is open and protected from the M4 by trees. The site is at the junction of Keats Way and Sipson Road, West Drayton, Middlesex. Its location is shown in the map, Figure 2 and the station is shown in Figure 3. Figure A1.2 Location of the Continuous monitor 13 (Junction of Keats Way and Sipson Road, West Drayton, Middlesex) Sites covered by Site Address Grid Reference Hillingdon 1 - South Ruislip South Ruislip , Hillingdon 2 - Hillingdon Hospital Field Heath Rd/ junction Colham Rd , Hillingdon 3 - Oxford Avenue Oxford Avenue, Hillingdon , Heathrow Airport LHR2 Heathrow Airport, North Apron , Harlington - AURN Heathrow Airport, Harlington , åéíåéå
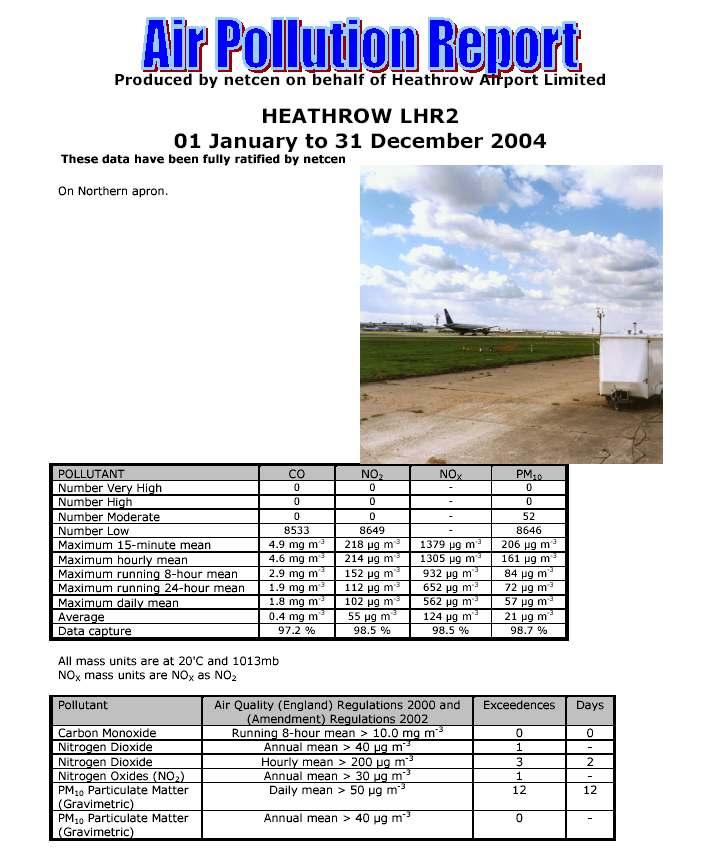
57 åéíåéå
58 åéíåéå
59 Appendix 2 Traffic Flow data CONTENTS Table A2.1 Road classifications in LAQM TG(03) Definitions Table A2.3 Traffic Data for the London Borough of Hillingdon, DMRB output 2005 Table A2.2 Predicted background concentrations åéíåéå
60 Table A2.1 Road Classifications in LAQM TG (03) Definitions Very busy roads Single carriageway roads with average daily traffic flows exceeding 80,000 vehicles Dual carriageway (2- or 3-lane) roads with average daily traffic flows exceeding 120,000 vehicles Busy Roads Motorways with average daily flows exceeding 140,000 vehicles. Roads with more than 30,000 vehicles per day. Table A2.2 Predicted background concentrations Year Predicted Background Concentrations CO Benzene 1,3 butadiene NOx NO 2 PM 10 (mgm -3 ) (mgm -3 ) (mgm -3 ) (mgm -3 ) (mgm -3 ) (mgm -3 ) åéíåéå
61

62 Table A 2.3 Traffic Data for the London Borough of Hillingdon, DMRB output 2005 åéíåéå
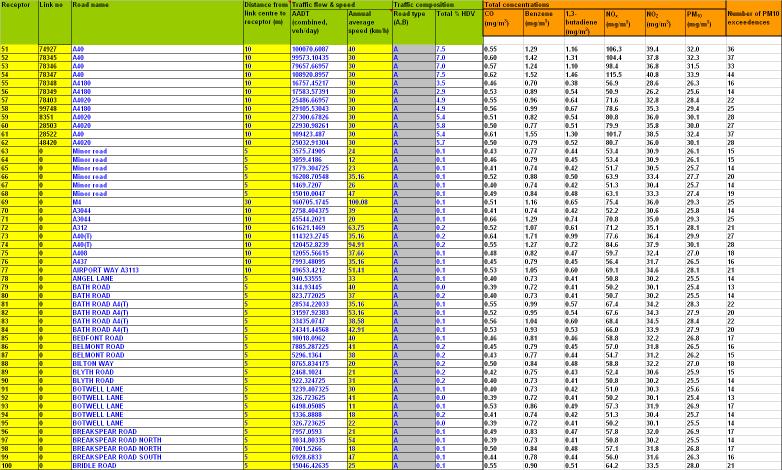
63 åéíåéå
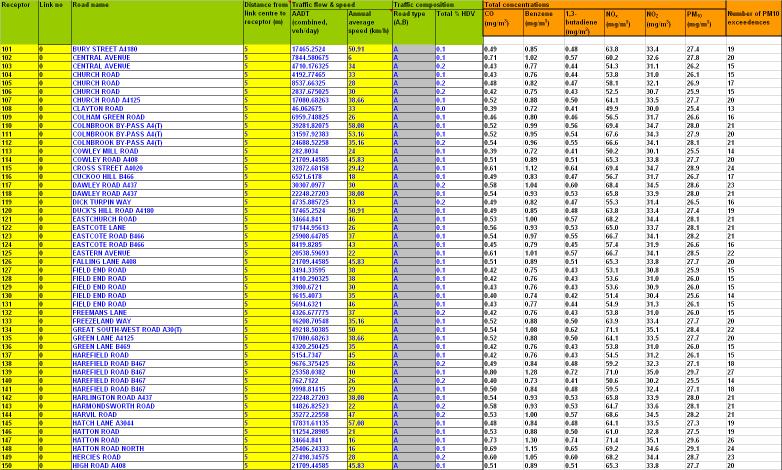
64 åéíåéå
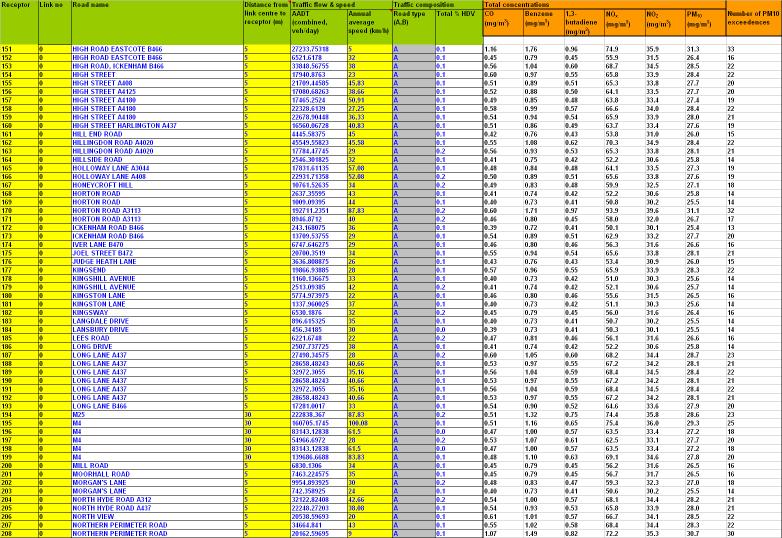
65 åéíåéå
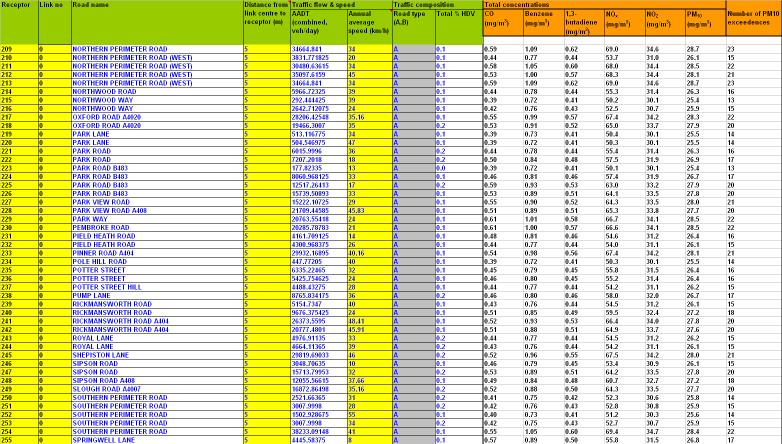
66 åéíåéå
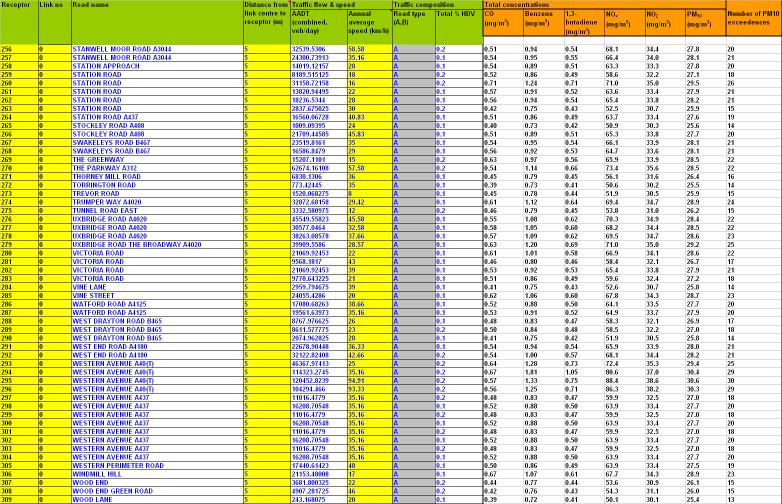
67 åéíåéå
The London Borough of Hillingdon
 The London Borough of Hillingdon Updating and Screening Assessment, 215 Document Control Client London Borough of Hillingdon Job umber Report Prepared By: Michael Holland Principal Contact Val Beale Document
In addition, they now have a flexible role in working towards reducing emissions and concentrations of Fine Particulate Matter (PM 2.5 ).
.") Appendix A: UK National Air Quality Strategy The air quality objectives set out at national level in the Air Quality (Standards) Regulations 2010, provide the statutory basis for the air quality objectives
Appendix A: UK National Air Quality Strategy The air quality objectives set out at national level in the Air Quality (Standards) Regulations 2010, provide the statutory basis for the air quality objectives
Harlow Council. Local Air Quality Management Progress Report. April 2005
 Harlow Council Local Air Quality Management Progress Report April 2005 Report written by: Ken Nicholson (Nicholson Environmental) For Essex County Council Waste, Recycling and Environment Environmental
2011 Air Quality Detailed Assessment Report Epping Forest District Council
 2011 Air Quality Detailed Assessment Report Epping Forest District Council In fulfillment of Part IV of the Environment Act 1995 Local Air Quality Management August, 2011 Local Authority Officer: Fay Rushby
10.0 AIR QUALITY AND CLIMATIC FACTORS
 .0 AIR QUALITY AND CLIMATIC FACTORS.1 ASSESSMENT METHODOLOGY.1.1 General Section 39 (2) (b) (ii) of the Transport (Railway Infrastructure) Act 2001, requires that proposed developments are examined in
Air quality and emissions mitigation guidance for Sussex authorities (2013) - Appendices
 - Appendices") Air quality and emissions mitigation guidance for Sussex authorities (2013) - Appendices Sussex Air Quality Partnership Version: November 2013 Sussex Air Quality Partnership (Sussex-air) Appendices Page
Air quality and emissions mitigation guidance for Sussex authorities (2013) - Appendices Sussex Air Quality Partnership Version: November 2013 Sussex Air Quality Partnership (Sussex-air) Appendices Page
Armagh City and District Council Stage 2 update and Stage 3 Review and Assessment
 Report = Armagh City and District Council Stage 2 update and Stage 3 Report to Armagh City and District Council = = = = = = = = = = = = = = = = = = = = åetcen/ed48122001/issue 1 October 2003 = Title Armagh
^áê=nì~äáíó=oéîáéï=~åç= ^ëëéëëãéåí=j=pí~öé=o
 AEAT/ENV/R/1009 ^áênì~äáíóoéîáéï~åç ^ëëéëëãéåíjpí~öéo A report produced for February 2002 AEAT/ENV/R/1009 ^áênì~äáíóoéîáéï~åç ^ëëéëëãéåíjpí~öéo February 2002 AEAT/ENV/R/1009 Title Air Quality Review and
Relationship between the UK Air Quality Objectives and Occupational Air Quality Standards
 Relationship between the UK Air Quality Objectives and Occupational Air Quality Standards November 2016 Document Control Report Prepared By: Dr Ben Marner Document Status and Review Schedule Report No.
A LOW EMISSION ZONE FOR LONDON.
 A LOW EMISSION ZONE FOR LONDON. Lucy Sadler 1, David Hutchinson 1, Paul Watkiss 2, David Carslaw 3. 1 Greater London Authority, City Hall, The Queen's Walk, London, SE1 2AA, UK lucy.sadler@london.gov.uk,
OUR APPROACH TO AIR QUALITY
 OUR APPROACH TO AIR QUALITY JANUARY 2018 Contents Contents Executive summary... 4 1 Introduction.... 6 1.1 Our approach to local air quality.... 6 1.2 Purpose and structure of this document.............................................................
SITESOLUTIONS Air Quality
 SITESOLUTIONS Air Quality Section 1: Air Quality Management Areas IDENTIFIED This report is issued for the property described as The site is located in an Air Quality Management Area, which indicates that
2016 Air Quality Progress Report
 2016 Air Quality Progress Report The City of Cardiff Council In fulfillment of Part IV of the Environment Act 1995 Local Air Quality Management August 2016 LAQM Progress Report 2016 i Local Authority Officer
Air Quality. Executive Summary
 Air Quality Executive Summary Air quality adjacent to the Scheme is currently good with low background concentrations of air pollutants. However, there are areas within Cambridge city centre which currently
Air quality. Report. Environmental Audit Committee, Environment, Food and Rural Affairs Committee, Health Committee and Transport Committee
 A picture of the National Audit Office logo Report by the Comptroller and Auditor General Environmental Audit Committee, Environment, Food and Rural Affairs Committee, Health Committee and Transport Committee
Air Pollution. in Scotland 2010
 Air Pollution in Scotland 2010 1 Introduction This brochure is the fourth in an annual series on air quality in Scotland. Produced by AEA on behalf of the Scottish Government, it aims to provide the people
What does it mean for you?
 The Medium Combustion Plant Directive (MCPD) What does it mean for you? INTRODUCTION TO THE MCPD IMPROVING AIR QUALITY In 2015 the UK government announced plans to introduce the Medium Combustion Plant
Air Quality Monitoring at Dublin Airport: Annual Report for HSSE Department
 Air Quality Monitoring at Dublin Airport: Annual Report for 2013 Air Quality Monitoring at Dublin Airport: 2013 Table of Contents Glossary... 3 Executive Summary... 4 1. Introduction... 5 1.1. Background...
Performance Standards for Indicative Ambient Particulate Monitors Environment Agency July 2012 Version 2
 Performance Standards for Indicative Ambient Particulate Monitors Environment Agency July 2012 Version 2 Foreword We set up our Monitoring Certification Scheme (MCERTS) to provide a framework of standards
^áê=nì~äáíó=oéîáéï=~åç= ^ëëéëëãéåí=j=pí~öé=o
 ^b^qlbkslolnmnp ^áênì~äáíóoéîáéï~åç ^ëëéëëãéåíjpí~öéo A report produced for Newtownabbey Borough Council May 2002 ^b^qlbkslolnmnp ^áênì~äáíóoéîáéï~åç ^ëëéëëãéåíjpí~öéo May 2002 AEAT/ENV/R/1013 Title Air
Performance Standards for Continuous Ambient Air Quality Monitoring Systems. Environment Agency Version 8 June 2012
 Performance Standards for Continuous Ambient Air Quality Monitoring Systems Environment Agency Version 8 June 2012 Foreword We set up our Monitoring Certification Scheme (MCERTS) to provide a framework
Indicator Fact Sheet Signals 2001 Air Pollution
 Indicator Fact Sheet Signals 1 Air Pollution AP12b Exceedance days of air quality threshold value of Particulate Matter AP12 PM: in urban areas (black smoke 24h >12, TSP 24 h > 1, PM 24h > ug/m3) 4 4 3
Appendix VIII: Determination of chimney heights
 Appendix VIII: Determination of chimney heights 181 Regional Air Quality Plan for Taranaki 182 Regional Air Quality Plan for Taranaki Appendix VIII: Determination of stack heights and boiler operation
London City Airport Air Quality Measurement Programme: Annual Report 2011
 London City Airport Air Quality Measurement Programme: Annual Report 2011 March 2012 Document Control Client London City Airport Principal Contact Gary Hodgetts Job Number J1188 Report Prepared By: Suzanne
Derry City Council LAQM Progress Report 2013
 Derry City Council LAQM Progress Report 2013 Bureau Veritas Air Quality September 2013 Document Control Sheet Issue/Revision Issue 1 Issue 2 Issue 3 Remarks Draft Final Updated Final Date July 2013 August
APPENDIX H AIR DISPERSION MODELLING REPORT BY PROJECT MANAGEMENT LTD. (REF. CHAPTER 11 AIR QUALITY AND CLIMATIC FACTORS)
") 101050.22.RP.0001 A Environmental Impact Statement 15 th April 2005 APPENDIX H AIR DISPERSION MODELLING REPORT BY PROJECT MANAGEMENT LTD. (REF. CHAPTER 11 AIR QUALITY AND CLIMATIC FACTORS) S:\Projects\190900\101050
101050.22.RP.0001 A Environmental Impact Statement 15 th April 2005 APPENDIX H AIR DISPERSION MODELLING REPORT BY PROJECT MANAGEMENT LTD. (REF. CHAPTER 11 AIR QUALITY AND CLIMATIC FACTORS) S:\Projects\190900\101050
12. EMISSIONS OF SULPHUR DIOXIDE
 Air Air quality is to a great extent influenced by combustion of fossil fuels, evaporation of volatile organic compounds and their photochemical reaction with other pollutants in the atmosphere. Pollutants
Air quality in the vicinity of a governmental school in Kuwait
 Air Pollution XVI 237 Air quality in the vicinity of a governmental school in Kuwait E. Al-Bassam 1, V. Popov 2 & A. Khan 1 1 Environment and Urban Development Division, Kuwait Institute for Scientific
Viridor Waste Management. Proposed Development of an In-Vessel Composting Facility. Land at Exide Batteries, Salford Road, Bolton
 Viridor Waste Management Proposed Development of an In-Vessel Composting Facility Land at Exide Batteries, Salford Road, Bolton Non-Technical Summary January 2009 Introduction Viridor Waste Management
Dublin Airport Air Quality Monitoring Q1, Q2 2017
 Dublin Airport Air Quality Monitoring Q1, Q2 2017 Environment August 2017 Dublin Airport Air Quality Monitoring Report Quarter 1&2 2017 Air Quality Monitoring Dublin Airport: Q1, Q2 2017 Contents 1.0 Introduction...
Urban Form, Vehicle Technology and Air Quality
 Urban Form, Vehicle Technology and Air Quality Dr Paul Goodman Research Associate, Transport Operations Research Group, Newcastle University and Dr Gordon Mitchell, University of Leeds, Dr Anil Namdeo,
I-70 East ROD 1: Phase 1 (Central 70 Project) Air Quality Conformity Technical Report
 Air Quality Conformity Technical Report") I-70 East ROD 1: Air Quality Conformity Technical Report January 2017 I-70 East ROD 1: Air Quality Conformity Technical Report TABLE OF CONTENTS Chapter Page 1 PURPOSE OF THIS REPORT... 1 2 PROJECT DESCRIPTION...
I-70 East ROD 1: Air Quality Conformity Technical Report January 2017 I-70 East ROD 1: Air Quality Conformity Technical Report TABLE OF CONTENTS Chapter Page 1 PURPOSE OF THIS REPORT... 1 2 PROJECT DESCRIPTION...
Air quality report for Lush, Oxford & Lush, South Molton Street in London A comparison of nitrogen dioxide pollution in June 2013
 Air quality report for Lush, Oxford & Lush, South Molton Street in London A comparison of nitrogen dioxide pollution in June 2013 By Andrew Wood, Network for Clean Air August 2013 Pictures: Mounting gas
CANADA-WIDE STANDARDS FOR PM & OZONE STATUS OF JURISDICTIONAL IMPLEMENTATION ACTIVITIES MANITOBA
 CANADA-WIDE STANDARDS FOR PM & OZONE STATUS OF JURISDICTIONAL IMPLEMENTATION ACTIVITIES MANITOBA I. INTRODUCTION Manitoba has only one Census Metropolitan Area (CMA) (i.e., Winnipeg with 6% of Manitoba
STUDY FOR PARTICULATE SAMPLING, SIZING AND ANALYSIS FOR COMPOSITION
 STUDY FOR PARTICULATE SAMPLING, SIZING AND ANALYSIS FOR COMPOSITION by A M King 1, A M Jones 1, S R Dorling 2, J R Merefield 3, I M Stone 3, K Hall 4, G V Garner 4, P A Hall 4 and B Stokes 5 1 IMC Technical
FACILITY PROFILE. New Brunswick Power Corporation for the Belledune Thermal Generating Station
 FACILITY PROFILE New Brunswick Power Corporation for the Belledune Thermal Generating Station Prepared by: Industrial Processes Section, Impact Management Branch Department of Environment and Local Government
Ambient Air Monitoring
 Ambient Air Monitoring At Newbridge, Co. Kildare 1 st October 2009 24 th May 2010 Contents Summary........ 3 Introduction........ 4 Time Period........ 5 Siting......... 5 Monitoring Methods....... 6 Results.........
6.1 INTRODUCTION 6.2 REGULATORY FRAMEWORK NATIONAL AMBIENT AIR QUALITY STANDARDS COMPLIANCE STATUS TRANSPORTATION CONFORMITY
 Chapter 6 Air Quality 6.1 INTRODUCTION This chapter presents a project-level analysis of the potential for air quality impacts that could result from mobile and stationary sources of air emissions generated
Controlling Pollution Episodes In Paris
 Controlling Pollution Episodes In Paris King s College London LAQNC 13/07/2017 Summary 1. State of the air quality in Paris region 2. December 2016 PM pollution episode and emergency measures 3. Crit Air
Health impacts of air pollution in London: from understanding to forecasting
 Health impacts of air pollution in London: from understanding to forecasting John Gulliver University of the West of Scotland Marta Blangiardo, David Briggs, Anna Hansell Imperial College London Study
Air Pollution and Conservation Areas
 Air Pollution and Conservation Areas Simon Bareham Countryside Council for Wales Welsh Air Quality Forum 14 September 2005 Outline Nature conservation legislation and policy Key air pollution issues affecting
EXPERIENCE OF SOURCE APPORTIONMENT STUDY IN INDIA
 INTERNATIONAL WORKSHOP ON VEHICULAR AIR POLLUTION AND ITS IMPACT ON HUMAN HEALTH: NEW DELHI, SEPTEMBER 01 02, 2011 EXPERIENCE OF SOURCE APPORTIONMENT STUDY IN INDIA Dr. Prashant Gargava Senior Environmental
Technical Notes for Biomass and Air Quality Guidance
 Technical Notes for Biomass and Air Quality Guidance Appendix 1 Restricted Commercial AEA/ED45645/Draft 1 Unit conversion tool Introduction In order to assess the impact of a combustion appliance on air
NO2, SO2, PM2.5, Oh my!?! Information Session EPA R/S/L Modelers Workshop May 10, 2010
 NO2, SO2, PM2.5, Oh my!?! Information Session EPA R/S/L Modelers Workshop May 10, 2010 Purpose & Outline Provide background and updates on permit modeling processes and technical aspects related to new
Upper Athabasca Region Air Zone Canadian Ambient Air Quality Standards Response Government of Alberta Action Plan
 Upper Athabasca Region Air Zone Canadian Ambient Air Quality Standards Response Government of Alberta Plan September 2017 Any comments or questions regarding the content of this document may be directed
PLEASE NOTE. For more information concerning the history of these regulations, please see the Table of Regulations.
 PLEASE NOTE This document, prepared by the Legislative Counsel Office, is an office consolidation of this regulation, current to August 7, 2004. It is intended for information and reference purposes only.
Air Pollution Management and Modeling - Indian Perspective
 Air Pollution Management and Modeling - Indian Perspective GUFRAN BEIG Indian Institute of Tropical Meteorology, Pune - 411 008 (e-mail: beig@tropmet.res.in) 1 Contents Air Quality Concerns Current Statust
The assessment is based upon the design ore production of 95 million tonnes / annum.
 9A Air Quality Assessment Supporting Information This annex sets out the detailed methodology, input data and criteria for the assessment. The overarching assessment approach is detailed in Chapter 9:
NATIONAL INSTITUTE FOR HEALTH AND CARE EXCELLENCE. Health and Social Care Directorate. Indicator Process Guide. Published December 2017
 NATIONAL INSTITUTE FOR HEALTH AND CARE EXCELLENCE Health and Social Care Directorate Indicator Process Guide Published December 2017 Please note that this is an interim factual update to the NICE Indicator
DEFRA consultation on the Implementation of Clean Air Zones in England ~ Response from Campaign for Better Transport
 DEFRA consultation on the Implementation of Clean Air Zones in England ~ Response from Campaign for Better Transport This paper records the response tabled online through the DEFRA consultation hub, in
Air quality in the Mesogaia Plain in Eastern Attica before and after the opening of the Athens International Airport
 Air quality in the Mesogaia Plain in Eastern Attica before and after the opening of the Athens International Airport C. M. O'Connor, E. P. Anamaterou & E. G. Leivaditis Environmental Department, Athens
Portbury Dock Renewable Energy Plant. Cumulative Impact Assessment Non-Technical Summary September 2009
 Portbury Dock Renewable Energy Plant Cumulative Impact Assessment Non-Technical Summary September 2009 INTRODUCTION On 28 th August 2009 E.ON Climate & Renewables UK Developments Limited (EC&R) submitted
Air quality in stations
 Air quality in stations Introduction and the European legislative framework BONTINCK Willy, Head of the Environmental Department SNCB-HOLDING Presentation Air quality in indoor public areas (eg stations)
UK Legislative Approach: Contaminated Land
 UK Legislative Approach: Contaminated Land Presented by: David Middleton, Defra, UK Date: Monday 7 March 2016 Overview Legislation Risk Based Approach Guidance Brownfield Development enabling factors Sustainable
Ambient Air Quality Monitoring Baseline Report, Kirby Misperton A Wellsite, KM8 Production Well
 Ambient Air Quality Monitoring Baseline Report, Kirby Misperton A Wellsite, KM8 Production Well. Prepared for: Third Energy UK Gas Ltd. Document Control Page Client Third Energy UK Gas Ltd. Document Title
Highgate s air quality
 Highgate s air quality This is a report about air pollution in Highgate. At its core is an air quality survey initiated by the Highgate Neighbourhood Forum, crowd-funded thanks to the generosity of local
Clean Air. for. Kaliningrad
 Clean Air for Kaliningrad Clean Air for Kaliningrad The urban air pollution induced by traffic in Kaliningrad is raising increasing concern. KALAIR is a LIFE-Third Countries Project, co-funded by the European
Air Quality Assessment Report Paris Grand Development County of Brant, Ontario
 Air Quality Assessment Report Paris Grand Development County of Brant, Ontario Novus Reference No. 16-0214 NOVUS TEAM: Technical Coordinator: Air Quality Engineer: Project Director: Laura Clark, B.Eng.,
Contaminated Land - Managing the Risk
 Contaminated Land - Managing the Risk Signatures removed from electronic version Submitted by... Peter Wigley Nominated Responsible Manager Approved by... Tom Stevenson Chairman, Civil Engineering Subject
Air Quality Impacts of the London Low Emission Zone. Ben Barratt, King s College London 49 th IAPSC Conference: Mon 13 th Dec 2010
 Air Quality Impacts of the London Low Emission Zone Ben Barratt, King s College London 49 th IAPSC Conference: Mon 13 th Dec 2010 Identifying the impacts of an LEZ Few, if any, comprehensive LEZ accountability
Lower Athabasca Region Air Zone Canadian Ambient Air Quality Standards Response Government of Alberta Action Plan
 Lower Athabasca Region Air Zone Canadian Ambient Air Quality Standards Response Government of Alberta Plan September 2017 Any comments or questions regarding the content of this document may be directed
your guide to completing an application for a new or replacement water connection from your property to an existing water main
 your guide to completing an application for a new or replacement water connection from your property to an existing water main If you wish to apply for a new or replacement water connection you should
AIR REGULATION IN SOUTH CAROLINA 3 JUNE 2016
 AIR REGULATION IN SOUTH CAROLINA Presented by Phil Conner 3 JUNE 2016 pconner@nexsenpruet.com SCDHEC s Authority for Administering Air Quality Regulations South Carolina Pollution Control Act (The PCA
Changes to Federal Ambient Air Quality Standards and the Affect on Industry in BC
 Changes to Federal Ambient Air Quality Standards and the Affect on Industry in BC EMA of BC - 2017 Workshop February 16, 2017 Anna Henolson Outline Background New SO2 CAAQS CAAQS Implementation in British
Welcome To Our Exhibition
 Welcome To Our Exhibition Welcome to the exhibition of our proposals for a Waste Recycling and Renewable Energy Facility Distributed Renewable Energy Networks Ltd (DRENL) propose to develop a 10MW Waste
(1) Site Suitability PURPOSE
 Site Suitability PURPOSE") 3.3 Code for Development and Use of Rural Service Industries PURPOSE This purpose of this code is to encourage the development and use of suitable rural service industries on rural, industrial or suitable
3.3 Code for Development and Use of Rural Service Industries PURPOSE This purpose of this code is to encourage the development and use of suitable rural service industries on rural, industrial or suitable
ENVIRONMENTAL PROTECTION ACT AIR QUALITY REGULATIONS
 c t ENVIRONMENTAL PROTECTION ACT AIR QUALITY REGULATIONS PLEASE NOTE This document, prepared by the Legislative Counsel Office, is an office consolidation of this regulation, current to August 7, 2004.
Air Pollution. Audrey de Nazelle November
 Air Pollution Audrey de Nazelle anazelle@imperial.ac.uk November 5 2013 2 weeks ago: Helen ApSimon on atmospheric sciences Today: taster on regulations, monitoring & modelling, and air pollution control
Red Deer Region Air Zone Canadian Ambient Air Quality Standards Response Government of Alberta Action Plan
 Red Deer Region Air Zone Canadian Ambient Air Quality Standards Response Government of Alberta Action Plan September 2017 Any comments or questions regarding the content of this document may be directed
Nova Scotia Air Zone Report. Nova Scotia Air Quality Unit, 2015
 Nova Scotia Air Zone Report Nova Scotia Air Quality Unit, 2015 Acronyms AQHI Air Quality Health Index AQMS Air Quality Management System AQU Nova Scotia Environment s Air Quality Unit CAAQS Canadian Ambient
EXECUTIVE SUMMARY OF THE NATIONAL COMMUNICATION OF MONACO
 UNITED NATIONS Framework Convention on Climate Change Distr. GENERAL FCCC/NC/14 14 December 1995 ENGLISH Original: FRENCH EXECUTIVE SUMMARY OF THE NATIONAL COMMUNICATION OF MONACO submitted under articles
Response of the Road Haulage Association to Transport for London. Consultation on Mayor s Transport Strategy.
 Response of the Road Haulage Association to Transport for London. Consultation on Mayor s Transport Strategy. Background about the RHA 2 October 2017 1. The Road Transport Industry is a dynamic, business
your guide to completing an application for a new or replacement water connection from your property to an existing water main
 your guide to completing an application for a new or replacement water connection from your property to an existing water main If you wish to apply for a new or replacement water connection you should
ISO 14001:2015. EMS Manual.
 www.iso-9001-checklist.co.uk Insert your company s name or logo, and address. This EMS manual is the property of Your Company. It must not be reproduced in whole or in part or otherwise disclosed without
MEAN ANNUAL EXPOSURE OF CHILDREN AGED 0-4 YEARS TO ATMOSPHERIC PARTICULATE POLLUTION
 MEAN ANNUAL EXPOSURE OF CHILDREN AGED 0-4 YEARS TO ATMOSPHERIC PARTICULATE POLLUTION GENERAL CONSIDERATIONS Issues Type of indicator Rationale Issues in indicator design Respiratory disease Exposure (proximal)
GE/GN8640. Risk Evaluation and Assessment. Guidance on Planning an Application of the Common Safety Method on. Rail Industry Guidance Note
 GN Published by: Block 2 Angel Square 1 Torrens Street London EC1V 1NY Copyright 2014 Rail Safety and Standards Board Limited GE/GN8640 Method on Risk Evaluation and Assessment Issue One; June 2014 Rail
Updates on Proposed Guidance/Technical Bulletins and Technical Standards
 Updates on Proposed Guidance/Technical Bulletins and Technical Standards September 2015 Presentation for AWMA Breakfast Series by Cathy Grant (cathy.grant@ontario.ca) 416-327-6600 1 Standards Development
Transit Service Guidelines
 G R E AT E R VA N CO U V E R T R A N S P O RTAT I O N A U T H O R I T Y Transit Service Guidelines PUBLIC SUMMARY REPORT JUNE 2004 Greater Vancouver Transportation Authority TRANSIT SERVICE GUIDELINES
London Borough of Barnet Air Quality Action Plan
 London Borough of Barnet Air Quality Action Plan 2017-2022 SUMMARY This Air Quality Action Plan (AQAP) has been produced as part of the Council s duty to contribute to London Local Air Quality Management.
Air quality monitoring and modelling techniques for street canyons: the Paris experience
 Air quality monitoring and modelling techniques for street canyons: the Paris experience S. Vardoulakis^, N. Gonzalez-Flesca^ & B.E.A. Fisher* *Institut National de I'Environnement Industriel et des Risques
SEPA s National air quality report 2008
 SEPA s National air quality report 2008 Contents Executive summary 2 1 Introduction 4 2 SEPA s role in the management of air quality 7 3 Sulphur dioxide 11 4 Oxides of nitrogen 15 5 Particulate matter
Appendix Q Canadian Air Quality Study
 Appendix Q Canadian Air Quality Study NOTICE The information contained in this Appendix was developed strictly for the purpose of evaluating the environmental impacts associated with the Ambassador Bridge
Proceedings of the Eastern Asia Society for Transportation Studies, Vol.8, 2011
 Modeling of Traffic-Induced NO 2 Concentration to Predict the Indoor Air Quality in Houses near Major Road Adyati Pradini YUDISON Research Assistant Air and Waste Management Research Group Faculty of Civil
The reform of Vehicle Excise Duty to ensure a cleaner environment
 HM Treasury The reform of Vehicle Excise Duty to ensure a cleaner environment Response from Friends of the Earth 1 Friends of the Earth Friends of the Earth exists to campaign actively, effectively and
Foreword 3. Terminology 5
 CONTENTS Foreword 3 Terminology 5 Section 1 Introduction 7 What Legislation Applies 7 The Division Of Responsibility 8 Building Regulations Compliance In General 9 Risk Assessment and The Workplace Fire
Environmental Management System Integrated Pollution Control. Origination Date 1 st February Area: The Group
 Environmental Management System Integrated Pollution Control Document No. 5.2.1 Version no. 1 Origination Date 1 st February 2017 Area: The Group Approval: Group Services & Facilities Last Revision Date
R E P O R T E P O R T
 R E P O R T E P O R T EMISSION SUMMARY AND DISPERSION MODELLING REPORT GENERAL MOTORS OF CANADA COMPANY ST. CATHARINES CET CASTING, ENGINE AND TRANSMISSION Company Address: GENERAL MOTORS OF CANADA COMPANY
Proposed London Low Emission Zone. Impacts Monitoring Programme. Charles Buckingham Monitoring Manager Transport for London
 Proposed London Low Emission Zone Impacts Monitoring Programme Charles Buckingham Monitoring Manager Transport for London Background Proposed scheme being taken forward by TfL Congestion Charging Division
ASSESSMENT OF TRAFFIC INDUCED POLLUTION FROM THE NEW HIGHWAY OF ATHENS (ATTIKI ODOS) Observatory of Athens, Athens, Greece
 Observatory of Athens, Athens, Greece") ASSESSMENT OF TRAFFIC INDUCED POLLUTION FROM THE NEW HIGHWAY OF ATHENS (ATTIKI ODOS) Michael Petrakis 1, Ilias Kavouras 1, Basil Psiloglou 1, Spyros Lykoudis 1 and Theodora Kopania 1 1 Institute for Environmental
ASSESSMENT OF TRAFFIC INDUCED POLLUTION FROM THE NEW HIGHWAY OF ATHENS (ATTIKI ODOS) Michael Petrakis 1, Ilias Kavouras 1, Basil Psiloglou 1, Spyros Lykoudis 1 and Theodora Kopania 1 1 Institute for Environmental
The practicalities of urban air quality management in large European cities
 The practicalities of urban air quality management in large European cities Martin Lutz Senate Department for Health, Environment and Consumer Protection Directorate IX, Environment Policy where are we
Testimony of Seyed Sadredin Executive Director/Air Pollution Control Officer San Joaquin Valley Air Pollution Control District
 Executive Director/Air Pollution Control Officer San Joaquin Valley Air Pollution Control District Before the Written Testimony on H.R. 806, Ozone Standards Implementation Act of 2017 Chairman Shimkus,
UP IN THE AIR. How to Solve London s Air Quality Crisis: Part 1. Richard Howard
 UP IN THE AIR How to Solve London s Air Quality Crisis: Part 1 Richard Howard About the Capital City Foundation The Capital City Foundation is a new research unit created by Policy Exchange to develop
2014 Air Quality Progress Report for Nottingham City Council. In fulfillment of Part IV of the Environment Act 1995 Local Air Quality Management
 2014 Air Quality Progress Report for Nottingham City Council In fulfillment of Part IV of the Environment Act 1995 Local Air Quality Management Date July 2014 Local Authority Officer Richard Taylor Pollution
REPORT SURAT GAS PROJECT SUPPLEMENTARY AIR QUALITY ASSESSMENT. Coffey Environments
 REPORT SURAT GAS PROJECT SUPPLEMENTARY AIR QUALITY ASSESSMENT Coffey Environments Job No: 3568D 7 June 2013 PROJECT TITLE: Surat Gas Project Supplementary Air Quality Assessment JOB NUMBER: 3568D PREPARED
Greschbachstrasse 3b, Kahlsruhe Germany
 1 Certification Report and Checklist on the Evaluation of the Ambient Air Particulate Matter Test Reports Submitted for Approval and Certification within the MCERTS Scheme for UK Particulate Matter Evaluation
Detailed Air Quality Modelling and Analysis
 Page 1 of 22 Ser. No. Via San Gregorio, 38 20124 Milan - Italy IAL00-ERM-643-Y-TAE-1021 Proponent: Author: Project Title: Trans Adriatic Pipeline AG Environmental Resources Management Trans Adriatic Pipeline
Workplace Travel Plans A guide for Swindon developers
 Workplace Travel Plans A guide for Swindon developers Incorporating the use of Modeshift Starsfor to create Travel Plans and support planning applications Contents What this guidance does... 3 What is
Transportation and Works Department The Regional Municipality of York Yonge Street Newmarket, Ontario L3Y 6Z1
 TRANSPORTATION IMPACT STUDY (TIS) GUIDELINES FOR DEVELOPMENT APPLICATIONS Transportation and Works Department The Regional Municipality of York 17250 Yonge Street Newmarket, Ontario L3Y 6Z1 August, 2007
USE OF ATMOSPHERIC DISPERSION MODELS FOR URBAN AIR QUALITY MANAGEMENT IN POLAND AND OTHER CEE COUNTRIES
 USE OF ATMOSPHERIC DISPERSION MODELS FOR URBAN AIR QUALITY MANAGEMENT IN POLAND AND OTHER CEE COUNTRIES Leslaw Adamczyk, Ryszard Pazdan and Marek Rosicki ATMOTERM S.A., Opole, Poland INTRODUCTION The Air
MONITORING IMPLEMENTATION AND PERFORMANCE
 12 MONITORING IMPLEMENTATION AND PERFORMANCE The FAST Act continues the legislation authorized under MAP-21, which created a data-driven, performance-based multimodal program to address the many challenges