TransAlta Corporation. Investor Presentation March 2018
|
|
|
- Dwight Walsh
- 6 years ago
- Views:
Transcription
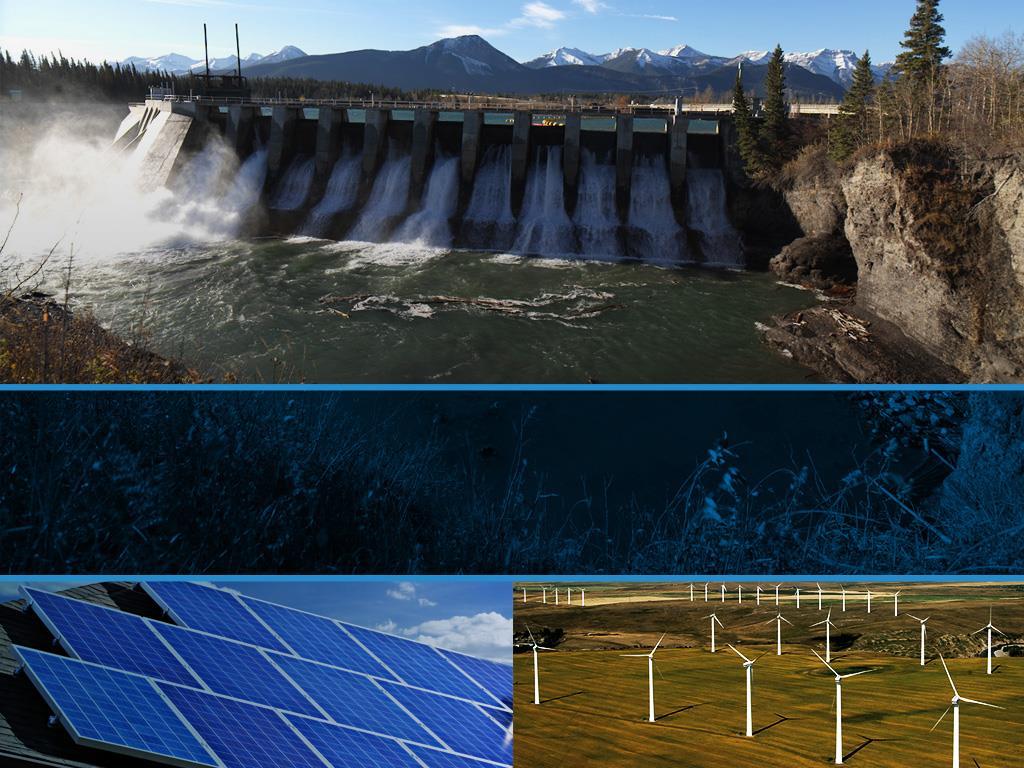

1 TransAlta Corporation Investor Presentation March
2 Forward Looking Statements This presentation includes forward-looking statements or information (collectively referred to herein as forward-looking statements ) within the meaning of applicable securities legislation. All forward-looking statements are based on our beliefs as well as assumptions based on available information and on management s experience and perception of historical trends, current conditions, and expected future developments, as well as other factors deemed appropriate in the circumstances. Forward-looking statements are not facts, but only predictions and generally can be identified by the use of statements that include phrases such as may, will, can, believe, expect, anticipate, intend, plan, project, forecast, foresee, potential, enable, continue, or other comparable terminology. These statements are not guarantees of our future performance and are subject to risks, uncertainties, and other important factors that could cause actual results or outcomes to be materially different from those set forth in the forward-looking statements. In particular, this presentation contains forward-looking statements pertaining to: our priorities and goals, including TransAlta s strategic priorities and its ability to end the year with $3.2 billion in debt and an Adjusted FFO/Net Debt ratio over 22%; emerging industry trends, including assumptions pertaining to declining cost for renewables, abundant supply of low cost natural gas and increasing value of hydrobased power storage; ability to execute on life extension and growth opportunities, including Brazeau Pumped Storage and Bighorn facility expansion; expected $30 million to $50 million to be received annually in credits for TransAlta s existing renewable generation; increase in revenue from Alberta; ability to realize $25 million annually in green credits for Alberta Hydro assets and $15 million and $20 million for our Alberta wind assets; conversion of 2,600 MW of the Alberta coal fleet to clean energy by 2022; ability to qualify for Alberta capacity payments in 2021; upside potential for post-ppa Alberta hydro; the implementation of Alberta s capacity market and the regulatory design of such capacity market; forecasted Alberta prices; cumulative life extension of the converted coal-to-gas units; emission reductions anticipated following conversion of coal-to-gas; reduction in fixed costs following conversion to gas; our portfolio management strategy and any benefit from higher price volatility expectations regarding free cash flow ( FCF) of converted units; economic advantages expected to be realized of converted units, including cost and time to build; TransAlta s key growth strategies and opportunities; construction of gas pipeline, including the Tidewater natural gas pipeline, the volumes, cost and expected commercial operation date ( COD ) thereof; the Bighorn hydro expansion and Brazeau Pumped Hydro projects, including the size, cost and timing thereof; the system benefit arising from the Brazeau Pumped Hydro project; growth to be realized, including the Goonumbla solar farm in Australia, the Garden Plains and Cowley Ridge wind farms in Alberta and the Antelope Coulee Wind farm in Saskatchewan, including the capacity, in-service date and cost of each project; capital allocation in 2018 and 2020; future capital structure, including adjusted FFO to net debt in 2020; FCF outlook in 2018; the 2018 outlook, including comparable EBITDA, FFO and FCF ranges; the 2018 to post-2021 FCF outlook; and the relationship with TransAlta Renewables, including TransAlta s continued sponsorship of TransAlta Renewables and the ability of TransAlta renewables to compete for third party acquisitions and new opportunities. Factors that may adversely impact our forward-looking statements include risks relating to: legislative or regulatory developments, including as it pertains to the Alberta capacity market and Federal environmental legislation; changes in economic and competitive conditions; inability to secure natural gas supply and the construction of a natural gas pipeline on terms satisfactory to the Company; the introduction of disruptive sources of energy or capacity; changes in the price for natural gas; decreased demand for energy or capacity; availability of financing; fluctuations in market prices, including deviations of Alberta spot and Mid-C spot prices relative to stated assumptions; the availability of fuel supplies required to generate electricity, including the costs of natural gas within Alberta; changes to the relationship with, or ownership of, TransAlta Renewables; wind and hydro resources being less than long term average; reduction to the Canadian coal capacity factor; our ability to contract our generation for prices that will provide expected returns; risks associated with development projects and acquisitions, including permitting, labour and engineering risk associated with the coal to gas conversions; increased costs or delays in the construction or commissioning of pipelines to the converted units. The foregoing risk factors, among others, are described in further detail in the Risk Management section of our Management Discussion and Analysis and under the heading Risk Factors in our Annual Information Form. Readers are urged to consider these factors carefully in evaluating the forward-looking statements and are cautioned not to place undue reliance on these forward-looking statements. The forward-looking statements included in this document are made only as of the date hereof and we do not undertake to publicly update these forward-looking statements to reflect new information, future events or otherwise, except as required by applicable laws. Readers are cautioned not to place undue reliance on forward-looking statements, which reflect the Corporation's expectations only as of the date of this presentation. The purpose of the financial outlooks contained in this presentation is to give the reader information about management's current expectations and plans and readers are cautioned that such information may not be appropriate for other purposes. In light of these risks, uncertainties, and assumptions, the forward-looking events might occur to a different extent or at a different time than we have described, or might not occur at all. We cannot assure that projected results or events will be achieved. Certain financial information contained in this presentation, including Comparable EBITDA, FFO and FCF, may not be standard measures defined under International Financial Reporting Standards ( IFRS ) and may not be comparable to similar measures presented by other entities. These measures should not be considered in isolation or as a substitute for measures prepared in accordance with IFRS. For further information on non-ifrs financial measures we use, see the section entitled Reconciliation of Non-IFRS Measures contained in our most recently filed Management's Discussion and Analysis, filed with Canadian securities regulators on and the Securities and Exchange Commission on Unless otherwise specified, all dollar amounts are expressed in Canadian dollars. 2
3 Emerging Industry Trends De-carbonization Move away from coal Significant Growth in Renewables Growth in renewables as a source of low carbon generation Cost of renewables is declining Intermittent nature of renewables is shifting value from baseload to peaking resources Natural Gas Generation Growth Abundant supply of low cost natural gas will support dispatchable natural gas generation and coal to gas conversions Shift to Fast- Ramping Technologies Growing need for flexible, responsive generation Value of hydro-based power storage will increase Increasing recognition of the importance of reliability TransAlta well positioned to capitalize on emerging trends 3
4 2018 Priorities and Goals 1 Support the development of an effective and investable capacity market 2 Construct the Tidewater pipeline 3 Complete engineering and announce the first two plants for conversion 4 Close and develop the two US wind projects at TransAlta Renewables 5 Deliver on financial, safety and environmental goals 6 7 End the year with $3.2 billion in debt and an Adjusted FFO/Net Debt ratio over 22% Build and develop an adaptable workforce with advanced technological skills Transform TransAlta to deliver 100% clean power by
5 PRELIMINARY DRAFT FOR DISCUSSION PURPOSES ONLY, :47 PM TransAlta s Global Generation Portfolio 5
6 TransAlta Today 2017 CASH FLOW GENERATED BY THE BUSINESS (1) Coal / Future CTG Hydro Solar Wind AUSTRALIA Hydro Gas Corporate Offices Wind / Solar 25% 7% 25% $818 mm Coal BC AB ON QC NB 43% WA Gas MN MA WY Significant generator with 8,266 MW of capacity Diversified operations with over 65 facilities in three countries Highly contracted (70%) with upside to Alberta market 1 Comparable EBITDA less sustaining capital and other adjustments and excludes Energy Marketing and Corporate Segments 6


 Long-term")
7 Natural Gas OVERVIEW 100% of generation contracted 9 year weighted average contract life Total net capacity of 1,348MW 67% Canada and 33% Australia WESTERN CANADA AUSTRALIA EASTERN CANADA CUSTOMER FOCUS Sites designed and built to supply a customer need Excellent track record of extensions beyond original contract term $372 $400 Gas-fired Generation Assets $315 $334 $300 - $ E EBITDA ($ millions) Long-term stable cash flows 7

8 Wind and Solar OVERVIEW 71% of generation contracted with an average capacity weighted contract life of 13 years Total net capacity of 1,339MW Canada s largest generator of wind power Experienced developer and operator of wind in Alberta OPERATING MODEL Remote monitoring and operation of all sites optimizes site performance Extensive data enables optimization of operations Able to leverage our knowledge and customer relationships to develop new sites WESTERN CANADA WESTERN U.S. $179 $176 $195 $214 EASTERN CANADA Wind / Solar Assets $220 - $ Contracted EBITDA ($ millions) Merchant EBITDA ($ millions) Highly contracted asset base with upside in Alberta 8
9 Hydro OVERVIEW Own and operate over 90% of Alberta s hydro Expecting approximately $25 million annually in green credits under new regulation WESTERN CANADA CANADA EASTERN CANADA Critical back-up for wind and solar Essential for market stability Immediate ramping Hydro Facilities LIFE EXTENSION AND GROWTH $225 - $275 Re-contracted Akolkolex for 30 years Optionality for extensions and upgrades New opportunities: Brazeau Pumped Storage Bighorn facility expansion $87 $73 $82 $75 Unique, reliable and perpetual EBITDA ($ millions) 9

10 CA and US Coal / Future CTG OVERVIEW Total net capacity of 4,653MW 3,313MW in Alberta and 1,340MW in US PPAs on Keephills 1 and 2 and Sheerness expire at end of 2020 in advance of the transition to the new capacity market STRATEGIC OBJECTIVES Optimize the value of the coal portfolio between 2018 to 2020 Convert 2,600 MW of the Alberta coal fleet to clean energy by 2022 Evaluate timing of conversions of jointly owned facilities Keephills 3, Genesee, and Sheerness OFF-COAL AGREEMENT Government of Alberta annual off-coal payments of $37.4 million totaling $524 million First payment received in Q3/17 Opportunity to monetize ($ million) $451 $456 Approximately $200 million in FCF annually for an additional fifteen years beyond 2021 $434 $413 Coal / Future CTG Facilities EBITDA ($ millions) $300 - $350 10
11 PRELIMINARY DRAFT FOR DISCUSSION PURPOSES ONLY, :48 PM Clarity in Alberta s Power Market Transition 11
12 Regulatory Clarity Achieved Coal Phase Out Off-coal agreement and federal rules mean coal is phased out by 2029 in Canada Environmental Policies Initial carbon tax of $30/tCO2 effective January 1, 2018, potentially climbing to $50/tCO2 by 2022 Credits for electricity generation with emissions below 0.37 tco 2 per MWh Existing wind and hydro eligible Capacity Market Supports incumbent and new generation by providing value for capacity Capacity market design well advanced First auction in 2019 for capacity in 2021 Coal to Gas Plant life extended by 5 to 10 years past coal end of life TransAlta s cumulative fleet life extended by approximately 75 years adding over $1 billion of FCF Regulatory clarity supports investment strategy 12
13 Alberta Carbon Rules are a Positive Outcome for TransAlta EXISTING WIND AND HYDRO GENERATION Will receive credits for generation up to the performance standard under the OBA NEW GREEN CREDITS Eligible to use credits for up to 40% of carbon price obligations starting in 2018 Escalating by 5% per year to 60% by 2022 Credits will be used to offset the carbon costs for coal and converted gas units OBA SYSTEM Generators charged based on emissions above the performance standard Generators credited based on emissions below the performance standard Emissions above standard 0.37 tco 2 e/mwh Emissions below standard $30 to $50 million annually in credits for existing renewables 13
14 Upside Potential for Alberta Wind Assets ALBERTA WIND REVENUE (1) Alberta market supports higher value Benefit from higher expected power price due to carbon costs and higher stronger fundamentals $15 to $20 million annually in green credits Will qualify for capacity payments in 2021 $60 $50 $40 $30 $20 Power Revenue ($ mm) Credits ($ mm) Capacity Revenue ($ mm) $10 $0 Today 2018 to 2020 Post 2021 Revenue from Alberta expected to increase over 90% going forward 1) Energy price in 2018 to 2020 assumed to be $65/MWh. Energy and capacity prices post 2021 assumed to be $40/MWh and $10/KW-month, respectively. Credits based on a $30 carbon tax in 2018 to 2020 and a $50 carbon tax post Generation assumed to be 1,000 GWh 14
15 $ millions Significant Upside Post-PPA for Alberta Hydro $300 $225 - $275 $250 $200 $150 $100 $50 $0 Historical EBITDA (5-yr average) Capacity Payment Received from BP¹ Obligations Paid to the BP¹ Future Capacity Payments Emissions Credits Future Proforma EBITDA Comparable hydro assets valued at 12x to 14x EBITDA 1 Balancing Pool 15
16 Development of Alberta s Capacity Market Supports Our Fleet Forward Auction Provides future revenue visibility and stability Equal Treatment All capacity resources permitted to participate TransAlta s entire generation fleet will be able to participate Downward Sloping Demand Curve Mitigates price volatility and supports capacity revenue during periods of oversupply REP Capacity Excluded Avoids negative impact on capacity price due to subsidized renewables TransAlta is well positioned to compete in a capacity market 16
17 TransAlta s Units are Required EXPECTED CAPACITY REQUIREMENTS (MW) Peak Demand 15% Reserve (1) (2) 13,966 1,822 14,441 1,884 15,216 1,985 Adjusted Capacity: 13,700 (3) (4) 12,144 12,557 13, E 2025E 2030E 1 Based on AESO s 2017 reference case 2 Assumes AESO sets a 15% reserve margin above peak demand for determining capacity requirements 3 Adjusted for outages, de-rates and anticipated capacity eligibility for thermal (95%), hydro (90%) and wind (15%) generation 4 Assumes interties are ineligible for capacity 17
18 Forecasted Alberta Prices in New Market Design CAPACITY PRICE FORECAST ($/KW-MONTH) $25 $20 $15 $10 LEI EDC $5 2021E 2022E 2023E 2024E 2025E 2026E 2027E 2028E 2029E 2030E 2031E ENERGY PRICE FORECAST ($/MWH) $55 $50 $45 $40 $35 LEI EDC $ E 2022E 2023E 2024E 2025E 2026E 2027E 2028E 2029E 2030E 2031E Capacity price will be an important driver of future revenue 18
19 PRELIMINARY DRAFT FOR DISCUSSION PURPOSES ONLY, :48 PM Transitioning our Coal Fleet 19
20 MW Converted CTG Conversions: Proven Technology Harding Street Unit 7 MW Converted 450MW Timeframe 2016 Fuel switching is an attractive and economical option for utilities that must maintain a certain generating capacity in their fleet [ ] Power Engineering Shawville Unit 3/4 376MW 2015/2016 A number of coal plants nationwide have converted to natural gas, a move that uses much of the same infrastructure but involves different economics, less pollution [ ] Midwest Energy News NORTH AMERICAN CTG CONVERSIONS 5,000 4,000 Conversions (# Completed) ,000 Joliet Unit 7/8 1,326MW (1) ,000 1, Not a new concept - many North American examples of CTG conversion 1 Capacity for Unit 6 (290MW), Unit 7 (518MW), and Unit 8 (518MW). Units 7 and 8 are most similar to TransAlta s planned conversions 20
21 Key Driver of Conversion Life Extension TRANSALTA S COAL & CTG GENERATION CAPACITY (MW) 4,000 3,500 3,000 Cumulative fleet life extended by approximately 75 years 2,500 2,000 1,500 1, No Conversion Scenario Convert to Gas 21
22 Key Outcomes of Conversion Emissions Reduction EMISSIONS INTENSITY REDUCTION (%) 48% 60% (1) 98% 95% Carbon emissions are almost halved and particulate emissions are effectively eliminated for converted generation CO2 NOx SO2 Hg 1 NOx reduction ranges from 10% to 70% depending on unit specification. Certain units already generate low NOx emissions. 22
23 $ millions Key Outcomes of Conversions Reduced Fixed Costs $45 $40 $35 $30 Less complex operations lead to significant cost reductions $25 $20 $15 $10 $5 $0 Convertible Coal Converted Gas Fixed OM&A Sustaining Capital Pipeline Tolls Fixed OM&A and sustaining capital costs are reduced 1 Average annual fixed costs for a 400 MW unit by approximately 15% 23
24 Key Outcomes of Conversion Competitive Variable Costs $50 $45 $40 $35 $30 $25 $20 $15 $10 $5 $30 PER TONNE CARBON COSTS ($/MWh) $50 PER TONNE CARBON COSTS ($/MWh) $0 Coal Converted Coal Converted Fuel Carbon Other Cost of carbon drives competitive advantage Note: Converted unit based on natural gas price of $2.50/GJ. Other category includes costs associated with the removal of mercury, and costs associated with reducing NOX, SOx, and particulates. Transmission costs are excluded in all scenarios. 24
25 Key Outcomes of Conversions FCF Generation CUMULATIVE FCF OVER LIFE OF ASSETS ($ MILLION) $3,000 $2,500 $2,000 $1,500 Conversion expected to generate over $1 billion in additional FCF given expected federal regulations Convert to Gas $1,000 $500 Stay on Coal $- Expected FCF growth of over $1 billion with conversion Assumes $30 carbon tax and $8/KW-month capacity price 25
26 Sensitivity of FCF to Capacity Prices EST. AVERAGE ANNUAL FCF UNDER CAPACITY MARKET ($ MM) $400 $350 $30/tonne $300 $250 $200 $150 $ Average $50 - $7.00 $8.00 $9.00 $10.00 $11.00 $12.00 $13.00 Capacity Price ($/KW-month) FCF of converted units is expected to be in-line with historical 26
27 Substantial Economic Advantages Compared to New Build Conversions will be able to enter the market faster, at lower capital cost and with substantially less risk than new CCGT CTG Conversion New Combined Cycle Facility Build Cost (2,700 MW) $300 million $4.5 billion Time to Build 60 days 4 5 years Ramping Slower Faster Carbon Tax Higher Lower Illustrative Heat Rate 9.5x - 11x 7x Conversions will supply customers with low priced, reliable power 27
28 PRELIMINARY DRAFT FOR DISCUSSION PURPOSES ONLY, :48 PM Strongly Positioned For The Future 28


29 TransAlta s Growth Strategy De-carbonize Leverage Existing Sites Leverage Scale and Operational Expertise for Acquisitions Focus on Greenfield & Brownfield Take Some Merchant Risk Expand into New Regions Expand Direct Customer Business Partner 29
30 TransAlta s Growth Strategy Key Actions Strategy Actions De-carbonize Fleet Leverage Existing Sites Leverage Scale and Operational Expertise Focus on Greenfield & Brownfield Take Some Merchant Risk Expand into New Regions Expand Direct Customer Business Partner Convert coal to gas Expand in hydro/wind/solar/efficient gas Expand existing Alberta hydro sites (e.g. Brazeau) Future repowering of existing wind sites Add new natural gas at existing coal sites Integrate new assets without adding significant overhead/admin costs In-sourcing of operations and maintenance Leverage experience and competitive advantage in new builds Less competitive - higher returns Leverage Energy Trading & Marketing expertise and knowledge Opportunities with some merchant risk attract fewer competitors and generate higher returns Expand into other regions of U.S. and Eastern Australia Behind-the-fence generation PPAs with non-traditional counterparties (e.g. technology/telecom companies) Create value by combining strengths of other parties Potential to partner with financial players, OEMs, and customers 30
31 Growth Opportunity Set Alberta natural gas pipeline Potential for 500+ MW of renewables in Alberta and Sask. Behind the fence gas generation in Alberta, BC and Ontario Solar development in Australia and U.S. Significant acquisition opportunities in U.S., Canada, Australia Conversion of 2,500-3,000 MW of coal to gas Potential for 4,000 MW of renewable in Alberta Brazeau energy storage project, Bighorn expansion, Dunvegan Repowering of existing wind sites in U.S. and Canada Acquisitions Replacement of 3,000 MW of converted CTG in Alberta with greenfield natural gas fired generation and storage Greenfield solar and wind in U.S. Acquisitions TransAlta/TransAlta Renewables well positioned to continue to grow 31

32 Alberta Pipeline Strategy NATURAL GAS PIPELINE REQUIREMENTS Sundance and Keephills can consume up to 175 MMcf/d through fuel blending; up to 700 MMcf/d once converted Existing pipelines can provide only limited amount of gas today Two or more pipelines will be secured in order to minimize the risk of any supply disruptions and to provide diversified access to natural gas in Western Canada TIDEWATER NATURAL GAS PIPELINE Entered into Letter of Intent with Tidewater to construct a 120 km pipeline from their Brazeau River Complex to TransAlta s generating facilities Initial volumes of 130 MMcf/d with the potential to expand to 340 MMcf/d Cost of ~$150 million, and expected COD in early 2020 PROPOSED PIPELINE MAP PROVIDES ACCESS TO TIDEWATER STORAGE FACILITIES TransAlta has the option to invest in up to 50% of the pipeline Aligns both companies interests; provides low cost access to natural gas transportation and future flexibility Ownership builds on TransAlta s ownership of natural gas pipeline infrastructure in Australia 32
33 Brazeau Energy Storage SIGNIFICANT VALUE Edmonton Unique one-of-a-kind pumped storage hydro project Up to a 900 MW/5,000 MWh Water Flow Brazeau Reservoir Brazeau Canal Water Flow Brazeau Gorge Brazeau Dam 355MW Investment of $2.5 billion Significant economic and employment benefits Abraham Lake Big Horn 1&2 120MW Water Flow Rocky Mountain House Targeting 2025/2026 operating date Requires long-term contract Ft. McMurray Grande Prairie Bonnyville Hinton Edmonton Camrose Wetaskiwin Red Deer Calgary Drumheller Medicine Hat 100 km Lethbridge 60 mi 33
34 Brazeau Pumped Hydro Significant System Benefits Fast Ramping Load Following Brazeau Pumped Hydro Storage Avoided Curtailment Wind Firming Voltage and Inertia Support Supports Transition to Clean Energy and a Low Cost, Reliable Electricity System 34

35 TransAlta s Brazeau Pumped Hydro Opportunity Proposed pumped hydro Existing power house Leverages existing infrastructure 35
36 Brazeau: Significant Work Completed and Underway Engaged Owner s Engineer, providing Class 5 Estimate Conducted initial geotechnical work Started engagement with First Nations Started environmental field studies Engaged with Governments, Communities, Unions, Regulators and NGOs 36

37 Bighorn Hydro Expansion Expand existing Bighorn from 120 MW to 240 MW Two additional turbines and intake structure Preliminary engineering work completed, identifying no significant issues Utilizes existing infrastructure Capable of providing energy, capacity and ancillary services Preliminary cost estimate of $360 million Brazeau Reservoir Water Flow Brazeau Gorge Edmonton Water Flow Brazeau Canal Brazeau Dam 355MW Bighorn 1&2 120MW Water Flow Rocky Mountain House Abraham Lake 37
38 Australian Growth Goonumbla Solar Farm AUSTRALIA Location Capacity Proposed In-Service Date Capital Costs Other Details 350km North-West of Sydney in New South Wales 70MW 2019 $140 mm Site is permitted under the New South Wales Major Project Planning Development process Engaged Tier 1 EPC contractor to undertake construction and operation and maintenance Interconnection agreements are in place Currently securing offtake agreements Perth Goonumbla Sydney TransAlta continues to build on already its significant Australian presence 38
39 Canadian Wind Projects Garden Plains Wind Location 30 km north of Hanna, Alberta Capacity 130MW Proposed In-Service Date Future Alberta REP calls or third party contracting Capital Costs $260 mm Other Details Wind resource data dating back to 2009 Partnerships with landowners since 2011 Location Antelope Coulee Wind 35 km southwest of Swift Current, Saskatchewan Capacity Up to 200MW Location Capacity Cowley Ridge Wind Repower Northwest of Pincher Creek, Alberta 20MW Edmonton Proposed In-Service Date Capital Costs Other Details April 2021 $400 mm Wind resource data dating back to 2008 Proposed In-Service Date Capital Costs Other Details Future Alberta REP calls or third party contracting $40 mm Site of original Cowley Ridge Wind Farm which was built in 1993 and dismantled in 2016 Long-term understanding of wind resource Hanna Calgary Swift Current Pincher Creek Saskatoon Regina Alberta wind projects remain candidates for future REP procurements or third party contracting; Antelope Coulee prepared for up-coming Saskatchewan RFP. 39
40 Well Positioned to Grow Proven track record with significant opportunities being evaluated Competitive advantages beyond cost of capital Brownfield expansions leveraging existing infrastructure provide unique growth opportunity Continue to utilize TransAlta Renewables for long-term contracted opportunities Remain Focused and Disciplined 40
41 PRELIMINARY DRAFT FOR DISCUSSION PURPOSES ONLY, :48 PM Outlook and Financial Summary 41
42 Portfolio Management Strategy - Alberta Q Q2-Q Percentage Contracted (1) 91% 61% 55% 45% Forward Price ($/MWh) Hedged Price ($/MWh) POSITION (MW) 3,500 3,000 2,500 2,000 Potential open positions Hedges Long-term contracts Strategic shift from being highly hedged to active portfolio management - positioning the portfolio to benefit from potential price volatility 1,500 1, Sundance PPA Other PPA Q1/2018 Q2-Q4/ Our outlook assumes a price range of $50 to $60/MWh in 2018 (1) Excluding mothballed capacity 42
43 Capital Allocation to 2020 SOURCES & USES ($ BILLION) $0.4 Existing Liquidity $0.2 Drop down to RNW Bond Repayment $1.4 $0.3 Off-Coal Monetization Amortizing Debt $0.3 $1.2 FCF including payment for Alberta PPA termination Dividend $0.1 Growth $0.3 Uses Sources Prudent allocation of capital excess cash could be allocated to growth or be returned to shareholders 43
44 Capital Structure On Solid Ground Debt metrics above target range post 2021 allow for excess FCF to be allocated to growth ADJUSTED FFO TO NET DEBT 30% 25% 20% 15% 15% 17% Current capital plan would result in FFO / Net Debt of ~30% 20% Target range of 20-25% 10% 5% 0% E 2020E Flexibility to fund additional growth over the next three years 44
45 Free Cash Flow Outlook FREE CASH FLOW BUILD-UP ($ MILLION) $600 $500 $400 Int. Exp. Reduction Alberta Market Optimization Greenlight & Other Solomon Sundance A Sundance B/C Sundance B/C Termination Payment $300 $328 South Hedland Coal Cost $275 - $350 $200 $100 $ E More upside through additional productivity gains, cost and capital reductions and higher prices 45
46 2018 Outlook 2018 Outlook Ranges ($ million) Low High Comparable EBITDA $950 $1,050 Funds from Operations $725 $800 Sustaining Capital (215) (235) Free Cash Flow $275 $350 Free Cash Flow Including PPA Termination Payment $475 $550 Free Cash Flow Per Share $0.96 $1.22 Annual Dividend $0.16 $0.16 Dividend Payout Ratio 17% 13% Range of Key Assumptions Alberta Spot ($/MWh) $50 - $60 Alberta Contracted ($/MWh) $35 - $40 Mid-C Spot (US$/MWh) $20 - $25 Mid-C Contracted (US$/MWh) $47 - $53 Canadian Coal Capacity Factor 65% - 75% Hydro / Wind Resource Long term average 46
47 Free Cash Flow Outlook FREE CASH FLOW BUILD-UP ($ MILLION) $600 $525 - $575 $500 $400 $300 $200 Sundance B/C Termination Payment $275 - $350 $375 - $425 Full Year of Greenlight Interest Reductions Optimization Full Coal Cost Reductions Mississauga Poplar Creek Hydro Upside $100 $0 2018E 2019 to 2020 Post
48 Enhancing Growth Through Sponsored Vehicle COMMENTARY ADVANTAGE FOR TRANSALTA Significant Source of Value Attractive portfolio of highly contracted renewables and gas-fired assets Current dividend yield 8% Majority shareholder - 64% Provides stable and predictable dividends to TransAlta Strong Balance Sheet Low leverage offers strong potential for growth Significant acquisition capacity (both third-party acquisitions and drop-downs) Premium for Strong, Stable Cash Flows Market premium multiple for assets with strong, stable cash flows 9.4x EV/EBITDA Access to competitive cost of capital 12% AFFO Yield Ability to compete for third party acquisitions and new opportunities Ability to align risk/return profile with appropriate entity Provides natural home for new renewables investments 48
49 Why Invest in TransAlta Diversified portfolio in Alberta creates short-term value Significant value creation from coal to gas conversions Strong long term cash flows from diversified portfolio Improving balance sheet Growth opportunities unique to TransAlta 49
50 Value of Coal Not Being Recognized TA RNW TA-Excluding RNW TA Upside $0.9 $1.3 $2.9 Value attributable to existing coal plants in current share price Implies Coal at 6x to 8x EBITDA $3.4 $1.0 PPA Termination payment Renewables and gas not held at RNW Coal Monetization $0.2 $0.2 $0.6 $0.4 $1.9 Hydro (2) $2.2 TA Equity TA Debt, net of cash Preferred Shares NCI RNW Equity RNW Debt Remaining Value Coal Plant Correct valuation for the coal and CTG would increase the share price by $5 to $8 per share Priced as February 26, Balance sheet items reflect Q values. 1 includes the market value of TransAlta Renewables and BV of TA Cogen. 2 Hydro valued at $2.6 million per MW (1) 50
Investor Presentation September 2016
 Investor Presentation September 2016 1 LEGAL DISCLAIMER Statements made by representatives for ATCO Ltd. and information provided in this presentation may be considered forward-looking statements. By their
Renewable Independent Power Producer. Geothermal Conference and Expo
 Renewable Independent Power Producer Geothermal Conference and Expo - 2014 1 Forward Looking Statements This presentation contains certain forward-looking statements within the meaning of the Private Securities
Electricity Supply. Monthly Energy Grid Output by Fuel Type (MWh)
") For the first quarter of 2015, Ontario experienced overall demand that was typical for the province in winter, and strong generator output. Demand for Ontario electricity increased as a result of cold
For the first quarter of 2015, Ontario experienced overall demand that was typical for the province in winter, and strong generator output. Demand for Ontario electricity increased as a result of cold
SUNDANCE 7 January 2014
 Artist rendering of a combined-cycle natural gas power plant. SUNDANCE 7 January 2014 Project Information Booklet Table of Contents Introduction to Sundance 7 1 TransAlta and MidAmerican 1 Project location
Hedging Coal Price Risk in a Deregulated Power Market
 Hedging Coal Price Risk in a Deregulated Power Market Ginny Farrow Manager Rail Car Fleet NCCI Spring Conference Greensboro, NC April 12, 2007 Safe Harbor Statement This Presentation contains forward-looking
Financial Issues and the Future of Coal
 Financial Issues and the Future of Coal David Schlissel January 10, 2012 45 Horace Road, Belmont MA 02478 david@schlissel-technical.com (office) 617-489-4840 (cell) 617-947-9507 Economic vs. Financial
Policy Direction for Alberta s Capacity Market Framework
 Policy Direction for Alberta s Capacity Market Framework August 15, 2017 Alberta Department of Energy Table of Contents Executive Summary... 1 1 Introduction... 2 2 Policy Direction for Alberta s Capacity
Avery Dennison Investor Presentation August 2014
 Avery Dennison Investor Presentation August 2014 Unless otherwise indicated, the discussion of the company s results is focused on its continuing operations, and comparisons are to the same period in the
ABENGOA. Chile, changing the energy matrix. Completing Transformation. Ivan Araneda. Innovative Technology Solutions for Sustainability
 Innovative Technology Solutions for Sustainability ABENGOA Chile, changing the energy matrix Completing Transformation 9th Annual Analyst and Investor Day Ivan Araneda General Manager Abengoa Chile New
OPG REPORTS 2017 FINANCIAL RESULTS. OPG records increase in net income for third consecutive year
 Mar. 8, 2018 OPG REPORTS 2017 FINANCIAL RESULTS OPG records increase in net income for third consecutive year [Toronto]: Ontario Power Generation Inc. (OPG or Company) today reported net income attributable
Tucson Electric Power 2017 Integrated Resource Plan. Southern Arizona Regional Solar Partnership Jeff Yockey, PE
 Tucson Electric Power 2017 Integrated Resource Plan Southern Arizona Regional Solar Partnership Jeff Yockey, PE May 2017 Integrated Resource Plan (IRP) Overview Just a Plan Additional steps for specific
Cogeneration & Carbon Management Key Issues in the Design of Carbon Management Policies and Regulations in Alberta
 Cogeneration & Carbon Management Key Issues in the Design of Carbon Management Policies and Regulations in Alberta Paula McGarrigle Managing Director Solas Energy Consulting Inc. Suite 119, 2137 33 Avenue
ALBERTA POWER MARKET
 ALBERTA POWER MARKET www.canaxenergy.com Generating Capacity Generating Capacity [MW] Coal 5,840 Gas 4,434 Hydro 900 Wind 522 Biomass 184 Fuel Oil 13 Subtotal 11,892 Interconnections British Columbia 750
Recommended acquisition of The BSS Group plc. 5 July 2010
 Recommended acquisition of The BSS Group plc 5 July 2010 Important information This document is being made available only to persons who fall within the exemptions contained in Article 19 and Article 49
CANADA S NEXT INTERMEDIATE GOLD PRODUCER. Nishnawbe Aski Development Fund Aboriginal Partnership Conference Timmins, Ontario May 30, 2013
 CANADA S NEXT INTERMEDIATE GOLD PRODUCER 1 Nishnawbe Aski Development Fund Aboriginal Partnership Conference Timmins, Ontario May 30, 2013 Forward Looking Information This presentation contains certain
Net Demand Variability (NDV) Summary
 Summary") Net Demand Variability (NDV) Summary Executive Summary: This document provides a summary of the Net Demand Variability (NDV) work presented to the Energy and Ancillary Service (EAS) workgroup in WG meetings
Net Demand Variability (NDV) Summary Executive Summary: This document provides a summary of the Net Demand Variability (NDV) work presented to the Energy and Ancillary Service (EAS) workgroup in WG meetings
Modelling of Australia s National Energy Guarantee
 Modelling of Australia s National Energy Guarantee Ambition is key White Paper Leonard Quong Kobad Bhavnagri Ali Asghar November 22, 217 Executive Summary The Turnbull Government s National Energy Guarantee
Client Name/Presentation Title
 Client Name/Presentation Title MARCH 2 Introduction This presentation will address the following topics: Comparative levelized cost of energy for various technologies on a $/MWh basis, including sensitivities,
Date of Request for Comment: April 7, 2017 Period of Comment: April 7, 2017 through May 5, 2017
 Market Participant Comments and AESO Replies Matrix Proposed Amended Section 304.3, Wind and Solar Power Ramp Up Management ( amended Section 304.3 ) Date of Request for Comment: April 7, 2017 Period of
American Public Power Association Joint Action Workshop December 6, 2004 Fitch s Take on Fuel Risk
 American Public Power Association Joint Action Workshop December 6, 2004 Fitch s Take on Fuel Risk Karl Pfeil III, Senior Director FitchRatings, Inc. Fitch Ratings Global Power North America > Fitch is
The New England Clean Power Link A powerful wind and hydro partnership for Massachusetts
 The New England Clean Power Link A powerful wind and hydro partnership for Massachusetts RENEWABLE AFFORDABLE RELIABLE PROJECT OVERVIEW The New England Clean Power Link A powerful wind and hydro partnership
Ashbridges Bay Treatment Plant Biogas Cogeneration Proposal from Toronto Hydro Energy Services
 STAFF REPORT ACTION REQUIRED Ashbridges Bay Treatment Plant Biogas Cogeneration Proposal from Toronto Hydro Energy Services Date: May 20, 2009 To: From: Wards: Reference Number: Public Works and Infrastructure
CHAPTER 1 EXECUTIVE SUMMARY
 CHAPTER 1 EXECUTIVE SUMMARY The 2016 SD Electricity Supply Resource Procurement Plan The 2016 South Dakota Electricity Supply Resource Procurement Plan ( Plan ) evaluates NorthWestern Energy s ( NorthWestern
WATER AND WIND QUÉBEC S CLEAN, RENEWABLE ENERGY RESOURCES
 WATER AND WIND QUÉBEC S CLEAN, RENEWABLE ENERGY RESOURCES QUÉBEC HAS THE CLEAN ENERGY MASSACHUSETTS NEEDS Hydro-Québec is proposing a new source of clean energy to Massachusetts, in the form of firm deliveries
Alberta & Saskatchewan Renewable Energy Finance Summit Alberta and Saskatchewan Climate Policy Developments and Implications for Renewables
 Alberta & Saskatchewan Renewable Energy Finance Summit 2018 Alberta and Saskatchewan Climate Policy Developments and Implications for Renewables Lisa (Elisabeth) DeMarco DeMarco Allan LLP lisa@demarcoallan.com
2 November Project Manager Queensland Renewable Energy Expert Panel PO Box 15456, City East Queensland Online:
 2 November 2016 Project Manager Queensland Renewable Energy Expert Panel PO Box 15456, City East Queensland 4002 Level 22 530 Collins Street Melbourne VIC 3000 Postal Address: GPO Box 2008 Melbourne VIC
Natural Gas Market Review EB
 Natural Gas Market Review EB-2010-0199 Presented to the Ontario Energy Board October 7/8, 2010 David Butters President & CEO Agenda APPrO who we are Background on Ontario s gas-fired generators Current
W I N D A N D S O L A R R F Q / R F P P R O C E S S
 W I N D A N D S O L A R R F Q / R F P P R O C E S S S a s k a t c h e w a n R e n e w a b l e s I P P and Supplier I n f o r m a t i o n S e s s i o n S a s k a t o o n, S a s k a t c h e w a n N o v e
Cost of Service and Public Policy. Ted Kury Director of Energy Studies, PURC
 Cost of Service and Public Policy Ted Kury Director of Energy Studies, PURC ted.kury@warrington.ufl.edu Session Overview Improving Utility Sector Performance Costs to Provide Service Uniform System of
Utility-scale PV challenges in the Australian market
 Utility-scale PV challenges in the Australian market All-Energy Conference 2016 October 4, 2016 Renzo Gaggioli Senior Project Manager, Energy Business www.canadiansolar.com Safe Harbor Statement This presentation
APPENDIX B: WHOLESALE AND RETAIL PRICE FORECAST
 APPENDIX B: WHOLESALE AND RETAIL PRICE FORECAST Contents Introduction... 3 Key Findings... 3 Background... 5 Methodology... 7 Inputs and Assumptions... 8 Load... 8 Fuel Prices... 9 Resources... 9 Pacific
1. Is there a preference between MW and MWh? RPS need for San Diego Gas & Electric is based upon a percentage of retail sales, which is in MWh.
 1. Is there a preference between MW and MWh? RPS need for San Diego Gas & Electric is based upon a percentage of retail sales, which is in MWh. There is no target for MW of renewable capacity (except in
December 2014 John Dalton
 ISO-New England Forward Capacity Auction #9 Summary Price Forecast December 2014 John Dalton 978-369-2465 jdalton@poweradvisoryllc.com ISO-New England s upcoming Forward Capacity Auction prices are likely
WESTFALIA AUTOMOTIVE ACQUISITION AUGUST 25, 2016
 WESTFALIA AUTOMOTIVE ACQUISITION AUGUST 25, 2016 1 SAFE HARBOR STATEMENT FORWARD-LOOKING STATEMENTS This presentation may contain "forward-looking statements" as defined in the Private Securities Litigation
Executive Summary PSE Integrated Resource Plan. Contents. Chapter 1: Executive Summary
 1 2017 PSE Integrated Resource Plan Executive Summary The IRP is best understood as a forecast of resource additions that appear to be cost effective given what we know today about the future. We know
INDONESIA S NEW DEVELOPMENT IN POWER AND RENEWABLE ENERGY SECTORS by Hapsari Arumdati
 INDONESIA S NEW DEVELOPMENT IN POWER AND RENEWABLE ENERGY SECTORS by Hapsari Arumdati Introduction Indonesian power sector is one of the business sectors in Indonesia which is strictly regulated. For the
YOUR LOCAL DEVELOPER
 YOUR LOCAL DEVELOPER ABOUT Alberta Wind Energy Corporation ( AWEC ) was formed in 2003 to develop independent wind farm projects. The Company is currently focused on developing several sites, taking a
INTEGRATED RESOURCE PLAN
 HOOSIER ENERGY INTEGRATED RESOURCE PLAN 2016 UPDATE WHAT IS RESOURCE PLANNING? Key features Inputs Resource mix n Member input n Board policies n Regulatory requirements n Risk adjusted least cost Energy
SB 838: Oregon Renewable Energy Act Establishing an Oregon Renewable Energy Standard
 SB 838: Oregon Renewable Energy Act Establishing an Oregon Renewable Energy Standard Section-by-Section Summary SB 838, C-engrossed version As passed by Oregon House of Representatives, May 23 rd, 2007.
About Energy UK. Introduction
 REC 34-15 Energy UK response to DG Comp investigation of Investment Contract (early Contract for Difference) for Lynemouth power station biomass conversion 10 May 2015 About Energy UK Energy UK is the
Emera Utility Services 2 Utility services contractor working in Atlantic Canada and other regions
 At a Glance About Emera From our origins as a single electrical utility in Nova Scotia, Emera has grown to become a North American energy leader serving customers in Canada, the U.S. and the Caribbean.
Third quarter and first nine months 2017 Results Release. October 19 th, 2017
 Third quarter and first nine months 2017 Results Release October 19 th, 2017 Safe harbor statement Any statements contained in this document that are not historical facts are forward-looking statements
Energy Trust of Oregon Strategic Plan
 Energy Trust of Oregon 2015-2019 Strategic Plan October 1, 2014 Introduction Who We Are Energy Trust of Oregon is an independent nonprofit organization dedicated to helping 1.5 million customers of four
Financial and other information related to the intended combination of Intrum Justitia and Lindorff published by Intrum Justitia
 Stockholm 12 June 08:10 CET (page 1 of 5) PRESS RELEASE Intrum Justitia AB (publ) Corporate identity no.:556607-7581 Financial and other information related to the intended combination of Intrum Justitia
Leading the way towards a Smart Grid Capital Market Day London, December 5, 2013
 Jan Mrosik CEO Smart Grid Division Leading the way towards a Smart Grid Capital Market Day London, Safe Harbour Statement This document contains statements related to our future business and financial
Zero Net Carbon Portfolio Analysis
 Zero Net Carbon Portfolio Analysis Prepared for: Platte River Power Authority December 5, 2017 This Report was produced by Pace Global, a Siemens business ( Pace Global ) and is meant to be read as a whole
2005 Integrated Electricity Plan Modelling Approach IEP Provincial IEP Committee Meeting #4 May 31/June 1, 2005
 2005 Integrated Electricity Plan Modelling Approach 2005 IEP Provincial IEP Committee Meeting #4 May 31/June 1, 2005 IEP Road Map Part 2 Key Input Assumptions Part 1 Planning Objectives and Principles
Fringe-of-Grid PV Projects - Normanton Solar Farm
 Fringe-of-Grid PV Projects - Normanton Solar Farm All-Energy Conference 2016 October 5, 2016 Josh Currah Project Manager, Energy Business www.canadiansolar.com Safe Harbor Statement This presentation has
Colorado PUC E-Filings System
 Page of BEFORE THE PUBLIC UTILITIES COMMISSION OF THE STATE OF COLORADO * * * * IN THE MATTER OF THE APPLICATION OF PUBLIC SERVICE COMPANY OF COLORADO FOR APPROVAL OF ITS 0 ELECTRIC RESOURCE PLAN ) ) )
DATA ASSUMPTIONS AND DESCRIPTION OF STUDIES TO BE PERFORMED 2014 EGSL & ELL Integrated Resource Plans
 ENTERGY GULF STATES LOUISIANA, L.L.C. & ENTERGY LOUISIANA, LLC LPSC DOCKET NO. I-33014 DATA ASSUMPTIONS AND DESCRIPTION OF STUDIES TO BE PERFORMED 2014 EGSL & ELL Integrated Resource Plans This version
Hydro takes over Vale s aluminium business in transforming transaction
 Hydro takes over Vale s aluminium business in transforming transaction Svein Richard Brandtzæg, President and CEO Bank of America Merrill Lynch Global Metals & Mining Conference May 12, 2010 (1) Cautionary
Bill Fehrman President and CEO
 Bill Fehrman President and CEO A graduate of the University of Nebraska in Lincoln and with a master s degree in business administration from Regis University, Bill joined MidAmerican Energy in 2007 after
Coal Closure In Ontario
 MINISTRY OF ENERGY Coal Closure In Ontario August 2015 Purpose Ontario has experience in phasing out coal-fired electricity generation. This deck provides insight into Ontario s experience through a thorough
2012 Integrated Resource Plan
 2012 Integrated Resource Plan Entergy System This document describes the Entergy System s Integrated Resource Plan for the period 2012 2031. The Integrated Resource Planning Process results in a Preferred
NRG Business. Mauricio Gutierrez COO and President NRG Business
 NRG Business Mauricio Gutierrez COO and President NRG Business NRG Wholesale to Business Organized to Survive Today, Win Tomorrow & Grow the Future Wholesale Unmatched portfolio positioned to survive retirement
INVESTING IN OUR ECONOMY: NORTH-SOUTH CORRIDOR TRANSMISSION REINFORCEMENT
 INVESTING IN OUR ECONOMY: NORTH-SOUTH CORRIDOR TRANSMISSION REINFORCEMENT Government of Alberta Response to the Critical Transmission Review Committee Report February 23, 2012 Alberta s Electricity Transmission
SILVERCORP REPORTS Q3 RESULTS: NET INCOME OF $12.7 MILLION, $0.08 PER SHARE AND PROVIDES FISCAL 2019 PRODUCTION AND CASH COSTS GUIDANCE
 NEWS RELEASE Trading Symbol: TSX: SVM NYSE AMERICAN: SVM SILVERCORP REPORTS Q3 RESULTS: NET INCOME OF $12.7 MILLION, $0.08 PER SHARE AND PROVIDES FISCAL 2019 PRODUCTION AND CASH COSTS GUIDANCE VANCOUVER,
LNG Projects Development of the Future
 LNG Projects Development of the Future Gastech, 7 th of April 2017 Hilary Mercer VP Integrated Gas Projects and Executive Director Prelude 1 Definitions & cautionary note The companies in which Royal Dutch
SILVERCORP REPORTS SILVER PRODUCTION OF 5.0 MILLION OUNCES, CASH FLOWS FROM OPERATIONS OF $31.9 MILLION, OR $0
 NEWS RELEASE Trading Symbol: TSX: SVM SILVERCORP REPORTS SILVER PRODUCTION OF 5.0 MILLION OUNCES, CASH FLOWS FROM OPERATIONS OF $31.9 MILLION, OR $0.19 PER SHARE, FOR FISCAL YEAR ENDED MARCH 31, 2016 VANCOUVER,
Market Mechanics Review of Net Demand Variability from the E&AS Design Stream Working Group Meeting 6&8
 Market Mechanics Review of Net Demand Variability from the E&AS Design Stream Working Group Meeting 6&8 Impact of Net Demand Variability Reference Case and High Cogen scenario Background Dispatching to
Non-IFRS performance measure. Refer to the Non-IFRS Performance Measures contained in the Q Management s Discussion and Analysis.
 PRESS RELEASE TSX NYSE: RIC Richmont Mines Reports Strong Second Quarter Financial Results Driven by Solid Operational and Record Cost Performance from the Island Gold Mine; Reports Net Free Cash Flow
FIRST SOLAR INVESTOR OVERVIEW
 FIRST SOLAR INVESTOR OVERVIEW IMPORTANT INFORMATION Forward Looking Statements This presentation contains forward-looking statements which are made pursuant to safe harbor provisions of the Private Securities
Supporting Co-Generation Through Alberta s Climate Leadership Plan
 Supporting Co-Generation Through Alberta s Climate Leadership Plan Prepared for the Oil Sands Community Alliance (OSCA) A Division of the Canadian Association of Petroleum Producers (CAPP) August 3, 2017
VALUE OF YOUR WIND PPA
 ROCKY MOUNTAIN IN STIT U TE TRANSMISSION INVESTMENTS AFFECT THE VALUE OF YOUR WIND PPA INSIGHT BRIEF March 2017 IIIII Anthony D. Teixeira ateixeira@rmi.org HIGHLIGHTS The Trend: Two-thirds of corporate
Zero Net Carbon Portfolio Analysis
 Zero Net Carbon Portfolio Analysis Prepared for: Platte River Power Authority December 12, 2017 www.paceglobal.com Agenda Background Methodology Assumptions Cases Findings and Recommendations Page 2 Background
The Outlook for Retail Electricity Prices
 The Outlook for Retail Electricity Prices Presentation to Power Australia Conference 2011 Edwin O Young 27 September 2011 Australia s future retail electricity price environment Australian retail electricity
New England Electricity Outlook
 O C T O B E R 2 1, 2 0 1 6 S O U T H P O R T L A N D, M E New England Electricity Outlook Environmental and Energy Technology Council of Maine (E2Tech) Eric Johnson D I R E C T O R, E X T E R N A L A F
Financing Small Hydro Projects (SHP): The Challenges and the Opportunities
: The Challenges and the Opportunities") Financing Small Hydro Projects (SHP): The Challenges and the Opportunities Presented by: Mark Matousek Founder & Vice Chairman ORENCO Hydropower Presented at: NWHA Small Hydro Workshop 2011 September Clean
Financing Small Hydro Projects (SHP): The Challenges and the Opportunities Presented by: Mark Matousek Founder & Vice Chairman ORENCO Hydropower Presented at: NWHA Small Hydro Workshop 2011 September Clean
FINANCIAL PERSPECTIVES
 FINANCIAL PERSPECTIVES M³ - Meet Merck Management Marcus Kuhnert, CFO Darmstadt December 10, 2015 Disclaimer Cautionary Note Regarding Forward-Looking Statements This communication may include forward-looking
Solar Rural Alberta s Opportunity. David Vonesch, P.Eng
 Solar Rural Alberta s Opportunity David Vonesch, P.Eng SkyFire Energy Inc! Founded in 2001 in Calgary! Offices and staff in Edmonton and Calgary! Western Canada s leading solar EPC (Engineering, Procurement
Co-Benefits of Renewable Energy and Energy Efficiency in Utah
 Co-Benefits of Renewable Energy and Energy Efficiency in Utah Air Quality, Health and Water Benefits A Report to the State of Utah March 15, 2010 Jeremy Fisher, PhD; Jon Levy, ScD; Yurika Nishioka, ScD;
APSC Docket No U Entergy Arkansas, Inc Integrated Resource Plan
 Entergy Arkansas, Inc. APSC FILED Time: 10/31/2012 2:33:12 PM: Recvd 10/31/2012 2:30:51 PM: Docket 07-016-U-Doc. 24 425 West Capitol Avenue P. O. Box 551 Little Rock, AR 72203-0551 Tel 501 377 4457 Fax
New England States Committee on Electricity
 Renewable and Clean Mechanisms 2.0 Study Phase I: Scenario Analysis Winter 2017 New England States Committee on Electricity Overview Context Analytical Approach and Modeling Assumptions Scenario Analysis
WILLIAM BLAIR GROWTH STOCK CONFERENCE. June 14, 2017
 WILLIAM BLAIR GROWTH STOCK CONFERENCE June 14, 2017 Safe Harbor Statement Statements made in this presentation which are not statements of historical fact are forward-looking statements and are subject
Manitoba Hydro - Power Plants and SWOT Analysis, 2011 Update
 Manitoba Hydro - Power Plants and SWOT Analysis, 2011 Update #43357 $1000 53 pages In Stock Report Description The report contains the profile of the company that is involved in the field of power generation
EAGLE MOUNTAIN Hydro Electric Pumped Storage Project
 EAGLE MOUNTAIN Hydro Electric Pumped Storage Project Eagle Crest Energy Company Making Renewable Energy Dependable Northwest Wind Integration Forum Portland, Oregon October 17, 2008 By Gil Tam Eagle Crest
GAS BACKBONE OF THE ENERGY SYSTEM TANYA MORRISON, CLIMATE CHANGE GR MANAGER IGU & PGNIG at COP19, Warsaw November 2013
 GAS BACKBONE OF THE ENERGY SYSTEM TANYA MORRISON, CLIMATE CHANGE GR MANAGER IGU & PGNIG at COP19, Warsaw November 2013 Copyright of Royal Dutch Shell plc 1 CAUTIONARY NOTE The companies in which Royal
Dispatching Variable Generation Resources
 Dispatching Variable Generation Resources A Discussion Paper for Stakeholder Engagement 91 (Renewable Integration) Table of Contents Introduction... 3 IESO Dispatch Processes... 5 Registration... 5 Dispatch
11.0 Energy. Summary Energy snapshot
 11.0 Energy Summary Improving energy affordability and security will require significant reform of the energy sector. The NSW Government is delivering the sale of the generation businesses and has rationalised
MONTANA S ENERGY ECONOMY
 MONTANA S ENERGY ECONOMY EPDD Mission Foster creation of high quality jobs Increase tax base Increase Montana energy production The Schweitzer Energy Policy Long term, sustainable, reliable, and affordable
Logitech Q1 Fiscal Year 2015 Preliminary Financial Results Management s Prepared Remarks (July 23, 2014)
") Logitech is posting a copy of these prepared remarks, its press release and accompanying slides to its investor website. These prepared remarks will not be read on the call. We refer both to GAAP and to
Logitech is posting a copy of these prepared remarks, its press release and accompanying slides to its investor website. These prepared remarks will not be read on the call. We refer both to GAAP and to
FUTURE OF ENERGY SURVEY - NIGERIA. March 2015, Nigeria
 FUTURE OF ENERGY SURVEY - NIGERIA March 015, Nigeria Copyright Company by name Shell International appears here BV DEFINITIONS AND CAUTIONARY NOTE The companies in which Royal Dutch Shell plc directly
Renewable Portfolio Standards
 Renewable Portfolio Standards Lisa Schwartz Presentation to Oregon State University Energy Economics Class Feb. 22, 2010 The Regulatory Assistance Project China EU India United States About the Regulatory
Gas-Electric Coordination in PJM: Trends, Issues, Interactions, and Looking Ahead
 Gas-Electric Coordination in PJM: Trends, Issues, Interactions, and Looking Ahead Harvard Electricity Policy Group 68 th Plenary Session Paul M. Sotkiewicz, Ph.D. Chief Economist PJM Interconnection October
Energy Services. Your one-stop-shop solutions provider
 Energy Services Your one-stop-shop solutions provider We are Uniper We are a leading international energy company with operations in more than 40 countries and 12,600 employees. We combine a balanced portfolio
Uniform Price vs. Differentiated Payment Auctions
 Uniform Price vs. Differentiated Payment Auctions A Discussion of Advantages and Disadvantages PREPARED FOR Independent Electricity System Operator ICA Fundamentals and Concepts Stakeholder Meeting PREPARED
EVA grossly miscalculates Wind s Capacity Factor:
 EVA grossly miscalculates Wind s Capacity Factor: Typical Pennsylvania Wind Capacity Factor: Myersdale Wind Energy Center 60.00% 50.00% Capacity Factor 40.00% 30.00% 20.00% 10.00% 0.00% 2004-2009 Source:
CB&I Investor Presentation March 2017
 A World of Solutions CB&I Investor Presentation March 2017 A Leading Provider of Technology and Infrastructure for the Energy Industry Safe Harbor Statement This presentation contains forward-looking statements
Northwest Power and Conservation Council NW Power Markets Symposium Products & Transactions
 Northwest Power and Conservation Council NW Power Markets Symposium Products & Transactions Presented by: John Wilkinson John.Wilkinson@MorganStanley.com 604-658-8132 July 2013 Disclaimer: The information
August 22, 2014 FIRE ISLAND WIND
 August 22, 2014 FIRE ISLAND WIND Phase 1 Summary: Performance Project Performance: Benefits realized: 93,500 MWh LTD >875,000 MCF of NG burn avoided ~$6.5 MM in NG purchases avoided 55,000 tons of CO2
Pacific Ethanol, Inc.
 Pacific Ethanol, Inc. (Nasdaq: PEIX) Third Quarter 2016 Financial Results November 3, 2016 Cautionary Statements Statements and information contained in this communication that refer to or include Pacific
Optimization and Flexibility First: The Clear Case for Energy Storage
 Optimization and Flexibility First: The Clear Case for Energy Storage Ontario s Long-Term Energy Plan (2017) Submission of Energy Storage Canada (ESC) December 16, 2016 1 Executive Summary In the last
Your guide to the. SOUTHERN ALBERTA Transmission Reinforcement
 Your guide to the SOUTHERN ALBERTA Transmission Reinforcement OUR TRANSMISSION LINES TRANSPORT THE POWER YOU USE EVERY DAY. Edmonton Red Deer Calgary Lethbridge 85% AltaLink s transmission system efficiently
Welcome to our Open House!
 Welcome to our Open House! Please sign in at the front desk and provide your contact information if you would like to receive project updates. We invite you to walk around and look at the displays. If
Indonesia s Generation Fuel Mix in an Era of Price Uncertainty Tom Parkinson 14 April 2015
 Indonesia s Generation Fuel Mix in an Era of Price Uncertainty Tom Parkinson 14 April 215 Who we are Helping Our Clients Create Value Market analysis and insights Asset valuation / M&A Policy / regulation
California s Renewable Portfolio Standard
 California s Renewable Portfolio Standard Northwest Power and Conservation Council California Power Markets Symposium September 5, 2013 William A. Monsen MRW & Associates, LLC Oakland, California wam@mrwassoc.comcom
PGE s 2013 Integrated Resource Plan
 PGE s 2013 Integrated Resource Plan OPUC Public Meeting 2014 Portland General Electric. All rights reserved. Today s topics IRP public process Load-resource balance Assumptions and inputs E3 low-carbon
BUILDING CANADA S LARGEST GOLD MINE Production Early Mining Ready Summit October 23, 2012
 BUILDING CANADA S LARGEST GOLD MINE Production Early 2013 1 Mining Ready Summit October 23, 2012 Forward Looking Information This presentation contains certain forward-looking information as defined in
Modelling of the Clean Energy Finance Corporation
 Australian Solar Council and WWF- Australia Modelling of the Clean Energy Finance Corporation Potential Impacts on Renewable Energy in Australia Potential Impacts on Renewable Energy in Australia Prepared
New Opportunities in the Alberta Electricity Market. A BLG Overview
 New Opportunities in the Alberta Electricity Market A BLG Overview April 2017 THE NEW ALBERTA ELECTRICITY OPPORTUNITY Renewable power will account for 30% of Alberta s generation by 2030 likely over 7,000