APPENDIX 3-5 Project 5: Central Coast Water Authority, Water Supply Reliability and Infrastructure Improvement Project
|
|
|
- Collin Ball
- 6 years ago
- Views:
Transcription
1 APPENDIX 3-5 Project 5: Central Coast Water Authority, Water Supply Reliability and Infrastructure Improvement Project 2005 CCWA Urban Water Management Plan Biological Survey Report Engineering Review of Pipeline Repair Alternatives Proposed Santa Barbara County IRWM Data Management System, Application for Prop 84 Planning Grant, Round 1, Santa Barbara County, IRWM Plan 2012, Task 4: Establish Data Management System, pp. 51, September 28, 2010

2 2005 URBAN WATER MANAGEMENT PLAN Prepared for: Central Coast Water Authority With Support From: Santa Barbara County Flood Control and Water Conservation District Santa Barbara County Water Agency San Luis Obispo County Flood Control and Water Conservation District Prepared by: William J. Brennan Executive Director Central Coast Water Authority With Assistance From: Lynn Rodriguez Rodriguez Consulting, Inc. December 2005
3 TABLE OF CONTENTS Introduction.. 5 UWMP Checklist.. 7 Agency Coordination... 8 Public Participation.. 10 Service Area Information with Twenty Year Projections...12 History of the State Water Project 12 State Water Project in Santa Barbara County. 15 The Early Years.. 15 The 1980 s and 1990 s 15 Commitment to Environmental Protection.. 18 Population 23 San Luis Obispo County. 23 Santa Barbara County. 25 Climate. 26 Potential Effects of Global Warming.. 29 Water Sources Water Sources Groundwater 32 Reliability of Supply. 34 Updated SWP Reliability Analysis Transfers and Exchange Opportunity 38 Transfers and Exchanges. 38 Groundwater Banking Programs. 39 Water Use by Customer Type Past, Present and Future.. 41 M&I Use.. 41 Per Capita Use. 41 Agricultural Use Predicting Future Use.. 44 Demand Management Measures. 45 Santa Barbara County. 46 Water Agency Demand Management Measures. 46 San Luis Obispo County. 50 District Demand Management Measures. 50 2
4 TABLE OF CONTENTS (continued) Evaluation of Demand Management Measures Not Implemented.. 53 Planned Water Supply Projects and Programs. 54 Development of Desalinated Water. 56 Brackish or Groundwater Desalination Seawater Desalination. 56 Water Shortage Contingency Plan.. 58 Estimate of Minimum Supply for Next Three Years 60 Catastrophic Supply Interruption Plan. 61 Prohibitions, Penalties and Consumption Reduction Methods 62 Analysis of Revenue Impacts of Reduced Sales During Shortages. 63 Draft Ordinances and Use Monitoring Procedure 63 Recycled Water Plan 65 Water Quality Impacts on Reliability. 67 Projected Normal Year and Dry Year Supply Adoption and Implementation of UWMP.. 73 References. 75 LIST OF FIGURES 1. State Water Project Facilities 2. State Water Project Contractors 3. Coastal Branch Phase II Project Map 4. Location Map for Santa Barbara County Project Participants 5. Location Map for San Luis Obispo County Water Purchasers 6. Population and Growth 7. Santa Barbara Precipitation
5 LIST OF TABLES 1. CCWA Board of Directors Voting Percentages 2. CCWA Project Participant Table A Amount 3. San Luis Obispo County Water Purchaser Table A Amount Population Distribution Growth Rates LIST OF TABLES (continued) 5. Santa Barbara County Population Data and Forecasts 6. Monthly Averages for ETo, Temperature & Rainfall (Paso Robles/ Atascadero) 7. Monthly Averages for ETo, Temperature & Rainfall (San Luis Obispo) 8. Monthly Averages for ETo, Temperature & Rainfall (Lake Cachuma/ Santa Ynez) 9. Monthly Averages for ETo, Temperature & Rainfall (Santa Barbara) 10. Historical SWP Deliveries 11. SWP Demand Projections Through Water Available to CCWA and SLOCFC&WCD during Average/Normal Years 13. Dry Year Supply Reliability 14. Santa Barbara County Water Use 15. Irrigation Water Use for Major Crops Grown in Santa Barbara County 16. Proposed Seawater Desalination Facilities Along the California Coast 17. Minimum Water Supply Availability for the Next Three Years 18. Wastewater Treatment Plants in Santa Barbara County 19. Normal Year Supplies 20. Single Driest Year Supplies 21. Multiple Dry Year Supplies APPENDICES Appendix A Resolution of the CCWA Board of Directors Adopting the CCWA 2005 Urban Water Management Plan Appendix B Santa Barbara County 2004 Report to the California Urban Water Conservation Council Appendix C Contact Information Details GLOSSARY 4
6 INTRODUCTION This Urban Water Management Plan (UWMP) has been prepared in response to the Urban Water Management Planning Act (Act), California Water Code Sections through The Act was adopted by the California Legislature as Assembly Bill 797 during the session and signed into law by Governor Deukmejian on January 1, The Act requires that every urban water supplier shall prepare and adopt an Urban Water Management Plan. Urban water supplier is defined as a supplier, either publicly or privately owned, providing water for municipal purposes either directly or indirectly to more than 3,000 customers or supplying more than 3,000 acre-feet of water annually. Under this definition, the Central Coast Water Authority (CCWA) is considered an urban water supplier. Since CCWA is a relative newcomer to the water supplier landscape, this 2005 UWMP represents its initial plan. CCWA is exclusively a water wholesaler providing potable water for municipal uses indirectly through retail urban water suppliers in Santa Barbara and San Luis Obispo Counties. The intent of this plan is to provide DWR, participating retail agencies and the public with information on present and future water sources and demands and to provide an assessment of CCWA s water resource needs. Specifically, the UWMP must provide water supply planning for a 20-year planning period in 5-year increments, identify and quantify adequate water supplies for existing and future demands during normal, dry and drought years, and assure efficient use of urban water supplies. This UWMP addresses all Water Code requirements for such a plan. CCWA has coordinated its UWMP planning efforts with a number of agencies to ensure that data and issues are presented accurately. CCWA s UWMP includes a broad overview of its service area and operational facilities, as well as a general description of the service area s water conservation, water recycling, and water supply and demand management activities. Being a water wholesaler, CCWA supports the water conservation efforts implemented by its retail agencies. This UWMP focuses on CCWA s own activities, and the activities of three County level agencies in Santa Barbara and San Luis Obispo Counties, due to specific contractual relationships that exist between the agency and CCWA, or due to their activities relating to urban water management planning within CCWA s service area. These agencies are the Santa Barbara County Flood Control and Water Conservation District (SBCFC&WCD), Santa Barbara County Water Agency (Water Agency), and the San Luis Obispo County Flood Control and Water Conservation District (SLOCFC&WCD). CCWA has legal relationships with SCBFC&WCD and SLOCFC&WCD that will be discussed further on page 10 of this plan. The Water Agency is a dependent special district, along with the SBCFC&WCD comprises the Water Resources Division of the Santa Barbara County Public Works Department. The Water Agency is responsible for regional water efficiency programs in Santa Barbara County, and its region wide activities will be discussed in this plan. This plan will not include a detailed description of individual retailer conservation programs, since each retailing agency is an urban water supplier and will prepare its own 5
7 urban water management plan. Similarly, details of recycled water treatment and distribution are left to the UWMP s of the urban water suppliers who perform these tasks within CCWA s service area. Because of the unique relationship between CCWA, SBCFC&WCD, the Water Agency and SLOCFC&WCD, some of the topics discussed in this plan will reflect the activities of each organization as it relates to the wholesale importation, treatment and delivery of SWP water to the Central Coast. Urban Water Management Plans are to be adopted by each urban water supplier and submitted to the Department of Water Resources by December 31, The California Environmental Quality Act (CEQA) does not apply to the preparation and adoption of Urban Water Management Plans (Water Code Section 10652). 6
8 UWMP Checklist This UWMP addresses the Water Code requirements for such a plan. The following is a checklist indicated where each Water Code requirement is addressed in the UWMP (in the order of the referenced Water Code Section) Water Code Section(s) Section Page Number 10620(d), 10621(b), Agency Coordination and Public Participation (a) Service Area Information (b) Water Sources (b) 1-4 Water Sources - Groundwater (c) 1-3 Reliability of Supply (d) Transfer and Exchange Opportunities (e) 1-2 Water Use by Customer Type (f) 1-4 Demand Management Measures (DMMs) (g) Planned Water Supply Projects and Programs, 53 including non-implemented DMMs 10631(h) Planned Water Supply Projects and Programs (i) Development of Desalinated Water Water Shortage Contingency Plan (b) Three-Year Minimum Water Supply (c) Catastrophic Water Supply Interruption Plan (d-f) Prohibitions, Penalties and Consumption Reduction Methods (g) Revenue and Expenditure Impacts Analysis Recycled Water Plan Water Quality Impacts on Reliability (a-d) Projected Normal Year And Dry Year Supply, Water Service Reliability Adoption and Implementation of UWMP 73 7
9 AGENCY COORDINATION Water Code Section (a) Every urban water supplier shall prepare and adopt an urban water management plan in the manner set forth in Article 3 (commencing with Section 10640). (b) Every person that becomes an urban water supplier shall adopt an urban water management plan within one year after it has become an urban water supplier. (c) An urban water supplier indirectly providing water shall not include planning elements in its water management plan as provided in Article 2 (commencing with Section 10630) that would be applicable to urban water suppliers or public agencies directly providing water, or to their customers, without the consent of those suppliers or public agencies. (d) (1) An urban water supplier may satisfy the requirements of this part by participation in area wide, regional, watershed, or basin wide urban water management planning where those plans will reduce preparation costs and contribute to the achievement of conservation and efficient water use. (2) Each urban water supplier shall coordinate the preparation of its plan with other appropriate agencies in the area, including other water suppliers that share a common source, water management agencies, and relevant public agencies, to the extent practicable. (e) The urban water supplier may prepare the plan with its own staff, by contract, or in cooperation with other governmental agencies. (f) An urban water supplier shall describe in the plan water management tools and options used by that entity that will maximize resources and minimize the need to import water from other regions (d) (2) Each urban water supplier shall coordinate the preparation of its plan with other appropriate agencies in the area, including other water suppliers that share a common source, water management agencies, and relevant public agencies, to the extent practicable. The Central Coast Water Agency is a wholesaler which serves imported State Water to retail water agencies in the Santa Barbara and San Luis Obispo Counties. As a first step in the preparation of the 2005 UWMP, CCWA met with staff from Santa Barbara County Flood Control and Water Conservation District, Santa Barbara County Water Agency and San Luis Obispo County Flood Control and Water Conservation District. Through a series of meetings and conference calls, CCWA maintained lines of communication to ensure the efficient and timely transfer of relevant data needed to complete the UWMP. The following table lists the types of organizations that were contacted. See Appendix C for additional contact information. 8
10 Entities County of San Luis Obispo Flood Control and Water Conservation District County of Santa Barbara Water Agency Retailers (Contractors in each County) Wastewater Agencies Other Relevant Public Agencies Environmental Organizations COORDINATION AND PUBLIC INVOLVEMENT Coordination and Public Involvement Actions Helped write the plan Was contacte d for assistanc e Receive d copy of the draft Commented on the draft Attende d public meeting s Received a notice of intention to adopt a a a a a a a a a a a a a a a a a a a a 9
11 Figure 3 Coastal Branch Phase II Project Map San Antonio Res. MONTEREY CO. Coastal Branch, Phase I KINGS CO. Nacimiento Res. Salinas Paso Robles 46 Tank No.1 and Polonio Pass Water Treatment Plant Polonio Pass P.P. Devil's Den P.P. Bluestone P.P. C A L I F O R N I A A C Q U E D U C T 5 0 Scale 5 Miles N Atascadero KERN CO. MORRO BAY Chorro Valley Pipeline River Cuesta Tunnel Tank No. 2 Morro Bay Santa Margarita Reservoir Avila Beach San Luis Obispo SAN LUIS OBISPO COUNTY Pismo Beach Lopez Grover City Arroyo Grande Oceano Twitchell Reservoir Cuy a m a Guadalupe Santa Ri v e r Point Sal 1 So. Cal. Water Co. Tank No. 5 1 Santa Maria Sisquoc M ar i a Ri ver SANTA BARBARA COUNTY S A N R A F A E PACIFIC Vandenberg AFB 1 Sa ntonio n A 101 Cr eek LEGEND Coastal Branch, Phase II CCWA Extension Local Connection Existing Pipeline Pumping Plant (P.P.) Tank Local Facilities Turnout Participants in the State Water Project San t a Lompoc Point Arguello Point Conception OCEAN Tank No Yn ez 1 Riv er Buellton Solvang 101 Gaviota 154 SANTA BARBARA CHANNEL Santa Ynez River Water Conservation District, ID #1 Santa Ynez Pumping Facility Morehart Land Co. Goleta Water District 101 L M O U N T A I N S Lake Cachuma Tecolote Tunnel 154 Corona del Mar Treatment Plant Santa Barbara Research Center Cater Treatment Plant Montecito Water District La Cumbre Mutual Water Company Santa Barbara Carpinteria Valley Water District 17
12 A Commitment to Environmental Protection Throughout the planning and construction of the project, CCWA was committed to environmental protection. CCWA formed a project team of CCWA staff, engineers, environmental consultants and attorneys charged with integrating their respective skills and treated environmental protection with the same priority given technical and financial issues. Environmental mitigation measures were incorporated into the project from inception to completion. The project team conducted regular meetings to maintain clear lines of communication and reporting. Each team member took personal responsibility for completing tasks properly and timely, resolving small problems before they became bigger problems, and staying ahead of issues to prevent problems from developing. Before project planning began, the team met with every regulatory agency that might have had jurisdiction over the project. They discussed potential resource issues that needed to be addressed and established a dialogue that encouraged the resource agencies to call if problems were identified as the project progressed. CCWA and its project participants complied with both CEQA and the National Environmental Protection Act (NEPA) and prepared three EIRs with Supplemental EIRs, an Environmental Assessment and a number of Negative Declarations. CCWA and its consultants coordinated closely with the California Department of Fish & Game, U.S. Fish and Wildlife Service, U.S. Army Corps of Engineers, U.S. Bureau of Reclamation and local Native American groups to formulate and implement a mitigation and monitoring program to (1) protect sensitive species and their habitats, (2) avoid impact to cultural resources, (3) restore disturbed areas to their prior condition to the extent feasible and (4) provide offsite mitigation for those areas that could not be restored, (e.g., large trees cannot be grown over the pipeline, and above ground valve vaults and similar facilities occupy surface areas which must remain clear in perpetuity). CCWA s commitment to environmental protection resulted in a project which was virtually undetectable to the public just one year after completion due to successful revegetation efforts. When the CCWA Board of Directors approved construction of the 42-mile CCWA pipeline, it included a number of conditions. One condition was to require each of the CCWA project participants to commit that its SWP water Table A Amount will be used first to offset its proportionate share of groundwater overdraft and then to improve water quality for its consumers. (Any remaining water would be used for future growth consistent with community general plans.) Thus, SWP water is providing the "ultimate" environmental benefit by reducing groundwater overdraft in a number of areas throughout the county. 18
13 Each Santa Barbara County project participant is a water purveyor or user located in Santa Barbara County (see Figure 4). Table 2 CCWA Project Participant Table A Amounts Agency Table A Amount 1 City of Buellton 578 Carpinteria Valley Water District 2,000 Goleta Water District 4,500 City of Guadalupe 550 La Cumbre Mutual Water Company 1,000 Montecito Water District 3,000 Morehart Land Company 200 City of Santa Barbara 3,000 Santa Barbara Research Center 50 City of Santa Maria 16,200 Santa Ynez RWCD, ID#1 2,000 Southern California Water Company 500 Vandenberg Air Force Base 5,500 TOTAL 39, In acre-feet per year. The amounts do not include CCWA s 3,908 acre-feet per year drought buffer Table A Amount and 2,500 acre-feet per year additional Table A Amount held by Goleta Water District. 19
14 Figure 4 Location Map for Santa Barbara County Project Participants 20
15 Figure 5 - Location Map for San Luis Obispo County Water Purchasers 21
16 Each San Luis Obispo County water purchaser is a water purveyor or user located in San Luis Obispo County which has contractual rights from SLO County to receive water from the SWP (see Figure 5). Table 3 San Luis Obispo County Water Purchaser Table A Amounts Agency Table A Amount Avila Beach Community Services District 100 Avila Valley Mutual Water Company, Inc. 20 California Men's Colony (State) 400 County of San Luis Obispo C.S.A. No County of San Luis Obispo (Operations Center and Regional Park 425 City of Morro Bay 1,313 Oceano Community Services District 750 City of Pismo Beach 1,240 San Luis Coastal Unified School District 7 San Miguelito Mutual Water Company 275 San Luis Obispo County Community College District (Cuesta College) 200 TOTAL 4,830 22
17 WATER SOURCES CCWA s sole water supply is imported water from the State Water Project. As such, it is subject to natural and man-made forces, ranging from drought and earthquakes to environmental regulations and water rights determinations. Some of the challenges facing California with respect to importing water include: A major earthquake could damage the California Aqueduct Questionable integrity of the levee system within the Bay-Delta. The demand for water used for environmental purposes is increasing, especially in the San Francisco Bay/Sacramento-San Joaquin Bay Delta (Bay-Delta), reducing the ability to convey water through the Central Valley Project or the State Water Project. Threats to infrastructure security CCWA s Water Supply Agreements with each of its project participants stipulate that imported State water will be a supplemental source of water. Its first use must be to reduce ground water overdraft. Only after that condition has been satisfied, can State water be utilized for planned growth. In February 1963, The Santa Barbara County Flood Control and Water Conservation District (SBCFC&WCD) and the San Luis Obispo County Flood Control and Water Conservation District (SLOFC&WCD) entered into a 75 year agreement with the Department of Water Resources (DWR). SWP water originates within the Feather River watershed, is captured in Lake Oroville, and flows via the Sacramento-San Joaquin Delta, the California Aqueduct and the Coastal Branch Extension into CCWA s treatment and conveyance facilities. Originally, SBCFC&WCD requested 57,700 acre-feet of water annually. In 1980, Santa Barbara County water purveyors requested and agreed to pay for 45,486 acre-feet and SBCFC&WCD, with the concurrence of DWR, suspended the remaining 12,214 acre 30
18 feet. In 1994, Santa Barbara County water purveyors, now part of CCWA, agreed to take 39,078 acre-feet with an additional 3,908 acre-feet of drought buffer. Goleta Water District took an additional 2,500 acre-feet of drought buffer to further firm up its supply. SLOCFC&WCD originally requested 25,000 acre-feet annually. In 1991, it decided, however, to participate in the treatment and conveyance facilities for 4,830 acre-feet only. The remaining 20,170 acre-feet remains as a drought buffer to firm up supplies. Because CCWA is connected to the State water system, it may utilize the system for transfers to and from other water districts, exchanges, banking, off-site storage, etc. This connection to the rest of the State is of immense value to CCWA project participants as it provides opportunities to increase reliability and supplement other supplies. 31
19 WATER SOURCES GROUNDWATER CCWA does not currently use groundwater as a supply source. It does support the efforts of its project participants to reduce overdraft, implement conjunctive use projects and groundwater storage and banking programs. As described in the previous section, CCWA member agencies must first offset groundwater overdraft with SWP water, before using their allocations to serve new customers. 32
20 Information regarding groundwater supplies being used by CCWA project participants can be found in the individual UWMPs prepared by these agencies. Information about all groundwater resources in Santa Barbara County is contained in the 2004 Santa Barbara County Groundwater Report prepared by the County Water Agency, and can be downloaded from their website at Additionally, San Luis Obispo County groundwater information including the Nipomo Mesa Groundwater Resource Capacity Study, Integrated Regional Water Management Plan and the Paso Robles Groundwater Basin Study can be found at 33
21 RELIABILITY OF SUPPLY CCWA is a SWP contractor (through SBCFC&WCD) with an annual contractual Table A Amount of 45,486 acre-feet. SLOCFC&WCD is also a SWP contractor with an annual Table A Amount of 25,000 acre-feet. Table A Amount (formerly referred to as entitlement ) is named for Table A in each SWP Contractor s Water Supply Contract. It contains an annual buildup in Table A Amounts of SWP water, from the first year of the Water Supply Contract through a specific year, based on growth projections made before the Water Supply Contract was executed. For most Contractors, the maximum annual Table A Amount was reached in 1990, although both CCWA and SLOCFC&WCD did not receive SWP water until The total of all SWP Contractors maximum Table A Amounts is currently about 4.17 million acre-feet per year. CCWA treats and delivers this imported water to SLOCFC&WCD and each of its project participants through both State and local facilities. Table 10 Historical Total SWP Deliveries Year Allocation Delivery Amt. CCWA (af) Delivery Amt. SLOCFC&WCD (af) % 7, % 18,618 3, % 20,110 3, % 22,742 2, % 18,946 4, % 27,636 4, % 26,970 4, % 29,705 4,165 34
22 Table 11 SWP Supply Projections through 2030 Year CCWA 45,486 45,486 45,486 45,486 45,486 45,486 Request (af) SLOCFC&WCD Request (af) 25,000 25,000 25,000 25,000 25,000 25,000 Each Contractor annually submits by October 1st of each year a request to DWR for water delivery in the following calendar year, in any amount up to the Contractor s full Table A Amount. The Water Supply Contracts provide that, in a year when DWR is unable to deliver total Contractor requests, deliveries to all Contractors will be reduced, in accordance with specified water allocation rules. The process results in deliveries that equal total available supply for that year. Some Contractors have never requested delivery of their full Table A amounts as a result of factors such as less-than-planned water demand, availability of other water supplies, and water conservation efforts that have held demand below initial demand projections for full contract amounts. Other Contractors order their full Table A Amounts nearly every year. The amount of actual water available to be delivered by DWR varies from year to year based on a combination of hydrologic conditions, water available in SWP storage reservoirs, and environmental regulations in the San Francisco Bay/Sacramento-San Joaquin River Delta. SWP water deliveries are subject to reduction when dry conditions occur in northern California. In May 2003, DWR released its most recent State Water Project Delivery Reliability Report. The report is intended to assist SWP contractors in assessing the adequacy of the SWP component of their overall supplies. The analyses contained in the report conclude that the SWP, using existing facilities operated under current regulatory conditions, and with all contractors asking for their full Table A Amount, could deliver 76 percent of total Table A Amounts on a long-term average basis. Updated SWP Reliability Analysis 2005 On May 25, 2005, DWR informed the SWP Contractors that it was in the process of updating the Reliability Report and provided a recommended set of analyses to be used for preparing 2005 UWMPs. These updated analyses indicate that the SWP, using existing facilities operated under current regulatory conditions, and with all contractors asking for their full Table A Amounts in most years, could deliver 77 percent of the total Table A Amounts on a long-term average basis. These most recent analyses also project that, SWP deliveries during multiple-dry year periods would be about 25 to 40 percent of Table A Amounts, and possibly as low as 5 percent of Table A Amounts during an unusually dry single year. During wetter years, or about 25 percent of the time, 100 percent of full Table A Amounts are projected to be available. 35
23 The following two tables summarize the reliability of SWP water supplies during average/normal, single-dry, and multiple-dry years. Table 12 Water Available to CCWA and SLOCFC&WCD During Average/Normal Years % of Table A Amount 69% 71% 73% 75% 77% 77% CCWA (af) 31,385 32,295 33,205 34,115 35,024 35,024 % available to CCWA 80% 83% 85% 87% 90% 90% SLOCFC&WCD (af) 17,250 25,001 18,250 18,750 19,250 19,250 % available to SLOFC&WCD >100% >100% >100% >100% >100% >100% Notes: (1) The percentages of Table A Amount projected to be available are taken from Table 6-5 of DWR's "Excerpts from Working Draft of 2005 State Water Project Delivery Reliability Report" (May 2005). Supplies are calculated by multiplying CCWA s Table A Amount of 45,486 af and SLOCFC&WCD s 25,000 af by these percentages. Note, however, that CCWA has only 39,078 af of Treatment plant and pipeline capacity and SLOC has only 4,830 af Table 13 Dry Year Supply Reliability (1) Contractor Single Dry Yr. (2) Multiple Dry Yrs. (3) 2005 CCWA (af) 1,819 14,556 % of Table A 4% 32% SLOCFC&WCD (af) 1,000 8,000 % of Table A 4% 32% CCWA (af) 2,274 15,010 % of Table A 5% 33% SLOCFC&WCD (af) 1,250 8,250 % of Table A 5% 33% Notes: (1) The percentages of Table A Amount projected to be available are taken from Table 6-5 of DWR's "Excerpts from Working Draft of 2005 State Water Project Delivery Reliability Report" (May 2005). Supplies are calculated by multiplying CCWA's Table A Amount of 45,486 af and SLOCFC&WCD s af by these percentages. (2) Based on the worst case historic single dry year of (3) Supplies shown are annual averages over four consecutive dry years, based on the worst case historic four-year dry period of as stated in the most recent DWR SWP Delivery Reliability Report. The above tables do not reflect the additional water available through exchanges with other water contractors, purchases of water through DWR dry year water purchase programs, short term water transfers through DWR s Turnback Pool programs and groundwater recharge programs operated by some CCWA project participants. In any given year, additional water can be made available through the SWP system for the incremental cost of purchasing or exchanging the water from others in the State. 36
24 Additionally, retail agencies use SWP water delivered through CCWA as a supplemental water supply to augment other surface and groundwater supplies. There does not appear to be any statistical correlation between droughts that would affect the SWP watersheds and those that would affect the watersheds of Santa Barbara and San Luis Obispo Counties. Several CCWA project participants have also invested in water reclamation (recycling) projects, desalination, water transfers, exchanges, conservation measures and conjunctive use projects to increase the reliability of their overall water portfolios. 37

25 DEMAND MANAGEMENT MEASURES CCWA is a Joint Powers Authority with the sole mission to supply Santa Barbara and San Luis Obispo Counties with reliable, high quality supplemental water. Our mission is to maximize imported deliveries of SWP water for the benefit of our project 45
26 participants. CCWA recognizes the importance and role of water conservation, and demand management, as a priority in any water resource strategy and supports the efforts of its retail agencies to implement programs for their customers. CCWA is a member of the California Urban Water Conservation Council (CUWCC). Santa Barbara County In Santa Barbara County the Santa Barbara County Water Agency (Water Agency) implements regional water demand management measures (i.e. public outreach, education, data collection, joint purchase and multi-agency grant projects, etc.) and provides technical support to local water purveyors implementing their own programs (i.e. residential water evaluations, water rate programs, system water audits, etc.) The Water Agency is one of the founding members of the California Urban Water Conservation Council (CUWCC) and is the umbrella organization for water conservation activities in Santa Barbara County. The Water Agency provides oversight for the demand management measures for all CCWA project participants in Santa Barbara County. The Water Agency manages the Regional Water Efficiency Program, which was established in December 1990 to promote the efficient use of urban and agricultural water supplies in Santa Barbara County, and to provide information and assistance to the eighteen local water purveyors within the county. The Program provides coordination for cooperative efforts among purveyors, acts as a clearinghouse for information on water efficiency technology, and monitors local, state and national legislation concerning efficient water use. The Program serves around 400,000 county residents. The following information was taken from the Water Agency s 2004 report to the CUWCC which identifies the wholesale agency measures being implemented as well as other sources of information regarding demand management measures (The full 2004 report to CUWCC can be found the in Appendices of this plan). Beginning in 2006, CCWA intends to become an active participant with the Water Agency to assist retailers receiving State water in implementing Demand Management Measures. It will also provide leadership and assistance to retailers receiving State water in San Luis Obispo County. Water Agency Demand Management Measures DMM 1 Water Survey Programs for Single-Family Residential and Multi-Family Residential Customers The Water Agency is neither a water wholesaler nor retailer, and therefore does not have direct access to residential water customer accounts in the County. The Water Agency collects production surveys for each of the water districts within the County to provide summary information on residential water use. Beginning in 2006, CCWA will provide leadership and assistance to retailers receiving State water. 46
27 DMM 2 Residential Plumbing Retrofit The Water Agency is neither a water wholesaler nor retailer, and does not facilitate retrofits for water customers. The Agency does provide staffing support, funding and materials to local water purveyors and assists them in the implementation of their own conservation programs through the Regional Water Efficiency Program. Beginning in 2006, CCWA will provide leadership and assistance to retailers receiving State water. DMM 3 System Water Audits, Leak Detection and Repair The Water Agency is neither a water wholesaler nor retailer. Therefore, the Agency does not have a distribution system. The Agency does provide staffing support, funding and materials to local water purveyors and assists them in the implementation of their own conservation programs through the Regional Water Efficiency Program. The Agency encourages the water purveyors to conduct system audits and provides technical materials, legislative updates and workshops regarding leak detection and repair. CCWA monitors its system water losses through its meters. All water entering or exiting the system is metered and all meters are calibrated biannually. The entire pipeline route is also physically inspected on an annual basis. Beginning in 2006, CCWA will provide leadership and assistance to retailers receiving State water. DMM 4 Metering With Commodity Rates for All New Connections and Retrofit of Existing Connections The Water Agency is neither a water wholesaler nor retailer, and therefore does not have authority to modify water rates. The Water Agency provides technical support to water purveyors establishing retrofit programs in their service areas. Beginning in 2006, CCWA will provide leadership and assistance to retailers receiving State water. DMM 5 Large Landscape Conservation Programs and Incentives Though the Water Agency does not have any direct customers, the Water Agency helps to fund large landscape irrigation evaluations conducted by the Cachuma Resource Conservation District. The County also supports a regional ET controller installation program with partnering water districts. DMM 6 High Efficiency Washing Machine Rebate Programs The Water Agency is neither a water wholesaler nor retailer. The Water Agency provides technical support to water purveyors establishing rebate programs in their service areas. Beginning in 2006, CCWA will provide leadership and assistance to retailers receiving State water. DMM 7 Public Information Programs On behalf of, and in cooperation with, water retailers in Santa Barbara County, the Water Agency conducts many public information programs. These include the Be Water Wise Campaign, a radio and newspaper ad campaign, Water Awareness Month and the Earth Day Fair in May, Santa Maria River Levee Bike Path Interpretive Signs, a quarterly 47
28 newsletter on water conservation activities, and the promotion and distribution of multiple publications to the public at events and workshops. DMM 8 School Education Programs On behalf of, and in cooperation with, water retailers in Santa Barbara County, the Water Agency offers presentations to elementary and junior high classrooms throughout the County on water supply and water conservation. Over 3,000 students received presentation in The Water Agency also facilitates a High School Video Contest on Water Awareness. DMM 9 Conservation Programs for Commercial, Industrial and Institutional Accounts Though the Water Agency does not have any direct customers, the Water Agency and partnering water districts implement a rebate program for CII customers that replace high water use toilets, urinals, and clothes washers. The Water Agency does not perform retrofits, but provides staff and financial support to partnering districts for this program. The Water Agency also manages a program for Lodging Industry entities in Santa Barbara County, providing educational and training materials for employees and guests. DMM 10 Wholesale Agency Assistance Programs The Water Agency provides staffing support, funding and materials to local water purveyors and assists them in the implementation of conservation programs through the Regional Water Efficiency Program. The Program provides coordination for cooperative efforts among purveyors, acts as a clearinghouse for information on water efficiency technology, and monitors local, state and national legislation concerning efficient water use. The Water Agency partners on multiple conservation programs with several water districts, as explained in other demand management measures detailed in this section. Beginning in 2006, CCWA will provide leadership and assistance to retailers receiving State water. DMM 11 Conservation Pricing Although the Water Agency is neither a water wholesaler nor retailer, the Agency encourages the water purveyors in the County to adopt rate structures that support conservation and provides technical materials, legislative updates and workshops regarding rate structures. An annual survey of water rates in Santa Barbara County is distributed to local water purveyors. The information is compiled by staff and sent to all participants. Information about water rates in other areas has also been collected and made available to local water purveyors. Beginning in 2006, CCWA will provide leadership and assistance to retailers receiving State water. DMM 12 Conservation Coordinator Although the Santa Barbara County Water Agency is neither a water wholesaler nor retailer, the Agency does provide staffing support to local water purveyors. A Coordinator and two Program Specialists provide a total of approximately 65 hours per 48
29 week of staff support. Beginning in 2006, CCWA will provide leadership and assistance to retailers receiving State water. DMM 13 Water Waste Prohibition The Water Agency is not a retailer or wholesalers of water and does not have the authority to enact water waste prohibitions. The Water Agency works with water purveyors to encourage wise water use and the reduction of wasted water. Beginning in 2006, CCWA will provide leadership and assistance to retailers receiving State water. DMM 14 Residential Ultra-low Flush Toilet Replacement Program Ultra-low flush toilet replacement programs have been implemented by the individual retail water agencies in the Santa Barbara County area. The Water Agency is not a retailer or wholesaler of water, and does not have any current programs on residential toilet replacement programs. Additional information on demand management measures can be found in retailer UWMPs and in the Appendix of this plan. 49
30 San Luis Obispo County SLOCFC&WCD (District) primarily relies on its individual water retailers to take appropriate demand management measures. Although most communities are small and fall below the threshold requirement for the preparation of an UWMP, they are quite active in water conservation. Each of these communities has taken different approaches that are most appropriate to their situation. The details of these measures are described within documents prepared by those agencies. For the larger communities these measures are also described within their individual UWMP. The District, however, does encourage conservation and where feasible does cooperate with these individual retailers. The District is also currently investigating new ways to promote conservation. These efforts are more fully described in the District s Integrated Regional Water Master Plan. As a wholesale agency with no direct customers, the District has limited authority to implement the demand management measures described within the water code. Beginning in 2006, CCWA intends to become an active participant with the District to assist retailers receiving State water in implementing Demand Management Measures. It will also provide leadership and assistance to retailers receiving State water in Santa Barbara County. District Demand Measurement Measures DMM 1 Water Survey Programs for Single-Family Residential and Multi-Family Residential Customers The District does not have any direct customers, and does not have the authority to conduct water audits/surveys for customers within the contracting agencies service areas. Beginning in 2006, CCWA will provide leadership and assistance to retailers receiving State water. DMM 2 Residential Plumbing Retrofit The District does not have any direct customers or the authority to conduct plumbing retrofits for customers within the contracting agencies service areas. Beginning in 2006, CCWA will provide leadership and assistance to retailers receiving State water. DMM 3 System Water Audits, Leak Detection and Repair The distribution system is monitored monthly as part of the operations reporting process. As part of this process, losses due to leaks and other causes are measured. The average loss factor in the system is approximately 3.6%. CCWA monitors its system water losses through its meters. All water entering or exiting the system is metered and all meters are calibrated biannually. The entire pipeline route is also physically inspected on an annual 50
31 basis. Beginning in 2006, CCWA will provide leadership and assistance to retailers receiving State water. DMM 4 Metering With Commodity Rates for All New Connections and Retrofit of Existing Connections All connections between the County and its contracting agencies are metered. The District does not have the authority to meter with commodity rates within the service areas of its contracting agencies. Beginning in 2006, CCWA will provide leadership and assistance to retailers receiving State water. DMM 5 Large Landscape Conservation Programs and Incentives The District has funded and promoted the use of this service to large landscapes (schools, parks, golf courses, etc.) throughout the County. This program is performed in cooperation with the three Resource Conservation Districts in the region. Beginning in 2006, CCWA will provide leadership and assistance to retailers receiving State water. DMM 6 High Efficiency Washing Machine Rebate Programs This measure is the responsibility of the individual water agencies. Beginning in 2006, CCWA will provide leadership and assistance to retailers receiving State water. DMM 7 Public Information Programs In cooperation with water retailers in San Luis Obispo County, the District funds and supports many public information programs. These include the spring newsletter prepared by the Partners in Water Conservation and the distribution of pamphlets in various public events. Programs also include participation in low water landscape exhibits at the annual Home Show and Mid-State Fair. The District also participates in a public information program to distribute soil moisture meters to home owners. Additional public information on conservation is given as part of the Sammy the Steelhead water quality programs. Radio and newspaper ad campaigns are often considered but have been minimally effective and have been recently dropped for the time being. Beginning in 2006, CCWA will provide leadership and assistance to retailers receiving State water. DMM 8 School Education Programs The District does not conduct school education programs regarding water resources or conservation. These programs are conducted at the local level by contracting water agencies. DMM 9 Conservation Programs for Commercial, Industrial and Institutional Accounts As a wholesaler, the District does not have the authority to conduct commercial and industrial water conservation programs within the service areas of its contracting 51
32 agencies. These audits must be provided at the local level by the individual retail agencies. Beginning in 2006, CCWA will provide leadership and assistance to retailers receiving State water. DMM 10 Wholesale Agency Assistance Programs The District has not signed the statewide MOU for urban water conservation. The District works with its contracting water agencies to determine the appropriate role for the District to play in helping local agencies implement the best management practices. Beginning in 2006, CCWA will provide leadership and assistance to retailers receiving State water. DMM 11 Conservation Pricing As a wholesaler, the District does not have the authority to set rates for retail water/sewer customers. This authority lies with the individual retail water agencies and cities. Beginning in 2006, CCWA will provide leadership and assistance to retailers receiving State water. DMM 12 Conservation Coordinator The District does not currently staff a full-time water conservation coordinator position because many conservation measures and practices are out of the District s jurisdiction or are the responsibility of individual retail agencies. Some of the local retail agencies have a water conservation coordinator on staff, such as Paso Robles, Tempton, Atascadero, San Luis Obispo, Pismo Beach and Grover Beach. Beginning in 2006, CCWA will provide leadership and assistance to retailers receiving State water. DMM 13 Water Waste Prohibition As a wholesaler, the District does not have the authority to implement water waste prohibitions for retail water customers. This is the responsibility of the individual retail water agencies. Beginning in 2006, CCWA will provide leadership and assistance to retailers receiving State water. DMM 14 Residential Ultra-low Flush Toilet Replacement Program Ultra-low flush toilet replacement programs are being implemented by the individual retail water agencies. Additional information on demand management measures can be found in retailer UWMPs and in the District s IRWM. 52

33 EVALUATION OF DEMAND MANAGEMENT MEASURES NOT IMPLEMENTED As described in the previous section CCWA is a Joint Powers Authority with the sole mission to supply Santa Barbara and San Luis Obispo Counties with reliable, high quality supplemental water. CCWA will continue to work with Santa Barbara and San Luis Obispo Counties to assure that its member agencies have the support and resources they need to conduct effective programs, to evaluate the measures they are implementing and conduct ongoing assessments of the measures they are not implementing. 53

34 PLANNED WATER SUPPLY PROJECTS AND PROGRAMS During the last year, CCWA s Board of Directors asked CCWA staff to investigate methods of increasing SWP water during dry periods. CCWA staff have, or are in the process of: Studying the feasibility of acquiring additional SWP Table A Amount water to be utilized as a drought buffer amount Investigating out-of-district storage (either surface or ground water banking) Investigating banking opportunities within CCWA s and/or San Luis Obispo County s service area Increasing treatment plant capacity by getting State Department of Health Services permission to re-rate the plant filters to accept higher flows Studying CCWA pipeline capacity and what can be done to move more water when opportunities exist In 2006, CCWA will initiate a study to determine the reliability needs of each of its project participants and the pros and cons of groundwater banking and conjunctive use opportunities throughout the State. This information will assist project participants in determining the cost and risks involved in increasing the overall reliability of SWP water as a supplemental source. Currently, CCWA project participants have a 10% drought 54
35 buffer to increase reliability during dry periods. CCWA will investigate the feasibility and cost of increasing the drought buffer amount to approximately 33%. Each project participant has a different need for SWP water as a supplemental supply and, as a result of the above outlined studies, will decide whether and to what level to participate in reliability enhancements. Thus, it is impossible, at this time, to estimate the single or multiple dry year benefits. 55
36 ESTIMATE OF MINIMUM SUPPLY FOR NEXT THREE YEARS The minimum water supply available during the next three years would occur with a 3- year multiple dry-year event occurring between the years 2006 and According to DWR s Excerpts from Working Draft of 2005 State Water Project Delivery Reliability Report, May 2005, in the worst case four year dry period, the SWP will still deliver 32% of its Table A Amount. Both Santa Barbara and San Luis Obispo Counties hold some of their Table A Amounts as drought buffer (Table A Amount water that does not have treatment plant or pipeline delivery capacity), so delivery amounts will be higher than the DWR allocation. Additionally, two Santa Barbara County project participants have an exchange agreement with the Dudley Ridge Water District that would allow them to bring in some additional water. The following table illustrates the estimate of minimum supply for the next three years. Table 17 Minimum Water Supply Availability for the Next Three Years County Source Table A Delivery Year 1 Year 2 Year 3 Amount Capability Santa Barbara SWP 45,486 39,078 14,556 14,556 14,556 Santa Barbara Dudley Ridge 725 Exchange Santa Barbara SWP Carryover 5,000 TOTAL 19,556 14,556 15,821 % of Delivery 50% 37% 40% Capability San Luis Obispo SWP 25,000 4,830 4,830 4,830 4,830 TOTAL 4,830 4,830 4,830 % of Delivery Capability 100% 100% 100% 60

37 ADOPTION AND IMPLEMENTATION OF UWMP 73
38 1. A copy of the adoption resolution is attached to this UWMP as Appendix A. 2. CCWA has reviewed and endorses the DMM implementation plan. 3. CCWA will provide its 2005 UWMP to DWR, the Santa Barbara County Water Agency, the SLOCFC&WCD and each project participant within 30 days of adoption. 4. CCWA recognizes that it must file copies of amendments or changes to the 2005 UWMP with the Santa Barbara County Water Agency, the SLOCFC&WCD and each project participant within 30 days of adoption. 5. CCWA will make the 2005 UWMP available for public review within 30 days of filing it with DWR. 6. CCWA continually encourages the involvement of all stakeholders in the affairs of water management. CCWA meets regularly with its project participants through the Operating Committee, in which the public is invited to participate, and solicits input on a variety of tasks and issues. Each month, CCWA holds a Board meeting, in which the public is invited to participate, and comment on issues related to the conduct of CCWA s business. In addition, CCWA maintains a website containing key reports for public use and to make available contacts within the agency should there be any issues. CCWA will hold a public hearing on its 2005 UWMP and will notify all stakeholders involved using standard modes of notification. 74
39 APPENDIX A Resolution of the CCWA Board of Directors Adopting the 2005 CCWA Urban Water Management Plan 77

40 79
41 80
42 APPENDIX B Santa Barbara County Water Agency 2004 Report to the California Urban Water Conservation Council 81
43 BMP 03: System Water Audits, Leak Detection and Repair Reporting Unit: Santa Barbara County Water Agency BMP Form Status: 100% Complete Year: 2004 A. Implementation 1. Has your agency completed no a pre-screening system audit for this reporting year? 2. If YES, enter the values (AF/Year) used to calculate verifiable use as a percent of total production: a. Determine metered 0 sales (AF) b. Determine other 0 system verifiable uses (AF) c. Determine total 0 supply into the system (AF) d. Using the numbers 0.00 above, if (Metered Sales + Other Verifiable Uses) / Total Supply is < 0.9 then a full-scale system audit is required. 3. Does your agency keep no necessary data on file to verify the values used to calculate verifiable uses as a percent of total production? 4. Did your agency complete a no full-scale audit during this report year? 5. Does your agency maintain no in-house records of audit results or the completed AWWA audit worksheets for the completed audit? 6. Does your agency operate a no system leak detection program? a. If yes, describe the leak detection program: B. Survey Data 1. Total number of miles of distribution system line. 0 83
44 2. Number of miles of distribution system line surveyed. C. System Audit / Leak Detection Program Expenditures D. "At Least As Effective As" 1. Budgeted Expenditures 2. Actual Expenditures 0 Next This Year Year Is your AGENCY yes implementing an "at least as effective as" variant of this BMP? a. If YES, please explain in detail how your implementation of this BMP differs from Exhibit 1 and why you consider it to be "at least as effective as." Santa Barbara County Water Agency is neither a water wholesaler nor retailer. Therefore, the Agency does not have a distribution system. The Agency does provide staffing support; funding and materials to local water purveyors and assists them in the implementation of their own conservation programs through the Regional Water Efficiency Program. The Regional Water Efficiency Program was established in December 1990 to promote the efficient use of urban and agricultural water supplies in Santa Barbara County, and to provide information and assistance to the eighteen local water purveyors within the county. The Program provides coordination for cooperative efforts among purveyors, acts as a clearinghouse for information on water efficiency technology, and monitors local, state and national legislation concerning efficient water use. The Program serves around 0 84
45 E. Comments 400,000 county residents. Three Program Specialists dedicate approximately 65 hours of staff time per week in support of this program. In reference to BMP 03, the Agency encourages the water purveyors to conduct system audits and provides technical materials, legislative updates and workshops regarding leak detection and repair. 85
46 BMP 07: Public Information Programs Reporting Unit: BMP Form Status: Santa Barbara County Water 100% Complete Agency A. Implementation 1. Does your agency maintain an active public information program to promote and educate customers about water conservation? Year: 2004 a. If YES, describe the program and how it is organized. The Santa Barbara County Water Agency oversees the Regional Water Efficiency Program for the county. A number of the Program's activities fulfill - on a regional level - the obligations for best management practices (BMPs) in the statewide California Urban Water Conservation Council Memorandum of Understanding (MOU) and/or the Bureau of Reclamation's water conservation criteria. The County Water Agency is a signatory to the MOU and has prepared a plan to meet the Bureau's water conservation criteria. Many of the regional activities also assist individual water purveyors to satisfy their own conservation goals under the MOU and Bureau Criteria. Be Water Wise Advertising Campaign The Be Water Wise advertising campaign, which is sponsored by a number of local water purveyors, began on August 4, The whimsical ads that promote water use efficiency feature plants complaining about their bloated roots caused by their owners over watering and the lackadaisical Dave who waters a number of inanimate objects including his driveway and mailbox throughout his neighborhood due to a mismanaged irrigation system. The campaign was designed to raise awareness of how many of us overeater our landscapes and to highlight tools that are available to irrigate more efficiently. The Be Water Wise Campaign includes radio spots, newspaper advertisements and television commercials highlighting the importance of watering wisely. The ads direct local residents to visit for tools on efficient irrigation. A feature of the website is a landscape watering calculator that allows residents to enter specific information on their landscaping and will generate a recommended irrigation schedule based on historical local weather data. Local sponsors of this campaign include the Santa Barbara County Water Agency, City of Santa Barbara, Goleta Water District, California Cities Water Company, Carpinteria Valley Water District, Montecito Water District, La Cumbre Mutual Water Company, Vandenberg Village Community Services District, Los Alamos Community Services District, and Cuyama Community Services District. During the advertising campaign, the number of visitors to our website increased by an average of 80% per month. During August, visits increased by only 8%, but in September and October visits were up by 111% and 121% respectively. In addition, 590 visits to our watering calculator took place during the campaign. Visits to the sbwater.org and the watering calculator remained well above average through December of The program partners and KRUZ also co-sponsored a Waterwise Home and Garden Makeover during the campaign. The makeover included plant and irrigation yes 86
47 installation and maintenance from EnviroScaping, irrigation equipment from All Around Irrigation, design and construction assistance from Common Ground Landscape Architecture & Planning, a Weather TRAK ET Controller from Hydropoint Data Systems, landscape materials from AgriTurf Supplies Inc., waterwise native plants from Seaside Gardens and books on greywater and principles of ecological design from Oasis designs. Ms. Rosa Torres was selected as the lucky winner from Santa Barbara. Ô Santa Maria River Levee Bike Path Interpretive Signs Water Resources staff completed the production and installation of new interpretive signs for the Santa Maria Levee Bike Path. The signs, which were installed in June 2003, cover a number of topics including water supply, flood control and water quality and have been placed at intervals along the bike path, so that riders can learn about local water issues as they cruise the levee. Water Awareness Month: Staff participated with local water purveyors in this annual event, which is sponsored by the California Water Awareness Committee. The County Board of Supervisors adopted a resolution declaring May as Water Awareness Month in Santa Barbara County. Advertisements reminding local residents to conserve water and encouraging them to participate in local events were placed in number of local newspapers. Events included tours of the City's desalination facility and the Alice Keck Park Memorial Garden, and Goleta Water Awareness Day. In addition, Water Awareness Month displays were showcased in both north and south county facilities with information on local water supplies, water conservation and a mural produced by the Girl Scouts of Tres Condados who earned their Water Drop Patches in Goleta Water District also held their annual Water Awareness Day and Montecito Water District held an Open House. Advertising for each of these events was placed in the Santa Barbara Independent, the Montecito Journal, the Santa Barbara News Press, the South Coast Beacon and the Carpinteria Coastal View. This year's sponsors included the City of Santa Barbara, Carpinteria Valley Water District, the Santa Barbara County Water Agency, Montecito Water District, Goleta Water District and La Cumbre Mutual Water Company. Earth Day Fair: Staff coordinated local purveyor participation in this annual event in Santa Barbara, which took place on April 18, Staff displayed information on the Green Gardener Program and a Water Trivia game, and also put together a children's activity booth, which included fishing for water facts, a tooth brushing demonstration to show how kids could save water while brushing their teeth with recycled toothbrushes for prizes and a mural decorating table. Staff also participated in the Flex Your Power promotion of High Efficiency Clothes Washers and coordinated a prize giveaway in which Santa Barbara Family Care Center won a Maytag Neptune washer and dryer set. Approximately 5,000 people attended the event. Sponsors for this event included the City of Santa Barbara, Goleta Water District, Montecito Water District, La Cumbre Mutual Water Company, and the Carpinteria Valley Water District. In addition, staff attended the Santa Maria Earth Day fair on April 24 with the toothbrush demonstration and the Green Gardener program display. Girl Scouts Water Drop Patch Event Over 30 Girl Scouts from troops located in Santa Barbara, Ventura, Oxnard, Lompoc and Camarillo traveled to Santa Barbara on May 22nd for the 5th annual Water Drop Patch day extravaganza. This event is open to Brownies and Juniors in the Tres Condados Girl Scout region and explores the wonderful world of 87
48 water. Topics covered included: the water cycle, local water supply, creek & ocean water pollution, watershed wildlife, water use & conservation and more. Door prizes were awarded to the first 25 girls to arrive at the event, and pizza gift certificates were given to the troops with the most girl attendees. The Water Drop Patch program was jointly developed by the United States EPA and the Girl Scout Council of the Nation's Capital. The purpose of the project is to encourage girls to: - Make a difference in their communities by becoming watershed and wetlands stewards. - Use their skills and their knowledge to educate others in their communities about the need to protect the nation s valuable water resources. - Explore the natural world to gain an interest in science and math. This event is sponsored by the Carpinteria Valley Water District, Goleta Water District, City of Lompoc, Montecito Water District, City of Santa Barbara, and Santa Barbara County Water Agency. A similar water badge activity will be held for Santa Barbara County Girl Scouts in the fall. The next Water Drop Patch day will be held on Saturday, June 25, Water of Santa Barbara County: Staff distributed these brochures to local water purveyors, teachers, students and other interested individuals and organizations and at all public events attended by Water Agency staff. Water Resources Brochure: This 3-color poster summarizes the water supplies and uses throughout the County. The brochure is available to the public at water district offices, public events such as Earth Day and at public presentations. County Water Connection Newsletter: Three newsletters were published in 2003/2004. The newsletter covers water efficiency, water supply, and pollution prevention in Santa Barbara County. The newsletter is distributed at not cost to over 200 water purveyors, public interest groups and other interested parties. Individuals or groups are added to the mailing list by request. Conservation Requests: The County assisted local purveyors and the public by providing information about efficient water use on request, and also provided technical assistance with water conservation program elements and implementation. 2. Indicate which and how many of the following activities are included in your public information program. Number of Public Information Program Activity Yes/No Events a. Paid Advertising yes 6 b. Public Service Announcement yes 9 c. Bill Inserts / Newsletters / Brochures yes 21 d. Bill showing water usage in comparison no to previous year's usage e. Demonstration Gardens yes 0 f. Special Events, Media Events yes 6 g. Speaker's Bureau yes 3 h. Program to coordinate with other government agencies, industry and public interest groups and media yes 88
49 B. Conservation Information Program Expenditures This Year Next Year 1. Budgeted Expenditures Actual Expenditures C. "At Least As Effective As" 1. Is your AGENCY implementing an "at least as effective as" variant No of this BMP? a. If YES, please explain in detail how your implementation of this BMP differs from Exhibit 1 and why you consider it to be "at least as effective as." D. Comments 89
50 BMP 08: School Education Programs Reporting Unit: BMP Form Status: Santa Barbara County 100% Complete Water Agency A. Implementation 1. Has your agency implemented a school information program to promote water conservation? Year: Please provide information on your school programs (by grade level): Grade Are grade- No. of class No. of No. of appropriate presentations students teachers' materials reached workshops distributed? yes Grades yes K-3rd Grades yes th-6th Grades yes th-8th High yes School 3. Did your Agency's materials meet state education framework yes requirements? 4. When did your Agency begin implementing this program? 12/10/1990 B. School Education Program Expenditures This Year Next Year 1. Budgeted Expenditures Actual Expenditures 7974 C. "At Least As Effective As" 1. Is your AGENCY implementing an "at least as effective as" No variant of this BMP? a. If YES, please explain in detail how your implementation of this BMP differs from Exhibit 1 and why you consider it to be "at least as effective as." D. Comments 90
51 BMP 10: Wholesale Agency Assistance Programs Reporting Unit: BMP Form Status: Santa Barbara County Water 100% Complete Agency A. Implementation 1. Financial Support by BMP Year: 2004 Financial Financial Incentives Budgeted Amount Incentives Budgeted Amount BMP Offered? Amount Awarded BMP Offered? Amount Awarded 1 No 8 yes No 9 yes No 10 No 4 No 11 No 5 yes No 6 No 13 No 7 yes No 2. Technical Support a. Has your agency conducted or funded workshops addressing CUWCC procedures for calculating program savings, costs and cost-effectiveness? b. Has your agency conducted or funded workshops addressing retail agencies' BMP implementation reporting requirements? c. Has your agency conducted or funded workshops addressing: No No 91
52 1) ULFT replacement No 2) Residential retrofits No 3) Commercial, industrial, and institutional surveys No 4) Residential and large turf irrigation yes 5) Conservation-related rates and pricing No 3. Staff Resources by BMP BMP Qualified Staff Available for BMP? No. FTE Staff Assigned to BMP BMP Qualified Staff Available for BMP? No. FTE Staff Assigned to BMP 1 yes 1 8 yes yes 1 9 yes yes 1 10 yes 1 4 yes 1 11 yes 1 5 yes yes yes 1 13 yes 1 7 yes yes 1 4. Regional Programs by BMP BMP Implementation/ Management Program? BMP Implementation/ Management Program? 1 No 8 yes 92
53 2 No 9 yes 3 No 10 No 4 No 11 No 5 yes 12 yes 6 No 13 No 7 yes 14 No B. Wholesale Agency Assistance Program Expenditures This Year Next Year 1. Budgeted Expenditures Actual Expenditures C. "At Least As Effective As" 1. Is your AGENCY implementing an "at least as effective as" variant of this BMP? a. If YES, please explain in detail how your implementation of this BMP differs from Exhibit 1 and why you consider it to be "at least as effective as." Santa Barbara County Water Agency is not a wholesale agency so the dollar amounts listed in the "Financial Support" section do not necessarily reflect monies given to other agencies, but the amounts budgeted for the Regional Water Efficiency Program. The Water Agency provides staffing support, funding and materials to local water purveyors and assists them in the implementation of their own conservation programs through the Regional Water Efficiency Program. The Program was established in December 1990 to promote the efficient use of urban and agricultural water supplies in Santa Barbara County, and to provide information and assistance to local water purveyors. The Program provides coordination for cooperative efforts among purveyors, acts as a clearinghouse for information on water efficiency technology, and monitors local, state and national legislation concerning efficient water use. D. Comments yes 93
54 BMP 11: Conservation Pricing Reporting Unit: Santa Barbara County Water Agency A. Implementation BMP Form Status: 100% Complete Year: 2004 Rate Structure Data Volumetric Rates for Water Service by Customer Class 1. Residential a. Water Rate Structure Service Not Provided b. Sewer Rate Structure Service Not Provided c. Total Revenue from Volumetric Rates $0 d. Total Revenue from Non-Volumetric $0 Charges, Fees and other Revenue Sources 2. Commercial a. Water Rate Structure b. Sewer Rate Structure c. Total Revenue from Volumetric Rates $ d. Total Revenue from Non-Volumetric $ Charges, Fees and other Revenue Sources 3. Industrial a. Water Rate Structure b. Sewer Rate Structure c. Total Revenue from Volumetric Rates $ d. Total Revenue from Non-Volumetric $ Charges, Fees and other Revenue Sources 4. Institutional / Government a. Water Rate Structure b. Sewer Rate Structure c. Total Revenue from Volumetric Rates $ d. Total Revenue from Non-Volumetric Charges, Fees and other Revenue Sources 5. Irrigation a. Water Rate Structure $ 94
55 b. Sewer Rate Structure c. Total Revenue from Volumetric Rates $ d. Total Revenue from Non-Volumetric Charges, Fees and other Revenue Sources 6. Other $ a. Water Rate Structure b. Sewer Rate Structure c. Total Revenue from Volumetric Rates $ d. Total Revenue from Non-Volumetric $ Charges, Fees and other Revenue Sources B. Conservation Pricing Program Expenditures This Year Next Year 1. Budgeted Expenditures Actual Expenditures 0 C. "At Least As Effective As" 1. Is your AGENCY implementing an "at least as effective as" variant of this BMP? yes a. If YES, please explain in detail how your implementation of this BMP differs from Exhibit 1 and why you consider it to be "at least as effective as." Although the Santa Barbara County Water Agency is not a water wholesaler nor retailer, the Agency does provide staffing support, funding and materials to local water purveyors and assists them in the implementation of their own conservation programs through the Regional Water Efficiency Program. The Regional Water Efficiency Program was established in December 1990 to promote the efficient use of urban and agricultural water supplies in Santa Barbara County, and to provide information and assistance to local water purveyors. The Program provides coordination for cooperative efforts among purveyors, acts as a clearinghouse for information on water efficiency technology, and monitors local, state and national legislation concerning efficient water use. A Coordinator, and two Program Specialists provide a total of approximately 65 hours per week of staff support. In reference to BMP 11, the Agency encourages the water purveyors in the County to adopt rate structures that support conservation and provides technical materials, legislative updates and workshops regarding rate structures. An annual survey of water rates in Santa Barbara County is distributed to local water purveyors. The information is compiled by staff and sent to all participants. Information about water rates in other areas has also been collected and made available to local water purveyors. D. Comments 95
56 BMP 12: Conservation Coordinator Reporting Unit: BMP Form Status: Santa Barbara County Water 100% Complete Agency Year: 2004 A. Implementation 1. Does your Agency have a conservation coordinator? yes 2. Is this a full-time position? yes 3. If no, is the coordinator supplied by another agency with which you cooperate in a regional conservation program? 4. Partner agency's name: 5. If your agency supplies the conservation coordinator: a. What percent is this conservation coordinator's position? 80% b. Coordinator's Name Rory Lang c. Coordinator's Title Regional Water Efficiency Program Coordinator d. Coordinator's Experience and Number of Years e. Date Coordinator's position was created (mm/dd/yyyy) 6. Number of conservation staff, including Conservation Coordinator. B. Conservation Staff Program Expenditures 7 years running environmental programs 12/10/1990 This Year Next Year 1. Budgeted Expenditures Actual Expenditures C. "At Least As Effective As" 1. Is your AGENCY implementing an "at least as effective as" variant of this BMP? no a. If YES, please explain in detail how your implementation of this BMP differs from Exhibit 1 and why you consider it to be "at least as effective as." D. Comments 3 96
57 California Red legged Frog Survey Report Long Pool of Santa Ynez River August 2009 Prepared for Central Coast Water Authority 255 Industrial Way Buellton, CA Prepared by Science Applications International Corporation 5464 Carpinteria Avenue, Suite K Carpinteria, CA 93013
58 This page intentionally left blank.
59 Introduction Two segments of the pipeline that delivers State Water Project water to Lake Cachuma have become exposed within the Santa Ynez River floodplain between Bradbury Dam and the Highway 154 crossing (Figure 1). One exposed segment is located within an overflow channel that carries water only during high flows, such as when Lake Cachuma spills (Figure 2). It is approximately 220 feet from the Long Pool within the river. The second exposed segment is located in San Lucas Creek where it passes through the river floodplain to the active river channel (Figure 3). It is approximately 150 feet south of the active river channel. The Central Coast Water Authority (CCWA) plans to repair these segments so that the pipeline is no longer exposed. The California red-legged frog is federally listed as threatened, and this species is known to be present in some locations along the river and in some of the tributaries. However, no reports of this species in the project area are known. Because suitable habitat appears to be present, particularly in the Long Pool, surveys to determine presence or absence of the species were conducted in accordance with the current (August 2005) U.S. Fish and Wildlife Service protocol. Survey Methods The survey protocol requires two day and four night surveys over a six-week period during the breeding season. The surveys must be a minimum of seven days apart, but the day surveys can be conducted on the same day as the night surveys. The Long Pool was visited on 25 March and 5 May 2009 to determine the best methods for conducting the surveys. Access to and walking along the bank of the pool was found to be infeasible due to dense vegetation growth on the bank that included willows (Salix spp.), mulefat (Baccharis salicifolia), blackberry (Rubus ursinus), and other species. Dense patches of California bulrush (Scirpus californicus) around much of the pool margin and a steep cliff on the north bank also limited access to the water s edge. Wading in the pool was also found to be infeasible due to the large cobble to boulder strewn bottom, water depth (sometimes over 3 feet), and size of the pool (approximately 1,700 feet long). Thus, use of a two-person kayak was determined to be the best method to survey the margin of the Long Pool. Binoculars (Cannon 8x25) were used for both the day and night surveys, and a Mag Lite 3D cell flashlight was used at night. Dr. Rosie Thompson (Permit TE ) conducted the surveys with the assistance of Mr. Ron Cline of CCWA. Ron slowly paddled the kayak near the shore, stopping frequently while Rosie looked for frogs. Frogs found by eye shine at night were approached very slowly to verify identification. Vegetation along the shore was recorded during the last day survey. Approximately 1,100 feet of the pool were surveyed by kayak (Figure 4). The upstream about 100 feet was not accessible due to bulrush growth, and the western arm of the pool was too shallow for the kayak. The river adjacent to the San Lucas Creek exposed pipeline segment was not surveyed due to lack of access from the landowner. Survey information is provided in Table 1. Results No frogs were observed during the first day survey. Bullfrogs (Rana catesbeiana) were observed and heard during all the night surveys (14 to 27 per survey) and the last day survey (6). The bullfrogs were primarily in shallow water along the shore with low emergent or submerged aquatic plants. Only a few were seen in the bulrushes. Pacific chorus frogs (Pseudacris regilla) were heard during all the night surveys. No California red-legged frogs were observed in any of the surveys. Other species observed include trout (Oncorhynchus mykiss), carp (Cyprinnus caprio), southwestern pond turtle (Actinemys marmorata pallida), beaver (Castor canadense), bats (species not identified), American coot (Fulica americana), mallard (Anas platyrhynchus), pied-billed grebe (Podilymbus podiceps), and swallows (at least 2 species). California Red-legged Frog Survey Report, Long Pool of Santa Ynez River 1 August 2009
60 The east end of the Long Pool has a cottonwood/willow (Populus fremontii/salix lasiolepis) riparian woodland on the banks with a few white alders (Alnus rhombifolia) on the south bank. Western sycamore (Platanus racemosa) trees occur at scattered locations around the pool. More cottonwood/willow riparian woodland is present on the south bank at the west end of the pool. Riparian scrub dominated by sandbar willow (Salix exigua) and mulefat occurs between the woodland patches and around the western end of the Long Pool. Herbaceous plants make up much of the understory. California bulrush forms large patches in the water, with smaller amounts of cattail (Typha sp.) and rushes (Juncus spp. and Eleocharis sp.). Submerged aquatic plants as well as low emergent plants were also in the water. One non-native submerged plant, Potamogeton crispus, was observed in the water adjacent to the cliff on the north side of the pool. Table 1. Survey Information Date Time Conditions Notes 5 May :20-3:20 PM Clear and breezy Only able to wade approximately 1/3 of pool length; large trout in pool 21 May :00-10:15 PM Clear, calm; ¼ moon (not visible); air 63-55F Kayak survey of pool; two beaver 3 June :05-10:35 PM Few high patches of fog but clearing; Kayak survey of pool; two beaver, many ¾ moon; air 61F bats, large carp 18 June :05-10:57 PM Clear, calm; almost new moon (not visible); air 68-61F Kayak survey of pool; beaver active 25 June :30-7:14 PM Clear, light breeze; air 82-77F Kayak survey of pool; recorded dominant vegetation along shore; photos of habitat 25 June :10-10:35 PM Clear, calm; sliver moon; air 66-59F Kayak survey of pool; beaver active Conclusions Based on the results of the California red-legged frog surveys and observations of the repair sites, the proposed project would have no effects on the California red-legged frog. Although no surveys were conducted in the Santa Ynez River adjacent to the San Lucas Creek site, no California red-legged frogs are expected in that area since none were found in apparently suitable habitat in the Long Pool. The distance from the Long Pool to San Lucas Creek is approximately 1.4 miles by air and 1.6 miles via the river. At that location, the river channel does not appear to have an abundance of suitable habitat for this species, based on aerial photographs. However, a site assessment of the adjacent Santa Ynez River by a qualified biologist and one night survey is recommended prior to construction at the San Lucas Creek site. 2 California Red-legged Frog Survey Report, Long Pool of Santa Ynez River August 2009

61 Bradbury Dam Long Pool Exposed Pipe z Y n e S a n t a R i v e r Exposed Pipe San Lucas Creek Highway 154 N Scale Feet Figure 1. Exposed Pipeline Repair Locations


62 Cliff SURVEY AREA S a n t a Y n e z R i v e r L o n g P o o l Exposed Pipe LEGEND Riparian Scrub Bulrush/Cattail Marsh N Riparian Woodland Scale Feet Figure 4. Survey Area and Dominant Vegetation Types along Pool Margin
63 Attachment A Site Assessment and Survey Forms
64 This page intentionally left blank.
65 Attachment B Site Photographs

66 Photo 1. Looking northwest along exposed pipeline near the Long Pool and approximately 3,800 feet northwest of the Bradbury Dam spillway gates. 15 December 2007 California Red-legged Frog Survey Report, Long Pool of Santa Ynez River B-1 August 2009
, a")

67 Photo 2. Looking northeast from the exposed pipeline toward the Long Pool (behind the riparian scrub), a distance of about 220 feet. 15 December 2007 Photo 3. Looking east along exposed pipeline in San Lucas Creek, approximately 150 feet south of the Santa Ynez River (to left). 15 December 2007 B-2 California Red-legged Frog Survey Report, Long Pool of Santa Ynez River August 2009

.")
68 Photo 8. North bank of Long Pool with vertical cliff. Submerged and emergent aquatic plants are at base of the cliff. Bullfrogs were always seen here. 25 June 2009 Photo 9. Looking upstream in the Long Pool toward Bradbury Dam (in background). 25 June 2009 California Red-legged Frog Survey Report, Long Pool of Santa Ynez River B-5 August 2009
 owns and operates a transmission pipeline that delivers water from the Santa Ynez Pumping Plant, located in the Santa Ynez Valley, to Lake")

69 AECOM 5851 Thille Street Suite 201 Ventura, CA tel fax Technical Memorandum To Subject From Date April 13, 2010 Background John Brady, P.E., Operations Manager/Engineer Central Coast Water Authority Page 1 Pipeline Erosion Repair Project Alternatives Development Douglas Hahn, P.E., Project Manager The Central Coast Water Authority (CCWA) owns and operates a transmission pipeline that delivers water from the Santa Ynez Pumping Plant, located in the Santa Ynez Valley, to Lake Cachuma. This pipeline, which was constructed in the 1960 s, delivers up to 10,000 gpm, at up to 376 feet of head. Erosion of soils has been a historical issue with the pipeline being in the floodplain, downstream of the Bradbury Dam. There are currently two (2) areas of the pipeline where the once-buried pipeline has become exposed and is above-ground due to soil erosion. The objective of this project is to study the issues, evaluate alternatives, and provide design and construction phase engineering services to provide remediation and repairs of these two (2) exposed reaches of pipeline. This memorandum reports on the initial tasks of this project to begin the review of issues and options for improvements to select viable alternatives for further development and evaluation. Recommendations for interim measures to be installed within the near term are presented and alternatives for longer term improvements are identified for consideration and further study. The exposed reaches of the project are shown on the Project Location Map, Figure 1, and are described as follows: Immediately downstream of the Bradbury Dam Spillway, in an area where a secondary overflow channel diverts in a southerly path from the main channel of the Santa Ynez River. In this location the pipeline is exposed for approximately 200 feet. In the current channel of San Lucas Creek, immediately upstream of its confluence with the Santa Ynez River, but within the river s floodplain. In this location the pipeline is exposed for approximately 50 feet.
70 Memorandum to John Brady April 12, 2010 Page 2 A secondary objective of the project s initial phases is for limited evaluation and consultation related to the reliability and longevity of the full length of the transmission pipeline. CCWA is interested in remedial measures for the two (2) exposed reaches of pipeline to be coordinated with anticipated future improvements or replacements of the full or major segments of the transmission pipeline. Scope of Preliminary Investigations For this phase of the project, AECOM performed the following tasks: Desktop Investigation. Readily available reports, historic aerial photos, as-built drawings and other information were gathered from CCWA, team files and public sources. This information was reviewed and analyzed from both engineering and geotehnical veiwpoints. Site Reconnaissance. Geotechnical and pipeline structure experts from AECOM and FUGRO visited the two (2) sites and made pertinent observation. Preliminary Review of Concepts. The information was gathered and various constructuction methods were considered for potential options. The effort included conference calls with members of the project team to make initial assessments of the available options and provide a concensus on the direction of the project. Technical Memorandum. The findings of the preliminary investigation, including identifying alternative for further evaluation, are presented in this current document. A full description of AECOM s Scope of Work for this study in found in Appendix A. Desktop Investigation, Engineering Prior to the site visit, related documents collected by the CCWA staff were reviewed in CCWA s office. It was noted that the initial pipeline was constructed of steel cylinder concrete pipe (SCCP). This type of pipe is constructed with a thin-walled steel cylinder wrapped with reinforcing rods and cement mortar lined and coated. The general performance of SCCP has been relatively good; similar to that of mortar lined and coated steel pipe. The reinforcement in this type of pipe is mild steel (not high strength), is not prestressed, and is not susceptible to the catastrophic failures characterizing pre-stressed concrete cylinder pipe. Like most pipe materials, SCCP is advertized to have a 50-year life under optimal conditions, however, the life-expectancy of SCCP could be many decades longer. In the review, it was also noted that both segments of the pipeline that have been exposed were on revised alignments of the pipeline where portions of the pipeline had been replaced in 1969 following damage that occurred during the heavy flooding of that year. Record information including lay sheets for full length of the original pipeline was available, but shop drawings for the realignments in 1969, were not found during our visit. It will be initially assumed that the piping materials are similar to initial mainline SCCP materials.
71 Memorandum to John Brady April 12, 2010 Page 3 The as-builts for the original pipeline indicate that in the vicinity of the upstream exposed segment (between Stations and 43+00) the alignment was on the north bank of the Santa Ynez River low-flow channel in 1960 during the initial pipeline construction. The 1969 realignment of the pipeline brought the alignment further south crossing this channel area at the now exposed section pipe. It appears the earlier low-flow channel had become a secondary channel prior to the 1969 realignment. This secondary channel receives overbank flows from the main channel during high flow releases of the dam. The dam spillway has apparently influenced the river alignment immediately downstream of the dam. San Lucas Creek was also noted to have meandered. The San Lucas Creek crossing for the initial pipeline construction in 1960 was further west than today, and the repair work in 1969 showed an intermediate crossing point different from both the 1960 and current conditions. San Lucas Creek changed its current channel location in the early 1990 s and started the erosion that has led to the current exposure of this pipeline section. This is likely a meandering of the stream in the alluvial materials of the Santa Ynez River floodplain versus a progressive shift of the creek channel to the east. The upstream exposed portion was located roughly on the design documents for the 1969 repairs at Station to Station The San Lucas crossing was roughly located around Station The upstream exposed portion was also located on the County of Santa Barbara Assessor s Map Book 141, Page 26 within Parcel 5 near or on the Rancho De Los Pinos Boundary, which is owned by the U.S. Bureau of Reclamation. The San Lucas exposed segment was roughly located on the Assessor s Book 141, Page 29 within Parcel 55, which is owned by a private land owner. CCWA holds a 30-foot wide permanent easement (Official Record ) along the pipeline alignment and has right of access through the private land owner s land for maintenance and repair. The right of access requires notification and coordination with the land owner. Corrosion CCWA has installed and regularly monitors cathodic test stations along the pipeline alignment. In 1993, Corrosion Engineering and Research Company provided a soil corrosivity study that identified soils in the proximity of the exposed section as having a corrosion classification of neglibible. Adverse readings were not noted in the vicinity of the exposed sections of this study. Site Reconnaissance On Monday, October 20, 2009, Andy Romer and Douglas Hahn of AECOM joined John Brady and Ron Cline of CCWA, on a site visit of the project site. Reconnaissance was made of the two (2) exposed portions of the CCWA 30-inch pipeline along the Santa Ynez River. Upstream Segment Observations Three (3) 40-foot pipe sections and 87 +/- feet of concrete encasement were exposed at the upstream segment. Portions of the pipeline were bridging over a shallow channel less than a foot below the bottom of the pipeline. A small trough could be seen downstream of the pipeline where flows cascading over the pipeline at a higher velocity had scoured deeper. In


72 Memorandum to John Brady April 12, 2010 Page 4 the areas where erosion had taken place, it was noted that the materials were cobbles. The fines and sands had been washed out of the top layer of material. One to three hundred feet upstream of this segment, an air-vac assembly was noted with the designation of Station San Lucas Creek Segment Observations This exposed segment of pipe measured about 47 feet in length with a short (5 feet) portion of concrete encasement exposed on the west side. Erosion was not as deep and there were no lengths of pipe bridging the channel. Like the other site, there was a deep trough immediately downstream of the pipeline. Smaller cobbles were noted than the upstream site, but fines were also removed in the crossing area. 20 to 40 feet to the east of the crossing, a marker was noted with Station (In the field, we read the marker as , but in reviewing record drawings it was noted that an 8 inch outlet was located at Station ) Photos from the site visit are shown.
73 Memorandum to John Brady April 12, 2010 Page 5 Flood Release Historic spillway releases from Lake Cachuma recorded by the U.S. Bureau of Reclamation since 1958 have been reviewed to assess the magnitude and frequency of large flows in the Santa Ynez River. At this point in the investigations no hydrologic or hydraulic analyses have been conducted. The graph shown below simply plots the largest releases of each year (some years had multiple releases) against the fraction of years that flow was exceeded (rank divided by 52 total years of record). Cachuma Release Flows Q (CFS) 90,000 80,000 70,000 60,000 50,000 40,000 30,000 20,000 10, Fraction of Rank Over Years of Record There have been two (2) operating strategies for releases of the dam. A spill event occurs when the lake level reaches 750 feet and the gates are open. Operators of the dam have traditionally based releases on the inflow into the lake and what it takes to maintain a stable elevation. This has changed recently and the dam is now operated as a flood control reservoir. This new operation could reduce the peaks of the higher flow releases and increase the number of lower flow releases. The largest peak flow release occurred in 1969 with a flow of near 80,000 CFS, but it should be noted that operator error contributed to this high value by allowing all three (3) gates to be open nearly 100 percent. The graph also indicates that about once every five years (or a 20 percent chance) releases exceed about 10,000 CFS, and about once every 10 years (or a 10 percent chance) releases exceed about 20,000 CFS. In looking at the recent record, the upper pipeline segment was likely exposed by channel erosion during the 19,942 cubic feet per second (CFS) flow release in 2005, with or without additional erosion caused by a peak release of 10,066 CFS in In subsequent years, the only spillway release was limited to 819 CFS in Somewhere near this 10,000 CFS to 20,000 CFS flow range is likely the flow level where some flows will divert from the current main channel and cross the upper exposed segment of the pipeline. Note, in 32 of the last 52 years there have been no flood releases, and as of this date, the lake is currently four feet from reaching the spillway crest. There is a USGS Stream Gage ( Santa Ynez R Nr Santa Ynez,CA) near the upper exposed pipe which can offer nearby historic water levels. However, channel overflows, and the frequencies of flood events that cross the pipeline cannot be calculated from this data due to insufficient topographic information.
74 Memorandum to John Brady April 12, 2010 Page 6 San Lucas Creek is an unregulated watershed and the lower exposed pipeline segment will be impacted by a separate regime of flows. That is, San Lucas Creek can have erosive flood flows at different times and for different events than the large flow releases from Lake Cachuma. The exposed pipeline at the San Lucas Creek crossing will likely see more frequent creek flows, but at smaller magnitudes than the Santa Ynez releases. With updated topography, and considering the extent of the eroded channel section, estimates of past flood flows can be roughly made and used as a design criteria. This type of calculation would only estimate recent erosive flow events that will be exceeded by larger flood events. Desktop Investigation, Geotechnical Fugro West, Inc. (Fugro) conducted a desktop study including the review of historical aerial photographs of the Santa Ynez River below Bradbury Dam. Their report dated January 29, 2009 is appended to this memorandum (Appendix B). Some of their key findings noted (due to cobbles, sands, and high groundwater) are not: excavations will be difficult; excavations will require relatively large cut backs; and trenchless technologies for short spans (less than 1,000 feet) are not viable. The aerial photos confirm the normal low-flow channel below Bradley Dam has shifted from the southern side of the sand bar to the northern side following the 1969 flood events. Fugro also noted the reduced channel grades over time, but couldn t provide quantified estimates, without record survey information. Construction/Repair Options As preparation for discussions on repair options, several options including the approaches noted in AECOM s proposal and ideas identified while conducting site observations were reviewed on a very conceptual level to roughly size the improvements and the magnitude of costs involved. These options are briefly described below. Table 1 (follows) provides a summary. Trenchless technology was not considered for alternatives involving short installation lengths. Full Pipeline Replacement. This alternative involves the relocation of five (5) miles of the transmission pipeline that is in the Santa Ynez River flood plain to a more secure and accessible location under or adjacent to Highway 154. This is the baseline project for complete restoration of the transmission system, which would require a significant period of time for planning, approvals, and funding. This alternative will have a significant cost, but would have the environmental benefit of removing facilities out of the river area, greatly increasing the reliability of the line, reducing risk and facilitating normal operations and maintenance. The other challenge in addition to cost are the approvals and permitting issues that would need to be coordinated with CALTRANS for construction on or adjacent to the highway s right-of-way. Problem Area Replacement. The area immediately below Bradbury Dam to below the San Lucas Creek confluence is where both exposed segments of the pipeline have recently occurred. This is also the area where significant pipeline replacements were made after the flooding of A rough concept using two (2) reaches of about 3,000-foot lengths of
 was considered. This option would significantly improve the reliability of this 8,000 to 9,000-foot portion of the pipeline.")
75 Memorandum to John Brady April 12, 2010 Page 7 horizontal directional drilling (HDD) under the erosive channel areas complimented with about a 2,500 feet of conventional pipeline construction outside the channel (but within the floodplain) was considered. This option would significantly improve the reliability of this 8,000 to 9,000-foot portion of the pipeline. The remaining 19,000 feet of the pipeline in the Santa Ynez River floodplain would remain with its current risks and other conditions. Note, relocating segments of the pipeline to Highway 154 could be considered, but the added lengths and right-of-way requirements to tie in the segment upstream and downstream, would add additional costs. Riprap. Riprap can be installed downstream of the current exposed sections of the pipeline. The riprap would act as drop structures slowing flows over the pipeline with the energy being dissipated while crossing the new rock structures versus the pipeline. With this measure, the exposed pipe segments could be backfilled with the riprap offering erosion protection for this material. This type of construction could be conducted as a relatively quick and simple emergency measure by using a backhoe to move larger stones and boulders from the river channel to the downstream side of the exposed pipeline. Importing heavy and dense angular stones would form stronger structures. This type of option would have limited effectiveness for the full pipeline in that the pipeline upstream and downstream of these improvements would be at risk if the erosive flows migrated to other locations. Also the cost and size of stones would be constructed to meet a certain criteria of flow and velocities such as a 10-year flood event. This type of improvement would be at risk for larger flood events. Due to these limitations, this type of option would be considered as a temporary or interim measure. Point Replacements. Similar to past repairs, the exposed segments could be replaced with a deeper placement of the pipe combined with a concrete encasement. Like the riprap option, this option would have limited effectiveness for the full pipeline in that the pipeline upstream and downstream of these improvements would be at risk if the erosive flows migrated to other locations or if addition down cutting of the channel occurs. This option would also be considered as a temporary or interim measure. Piers. Where erosion has cut deeper channels, the pipeline could be raised and supported above the planned flows. Piers could be placed by drilling or driving piles. This construction option has successfully been used for downstream portions of this same transmission line. Like the riprap option, this option would have limited effectiveness for the full pipeline in that the pipeline upstream and downstream of these improvements would be at risk if the erosive flows migrated to other locations; and whatever is used as a criterion for required flow areas, a larger event could potentially occur. This option would also be considered as a temporary or interim measure. Pier supports in Santa Ynez River.
76 Memorandum to John Brady April 12, 2010 Page 8 Alternative & Cost Full Pipeline Replacement $160 Million Problem Area Replacement $7 Million Riprap $200,000 Point Replacements $300,000 Piers $600,000 Damage Risk Mitigation Table 1 - Alternatives Description of Cost Basis 26,000 feet of 30 WSP in Highway $20*/dia-in =>$600/foot => $160 Million. *From recent bid for 2nd Barrel COMB (48 WSP) 6,000 feet of $1,000/foot => $6 Million plus 1000 feet conventional $600/foot => $600, x 10 = 2,500 ft $80/ft-sq => $200, of 30 WSP concrete encased@ $1000/foot => $300, total borings, 24 $1300/foot => $520,000 plus Armored pipe replacement $400/ft => $80,000 Telephone Conferences Telephone conferences were conducted on February 10, 2010 and February 17, 2010 to review desktop investigation findings, observations and potential options, and to discuss the course of the project. In the first session, Dan Ellison and Doug Hahn were joined with Lori Prentice of Fugro and John Brady. Dave Arthurs joined briefly at the start of the first session and participated in the second session. Andy Romer along with Rosie Thompson, of ENTRIX was also able to participate in the later session on the February 17, At the first session concepts for interim and long-term repairs were discussed along with the findings of Fugro s desktop study. In the second session, these options were further discussed, and scheduling issues for permits and access were raised. Considering the time needed to conduct geotechnical explorations, which are essential for evaluating the feasibility of long-term repairs; and the potential risk of the exposed pipeline segments in their current state; there was a consensus to move forward with interim measures. The continued development and evaluation of long-term repairs will progress within the constraints of permitting and the moratorium. A moratorium established by the U.S. Bureau of Reclamation prohibits work in the Santa Ynez River channel area from December first through May first. The recommendations on interim measures and longer term alternatives that followed from these conference calls are discussed below. A proposed schedule of key project and construction activities was also developed and is presented in Appendix C. Interim Measures In our site visits to the exposed segments, Andy Romer suggested a means to control velocities and sediment loss that he had seen in another application. That was to provide riprap structures downstream of the exposed segments. In the conference call this option was thought of as an appropriate approach, but it was requested that a flow path be created
77 Memorandum to John Brady April 12, 2010 Page 9 to control limited flows passing the pipeline. It was agreed that the riprap structure could be complemented with lowering and hardening portions of the exposed segments. The riprap could be extended 5 to 10 feet beyond the channels created by erosion. The lowering and hardening of the pipelines will provide some control of the local hydraulics up to limited flows. The replacement pipe would likely be lowered 5 to 8 feet below a 10 to 20 foot wide channel via conventional trenching and would be concrete encased. The new channel would traverse both the riprap structure and the lowered pipeline and would be lined with a rock mesh slope armor or cement grouted riprap (smaller stone than the drop structure). The pipe replaced would be one (1) or two (2) 40-foot sections of the existing SCCP. For SCCP type pipe, field repairs and replacements need to span joint to joint, where there is adequate steel for welding. The interim measures would be not intended to provide complete protection of the lines during severe flooding or large spillway releases. The basics of this concept are shown on Figure 2. The concept should be further refined with hydrologic and hydraulic analyses based on site-specific geotechnical information and design-level ground surveys. Long-Term Improvements The next step for long-term improvements is to continue to study the issues and evaluate alternatives for pipeline protection, focusing on the two (2) currently exposed segments of the transmission pipeline. Assuming the interim measures design moves forward, this alternative analysis will account for the interim measures (in place) when assessing improved reliability and added value. The alternatives to be considered would include replacing high-risk portions of the pipeline by 1) realigning the pipeline out of the flood plain using conventional trenching methods, 2) using HDD to locate the pipeline below potential erosion depths, or 3) a combination of these two (2) methods. The ultimate protection would be to replace the entire pipeline outside the flood plain with a new alignment under or adjacent to the highway. As noted earlier, relocating a limited pipeline segment to Highway 154 would not be economically feasible. The high-risk pipeline reach to be considered is the area between and adjacent to the two (2) exposed segments investigated in this project. A preliminary concept plan combining HDD and conventional construction is shown on Figure 3. Note, this alignment does not represent a proposed alignment to be considered by CCWA at this time. Alternative projects should be developed with new geotechnical explorations and investigations, topographic surveys, hydrologic and hydraulic analyses and constructability reviews, then evaluated based on costs, reliability, risks, environmental impacts and other considerations. Attachments: Appendix A: Appendix B: Appendix C: Scope of Work Geotechnical Desktop Study Report Preliminary Project Schedule
78 APPENDIX A Scope of Work
79 Task 110 Desktop Investigation, Engineering CCWA will support the investigation by collecting and assembling available as-builts, reports, pertinent operations and repair records, pipe laying drawings and related information for the pipeline and site conditions. This information will be gathered from CCWA s records and from key agencies such as the Bureau of Reclamation, Department of Water Resources, and the County of Santa Barbara flood control agency. AECOM will review the gathered information to better understand the project requirements and to garner pertinent facts for developing and assessing remediation alternatives. AECOM will supplement the data collection provided by CCWA with limited contacts with other agencies. Up to three (3) meetings with the CCWA staff and key agencies, such as the Bureau of Reclamation or County of Santa Barbara, are anticipated for data collection. Consistent with the professional standard of care and unless specifically provided herein, AECOM shall be entitled to rely upon the accuracy of data and information provided by CCWA or others without independent review or evaluation. The following is a partial list of data and records to be gathered and reviewed: CCWA Preliminary Design Report As-Builts of Existing Pipeline and Previous Repairs Bureau of Reclamation records and reports for Lake Cachuma Flood Control Records DWR records for stream gages, wells, etc. Right-of-Way (Parcel Maps, CCWA Easements) Task 115 Desktop Investigation, Geotechnical As a subconsultant to AECOM, Fugro West will investigate geotechnical conditions at the two sites. Recent and historic borings and previous reports for the immediate vicinity will be used in this initial task with no new excavations. Site reconnaissance will be used to supplement the data review. Aerial photography from the UCSB Map and Imagery Library will be reviewed to evaluate historical flow patterns. A technical memorandum summarizing findings and opinions will be provided. Task 120 Site Reconnaissance AECOM will drive the full alignment of the transmission pipeline and visit the two exposed portions of the pipeline and accessible areas of the pipeline where recent repairs have been made. CCWA will be responsible for acquiring the required rights of access and coordinating with adjacent landowners. Observations will be documented in a brief field assessment memo and photos. Task 130 Preliminary Contacts and Coordination with Stakeholders CCWA or CCWA s environmental consultant will be responsible for any environment documentation, CEQA document processing, etc. for the pipeline repairs and related construction. Several state and federal agencies will require permits for the proposed work
80 and will have requirements regarding how construction activities may proceed. It is assumed that CCWA s environmental consultant will provide input on permit and compliance requirements for consideration in the Task 100 Preliminary Investigations. Task 140 Preliminary Development and Assessment of Alternative Concepts AECOM will analyze the information gathered in earlier tasks to develop concepts for rehabilitating the two reaches of exposed pipe. The four options noted in the AECOM s SOQ will be part of the consideration: Horizontal Directional Drilling Pipe Suspension Bridge Pipe in a Pipe with Drilled Piers Deep Open-Trench with Hardening Other construction methods may be reviewed and options for emergency responses and repairs and other long-term improvements for the full transmission pipeline may also be considered on a preliminary concept level. Limited evaluation and assessments of options will consider several aspects including: Cost Reliability/Longevity Constructability Environmental Compliance Permits/Regulatory Limitations Risk Short-term/Long-term Access and Right-of-Way Safety/Security Aesthetics Schedule Constraints Operations and Maintenance Task 150 Technical Memorandum AECOM will prepare a Technical Memorandum summarizing the findings of the study and identifying three alternatives at each exposed pipe location for further evaluation. One meeting will be held with CCWA to present and review the findings.
81 APPENDIX B Geotechnical Desktop Study Report
82
83
84
85
86
87
88

89

90
91 APPENDIX C Preliminary Project Schedule

92
93
94


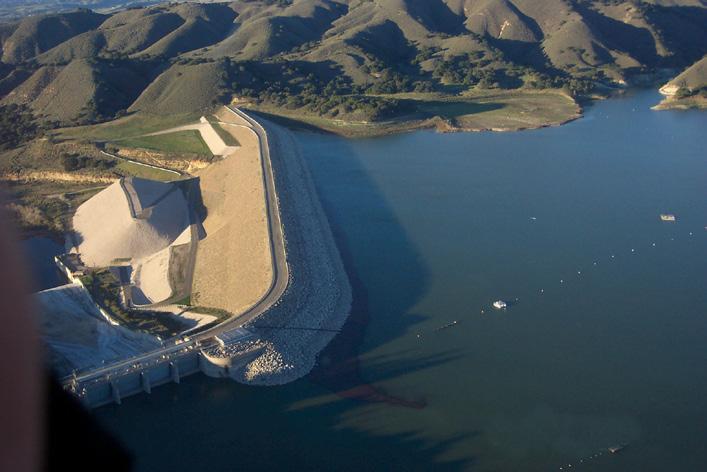


95 Application for Proposition 84 Planning Grant Round 1 Santa Barbara County IRWM Plan 2012 Santa Barbara County Water Agency Prepared by September 28, 2010
2015 Urban Water Management Plan for Mojave Water Agency
 Courtesy: Google Earth FINAL 2015 Urban Water Management Plan for Mojave Water Agency Prepared by Kennedy/Jenks Consultants June 2016 300 North Lake Avenue, Suite 1020 Pasadena, California 91101 626-568-4300
Paso Robles Groundwater Basin Management Plan A Focus on Voluntary Actions to Improve the Sustainability of Our Water Supply
 Paso Robles Groundwater Basin Management Plan A Focus on Voluntary Actions to Improve the Sustainability of Our Water Supply Why Implement a Groundwater Management Plan? Pumping at or near basin annual
SECTION 7: DEMAND MANAGEMENT MEASURES
 SECTION 7: DEMAND MANAGEMENT MEASURES 7.1 DOCUMENT REQUIREMENTS 7.1.1 UWMP Requirements This section will include the following: Describe how each water demand management measures are being implemented
UWMP Standardized Tables. Palos Verdes District Urban Water Management Plan Appendix H
 UWMP Standardized Tables Palos Verdes District 2015 Urban Water Management Plan Appendix H Table 2-1 Retail Only: Public Water Systems Public Water System Number Public Water System Name Number of Municipal
ENVIRONMENTAL IMPACT ANALYSIS WATER RESOURCES: WATER SUPPLY 1. ENVIRONMENTAL CONDITIONS. a. Physical Setting. (1) Water Supply
 Water Supply") IV. E.2. ENVIRONMENTAL IMPACT ANALYSIS WATER RESOURCES: WATER SUPPLY 1. ENVIRONMENTAL CONDITIONS a. Physical Setting (1) Water Supply The Los Angeles Department of Water and Power (LADWP) owns, operates,
IV. E.2. ENVIRONMENTAL IMPACT ANALYSIS WATER RESOURCES: WATER SUPPLY 1. ENVIRONMENTAL CONDITIONS a. Physical Setting (1) Water Supply The Los Angeles Department of Water and Power (LADWP) owns, operates,
Los Angeles 3 rd Regional
 Los Angeles 3 rd Regional Investors Conference Los Angeles, California March 31, 2016 Metropolitan Water District of Southern California 1 Metropolitan Water District of of Southern California 2 Metropolitan
THE SANTA YNEZ RIVER CONSERVATION DISTRICT IMPROVEMENT DISTRICT NO. 1 INTRODUCTION
 THE SANTA YNEZ RIVER CONSERVATION DISTRICT IMPROVEMENT DISTRICT NO. 1 INTRODUCTION The Santa Ynez River Water Conservation District, Improvement District No. 1 ("District" or "SYRWCD, ID#1") is a public
Chapter 8 National Economic Development and Locally Preferred Alternative
 Chapter 8 National Economic Development and Locally Preferred Alternative Determination of Feasibility This chapter considers the feasibility of the NED Plan and the Locally Preferred Alternative. As indicated
PASO ROBLES GROUNDWATER BASIN: WATER SUPPLY FRAMEWORK, HISTORY, AND CURRENT CONDITIONS. CCVT Sustainable Ag Expo.
 PASO ROBLES GROUNDWATER BASIN: WATER SUPPLY FRAMEWORK, HISTORY, AND CURRENT CONDITIONS CCVT Sustainable Ag Expo November 18, 2013 Paul A. Sorensen, PG, CHg Principal Hydrogeologist Fugro Consultants, Inc.
CONSERVATION PLAN April 2009
 CONSERVATION PLAN April 2009 1. INTRODUCTION AND OBJECTIVES Water supply has always been a key issue in the development of Texas. In recent years, the growing population and economic development of North
TAUSSIG. & Associates, Inc. DAVID. Public Finance Facilities Planning Urban Economics CAPACITY FEE STUDY FOR SAN GORGONIO PASS WATER AGENCY
 DAVID TAUSSIG & Associates, Inc. CAPACITY FEE STUDY FOR SAN GORGONIO PASS WATER AGENCY JULY 21, 2015 Public Finance Facilities Planning Urban Economics Newport Beach Riverside San Francisco Chicago CAPACITY
Water Rates in Santa Barbara County: February 2018
 City/District or Company Billing interval Monthly, Bimthly Water Rates in Santa Barbara County: February 2018 Rate * structure, Block etc Single Family (SFR) Buellton Monthly Carpinteria Monthly Block
Engineer s Report. Santa Clara Valley Water District California Aqueduct Reverse Flow Project Project No
 17 Santa Clara Valley Water District California Aqueduct Reverse Flow Project Project No. 60061007-6810 Engineer s Report February 2015 Water Utility Capital Division This page intentionally left blank.
Cost Sharing Agreement For The Los Vaqueros Reservoir Expansion Project Planning. ACWD Board Meeting December 8, 2016
 Cost Sharing Agreement For The Los Vaqueros Reservoir Expansion Project Planning ACWD Board Meeting December 8, 2016 Los Vaqueros Reservoir (LV) Owned and operated by CCWD Off-stream reservoir, adjacent
Alameda County Water District
 Alameda County Water District Alameda Local Agency Formation Commission Meeting Robert Shaver, Assistant General Manager Thursday, March 13, 2014 Month, Day, Year Overview Founded in 1914 Population: ~336,000
Questions and Answers about the Water Supply and Water Quality bond act for the November, 2018 ballot. Updated November 17, 2017
 Questions and Answers about the Water Supply and Water Quality bond act for the November, 2018 ballot. Updated November 17, 2017 What is the need for more State investment in water resources? What is the
Pipelines to Nowhere? Structural Responses to Climate Change and Population
 Pipelines to Nowhere? Structural Responses to Climate Change and Population Presented by James Lochhead, Esq. Brownstein Hyatt Farber Schreck, LLP bhfs.com Evolving Strategies of Water Supply Development
2015 URBAN WATER MANAGEMENT PLAN Final Report
 PREPARED FOR Coachella Valley Water District 2015 URBAN WATER MANAGEMENT PLAN Final Report July 1, 2016 This page left intentionally blank TABLE OF CONTENTS Section 1 Introduction and Overview... 1-1 1.1
Paso Robles Basin Groundwater Management Plan
 March 2011 Paso Robles Basin Groundwater Management Plan Submitted to Paso Robles Groundwater Basin Groundwater Advisory Committee Date: V2.0 Project No: 083720 Table of Contents Table of Contents i 1
Executive Directive #5 Issue Date: October 14, 2014 Subject: Emergency Drought Response Creating a Water Wise City Introduction Los Angeles and
 Executive Directive #5 Issue Date: October 14, 2014 Subject: Emergency Drought Response Creating a Water Wise City Introduction Los Angeles and California as a whole are currently experiencing extreme
Revised 8-4. Board of Directors Water Planning and Stewardship Committee. September 11, 2007 Board Meeting. Subject. Description
 Board of Directors Water Planning and Stewardship Committee September 11, 2007 Board Meeting Subject Adopt criteria for conveyance options in implementation of Long Term Delta Plan Description Revised
Water Supply Water Quality Water Reuse and Conservation Watershed Management Interagency Coordination
 WATER ELEMENT INTRODUCTION Water is one of the most critical resources for the Merced County economy and for the quality of life of its residents. Both surface water and groundwater supplies are an important
ARTICLE 10 WATER SHORTAGE CONTINGENCY PLAN 90
 ARTICLE 10 WATER SHORTAGE CONTINGENCY PLAN 90 5.1001 DECLARATION OF PURPOSE AND PRINCIPLES In accordance with Water Code 10632 requirements, Eastern Municipal Water District (EMWD) is responsible for conserving
California Water Service Urban Water Management Plan. Antelope Valley District June Quality. Service. Value. Quality. Service. Value.
 2015 Urban Water Management Plan June 2016 Quality. Service. Value. Quality. Service. Value Table of Contents List of Tables... 5 List of Figures... 7 List of Acronyms... 8 Chapter 1 Introduction and
California Water: Looking to the Future. Statistical Appendix
 Golden Gate University School of Law GGU Law Digital Commons California Agencies California Documents 1-1988 California Water: Looking to the Future. Statistical Appendix California Department of Water
California Drought, Water, Parks, Climate, Coastal Protection, and Outdoor Access for All Act of 2018 (Proposition 68) Item 5.7
 Item 5.7") California Drought, Water, Parks, Climate, Coastal Protection, and Outdoor Access for All Act of 2018 (Proposition 68) Item 5.7 1 Potential Funding Availability California Drought, Water, Parks, Climate,
California Drought, Water, Parks, Climate, Coastal Protection, and Outdoor Access for All Act of 2018 (Proposition 68) Item 5.7 1 Potential Funding Availability California Drought, Water, Parks, Climate,
ORDINANCE NO. Adopted by the [AGENCY] [DATE] ADOPTING A WATER CONSERVATION PROGRAM
![ORDINANCE NO. Adopted by the [AGENCY] [DATE] ADOPTING A WATER CONSERVATION PROGRAM](/thumbs/71/65960919.jpg "ORDINANCE NO. Adopted by the [AGENCY] [DATE] ADOPTING A WATER CONSERVATION PROGRAM") Page 1 of 5 ORDINANCE NO. Adopted by the [AGENCY] [DATE] ADOPTING A WATER CONSERVATION PROGRAM WHEREAS, article X, section 2 of the California Constitution declares that waters of the State are to be put
Page 1 of 5 ORDINANCE NO. Adopted by the [AGENCY] [DATE] ADOPTING A WATER CONSERVATION PROGRAM WHEREAS, article X, section 2 of the California Constitution declares that waters of the State are to be put
SPECIAL BOARD OF DIRECTORS MEETING. 1:00 p.m.
 4677 Overland Avenue San Diego, California 92123 SPECIAL BOARD OF DIRECTORS MEETING Board Room February 13, 2014 1:00 p.m. 1. Call to order. 2. Roll call Determination of a quorum. A. Report on proxies
Notice of Preparation of an Environmental Impact Report and Scoping Meeting
 Notice of Preparation of an Environmental Impact Report and Scoping Meeting Date: August 15, 2017 To: Project Sponsor and Lead Agency: Staff Contact: Project Title: Location: General Plan Designation:
GOOD NEIGHBOR POLICY
 Regional Open Space MIDPENINSULA REGIONAL OPEN SPACE DISTRICT GOOD NEIGHBOR POLICY Adopted by the Board of Directors October 26, 1988 Amended August 14, 1996 Amended September 26, 2007 Introduction The
Managed Groundwater Recharge to Support Sustainable Water Management. A Sacramento Valley Perspective November 8, 2017
 To advance the economic, social and environmental sustainability of Northern California by enhancing and preserving the water rights, supplies and water quality. Managed Groundwater Recharge to Support
2005 Urban Water Management Plan
 2005 Urban Water Management Plan Long Beach Board of Water Commissioners Frank Clarke, President William B. Townsend, Vice-President Stephen T. Conley, Member Helen Z. Hansen, Member Kevin L. Wattier,
Committee on Water. Desalination as a Water Source
 Committee on Water Committee on Water Desalination as a Water Source Water Supply Reliability for San Diego County NARUC Summer Policy Summit July 17, 2017 Bob Yamada Director of Water Resources San Diego
Potable Water Supply, Wastewater & Reuse Element
 Potable Water Supply, Wastewater & Reuse Element GOAL ONE: HIGH QUALITY AND AFFORDABLE POTABLE WATER WILL BE AVAILABLE TO MEET THE EXISTING AND PROJECTED DEMANDS OF PINELLAS COUNTY UTILITY CUSTOMERS. 1.1.
IV.M.1 WATER SUPPLY 1. INTRODUCTION. 2. EXISTING CONDITIONS a. Water Supply i. Los Angeles Department of Water and Power (LADWP)
") IV.M.1 WATER SUPPLY 1. INTRODUCTION This section describes regional water supplies and existing water infrastructure serving the Project site, estimates the water demand associated with the Project, and
IV.M.1 WATER SUPPLY 1. INTRODUCTION This section describes regional water supplies and existing water infrastructure serving the Project site, estimates the water demand associated with the Project, and
Central Valley Project (CVP) Operations: In Brief
 Operations: In Brief") Central Valley Project (CVP) Operations: In Brief Charles V. Stern Specialist in Natural Resources Policy Pervaze A. Sheikh Specialist in Natural Resources Policy Betsy A. Cody Acting Senior Advisor to
Central Valley Project (CVP) Operations: In Brief Charles V. Stern Specialist in Natural Resources Policy Pervaze A. Sheikh Specialist in Natural Resources Policy Betsy A. Cody Acting Senior Advisor to
California Water Service Urban Water Management Plan. Bakersfield District June Quality. Service. Value
 2015 Urban Water Management Plan June 2016 Quality. Service. Value Table of Contents List of Tables... 7 List of Figures... 9 List of Acronyms... 10 Chapter 1 Introduction and Overview... 11 1.1 Background
Alternatives Analysis
 CHAPTER 7 Alternatives Analysis 7.1 Introduction This Chapter describes alternatives to the project pursuant to CEQA Guidelines (Section 15126.6(a)) that may avoid or lessen significant environmental impacts
SLIDES: Status of Southern Nevada Water Authority (SNWA): Third Intake into Lake Mead and Groundwater Project
: Third Intake into Lake Mead and Groundwater Project") University of Colorado Law School Colorado Law Scholarly Commons Western Water Law, Policy and Management: Ripples, Currents, and New Channels for Inquiry (Martz Summer Conference, June 3-5) Getches-Wilkinson
University of Colorado Law School Colorado Law Scholarly Commons Western Water Law, Policy and Management: Ripples, Currents, and New Channels for Inquiry (Martz Summer Conference, June 3-5) Getches-Wilkinson
SOUTHERN NEVADA WATER BRIEFING Prepared for the Legislative Commission's Subcommittee to Study Water
 SOUTHERN NEVADA WATER BRIEFING Prepared for the Legislative Commission's Subcommittee to Study Water John J. Entsminger, General Manager Southern Nevada Water Authority EXHIBIT C - WATER Document consists
CHAPTER 11 Climate Change Considerations
 CHAPTER 11 CHAPTER 11 CLIMATE CHANGE CONSIDERATIONS 11.1 INTRODUCTION Human activities, such as energy production and land development also result in both direct and indirect emissions that contribute
City of San Diego Pure Water Project October 2014
 City of San Diego Pure Water Project October 2014 SDCTA Position: SUPPORT Rationale for Position: Substantial study has demonstrated a potable reuse project within the City of San Diego would be safe,
PREPARE60 OVERVIEW 1
 PREPARE60 OVERVIEW 1 UTAH S WATER BUDGET Category Total precipitation 61,500,000 Used by vegetation & natural systems 53,789,000 Basin Yield 7,711,000 Compact decreases 535,000 Ground water mining increases
5.11 UTILITIES WATER SUPPLY
 5.11 UTILITIES WATER SUPPLY 5.11.1 INTRODUCTION The purpose of the Water Supply section is to assess the proposed project s potential impact on available water supply and infrastructure. The analysis in
MONTE VISTA WATER DISTRICT 2015 URBAN WATER MANAGEMENT PLAN
 MONTE VISTA WATER DISTRICT 2015 URBAN WATER MANAGEMENT PLAN PUBLIC REVIEW DRAFT MAY 2016 Prepared by Monte Vista Water District Staff: General Manager Public Affairs Director/ Water Use Efficiency Practitioner
Executive Summary. ES.1 Project Background
 ES.1 Project Background The natural flow of the Kern River has been apportioned among various water users pursuant to a series of court decisions and agreements including, but not limited to, the following:
Water Conservation Plan Annual Report Retail Water Supplier
 Water Conservation Plan Annual Report Retail Water Supplier CONTACT INFORMATION Name of Utility: Goforth SUD Public Water Supply Identification Number (PWS ID): TX1050019 Certification of Convenience and
Marin Municipal Water District 2015 Urban Water Management Plan Water Demand Analysis and Water Conservation Measures Update FINAL
 2015 Urban Water Management Plan Water Demand Analysis and Water Conservation Measures Update FINAL July 1, 2015 TABLE OF CONTENTS LIST OF FIGURES...4 LIST OF TABLES...4 LIST OF ACRONYMS...5 EXECUTIVE
This page is intentionally left blank.
 This page is intentionally left blank. STATE OF CALIFORNIA CALIFORNIA NATURAL RESOURCES AGENCY EDMUND G. BROWN JR., Governor DEPARTMENT OF WATER RESOURCES 1416 NINTH STREET, P.O. BOX 942836 SACRAMENTO,
National Water Demand Management Policy
 National Water Demand Management Policy Introduction In 1997, the Ministry of Water and Irrigation developed Jordan s Water Strategy and the following four policies, which include: Water Utility Policy;
Montecito Water District Drought and Quarterly Water Supply Update
 Montecito Water District Drought and Quarterly Water Supply Update October 2017 December 2017 Board Meeting February 20, 2018 Page 1 Outline 1. Drought Status 2. Total Production & Customer Demands 3.
Option 11. Divert Water from Miocene and Hendricks Canal to Supply the Ridge
 Integrated Water Resources Plan Option 11 Divert Water from Miocene and Hendricks Canal to Supply the Ridge This option would use water from the Miocene Canal and/or Hendricks Canal for municipal supplies
POTABLE WATER ELEMENT
 Goal 4.0. Provide current and future residents of the County's utility service areas, and large users of the regional raw water system a cost-effective and equitable potable or raw water supply system
Local Resource Management in Southern California
 Abstract Local Resource Management in Southern California José Vergara and Anatole Falagan 1 With a population of nearly 18 million, the Southern California region has demands in excess of 3.8 million
TABLE OF CONTENTS 4.17 UTILITIES AND SERVICE SYSTEMS...
 TABLE OF CONTENTS 4.17 UTILITIES AND SERVICE SYSTEMS... 4.17-1 4.17.0 Introduction... 4.17-1 4.17.1 Methodology... 4.17-2 4.17.2 Existing Conditions... 4.17-2 4.17.3 Impacts... 4.17-4 4.17.4 Applicant-Proposed
Chapter 6 Water Resources
 Chapter 6 Water Resources Elemental Geosystems 5e Robert W. Christopherson Charles E. Thomsen 1 Water Resources The Hydrologic Cycle Groundwater Resources Our Water Supply The Hydrologic Cycle A Hydrologic
4.2 Step 2 Profile of Water Demands and Historical Demand Management
 4.2 Step 2 Profile of Water Demands and Historical Demand Management Step 2 involves an overview of the historical water demand trends as well as the influence of historical water demand management on
ANTELOPE VALLEY-EAST KERN WATER AGENCY 2015 Urban Water Management Plan
 ANTELOPE VALLEY-EAST KERN WATER AGENCY FINAL DRAFT JUNE 2016 Table of Contents Section 1 : Introduction... 1-1 1.1 Background and Purpose... 1-1 Section 2 Plan Preparation... 2-1 2.1 Plan and Agency Identification...
Santa Barbara County Comprehensive Plan. Conservation Element
 Santa Barbara County Comprehensive Plan Conservation Element 1 2 3 GROUNDWATER RESOURCES SECTION Adopted May 24, 1994 Amended November 8, 1994 Santa Barbara County Planning and Development Department 123
San Diego, A Cadillac Desert; Presentation by: Dana Fi Friehauf, fpe P.E. Water Resources Manager
 San Diego, A Cadillac Desert; Sustainable Strategies for Living in a Desert Presentation by: Dana Fi Friehauf, fpe P.E. Water Resources Manager Green Lunch Bag Series September 24, 2014 San Diego County
WATERSHED MANAGEMENT INITIATIVE: GOALS & IMPLEMENTATION OBJECTIVES, JULY 26, 1999
 WATERSHED MANAGEMENT INITIATIVE: GOALS & IMPLEMENTATION OBJECTIVES, JULY 26, 1999 The following table indicates the draft goals and objectives for the Santa Clara Basin WMI process. The overall objectives
System Plan Components Inventory
 Northeast San Joaquin County Groundwater Bank System Plan Components Inventory Northeast San Joaquin County Groundwater Banking Authority April, 2002 The Northeast San Joaquin County Groundwater Banking
Subsequent to these early efforts, the complexities associated with potable water provision have increased significantly.
 10.1 INTRODUCTION The reliable supply, treatment and distribution of potable water is vital to the health, safety and welfare of urban areas. The citizens and officials of the have long been involved with
4.0 ENVIRONMENTAL IMPACT ANALYSIS K. UTILITIES AND SERVICE SYSTEMS 1. WATER SUPPLY
 4.0 ENVIRONMENTAL IMPACT ANALYSIS K. UTILITIES AND SERVICE SYSTEMS 1. WATER SUPPLY 1. INTRODUCTION This section estimates the Project s water demand and assesses the adequacy of water supply and infrastructure
Report of the Working Group on Reducing Peak Water Demand
 Report of the Working Group on Reducing Peak Water Demand Peter Beckmann, Doug Engfer, Sue Holt, Rick Longinotti, Sarah Mansergh Contents Why Reduce Water Demand? Reducing Peak Season Use Residential Outdoor
Sustainable Ag Lands Conservation (SALC) Stakeholder Kickoff Meeting Agenda (Meeting #1) 1) Welcome and Introductions (10 min)
 Stakeholder Kickoff Meeting Agenda (Meeting #1) 1) Welcome and Introductions (10 min)") Sustainable Ag Lands Conservation (SALC) Stakeholder Kickoff Meeting Agenda (Meeting #1) Thursday, April 28, 2016 10:00 am to Noon Development Services Training Room 7 County Center Drive, Oroville AGENDA
Sustainable Ag Lands Conservation (SALC) Stakeholder Kickoff Meeting Agenda (Meeting #1) Thursday, April 28, 2016 10:00 am to Noon Development Services Training Room 7 County Center Drive, Oroville AGENDA
APPENDIX H Guidance for Preparing/Reviewing CEQA Initial Studies and Environmental Impact Reports
 APPENDIX H H.1 Guidance for Preparing and Reviewing CEQA Initial Studies Step 1: Consider the Project Characteristics as Provided by the Project Applicant Review the project application and draft plan
Date: Wednesday, October 4, Location: Western Municipal Water District Board Room Meridian Parkway, Riverside, 92518
 Date: Wednesday, October 4, 2017 Time: 6 p.m. WESTERN MUNICIPAL WATER DISTRICT NEW DATE SCHEDULED FOR PUBLIC HEARING Proposed Increases in Water Rates and Service Charges Location: Western Municipal Water
Launch Internet Explorer Browser.lnk
 Launch Internet Explorer Browser.lnk Table of Contents Overview of the Ground Water Reporting Program... 1 History of the Ground Water Reporting Program... 1 2006 Ground Water Summary Report... 1 Reporting
Introduction Page I-1 INTRODUCTION
 Introduction Page I-1 INTRODUCTION The Arcata General Plan: 2020 will help shape how the city of Arcata will look, function, provide services, and manage resources for the next 20 years. The plan is the
Response to Comments of Don and Tricia Nevis (Letter I25) See the master response to Public Outreach Process.
 See the master response to Public Outreach Process.") Freeport Regional Water Authority and the U.S. Department of the Interior, Bureau of Reclamation Chapter 8. Responses to Comments from Individuals Don and Tricia Nevis (I25) Response to Comments of Don
Freeport Regional Water Authority and the U.S. Department of the Interior, Bureau of Reclamation Chapter 8. Responses to Comments from Individuals Don and Tricia Nevis (I25) Response to Comments of Don
Environmental Geography
 Environmental Geography Lecture 13 Water Pollution Lecture 13: Water Pollution I. Water Pollution A. Groundwater B. Surface Water C. Regulation II. Water Use in California 1 I. Water Pollution Types of
Kern Water Bank. Kern Water Bank Authority
 Kern Water Bank Kern Water Bank Authority THE KERN WATER BANK Ensuring a Reliable Water Supply to the Southern San Joaquin Valley Providing for Exceptional Upland and Riparian Habitat Kern Water Bank Authority
Water Management Representatives
 Bay Area Water Supply and Conservation Agency A multicounty agency authorized to plan for and acquire supplemental water supplies, encourage water conservation and use of recycled water on a regional basis.
DROUGHT MANAGEMENT AND WATER CONSERVATION IN CHARLOTTESVILLE AND ALBEMARLE COUNTY
 DROUGHT MANAGEMENT AND WATER CONSERVATION IN CHARLOTTESVILLE AND ALBEMARLE COUNTY Albemarle County Sewer Authority Gary Fern, P.E., Executive Director Rivanna Water and Sewer Authority Tom Frederick, P.E.,
Water and Environment. Monterey Peninsula, Carmel Bay and South Monterey Bay Integrated Regional Water Management Draft Plan
 Water and Environment Monterey Peninsula, Carmel Bay and South Monterey Bay Integrated Regional Water Management Draft Plan December 11, 2006 Presentation Outline Purpose of IRWM Planning Status of Plan
APPENDIX A NOTICE OF PREPARATION/ NOTICE OF INTENT. Proposed Lower Yuba River Accord June 2007 Draft EIR/EIS
 APPENDIX A NOTICE OF PREPARATION/ NOTICE OF INTENT Proposed Lower Yuba River Accord June 2007 Draft EIR/EIS Proposed Lower Yuba River Accord June 2007 Draft EIR/EIS Interested Parties NOTICE OF PREPARATION
DRAFT Master Water Reclamation Plan. City Council Meeting March 28, 2017
 DRAFT Master Water Reclamation Plan City Council Meeting March 28, 2017 Presentation Overview Tonight s Overall Goals Acknowledge Input City has Received Reminder: Where We are in the Process Present the
Environmental Setting, Impacts, and Mitigation Measures - Water Supply
 Chapter 3L. Environmental Setting, Impacts, and Mitigation Measures - Water Supply This chapter describes the early history of the LADWP water system, recent water supply and demand conditions in the Los
Colorado River Challenges Impacts to Southern Arizona
 Colorado River Challenges Impacts to Southern Arizona 2 3 4 5 Colorado River Basics 7 States, 2 Nations Annual Flow 15.0 MAF 40 Million People All of the Major Cities in Southwest 5.5m Irrigated Acres
Developing Metrics & Indicators for the California Water Plan. CA Sustainability Indictors Symposium February 23, 2011
 Developing Metrics & Indicators for the California Water Plan CA Sustainability Indictors Symposium February 23, 2011 1 Update 2009 State s Blueprint Integrated Water Management & Sustainability 2 Update
Fillmore One to seven million acre-feet in storage depending on calculation assumption; surface area is 20,100 acres.
 Where does the City of Santa Paula obtain its water? Currently, the City of Santa Paula obtains its water supply from the court-adjudicated Santa Paula Groundwater Basin (Basin) and in lieu surface water
Raw water sources, facilities, and infrastructure
 WATER AND WASTEWATER SERVICES IN STEAMBOAT SPRINGS Prepared by Jay Gallagher, General Manager Mt. Werner Water and Sanitation District (February, 2015) Raw water sources, facilities, and infrastructure
12:00 noon 7. Tour of the Silicon Valley Water Advanced Water Purification Center
 Joint Recycled Water Policy Advisory Committee Pat Burt, Council Member, City of Palo Alto Tom DuBois, Council Member, City of Palo Tony Estremera, Board Member, Santa Clara Valley Water District Gary
ARIZONA CONSERVATION REQUIREMENTS. Management Plans MUNICIPAL CONSERVATION REQUIREMENTS
 ARIZONA CONSERVATION REQUIREMENTS Management Plans The Arizona Groundwater Management Code establishes the legal framework for conserving water in Arizona's most populous areas. To help achieve its goals,
VENTURA RIVER WATER DISTRICT (VRWD) Drought Update and Water Rate Changes
 Drought Update and Water Rate Changes") VENTURA RIVER WATER DISTRICT (VRWD) Drought Update and Water Rate Changes July 20, 2016 7:00 P.M. Oak View Community Center The District Must Be Revenue Neutral Background Drought Future Conservation Efforts
VENTURA RIVER WATER DISTRICT (VRWD) Drought Update and Water Rate Changes July 20, 2016 7:00 P.M. Oak View Community Center The District Must Be Revenue Neutral Background Drought Future Conservation Efforts
GENERAL ASSEMBLY OF NORTH CAROLINA SESSION 2011 SESSION LAW HOUSE BILL 609
 GENERAL ASSEMBLY OF NORTH CAROLINA SESSION 2011 SESSION LAW 2011-374 HOUSE BILL 609 AN ACT TO PROMOTE THE DEVELOPMENT OF WATER SUPPLY RESERVOIRS AND OTHER WATER SUPPLY RESOURCES, TO PROVIDE THAT FUNDS
PIMA COUNTY COMPREHENSIVE PLAN CO PIMA COUNTY REGIONAL COMPREHENSIVE PLAN POLICY MAJOR PLAN AMENDMENT
 PIMA COUNTY COMPREHENSIVE PLAN CO7-07-04 PIMA COUNTY REGIONAL COMPREHENSIVE PLAN POLICY MAJOR PLAN AMENDMENT Arizona law [A.R.S. 11-821(C)(3)] requires: Planning for water resources that addresses: a)
Cadiz Inc. Corporate Presentation November 2017
 Cadiz Inc. Corporate Presentation November 2017 Cadiz Valley 1,300 square-mile watershed in Mojave Desert. Aquifer system holds approx. 20 million AF, like Lake Mead. Natural recharge 32,500 AF/year. Cadiz
3.0 CUMULATIVE PROJECTS SCENARIO
 3.0 CUMULATIVE PROJECTS SCENARIO The CEQA Guidelines define cumulative impacts as two or more individual effects that, when considered together, are considerable or which compound or increase other environmental
Drought Contingency Plan
 for San Jacinto River Authority Highlands Division Prepared by San Jacinto River Authority Adopted: March 27, 2014 This page intentionally left blank. Table of Contents Table of Contents Section Page Section
Soquel Creek Water District s Groundwater Recharge Feasibility Study. Lydia Holmes
 Soquel Creek Water District s Groundwater Recharge Feasibility Study Lydia Holmes Soquel Creek Water District (SqCWD) Filename.ppt/2 Small beach community east of Santa Cruz 37,000 residents 100% reliant
Clean water. From nature.
 Clean water. From nature. Natural Treatment System Save water. Do your part. Did you know that over watering or a broken sprinkler on your property can contribute to ocean pollution? Excess watering creates
South Florida Water Management District Future Directions. Melissa Meeker, Executive Director
 South Florida Water Management District Future Directions Melissa Meeker, Executive Director September 15, 2011 District Overview Oldest and largest of five water management districts Covers 18,000 square
Frequently Asked Questions Updated July 17, 2015
 Frequently Asked Questions Updated July 17, 2015 1. What is California WaterFix? California WaterFix is a proposal backed by the administrations of Governor Edmund G. Brown Jr. and President Barack Obama
The Los Angeles Desalination Project
 DRAFT PROPOSAL The Los Angeles Desalination Project Author: Brian Nissen Company: Bella Machines www.bellamachines.com The Los Angeles Desalination Project CALIFORNIA WATER The California water crisis
Bob Jaques, Seaside Basin Watermaster Technical Program Manager. Gus Yates, Senior Hydrologist, Todd Groundwater
 6 April 2015 MEMORANDUM To: From: Re: Bob Jaques, Seaside Basin Watermaster Technical Program Manager Gus Yates, Senior Hydrologist, Todd Groundwater Groundwater Management Options and Recommendations
MEMORANDUM DEBBIE MALICOAT, DIRECTOR OF ADMINISTRATIVE SERVICES
 MEMORANDUM TO: FROM: CITY COUNCIL DEBBIE MALICOAT, DIRECTOR OF ADMINISTRATIVE SERVICES SUBJECT: CONSIDERATION OF SECOND AMENDMENT TO AMENDED AND RESTATED SOLID WASTE COLLECTION FRANCHISE AGREEMENT WITH
COUNTY OF SANTA BARBARA OFFICE OF THE AGRICULTURAL COMMISSIONER SANTA BARBARA SANTA MARIA LOMPOC SOLVANG CARPINTERIA
 COUNTY OF SANTA BARBARA OFFICE OF THE AGRICULTURAL COMMISSIONER SANTA BARBARA SANTA MARIA LOMPOC SOLVANG CARPINTERIA 2011 Permit Conditions for Shank Applied Metam Sodium/Potassium Permittee Name (printed)
U.S. Water Budget. Figure Source:Data from The Nation s Water Resources , Vol. 1, U.S. Water Resources Council.
 U.S. Water Budget Figure 10.18 10-9 Source:Data from The Nation s Water Resources 1975-2000, Vol. 1, U.S. Water Resources Council. Average U.S. Precipitation Figure 10.19 10-10 Source: U.S. Water Resources