REGIONAL HYDROPOWER POTENTIAL SCOPING STUDY
|
|
|
- Dominic Edwards
- 6 years ago
- Views:
Transcription
1 REGIONAL HYDROPOWER POTENTIAL SCOPING STUDY Prepared for the Northwest Power & Conservation Council November 2014 Submitted by the Northwest Hydroelectric Association
2 TABLE OF CONTENTS Summary of Key Findings Chapter 1: Non-Powered Dams Chapter 2: Conduit and Hydrokinetic Chapter 3: Pumped Storage Chapter 4: Tidal and Wave Energy Chapter 5: General Hydropower Assessments Chapter 6: Tools for Pre-Feasibility Assessment of Hydropower Potential Chapter 7: Legislative and Regulatory Environment Appendix A: List of Studies Reviewed Appendix B: Parameters of Studies Reviewed Appendix C: Support Tables
3 PACIFIC NORTHWEST HYDROPOWER POTENTIAL SCOPING STUDY SUMMARY OF KEY FINDINGS The Northwest Power and Conservation Council ( the Council ) in August 2014 sought to understand if the substantial new hydropower potential identified in several recent studies could be used to determine a reasonable, realistic estimate of regional hydropower potential capacity and generation. The intent of this report is to provide a preliminary analysis of the data included in those studies and to address whether the data is of sufficient quality to determine an identified hydropower potential for the region. The Northwest Hydroelectric Association (NWHA), as the contractor, added to the scope of work additional areas to be explored to better validate the hydropower potential that may be available for the next 20 year period for which the Council is planning. Those additional items included: a survey of utility and non-utility generators planning hydropower projects; a review of applications before the Federal Energy Regulatory Commission (FERC); and mapping of the Council s protected areas designation as compared to the U.S. Department of Energy 1 study landscape which identifies a very sizeable amount of potential hydropower for the Pacific Northwest available as run-of-the-river projects. Adding the survey and the FERC application review provides an opportunity to see not only what may be potentially available from the studies, but what is actually under current consideration by project sponsors for implementation in the near term. To affirm the location of the projects identified in the DOE study NWHA intends to provide a map of the proposed project reaches from the Department of Energy study developed by Oak Ridge National Laboratory as an overlay to the map from the Council s protected areas program stream reaches prepared by the Pacific States Marine Fisheries Commission in the StreamNet model format. The resulting overlay map will compare how the two sets of stream reaches correlate in location to better ascertain potential project capacity numbers more reflective of the region s regulatory process. This task is still ongoing due to the complexity of matching up the two systems polygons in an effective manner to produce that overlay, but it is anticipated the map can still be produced in November 2014 to make the comparison. Project Studies Reviewed A total of 24 studies developed from 2003 through 2014 were reviewed. Appendix A provides a list of the studies along with the date, author, contractor, document link and whether the study was national or specific to the Pacific Northwest. Appendix B provides the parameters or characteristics of each study as well as the model used for developing the study. The studies are classified in groups, including: 1 New Stream-reach Development: A Comprehensive Assessment of Hydropower Energy Potential in the United States, April 2014, Oak Ridge National Laboratory for U.S. Department of Energy Wind and Water Power Technologies Office. Page S-1
4 projects at existing non-powered dams; conduit and kinetic projects within canals, pipelines or other manmade conveyances; pumped storage/energy storage projects; tidal and wave energy projects; and general project assessments including a mix of projects. The studies identify a broad and varying range of hydropower potential for the Pacific Northwest. Many of the studies are based on physical and hydrologic potential and do not take into account screens for environmental attributes which could provide conflict with fish and wildlife and resource habitats. Some studies do not consider protected land use areas such as state and national parks or watershed landscapes, nor state and federal scenic water programs. None of the studies address the Council s protected area designations identified in its Fish and Wildlife program, 2 designed to ensure that new hydroelectric development is carried out in a manner that protects the fish and wildlife resources of the Columbia River Basin and the Pacific Northwest and does not further obligate the region s ratepayers for mitigation measures. There are hydropower projects identified in the studies that can be developed at existing diversions: projects at existing non-powered dams; conduit and kinetic projects within canals, pipelines or other manmade conveyances; additions to existing hydropower facilities; and some of the pumped storage or stored energy projects. These projects have a less significant impact on the region s rivers and streams as they do not require a new diversion and therefore are not subject to Council review under the protected areas designation. Relicensing of existing projects or the addition of generation to an existing hydropower facility are also exempt from the protected areas designation. This is important as a large number of Northwest streams are identified in the program because of regional commitments to fish and wildlife resources and environmental benefits. Hydropower projects that require new diversions from a river or stream within protected areas, as of the new October 2014 measures 3 for the Council s Fish and Wildlife Program, now allow an exception process under which the Council may consider a project with a run-of-the-river project at a new diversion from the stream. That exception process was not available in the prior version of the program. The process allows for a petition for an exception to the protected areas designation for proposed projects that will provide exceptional benefits to fish and wildlife. It is not presumed that because a project is may not be regulated under the protected areas that it is automatically deemed environmentally acceptable, as each project must be reviewed by a myriad of state and federal agencies for its impact on water quality, quantity, fish and wildlife and habitat resources, as well as land use and other parameters. Existing non-powered dams and conduit projects are subject to state and federal requirements for fish screening and fish passage in some cases. Projects located on water bodies that require new diversions or are not within or on existing manmade conveyance structures will require a higher level of standards to be met as set by reviewing agencies. The U.S. Department of Energy (DOE) funded the Oak Ridge National Laboratory study, New Streamreach Development: A Comprehensive Assessment of Hydropower Energy Potential in the United 2 3 Columbia River Basin Fish and Wildlife Program, Protected Areas: Columbia River Basin Fish and Wildlife Program, Pre-publication version 2014, pages : Page S-2
5 States, in April this year. 4 The assessment identified the Pacific Northwest region as having the highest amount of energy available from new hydropower potential of the 18 regions assessed nationally, 32% of the nation s identified supply. U.S. Department of Energy Secretary Dr. Ernest Moniz recently outlined the Department of Energy s goal of doubling U.S. hydropower by The release of the study as a resource assessment detailing new hydropower development potential launches a partnership with industry to develop a long-term vision, the next step in DOE s strategy aiming to increase the nation s access to hydropower. The Department s visioning process for 2025 will result in a number of tools being developed, including cost estimating procedures and regulatory approaches. At the same time the Hydro Research Foundation 5 has been commissioned by the Oak Ridge National Laboratory to identify technology and policy innovations and on-line technology resources, such as an on-line searchable technology catalog, and improved tools for pre-qualification of sites and feasibility to reduce costs and barriers and enable more hydropower deployment. The amount of capacity identified within the assessment for the Pacific Northwest region is 25,226 megawatts (MW) of capacity and 148,999,000 megawatt hours (MWh) annually in energy production, at a capacity factor of 67%. The capacity of 25,226 MW is equal to 76% of the region s existing hydropower capacity. The undeveloped energy calculated for the region from this study equates to 118% of the region s existing energy produced from hydropower. The methodology used is targeted at a higher reconnaissance level designed to calculate the potential from run-of-the-river projects, those not sited at existing diversions. As a result, it is anticipated that many of the identified projects may not be able to be developed without exceptional benefits to fish and wildlife in the region if they are located within the Council s protected areas designation as identified by the current map. 6 See Chapter 5 for a more thorough discussion. NWHA has analyzed the studies listed in Appendix A that propose hydropower projects in the Pacific Northwest region. The review identifies which studies contain projects that can be successfully developed without impact to the protected areas designations because they incorporate an existing diversion from the stream or do not require a diversion to implement. The studies are grouped by the type of hydropower project technology and summarized in chapters detailing each project type: Chapter 1 - adding power to existing non-powered dams; Chapter 2 developing generation within or at the end of existing conduits (pipelines or canals) or other manmade conveyance structures constructed for water delivery systems for irrigation, domestic water supply and wastewater treatment; or kinetic energy projects not requiring a diversion structure, placed in either manmade conveyances or in streams; Chapter 3 pumped storage with or without reservoir storage facilities; Chapter 4 - tidal and wave energy projects in rivers and the Pacific Ocean; Chapter 5 - general project assessments that provide a variety of projects, both run-of-the-river with no existing diversion, as well as some of the projects mentioned above Chapter 6 provides a review of six existing tool sets that can be used to define project parameters as a pre-feasibility tool Chapter 5, Study E-1, U.S. Department of Energy, April 2014 Hydro Research Foundation ( Northwest Power and Conservation Council Fish and Wildlife Plan, Protected Areas StreamNet map Page S-3
6 The various hydropower technologies provide a renewable resource without fuel and without greenhouse gas emissions, but pumped storage, as described in Chapter 3, is a technology that can provide additional benefits to the region. Ancillary benefits include storage capacity and transmission benefits, including load balancing, frequency control and reserve generation capacity. This type of energy storage project can firm the variability of non-dispatchable renewable power resources, such as wind and solar power energy. Pumped storage projects are able to absorb excess load at times of high output and low demand. The value of using pumped storage to balance and integrate with wind energy output offers maximum flexibility to resolve the challenge of wind integration and restoration of operational flexibility on a more immediate basis to the Federal Columbia River Power System. The region has one existing pumped storage facility and as the FERC applications confirm, others are in the planning stage. Additional Supply Identification To firm up numbers addressed in all of the studies reviewed, as well as to identify projects in current planning not identified within the studies, NWHA has provided two additional components to this report: 1) review of existing Federal Energy Regulatory Commission (FERC) applications as provided in tables in Appendix C; and 2) the development of a survey provided to project developers, both utility and non-utility generators, to assess pending projects. The survey and the results are detailed in Appendix C. NWHA pulled all of the applications for the Pacific Northwest states from the FERC records as of September Those records were then divided into tables showing each type of hydropower technology and include project proposed capacity and energy figures. The tables provide a picture in time of what is being studied or recently approved for construction. The tables are defined by pending and issued applications. Issued permits and approvals provide a more near-term review of potential hydropower development as the developer has moved past the original preliminary feasibility period to a period of specific studies and planning to implement a project. NWHA also pulled data from FERC which identifies some of the incremental or upgrade hydropower projects in process which have received federal tax credits. Those projects are enhancements adding generation to existing projects and are summarized in Appendix C as Table 8. Second, NWHA conducted a survey of northwest generators, both utilities and non-utility producers, to ascertain their plans for future hydropower development. The questions for which responses were sought are identified in Appendix C. In addition to individual entity responses NWHA received information from the U.S. Bureau of Reclamation (Reclamation) regarding proposals that are now in progress on their non-powered dams or canal systems outside the Federal Columbia River Power System (FCRPS). NWHA did not query the federal agencies for specific information regarding the FCRPS system in its survey process as the Council staff derives direct information from the federal entities operating the system. Reports from some state agencies approving water rights for development of hydropower projects were also provided as a result of the survey. In some cases the responder asked for anonymity, especially if an application had not yet been filed with FERC and identifying the site could result in competition or other issues. Appendix C compiles all the potential projects identified by source: from the studies reviewed, from current FERC records and from the survey conducted by NWHA. Numbers derived from those tables are Page S-4
7 then correlated to develop a range of potential future power available within the next 20 year period for which the Seventh Power Plan addresses regional resources. Environment for Additional Hydropower Generation Legislative and Regulatory Environment An array of federal legislation and pending regulatory approaches that will affect operation and development of the hydropower system as well as other energy resources is important for the region s ability to produce additional hydropower. Chapter 7 provides a discussion of two major pieces of legislation enacted by the U.S. Congress in 2013 that significantly streamline the process for conduit exemptions, raise the capacity limitation for exempt projects (those at existing diversions) and provide for a pilot process for an expedited two-year license term for other projects that require a full licensing process. The third major piece is a rulemaking by the Environmental Protection Agency (EPA) requiring significant reduction in coal plant emissions to promote cleaner and more efficient alternative energy solutions. The Sixth Power Plan indicated that 85% of the carbon dioxide from the regional power system was from coal operation emissions as of the Plan s adoption in Reducing and replacing half the existing coal-fired generation serving the region with efficiency measures and renewable energy generation could reduce the carbon emissions to 18% below 1990 levels, the plan related in one of its scenarios. The Sixth Power Plan indicated that a fixed carbon price of $45 per ton has a similar effect on carbon emissions as retiring half of the existing coal-fired generation. Either strategy, the plan stated, would meet carbon reduction targets for 2020, with more certainty in meeting the target provided by coal plant retirement. In addition, both the Corps of Engineers and the Bureau of Reclamation, whose major hydroelectric projects are the core of the Federal Columbia River Power System, have been encouraged by the U.S. Department of Energy and Congress to cooperate with non-federal developers in adding power to any non-powered dams both in the region and nationally. The Bureau of Reclamation has developed a Lease of Power Privilege (LOPP) agreement process to allow non-federal development on its facilities. The Corps recently issued a Section 408 approval process for non-federal development on its facilities. In addition to non-powered dams, federal facilities such as canals and levees provide infrastructure for further hydropower development. Potential Hydropower Supply from Studies Reviewed Each chapter identifies project sites or stream reaches in the Pacific Northwest that may provide future hydropower potential, as referenced in Figure 1. TYPE OF PROJECT NO. OF PROJECTS CAPACITY (MW) ENERGY (MWh) Chapter 1: Non-powered Dams , Chapter 2: Conduit and Hydrokinetic , Chapter 3: Pumped Storage 8 6, , Chapter 4: Tidal and Wave Energy Chapter 5: General/Multiple Type Assessments - 40, ,792, Figure 1.0: Study Potential in the Pacific Northwest Page S-5
8 For chapters 1, 2 and 3 projects were identified specifically enough to calculate the capacity and energy shown in the chart. Chapter 1: non-powered dams Chapter 1 identified non-powered dam sites and includes detailed information which in some cases allows cost to be determined. The studies developed by the Bureau of Reclamation (A-3, B-5 and B-6 appearing in Chapters 1 and 2) are more specific and include some cost information and provide tools for addressing feasibility that could be applied to other projects. Study A-3 (Chapter 1) provides a Hydropower Assessment Tool that enables a developer to determine a preliminary cost and also addresses identifying annual operation and maintenance costs. The cost estimates from the study apply primarily to existing non-powered dams. The Bureau of Reclamation LOPP process table identifies a few projects which are actually in progress as the developer has begun the agreement process with Reclamation and/or has filed a FERC application (see FERC tables in Appendix C). These projects are the most likely to move forward in the near future. Both the Army Corps of Engineers and the Bureau of Reclamation have been encouraged by the U.S. Department of Energy and Congress to actively offer the opportunity to developers to seek cooperative agreements with the agencies to add power to nonpowered dams. Chapter 2: conduit and hydrokinetic projects Chapter 2 identifies conduit and hydrokinetic projects which do not require a new diversion structure. These projects are located at specific sites and may likely be developed over the next 20 year period if financial conditions can be met. The conduit exemption process regulated by FERC is based on a newer technology approach of adding or inserting generation equipment within conveyance structures. This type of project has begun to be developed in the region within the last five years using manmade conveyance structures in irrigation, water supply and wastewater systems. The projects within water supply and wastewater systems are smaller in size, generally less than 100 kw capacity and up to 250 kw capacity. The City of Portland has developed a number of small projects within its municipal drinking water system recently, as an example. The conduit exemption projects within irrigation districts tend to be larger in capacity due to the size of piping and water flows. Central Oregon irrigation districts have developed several of these projects within the last five years with pipelines varying from 36 diameter to 120 diameter with energy generation from.75 MW to 5.0 MW generation. Recent Congressional legislation has streamlined the process for these project so that they can be approved in 6 months or less generally. Chapter 3: pumped energy storage In Chapter 3 the overall studies showed some very high totals for the region, but the experienced consultants authoring Chapter 3 were able to address the studies and select the most viable projects. Table 2.0 in Chapter 3 provides an estimate of the potential. The energy total reflects reserved energy instead of gross energy. The FERC application numbers in Appendix C show gross energy and overestimate what will be available from the project as net energy as a portion of the energy generated is needed to run reverse pumping required by the technology. Chapter 4: tidal and wave energy The tidal and wave energy total from Chapter 4 was taken from the Georgia Tech study, which was the only study to show total capacity by state. The other studies were a reflection of the total ocean potential along the West Coast. The Georgia Tech study did not indicate the energy component for the capacity identified. The tidal and wave energy technology is very new and most of the projects Page S-6
9 proposed in the region are pilots to determine feasibility and demonstrate new equipment models. At this point three earlier projects that are addressed in Chapter 4 appear to have been abandoned for the time being. The East River project in New York, one of the very first completed, failed; but it is in the process of being replaced with the use of a newer equipment technology. Chapter 5: general assessments of hydropower The general assessments include all types of hydropower technologies. These numbers reflect a very high range of what can be developed. The 2014 study developed by Oak Ridge National Laboratory for the U.S. Department of Energy is the newest analysis (2014) of general project data; the projects would be run-of-the-river, creating new diversions from a water body. Overlaying this study with the protected areas map (in development) will be critical to determine how viable projects on the enumerated stream reaches may be. The mapping project may also be helpful in reaching a preliminary decision on the viability of other projects within the general assessments that are not at existing diversions. Feasibility of Potential Hydropower Supply Identification from Studies The Council requested a determination as to whether there is enough information in the studies to identify the power potential in the Pacific Northwest over the next 20 year period of the Seventh Power Plan. The answer varies among studies, based on the components addressed in each of the studies. The studies reviewed and summarized in this report were developed over the last decade by a wide variety of entities ranging from national laboratories to consulting firms working for government and private entities. The criteria used to develop each study, the hydrologic data and the topographic information available to predict new and upgraded hydropower capacity, varies in quality and specifics. Studies that provide the most factors (cost; protected lands; fish, wildlife and habitat sensitive areas and other components as listed in Appendix B) at specific site locations provide the highest level of probability. Other studies, such as the general assessments in Chapter 5, are often not site specific enough to make a determination. While they provide information regarding sensitive areas, there is the need for matching up the results with the protected area designations as some of the studies are based on flow and hydraulics of river stretches versus sites. In the mid-1980s NWHA developed a study for the Bonneville Power Administration that sought to identify a very defined range of specific components for each project that had a preliminary permit 7 as the need for power in the early 1980s drove power sales agreement prices to a level that resulted in a substantial number of hydropower projects identified in applications to FERC. The process required talking to the proposing developer by telephone to complete fields for sensitive species and lands, cost, timing for development, etc. That is the kind of process that would need to be undertaken by Council staff or their designate to further verify which projects may be viable in the near future and whether they can meet regulatory requirements and cost-effectiveness. Potential Hydropower Supply from FERC Applications and the NWHA Survey While the information from the studies varies in determination of viability at sites which may be developed within the near future, the information provided by actual FERC applications (see Appendix C, 7 Status of New Hydroelectric Development Costs and Seasonality by the Northwest Hydroelectric Association for the Bonneville Power Administration, Contract DE-AC79-84BP16229, 1984 Page S-7
10 Tables 1-8) is more reliable in that some preliminary analysis and studies have been conducted at specific sites (Figure 2.0). Review of FERC Applications Federal Energy Regulatory (FERC) Tables Identification of applications in process PROJECT TYPE TABLE NO. OF STATUS CAPACITY ENERGY PROJECTS (MW) (MWh) Conduit Exemptions 1 9 Issued ,837 Conduit Exemptions 2 11 Issued ,000 Licensed Marine 3 2 Issued ,500 Conventional Hydro - Permits 4 2 Pending ,870 Conventional Hydro - Permits 5 22 Issued ,436 Conventional Hydro - Licenses 6 9 Pending ,952 Pumped Storage - Permits 7 9 Pending 7, ,123,686 TOTAL 64 7, , Figure 2.0 FERC Applications Issued Conduit Exemptions Projects approved by FERC and project development can be underway, including Applications filed before the new legislation (chapter 7) requiring exemption permit (Table 1) Applications filed after legislation enacted in 2013requiring only a notice of intent (Table 2) which must be 5 MW or less capacity; conduit exemptions more than 5 MW and up to 40 MW must file an exemption permit) Conduit exemption projects are those with generation equipment within or at the end of canals, pipelines, ditches and other man-made conveyance structures that as their primary purpose supply water to agriculture, municipal or industrial purposes, as required by FERC. Permits (Tables 4, 5 and 7) A preliminary permit allows a 3 year study period for project planning purposes; potential extensions are available under approved circumstances for up to 4 years. Licenses (Tables 3, 6) Licenses are awarded after necessary studies and public process are completed, generally after the permit stage, although it is possible to start at the license level without applying for a preliminary permit. Once a license is awarded, then construction can begin. FERC listing of tax credits for project upgrades (Table 8) See tables 1-8 in Appendix C for project site lists. Page S-8
11 Survey of Hydropower Potential In addition to reviewing FERC applications, NWHA conducted a survey over 30 days time requesting a broad range of utilities and non-utility developers to identify imminent hydropower projects. A copy of the survey is located in Appendix C. The information from the survey was self-reported and identifies a number of projects of various types. The information could be further validated identifying higher potential with the ability to seek more detailed information from each respondent and to follow up with those potential generators not responding to the survey. Refer to Table 9 in Appendix C which lists the projects individually. Summary of Hydropower Estimates Supply Estimate Table A on pages S-14 and S-15 represents a reasonable estimate of the projects that may be developed over the next 20 year period. The theoretical future hydropower potential for the Northwest appears to be in range of 3,200 MW capacity with an annual 23 million MWhs of energy production. Table A lists the projects that are included in that capacity. This project list represents projects from the studies, from the NWHA survey and from FERC (Federal Energy Regulatory Commission) applications, often from two or more of those sources. These are the projects that appear to be either more readily available in time (such as conduit projects), have utility commitment as planned upgrades, or are projects that appear to be into the licensing process from existing information available. See pages S-16 and S-17 for further explanation of the determinations. Cost Estimates The diversity of the types of hydropower development as well as the specifics for each project based on their siting makes it difficult to assign a specific configuration or unit price. However, a number of the studies reviewed make an attempt to define cost within certain parameters. Non-powered Dams Study A-1 provides cost estimates derived from the Idaho National Engineering and Environmental Laboratory (INEEL) 2003 study Estimation of Economic Parameters of US Hydropower Resources and from the Bureau of Reclamation 2011 study Hydropower Resource Assessment of Existing Reclamation Facilities. Costs were then indexed to 2012 based on applicable indices from the Civil Works Construct Cost Index System (CWCCIS) and from ENR s skilled labor index. Those costs include the full range of developments costs as well as annual operation and maintenance costs. Costs include construction, non-structural development costs such as permitting and land rights, generation equipment, fish and wildlife mitigation and water quality monitoring. Operation and maintenance costs include fixed and variable operational costs, FERC annual charges, insurance, taxes, management and major repair costs. The study provides a number of parametric equations for determining direct costs. Although costs were not determined for each of the projects defined in the Northwest, the five projects listed on page 2 of Chapter 1 are the top 5 projects identified in this region by the study author. Of those 5 projects, only the Howard Hanson Dam was determined to be highly feasible. Costs were not identified for each of the sites listed, but formulas and models could be used to determine costs of individual sites as described in the study. Page S-9
12 Study A-2 did not provide costs. Study A-3 identifies 13 sites in the Northwest with a benefit cost ratio greater than.75, making them feasible according to the study authors. The cost per kw of capacity ranges from $1,889 to $5,075 per kw. An average for the 13 sites in region is $3,518 per installed kw of capacity. The annual O&M for all sites identified in the Pacific Northwest (34 sites) ranged from $1,889 to $32,368. View the table on page 5-34 of the study for O & M cost analysis. Based on the studies reviewed for non-powered dams, the average cost per kw of capacity falls into the $3,500 per kw range. Conduit Projects Conduit projects (generation within or at the end of a manmade conveyance structure) are difficult to define from a cost perspective because there are other indirect benefits that skew the cost/benefit ratio if only the capital costs and power sales agreement revenues are considered. Many of the projects recently completed or in process will provide considerable water conservation benefits. Some of the project developers have dedicated the conserved water instream to provide fish and wildlife, water quality and scenic values. In some of those cases, non-profit or government entities defrayed project expenses by providing some funding to support the transfer of water to instream benefits. This is primarily a process that occurs in Oregon based on incentive programs provided by state lottery funding and state and federal programs, such as the Bureau of Reclamation s water conservation programs. The generation facility added to an irrigation district s water infrastructure may cost $2 million for a 1 MW capacity project, based on two recently developed projects in the Deschutes River Basin in Oregon. However, the pipeline necessary to pipe an open canal for 3-5 miles to use the water pressure for generation and to conserve water both for the irrigation district s patrons as well as providing water for instream benefits, may cost in the range of $10 million. Some of the costs should be attributed to the district s conveyance system and some to public benefit for water supplied instream. As a result, it is difficult to determine the cost without separating the benefits. The figures provided in the studies do not make that kind of assessment. Study B-1, resulting from the U.S. Department of Energy support provided to the Oak Ridge National Laboratory, provides a software tool to consistently evaluate the energy and economic feasibility of potential hydropower sites. The ORNL-Hydropower Energy and Economic Assessment (HEEA) Tool (Version 1.0) is an excel workbook with embedded macro functions programmed in Visual Basic using Microsoft Excel That tool was used in this basin assessment as a model and continues to be enhanced for future use. The Deschutes River Basin in Oregon was used as a pilot area to develop the tool. The study analyzed 6 non-powered dams as well as a number of conduit exemption projects. The 6 non-powered dams are also listed in study A-3 above. The other sites reviewed are conduit projects. A total of 15 conduit sites were modeled and estimates of cost were provided based on a kw of capacity. The cost per kw installed ranged from $2,140 to $11,867, with an average of $4,391. Costs included site preparation, licensing and civil works, transmission, environmental indicator mitigation, and land and water rights. The costs are defined as the overnight development costs. Those costs do not include financing or cost escalation during construction. The tool used in the study does include interest during construction, escalation/inflation factors and the discount rate of capital. Annual operation and maintenance costs are also addressed, including the cost of equipment replacement. Potential revenue was derived from the base price projection of the Council s Sixth Power Plan and state-level electricity prices from the EIA (Energy Information Administration). Green incentive benefits are included from federal and state resources. Although GHG (greenhouse gases) Page S-10
13 would be avoided, since there s no carbon market in Oregon, no value was assigned. Study B-2 is a precursor to study B-1 and provides no additional cost information. Study B-3 provides a range of potential costs for conduit projects. The costs identified in that study include equipment, installation, permitting, interconnection, design and other fees. A sample project with output of 968 kw capacity with a cost of between $5,362,500 to $9,418,750 has a cost benefit ratio of.333 to.586, dependent upon final project cost between the two figures. Taking an average cost between the two results in an average cost of $7,634 per kw installed capacity. Study B-4 only includes equipment and installation costs. Based on 2009 costs, conduit projects range from $5,000-10,000 kw average. Studies B-5, B-6 and B-7 have no costs based on actual projects. Based on the studies in Chapter 2 for conduit projects, the costs average in the range of $5,000-7,500 per kw. Each site is fairly specific to site requirements so there is a broad variation in costs and the costs include development of conveyance infrastructure in addition to the energy component. Pumped Storage Projects The projected costs for pumped storage range from $1800 kw to $3500/kW of installed capacity. This range is driven by tunnel lengths, the overall head, the amount of above ground civil infrastructure required and the variable speed technology for the pump/turbines. See Chapter 3 for discussion. Based on study reviews, the cost of pumped storage projects is $1800 to $3500/kW of capacity. Tidal and Wave Energy Projects No costs were provided in any of the studies reviewed for tidal and wave energy projects. The technology is new and there have been no successful installations in the Northwest. General Project Assessments Studies E-1 and E-2 did not include cost information, nor did studies E-4, E-5 or E-6. Study E-7 is not relevant as it is based on 2002 prices. Study E-3 of Oregon irrigation district potential projects resulted in costs ranging from $1,571,419 to $19,750,000 per project for.10 to 2.5 MW installed capacity. The cost per kw ranged from $2,487 to as high as $21,062 kw. The average was $8,464 per kw with many projects in the $3,000-9,000 range. But again, the major cost in these projects is the pipeline infrastructure necessary to conserve the energy and water benefits. Costs in the study included pipeline installation, interconnection, civil construction and equipment, design, permitting, and land use siting. The only mitigation costs included were for fish screening of diversions where necessary. Revenue and Financing Environment The Northwest has been favored in having the flexibility, efficiency and lower cost afforded from a hydropower system with emission-free and abundant renewable energy as its source of electricity. While capital costs may be high for some projects, the life of hydropower projects as compared to other Page S-11
14 renewables is extremely long. Some facilities in the region have operated over 100 years. The ability to provide generation using existing facilities--non-powered dams, pumped storage at existing reservoirs, and conduit generation within existing water delivery systems provides effective alternatives for thermal projects. There is no fluctuating fuel cost for hydropower production. Developing a comparison among generation projects needs to take into account the long project life and the lack of fuel costs in a more complete strategy. Currently the cost of energy produced by a natural gas-fired generation facility drives the revenue new hydropower facilities can obtain in a power sales agreement (PSA) from a utility when projects are developed by non-utility generators. As a result low gas prices result in higher capital cost hydropower projects sitting on the shelf awaiting a viable revenue stream to begin construction. As gas prices rise, since natural gas-fired generation has become the Northwest surrogate for developing PURPA pricing as the basis for PSAs, prices will rise allowing for a higher investment in the capital necessary to develop additional renewable energy production from the hydropower resource. Given federal proposals to cut carbon emissions, if the region were to incorporate a value for displacement of emissions, the potential to enlarge the existing hydropower system in an environmentally sound approach would provide more opportunities for financing hydropower projects identified in the studies as well as other renewable energy production. Study A-1 (Chapter 1) developed by the Hydropower Analysis Center of the U.S. Army Corps of Engineers uses a formula for the Pacific NW Region to show the environmental and cost benefit associated with hydropower generation in avoiding emissions from greenhouse gases generated by fossil fuel resources. The EPA egrid 9 th edition of 2010 ( is a comprehensive database of environmental attributes of electric systems, incorporating data from several federal agencies. One of the fields of data in the egrid chart is emission rates for 26 egrid subregions. The WECC Northwest egrid subregion as of 2010 shows the annual total output emission rates for this region. The output emission rates are shown as: 1, lb/mwh of carbon dioxide lb/gwh of methane lb/gwh of nitrous oxide The annual total output emission rates for greenhouse gases (GHGs) can be used as default factors for estimating GHG emissions from electricity use when developing a carbon footprint or emission inventory. Both the earlier 4 th Power Plan and study A-3 attempted to calculate a rate for incentivizing the reduction of GHGs. Existing renewable portfolio standards (RPS) developed by some of the Northwest states promote renewable acquisition and development of hydropower projects as do a number of incentive programs developed by the Northwest states. It is difficult to make a financial determination as to the value of incentive programs generally, but study A-3 (Chapter 1) provides an analysis of benefits by state and by federal program. Supply Curve Information provided in the studies does not indicate completion dates for projects. Some information was provided in the survey but there is not adequate information supplied to determine a supply curve based on a timeline. While there is some cost information for future potential hydropower, even the Page S-12
15 small conduit projects with little impact will not go forward without a structural marketplace that provides benefit for the advantages of hydroelectric power: Long plant life No greenhouse gas emissions Provision of stability in balancing other renewable resources No fluctuating fuel cost The current marketplace is dominated by a gas-fired generation base that doesn t promote an adequate pricing structure to develop hydropower components effectively given the upfront capital costs. With the current pricing structure, utility upgrades and some small projects may move forward but the supply capability is not predictable given the current environment. Page S-13
16 Potential Hydropower Anticipated November 2014 Non-Powered Dams Capacity Generation FERC No Study Date Developer State Project Information River MW MWh # Opr. Identified in Survey and FERC Applications Tongue River Dam P N/A State of Montana, DNR MT Add capacity Ruby ,344.0 Gibson Dam P Tollhouse Energy/Greenfield I. MT New project at existing dam Sun ,217.0 Mason Dam P N/A Baker County OR New project at existing dam Powder ,100.0 Pinto Dam P GCHPA* WA New project at existing dam Columbia ,700.0 Warmsprings Dam Hydro P N/A Warmsprings Irrigation Distric OR New project at existing dam Malheur ,442.0 Studies A-1, A-2, A-3 & FERC Applications McKay Dam P A-3 N/A McKay Dam Hydropower OR New project at existing dam Umatilla ,400.0 Howard A. Hanson Dam P A-1, 2 N/A Howard A. Hanson Power, LLC WA New project at existing dam Green ,000.0 Scooteney Wasteway P A GCHPA WA New project at existing dam Columbia ,480.0 Easton Diversion Dam P A-3 N/A Qualified Hydro 15 LLC WA New project at existing dam Yakima ,000.0 Blue River Dam P A-1 N/A Qualified Hydro 15 LLC OR New project at existing dam Blue ,565.3 NON-POWERED DAMS POTENTIAL 10 Projects: ,248.3 Conduit Exemptions & Hydrokinetic Projects Studies B-1 and B-2 B-2 N/A Various irrigation districts OR 4 Conduit projects Deschutes ,508.0 Study B-3 B-3 N/A Various irrigation districts OR 2 Conduit projects Deschutes ,172.0 Stiudy B-5 B-5 N/A Various canal sites NW 111 Conduit projects NW Rivers , Survey Responses SR N/A Various canal/pipeline sites NW 15 Conduit projects NW Rivers ,918.0 Hydrokinetic Demo Project SR 2015 Hydrokinetic unit in canal WA 1 Hydrokinetic conduit project Yakima 0.01 N/A FERC apps. Issued FERC N/A Approved projects/canals NW 7 Conduit projects NW Rivers ,433.0 FERC approved NOIs FERC N/A Approved projects/canals NW 3 Conduit projects NW Rivers ,480.0 CONDUIT EXEMPTIONS AND HYDROKINETIC PROJECTS 143 Projects: ,107.8 Pumped Storage Projects John Day Pool C-2 N/A Klickitat PUD WA Pumped storage Columbia 1, ,000.0 Swan Lake C-2 N/A EDF Renewable Energy OR Pumped storage Klamath ,000.0 Banks Lake SR 2019 *Grand Coulee Hydroelectric WA Pumped storage Columbia 1, ,084.0 Power Agency (GCHPA) PUMPED STORAGE PROJECTS 2, ,084.0 SR: Survey S-14 Table A Tidal and Wave Energy
17 Potential Hydropower Anticipated November 2014 No identified projects at this time General Assessments Capacity Generation FERC No Study Date Developer State Project Information River MW MWh # Opr. Identified in Survey and FERC Applications Various canal or small reservoir E-3 N/A Various irrigation districts OR 30 Conduit exemptions Oregon Rivers ,852.0 Oak Springs SR N/A Oregon Dept. Fish/Wildlife OR Exemption at existing diversion Deschutes Unidentified Location SR N/A Portland General Electric OR New traditional project Clackamas ,210.0 Identified in FERC Applications only Go with the Flow P FERC N/A Go with the Flow Hydropower OR Traditional hydro exemption Umatilla Weiser-Galloway P14608 FERC N/A Idaho Water Resources Board ID Traditional hydro project Weiser ,000.0 Two Girls Creek P FERC N/A Green Volt Hydro Inc. OR Traditional hydro Two Girls Creek ,870.0 GENERAL ASSESSMENTS 35 Projects: ,947.0 Upgrades These projects were identified in the survey: Blind report as requested SR 2020 Unidentified utility WA Add equipment NW N/A Box Canyon Dam P-2042 SR 2017 Pend Oreille PUD WA Add equipment Pend Oreille ,300,000.0 North Wasco PUD Plant P-7076 OR 2018 North Wasco PUD OR Add capacity at Dalles Dam Columbia ,800.0 Shoshone Falls P-2778 ID 2022 Idaho Power Company ID Add capacity Snake N/A Blind report as requested SR 2015 Unidentified utility WA Add energy NW ,000.0 Grand Coulee Dam SR Bureau of Reclamation WA Add units Columbia N/A Boundary Dam SR Seattle City Light WA Add equipment Pend Oreille , Packwood Lake Hydro SR 2015 Energy Northwest WA Add energy Cowlitz ,808.0 Black Canyon Dam SR 2018 Bureau of Reclamation ID Add third unit Payette N/A Hungry Horse Dam SR Bureau of Reclamation MT Replace turbines/efficiency Flathead N/A Lower Baker SR N/A Puget Sound Energy WA New powerhouse N/A Little Falls SR Avista Corporation WA 4 new units Spokane , Nine Mile SR 2015 Avista Corporation WA Upgrade Spokane ,040.0 Palisades Dam SR 2016 Bureau of Reclamation ID Replace turbines +7.5 efficiency Snake N/A 14 Projects: ,464,168.0 TOTAL OF ALL PROJECTS OF EACH TECHNOLOGY: 3, ,301, SR: Survey S-15
18 Explanations for Table A Non-Powered Dams The non-powered dams listed are those that were identified in the NWHA survey or as one of the priority projects in studies A-1, A-2 or A-3 (Chapter 1). In addition, all of these projects are active in the FERC application process and have the potential to be completed within the next 5 to 10 year period. Some of the projects result in agreements with the Bureau of Reclamation under an agreed upon Lease of Power Privilege (LOPP) which allows private development at a federal facility. Other projects on the list of non-powered dams at page 1-2 in Chapter 1 are not on FERC application lists or were not advised to be moving forward in the near future by a survey respondent. Potential: 10 Projects MW Capacity 148,248.3 MWhs Energy Conduit Exemptions and Hydrokinetic Projects Projects on the Potential Hydropower List were identified by study developers as viable sites with a higher potential for a positive cost/benefit ratio. These are all projects within canal systems with minimal environmental impacts. Some projects are underway now and will be completed in Others could be easily completed within 5 years or less, depending upon power sales agreement pricing that supports financing. Some of the projects have or are completed LOPP agreements with the Bureau of Reclamation. These projects are moving forward as they are able to often secure green credits from federally funded state water quality revolving funds for green projects or other incentives. The previously developed conduit projects in Oregon have resulted in reducing the districts water rights and placing that amount of water back into the river system as an instream water right with an early priority date in exchange for support of funds to purchase pipe and replace open canals with a closed delivery system. See Chapter 2 for tables identifying the projects and the FERC tables in Chapter 8 (Tables 1 and 2). Potential: 143 Projects MW Capacity 226,107.8 MWhs Energy Pumped Storage Projects While there are 8 pumped storage projects with FERC applications, only 3 of the projects have made significant process in moving forward with studies and review, as depicted in Table A and Chapter 3. Two are to complete their draft license application in 2015 (John Day Pool and Swan Lake); the Banks project is anticipated to be completed and on line by Completion of the projects will be determined upon the basis of achievable power sales agreements that support financing, or with the provision of other incentives. The energy total from the projects is reduced to net energy, based on the need to use some energy for reverse pumping operation. Potential: 3 Projects 2,640 MW Capacity 33,084.0 MWhs Energy Tidal and Wave Energy Projects There appear to be no current FERC applications that have not been withdrawn for tidal or wave energy projects in the Northwest. There is a potential demo project that may move forward, discussed in Chapter 4. The technology for tidal and wave energy projects is developing and there may be a number of projects within the next 20 year period. Currently there is not enough information to identify those projects. Page S-16
19 General Assessments It is difficult to determine the amount of power available from the general assessments in Chapter 5 because specific projects sites are often not identified. NWHA has requested a map that will show where the protected areas overlap the stream reaches identified but more information will be required to determine the amount of the power potentially available from studies E-1, E-2, E-5, E-6 and E-7. All of the Oregon small irrigation district projects identified in E-3 are included as they have little impact and can be developed with green incentives in the near future. Study E-4 is a review of water rights that could eventually lead to project identification but only calculates potentially available water rights within investor-owned utility service areas. Potential: 35 Projects 89.7 MW Capacity 429,947 MWhs Energy Upgrades to Existing Projects The listed upgrades in Table A were reported by the utility or entity owner. Not all of the respondents advised the amount of energy that would be added from the upgrades so the number represented below is lower than it would be with the additional information. Table 8 in Appendix C lists tax credits for upgrade projects that have been awarded to Northwest dam owners. The information does not contain dates when construction will or has taken place and although the chart is dated August 31, 2014, some of these tax credits go back to 2005 and may have already been applied to projects completed as well as being applicable to future projects. With more investigation, additional generation might be identified. Potential: 14 Projects MW Capacity 1, MWhs Energy TOTAL POTENTIAL FROM ALL HYDROPOWER TECHNOLOGIES AS REPRESENTED ON THE CHART: Potential: 3, MW Capacity 2,301, MWhs Energy *Where projects were duplicated within more than one study or more than one FERC application list, they were counted only one time in the above numbers. Page S-17
20 CHAPTER 1 NON-POWERED DAMS There are more than 80,000 non-powered dams (NPDs) in the United States, dams constructed in the past without the inclusion of energy generating equipment. In contrast, 2,500 powered dams provide 100 GW (gigawatts) of power: 78 GWs of conventional hydropower and 22 GWs of pumped-storage hydropower. 1 As many of the environmental impacts and capital costs of construction have already been addressed in building these facilities, adding hydropower provides an opportunity to produce additional power at a lower installed cost, with more limited environmental impacts and business risks, and within a more expedited time frame. The following studies were reviewed in addressing potential in the Northwest 2 for adding generation to the non-powered dams, as identified in Appendices A and B: A-1 Hydropower Resource Assessment at Non-Powered USACE Sites U.S. Army Corps of Engineers July 2013 Prepared by the Hydropower Analysis Center of USACE A-2 An Assessment of Energy Potential at Non-Powered Dams in the United States U.S. Department of Energy, Wind and Water Power Program April 2012 Prepared by Oak Ridge National Laboratory A-3 Hydropower Resource Assessment at Existing Reclamation Facilities U.S. Bureau of Reclamation March 2011 Prepared by Power Resources Office, Bureau of Reclamation, Department of the Interior The three studies identified the following potential hydropower capacity at NPDs in the Pacific Northwest 3 : Study A MWs of capacity 168, MWhs Study A MWs of capacity 871, MWhs Study A MWs of capacity 106, MWhs 1 Study A-2 2 For the purpose of this report, all of the state of Montana is included in the Pacific Northwest, even though the BPA service area includes only western Montana; many of the studies in this report present analysis on a state basis. Page 1-1
21 Total potential identified: The capacity identified includes these specific projects: Study Project Name State Capacity (MWs) Generation (MWhs) A-1 Blue River OR , A-1 Cottage Grove OR , A-1 Fern Ridge OR , A-1 Hiram M. Chittenden Locks & Dam WA , A-1 Howard A. Hanson Dam* WA , A-2 Howard A. Hanson Dam (not included in total)* WA [26.3] [101.62] A-3 Arthur R. Bowman Dam OR , A-3 Easton Diversion Dam OR , A-3 Sunnyside Dam WA , A-3 Scootney Wasteway WA , A-3 Emigrant Dam OR.733 2, A-3 Wickiup Dam OR , A-3 Cle Elum Dam WA , A-3 Ririe Dam ID.993 3, A-3 Scoggins Dam OR.955 3, A-3 McKay Dam OR , A-3 Keechelus Dam WA , A-3 Haystack Dam OR.805 3, A-3 Kachess Dam WA , TOTAL , (*Apparent discrepancy in capacity between studies A-1 and A-2 on Howard A. Hanson Dam) The above chart does not include the 225 MWs in study A-2 which are broken down only by state for capacity: Idaho 12 MW; Montana 88 MW; Oregon 116 MW; and Washington, 85 MW. Study A-1 This July 2013 study addresses adding generation to the non-powered US Army Corps dams. The study employed the 2012 Oak Ridge National Laboratory (ORNL) study of over 54,000 dams (Study A-2). A total of 419 of the sites identified in the study were USACD dams. The USACE reduced the feasible number of dams by applying additional screening criteria: a) generation of 1 MW or more of potential capacity; b) no current Federal Energy Regulatory Commission (FERC) license; and c) no obvious hindrances in developing hydropower, which resulted in 223 feasible sites. Economic benefits, such as energy value and federal and state incentives were considered, as well as cost estimations for construction, non-construction development and annual operating and maintenance costs defined by the Idaho National Engineering and Environmental Laboratory s (INEEL) 2003 study (study E-8 in this document) and from the Bureau of Reclamation s 2011 assessment (study A-3 in this document). To determine economic feasibility the study employed use of a benefit-cost ratio and an internal rate of return, comparing the net present value over a 50-year period of analysis. Using those Page 1-2

22 factors, the 12 projects in the Northwestern Division equated to MWs of potential capacity, but upon review, reduced to MWs as feasible capacity. The maximum power value is used in calculating a site s potential capacity. Site specific restrictions such as water quality and other environmental impacts were not calculated. Energy prices reflected by the Energy Information Administration (EIA) were applied to the sites. Five sites were considered feasible in the Northwest Region, which covers the Corps Portland (Figure 1) and Seattle (Figure 2) Districts, the majority of the four northwestern states. This is one of the few studies that takes into consideration the benefit of reduction in greenhouse gas emissions, using a specific identifying factor for each region, taking into account 26 differing sub-regions. A chart included in the study details the northwest region output emission rates from three sources. The five northwest projects would have the capability of avoiding million tons of GHG emissions. This study uses one of the broadest numbers of parameters in analyzing projects for both benefits and costs, providing the formulas for analysis. Figure 1 Sites of Oregon Projects Portland District US Army Corps Study A-1 Page 1-3
 analyzed 54,391 of the potential 80,000 NPDs nationwide, with input from the Idaho National Laboratory.")
23 Figure 2 Sites of Washington Projects Seattle District US Army Corps, Study A-1 The Protected Areas designation of the Northwest Power and Conservation Council s Fish and Wildlife Plan does not apply as these sites are at existing diversions. Study A-2 Oak Ridge National Laboratory (ORNL) analyzed 54,391 of the potential 80,000 NPDs nationwide, with input from the Idaho National Laboratory. Dams excluded from the study were those under 5 in height and those without adequate flow and other pertinent information. Dam sites include federal facilities, both US Army Corps of Engineers and Bureau of Reclamation facilities, as well as other dams from the National Inventory of Dams. Project sites were assessed on the basis that all existing flow through dams and runoff potential within the basin were included in determining flow available for generation and assuming a constant hydraulic head. The capacity factor was based on Energy Information Administration (EIA) generation for an 8 year period ending in 2008 for all generation in the US, with an additional regional factor. The study is based on energy production only as other mitigation factors, such as environmental impacts, are assumed to have been addressed during original construction. The analysis did not take into consideration economic feasibility nor regulatory review factors. Page 1-4

24 Figure 3 The addition of power to non-powered dams has the potential of adding up to 12 GWs or 12,000 MWs of renewable capacity. Of that capacity, 225 MWs are identified within the Pacific Northwest region. Figure 3 shows sites of non-powered dams with the potential of capacity greater than 1 MW. Individual projects are not called out in the study unless they are among the top 100 sites. There is one such site identified in the table above. Some sites in the Pacific Northwest are not included in the study as they are already approved by FERC and under construction. 4 The National Hydropower Assessment Program (NHAAP) baseline database and other national data systems were used as the basis for the study. The Protected Areas designation of the Northwest Power and Conservation Council s Fish and Wildlife Plan does not apply as these sites are at existing diversions. 4 See Chapter I FERC applications pending and recently approved. Page 1-5
25 Study A-3 The third study on non-powered dams was developed by the Power Resources Office of the U.S. Bureau of Reclamation, Department of the Interior, March Reclamation assessed 530 sites in the west, determining that 191 sites appear to have potential for further evaluation. An earlier 2005 study addressed the same sites; this assessment provides additional and updated information. The Hydropower Assessment Tool was used to estimate potential hydropower capacity and generation, as well as economic benefits. Reclamation s assessment tool computes generation; cost estimates for construction, equipment, preliminary transmission access, permitting and mitigation; as well as economic benefits. Current and forecast energy prices are used for the revenue stream. Green incentives from federal and state incentives are considered in the analysis. The benefit cost ration and internal return on revenue are based on a 50 year period. An interested developer can input data into the Excel spreadsheet model with embedded macro functions, providing the developer with a preliminary evaluation tool for a potential site. Various assumptions may be changed equipment, interest rate, flow exceedance, or cost variables, among other factors. The Resource Assessment also evaluated potential regulatory constraints including, but not limited to, fish and wildlife considerations and effects on Native American resources, recreation, water supply and quality and potential mitigation costs for those variables. Of the 530 sites reviewed, 105 sites were in the Pacific Northwest Region. A total of 28 of those sites were specified as having high confidence for potential development, 7 as medium confidence and the remaining 48 as low confidence. This study develops costs per kw of capacity. Thirteen Pacific Northwest sites have a benefit cost ration greater than 0.75 and are included in the chart on page 1-2. These 13 sites would produce MWs of capacity and 106,248 MWhs of energy. The average price per kw installed with all costs estimated ranges from $1,889 to $5,075. The chart on page 2 shows the dam sites with a benefit cost ratio, with green incentives, greater than.75 with medium and high confidence data. Figure 4 chart shows all non-powered dams reviewed in the Pacific Northwest, including those with a higher level of feasibility shown on page 1-2. The Protected Areas designation of the Northwest Power and Conservation Council s Fish and Wildlife Plan does not apply as these sites are at existing diversions. Page 1-6
26 Excerpt from Reclamation Study All Reservoirs Reviewed in the Pacific Northwest Region Page Economic Evaluation Table 5-22 summarizes the economic evaluation of hydropower development at sites in the Pacific Northwest region. Except for Washington, the other states in the Pacific Northwest region (sites are primarily in Oregon and Idaho) can receive the Federal green incentive for hydropower development. On average, for the sites analyzed, the green incentives only resulted in an increase in the benefit cost ratio of about Some sites in the Pacific Northwest region had very high cost per installed capacity, low benefit cost ratios, and low IRRs, indicating they would not be economical to develop. Table 5-22 Economic Evaluation Summary for Sites in Pacific Northwest Region Site ID Site Name Total Construction Cost (1,000 $) Annual O&M Cost (1,000 $) Cost per Installed Capacity ($/kw) Benefit Cost IRR Ratio With Green Incentives Benefit Cost IRR Ratio Without Green Incentives PN-1 Agate Dam $821.5 $41.8 $9, < < 0 PN-2 Agency Valley $11,353.3 $283.6 $9, < < 0 PN-6 Arthur R. Bowman Dam $8,994.9 $285.6 $2, % % PN-9 Bully Creek $8,062.9 $189.1 $25, < < 0 PN-10 Bumping Lake $11,275.7 $253.9 $21, < < 0 PN-12 Cle Elum Dam $13,692.3 $491.1 $1, % % PN-15 Cold Springs Dam $1,308.8 $48.9 $19, < < 0 PN-20 Crane Prairie $7,751.3 $183.6 $25, < < 0 PN-24 Deadwood Dam $19,510.1 $428.5 $22, < < 0 Easton Diversion Dam $4,006.9 $143.0 $3, % % PN-31 PN-34 Emigrant Dam $2,209.7 $95.0 $3, % % PN-37 Fish Lake $1,176.0 $48.3 $11, < < 0 PN-41 Golden Gate Canal $3,991.6 $121.5 $7, < < 0 PN-43 Harper Dam $5,901.2 $152.4 $13, < < 0 PN-44 Haystack $3,916.4 $131.4 $4, % % PN-48 Kachess Dam $4,335.9 $154.6 $3, % % PN-49 Keechelus Dam $6,774.2 $224.0 $2, % % PN-52 Little Wood River Dam $17,931.2 $419.3 $12, < < 0 PN-53 Lytle Creek $1,603.2 $54.4 $32, < < 0 PN-56 Mann Creek $3,554.4 $112.0 $7, < < 0 PN-57 Mason Dam $7,276.4 $220.2 $4, % % PN-58 Maxwell Dam $2,075.4 $66.9 $17, < < 0 PN-59 McKay Dam $4,274.0 $155.7 $3, % % PN-65 Ochoco Dam $1,286.3 $49.5 $18, < < 0 PN-78 Reservoir "A" $1,262.2 $47.4 $27, < < 0 PN-80 Ririe Dam $3,636.9 $131.5 $3, % % PN-87 Scoggins Dam $3,665.4 $130.6 $3, % % PN-88 Scootney Wasteway $8,014.4 $258.3 $3, % % PN-95 Sunnyside Dam $6,912.0 $205.4 $5, % % PN-97 Thief Valley Dam $2,601.0 $87.2 $7, % 0.6 < 0 PN-100 Unity Dam $9,462.0 $213.5 $30, < < 0 Figure 4
27 CHAPTER 2 CONDUIT AND HYDROKINETIC PROJECTS Projects that add generation equipment to existing conduits (pipelines, canals or other conveyance systems beyond an existing diversion) are considered by the Federal Energy Regulatory Commission (FERC) as conduit exemption projects. Conduit exemption projects are exempt from FERC licensing. There is still a review by FERC, but at a lower level that consists of filing a Notice of Declaration showing a site map and minimal project information. The projects are generally approved in 6 months or less when a complete application is filed. There is a public notice and the ability for comment. Conduit exemption project experience in the Northwest has occurred mainly within irrigation delivery systems, but there are now projects being installed within municipal water system pipelines. There is the potential to install projects within wastewater and other water delivery systems as well. In addition to adding generation equipment to conduits, there are also new equipment technologies that allow for equipment to be suspended within a conduit, or in some cases within a river or stream. Those hydropower projects are referred to as hydrokinetic energy projects. At this time the kinetic technologies are in the demonstration stage. While there are some prototypes currently installed, the technology is quite new. Council staff comment: The Protected Areas provisions of the Northwest Power and Conservation Council s Fish and Wildlife Program call for the protection of designated stream reaches from hydroelectric development. Exempt from this policy is the addition of hydroelectric generation to an existing non-hydroelectric dam or diversion structure, even if in a protected area. Thus any proposal to add hydroelectric generation to an existing conduit is exempt from the Protected Areas policy, whether that project uses conventional or hydrokinetic technology. New hydroelectric development directly in a stream is not exempt, and there is no distinction in the policy as to whether the project uses conventional or hydrokinetic technology. The Council adopted the protected areas policy in 1988, and has confirmed it in all fish and wildlife programs and power plans since. The Council has never formally considered the issue of new hydrokinetic technologies in this regard. The following studies were reviewed for conduit and hydrokinetic project potential: B-1 Technical & Economic Feasibility of Small Hydropower Development in the Deschutes River Basin U.S. Department of Energy June 2013 Prepared by Oak Ridge National Laboratory B-2 The Integrated Basin-Scale Opportunity Assessment Initiative, FY 2011 Year-End Report: Deschutes Basin Preliminary Hydropower Opportunity Assessment U.S. Department of Energy Page 2-1
28 September 2011 Prepared by Pacific Northwest National Laboratory, Battelle B-3 Feasibility Study on Five Potential Hydroelectric Power Generation Locations in the North Unit Irrigation District Energy Trust of Oregon August 2009 Prepared by Blackrock Consulting B-4 Power Extraction from Irrigation Laterals and Canals in the Columbia Basin Project University of Washington 2009 Prepared by Jessica M. Theilmann B-5 Site Inventory and Hydropower Energy Assessment of Reclamation Owned Conduits U.S. Bureau of Reclamation March 2012 Prepared by Power Resources Office, Bureau of Reclamation, Department of the Interior B-6 Bureau of Reclamation Renewable Energy Update U.S. Bureau of Reclamation July 2014 Fiscal Year 2014, Q3 Prepared by Bureau of Reclamation, Department of the Interior B-7 Scoping Study of Hydropower Potential in Wallowa County, Oregon Energy Trust of Oregon November 2010 Prepared by Renewable Energy Solutions, LLC The seven studies identified Project Name Capacity (MWs) Generation (MWhs) Study B-1 Wickiup Dam ,010 B-1 Bowman Dam ,587 B-1 North Canal Dam ,145 B-1 Ochoco Dam.366 2,992 B-1 Mile 45 conduit site ,565 B-1 Haystack canal site ,078 B-1 Lateral canal site B-1 Lateral 58-9 canal site Page 2-2
29 Table 1 B-3 Brinson Boulevard canal site.969 4,214 B-3 Smith Rock Drop canal site.610 1,958 B-5 Pacific NW Regional canal sites ,597 B-6 18 Reclamation Facilities ,243 B-7 22 conduit sites ,391 TOTAL ,645 Study B-1 The purpose of the study was to identify and assess opportunities for new small hydropower development in the Deschutes Basin, in Central Oregon, along with the technology needed to develop selected sites and the economic feasibility. The focus was to narrow the investigation to projects at existing diversions: non-powered dams, irrigation canals or other diversion structures. A 2010 Memorandum of Understanding among the U.S. Department of Energy (DOE), the U.S. Department of the Interior (DOI) and the U.S. Department of the Army (USACE) encouraged the Bureau of Reclamation, as one of the agencies affected by the agreement, to support optimization of energy at existing federal and non-federal projects. Section B of the agreement entails Integrated Basin-Scale Opportunity Assessments. This study reflects one of the basin assessments envisioned. The Deschutes Basin was selected as the first pilot basin. Criteria for addressing projects in the basin included: new generation at non-powered dams (NPDs) and diversion structures; new generation within existing irrigation canals and conduits; and increased generation at existing hydropower facilities; and projects considered to be small hydro (110 kw to 10 MW capacity). Because the potential projects are all at existing diversions, they are exempt from the restrictions of the Protected Areas of the Northwest Power Planning and Conservation Council. The study used the Oak Ridge National Laboratory (ORNL) Hydropower Energy and Economic Assessment (HEEA) tool under development. The tool uses site-specific information and hydrological data from multiple sources to: generate flow and power duration curves; determine turbine design flow, net head and technology type; calculate monthly and annual power generation and determine design power capacity; estimate project cost (installation cost and levelized cost of energy); and perform benefits and economic evaluations. The economic analysis considered: energy value derived from monthly generation data adjusted seasonally; capacity value reflecting avoided cost by utilities; and green incentives: tax credits, renewable energy credits (RECs) Page 2-3
30 The study assessed the following potential projects with sufficient historical flow data: 14 non-powered dams 15 irrigation canal/conduit sites. Of the 29 sites reviewed, 8 were considered to be economically viable using the HEEA tool. Those sites would add about 19 MW of hydroelectric capacity in the basin while generating over 78 gigawatt hours (GWh) of renewable energy annually. The result would be the powering of about 6,000 homes yearround and avoiding about 29,000 tons of greenhouse gas emissions. These are the 8 projected determined to be economically viable at this time: Project Name Project No. on Map Capacity (MWs) Generation (MWhs) Wickiup Dam ,010 Bowman Dam ,587 North Canal Dam ,145 Ochoco Dam.366 2,992 Mile 45 conduit site ,556 Haystack canal site ,078 Lateral site Lateral 58-9 site TOTAL ,242 Table 2 Page 2-4

31 Figure 1: Map of conduit/canal projects (including #1-4 in Table 2) (Source: Study B-1) Study B-2 The September 2011 study of the Deschutes Basin is a document reporting on the first-year progress of the Integrated Basin-Scale Opportunity Assessment Initiative, preceding study B-1 referenced on the preceding pages. These activities occurred between March 2010 and September 2011 of a two year pilot project period. The study represents an in-depth technical process report of the work developed in study B-1. Page 2-5

32 Study B-3 The North Unit Irrigation District in and around Madras, Oregon, has a delivery system encompassing 300 miles of canals and laterals. A private consultant, Black Rock Consulting, performed a review of canal sites that might lend themselves to potentially feasible generation sites. Three of the sites reviewed are the same as those in study B-1; study B-1 acknowledges this review as one of the source documents for the work accomplished. The review results were based on field survey data, canal and lateral design specifications, and flow information using district gauging stations. A cost estimate was defined for each of the five projects and current power sales rates were used in the revenue calculations. The project costs and revenues were based upon first year benefit versus cost of revenue versus amortized loan and simple payback periods. The Brinson Boulevard site ranked higher in this study than lateral 58-9 did in study B-1 and is added to the chart of available projects in the basin on page 2-2 due to its priority in this study. In addition, the fifth site in this study, Smith Rock Drop, was added due to its feasibility. Figure 2: Map of 5 North Unit Irrigation District Sites from Study B-3 Brinson Boulevard Site.969 MW Capacity 4, Smith Rock Drop.610 MW Capacity 1, Study B-4 This study is the result of a thesis for the Master of Science program in Mechanical Engineering at the University of Washington, submitted in Ms. Theilmann did field studies and worked with Grant County PUD and staff of the Columbia Basin Project. The study area, the Columbia Basin Project, is located in central Washington State, across six counties; the Project serves 671,000 acres of irrigation. Grant County PUD sought to demonstrate hydrokinetic turbines in some of the Project laterals. While the Project canals would provide greater generation capability, the hydrokinetic devices would interfere Page 2-6
33 with irrigation water delivery. As a result the hydrokinetic units were to be instead provided in the smaller lateral conveyance areas of the system. Three lateral sites were chosen to be reviewed for hydrokinetic potential. Hydrokinetic power harnesses the energy of water flow within water bodies, which could be a canal, stream or river. There is no impoundment of water required for hydrokinetic units to be placed within a water body. Most hydrokinetic turbines are in prototype status. This study refers to the unit engineered by New Energy Corporation in Canada, but since 2009 a number of other units have been installed. A current unit supplied by Instream Energy Technologies has been installed in the Roza Irrigation District near Yakima, Washington. At the time of this study the units ranged in size from 5 kw to 250kW at a cost of approximately $4,000 per installed kw. Today the range of sizes is broader and a larger variety of designs is available. At the time of the study, Solar energy cost $8,000 per kw, traditional hydropower $2,000 and small wind turbines about $2,500, by comparison. The hydrokinetic design must be tailored to the size of the lateral. For example a 25 kw hydrokinetic turbine in 2009 required a cross-sectional area of feet, a water depth of 5.58 feet and a required channel width of feet. These turbines are most effective in a high velocity situation. For the purpose of this study, the only costs considered were the equipment, its installation and appurtenant civil works. The study sought to compare the cost of traditional hydropower at lateral site diversions versus the cost of hydrokinetic installation. The conclusion of the study was that traditional hydropower within the Columbia Basin Project system was not only somewhat cheaper per kw but that traditional installations would also produce considerably more power than the hydrokinetic turbines. But the capital outlay for the conventional hydro systems is much larger because of the greater power generation output. The limitations on hydrokinetic power are a result of channel design and the flow relation to its critical point. An example in point is comparison of a hydrokinetic design for Check 2 on the lateral system with a 25 kw rated turbine in a 13 wide channel. In that configuration, 18 kw of electrical power would be generated at a unit capital cost of nearly $7,000 per kw. A conventional hydropower turbine at the same site would generate 700 kw at about $5,000 per installed kw. The design would replace the current check structure (diversion) and down channel baffle blocks. Given the new designs and prototypes since 2009, an updated study would be required to determine if the same comparison values still apply. Study B-5 This March 2012 study is a supplement to the Hydropower Resource Assessment at Existing Reclamation Facilities Report of March 2011 (see chapter 1 non-powered dams). Of the 530 sites identified, 191 were determined to have some level of hydropower potential. If all 191 sites were developed, 268 MWs in capacity would be available and 1.2 million MWh of energy produced. If all the sites with a benefit cost ratio greater than.75 were developed, that would provide 225 MW and 1.0 million MWh of energy. An earlier report did not capture the specific drops and listed the head differential along the entire stretch of a canal, which could be over ten miles long, rather than capturing the energy potential at drops along the canal. Unlike the earlier study, this supplement included site visits. This study also identifies proximity to distribution/transmission lines and provides site maps for the identified sites. It does not include an economic benefit cost analysis. Page 2-7
34 As with any non-federal development of hydropower on Reclamation facilities, existing project water deliveries cannot be negatively impacted by any proposed hydropower project envisioned. The project must be designed to protect continued water delivery even in the event of a powerplant outage. Project operators, such as irrigation districts, should be contacted to involve them as stakeholders in any project. Reclamation has a process for allowing development on federal facilities, the Lease of Power Privilege (LOPP); or the Federal Energy Regulatory Commission (FERC) may provide oversight through FERC s licensing process in accordance with the Memorandum of Understanding between FERC and Reclamation. Reclamation owns 47,336 miles of canals, laterals, drains, pipelines and tunnels, many with little head or flow. In discussion with equipment manufacturers, developers and others, Reclamation determined that a reasonable minimum head for a technically feasible micro-hydro project had to be at least 5 feet. Sites must have the capability of operating at least 4 months out of the year seasonally and produce 50 kw of capacity or more based on gross head and flow capacity of the canal would be identified in the report. The study uses the Hydropower Assessment Tool designed to size a power plant, but cut the flow exceedance to 15%, in discussions with Idaho National Laboratory, to account for the fact that canals operate seasonally. The majority of canal systems in the Pacific Northwest region operate 6-7 months annually. Outcome: Energy and Capacity STATE CANAL SITES POTENTIAL INSTALLED CAPACITY MW POTENTIAL ANNUAL ENERGY MWH ID , MT , OR , WA , TOTAL , Table 3 Study B-6 This is a July 2014 update of renewable energy projects that includes planned facilities or projects in progress. Projects on Reclamation facilities proposed to be developed by others will be developed under Reclamation s Lease of Power Privilege agreement process. Page 2-8
35 FERC and LOPP Non-Federal Hydroelectric Projects Planned on Reclamation Infrastructure in the Pacific Northwest as of July 2014 State Type Facility Type Status Type Project Name FERC Operating Entity Capacity (kw) Pump Estimated Generation Annual Capacity Generation (kw) (kwh) Project Initiation Preliminary Permit/ Lease Date WA FERC Conduit Preliminary Conventional 16.4 Wasteway Grand Coulee Project H. 7/29/2011 3/26/2013 Authority 1,750 OR FERC Conduit Exemption Conventional 45-Mile Earth by Design 7/16/2010 (Exemption: 12/17/2010) 5,000 WA FERC Conduit Preliminary Conventional 46A Wasteway Grand Coulee Project H. 7/29/2011 3/26/2013 Authority 1,600 WA FERC Dam Preliminary Pump Storage Banks Lake Pumped Storage Project Grand Coulee Project H. 8/22/2013 Authority 1,000,000 2,263,000,000 11/30/2011 OR FERC Dam Preliminary Pump Storage Bryant Mountain Pumped Storage Bryant Mountain LLC 3/1/2010 9/24/2010-1,250,000 2,409,000,000 MT FERC Conduit Exemption Conventional Mary Taylor Drop Turnbull Hydro, LLC 9/23/2011 (Exemption: 6/28/2012) 890 1,840,000 WA FERC Dam Preliminary Conventional McKay Dam Houtama Hydropower, LLC 8/13/2013 2/6/2014 2,300 OR FERC Conduit Preliminary Conventional Monroe Drop Natel 7/2/2012 3/28/ ,733,511 WA FERC Conduit Preliminary Conventional PEC 1973 Drop Grand Coulee Project H. 11/8/2011 3/26/2013 Authority 2,200 WA FERC Dam Preliminary Conventional Pinto Dam Grand Coulee Project H. 4/4/ /10/2012 Authority 3,400 WA FERC Conduit Preliminary Conventional Rocky Coulee Wasteway Grand Coulee Project H. 3/13/2012 7/11/2012 Authority 12,000 WA FERC Conduit Preliminary Conventional Scooteney Outlet Drop Grand Coulee Project H. 5/31/2011 3/26/2013 Authority 1,300 WA FERC Conduit Preliminary Conventional Scooteney Wasteway Grand Coulee Project H. 7/28/2011 3/26/2013 Authority 1,110 WA FERC Conduit Preliminary Conventional Scootney Inlet Drop Grand Coulee Project H. 5/31/2011 3/26/2013 Authority 1,700 OR FERC Dam Preliminary Conventional Unity Dams/Warm Springs Hydro Warm Springs Hydro, LLC 1/13/2014 6/16/ ,400,000 MT LOPP Conduit Request Conventional A Drop n/a Turnbull Hydro, LLC 6/1/2014 1,000 2,500,000 MT LOPP Dam Request Conventional Helena Valley Pumping Plant n/a Helena Valley Irrigation 9/13/2013 District 4,800 9,608,000 MT LOPP Conduit Request Conventional Johnson Drop n/a Turnbull Hydro, LLC 6/1/ ,700,000 MT LOPP Conduit Request Conventional Woods Drop n/a Turnbull Hydro, LLC 6/1/ ,200,000 MT LOPP Dam Request Conventional Yellowtail Afterbay n/a Crow Tribe 1/11/2012 9,000 68,261,000 Table 4 Total Potential Capacity: MW Conduits Tot l Potential Capacity: Pumped Storage: Annual Energy Potential: Pumped Storage: 2, MW 91, MWh 4,672,000 MWh Page 2-9
36 In addition to the 18 traditional or conduit exemption projects identified in the chart on the prior page, the chart also includes two pumped storage projects. One of them is already listed in another study in Chapter 3, the Banks Lake Project. There are two other projects in the Pacific Northwest that are not included in the chart as Reclamation s input was grant funding through the Water Smart Program, outside of the Lease of Power Privilege Program. Three Sisters Irrigation District - Sisters, Oregon Reclamation partially funded, under the Water Smart grant program, a.950kw hydropower project that resulted from piping an open canal in the Three Sisters Irrigation District. This project came on line in September It will provide 3.1 million kwh of energy annually between April and October. In addition to the generation project, the pipeline will provide pressurized water to 4,000 acres of agricultural lands within the district. Roza Canal Hydrokinetic Pilot Project - Sunnyside, Washington Instream Energy is developing a hydrokinetic pilot project on a canal in the Roza Irrigation District in Washington. The project has a capacity of 10 kw. Study B-7 Renewable Energy Solutions, during the 2010 irrigation season, examined hydroelectric potential and conveyance efficiency at 22 canal sites in Wallowa County, Oregon. The sites total 1.02 MW capacity with the potential of 3,300 MWhs of annual energy potential. See Table 5 following. The study included field review of existing irrigation infrastructure, transmission distances, water right information, technical detail and energy and water use efficiency. When determining the cost, the consultant received cost quotations on pipe, valves, generation equipment; and estimated powerhouse, construction and transmission cost, permitting and engineering. The energy value was determined by utility standard pricing in place at the time of the study and was not specific to projects. Page 2-10
37 Site Name HEAD (feet) Flow max (cfs) Kilowatt Max Kilowatt-hour Energy Value Alder Slope D ,118 $ 2,961 Allen Canyon D ,998 25,200 Arrowhead Pipeline ,781 2,072 Arrowhead Pipeline ,696 6,314 Chamberlain D ,674 7,825 Clearwater D ,012 3,529 Clearwater D ,572 1,841 Creighton D ,737 1,421 Cross Country Canal ,947 5,684 Kinney Lake D ,087 17,070 Kinney Lake D ,035 10,155 Kinney Lake D ,957 5,181 Kinney Lake D ,983 6,839 McCully Creek ,684 3,001 Moonshine D ,802 10,642 Prairie Creek ,617 29,276 Sheep Creek D ,266,439 91,184 Sheep Ridge D ,270 1,171 Sheep Ridge D ,000 1,512 West Side D ,390 2,404 West Side D ,447 3,704 West Side D ,606 5,156 Table 5 Page 2-11

38 CHAPTER 3 PUMPED STORAGE Pumped storage hydroelectric projects provide significant benefits to our energy supply system including storage, load balancing, frequency control, and reserve generation capacity. During off-peak hours or low demand periods, water is pumped from a lower reservoir into an upper reservoir where it is stored in the upper reservoir until released through generating units during peak demand. Pumped storage projects are able to absorb excess load at times of high output and low demand (i.e. over generation), while providing additional peak capacity to meet energy needs [figure 1]. Figure 1 - Typical Pumped Storage Plant/System This type of storage and generation may be applied to firm the variability of non-dispatchable renewable power sources, such as wind and solar power energy. Several pumped storage assessments have been conducted in the Northwest and throughout the United States, looking at candidate sites and energy storage needs for the region. It is also widely recognized that the storage reservoirs associated with pumped storage may be designed to provide multiple regional benefits including agriculture, domestic/commercial water usage, flow augmentation, and recreational enhancements. Pumped storage hydroelectric projects have been providing storage capacity and transmission grid ancillary benefits in the U.S. and Europe since the 1920s. Today, there are 40 pumped storage projects operating in the U.S. that provide more than 20 GW, or nearly 2 percent, of the capacity for our nation s energy supply system (Energy Information Admin, 2007). Figure 2 indicates the distribution of existing pumped storage projects in the U.S. Pumped storage and conventional hydroelectric plants combined account for approximately 77 percent of the nation s renewable energy capacity, with pumped storage Page 3-1

39 alone accounting for an estimated 16 percent of U.S. renewable capacity (Energy Information Admin., 2007). Figure 2 Existing Pumped Storage Projects in the United States Studies Reviewed The following studies were reviewed in addressing the potential in the Northwest for adding pumped storage, as identified in Appendix A: Page 3-2 C-1 Assessment of Opportunities for New US Pumped Storage Hydroelectric Plants Using Existing Water Features as Auxiliary Reservoirs Department of Energy, Idaho National Lab March 2014 C-2 Technical Analysis of Pumped Storage and Integration with Wind Power in the Pacific Northwest MWH for US Army Corps of Engineers August 2009 C-3 Appraisal Evaluation of Columbia River Mainstem Off-Channel Storage Options CH2MHill for US Bureau of Reclamation May 2007
40 C-4 Hydroelectric Pumped Storage for Enabling Variable Energy Resources within Federal Columbia Power System HDR for Bonneville Power Administration September 2010 From these reports, Table 1.0 provides a summary of the capacity potential of the more promising set of pumped storage projects that have been identified in the Northwest. Table 1: Summary of Capacity Identified in Studies C-1 through C-4 Study Project Name State Capacity (MW) C-1 See Report, Large Number of Studies Nationwide N/A C-2 John Day Pool WA 1300 C-2 Swan Lake OR 600 C-3 Crab Creek (varies by size) WA C-3 Sand Hollow Creek WA 285 C-3 Hawk Creek (varies by size) WA C-3 Foster Creek WA C-4 John Day Pool (duplicate, also cited in C-2) WA C-4 Swan Lake North OR 600 C-4 Brown s Canyon WA 1000 C-4 Banks Lake Pumped Storage North Banks Lake WA 1000 C-4 Banks Lake Pumped Storage South Banks Lake WA 1040 C-4 Lorella (Klamath County) OR 1000 C-4 Gordon Butte Mt 400 C-4 Yale-Merwin WA 255 Study C-1 This study provides a general assessment of opportunities for pumped storage in the lower 48 states that used an existing water body for either the lower or upper reservoir, but in most cases identified locations where two existing reservoirs could be hydraulically connected for use in pumped storage. The study identifies sites that met basic plant characteristic screening criteria and that were not located in an exclusion zone or environmentally sensitive area. The authors utilized some of the design elements of the 40 existing pumped storage projects in operation for their selection criteria, and based on the criteria used for this study, 2,505 sites were identified. The evaluation criteria included a base plant capacity of 10 MW minimum, area of upper reservoir surface area of 100 acres or greater, maximum distance between base plant and upper reservoir of 2 miles, and minimum elevation difference between reservoirs of 20 ft. By relaxing the minimum capacity to 1 MW, an additional 1,893 sites were identified. The report goes on to state that the number of sites would likely be reduced significantly upon further evaluation. Page 3-3
41 The following items were identified as issues that impact the usefulness of this report in the evaluation of pumped storage potential in the Northwest. The authors used existing pumped storage projects to ascertain the screening characteristics but unfortunately did not look at energy density in more rigor. If the report had determined that the minimum head requirement been greater than 300, the results would have been much more applicable. The report ignores the basics of water conveyance length (L) versus total gross head (H) ratio to be a metric for the screening study. There are established rules of thumb for L/H ration to apply to screening studies to identify possible sites for further evaluation (Pumped-Storage Planning and Evaluation Guide EPRI GS-6669 (January 1990). There are several projects that would have qualified as potential sites within the scope of this study: Turlock Irrigation s Red Mountain Bar site, Duke Energy s Coley Creek, site, and Grand Coulee Hydroelectric Power Authority s Banks Lake site, however, none of these sites are identified in the report. The report loses some credibility early on when three of the projects listed on the existing pumped storage data set do not in fact exist. The report identifies potential sites at existing pumped storage projects: Bear Swamp, Northfield, Castaic, Raccoon Mountain and Hyatt. More applicable to the Pacific Northwest, the authors did not considered closed loop pumped storage sites at all, and did not identify any of the sites outlined in previous studies of the Columbia River system off-stream storage, for example, or adjacent to Banks Lake. The configuration/capacity of an existing hydro station seems to influence the potential for reasons that are unknown or not relevant to pumped storage potential as demonstrated by the statement the potential base plant should have a capacity or a capacity potential of at least 10 MW. Lastly, it does not appear that any of the 60+ existing FERC preliminary permits or applications for permits were reviewed by the authors to apply a more modern methodology to this effort nor to provide any ground-truthing to the results. Due to the reasons listed above, the INEL report is limited in its usefulness to identify specific sites with pumped storage potential in the Pacific Northwest. Since this report covers the entire U.S. and the criteria used were significantly different than the other studies reviewed, specifics such as the MW potential of pumped storage in the Northwest from this report are not cited in this review. Study C-2 This report provides a summary of projects in the Northwest that have FERC preliminary permits. The list of projects with FERC permits were reviewed in this study, and the sites with the most potential are cited in Table 2.0. Page 3-4
42 The study notes that permitting, designing, procuring equipment and constructing a pumped storage project is a long term process requiring at least 6 to 7 years and 10 to 12 years to completing construction is more likely. To date, a large scale pumped storage project has never been developed by a private developer; however, new innovative Public-Private-Partnerships and permitting process are recommended for sites where environmental issues are considered to be limited. Table 2.0 Pumped Storage Projects with FERC permits FERC Docket Number Project Name Licensee/Permit Holder/Applicant State Capacity (MW) Closed Loop? L/H Ratio Estimated Energy Storage (MWh) John Day Pool PUD No.1 of Klickitat WA 1000 Yes County Swan Lake North Swan Lake North OR 600 Yes Hydro, LLC 2753 Brown s Canyon Douglas County PUD WA 1000 No Banks Lake Pumped Storage (Alternative 1 North Banks Lake) Grand Coulee Hydro Authority WA 1000 No Banks Lake Pumped Storage Grand Coulee Hydro WA 1040 No (Alternative 2 South Banks Lake) Authority Lorella (Klamath County) FFP Project 111, LLC OR 1000 Yes Gordon Butte GB Energy Park, LLC MT 400 Yes Yale-Merwin PacifiCorp WA 255 No N/A 2550 Study C-3 This report provides an appraisal study for four potential storage sites in Washington State. The primary needs for storage in this evaluation included agriculture, flow augmentation, domestic/commercial/ municipal/industrial (DCM&I) and climate change response. The secondary purposes included recreation and power. The 2007 Appraisal Evaluation builds on the work contained in the Pre-Appraisal Report, which was completed in December The objective of the Appraisal Evaluation is to determine which offchannel storage sites warrant further investigation, if a Feasibility Study is conducted. From the array of 11 potential off-channel storage options identified in the Pre-Appraisal Report, Reclamation and Ecology have determined that four off-channel storage alternatives warrant being carried forward into the Appraisal Evaluation. The four sites are referenced as Hawk Creek, Crab Creek, Sand Hollow Creek and Foster Creek. During the evaluation process, Foster Creek was eliminated from consideration due to geotechnical reasons. Appraisal-level designs for the dam and appurtenant structures, which include intake structures, inlet/outlet conveyance facilities, pumping/power plants, and transmission lines, were developed to support evaluation of the suitability of each project. The criteria/methodology used to develop appraisal-level designs, cost estimates, and the evaluation/ screening criteria used to compare the sites. Water balance modeling was used during the evaluation process. To provide an objective comparison of the sites, a decision support model was used in the evaluation. Through this process, Crab Creek was recommended as the project that should be evaluated in future studies. Page 3-5

43 The Hawk Creek site, southwest of Spokane, would utilize Lake Roosevelt as its lower reservoir and has the most promise from an energy density/pumped storage perspective due to its higher head of approximately 780. Figure 2 Site Map for C-3 Studies Study C-4 In 2010 HDR completed a study on behalf of BPA to help identify various strategies for combing wind integration and pumped storage technologies. This study assessed the operational flexibility of Reclamation s Keys pumped storage project and also did an evaluation of two closed loop projects adjacent to the main stem of the Columbia River Klickitat PUD s JD Pool site, and the previously mentioned Hawk Creek site upstream of Grand Coulee. The objective of the report was focused on how pumped storage could be another tool in BPA s toolbox for providing reserves for wind integration and potentially returning flexibility to the FCRPS. Identifying new sites across the BPA footprint was not within the scope of the study. The report is useful as an educational document on how grids in Europe utilize both conventional hydropower storage and new pumped storage for integrating variable energy resources. The study also demonstrated how much flexibility and system reserves could be provided by Reclamation s Keys pumped storage project for ten months of the year when water supply demands for irrigation did not trump all other project uses. Additionally, this report provides an assessment of the proposed projects in the U.S. that have been granted and/or filed for a FERC Preliminary Permit Application, as illustrated in Figure 3. This report concludes that one of the most promising sites in the Pacific NW for new, closed loop pumped storage is Klickitat PUD s JD Pool site. This is a high head site with relatively shorter tunnels, has outstanding transmission access, and has water rights available with no new water intake infrastructure required from the main-stem of the Columbia River. Page 3-6

44 Northwest Pumped Storage Sites and Costs In addition to the studies reviewed a team of experienced consultants (see resumes, Appendix D) provided a brief review of the projects available in the Pacific Northwest and projected cost information. Figure 3 shows the existing FERC permits for pumped storage projects. A total of 17 of these projects are located within the Northwest service area of Bonneville Power Administration. Figure 3 Preliminary Proposed Pumped Storage Projects as of April, 2014 Because of the timeline for new pumped storage projects, short term measures will be required. Notably, the one and only pumped storage site in the Northwest is the Bureau of Reclamation s John W. Keys III Pump-Generating Plant utilizing Banks Lake at Grand Coulee Dam with an installed pumped storage capacity of 314-MW. There are several pumped storage projects in active development such as Électricité de France Renewable Energy s (EDF-RE) Swan Lake North Pumped Storage Project and Public Utility District No. 1 of Klickitat County, Washington s (KPUD) John Day Pool (JD Pool) Pumped Storage Project (Figure 4). Page 3-7

45 Figure 4 Map of existing and proposed technically attractive pumped storage projects in the Northwest Costs The projected costs for pumped storage range from $1800/kW to $3500/kW of installed capacity. This range is driven by tunnel lengths, the overall head (the higher the head the smaller the machine dimensions and thus lower costs), the amount of above ground civil infrastructure required (such as an upper and lower reservoir), and variable speed technology for the pump/turbines. Refining the published costs for new, greenfield pumped storage is not practical at this time since engineering is in the preliminary stage for the Northwest projects. The potential of new pumped storage in the Pacific Northwest is very different than estimating conventional hydropower. It is not a matter of implementing a typical site on a navigable river or stream where economics are based upon head and flow, but rather what the market needs for grid balancing services and the valuation of those products provided from a pumped storage plant. For example, providing load following (flexible ramping capability) and regulation up and regulation down is not compensated; there is not a revenue stream that can help in the financing of a pumped storage project for that service. But those are precisely the services that a pumped storage project can provide and the need to better integrate variable energy supply. Page 3-8
46 Protected Areas It appears that the proposed sites are outside the Council s protected areas designation, which can be affirmed once the coordination between the StreamNet map and the Oak Ridge National Laboratory map can be rectified this fall. Page 3-9
47 CHAPTER 4 TIDAL AND WAVE ENERGY PROJECTS Tidal and wave energy technologies are new on the horizon and only a few projects have been developed or planned. The Pacific Northwest is uniquely situated to capture the energy of the Pacific Ocean. Wave energy is more stable than wind energy because wave energy is driven by the gravitational forces and is therefore more predictable. While current projects are more expensive than traditional hydropower, once more experience develops and research and development funds are committed, the wave and tidal technologies should follow a decrease in cost. Wave energy resources seem best between 30 and 60 degrees latitude and the potential seems to be greater on western coasts. Wave energy along the nation s coastlines is equal to 2,100 terawatt hours each year. Just one quarter of this potential would produce as much energy as the entire U.S. hydropower system. Oregon and Washington have the strongest resource in the lower 48 states. There are three types of wave energy technologies: floats, buoys or other pitching devices to generate electricity, driving hydraulic pumps by using the rise and fall of the ocean s swells; oscillating water column (OWC) devices to generate near the shore using the rise and fall of water in a cylindrical shaft; and an overtopping device or tapered channel, which may be used either near the shore or offshore. While these devices do not produce pollutant emissions or greenhouse gases, there is concern for impacts on marine ecosystems and fishery resources. Oregon, for example, has established an ocean floor mapping process with technical support from NOAA s Office of Coast Survey and Oregon State University. Using latest technologies the team completed the mapping in 2012, measuring depth, searching for navigational hazards and recording the natural features of coastal seabeds and fragile aquatic life. The intent is to develop similar mapping for the three Pacific states by The work will be helpful in modeling wave energy, marine reserves and tsunami modeling. The following studies appear to be among the most current reports involved the potential for tidal and wave energy resources: D-1 Assessment of Energy Production Potential from Tidal Streams in the United States Funded by the Wind and Water Program, Office of Energy Efficiency and Renewable Energy, U.S. Department of Commerce June 29, 2011 Prepared by Georgia Tech Research Corporation D-2 Mapping and Assessment of the United States Ocean Wave Energy Resource 2011 Technical Report Electric Power Research Institute (EPRI) Page 4-1
48 D-3 Assessment and Mapping of the Riverine Hydrokinetic Resource in the Continental United States 2012 Technical Report Electric Power Research Institute (EPRI) No specific projects were identified in any of the studies. Study D-1 The George Tech Research Corporation created a national database of tidal stream energy potential and a GIS tool usable by industry to support tidal energy technology development. The tidal currents were numerically modeled with the Regional Ocean Modeling System (ROMS) and calibrated with the available measurements of tidal current speed and water level surface. The states of Oregon and Washington were shown to have among the highest potential with Oregon having the potential of 48 MW in capacity and Washington, 683 MW. The study website provides mapping and other tools for determining project potential. Study D-2 EPRI identified that there was an estimated 440 TWh/yr (terawatt hours annually) along the West Coast (Washington, Oregon and California) with an estimate of 590 TWh/yr potential estimate on the outer shelf. A terawatt hour is one million megawatt hours or one trillion kilowatt hours. Washington 72 TWh/yr Inner Shelf 116 TWh/yr Outer Shelf Oregon 143 TWh/yr Inner Shelf 179 TWh/yr Outer Shelf The project used a 51-month Wavewatch III hindcast database developed by NOAA s National Centers for Environmental Prediction to calculate available wave power density. Study D-3 EPRI s 2012 technical report details assessment of the hydrokinetic resource in the 48 contiguous states, derived from spatially-explicit data contained in the NHDPlus, a GIS-based database containing river segment-specific information on discharge characteristics and channel slope A total of 72,398 river segments having a mean annual flow greater than 1,000 cubic feet per second (cfs) mean discharge were included in the assessment. River segments with hydroelectric dams were excluded. The Pacific Northwest was determined to have terrawatt hours per year in theoretical power with a technically recoverable power annually of 11 terrawatt hours. The technically recoverable instream hydrokinetic resource can be broadly defined as the amount of power that could be recovered given existing technologies. The Pacific Northwest has 9.2% of the total energy potential. The practically recoverable resource remains an unknown. While the studies identified net potential resources, no specific projects were identified. There are projects underway in the Pacific Northwest, however. Snohomish PUD in Washington has identified two projects: Page 4-2

49 Admiralty Inlet, east of Port Townsend FERC P for 29.3 to 75.3 average megawatts License issued March 2014 for 10-year pilot project Deception Pass, North Whidbey Island FERC P for 3 average megawatts Page 4-3 Figure 1 Snohomish PUD recently scrapped its Admiralty project, according to a September 30, 2014, press release. The projected cost had almost doubled from the earlier estimates and further funds for research and development from the U.S. Department of Energy didn t appear to be forthcoming to continue the attempt to develop the project. A demo project in Oregon is currently underway: M3 Wave Company, Salem, Oregon, is testing a new device with a one-fifth scale prototype; a full scale 100-foot device could produce 150 kws of power. The device was partially funded by U.S. DOE, the Oregon Wave Energy Trust and Oregon BEST.
50 In May of 2014 Ocean Power Technologies surrendered its 35-year FERC license issued in 2012 for the initial 1.5 MW phase of a planned 50 MW project (FERC 12713) at Reedsport, Oregon, the OPT Wave Park Project. The company is seeking approval to decommission and remove equipment installed in 2013 when installation of the first of 10 Power Buoys were placed. U.S. DOE has funded the Northwest National Marine Renewable Energy Center (NMERC) as a collaboration of Oregon State University and the University of Washington, to provide device testing. FERC issued an alternative license (FERC 14616) for an up to 20 MW test site for utility scale wave energy conversion devices near Newport, Oregon on the Outer Continental Shelf. FERC has currently licensed five marine and hydrokinetic projects, for both tidal energy and wave energy technologies. Preliminary permits have been issued for six additional projects. Page 4-4
51 CHAPTER 5 GENERAL GENERATION PROJECT ASSESSMENTS In addition to studies developed specific to certain hydropower technologies there have been some broader studies which include varying technologies, generally conventional hydropower technology. This chapter will review the following studies: E-1 New Stream-reach Development: A Comprehensive Assessment of Hydropower Energy Potential in the United States U.S. Department of Energy, Energy Efficiency and Renewable Energy, Wind and Water Power Technologies Office April 2014 Prepared by: Oak Ridge National Laboratories E-2 Assessment of Natural Stream Sites for Hydroelectric Dams in the Pacific Northwest Region Idaho National Laboratory March 2012 E-3 Hydropower Potential and Energy Savings Evaluation Irrigation Water Providers of Oregon Energy Trust of Oregon 2011 Prepared by Black Rock Consulting E-4 Small Hydropower Technology and Market Assessment Energy Trust of Oregon January 2009 Prepared by Summit Blue Consulting LLC E-5 Assessment of Waterpower Potential and Development Needs March 2007 Electric Power Research Institute (EPRI) E-6 Feasibility Assessment of the Water Energy Resources of the United States for New Low Power and Small Hydro Classes of Hydroelectric Plants U.S. Department of Energy, Energy Efficiency and Renewable Energy, Wind and Water Power Technologies Office January 2006 Prepared by Idaho National Laboratory Page 5-1
52 E-7 Estimation of Economic Parameters of U.S. Hydropower Resources Idaho National Engineering and Environmental Laboratory June 2003 Potential for the Northwest identified from studies: Capacity Generation Project Name (MWs) Study E-1 Northwest Projects < 1 MW 15, ,756,000 MWh E-1 Northwest Projects > 1 MW 9, ,244,000 MWh E-2 Northwest Projects (5,439 sites) 15, n/a E-3 Irrigation Projects (30 sites) ,823 MWh E-6 Northwest Projects n/a 9,969 MWa Table 1 Study E-1 This study focuses on new run-of-the-river projects. The projects would likely be run-of-the-river projects as the assessment is based upon stream reaches. A total of 3,793 stream reaches of high energy density (with estimated potential capacity > 1 MW per stream reach) were identified. The highest potential among the 18 national regions is in the Pacific Northwest, Region 17, which has 32% of all future capacity. Within the Pacific Northwest region, the Lower Snake River subregion has the most potential, then the Middle Columbia subregion, with the highest potential found predominantly in the Deschutes River Basin. Oak Ridge National Laboratory followed the NSD methodology (Hadjerious et al., 2013) to determine the total undeveloped capacity of GW (gigawatts) for the Pacific Northwest. This number equates to 76% of the capacity of existing hydropower in the region. In terms of energy, the undeveloped generation is TWh/year (terawatt hours annually), which is 118% of energy from existing hydropower projects in the Northwest. A terawatt is one million megawatt hours or one trillion kilowatt hours. NSD stream reaches have higher capacity factors compared with other larger-storage peakingoperation projects in the region that now exist. The capacity figure for the Pacific Northwest was rated at 67%. Page 5-2

53 Figure 1 Potential new hydropower capacity in the United States (higher-energy-density stream-reaches with >1 MW per reach, aggregated to HUC08 subbasins for illustration). Capacity and Energy for individual Northwest States: Potential new hydropower capacity in the United States (higher-energy-density stream-reaches with >1 MW per reach, aggregated to HUC08 subbasins for illustration). State Capacity (MW) Energy (MWhs/year) Idaho 7,018 41,015,000 Montana 4,763 28,201,000 Oregon 8,920 53,353,000 Washington 7,381 43,788,000 TOTAL 28, ,357,000 Table 2 Page 5-3

54 Figure 2: New Hydropower Potential in the Pacific Northwest The study is designed to accommodate the whole of more than 3 million U.S. streams so it is targeted at a higher reconnaissance level. The methodology considers only the physical characteristics of each stream and landscape and does not consider the economic feasibility of issues arising from environmental impacts, cost or benefits. The methodology allows for the identification of stream reaches using a range of technical, socio-economic and environmental characteristics, but it does not produce estimates of capacity, production, cost or impacts of sufficient accuracy to determine absolute economic feasibility but identifies reaches that have projects that could be review on a more detailed site specific process. The Northwest region has 70 native fish species; 16 of the species are identified in the study as fully or partially within ESA (Endangered Species Act) designations. Critical habitat for certain protect wildlife species was also considered. In addition, there are over 110 million acres of protected lands in the region or 57% of the total land area, 83% federally owned. Other factors considered were water quality, recreation, Wild and Scenic Rivers, fishing access and water use. Page 5-4


55 Figure 3: Environmental Constraints Page 5-5
 Fish and Wildlife Program as hydropower projects not currently sited at existing diversions require a special exception process review.")
56 Because the study is based on new run-of-the-river projects, there is going to be considerable concern about which areas fall under the protected area designations identified in the Northwest Power and Conservation Council s (Council) Fish and Wildlife Program as hydropower projects not currently sited at existing diversions require a special exception process review. NWHA is working with Oak Ridge National Laboratory and the Pacific Marine Salmon Fisheries Commission staff to develop a map that matches the protected area designations to the mapping of the stream reaches in this study to determine the overlap between the protected areas and the reaches. The map is anticipated in November. The map from the study that depicts fishery resources on the identified streams may be helpful in the interim to display protected fishery resources: Figure 4: Fish species of concern (number per HUC08 subbasin) in Region 17 Study E-2 This study also defines the Pacific Northwest region as Region 17, similar to study E-1, but in this case Region 17 does not include Montana. The study focused on Region 17 as a pilot project. Each stream reach in the region is considered to be a potential development site where a dam or other structure could be developed to impound water at the downstream end of the reach to capture the entire reach hydraulic head. The focus is on small hydropower projects to eliminate unrealistic project site reaches that were part of a larger river system. For the purposes of this study, a small hydro project is designated as 2 to 60 MWs in capacity and energy potential of less than 1 MWa up to 30 MWa annual power potential. Page 5-6
.")
57 The Idaho National Laboratory also used the NHD database for this study, as used in study E-1. The study addressed 231,747 regions in the region. Stream reaches with existing dam were excluded from the study (5,032 reaches). Figure 5: Locations of candidate small hydropower sites in Hydrologic Region 17 Stream reaches identified with potential projects: Reaches Number of Reaches Capacity (MWs) All reaches 231, ,666 Capacity potential less than 1 MW 29, ,485 Small hydropower reaches: 2 MW 60 MW 24,489 73,934 Available small hydropower reaches 15,676 42,835 Candidate reach sites for further assessment 5,439 15,021 Table 3 Page 5-7
58 The study took into consideration protected lands and some environmental exclusions, but does not list specifics. An earlier study a number of years prior using the same reaches defined reaches that would be excluded from development and removed them from the total defined. For the 24,489 sites considered small hydro, the following exclusions were made to arrive at that number of reaches with sites from the total reaches, leaving 64% of the sites as potential for development, or 15,676 sites: Existing dams.4 % Federal exclusions 29.0 % Environmental exclusions 7.0 % Study E-3 The 2010 study reviewed potential sites within Oregon s irrigation districts and considered both sites at existing dams as well as in conduits and canals. Only a subset, 14 of the 45 Oregon irrigation districts, could be included in the study as other feasibility studies were in progress with Energy Trust. A 2008 assessment (see study E-5) identified the irrigation districts as one of the state s largest resources for development of untapped hydropower potential. Analysis involved reviewing the water rights of 108 irrigation water suppliers (districts, ditch companies, and other forms of agricultural water delivery entities) and then providing a self-survey to 29 suppliers representing 30 different sites. Costs included current prices for piping open canals to create pressurized conduits, interconnection costs, generation equipment design and permitting, and powerhouse construction. No mitigation costs were included unless a fishscreen was not already in place and needed to be provided as required by Oregon law. Energy prices were based on revenue for standard power sales agreements as established by rule of the Oregon Public Utility Commission. The identified projects are exempt from the Protected Areas designation of the Council because all of these projects are at or beyond existing diversions. Oregon irrigation districts may use their existing water right for irrigation to also provide energy as a secondary use, so long as the water right is not enlarged, defined as using the right used beyond the existing term or season of use, or expansion in the quantity or delivery rate. A streamlined process through the Oregon Water Resources Department is available to establish hydropower as a secondary use for conduit or exempt projects approved by FERC. One of the constraints discovered in the review of these irrigation district projects was inconsistency in land use siting from one county to another. In some counties the conduit exemptions were an outright use; in others a conditional use permit was required; and in some a zone change was required. Total Capacity from the 30 Sites: MW Capacity 5,852 MWh Annually* *These are season projects that generally operate 6 months a year, during irrigation season. Page 5-8
59 Study E-4 The scope of work involved reviewing Oregon s water rights to determine the location of the larger water rights used by water delivery entities to assess potential hydropower by reuse of the same water right for energy purposes. The Oregon Water Resources Department WRIS (Water Rights Information System) was used for the analysis. The water right locations, for the purpose of the study, had to be located within an Oregon investor-owned utility (IOU) service area: Portland General Electric or PacifiCorp s systems. If funds from Energy Trust of Oregon (ETO) were to be used for future feasibility sites of projects, the projects would have to be in the IOU systems as under state law the IOUs fund ETO. The analysis found the following number of water rights of 5,000 acre feet or more in the two IOU service areas with a priority date of 1980 or older: Type of Water Right PacifiCorp PGE Surface Water Groundwater 4 2 Stored Water 7 1 Total Table 4 The study addressed capital costs, operations and maintenance, incentives and other costs and benefits on a general basis, but not by project. In addition to reviewing water rights to determine generation potential, the study consultant addressed federal and state requirements and environmental constraints. A survey was sent to the holders of the 78 water rights detailed in the chart above. An appendix in the study lists the water right holders subject to the referenced numbers. No calculations were made as to project capacity or energy potential. Study E-5 EPRI s (Electric Power Research Institute) study of 2006 estimated 23,000 MW capacity could be added to the generation system by the year 2025: 2,700 from new small hydro projects of less than 30 MW each; 2300 MW capacity additions to existing plants; 5,000 new MW at existing non-powered dams; 10,000 MW from ocean energy technologies; and 3,000 MW from hydrokinetic technologies. The overall resource potential was estimated to be 85,000 to 95,000 MW. The numbers identified were derived from the evaluation of existing studies and documents. A survey of generation providers also provided information. EPRI reported that to accomplish the potential suggested, there would need to be an investment of $377 million through 2015 for research and development in hydropower technology and an extension of the federal Production Tax Credit (PTC) and Clean Renewable Energy Bond (CREB) programs. Additionally, regulatory revisions to streamline and expedite permitting would be required. The report provides a thorough discussion of the available incentives. There are no regional figures presented and no specific projects addressed in this study. Page 5-9
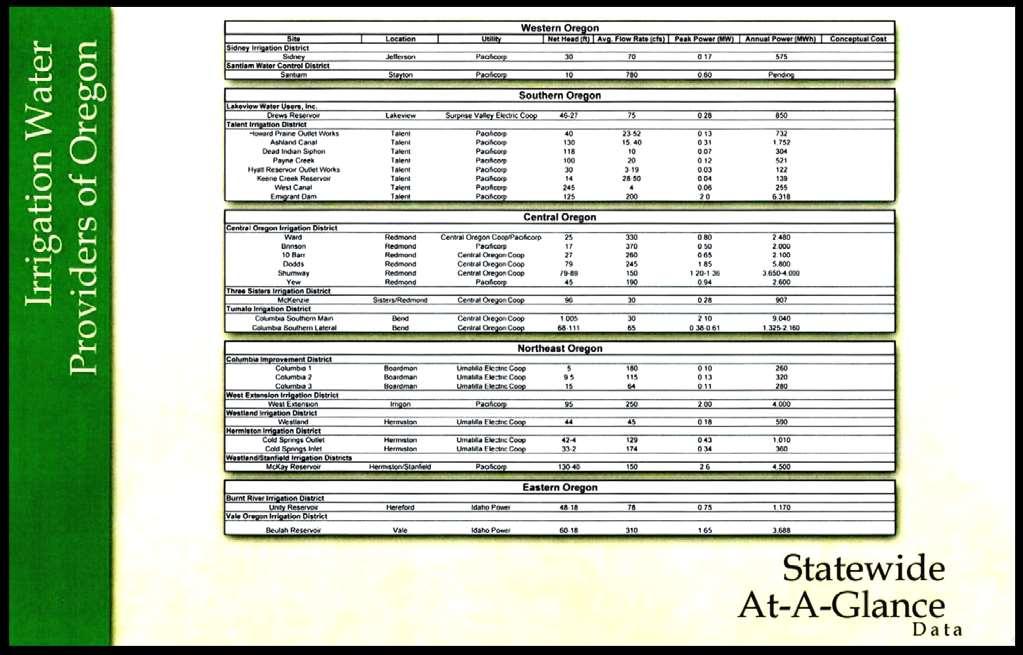
60 Page 5-10

61 Page 5-11
62 Study E-6 The U.S. Department of Energy study of 2006 updates an earlier study by the Idaho National Laboratory in 2004, using previously identified sites. The earlier study addressed every natural stream reach in the U.S. This study applies feasibility criteria to those earlier sites: site accessibility, load or transmission proximity, land use and environmental sensitivities. A development model, not using a dam, was applied to the stream reaches. It was assumed that either a low power (less than 1 MW) or a small hydro (1 MW to 30 MW) project would be installed at the site, whichever was less. The working flow was restricted to half the streamflow rate or sufficient flow to produce 30 MWa, whichever was less. As a result there were over 500,000 sites with a collective gross power potential of about 300,000 MWa. In further addressing feasibility criteria, the number of sites was reduced to 130,000 with about 100,000 MWa energy potential. When the development model was used with a limited penstock length, the energy potential was reduced to 30,000 MWa. This number equates to the total existing electrical energy load supplied by existing hydropower plants. A further reduction, after all criteria was applied, reduced the total sites to 5,400 with an energy output of 18,000 MWa, a greater than 50% increase in the existing hydropower fleet. Additional requirements included having a site within one mile of a road and within one mile of transmission access. The four Northwest states, along with California and Alaska, had the most identified sites. The Pacific Northwest is identified as Region 17 in the study. The Pacific Northwest potential was broken down by states: STATE ENERGY: MWa Idaho 2,122 Montana 2,669 Oregon 2,072 Washington 3,106 Total 9,969 Table 5 Study E-7 The June 2003 study by Idaho National Laboratory does not define project sites, but instead provides estimating tools. Due to the age of the study and updates that have more recently occurred, the costs provided may no longer be relevant. At that time one-half of the proposed 43,036 MW of capacity were identified as being able to be developed for $1,600 per kw@ or less. Developing power at nonpowered dams was identified at $1,200 per kw and $700 per kw, depending on the size capacity. Page 5-12
63 CHAPTER 6 TOOLS FOR ASSESSING HYDROPOWER POTENTIAL There are a number of tools that have been developed to apply to potential hydropower projects to determine feasibility. F-1 Northwest Subbasin Databrowser Developed by GIS Support Division and Environment, Fish and Wildlife Group, Bonneville Power Administration 2014 F-2 National Inventory of Dams Maintained by the U.S. Army Corps May 2013 Update F-3 Hydropower Energy and Economic Analysis Tool U.S. Bureau of Reclamation 2014 F-4 Virtual Hydropower Prospector Idaho National Laboratory 2011 F-5 Tidal Stream Interactive Map Georgia Tech Institute June 2011 F-6 National Hydropower Asset Assessment Program Oak Ridge National Laboratory Tool F-1 The new model of the Subbasin Data Browser provides access to environmental information for hydroelectric project sites in correlation with the Pacific Northwest Hydropower Database and Analysis System. A map viewer and data sets in a customizable environment allow users or user groups to create and share content as well. Data sets unique to the northwest, such as the protected areas map of the Northwest Power and Conservation Council s Fish and Wildlife Plan, are included in the components that can be addressed in ArcGIS format. Page 6-1

64 Tool F-2 The 2013 National Inventory of Dams database was collected from state and federal agencies that regulate dams in the United States. It provides maps and charts the majority of regulated dams and rates the facilities by degree of risk or hazard. Example: Oregon dams Figure 1 Tool F-3 The Hydropower Energy and Economic Analysis Tool is part of the recent studies conducted by Reclamation (Studies A-3 and B-5). This tool is a model that allows interested parties to conduct reconnaissance level hydropower assessments with minimal data inputs (location, flow and head). Then the Excel spreadsheet allows choices of equipment and other input to arrive at projected monthly production and it allows factoring in green incentives and other parameters. Page 6-2
65 Bureau of Reclamation - Hydropower Assessment Tool - Version 2.0 Date of Analysis Facility Name Agency Analysis Performed by Project Location (State):* * If Other is selected for project location- state-specific information must be input in "Other State" Tab Latitude Longitude Data Set yrs Max Head ft Min Head ft Max Flow cfs Min Flow cfs Data Analysis: Turbine Selection Input/Analysis: Turbine Design Head Turbine Maximum Flow ft cfs Turbine Type Generator Speed Max Generating Head Limit Min Generating Head Limit Max Generating Flow Limit Min Generating Flow Limit rpm ft ft cfs cfs indicates the default/model recommended value; Value can be overridden by user Powerplant Cost Estimate Input: Transmission Voltage T-Line Length kv miles Fish and Wildlife Mitigation Recreation Mitigation Historical & Archaeological Water Quality Monitoring Fish Passage Required Figure 2 Page 6-3
66 Tool F-4 The Virtual Hydropower Prospector is a geographic information system (GIS) tool designed to assist a user in locating and assessing natural stream water energy resources nationally. Pop ups shows the locations of potential projects determined using a set of feasibility criteria. Features such as roads, power infrastructure, land use, cities, etc., are visible to the user in a series of layers. This is a preliminary assessment tool that will define a level of feasibility, but actual field review of the site would be required to complete necessary feasibility information. The methods used for this tool are described in Water Energy Resources of the United States with Emphasis on Low Head/Low Power Resources as produced by the U.S. Department of Energy, April Methods to determine power potential originates from Feasibility Assessment of the Water Resources of the United States for Low Power and Small Hydroelectric Plants as developed by the U.S. Department of Energy, January 2006 (Study E-6). Resource assessment data from the Hydropower Resource Assessment at Existing Reclamation Facilities, March 2011 (Study A-3) was also used in development of the tool. The interactive maps link to various resource data. There are query tools to select specific features. Tool F-5 The Tidal Stream Interactive Map system, developed by Georgia Tech Institute, is a companion to the study developed by Georgia Tech (Study D-1). The user can look at a series of data layers, such as mean current speed, mean kinetic power density and water depth as well as geographic mapping. Data can be selected and exported. Tool F-6 The NHAAP GIS team at Oak Ridge National Laboratory (ORNL) developed this interactive mapping site to work from a database of studies produced by ORNL and others. A navigation system provides access to data and map products for: existing hydropower assets, non-powered dams, new stream-reach development, environmental attribution, ecological research, stream classification. Page 6-4

67 Figure 3 Page 6-5
68 CHAPTER 7 LEGISLATIVE AND REGULATORY ENVIRONMENT CONGRESSIONAL LEGISLATION Major Congressional legislation and federal rulemaking will have an impact on the ability to move forward with hydropower projects in the near term. Two pieces of significant legislation were enacted by the U.S. Congress in 2013 that provided streamlining of hydropower applications. Hydropower Regulatory Efficiency Act of 2013 Public Law (H.R. 267) was enacted August 9, 2013 House vote 422-0; Senate unanimous consent Findings - Section 2: Congress finds that the hydropower industry currently employs approximately 300,00 workers across the United States; hydropower is the largest source of clean, renewable electricity in the United States; as of the date of enactment of this Act, hydropower resources, including pumped storage facilities, provide nearly 7% of the electricity generated in the United States; and approximately 100,000 megawatts of electric capacity in the United States; only 3% of the 80,000 dams in the United States generate electricity, so there is a substantial potential for adding hydropower generation to non-powered dams; and according to one study, by utilizing currently untapped resources, the United States could add approximately 60,00 megawatts of new hydropower capacity by 2025, which could create 700,000 new jobs over the next 13 years. Components of the legislation Exemption Capacity Section 3 Section 3 of the Act amended section 405 of the PURPA (Public Utility Regulatory Policies Act of 1978) by increasing the maximum capacity of a project exempt from the full licensing process described under the Federal Power Act, as regulated by FERC, from 5 MW to 10 MW. An exemption is still regulated by the Federal Energy Regulatory Commission (FERC), even though not licensed, but the process is less onerous. A project would qualify for an exemption if it is at an existing diversion. Conduit Exemption Section 4 This section provides that conduit hydropower facilities with an installed capacity not exceeding 5 MW which meets other qualifying criteria set by FERC are not required to be licensed under the Federal Power Act. However, a notice of intent must be filed with FERC to determine if the project meets the qualifying criteria. If the facility does meet the criteria, FERC will make an initial determination within 15 days of the notice and then issue a public notice period for 45 days. A letter approving the facility will then be provided unless FERC receives comments contesting the action. Conduit projects have been moving through the process in days, generally with no contesting comments. There is a template for the notice of intent posted on FERC s website. Section 4 also increases the maximum installed capacity from 15 MW to 40 MW for a privately developed hydropower facility that qualifies for a conduit exemption. Previously the 40 MW capacity only applied to municipal projects. Page 7-1

69 A qualifying conduit hydropower facility must meet the following provisions: 1) A conduit is any tunnel, canal pipeline, aqueduct, flume, ditch or similar manmade water conveyance that is operated for the distribution of water for agricultural, municipal, or industrial consumption, and is not primarily for the generation of electricity. 2) The facility generates electric power using only the hydroelectric potential of a non-federally owned conduit.* 3) The facility has an installed capacity that does not exceed 5 megawatts (5 MW). 4) The facility was not licensed or exempted from the licensing requirements of Part I of the Federal Power Act on or before August 9, *If it is a federally owned conduit, then the Bureau of Reclamation would oversee the process through The LOPP process (Lease of Power Privilege). Figure 1: conduit project under construction Extension of Preliminary Permit Section 5 FERC is granted the authority to extend preliminary permits for up to 2 additional years beyond the 3 years previously allowed under Section 5 of the Federal Power Act to study a project before applying for the final license. Any permittee wishing to extend the preliminary permit term must file an application with FERC at least 30 days prior to the expiration date of the permit specifying the term of extension and how reasonable diligence has been carried out to meet the activities required under the permit. Page 7-2
70 Two-year Licensing Process Section 6 Section 6 requires FERC to investigate the feasibility of a 2-year licensing process for hydropower development at non-powered dams and closed-loop pumped storage projects. On August 5, 2014 FERC approved a pilot project to test the two-year licensing process, Free Flow Power s Project 92 proposed 5 MW project located at the Kentucky River Authority s existing Lock & Dam No. 11 on the Kentucky River. Legislative Background It is instructive to look at the Congressional votes for the streamlining legislation in this Act as passage was near unanimous prior to the President s signature. A coalition of interests, from federal agencies to hydropower developers and environmental organizations, such as America Rivers, supported the final legislation as enacted. Bureau of Reclamation Small Conduit Hydropower Development and Rural Jobs Act Public Law (H.R. 678) was enacted August 9, 2013 House vote 416-7; Senate unanimous consent Overview The legislation amends the Reclamation Project Act of 1939 [43 U.S.C. 485h(c)] by authorizing lease of power privileges in addition to and alternative to any authority in existing laws related to particular projects, including small conduit hydropower development; and first offering the lease of power privilege to an irrigation district or water users association operating the applicable transferred conduit, or to the irrigation district or water users association receiving water from the applicable reserved conduit; and using Reclamation s categorical exclusion process under the National Environmental Policy Act (NEPA) to small conduit hydropower development, excluding siting of associated transmission facilities on Federal lands. The Secretary of the Department of Interior will determine a reasonable time frame for the irrigation district or water users association to accept or reject a lease of power privilege offer for a small conduit hydropower project and if the entity does not elect to pursue the offer, the Secretary shall offer the lease of power privilege to other parties. For the purposes of this Act, small conduit hydropower means a facility capable of producing 5 MW or less of electric capacity. The Power Resources Office of Reclamation shall be the lead office of small conduit hydropower policy and procedure-setting activities under this Act. If an application was already provided to FERC prior to this Act, then it stands. Page 7-3
71 Lease of Power Privilege A Lease of Power Privilege agreement is a contractual right given to a non-federal entity used when Reclamation chooses to lease its right to develop hydropower at one of its facilities if that development does not interfere with other authorized project purposes. To implement Public Law , Reclamation revised its policy on the Lease of Power Privilege process that allows private developers, irrigation districts and others to implement projects on Reclamation facilities. A temporary process has been established (see: while the Reclamation manual is being updated, due to be completed in February CURRENT RULEMAKING EPA RULE III(d) On June 2, 2014, the U.S. Environmental Protection Agency, under President Obama s Climate Action Plan, proposed a plan to cut carbon pollution from existing power plants. See the proposed rules at (RIN 2060-AR 33). Public listening sessions were held nationwide at 11 sessions, including a session in Seattle in the Pacific Northwest region. The comment period has been extended to December 1, 2014 and a final rule is anticipated in June The proposal sets C02 standards for each state to be met by 2030 based on lowering carbon emissions by 30% below 2005 levels by The formula proposed for the state goals is the rate of C02 emissions from fossil fuel-powered plants in pounds divided by state electricity generation from fossilfuel powered plants and certain low- or zero-emitting power sources in megawatt hours (MWh). Each state must come up with a plan to meet the standard or form regional groups to do so. EPA is encouraging regional solutions as power plants are part of a large and complex interstate system. The state plans are due in June of 2016 with the potential of extensions available through June of The goal for the Pacific Northwest is about 60% reduction over all. Table 1: Proposed EPA Targets for Existing Power Plants State 2012 Emissions (lbs/mwh) 2030 Emissions (lbs/mwh) Percent Reduction Idaho % Montana 2,246 1,771 21% Oregon % Washington % Total 4,058 2,586 Page 7-4
72 Northwest electricity generation has half the carbon emissions as the rest of the nation, due to the region s massive hydroelectric system 1. While states like Washington and Oregon have some of the lowest emission rates in the country due to large hydroelectric resources, they have some of the steepest emission reductions by percentage under EPA s proposal. Washington, for example, would be required to have a 72% decrease in emissions. A number of factors and assumptions in the rules appear to drive some inequity in hydro rich states. For example, the base year for determining pollution decreases in the proposed rule is That was a year when the Pacific Northwest had an abundance of hydropower and displaced much of its generation from thermal facilities, giving the Northwest a very low carbon emission level of record. Discussions have centered on providing an alternative of a range of years to account for the differences among dry and wet years to provide more equity. The Northwest is unique in that the four states already participate in regional planning as the result of the federal Pacific Northwest Electric Power Planning and Conservation Act of 1980, administered by the Northwest Power and Conservation Council representing the four states. Hydropower represents 60% of the power generation mix in the Northwest 2 as compared to about 21% in the rest of the U.S. A number of programs are already reducing carbon emissions in the Northwest, including energy efficiency programs, retirement of coal plants, and the adoption of states renewable portfolio standards and other state incentives. The impact on the Northwest from the proposed rule is somewhat unclear at this time. The proposed rule could change significantly following the receipt of comments and revisions made by EPA. One of the largest concerns is that no credit for all of the region s prior actions to reduce emissions is taken into consideration in setting the goal.. 1 EIA (U.S. Energy Information Administration) Egrid data, average. 2 ibid Page 7-5

73 REGIONAL HYDROPOWER POTENTIAL SCOPING STUDY Contributors and Acknowledgments Principal Author Northwest Hydroelectric Association (NWHA) Executive Director, Jan Lee NWHA Board and Members contributions HDR Inc. Lisa W. Larson, P.E., Hydropower Specialist Richard R. Miller, P.E., Senior Vice President, National Director, Hydropower Rachel R. Darany, Senior Marketing Coordinator MWH Global Nathan A. Sandvig, Renewable Energy Project Management Michael D. Manwaring, North American Dams and Hydro Sector Lead Black & Veatch Frances Brinkman, P.E., Senior Engineering Manager Map Development Contributions Pacific State Marine Fisheries Commission Van C. Hare, GIS Manager Oak Ridge National Laboratory Nicole Samu, Geospatial Data Coordinator, Energy-Water Resource Systems Group, ESD
74 Appendix A: PACIFIC NORTHWEST HYDROPOWER POTENTIAL SCOPING STUDY - LIST OF STUDIES STUDIES AND ASSESSMENTS PROJECTS AT EXISTING UNPOWERED DAMS Author Prepared For Date Link National PNW Region A-1 Hydropower Resource Assessment at Non-Powered USACE Sites Hydropower Analysis Center US ACE July X X A-2 An Assessment of Energy Potential at Non-Powered Dams in the United States Oak Ridge National Lab U.S. Department of Energy April X X A-3 Hydropower Resource Assessment at Existing Reclamation Facilities Power Resources Office Bureau of Reclamation March X X CONDUIT AND KINETIC PROJECTS Author Prepared For Date Link National PNW Region B-1 Technical & Economic Feasibility Assessment of Small Hydropower Development in Deschutes River Basin Oak Ridge National Lab U.S. Department of Energy February X B-2 Integrated Basin-Scale Opportunity Assessment Initiative, FY 2011 Year-End Report: Deschutes Pacific NW Laboratory U.S. Department of Energy September X Basin Preliminary Hydropower Opportunity Assessment B-3 Feasibility Study on Five Potential Hydroelectric Power Generation Locations, North Unit Irrigation District Black Rock Consulting North Unit Irrigation District August X B-4 Power Extraction from Irrigation Laterals and Canals in the Columbia Basin Project University of Washington Grant County PUD January X B-5 Site Inventory and Hydropower Energy Assessment of Reclamation Owned Conduits Power Resources Office Bureau of Reclamation March X X B-6 Bureau of Reclamation Renewable Energy Update Bureau of Reclamation Department of the Interior July X X B-7 Scoping Study of Hydropower Potential in Wallowa County, Oregon Renewable Energy Solutions, LLC Energy Trust of Oregon November X PUMPED STORAGE/ENERGY STORAGE PROJECTS Author Prepared For Date Link National PNW Region C-1 Assessment of Opportunities for New US Pumped Storage Hydroelectric Plants Using Existing Water Idaho National Lab U.S. Department of Energy March X X Features as Auxiliary Reservoirs C-2 Appraisal Evaluation of Columbia River Mainstem Off-Channel Storage Options CH2M HILL Bureau of Reclamation May X C-3 Hydroelectric Pumped Storage for Enabling Variable Energy Resources within the Federal Columbia River Power System HDR Engineering Bonneville Power Administration September C-4 Technical Analysis of Pumped Storage and Integration with Wind Power in the Pacific Northwest MWH US Army Corp of Engineers August X TIDAL AND WAVE ENERGY PROJECTS Author Prepared For Date Link National PNW Region D-1 Assessment of Energy Production Potential for Tidal Streams in the US Georgia Tech Institute U.S. Department of Energy June X X D-2 Mapping and Assessment of the US Ocean Wave Energy Resources Electric Power Research Institute EPRI X X D-3 Assessment/Mapping of Riverine Hydroknetic Resource in the Contintental US Electric Power Research Institute EPRI x x GENERAL GENERATION PROJECT ASSESSMENTS: Author Prepared For Date Link National PNW Region E-1 New Stream-reach Development: Comprehensive Assessment of Hydropower Energy Potential in the US Oak Ridge National Lab U.S. Department of Energy April X X E-2 Assessment of Natural Stream Sites for Hydroelectric Dams in the PNW Region Idaho National Lab U.S. Department of Energy March X E-3 Irrigation Water Providers of Oregon: Hydropower Potential and Energy Savings Evaluation Black Rock Consulting Energy Trust of Oregon November X E-4 Small Hydropower Technology and Market Assessment Summit Blue Consulting Energy Trust of Oregon January X X E-5 Assessment of Waterpower Potential and Development Needs Electric Power Research Institute EPRI December X X E-6 Feasibility Assessment of the Water Energy Resources for the US for New Low Power & Small Hydro Classes Idaho National Lab U.S. Department of Energy January X X E-7 Estimation of Economic Parameters of US Hydropower Resources INEEL U.S. Department of Energy June MODELS/DATABASES/TOOLS Author Prepared For Date Link National PNW Region F-1 Northwest Hydrosite Database BPA/Council Ongoing X F-2 National Inventory of Dams US Army Corp of Engineers X X F-3 Hydropower Energy and Economic Analysis Tool Oak Ridge National Laboratory U.S. Department of Energy X X F-4 Virtual Prospector Tool Idaho National Lab X X F-5 Tidal Stream Interactive Map Georgia Tech Institute U.S. Department of Energy Jun-11 X X F-6 National Hydropower Asset Assessment Program (database) Oak Ridge National Laboratory U.S. Department of Energy X X LEGISLATION AND RULEMAKING Author Prepared For Date Link National PNW Region G-1 Bureau of Reclamation Small Conduit Hydropower Development and Rural Jobs Act US Congress Public Law Enrolled Aug X X G-2 Hydropower Regulatory Efficiency Act of 2013 US Congress Public Law Enrolled Aug X X G-3 EPA Rulemaking - Existing Power Plant Emissions Evnironmental Protection Agency Rulemaking 14-Jun-14 X X
75 Appendix B Page B-1 PARAMETERS OF STUDIES REVIEWED STUDIES AND ASSESSMENTS The study number correlates with the list of studies identified in Attachment A. PROJECTS AT EXISTING UNPOWERED DAMS A-1) Hydropower Resource Assessment at Non-Powered USACE Sites Objective: Assess the potential and economic feasibility of adding hydroelectric power to non-powered dams at USACE facilities Model: NHAAP (National Hydropower Asset Baseline Database); uses data and process from study #2 Approach: Of the 419 USACE non-powered dams of the USACE, 223 sites were reviewed: a) based on capacity (1 MW or larger), no current FERC license and no obvious hindrances in developing hydropower at these sites; b) using review of daily hydraulic head and flow values from 3 years of full data to determine seasonality and yearly hydrological variation and the relationship between hydraulic head and flow in conjunction and review of daily flows; c) base data from Oak Ridge National Laboratory when information not available from District offices Parameters: a) use of the maximum power value as a site s potential capacity; b) use of cost numbers from the Idaho National Engineering and Environmental Laboratory s (INEEL) 2003 study (study #21, attachment A) and the Bureau of Reclamation study of 2011 (study #3, attachment A); c) calculation of monetary benefits (energy value of generation, federal incentives); and non-monetary benefits (avoided emissions of non-fossil fuel based resource) d) determination by two metrics: benefit-cost ration and internal rate of return, comparing the net present value of cost over 50 years; e) site specific restrictions were not considered: environmental impacts, water quality, etc.; and f) energy prices based on EIA (Energy Information Administration) projected data by USACE District. Pacific NW Potential: a) Portland District: 3 projects deemed feasible with a total capacity of MWs and generation of 56, MWh, avoiding millions of tons of emissions from GHG (greenhouse gasses); Applegate and Dorena were exempted from the analysis as they have existing FERC licenses although not developed yet. b) Seattle District: 2 projects reviewed, but only one deemed feasible with a total capacity of MWs and generation of 95, MWhs, avoiding millions of tons of GHG emissions. When determining the estimated potential for the Pacific NW, it will be necessary to add back USACE facilities that are in the FERC process and not yet generating which were removed from the study due to having an existing permit or license from FERC, which can occur in the NWHA team s analysis of FERC applications.
76 Protected Areas Impact: Existing diversions are exempt from protected area restrictions. A-2) An Assessment of Energy Potential at Non-Powered Dams in the United States Objective: Identify non-powered dams (NPDs) to assess energy potential nationally Model: NHAAP (National Hydropower Asset Baseline Database); uses data and process from study #2 Approach: a) analysis of 54,391 sites of 80,000 available national; capacity potential of 12,000 MWs b) does not include sites under construction (get info from FERC analysis) c) assumes all existing flows through dams for capacity calculation and basin runoff potential d) only dams 5 or higher analyzed Parameters: Assesses only energy production as other mitigation factors considered to be addressed during original construction; no cost or regulatory review Pacific NW Potential: 225 MWs Only one site is named in the PNW because the study just shows the top 100 sites by name, which includes Howard A. Hanson Dam in Washington. The rest of the 225 MWs is not identified by site. A-3) Hydropower Resource Assessment at Existing Reclamation Facilities Objective: Identify and assess generation on existing Reclamation facilities Model: Reclamation Hydropower Assessment Tool Approach: Assessed 503 sites in the west based on flow records and other data already available; 191 dams and 52 canal systems nationally determined to have potential for further evaluation Parameters: Cost, economic benefits, transmission, equipment, green incentives, mitigation costs Pacific NW Potential: a) feasible sites in the PNW: 38.1 MW potential b) of 105 sites reviewed, only 34 with potential Page B-2
77 CONDUIT AND KINETIC PROJECTS (with some non-powered dams) B-1) Technical & Economic Feasibility Assessment of Small Hydropower Development in Deschutes River Basin Objective: Identify and assess opportunities for new small hydro in the Deschutes Basin Model: HEEA (Hydropower Energy and Economic Analysis Tool) of the Oak Ridge National Laboratory Approach: Assess ability to add new generation at non-powered dams and existing canals/conduits, implementing a new basin scale approach Parameters: Costs, inclusion of green incentives Pacific NW Potential: Potential of 27 MWs, considering 14 NPDs and 15 irrigation canal conduits; MWs deemed viable with 78,242 MWhs of energy generation. B-2) Integrated Basin-Scale Opportunity Assessment Initiative, FY 2011 Year-End Report: Deschutes Basin Preliminary Hydropower Opportunity Assessment Objective: Determine if a comprehensive basin analysis can result in increased hydropower generation while maintaining ancillary benefits such as water quality while maintaining other water uses (irrigation, instream flows, municipal) Model: a) BSOA (Basin Scale Opportunity Assessment Toolbox); and b) VIC (Variable Infiltration Capacity) Approach: a) Assess potential generation if objectives described above are met b) Uses base data from Study #2 Parameters: Environmental, passage, economic benefit, transmission, flows, protected areas Pacific NW Potential: Does not breakdown potential; this is a draft; there may be a later version, which will be researched. B-3) Feasibility Study on Five Potential Hydroelectric Power Generation Locations, North Unit Irrigation District Objective: Page B-3
78 Identify and assess potential generation sites within the North Unit Irrigation District (vicinity of Madras, OR) Model: General field review; no specific model Approach: a) Field survey data review b) Flow data review from irrigation district records c) Economic information from other projects recently constructed in the Deschutes Basin Parameters: Flow, transmission, economics, revenue, incentives Pacific NW Potential: MWs with potential energy generation of 6, MWhs. B-4) Power Extraction from Irrigation Laterals and Canals in the Columbia Basin Project Objective: Graduate thesis detailing how to define and select hydrokinetic and conventional hydropower projects in the Columbia Basin Project irrigation districts Model: None Approach: a) Details new hydrokinetic equipment and potential for generation b) Explores costs of various use of equipment with comparisons Parameters: Cost, equipment; no analysis of impacts Pacific NW Potential: Cites 3 potential projects that would equate to 3.2 MW capacity in the system. Given the large Columbia Basin Project system, there are likely many more projects within that system as well as other NW irrigation districts with substantial kinetic energy potential. This study addresses developing a model. B-5) Site Inventory and Hydropower Energy Assessment of Reclamation Owned Conduits Objective: Supplemental assessment to study #3, adding a substantial number of canal facilities that could provide generation as conduit projects on Reclamation facilities and an update of the 2007 study Potential Hydropower Development at Existing Federal Facilities Model: Hydropower Assessment Tool Page B-4
79 Approach: Reclamation staff a) researched project drawings of existing facilities b) conducted physical field tours c) reviewed aerial imagery d) evaluated flow exceedance minimums for sizing generation capacity e) garnered local experiential data from facility operators Parameters: Flow, proximity to transmission (not addressed in earlier studies), site maps, seasonal analysis Pacific NW Potential: Total western potential 373 sites, 104 MWs Pacific Northwest: 111 canal sites with 34.0 MWs capacity and 116, MWhs generation. B-6) Bureau of Reclamation Renewable Energy Update Objective: In July of 2014 Reclamation provided an updated document detailing new hydropower projects that have come on line or were in development at that time. Some were provided funds from Reclamation s Water Smart program and some projects are being developed under Reclamation s Lease of Power Privilege program. Model: These are not modeled results, but results based on studies conducted. Approach: Listing of in development projects. Parameters: These are projects more likely to move forward. They are either at existing dams or on conduits so they would be exempt from the Protect Areas prohibition. Pacific NW Potential: Conventional and conduit projects: 18 projects totaling MWs and 91,243 MWhs of energy production. The update also includes 2,250 MWs of pumped storage at 2 projects with 4,672,000,000 MWhs of generation. B-7) Scoping Study of Hydropower Potential in Wallowa County, Oregon Objective: The study seeks to identify viable conduit exemption projects in Wallowa County (northeastern) Oregon related to irrigation infrastructure. Model: These are not modeled results, but results based on field studies conducted. Page B-5
80 Approach: The consultant conducted field studies of the project and calculated capacity, production, available flows based on water right, water availability based on state agency records, and project development costs. Parameters: These are projects on existing irrigation infrastructure and are not new diversions, therefore they are exempt from the Protect Areas prohibition. Pacific NW Potential: A total of 22 conduit sites were identified, providing 1.02 MWs of capacity and 3,391 MWhs of generation production. PUMPED STORAGE/ENERGY STORAGE PROJECTS C-1) Assessment of Opportunities for New US Pumped Storage Hydroelectric Plants Using Existing Water Features as Auxiliary Reservoirs Objective: Assesses pumped storage potential nationally using existing water features as reservoirs Model: None Approach: a) Used GIS capabilities to research b) Developed applicable criteria to define 4 different types of sites (see PNW potential below) c) Identified surface water bodies with more than 100 acres and applied criteria Parameters: Technical review of sites based on physical properties; does not include cost or environmental impacts Pacific NW Potential: a) Pumped storage at existing hydropower facilities (dam/reservoir) OR MW; WA 19 MW b) Pumped storage at non-powered dams, 1 MW or greater 0 c) Pumped storage at greenfield sites of 10 MW or greater ID 10 MW; MT 22 MW; OR 131 MW; WA 272 MW C-2) Technical Analysis of Pumped Storage and Integration with Wind Power in the Pacific Northwest Objective: Describes various aspects of pumped storage development and integration with wind power in the NW Model: None Approach: Page B-6
81 Details all the aspects of developing pumped storage from a technology point of view and how the technology could be addressed in the PNW. Parameters: Physical attributes Pacific NW Potential: Potential new projects not identified specifically, but provides a list of projects that were in the FERC process in 2009: a) NW pump storage projects with a FERC issued preliminary permit in ,421 MW capacity b) NW pumped storage projects with a FERC preliminary permit pending in ,032 MW capacity C-3) Appraisal Evaluation of Columbia River Mainstem Off-Channel Storage Options Objective: Analyze and compare four off-channel reservoir sites on the Columbia River mainstem in WA state Model: None Approach: Development of sizing options comparing sites using a range of criteria, identifying power generation as a secondary benefit Parameters: Transmission lines, internal project pumping electrical needs, flow analysis, other water uses, cultural and environmental impacts, geology, socioencomics Pacific NW Potential: Of the sites considered, one of which may be selected, the power capacity varies from 69 MWs to 1,136 MWs, which will eventually be determined by the height of the dam, which facility is chosen (if any), the size of the reservoir and the scheduling of flows for power generation. C-4) Technical Analysis of Pumped Storage and Integration with Wind Power in the Pacific Northwest Objective: The study was conducted for the Bonneville Power Administration to identify strategies for combining wind integration and pumped storage technologies, with the potential of returning flexibility to the Federal Columbia River Power System (FCRPS). Model: A specific model was not used for the overall review, but Microfin was used to determine plant costs for estimated revenues derived in the study to show recovery of BPA costs associated with providing wind balancing reserves from the identified pumped storage alternatives for high levels of wind penetration. Page B-7
82 Approach/Parameters: The consultant reviewed how grids in Europe utilize both conventional hydropower storage and new pumped storage for integrating variable energy resources. The study also demonstrated how much flexibility and system reserves could be provided by Reclamation s Keys Pumped Storage Project. The study also addressed proposed projects in the U.S. that have been granted and/or filed for a FERC preliminary permit. Pacific NW Potential: Identifying new sites was not within the scope of the study, but some existing sites were referenced in the Pacific NW totaling 5,295 MWs of capacity. (See page 3, chapter 3.) TIDAL AND WAVE ENERGY PROJECTS D-1) Assessment of Energy Production Potential for Tidal Streams in the US Objective: Development of national database for tidal stream and current flow energy generation potential and development of a GIS tool and mapping feature to accelerate the market for tidal energy (see also study item #27 mapping tool) Model: Regional Ocean Modeling System Approach: a) Use of minimal grid resolution tool b) Use of bathymetric data interpolated onto model grid c) Determination of harmonic constituents for tidal current d) Use of kinetic readings of 2700 readings of NOAA tidal current stations Parameters: a) Velocity and flow rate b) Seabed geology and depth c) Environmental impacts d) Electric grid connection and energy e) Competing costs of other electricity sources Pacific NW Potential: Total theoretical power available along the coast of Pacific Northwest states: OR - 48 MW WA 683 MW D-2) Mapping and Assessment of the US Ocean Wave Energy Resources Objective: Assessment and mapping of US ocean wave energy resources to determine potential generation and to provide a third party validation by NREL Model: Page B-8
83 Use of Wavewatch III hindcast database developed by NOAA Approach: a) Determine cumulative development through probability distribution analysis b) Use of three capacity packing densities as input c) Quantitative analysis of coastal and marine spatial planning d) Formula derivation for developer project lease areas required e) Definition of accommodating different wave climates Parameters: Physical parameters only; does not consider Oregon s mapped development areas for tidal resources. Pacific NW Potential: WA 188 TWh/yr: 72 TWh/yr Inner Shelf; 116 TWh/yr Outer Shelf OR 322 TWh/yr: 143 TWh/yr Inner Shelf; 179 TWh/yr Outer Shelf D-3) Assessment/Mapping of Riverine Hydrokinetic Resource in the Continental U.S. Objective: The Electric Power Research Institute (EPRI) assessed hydrokinetic resources in the 48 contiguous state to determine potential power that might be generated by hydrokinetic project development. Model: The spatially-explicit data contained in the NHDPlus, a GIS-based database containing river segment-specific information on discharge characteristics and channel slope was used in the assessment. (Details: pages 5-1 through 5-8 of the study) Approach: A total of 73,298 river segments having a mean annual flow greater than 1,000 cubic feet per second (cfs) mean discharge were included in the assessment. River segments with existing hydroelectric dams were excluded. Parameters: The studied used hydrologic and physical components but does not take into account environmental impacts or costs. Pacific NW Potential: While the studies identified net potential resources, no specific projects were identified. GENERAL GENERATION PROJECT ASSESSMENTS: E-1) New Stream-reach Development: Comprehensive Assessment of Hydropower Energy Potential in the US Objective: Reconnaissance level analysis of undeveloped stream reaches considering the technical resource that could be available for development Page B-9
84 Model: NHAAP (National Hydropower Asset Assessment Project) Approach: a) Analysis of 3 million US stream reaches w/high energy density potential b) Use of topographical tools to determine surface inundation and reservoir storage area c) Environmental attribution to spatially join energy potential of reaches with natural ecological systems, social and cultural settings, policies, management and legal constraints Parameters: Review of fish habitat, recreational use, natural ecological systems, sensitive species, social and cultural importance and regulatory constraints. Pacific NW Potential: PNW has 32% of national potential of 25,266 MWs and 148,999,000 MWh/yr at 67% capacity. Capacity/MW MWhs/yr ID 7,018 41,015,000 MT 4,763 28,201,000 OR 8,920 53,353,000 WA 7,381 43,788,000 Total 28, ,357,000 E-2) Assessment of Natural Stream Sites for Hydroelectric Dams in the PNW Region Objective: Obtain total and site specific hydro potential and information about the physical characteristics and impacts of using a ;dam as a hydro development at greenfield sites, building on earlier INEL studies using Region 17 (OR/ID/WA) as a pilot project Model: Approach: a) Each stream reach considered a potential development site b) Considers dimensions of constructed impoundment boundary for dam and extent of inundated area produced by reservoir c) Focus on small hydro projects to eliminate unrealistic project site reaches that were part of a large river Parameters: a) Federal exclusion applied federal land use designations b) Environmental exclusions environmentally sensitive areas c) Definition of small hydro for purposes of this study: 2 to 60 MWs of capacity; energy component of less than 1 MWa up to 30 MWa of average annual power potential Page B-10
85 Pacific NW Potential: ID/OR/WA: No. Reaches Capacity MW All reaches: 231, ,666 Capacity potential less than 1 MW: 29, ,485 Small hydropower reaches: 24,489 73,934 Available small hydropower reaches: 15,676 42,835 Candidate small hydropower sites: selected for further assessment 5,439 15,021 (Montana not included in Region 17 and only Region 17 included in pilot) E-3) Irrigation Water Providers of Oregon: Hydropower Potential and Energy Savings Evaluation Objective: Assessment of project potential in certain Oregon irrigation districts and to identify potential energy upgrade projects within delivery systems or end user equipment such as pumps Model: None Approach: a) Analysis of water rights of 108 irrigation water suppliers in Oregon b) Secondary review through survey of 29 suppliers with potential projects of.5 MW or larger c) Physical analysis of sites resulting in feasibility review of 14 suppliers representing 30 sites Parameters: Flow rate, seasonality and stability of water right Interconnection cost and issues Equipment configuration and estimated costs Permitting and regulatory issues Review of protected areas Environmental parameters: protected species, water quality, wild and scenic rivers, passage Power sales revenue Land use siting Incentives Pacific NW Potential: OR 58,523 kwhs energy MW E-4) Small Hydropower Technology and Market Assessment Objective: Develop an understanding of hydro technologies, project types, configurations and associated cost for hydropower in Oregon, as well as reviewing institutional constraints and incentives Page B-11
86 Model: None Approach: a) Database analysis of 41,500 water rights in Oregon within PGE and PacifiCorp service areas, addressing the largest water users b) Develop a map of water right holders by region c) Segment large water users into 5 groups: municipal, irrigation, industrial/manufacturing, storage and agriculture d) Survey large water right holders w/water rights of 10,000 acre feet or more with a priority of 1980 or earlier. Parameters: Regulatory and permitting issues Water right size and priority, seasonality and stability Incentives Projects with existing diversions Capital and operation and maintenance costs Transmission access Market assessment Pacific NW Potential: The report did not determine the capacity and energy components, only the size of water rights. E-5) Assessment of Waterpower Potential and Development Needs Objective: Assess waterpower potential and development needs in support of US DOE s Renewable Research Programs such as R&D, incentive tax credits, etc. Model: None Approach: a) Identification and review of pertinent literature evaluating existing data sources b) Consultation with industry personnel and project owners with relevant knowledge c) Identification of need to extend incentives such as the production tax credit and Clean Renewable Energy Bonds (CREBs) to 2015 d) Identification of regulatory process enhancements Parameters: Pacific NW Potential: Only identified national numbers: 23,000 MW by 2025 (10,000 MW from conventional hydro; 3,000 from new hydro kinetic projects; and 10,000 ocean tidal energy devices Page B-12
87 E-6) Feasibility Assessment of the Water Energy Resources for the US for New Low Power & Small Hydro Classes Objective: Updates 2004 study with new feasibility criteria Model: None See also Virtual Hydropower Prospector Database and Mapping (#26) which coordinates with this study Approach: a) Review feasibility of earlier study by assuming a development model not requiring a dam but instead a penstock running parallel to the stream and returning water to the stream at the end of the penstock b) Assume only small or micro hydro development c) Limit flow for project to no more than half of the live streamflow or to produce 30 MWa, whichever is less Parameters: Site accessibility Load or transmission proximity Land use and environmental sensitivities Site within 1 mile of road Site within 1 mile of transmission or power infrastructure Pacific NW Potential: Reviewed 500,000 sites nationally, reducing to 5400 sites with 18,000 MWa as viable ID 2,122 MWa MT 1,669 MWa OR 2,072 MWa WA 3,106 MWa E-7) Estimation of Economic Parameters of US Hydropower Resources Objective: Develop tools for estimating the cost of project development, operation, maintenance and upgrading of hydroelectric plants and estimating generation potential Model: Use of Hydropower Evaluation Software (HES) Approach: a) Develop separate tools for costs and 5 types of environmental mitigation b) Develop median costs for capacity development c) Apply tools to previously identified hydropower resources identified in by earlier studies d) Assume that capacity is within the range of 1 MW or more, but no more than 1300 MW capacity; Page B-13
88 does not include pumped storage Parameters: Fish and wildlife mitigation Recreation mitigation Cultural resources evaluation Water quality monitoring Fish passage Pacific NW Potential Does not provide assessment of potential projects MODELS/DATABASES/TOOLS The following databases have specific detail of projects which are referred to within the above studies. We will be using those tools to assist in estimating future potential in the final report. F-1) Northwest Hydro site Database F-2) National Inventory of Dams F-3) Hydropower Energy and Economic Analysis Tool F-4) Virtual Prospector Tool F-5) Tidal Stream Interactive Map F-6) National Hydropower Asset Assessment Program (database) LEGISLATION AND RULEMAKING G-1) Bureau of Reclamation Small Conduit Hydropower Development and Rural Jobs Act G-2) Hydropower Regulatory Efficiency Act of 2013 The final report will describe current legislation and rulemaking. Page B-14
89 APPENDIX C Appendix C includes a summary of the following documents: Federal Energy Regulatory (FERC) Tables Identifying applications in process Issued exemptions Pending conventional preliminary permits Licensed marine projects Issued preliminary permits for pumped storage Issued preliminary permits for conventional hydropower Tax Credits Issued Survey Results from NWHA Survey conducted September 2014 Survey questions Compilation of survey forms from respondents Lease of Power Privilege and other projects U.S. Bureau of Reclamation Project Potential Identified in Review of Studies by Technology Type Compilation of charts from Chapters 1-5 The most reliable information comes from the FERC applications and survey responses as action has been taken to pursue projects by the entities responding to the survey and by applicants who have filed their intentions with FERC to study and pursue the listed projects. Some of the studies have less specific information and represent potential without significant feasibility analysis. FERC TABLES Federal Energy Regulatory (FERC) Tables Identification of applications in process PROJECT TYPE TABLE NO. OF STATUS CAPACITY ENERGY PROJECTS (MW) (MWh) Conduit Exemptions 1 9 Issued ,837 Conduit Exemptions 2 11 Issued ,000 Licensed Marine 3 2 Issued ,500 Conventional Hydro - Permits 4 2 Pending ,870 Conventional Hydro - Permits 5 22 Issued ,436 Conventional Hydro - Licenses 6 9 Pending ,952 Pumped Storage - Permits 7 9 Pending 7, ,123,686 TOTAL 64 7, , Issued Conduit Exemptions Projects approved by FERC and project development can be underway Page C-1 Applications filed before the new legislation (chapter 7) requiring exemption permit (Table 1) Applications filed after the legislation was enacted requiring only a notice of intent (Table 2)
90 (must be 5 MW or less capacity to file a notice of intent; conduit exemptions more than 5 MW and up to 40 MW must file an exemption permit) Conduit exemption projects are those with generation equipment within or at the end of canals, pipelines, ditches and other man-made conveyance facilities that as their primary purpose supply water to agriculture, municipal or industrial purposes. Permits (Tables 4, 5) A preliminary permit allows a 3 year study period for project planning purposes; potential extensions are available under approved circumstances for up to 4 years. Licenses (Tables 3, 6) Licenses are awarded after necessary studies and public process are completed, generally after the permit stage, although it is possible to start at the license level without applying for a preliminary permit. Once a license is awarded, then construction can begin. Table of Tax Credits Issue (Table 7) FERC record of tax credits issued on upgrade projects SURVEY RESPONSES Table B represents the responses received during the survey conducted in September 2014 by NWHA to ascertain projects planned or underway by generators, both utility and non-utility generators. In addition some state and federal agencies provided information that represents filings made in the public record. Page C-2

91 SURVEY Pacific Northwest Hydropower Potential Scoping Study Introduction The Northwest Power and Conservation Council has awarded a contract to the Northwest Hydroelectric Association (NWHA) to complete the Pacific Northwest Hydropower Potential Scoping Study. The NWHA is compiling information from various studies that have been conducted over the past ten years at both the regional and national level. These studies identify significant potential in the Pacific Northwest, but are often missing key elements of analysis necessary for determining realistic potential for example, environmental protected areas and cost effectiveness. NWHA will be providing information that will help the Council determine as part of its power planning if a realistic potential can be drawn from existing studies or if further steps need to be taken. As part of this hydropower potential scoping study, and in recognition of the current refurbishment of many existing regional hydropower facilities, NWHA is conducting a voluntary survey of current and future hydropower development in the Pacific Northwest. We are collecting information about specific hydropower projects that may be either in progress or on the drawing board that are anticipated to be developed within the next 20 year period. Projects may be new development, or may be efficiency and capacity improvements to existing projects. We will separate the responses into two time periods: 1) projects potentially available in the 5 year period beginning ; and 2) projects potentially available for the rest of the 20 year period NWHA and the Council greatly appreciate your participation in this voluntary survey. Responses are due by September 22nd in order for the NWHA to include it in the final deliverable to the Council. If you have any specific questions or concerns as you complete the survey, please feel free to call or Jan Lee at NWHA or Gillian Charles at the Council. Thank you. Jan Lee Executive Director Page C-3
Hydropower Potential Studies Reviewed for Scoping Study. Twenty four studies reviewed Grouped by categories Organized by chapters in report
 Hydropower Potential Studies Reviewed for Scoping Study Twenty four studies reviewed Grouped by categories Organized by chapters in report PROJECTS AT EXISTING UNPOWERED DAMS A 1 Hydropower Resource Assessment
Hydroelectric Pumped Storage Potential and Renewable Energy Integration in the Northwest
 Hydroelectric Pumped Storage Potential and Renewable Energy Integration in the Northwest Wind generation on Bonneville Power Administration s (BPA) system in the Northwest grew from almost nothing in 1998
CONTENTS LIST OF TABLES LIST OF FIGURES
 CONTENTS 1.0 PURPOSE OF ACTION AND NEED FOR POWER... 1-1 1.1 PURPOSE OF THE ACTION... 1-1 1.2 NEED FOR PROJECTS... 1-3 1.2.1 PacifiCorp Operations... 1-3 1.2.2 Cowlitz PUD Operations... 1-5 1.2.3 Regional
Basin-Scale Hydropower and Environmental Opportunity Assessments
 Basin-Scale Hydropower and Environmental Opportunity Assessments A framework for identifying and evaluating hydropower and environmental opportunities and linkages Simon Geerlofs, Jerry Tagestad, Kyle
SB 838: Oregon Renewable Energy Act Establishing an Oregon Renewable Energy Standard
 SB 838: Oregon Renewable Energy Act Establishing an Oregon Renewable Energy Standard Section-by-Section Summary SB 838, C-engrossed version As passed by Oregon House of Representatives, May 23 rd, 2007.
Low Impact Hydro Workshop Bend Oregon 23 September. 2010
 Low Impact Hydro Workshop Bend Oregon 23 September. 2010 FRUITS FROM THE EFFORT Siphon Power Plant Fully owned by COID On line producing revenue since 1989 Funded through ODOE SELP Debt obligation paid
Seventh Northwest Conservation and Electric Power Plan
 Seventh Northwest Conservation and Electric Power Plan CHAPTER 19: METHODOLOGY FOR DETERMINING QUANTIFIABLE ENVIRONMENTAL COSTS AND BENEFITS AND DUE CONSIDERATION FOR ENVIRONMENTAL QUALITY, FISH AND WILDLIFE,
Eska Creek Preliminary Feasibility Analysis
 Introduction Eska Creek Preliminary Feasibility Analysis This report examines the feasibility issues of energy and economics for a 1.8 MW hydroelectric project on Eska Creek (project). The Project is located
SB 838: Oregon Renewable Energy Act Establishing an Oregon Renewable Energy Standard
 SB 838: Oregon Renewable Energy Act Establishing an Oregon Renewable Energy Standard Section-by-Section Summary SB 838 with -2 Amendments as introduced in Senate Environment Committee, March 15 th, 2007
For Bandon Utilities Commission
 For Bandon Utilities Commission July 12, 2017 Profile BPA, a component of the U.S. Department of Energy, is a non-profit and self-funded power marketing administration in the Pacific Northwest. Congress
Puget Sound Energy 2016 Annual Renewable Portfolio Standard Report pursuant to RCW and WAC
 Puget Sound Energy 2016 Annual Renewable Portfolio Standard Report pursuant to RCW 19.285.070 and WAC 480-109-210 June 1, 2016 Required Contents: Checklist and Table of Contents RCW 19.285.070 WAC 480-109-210(2)
Northwest Power and Conservation Council
 Northwest Power and Conservation Council Pumped Storage GRAC Meeting Banks Lake Pumped Storage Project (North Dam) FERC Project No. 14329 Portland, Oregon January 27, 2015 Presented by: Lloyd Reed and
California s Renewable Portfolio Standard Program
 California s Renewable Portfolio Standard Program By Annette Faraglia PG&E Law Dept. 2009 Annual NHA Conference Washington, D.C. May 12, 2009 California s Renewable Portfolio Standard ( RPS ) is one of
DRAFT RECLAMATION MANUAL RELEASE Comments on this draft release must be submitted to Michael Pulskamp at by 5 PM on June 4, 2012.
 Background and Purpose of the Following Temporary Release (TRMR) Directive and Standard (D&S) The goal of preparing this TRMR D&S document, and providing stakeholders with the opportunity to comment on
Renewable Portfolio Standards
 Renewable Portfolio Standards Lisa Schwartz Presentation to Oregon State University Energy Economics Class Feb. 22, 2010 The Regulatory Assistance Project China EU India United States About the Regulatory
Overview of Recent Developments in California Environmental Laws
 Overview of Recent Developments in California Environmental Laws Northwest Hydropower Conference March, 2009 James M. Lynch, Partner K&L Gates LLP (206) 370-6587 jim.lynch@klgates.com FERC Licensed Hydropower
Oregon Renewable Energy Resources
 Background Brief on September 2012 Inside this Brief Overview of Renewable Energy Renewable Portfolio Standard Energy Facility Siting Renewable Energy Legislation Staff and Agency Contacts State Capitol
Ketchikan - Whitman Lake Hydro Project
 FY 2011 Capital Budget Total Project Snapshot Report Agency: Commerce, Community and Economic Development Grants to Municipalities (AS 37.05.315) Grant Recipient: Ketchikan Project Title: Ketchikan - Whitman
Review of the Colorado FERC Pilot Project and the Hydropower Regulatory Efficiency Act
 Review of the Colorado FERC Pilot Project and the Hydropower Regulatory Efficiency Act Kurt Johnson Telluride Energy 970-729-5051 kurt@tellurideenergy.com September 12, 2013 NW Hydro Association Small
Enter information in green-shaded fields. Do not modify blue-shaded fields. Energy Independence Act (EIA) Renewable Energy Report 2017
 Renewable Energy Report 2017") Enter information in green-shaded fields. Do not modify blue-shaded fields. Energy Independence Act (EIA) Energy Report Loads and Resources 2015 Annual Load (MWh) 6,474,983 Report Date May 31, 2016 Annual
Enter information in green-shaded fields. Do not modify blue-shaded fields. Energy Independence Act (EIA) Energy Report Loads and Resources 2015 Annual Load (MWh) 6,474,983 Report Date May 31, 2016 Annual
Pumped Storage - The Proven Grid Scale Storage Solution. Presented to: NWPCC GRAC Committee
 Pumped Storage - The Proven Grid Scale Storage Solution Presented to: NWPCC GRAC Committee January 27, 2015 Presentation Agenda Part 1 Variable Energy Resources Integration Challenges The Need for Grid
Columbia River Basin Reservoir Operations
 Columbia River Basin Reservoir Operations Future of Our Salmon Conference Portland, OR October 18, 2016 Pete Dickerson, P.E. USACE Northwestern Division US Army Corps of Engineers 2 Columbia River Basin!
Lake County Success. support through synergistic local partnerships that not only mitigate, but also produce
 Lake County Success Generating Environmental Gains With Geothermal Power By Mark Dellinger, Administrator, Lake County (CA) Sanitation District, and Eliot Allen, Principal, Criterion/Planners Engineers
July 2, PROPOSED ACTION: Approve the Framework for the Wildlife Crediting Forum
 W. Bill Booth Chair Idaho James A. Yost Idaho Tom Karier Washington Dick Wallace Washington Bruce A. Measure Vice-Chair Montana Rhonda Whiting Montana Melinda S. Eden Oregon Joan M. Dukes Oregon July 2,
Exploring the Impacts of California s Renewable Portfolio Standard
 Exploring the Impacts of California s Renewable Portfolio Standard System Planning Committee April 2010 Table of Contents Purpose... 1 Vocabulary... 1 System Planning Committee s Initial Assessment...
Seventh Plan Midterm Assessment: Draft Resource Capital Cost Estimates for Wind and Solar. Reminder: How the Council develops capital cost estimates
 Seventh Plan Midterm Assessment: Draft Resource Capital Cost Estimates for Wind and Solar Gillian Charles & Mike Starrett Power Committee May 8, 2018 Reminder: How the Council develops capital cost estimates
PUBLIC UTILITY DISTRICT NO.1 OF FRANKLIN COUNTY INTEGRATED RESOURCE PLAN PREPARED IN COLLABORATION WITH
 PUBLIC UTILITY DISTRICT NO.1 OF FRANKLIN COUNTY INTEGRATED RESOURCE PLAN 2014 PREPARED IN COLLABORATION WITH Contributors Name Company Title Linda Esparza Franklin PUD Director of Power Management Richard
OREGON DEPARTMENT OF FISH AND WILDLIFE
 OREGON DEPARTMENT OF FISH AND WILDLIFE Ways and Means Subcommittee on Natural Resources Phase 2 Hunting Eastern Oregon First steelhead on the Deschutes River Crabbing on the Oregon Coast 1 Policy Option
UPDATE: RENEWABLE PORTFOLIO STANDARDS IN THE NORTHWEST - A renewable power struggle?
 UPDATE: RENEWABLE PORTFOLIO STANDARDS IN THE NORTHWEST - A renewable power struggle? Marlys Palumbo Van Ness Feldman, PC Seattle Small Hydropower Workshop September 22-23, 2011 RPS Policies www.dsireusa.org
Department of the Army, U.S. Army Corps of Engineers. Notice of Intent to Prepare the Columbia River System Operations Environmental
 4332-90 DEPARTMENT OF DEFENSE Department of the Army, U.S. Army Corps of Engineers DEPARTMENT OF ENERGY Bonneville Power Administration DEPARTMENT OF THE INTERIOR Bureau of Reclamation Notice of Intent
Hydropower in Minnesota's Future
 Hydropower in Minnesota's Future Editor's Note: Water power as a source of energy in Minnesota has many champions, and rightly so. Plans to increase the output of electricity from dams existing in our
APPENDIX B: WHOLESALE AND RETAIL PRICE FORECAST
 APPENDIX B: WHOLESALE AND RETAIL PRICE FORECAST Contents Introduction... 3 Key Findings... 3 Background... 5 Methodology... 7 Inputs and Assumptions... 8 Load... 8 Fuel Prices... 9 Resources... 9 Pacific
National Hydropower Association
 National Hydropower Association An Overview of Hydropower Arkansas Alternative Energy Commission March 20, 2014 1 About NHA 180+ members Operational Excellence Legislative Affairs NHA is a forum to unite
Expanding Hydropower and Pumped Storage s Contribution to Grid Resiliency and Reliability RFI#: DE-FOA
 DATE: February 21, 2018 Expanding Hydropower and Pumped Storage s Contribution to Grid Resiliency and Reliability RFI#: DE-FOA-0001886 SUBJECT: Request for Information (RFI) RESPONSE DUE: April 6, 2018
SNOHOMISH COUNTY PUBLIC UTILITY DISTRICT NO.1. Your Northwest renewables utility
 SNOHOMISH COUNTY PUBLIC UTILITY DISTRICT NO.1 Your Northwest renewables utility November 1,2012 VIA ELECTRONIC FILING Kimberly D. Bose, Secretary Federal Energy Regulatory Commission (FERC) 888 First Street
PJM Interconnection, L.L.C. ( PJM ) submits hereby submits its responses to the United
 submits hereby submits its responses to the United") PJM Interconnection, L.L.C. 2750 Monroe Boulevard Audubon, PA 19403 Jacqulynn B. Hugee Associate General Counsel T: (610) 666-8208 F: (610) 666-8211 jacqulynn.hugee@pjm.com Via WPTORFI@ee.doe.gov Hoyt
PJM Interconnection, L.L.C. 2750 Monroe Boulevard Audubon, PA 19403 Jacqulynn B. Hugee Associate General Counsel T: (610) 666-8208 F: (610) 666-8211 jacqulynn.hugee@pjm.com Via WPTORFI@ee.doe.gov Hoyt
July 1, Jim Ruff -- Manager, Mainstem Passage and River Operations
 Bruce A. Measure Chair Montana Rhonda Whiting Montana W. Bill Booth Idaho James A. Yost Idaho Dick Wallace Vice-Chair Washington Tom Karier Washington Melinda S. Eden Oregon Joan M. Dukes Oregon July 1,
Pipelines and Penstocks Avoiding operational issues throughout the life of your project
 Pipelines and Penstocks Avoiding operational issues throughout the life of your project Presenter Dan Murrer, P.E. 322 East Front Street Suite 200 Boise, ID 83702 Tel. 208.383.6108 Daniel.Murrer@CH2M.com
COLUMBIA RIVER BASIN 2016 LONG-TERM WATER SUPPLY & DEMAND FORECAST. Presented by Meghan O Brien, Aspect Consulting
 COLUMBIA RIVER BASIN 2016 LONG-TERM WATER SUPPLY & DEMAND FORECAST Presented by Meghan O Brien, Aspect Consulting Outline What is OCR? 2016 Supply and Demand Forecast Findings Policy Issues Examined Declining
Hydropower Impact Analyses for Water Supply Reallocation Studies
 Hydropower Impact Analyses for Water Supply Reallocation Studies Russell L. Davidson, MSCE, PE Water Supply Workshop 2 June 2009 Tulsa, OK 2 June 2009 Hydropower Analysis Center 1 Other 6% Fossil Steam
Comparison of Renewable Portfolio Standards (RPS) Programs in PJM States
 Programs in PJM States") Regulation or Legislation Geographic Eligibility Reporting Period Banking Credit Multipliers Technology - Specific (set asides) NJ MD DC PA DE HB 1308 / SB 869 (2004) Bill 15-747 (4/12/2005) SB 1030/Act
Regulation or Legislation Geographic Eligibility Reporting Period Banking Credit Multipliers Technology - Specific (set asides) NJ MD DC PA DE HB 1308 / SB 869 (2004) Bill 15-747 (4/12/2005) SB 1030/Act
PROPOSED AMENDMENTS TO A-ENGROSSED SENATE BILL 1547
 SB -A (LC 0) // (DJ/ps) Requested by Senator FERRIOLI PROPOSED AMENDMENTS TO A-ENGROSSED SENATE BILL 1 1 In line of the printed A-engrossed bill, after utilities insert ; creating new provisions; and amending
First of three parts. First, all water power is emissions free and, in this era of growing concern over climate change, that is of increasing value.
 Hydro Doesn t Have to Be Big By Lea-Rachel Kosnik 01.22.2008 12:20 PM (UTC) First of three parts Miller-McCune The era of large hydropower dams is clearly over in the United States. Hydropower production,
Can Connecticut Meet Renewable Portfolio Standards and Improve Air Quality, Increase Energy Reliability, and Strengthen the Economy?
 Can Connecticut Meet Renewable Portfolio Standards and Improve Air Quality, Increase Energy Reliability, and Strengthen the Economy? Joel M. Rinebold Director of Energy Alexander Barton Energy Specialist
Pacific Northwest Region, Forest Service Basin-scale Restoration Prioritization Process
 Pacific Northwest Region, Forest Service Basin-scale Restoration Prioritization Process Pacific Northwest Region U.S.D.A. Forest Service Dave Heller, Regional Fish Program Leader Bruce McCammon, Regional
Burt Hamner, Founder/Director, Hydrovolts.
 Burt Hamner, Founder/Director, Hydrovolts www.hydrovolts.com burt@hydrovolts.com 1 In business since January 2010; 10 staff; HQ at McKinstry Innovation Center; factory in Seattle - South Park Marina on
Pacific Northwest Low Carbon Scenario Analysis
 Pacific Northwest Low Carbon Scenario Analysis Achieving Least-Cost Carbon Emissions Reductions in the Electricity Sector November 8, 2017 Arne Olson, Partner Nick Schlag, Sr. Managing Consultant Jasmine
National Hydropower Association
 National Hydropower Association Alaska Power Association Meeting August 2015 1 Advancing the U.S. Hydro Industry Vision Mission Double the contribution of hydropower - America s largest, most trusted and
TREASURE COAST REGIONAL PLANNING COUNCIL M E M O R A N D U M. To: Council Members AGENDA ITEM 8
 TREASURE COAST REGIONAL PLANNING COUNCIL M E M O R A N D U M To: Council Members AGENDA ITEM 8 From: Date: Subject: Staff February 20, 2009 Council Meeting Report on Florida Renewable Energy Potential
Northwest Hydropower and Columbia Basin River Benefits Fast Facts
 Northwest Hydropower and Columbia Basin River Benefits Fast Facts 2013-14 Northwest RiverPartners is an alliance of farmers, utilities, ports and businesses that promotes: the economic and environmental
Preliminary Assumptions for On-Shore Wind Technologies. Gillian Charles GRAC October 2, 2014
 Preliminary Assumptions for On-Shore Wind Technologies Gillian Charles GRAC October 2, 2014 At the last meeting Discussed current status of wind development in PNW Reviewed recent trends in development
Avista Dam Relicensing Factsheet Commenting on the Draft License Application
 Avista Dam Relicensing Factsheet Commenting on the Draft License Application Please Note: This is intended for informational purposes only and does not constitute legal advice. The life of every river
Washington Conservation and Respect Report 2016
 Washington Conservation and Respect Report 2016 Protecting and enhancing the environment is a core principle for Pacific Power. While providing safe, reliable electric service to our customers, we strive
Financing Small Hydro Projects (SHP): The Challenges and the Opportunities
: The Challenges and the Opportunities") Financing Small Hydro Projects (SHP): The Challenges and the Opportunities Presented by: Mark Matousek Founder & Vice Chairman ORENCO Hydropower Presented at: NWHA Small Hydro Workshop 2011 September Clean
Financing Small Hydro Projects (SHP): The Challenges and the Opportunities Presented by: Mark Matousek Founder & Vice Chairman ORENCO Hydropower Presented at: NWHA Small Hydro Workshop 2011 September Clean
Background and Purpose of the Following Draft Directive and Standard (D&S)
") DRAFT RECLAMATION MANUAL RELEASE Comments on this draft release must be submitted to Michael Pulskamp at mpulskamp@usbr.gov by 5 PM MDT, March 28, 2014. Background and Purpose of the Following Draft Directive
DRAFT RECLAMATION MANUAL RELEASE Comments on this draft release must be submitted to Michael Pulskamp at mpulskamp@usbr.gov by 5 PM MDT, March 28, 2014. Background and Purpose of the Following Draft Directive
Utility Scale Integration of Wind and Solar Power
 Utility Scale Integration of Wind and Solar Power Charles Reinhold WestConnect Project Manager Southwest Renewable Energy Conference Flagstaff, AZ Presentation Overview WestConnect Background Area Control
PROJECT BRIEF for the John Hart Generating Station Replacement Project
 PROJECT BRIEF for the John Hart Generating Station Replacement Project Issue Date: March 13, 2012 TABLE OF CONTENTS John Hart Generating Station Replacement Project Page ii of 17 1. INTRODUCTION... 3 1.1
Clean and Secure Energy Actions Report 2010 Update. GHG Policies
 Alabama Alaska Arizona Arkansas California Colorado Connecticut Delaware Florida Georgia Participant in Climate Registry; climate action plan: Policy Planning to Reduce Greenhouse Gas Emissions in Alabama
MTEP18 Futures. Planning Advisory Committee June 14, 2017
 MTEP18 Futures Planning Advisory Committee June 14, 2017 Overview Objective: Present final MTEP18 Futures and an overview of stakeholder feedback Key Takeaways: Four Futures to be used in MTEP18 to consider
DATA ASSUMPTIONS AND DESCRIPTION OF STUDIES TO BE PERFORMED 2014 EGSL & ELL Integrated Resource Plans
 ENTERGY GULF STATES LOUISIANA, L.L.C. & ENTERGY LOUISIANA, LLC LPSC DOCKET NO. I-33014 DATA ASSUMPTIONS AND DESCRIPTION OF STUDIES TO BE PERFORMED 2014 EGSL & ELL Integrated Resource Plans This version
The Husker Power Plan: A New Energy Plan for Nebraska
 The Husker Power Plan: A New Energy Plan for Nebraska By Sommer Energy, LLC Anna Sommer President Tel. 315-386-3834 anna@sommerenergy.com Applied Economics Clinic Elizabeth A. Stanton, PhD Director and
THE KBRA S UNWARRANTED AND COSTLY SUBSIDIES
 THE KBRA S UNWARRANTED AND COSTLY SUBSIDIES Background: On January 7, 2010, the final draft of the Klamath Hydroelectric Settlement Agreement (KHSA) and the final draft of the Klamath River Basin Restoration
CANADIAN HYDROPOWER AND THE CLEAN POWER PLAN
 TECHNOLOGY CANADIAN HYDROPOWER AND THE CLEAN POWER PLAN by Kyle Aarons Doug Vine April 2015 CANADIAN HYDROPOWER AND THE CLEAN POWER PLAN by Kyle Aarons Doug Vine April 2015 2015,. All Rights Reserved.
MONTANA S ENERGY ECONOMY
 MONTANA S ENERGY ECONOMY EPDD Mission Foster creation of high quality jobs Increase tax base Increase Montana energy production The Schweitzer Energy Policy Long term, sustainable, reliable, and affordable
PGE s 2013 Integrated Resource Plan
 PGE s 2013 Integrated Resource Plan OPUC Public Meeting 2014 Portland General Electric. All rights reserved. Today s topics IRP public process Load-resource balance Assumptions and inputs E3 low-carbon
Eugene Water & Electric Board. The Future of Utilities in the Pacific Northwest
 Eugene Water & Electric Board The Future of Utilities in the Pacific Northwest 1 Eugene Water & Electric Board The Future of Utilities in the Pacific Northwest Erin Erben Manager, Power & Strategic Planning
Pacific Power Renewable Portfolio Standard Oregon Implementation Plan January 1, 2014
 Pacific Power 2015-2019 January 1, 2014 (Updated February 28, 2014) Pursuant to S 469A.075 and OAR 860-083-0400, PacifiCorp, d.b.a. Pacific Power (the Company or PacifiCorp), respectfully submits the Oregon
Reorienting the Bureau of Reclamation
 Reorienting the Bureau of Reclamation Eric Meyer When considering restoration programs, The United States Bureau of Reclamation (USBR) is not a typical restoration agency. The USBR has existed for nearly
Revised 8-4. Board of Directors Water Planning and Stewardship Committee. September 11, 2007 Board Meeting. Subject. Description
 Board of Directors Water Planning and Stewardship Committee September 11, 2007 Board Meeting Subject Adopt criteria for conveyance options in implementation of Long Term Delta Plan Description Revised
Integrated Resource Plan
 2011 Integrated Resource Plan Addendum Let s turn the answers on. June 27, 2011 For more information, contact: PacifiCorp IRP Resource Planning 825 N.E. Multnomah, Suite 600 Portland, Oregon 97232 (503)
Mid-C Seminar July 16 th, 2014
 NWPP Members Market Assessment and Coordination Initiative Mid-C Seminar July 16 th, 2014 Dan Williams, LC Chair, Portland General Electric Slides not reviewed or approved by MC Members 1 Agenda History
Greenhouse Gas Emission Factors Info Sheet
 Greenhouse Gas Emission Factors Info Sheet Are you putting together a greenhouse gas (GHG) inventory or climate action plan for a business, city, or county? Do you want to estimate the GHG savings associated
EAGLE MOUNTAIN Hydro Electric Pumped Storage Project
 EAGLE MOUNTAIN Hydro Electric Pumped Storage Project Eagle Crest Energy Company Making Renewable Energy Dependable Northwest Wind Integration Forum Portland, Oregon October 17, 2008 By Gil Tam Eagle Crest
NASEO 2017 Northeast Regional Meeting Energy Storage Initiative. DOER Commissioner Judith Judson
 NASEO 2017 Northeast Regional Meeting Energy Storage Initiative DOER Commissioner Judith Judson Energy Storage Initiative $10 million initiative launched in 2015 State of Charge study Demonstration projects
5 TH ANNUAL CAPE COASTAL CONFERENCE
 5 TH ANNUAL CAPE COASTAL CONFERENCE Overview of Marine Renewable Energy Activities in Massachusetts Bruce Carlisle MA Office of Coastal Zone Management Overview Drivers: climate goals and policies Summary
Valuing Pumped Storage: Debunking Myths; Creating Tools
 NORTHWEST HYDROELECTRIC ASSOCIATION 2016 Pumped Storage Workshop Valuing Pumped Storage: Debunking Myths; Creating Tools FEBRUARY 18, 2016 Portland Marriott Downtown Waterfront Portland, Oregon Three Interrelated
Beacon Power, LLC Response to the New York Energy Highway Request for Information (RFI) May 30, 2012
 May 30, 2012") Beacon Power, LLC Response to the New York Energy Highway Request for Information (RFI) May 30, 2012 RESPONDENT INFORMATION Beacon Power, LLC ( Beacon Power or the Company ), a manufacturer and merchant
Beacon Power, LLC Response to the New York Energy Highway Request for Information (RFI) May 30, 2012 RESPONDENT INFORMATION Beacon Power, LLC ( Beacon Power or the Company ), a manufacturer and merchant
Renewables Portfolio Standard (RPS) Sara Kamins April 2, 2008
 Sara Kamins April 2, 2008") Renewables Portfolio Standard (RPS) Sara Kamins April 2, 2008 RPS Presentation RPS Policy RPS Procurement Process RPS Compliance Rules Progress Towards Goals Project Development Hurdles Future of RPS 2
Renewables Portfolio Standard (RPS) Sara Kamins April 2, 2008 RPS Presentation RPS Policy RPS Procurement Process RPS Compliance Rules Progress Towards Goals Project Development Hurdles Future of RPS 2
Overview of current situation
 2 Richard Overview of current situation M. Taylor, Executive Director International Hydropower Association (IHA) Recent developments in the hydropower market 1. Current situation 2. Synergy with other
COLORADO S RENEWABLE ENERGY DEVELOPMENT TEAM (REDT)
") COLORADO S RENEWABLE ENERGY DEVELOPMENT TEAM (REDT) Streamlining Small Hydro Power Permitting: An Infrastructure and Economic Opportunity Presented at the 2012 ASERTTI/NASEO State Energy Policy and Technology
COLORADO S RENEWABLE ENERGY DEVELOPMENT TEAM (REDT) Streamlining Small Hydro Power Permitting: An Infrastructure and Economic Opportunity Presented at the 2012 ASERTTI/NASEO State Energy Policy and Technology
Small Business Industry Day Project Development Process
 Small Business Industry Day Project Development Process T.J. Fichera Project Manager Walla Walla District October 13, 2016 US Army Corps of Engineers BUILDING STRONG Agenda Business Lines Asset Management
The Value of Hydropower to the Northwest Grid
 The Value of Hydropower to the Northwest Grid November 2016 Acknowledgments This paper was developed and reviewed by PNUCC members. A special thank you to the following individuals for their time and effort
SMUD. Renewable Energy. Resources Eligibility Guidebook. First Edition October 2008 SACRAMENTO MUNICIPAL UTILITY DISTRICT
 SMUD Renewable Energy Resources Eligibility Guidebook First Edition October 2008 SACRAMENTO MUNICIPAL UTILITY DISTRICT Prepared By Elaine Sison-Lebrilla ADVANCED, RENEWABLE AND DISTRIBUTED GENERATION TECHNOLOGIES
Portland General Electric Renewable Portfolio Standard Oregon Compliance Report 2013
 Portland General Electric Renewable Portfolio Standard Oregon Compliance Report 2013 As an introduction and summary of the Compliance Report, answer the following questions: Why is PGE submitting a Compliance
CRS Report for Congress Received through the CRS Web
 Order Code RS20569 Updated January 9, 2003 CRS Report for Congress Received through the CRS Web Water Resource Issues in the 108th Congress Betsy A. Cody Specialist in Natural Resources Policy Resources,
BPA s Non-Wires Solutions Overview
 BPA s Non-Wires Solutions Overview How are we changing the Pacific Northwest? Mike Weedall Vice President, Energy Efficiency Bonneville Power Administration March 20, 2006 Overview BPA Profile Energy Efficiency
Read the following article from the United States Geological Survey and answer the questions that follow.
 Read the following article from the United States Geological Survey and answer the questions that follow. Hydroelectric power water use from the USGS.gov website Hydroelectric power must be one of the
Federal Columbia River Power System
 Federal Columbia River Power System Printed on recycled paper with soy-based ink. U.S. Army Corps of Engineers Bonneville Power Administration Bureau of Reclamation Section 1: A RIVER OF MANY USES, MANY
Carbon Capture & Sequestration in the California Context
 WESTCARB Regional Partnership Carbon Capture & Sequestration in the California Context Elizabeth Burton WESTCARB TECHNICAL DIRECTOR Lawrence Livermore National Laboratory 7000 East Avenue Livermore CA
Energy Trust of Oregon Strategic Plan
 Energy Trust of Oregon 2015-2019 Strategic Plan October 1, 2014 Introduction Who We Are Energy Trust of Oregon is an independent nonprofit organization dedicated to helping 1.5 million customers of four
Overview of EPA s Clean Power Plan for Existing Power Plants. Iowa Association of Municipal Utilities 3 rd Annual Energy Conference November 4, 2015
 Overview of EPA s Clean Power Plan for Existing Power Plants Iowa Association of Municipal Utilities 3 rd Annual Energy Conference November 4, 2015 EPA s Final Clean Power Plan for Existing Power Plants
APPENDIX E PHASE 2 SOCIOECONOMIC ANALYSIS
 APPENDIX E PHASE 2 SOCIOECONOMIC ANALYSIS E-1A Appendix E.DOC Appendix E to the Consultation Record High-Level Socioeconomic Analysis of the Landscape Options Phase 2 This Phase 2 analysis was originally
Atlantic Link: An Update. June 6, 2017
 Atlantic Link: An Update June 6, 2017 About Emera Publicly traded (TSX: EMA); approximately CDN$29 billion in assets Constructing the 500 MW Maritime Link a 170-kilometre subsea HVdc cable between Newfoundland
A Study of United States Hydroelectric Plant Ownership
 INL/EXT-06-11519 A Study of United States Hydroelectric Plant Ownership Douglas G. Hall, INL Project Manager Kelly S. Reeves, NPS June 2006 The INL is a U.S. Department of Energy National Laboratory operated
Guidelines for Preparing an Alternatives Analysis
 Policy Number: Policy No. 2017-01 Title: Guidelines for Preparing an Alternatives Analysis Effective Date: September 7, 2017 Authority: Policy: Public Law 91-575, 84 Stat. 1509 et seq., Sections 3.1, 3.4(2),
BUDGETARY/ECONOMIC IMPACTS
 Bruce A. Measure Chair Montana Rhonda Whiting Montana W. Bill Booth Idaho James A. Yost Idaho January 4, 2012 Joan M. Dukes Vice-Chair Oregon Bill Bradbury Oregon Tom Karier Washington Phil Rockefeller
Zero Net Carbon Portfolio Analysis
 Zero Net Carbon Portfolio Analysis Prepared for: Platte River Power Authority December 12, 2017 www.paceglobal.com Agenda Background Methodology Assumptions Cases Findings and Recommendations Page 2 Background
U.S. Nuclear Energy Program
 Office of Nuclear Energy U.S. Nuclear Energy Program Bradley Williams Senior Advisor, Office of Nuclear Energy U.S. Department of Energy October 13, 2016 Nuclear Energy Tribal Working Group Trends in Nuclear
Development of Business Standards and Deployment of MXES 6.2 at the U.S. Bureau of Reclamation Presented by Ken Maxey Manager, Maintenance Services
 Development of Business Standards and Deployment of MXES 6.2 at the U.S. Bureau of Reclamation Presented by Ken Maxey Manager, Maintenance Services Office Before the Rocky Mt. Maximo Users Group May 7,
John Shurts General Counsel
 Henry Lorenzen Chair Oregon Bill Bradbury Oregon Phil Rockefeller Washington Tom Karier Washington W. Bill Booth Vice Chair Idaho James Yost Idaho Pat Smith Montana Jennifer Anders Montana John Shurts