Integrating Solar and Net Zero Homes. EFG May 2016
|
|
|
- Shonda Charles
- 5 years ago
- Views:
Transcription

1 Integrating Solar and Net Zero Homes EFG May 2016
2 Roseville Electric Utility Municipal Utility located east of Sacramento CA. 57,000 customer (50,000 residential customers) 340 MW annual system peak High concentration of rooftop solar, 6% of single family homes have rooftop solar Adding approximately 700 residential customers per year due to greenfield development of new homes
3 California Policy Impacting Forecasts Zero net energy homes Rooftop solar adoption SB350 - Doubling of Energy Efficiency savings in existing commercial buildings by 2030 Electric vehicle adoption
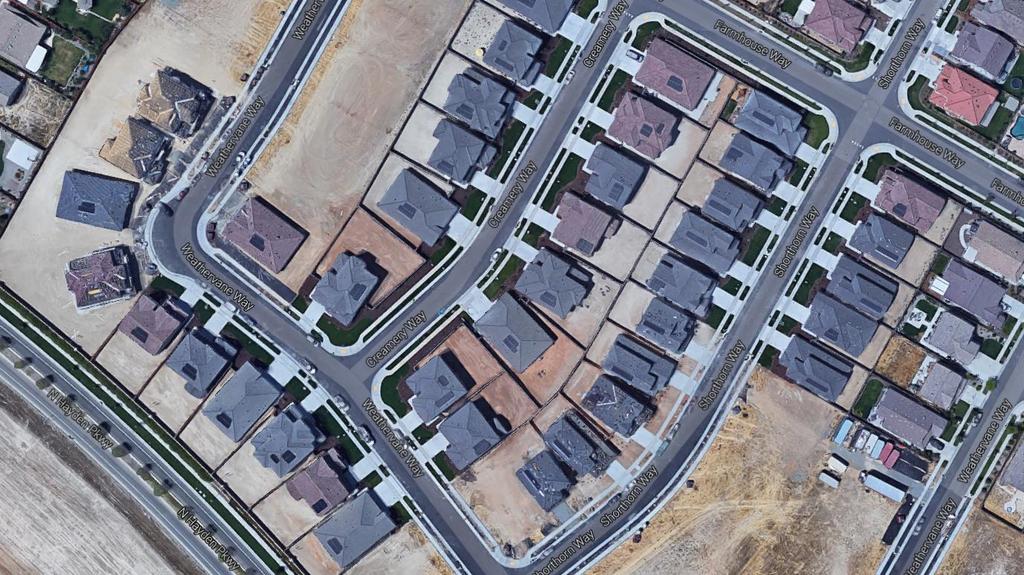
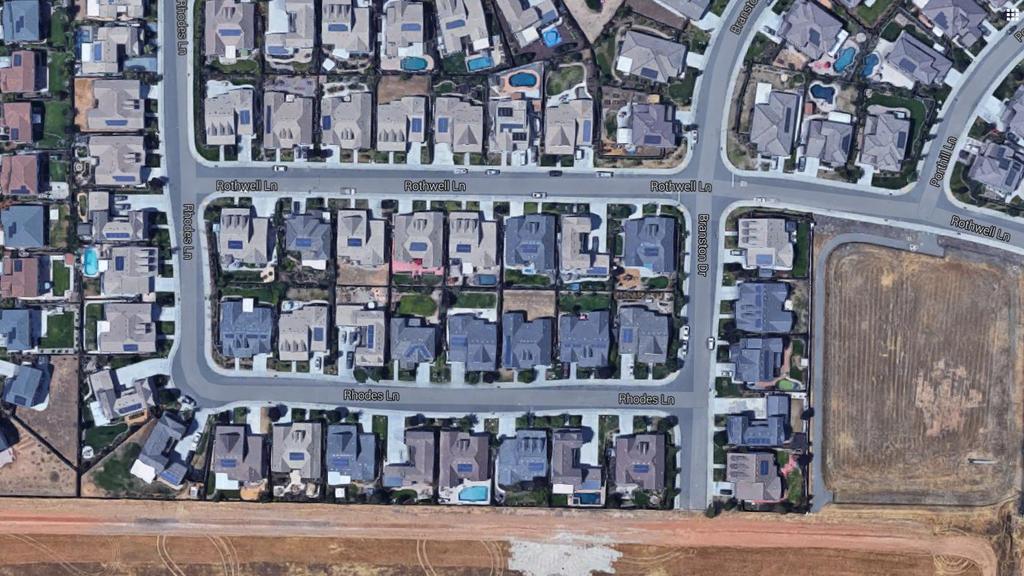
4 Zero Net Energy Homes
5 Zero Net Energy Homes All new home construction after 2020 will be net zero energy All new commercial after 2030 will be net zero energy Roseville is adding between 600 and 1000 new homes per year. An increasing number will be net zero 100% will be net zero starting in 2020.

6
7
8 Zero Net Energy Homes-impacts Homes will use no net energy over the course of a year. Size of rooftop solar will increase on new construction homes. Distributed solar generation will vary depending on the season. Need to forecast which months will be negative and which will be positive. Solar generation is low during system peak peak load may continue to grow while system energy does not.


9
10 Residential Forecast

11 Residential Heating Variable
12 Residential Cooling Variable
13 Residential XOther Variable Xother includes the economic variables HHSize, HHIncome, and Electricity Price
14 Building the Solar Variable Currently Roseville has approximately 2,360 residential solar customers; with a total installed capacity of 8.3 MW (the current average size is 2.7 kw). Assumes that 50 new residential solar systems will be added each month, representing new construction. Additionally, 10 retrofits of existing housing stock will occur each month. Average solar system size of retrofits will be 3.5 kw. Average size of new residential solar will slowly increase from 2 kw to net zero (5.5 kw) for new homes by Given the assumptions regarding additional customers and average system size a monthly installed capacity forecast (MW) is generated. Solar is generation is then used as a variable in the Residential Use Per Customer regression model.
15 Residential Xsolar Variable
16 Residential Average Use Model Model Statistics Iterations 1 Adjusted Observations 94 Deg. of Freedom for Error 89 R-Squared Adjusted R-Squared AIC 6.47 BIC Log-Likelihood Model Sum of Squares 3,027, Sum of Squared Errors 54, Mean Squared Error Std. Error of Regression Mean Abs. Dev. (MAD) Mean Abs. % Err. (MAPE) 2.32% Durbin-Watson Statistic Ljung-Box Statistic Prob (Ljung-Box) Skewness Kurtosis 3.44 Jarque-Bera Prob (Jarque-Bera) Variable Coefficient StdErr T-Stat P-Value mstructrescyc.xheat % mstructrescyc.xcooljul_sep % mstructrescyc.xcool_shoulder % mstructrescyc.xother % mstructrescyc.xsolar %
17 Adjusted Residential Sales Forecast Year ResMWh Growth Res MWh Res MWh Minus PV Growth Res MWh Minus PV Res MWh Plus EV Growth Res MWh plus EV , , , , % 441, % 441, % , % 421, % 421, % , % 431, % 431, % , % 444, % 444, % , % 436, % 436, % , % 440, % 440, % , % 431, % 431, % , % 434, % 434, % , % 430, % 430, % , % 425, % 426, % , % 421, % 422, % , % 418, % 418, % , % 416, % 416, % , % 413, % 414, % , % 411, % 412, % , % 409, % 410, % , % 407, % 408, % , % 403, % 404, % , % 400, % 401, % , % 397, % 399, % , % 395, % 397, % , % 392, % 394, % Residential equation: ResMWh=(Forecast average use * forecast customers) + EV
18 Residential Year Res MWh Growth ResMWh Res AvgUse (kwh) Growth Res Avg Use ,332 9, , % 9, % , % 9, % , % 9, % , % 9, % , % 8, % , % 8, % , % 8, % , % 8, % , % 8, % , % 8, % , % 7, % , % 7, % , % 7, % , % 7, % , % 7, % , % 7, % , % 7, % , % 7, % , % 6, % , % 6, % , % 6, % , % 6, % Decrease is driven by solar adoption and new zero energy homes.
19 Commercial Forecasts
20 SB 350 Assumptions SB350 - Doubling of Energy Efficiency savings in existing buildings by 2030 Increasing energy efficiency in the small and medium commercial classes. The class as a whole will reduce load by 2.5% per year starting in Additional data on the implementation of SB350 will likely change the way this law is forecasted. Power resources wanted the law included in the forecast using the California Energy Policy Report energy efficiency number (doubled). Forecast is a worst case scenario on SB 350 implementation (18% reduction in energy use by 2030).

21 Small Commercial Variables
22 Small Commercial Average Use Model Model Statistics Iterations 1 Adjusted Observations 91 Deg. of Freedom for Error 79 R-Squared 0.96 Adjusted R-Squared 0.96 AIC 6.67 BIC 7.00 Log-Likelihood Model Sum of Squares 1,352,591 Sum of Squared Errors 54,947 Mean Squared Error Std. Error of Regression Mean Abs. Dev. (MAD) Mean Abs. % Err. (MAPE) 1.67% Durbin-Watson Statistic 1.99 Ljung-Box Statistic Prob (Ljung-Box) 0.25 Skewness Kurtosis 2.83 Jarque-Bera 1.91 Prob (Jarque-Bera) Variable Coefficient StdErr T-Stat P-Value GS1XHeat % GS1XCool % GS1XOther % *Additional monthly binary variables included
23 Small Commercial Forecast Year GS1MWh Growth GS1MWh GS1 AvgUse (kwh) Growth GS1 AvgUse ,613 14, , % 14, % , % 13, % , % 14, % , % 14, % , % 14, % , % 14, % , % 14, % , % 14, % , % 14, % , % 14, % , % 14, % , % 14, % , % 14, % , % 14, % , % 14, % , % 13, % , % 13, % , % 13, % , % 12, % , % 12, % , % 12, % , % 11, % Decrease is driven by SB350 assumption Average use and class totals are decreasing If solar becomes more common in the GS1 class this forecast will need to be updated

24 Medium Commercial Total Sales Model *Additional monthly binary variables included
25 Medium Commercial Forecast Year GS2MWh Growth GS2MWh GS2 AvgUse (kwh) Growth GS2 AvgUse , , , % 289, % , % 280, % , % 278, % , % 294, % , % 295, % , % 299, % , % 303, % , % 300, % , % 299, % , % 299, % , % 299, % , % 299, % , % 298, % , % 298, % , % 299, % , % 292, % , % 285, % , % 278, % , % 272, % , % 265, % , % 259, % , % 252, % Customer forecast is flat Sales move based on SAE trends and SB350 Assumptions
26 System Forecast Largest impact is SB350 and net zero energy homes drop forecast in Residential, GS1, and GS2 Year System MWh Growth SysMWh ,303, ,275, % ,225, % ,223, % ,243, % ,228, % ,241, % ,231, % ,245, % ,241, % ,240, % ,235, % ,231, % ,227, % ,225, % ,223, % ,210, % ,198, % ,183, % ,170, % ,157, % ,145, % ,130, %
27 Conclusions The SAE model accounts for the energy efficiency and solar growth in the residential, small commercial, and medium commercial classes. State laws are driving changes to the long term forecast. The unknowns in the long term forecast continue to grow.
28 Questions?
Appendix H-1-3 Class Specific Regression Model Statistics
 Appendix H-1- Class Specific Regression Model Statistics EB-01-000 Page 1 of 1 Delivered: February, 01 1 1 1 1 1 1 A widely used measure of goodness of fit is the Adjusted R-Squared. The Adjusted R-Squared
SAE Model Overview. Eric Fox 2010 Energy Forecasting Week Las Vegas, Nevada Forecasters Forum/EFG Meeting
 SAE Model Overview Eric Fox 2010 Energy Forecasting Week Las Vegas, Nevada Forecasters Forum/EFG Meeting April 29 30, 2010 SAE Model Overview The Statistical Adjusted End Use Model (SAE) is a modeling
FORECASTING PV MARKET ADOPTION AND DEMAND IMPACTS
 14TH ANNUAL ENERGY FORECASTING MEETING / EFG SCOTTSDALE, ARIZONA MAY 18-20, 2016 FORECASTING PV MARKET ADOPTION AND DEMAND IMPACTS MIKE RUSSO INSTALLED SOLAR CAPACITY New Jersey Installed capacity of 1,000
Statistically Adjusted End-Use Forecasting Incorporating End-Use Structure in an Econometric Model
 Statistically Adjusted End-Use Forecasting Incorporating End-Use Structure in an Econoetric Model Residential Forecast Model- Typical Specification Regression Model Ten to fifteen years of historical onthly
FORECASTING THE GROWTH OF IMPORTS IN KENYA USING ECONOMETRIC MODELS
 FORECASTING THE GROWTH OF IMPORTS IN KENYA USING ECONOMETRIC MODELS Eric Ondimu Monayo, Administrative Assistant, Kisii University, Kitale Campus Alex K. Matiy, Postgraduate Student, Moi University Edwin
SAARC Training Workshop Program Identification, Comparison and Scenario Based Application of Power Demand/ Load Forecasting Tools
 SAARC Training Workshop Program Identification, Comparison and Scenario Based Application of Power Demand/ Load Forecasting Tools Long Term Power Demand Forecasting using Regression Model Contents Growth
CHAPTER THREE. Load Curves The curve showing the variation of load on the power station (power plant) with reference to time is known as load curve.
 with reference to time is known as load curve.") CHAPTER THREE Load Curves The curve showing the variation of load on the power station (power plant) with reference to time is known as load curve. Daily Load Curve Maximum Load (Peak Load) It represents
CHAPTER THREE Load Curves The curve showing the variation of load on the power station (power plant) with reference to time is known as load curve. Daily Load Curve Maximum Load (Peak Load) It represents
Table 1: Distribution Revenue at Current Rates. PowerStream Consolidated 2009 OEB Approved PS South 2009 Actual 2010 Actual 2011 Actual
 EB-0-0 Exhibit C Schedule Page of Filed May, 0 0 THROUGHPUT REVENUE OVERVIEW The components that derive revenue at current rates are identified in Exhibit C,, Schedules to. PowerStream has applied current
FOLLOW-UP NOTE ON MARKET STATE MODELS
 FOLLOW-UP NOTE ON MARKET STATE MODELS In an earlier note I outlined some of the available techniques used for modeling market states. The following is an illustration of how these techniques can be applied
LOADS, CUSTOMERS AND REVENUE
 Page of LOADS, CUSTOMERS AND REVENUE The purpose of this evidence is to present the Company s load, customer and distribution revenue forecast for the test years. The detailed test year forecasts are shown
Market Sentiment Helps Explain the Price of Bitcoin
 Market Sentiment Helps Explain the Price of Bitcoin Yoshiharu Sato http://yoshi2233.strikingly.com/ December 15 th, 2017 Abstract. A simple model that accurately explains the market price of Bitcoin (BTC)
Peninsula Clean Energy could launch a CCE by Fall January October 2015 October 2015 February 2016 March 2016 October 2016
 Overview Peninsula Clean Energy could launch a CCE by Fall 2016. Phase 1 Phase 2 Phase 3 January 2015 - October 2015 October 2015 February 2016 March 2016 October 2016 Pre-Planning & Due Diligence Internal
Guideline on evaluating the impact of policies -Quantitative approach-
 Guideline on evaluating the impact of policies -Quantitative approach- 1 2 3 1 The term treatment derives from the medical sciences and has more meaning when is used in that context. However, this term
IMPACT OF AUDIT PLANNING ON AUDIT QUALITY: CASE STUDY OF LOCAL AUDIT FIRMS IN UZBEKISTAN
 International Journal of Economics, Commerce and Management United Kingdom Vol. V, Issue 11, November 2017 http://ijecm.co.uk/ ISSN 2348 0386 IMPACT OF AUDIT PLANNING ON AUDIT QUALITY: CASE STUDY OF LOCAL
EVALUATION OF FACTORS AFFECTING BROADBAND INTERNET ACCESS USING REGRESSION ANALYSIS
 EVALUATION OF FACTORS AFFECTING BROADBAND INTERNET ACCESS USING REGRESSION ANALYSIS Vlasta BAHOVEC University of Zagreb, Faculty of Economics and Business Trg J. F. Kennedyja 6, 0000 Zagreb, Croatia vbahovec@efzg.hr
Finance & Banking Studies
 Journal of Finance & Banking Studies 7(1), 2018: 27-32 Finance & Banking Studies IJFBS, VOL 7 NO 1 Contents available at www.ssbfnet.com/ojs https://doi.org/10.20525/ijfbs.v7i1.837 Impact of working capital
Energy Forecasting Group, May 10-11, 2012 Las Vegas, Nevada. Terry Baxter, NV Energy
 NV Energy Integrating DSM Into The Forecast Energy Forecasting Group, May 10-11, 2012 Las Vegas, Nevada Terry Baxter, NV Energy 2 NV Energy Service Territory NVE Statistics ti ti Mixed results for 2011
Management by Objectives (MBO) as an Instrument for Organizational Performance of Deposit Money Banks in Nigeria
 as an Instrument for Organizational Performance of Deposit Money Banks in Nigeria") Management by Objectives (MBO) as an Instrument for Organizational Performance of Deposit Money Banks in Nigeria Felix Francis Department of Business Management Education, Adamawa State Polytechnic, P
Management by Objectives (MBO) as an Instrument for Organizational Performance of Deposit Money Banks in Nigeria Felix Francis Department of Business Management Education, Adamawa State Polytechnic, P
Modeling Hourly Electric Utility Loads in the Phoenix Area
 3/10/2012 SOS 598: Applied Data Analysis for Energy Scientists 12/06/2011 Modeling Hourly Electric Utility Loads in the Phoenix Area Seth Herron Joseph Fernandi SOS 598: Applied Data Analysis for Energy
Update on Zero-Net Energy (ZNE) in California
 in California") Update on Zero-Net Energy (ZNE) in California October 25 th, 2017 Snuller Price, Senior Partner About Energy and Environmental Economics, Inc. (E3) Founded in 1989, E3 is an industry leading consultancy
Update on Zero-Net Energy (ZNE) in California October 25 th, 2017 Snuller Price, Senior Partner About Energy and Environmental Economics, Inc. (E3) Founded in 1989, E3 is an industry leading consultancy
Towards a sustainable Romanian energy sector: Roadmap to RES in 2030 Deloitte Romania, June 2018
 Towards a sustainable Romanian energy sector: Roadmap to RES in 2030 Deloitte Romania, June 2018 Content Background 03 1. Development scenarios 04 2. Impact & benefits 09 Key messages 12 2 Background Romania
Appendix 4.3 Long Term Load and Demand Forecast
 Appendix 4.3 Long Ter Load and Deand Forecast 2016-2035 Long Ter Load and Deand Forecast Yukon Energ Corporation (YEC) Subitted to: Yukon Energ Corporation Whitehorse, YT, Canada Subitted b: Itron, Inc.
Barbu Bogdan POPESCU 1 Lavinia Ştefania ŢOŢAN 2 Silvia Elena CRISTACHE 3. KEYWORDS: employment, economic development, labor market, analysis.
 Statistical Modeling of Stochastic Dependences between Variables that Characterize Labor Market in Romania for Taking Relevant Management Decisions for a Competitive and Sustainable Development of Labor
DOE Funded Pumped Storage Study
 DOE Funded Pumped Storage Study Greg Brownell Manager, Resource Planning and Commodity Budget Feb, 2016 Powering forward. Together. Presentation Outline SMUD Overview DOE Funded Iowa Hill Study Overview
Charles D. Corbin & Gregor P. Henze
 Assessing Impact of Large-Scale Distributed Residential HVAC Control Optimization on Electricity Grid Operation and Renewable Energy Integration May 11, 2015 Charles D. Corbin & Gregor P. Henze Department
LONG-TERM DEMAND FORECAST MODELING NEW TECHNOLOGIES
 LONG-TERM DEMAND FORECAST MODELING NEW TECHNOLOGIES Eric Fox, Director Forecast Solutions Oleg Moskatov, Sr. Forecast Analyst Mike Russo, Forecast Analyst Itron Forecasting Brown Bag June 9, 2015 The Leonard
Distributed Generation
 Distributed Generation November 2014 November 6, 2014 1 Forward-Looking Statements Leading the Way in Electricity SM Statements contained in this presentation about future performance, including, without
Calculating a Dependable Solar. Generation Curve for. SCE s Preferred Resources Pilot
 S o u t h e r n C a l i f o r n i a E d i s o n P a g e 1 Calculating a Dependable Solar Generation Curve for SCE s Preferred Resources Pilot October 2017 S o u t h e r n C a l i f o r n i a E d i s o
ELECTRICITY CONSUMPTION & ECONOMIC GROWTH IN BANGLADESH: EVIDENCE FROM TIME-SERIES CAUSALITY APPROACH
 Romanian Economic and Business Review Vol. 11, number 2 19 ELECTRICITY CONSUMPTION & ECONOMIC GROWTH IN BANGLADESH: EVIDENCE FROM TIME-SERIES CAUSALITY APPROACH Arifuzzaman KHAN 1 Sandip SARKER 2 Delowar
Optimizing Transmission from Distant Wind Farms Sompop Pattanariyankool and Lester B. Lave Electricity Industry Center Carnegie Mellon University
 Optimizing Transmission from Distant Wind Farms Sompop Pattanariyankool and Lester B. Lave Electricity Industry Center Carnegie Mellon University 1 Optimizing Transmission from Distant Wind Farms Abstract
Acreage Needed in 2050 for Renewable Generation to Meet California s GHG Emission Reduction Goals California Energy Commission May 9, 2011
 Acreage Needed in 2050 for Renewable Generation to Meet California s GHG Emission Reduction Goals California Energy Commission May 9, 2011 The Energy Commission has developed a calculator to assist the
Welcome/Introductions Updates since last meeting/review of DSM program history Energy savings Demand savings Annual spend
 September 26, 2017 Agenda Welcome/Introductions Updates since last meeting/review of DSM program history Energy savings Demand savings Annual spend Challenges for future programs Rapid adoption of energy
Exhibit No. JM-1 Updated Vol.II, pages 2-98 through ELECTRIC ENERGY AND DEMAND FORECASTS
 2.6 ELECTRIC ENERGY AND DEMAND FORECASTS Updated Vol.II, pages 2-98 through 2-148 Introduction Projections of future energy and peak demand are fundamental inputs into Public Service s resource need assessment.
Economic Viability of Residential Microgrids in Ontario
 Economic Viability of Residential Microgrids in Ontario Aaron Barter Program Manager, Buildings & Community Energy Advanced Energy Centre 5 th Canadian German Smart Grid & Energy Storage Series Combined
Colorado Springs Utilities Demand Side Management & Renewable Energy Presentation for 19 th Annual SWEEP Workshop.
 Colorado Springs Utilities Demand Side Management & Renewable Energy Presentation for 19 th Annual SWEEP Workshop November 21, 2013 Mark James DSM & Renewable Energy Manager Agenda Colorado Springs Utilities
Public Interest Energy Research (PIER) Energy Savings through Smart Controls in Multifamily Housing Study: Impact Analysis
 Energy Savings through Smart Controls in Multifamily Housing Study: Impact Analysis") San Francisco Bay 510 444 5050 tel 800 966 1254 toll free 1999 Harrison Street Suite 1420 Oakland, CA 94612 Public Interest Energy Research (PIER) Energy Savings through Smart Controls in Multifamily Housing
San Francisco Bay 510 444 5050 tel 800 966 1254 toll free 1999 Harrison Street Suite 1420 Oakland, CA 94612 Public Interest Energy Research (PIER) Energy Savings through Smart Controls in Multifamily Housing
Technology and Disruptive Innovation in the Natural Gas Sector
 Technology and Disruptive Innovation in the Natural Gas Sector Technology Innovation & Policy Forum 2016; Waterloo November 24, 2016 David Teichroeb Business Development; Low Carbon Energy Strategies Net-Zero
Is the "duck curve" eroding the value of energy efficiency?
 Is the "duck curve" eroding the value of energy efficiency? Edward Burgess, Strategen Consulting Jeff Schlegel, Schlegel & Associates/Southwest Energy Efficiency Project (SWEEP) Ellen Zuckerman, Schlegel
2 CDM Adjustment for the Load Forecast for Distributors 2 1 Accuracy of the Load Forecast and Variance Analysis 3 1 Distribution and Other Revenue
 Page of Exhibit Tab Schedule Appendix Contents Operating Revenue Load and Revenue Forecasts Multivariate Regression Model CDM Adjustment for the Load Forecast for Distributors Accuracy of the Load Forecast
16TH ANNUAL ENERGY FORECASTING MEETING / EFG AUSTIN, TX APRIL 25-27, SAE UPDATES. Oleg Moskatov and Mike Russo April 27, 2018
 16TH ANNUAL ENERGY FORECASTING MEETING / EFG AUSTIN, TX APRIL 25-27, 2018 2018 SAE UPDATES Oleg Moskatov and Mike Russo April 27, 2018 2018 RESIDENTIAL UPDATE Oleg Moskatov PRIMARY CHANGES FROM 2017» Reference
Chapter 2 Burlington s Demand for Electricity
 Chapter 2 Burlington s Demand for Electricity The City of Burlington Electric Department (BED) provides electricity in its service territory of approximately 16 square miles, and the Burlington International
Volume-3, Issue-6, November-2016 ISSN No:
 A STATISTICAL ANALYSIS OF STOCHASTIC DRIFT IN THE MARKET OF METALS PLATINUM AND IRIDIUM Arghajit Mitra Research Scholar, Christ University, Bengaluru, India Subhashis Biswas Research scholar, Christ University,
Impact of SMEs in economic growth in Albania
 European Journal of Sustainable Development (2016), 5, 3, 151-158 ISSN: 2239-5938 Doi: 10.14207/ejsd.2016.v5n3p151 Impact of SMEs in economic growth in Albania Grisejda Myslimi 1, Krisdela, Kaçani 1 Abstract
Modelling and Forecasting the Balance of Trade in Ethiopia
 American Journal of Theoretical and Applied Statistics 2015; 4(1-1): 19-23 Published online March 18, 2015 (http://www.sciencepublishinggroup.com/j/ajtas) doi: 10.11648/j.ajtas.s.2015040101.14 ISSN: 2326-8999
Public Benefit Mandates and Programs AB 2021 Goal Setting
 Public Benefit Mandates and Programs AB 2021 Goal Setting Board of Public Utilities March 1, 2012 Legislative Background AB-1890 Public Benefits Charge 2.85% Mandated an established usage based charge
2015 SAE UPDATES ERIC FOX, DIRECTOR FORECAST SOLUTIONS OLEG MOSKATOV, SENIOR ANALYST MIKE RUSSO, ANALYST
 2015 SAE UPDATES ERIC FOX, DIRECTOR FORECAST SOLUTIONS OLEG MOSKATOV, SENIOR ANALYST MIKE RUSSO, ANALYST July 22, 2015 PLEASE REMEMBER» Phones are Muted: In order to help this session run smoothly, your
Exhibit to Agenda Item #1a
 Exhibit to Agenda Item #1a Board of Directors Meeting Wednesday,, scheduled to begin at 5:30 p.m. Customer Service Center, Rubicon Room Powering forward. Together. Strategic Direction 2, Competitive Rates
Analyzing Hawaii s Energy Eco-system
 Analyzing Hawaii s Energy Eco-system Chris Yunker Hawaii State Energy Office Energy Systems & Planning Program Manager Hawaii s Energy Choice In some ways the question Hawaii faces is straight forward
Assessment of Load Factor as a System Efficiency Earning Adjustment Mechanism
 Assessment of Load Factor as a System Efficiency Earning Adjustment Mechanism PREPARED FOR The Joint Utilities of New York PREPARED BY William Zarakas Sanem Sergici Kevin Arritt David Kwok February 10,
MISO Distributed Generation (DG) Presentation. October 27, 2015
 Presentation. October 27, 2015") MISO Distributed Generation (DG) Presentation October 27, 2015 AEG Study specific questions Recall AEG study is looking at DR, EE and DG penetrations, over 20 year time period Should we model a DG specific
MISO Distributed Generation (DG) Presentation October 27, 2015 AEG Study specific questions Recall AEG study is looking at DR, EE and DG penetrations, over 20 year time period Should we model a DG specific
An Experimental Study on the PV Systems Contribution on Lowering the Demand Charge
 Paper ID #17840 An Experimental Study on the PV Systems Contribution on Lowering the Demand Charge Mr. Jonathan Michael Newton, John Brown University Electrical/Computer Engineering student at John Brown
Transition to 100% Renewable Energy in California in 25 years By Tom Rust, Custom Power Solar
 Transition to 100% Renewable Energy in California in 25 years By Tom Rust, Custom Power Solar SUMMARY Converting all fossil fuel electric energy production to solar+wind+battery storage, most land vehicles
Energy Codes and Solar Moving Forward Together. Joe Cain, P.E. Solar Energy Industries Association
 Energy Codes and Solar Moving Forward Together Joe Cain, P.E. Solar Energy Industries Association About SEIA U.S. National Trade Association for Solar Energy Founded in 1974 1,000 member companies from
PWP 2015 IRP Update Energy Roadmap Event
 PWP 2015 IRP Update Energy Roadmap Event May 13, 2015 Can You Name These PWP Power Sources? 2 PWP Power Supplies 4 Energy Integrated Resource Plan (IRP) The IRP is a 20 year plan for meeting forecasted
Improving Energy Retrofit Decisions by Including Uncertainty in the Energy Modelling Process
 Improving Energy Retrofit Decisions by Including Uncertainty in the Energy Modelling Process Alireza Bozorgi 1, James R. Jones 2 1 ICF International, Atlanta, GA 2 Virginia Tech, Blacksburg, VA ABSTRACT:
Power Integrated Resource Plan Progress Update
 Power Integrated Resource Plan Progress Update Municipal Services Committee September 12, 2017 Item 4A Overview Provide a Progress Report on the 2015 IRP Next Steps for the 2018 IRP 2 Power Integrated
Timing Production Runs
 Class 7 Categorical Factors with Two or More Levels 189 Timing Production Runs ProdTime.jmp An analysis has shown that the time required in minutes to complete a production run increases with the number
SEN W.A. 100% Renewable Energy on the SWIS 2029
 1. BACKGROUND AND OBJECTIVES Sustainable Energy Now Inc. has been commissioned to provide a brief of /s which demonstrate the potential for WAs SWIS electricity grid demand to be fully met by a combination
Bulk Energy Storage Resource Case Study Update with the 2016 LTPP Assumptions
 Bulk Energy Storage Resource Case Study Update with the 2016 LTPP Assumptions Shucheng Liu Principal, Market Development 2016-2017 Transmission Planning Process Stakeholder Meeting February 28, 2017 Page
Economic Impacts of Unscheduled, Disruptive Events
 Economic Impacts of Unscheduled, Disruptive Events 1 Geoffrey J.D. Hewings R E A L Regional Economics Applications Laboratory University of Illinois International Workshop on the Economic Impacts of Extreme
Decarbonization of Heating Energy Use in California Buildings
 Decarbonization of Heating Energy Use in California Buildings Synapse Third Thursday Webinar November 15, 2018 Asa Hopkins, PhD Melissa Whited Report commissioned by NRDC Webinar logistics The webinar
ELECTRIC LOAD FORECAST 2010/11 to 2030/31
 ELECTRIC LOAD FORECAST 2010/11 to 2030/31 (For External Use Only) IMPORTANT: THIS MATERIAL IS THE EXCLUSIVE PROPERTY OF MANITOBA HYDRO AND ALL RIGHTS ARE RESERVED. ANY RELEASE, REPRODUCTION OR OTHER USE
Lab 2 - Linear Regression in Python
 Lab 2 - Linear Regression in Python February 24, 2016 This lab on Linear Regression is a python adaptation of p. 109-119 of Introduction to Statistical Learning with Applications in R by Gareth James,
CALMAC Study ID PGE0354. Daniel G. Hansen Marlies C. Patton. April 1, 2015
 2014 Load Impact Evaluation of Pacific Gas and Electric Company s Mandatory Time-of-Use Rates for Small and Medium Non-residential Customers: Ex-post and Ex-ante Report CALMAC Study ID PGE0354 Daniel G.
Solar Development in the Philippines 22 nd September. The Lantau Group
 Solar Development in the Philippines 22 nd September Who we are Electricity and Gas Experts Competition, Markets, Regulation, Policy Decisions Support Analysis Disputes Market Analysis Asset Valuation
Alternative Energy Concept Plan San Bernardino Community College District
 Alternative Energy Concept Plan San Bernardino Community College District January 13, 2011 Overview Long Term Energy Plan Objective Methodology Summary of Findings Funding Sources Energy Technologies Energy
SCE and PRIME JOINT RATE COMPARISONS
 and JOINT RATE COMPARISONS As part of our mutual commitment to better serve customers, Southern California Edison () and Pico Rivera Municipal Energy () have jointly created a comparison of our common
= Verified Zero Net Energy Building Case Study BAGATELOS ARCHITECTURAL GLASS SYSTEMS MANUFACTURING FACILITY OVERVIEW
 Verified Zero Net Energy Building Case Study Photo: Google Earth OVERVIEW Location: Sacramento, CA Project Size: 63,000 SF Construction Type: Retrofit Construction Date: 1969, Retrofit in 2008, additional
Future key factors of PV power generation to become a mainstream power source - Action plans of -
 Future key factors of PV power generation to become a mainstream power source - Action plans of PV150@2030 - New installation target of 150 GW by 2030 was proposed based on the forecast on
SCE and PRIME JOINT RATE COMPARISONS
 and JOINT RATE COMPARISONS As part of our mutual commitment to better serve customers, Southern California Edison () and Pico Rivera Innovative Municipal Energy () have jointly created a comparison of
SCE and PRIME JOINT RATE COMPARISONS
 and JOINT RATE COMPARISONS As part of our mutual commitment to better serve customers, Southern California Edison () and Pico Rivera Municipal Energy () have jointly created a comparison of our common
Forecasting Major Food Crops Production in Khyber Pakhtunkhwa, Pakistan
 Journal of Applied and Advanced Research 2017, 2(1): 21 30 doi.: 10.21839/jaar.2017.v2i1.40 http://www.phoenixpub.org/journals/index.php/jaar ISSN 2519-9412 / 2017 Phoenix Research Publishers Research
SCE s Preferred Resources Pilot (PRP) Annual Progress Update
 Annual Progress Update") SCE s Preferred Resources Pilot (PRP) Annual Progress Update December 2014 http://on.sce.com/preferredresources http://edison.com/preferredresources PRP Annual Progress Update Outline Content PRP Overview
SCE s Preferred Resources Pilot (PRP) Annual Progress Update December 2014 http://on.sce.com/preferredresources http://edison.com/preferredresources PRP Annual Progress Update Outline Content PRP Overview
Packaged Refrigerant Based Energy Storage (RBES) Air Conditioning System
 Air Conditioning System") Packaged Refrigerant Based Energy Storage (RBES) Air Conditioning System Ram Narayanamurthy Ice Energy, Inc. this technology provides some of the largest opportunities we have right now to address the
Packaged Refrigerant Based Energy Storage (RBES) Air Conditioning System Ram Narayanamurthy Ice Energy, Inc. this technology provides some of the largest opportunities we have right now to address the
Level 2 Emerging Technology Scenario. Background
 Level 2 Emerging Technology Scenario Charlie Grist Kevin Smit Tina Jayaweera Conservation Resources Advisory Committee May 1, 2015 Background Purpose: Very low or no carbon resource scenario (3B) What
Is More Always Better? A Comparison of Billing Regression Results Using Monthly, Daily and Hourly AMI Data
 Is More Always Better? A Comparison of Billing Regression Results Using Monthly, Daily and Hourly AMI Data John Cornwell, Evergreen Economics, Portland, OR Stephen Grover, Evergreen Economics, Portland,
SCE's DER Disaggregation Methodologies. DFWG Meeting #1 April 18th 2018
 SCE's DER Disaggregation Methodologies DFWG Meeting #1 April 18th 2018 SCE s Overall DER Disaggregation Process DER Inputs Process General Description EV, PVR, LMDR* Historical Adoption Customer Data Demographic
INTERIOR MARKET PRICING SYSTEM UPDATE July 1, Timber Pricing Branch
 INTERIOR MARKET PRICING SYSTEM UPDATE - 2011 July 1, 2011 Timber Pricing Branch Table of Contents Introduction... 1 Auction Dataset... 1 Equations... 1 Specified Operations... 6 Tenure Obligation Adjustments...
NJ Solar Market Update
 NJ Solar Market Update March 10, 2015 Renewable Energy Committee Meeting Trenton, NJ Prepared by Charlie Garrison Solar Installed Capacity Data The preliminary installed solar capacity as of 2/28/15 is
********************************************************************************************** *******************************
 1 /* Workshop of impact evaluation MEASURE Evaluation-INSP, 2015*/ ********************************************************************************************** ******************************* DEMO: Propensity
Quantification of Harm -advanced techniques- Mihail Busu, PhD Romanian Competition Council
 Quantification of Harm -advanced techniques- Mihail Busu, PhD Romanian Competition Council mihail.busu@competition.ro Summary: I. Comparison Methods 1. Interpolation Method 2. Seasonal Interpolation Method
RESPOND Session. Customers Response to Electricity Price Variations Caused by Intermittent Generation
 1 th IAEE European Conference, Vienna, Austria, 7-1 September 29! RESPOND Session Customers Response to Electricity Price Variations Caused by Intermittent Generation Frits Møller Andersen, Poul Erik Grohnheit
VALUING ROOFTOP SOLAR
 INTRODUCTION NET ENERGY METERING VALUING ROOFTOP SOLAR ALTERNATIVES TO NEM 1 INTRODUCTION TURN DISTRIBUTED GENERATION 2 TURN A Consumer Advocacy Organization Fighting for Small Ratepayers since 1973 Founded
This is Getting Complicated
 This is Getting Complicated Planning DR Resources in a World of DERs Shauna Jensen, Portland General Electric Robin Maslowski, Navigant Demand Response Energy Efficiency Wind Customer-Controlled Storage
Clean Energy Extension
 Clean Energy Extension ag.umass.edu/energy The Clean Energy Extension is an Affiliate of the UMass Amherst Center for Agriculture, Food and the Environment 209 Agricultural Engineering Building University
ITRON'S EFG SAE UPDATES AND INDUSTRIAL FILE PREVIEW
 ITRON'S EFG SAE UPDATES AND INDUSTRIAL FILE PREVIEW June 30, 2014 PLEASE REMEMBER» Phones are Muted: In order to help this session run smoothly, your phones are muted.» Full Screen Mode: To make the presentation
The California Energy Commission s Peak Load Reduction Program. Peak Reduction Program Authorization and Funding
 The California Energy Commission s Peak Load Reduction Program Presented By: Monica Rudman California Energy Commission (916) 654-4006 mrudman@energy.state.ca.us Prepared for: ACEEE Conference on Energy
Impact of small solar PV on the NSW wholesale electricity market. Approved for Public Release 12 October 2017
 Impact of small solar PV on the NSW wholesale electricity market Approved for Public Release 12 October 2017 Disclaimer This report (Report) has been produced by Energy Synapse Pty Ltd ABN 34 616 603 082
DRAFT DRAFT. DSM Advisory Group Meeting. August 24, 2016
 DRAFT DRAFT DSM Advisory Group Meeting August 24, 2016 Agenda Welcome/Introductions Review of opt-out rules in other states Presentation from MEEA representative Opt-out in surrounding states not in MEEA
BEFORE THE FLORIDA PUBLIC SERVICE COMMISSION DOCKET NO EI
 BEFORE THE FLORIDA PUBLIC SERVICE COMMISSION DOCKET NO. 00-EI IN RE: TAMPA ELECTRIC COMPANY S PETITION FOR AN INCREASE IN BASE RATES AND MISCELLANEOUS SERVICE CHARGES DIRECT TESTIMONY AND EXHIBIT OF LORRAINE
Derby Energy Profile. Derby Statistics:
 Derby Energy Profile Northeastern Vermont Development Association (NVDA) has prepared this document using best available data to help you meet with the requirements of Act 174 and Enhanced Energy Planning
INTERIOR MARKET PRICING SYSTEM UPDATE Pricing Branch
 INTERIOR MARKET PRICING SYSTEM UPDATE - 2010 Pricing Branch Table of Contents Introduction... 1 Auction Dataset... 1 Equations... 1 Specified Operations... 6 Tenure Obligation Adjustments... 7 Summary...
2014 Integral Analytics, Inc.
 1 2 3 4 5 6 7 Company Overview Putting Advanced Analytics into Software to Manage Utility Costs & Risks Smart Grid Solutions T&D Planning Storage & Renewable Evaluation DSM Planning & Evaluation Marketing
Albany Energy Profile
 Albany Energy Profile Northeastern Vermont Development Association (NVDA) has prepared this document using best available data to help you meet with the requirements of Act 174 and Enhanced Energy Planning
California Energy Policy Old and New A Snap Shot
 Keynote Western Cooling Efficiency Center 2016 Affiliates Forum California Energy Policy Old and New A Snap Shot Building Energy Efficiency Past: Title 24, Appliance Standards and Present: AB 758, SB 350,
The study obtains the following results: Homework #2 Basics of Logistic Regression Page 1. . version 13.1
 Soc 73994, Homework #2: Basics of Logistic Regression Richard Williams, University of Notre Dame, https://www3.nd.edu/~rwilliam/ Last revised January 14, 2018 All answers should be typed and mailed to
Appendix C: Renewable Energy Targets & Data
 Appendix C: Renewable Energy Targets & Data Municipal Energy Targets The targets provided in this appendix represent the amount of new renewable energy capacity (solar, wind and hydro) that each community
Memorandum. Components of Avoided Costs
 Memorandum To: Maggie Downey From: Doug Hurley CC: Max Chang Date: October 5, 2011 Subject: Avoided Cost of Solar PV on Cape Cod The Cape Light Compact and the Cape and Vineyard Electric Cooperative have
Westfield Energy Profile
 Westfield Energy Profile Northeastern Vermont Development Association (NVDA) has prepared this document using best available data to help you meet with the requirements of Act 174 and Enhanced Energy Planning
Pacific Northwest Low Carbon Scenario Analysis
 Pacific Northwest Low Carbon Scenario Analysis 2018 Scenarios and Sensitivities June 2018 Arne Olson, Senior Partner Kush Patel, Partner Nick Schlag, Director Kiran Chawla, Consultant Femi Sawyerr, Associate