Draft 2015 Urban Water Management Plan
|
|
|
- Janice Dickerson
- 5 years ago
- Views:
Transcription

1 Prepared for Sacramento County Water Agency Draft 2015 Urban Water Management Plan May 2016 Northgate Sacramento Arden Park Vista 50 Rancho Cordova 50 Mather Sunrise 99 SW Tract Laguna Vineyard 5 Hood Sacramento River 99 East Walnut Grove
2
3 2015 Urban Water Management Plan Prepared for Sacramento County Water Agency Sacramento, CA May White Rock Road, Suite 180 Rancho Cordova, CA 95670
4
5 Project Participants Brown and Caldwell Paul Selsky Melanie Holton May Huang Sacramento County Water Agency Dave Underwood Dave Zuccaro Forest Williams Michael Grinstead Ping Chen Juan Perez ii
6
7 Table of Contents List of Figures... v List of Tables... vi List of Abbreviations... viii 1. Introduction Urban Water Management Planning Act Plan Organization Plan Preparation Basis for Preparing the Plan Coordination and Outreach Coordination between Wholesaler and their Retailers Coordination with Other Agencies and the Community Notices to Cities and Counties System Description General Description Mather Sunrise Laguna Vineyard Arden Park Vista East Walnut Grove Hood Northgate Southwest Tract Metro Air Park Service Area Climate Service Area Population and Demographics Other Demographic Factors System Water Use Water Uses by Sector Distribution System Water Losses Water Savings from Codes, Standards, Ordinances, or Transportation and Land Use Plans Water Use for Lower Income Households SB X7-7 Baselines and Targets Baseline Periods Service Area Population Gross Water Use Baseline Daily Per Capita Water Use and 2020 Targets Compliance Daily per Capita Water Use iii
8 2015 Urban Water Management Plan Table of Contents 6. Water Supplies Purchased Water Central Valley Project City of Sacramento s American River Place of Use Water Supply Surface Water Groundwater Groundwater Basin Description Groundwater Management Overdraft Conditions Historical Groundwater Pumping Remediated Groundwater Stormwater Wastewater and Recycled Water Recycled Water Coordination Wastewater Collection, Treatment, and Disposal Recycled Water System Recycled Water Beneficial Uses Actions to Encourage and Optimize Future Recycled Water Use Desalinated Water Opportunities Exchanges or Transfers Future Water Projects Summary of Existing and Planned Sources of Water Energy Intensity Climate Change Water Supply Reliability Constraints on Water Sources Reliability by Type of Year Supply and Demand Assessment Regional Supply Reliability Water Shortage Contingency Planning Stages of Action Prohibitions on End Uses Penalties, Charges, and Other Enforcement of Prohibitions Consumption Reduction Methods Determining Water Shortage Reductions Revenue and Expenditure Impacts Resolution or Ordinance Catastrophic Supply Interruption Plan Minimum Supply Next Three Years Demand Management Measures Demand Management Measures Common for Retail and Wholesale Water Agencies Water Waste Prevention Ordinances iv
9 2015 Urban Water Management Plan Table of Contents Metering Conservation Pricing Public Education and Outreach Programs to Assess and Manage Distribution System Real Loss Water Conservation Program Coordination and Staffing Support Other Demand Management Measures Additional Demand Management Measures Specific for Wholesale Water Agencies Asset Management Wholesaler Supplier Assistance Program Planned Implementation to Achieve Water Use Targets Plan Adoption, Submittal, and Implementation References List of Appendices Appendix A: Appendix B: Appendix C: Appendix D: Appendix E: Appendix F: Appendix G: Appendix H: Appendix I: Appendix J: Documentation of City/County Notification and Water Supplier Coordination Notice of Public Hearing Adoption Resolution and Supporting Documentation DWR Urban Water Management Plan Checklist SB X7-7 Verification Forms 2013 and 2014 Best Management Practices Annual Reports to the California Urban Water Conservation Council AWWA Water Audit Tables Water Waste Section of the Conditions of Service Chapter of the Sacramento County Water Agency Code Water Shortage Contingency Resolution and Plan Climate Change Vulnerability Assessment List of Figures Figure 3-1. Sacramento County Water Agency Service Area Figure 6-1. Groundwater Basins in Sacramento County v
10 2015 Urban Water Management Plan Table of Contents List of Tables Table 2-1. (DWR Table 2-1 R) Retail Only: Public Water Systems Table 2-2. (DWR Table 2-2) Plan Identification Table 2-3. (DWR Table 2-3) Agency Identification Table 2-5. (DWR Table 2-4 R) Retail: Water Supplier Information Exchange Table 3-1. Monthly Average Climate Data Summary Table 3-2. (DWR Table 3-1 R) Retail: Population - Current and Projected Table 3-3. (DWR Table 3-1 W) Wholesale: Population - Current and Projected Table 4-1. (DWR Table 4-1 R) Retail: Demands for Potable and Raw Water Actual Table 4-2. (DWR Table 4-1 W) Wholesale: Demands for Potable and Raw Water - Actual Table 4-3. Water Demands by System Table 4-4. (DWR Table 4-2 R) Retail: Demands for Potable and Raw Water Projected Table 4-5. (DWR Table 4-2 W) Wholesale: Demands for Potable and Raw Water - Projected Table 4-6. (DWR Table 4-3 R) Retail: Total Water Demands, ac-ft/yr Table 4-7. (DWR Table 4-3 W) Wholesale: Total Water Demands, ac-ft/yr Table 4-8. (DWR Table 4-4R) Retail and Wholesale: 12 Month Water Loss Audit Reporting Table 4-9. (DWR Table 4-5 R) Retail Only: Inclusion in Water Use Projections Table Water Demand Projections with Savings due to Codes and Standards Table 5-1. (DWR Table 5-1 R) Baselines and Targets Summary: Retail Agency or Regional Alliance Only Table 5-2. (DWR Table 5-2 R) 2015 Compliance: Retail Agency or Regional Alliance Only Table 6-1. Other Known Groundwater Basin Purveyors Table 6-2 (DWR Table 6-1) Retail and Wholesale: Groundwater Volume Pumped, ac-ft/yr Table 6-3. Participation in Reuse Planning Table 6-4. (DWR Table 6-2 R) Wastewater Collected Within Service Area in Table 6-5. (DWR Table 6-3 R) Retail: Wastewater Treatment and Discharge Within Service Area in 2015, ac-ft/yr Table 6-6. (DWR Table 6-4 R) Retail: Current and Projected Recycled Water Direct Beneficial Uses Within Service Area, ac-ft/yr Table 6-7. (DWR Table 6-5 R) Retail: 2010 UWMP Use Projection Compared to 2015 Actual, ac-ft/yr Table 6-8. (DWR Table 7-1) Retail: Methods to Expand Future Recycled Water Use Table 6-9. (DWR Table 6-7) Retail and Wholesale: Expected Future Water Supply Projects or Programs Table (DWR Table 6-8 R) Retail: Water Supplies Actual, ac-ft/yr Table (DWR Table 6-8 W) Wholesale: Water Supplies Actual, ac-ft/yr Table (DWR Table 6-9 R) Retail: Water Supplies Projected, ac-ft/yr Table (DWR Table 6-9 W) Wholesale: Water Supplies Projected, ac-ft/yr vi
11 2015 Urban Water Management Plan Table of Contents Table 7-1. (DWR Table 7-1) Retail: Basis of Water Year Data Table 7-2. Calculation of Percent of Average Supply, ac-ft/yr Table 7-3. (DWR Table 7-1 W) Wholesale: Basis of Water Year Data Table 7-4. (DWR Table 7-2 R) Retail: Normal Year Supply and Demand Comparison, ac-ft/yr Table 7-5. (DWR Table 7-2 W) Wholesale: Normal Year Supply and Demand Comparison, ac-ft/yr Table 7-6. (DWR Table 7-3 R) Retail: Single Dry Year Supply and Demand Comparison, ac-ft/yr Table 7-7. (DWR Table 7-3 W) Wholesale: Single Dry Year Supply and Demand Comparison, ac-ft/yr Table 7-8. (DWR Table 7-4 R) Retail: Multiple Dry Years Supply and Demand Comparison, ac-ft/yr Table 7-9. (DWR Table 7-4 W) Wholesale: Multiple Dry Years Supply and Demand Comparison, ac-ft/yr Table Projected Available Single Dry Year Water Supplies with Facility Constraints, ac-ft/yr Table Projected Available Multiple Dry Years Water Supplies for Second Year with Facility Constraints, ac-ft/yr Table 8-1 (DWR Table 8-1 R). Retail : Stages of WSCP Table 8-2 (DWR Table 8-2 R). Retail Only: Restrictions and Prohibitions on End Uses Table 8-3 (DWR Table 8-3 R). Retail Only: Stages of WSCP - Consumption Reduction Methods Table 8-4. Reduction Measuring Mechanisms Table 8-5. (DWR Table 8-4 R). Retail: Minimum Supply Next Three Years, ac-ft/yr Table 8-6. (DWR Table 8-4 W). Wholesale: Minimum Supply Next Three Years, ac-ft/yr Table (DWR Table 10-1 R) Retail: Notification to Cities and Counties Table (DWR Table 10-2 W) Wholesale: Notification to Cities and Counties vii
12 List of Abbreviations Act Urban Water Management Planning Act ac-ft acre-feet ac-ft/yr acre-feet per year Agency Act Sacramento County Water Agency Act ALERT Automated Local Evaluation in Real Time AWWA American Water Works Association LHMP MIE M&I MGD MIE Local Hazard Mitigation Plan Media in Education Municipal and Industrial million gallons per day media in education BMP Cal-Am CASGEM CBSC CRS CSA CUWCC CVP DHCD DMM DWR EPA ETo ft FRWA FVWC GET GMP GPCD GSA GSP IRWMP kwh best management practices California American Water Company California Statewide Groundwater Elevation Monitoring California Building Standards and Code Community Rating System Central Service Area California Urban Water Conservation Council Central Valley Project Department of Housing and Community Development Demand Management Measure California Department of Water Resources U.S. Environmental Protection Agency evapotranspiration feet/foot Freeport Regional Water Authority Fruitridge Vista Water Company Groundwater and Extraction Treatment groundwater management plan gallons per capita per day Groundwater Sustainability Agencies Groundwater Sustainability Plans Integrated Regional Water Management Plan kilowatt-hour NSA NWS F PL Plan POU PSA North Service Area National Weather Service degrees Fahrenheit public law Urban Water Management Plan Place of Use public service announcement Reclamation U.S. Bureau of Reclamation RWA Regional Water Authority RWQCB Regional Water Quality Control Board SACOG Sacramento Area Council of Governments SB X7-7 Senate Bill X7-7 SCGA Sacramento Central Groundwater Authority SCWA Sacramento County Water Agency SGA Sacramento Groundwater Authority SGMA Sustainable Groundwater Management Act SMUD Sacramento Municipal Utilities District SRCSD Sacramento Regional County Sanitation District SSA South Service Area SSWD Sacramento Suburban Water District SWRCB State Water Resources Control Board SWTP Surface Water Treatment Plant SWTWMD Southwest Tract Water Maintenance District WDR Waste Discharge Requirement WEP Water Efficiency Program WROS Water Recycling Opportunities Study WRPP Water Recycling Pilot Program viii
13 Section 1 Introduction This Urban Water Management Plan (Plan) addresses the Sacramento County Water Agency (SCWA) and includes a description of the water supply sources, historical and projected water use, and a comparison of water supply to water demands during normal, single-dry, and multiple-dry years. SCWA supplies water to its retail customers and also provides wholesale water supply to a retail water agency, Elk Grove Water District. This Plan serves as a long-range planning document for SCWA s water supply. Elk Grove Water District has prepared its own 2015 Plan, which should be consulted for details on their demands and supplies. This section describes the Urban Water Management Planning Act (Act) and the Plan organization. 1.1 Urban Water Management Planning Act SCWA s Plan has been prepared in accordance with the Act, as amended, California Water Code, Division 6, Part 2.6, Sections through The Act became part of the California Water Code with the passage of Assembly Bill 797 during the regular session of the California legislature. The Act was amended in November 2009 with the adoption of the Water Conservation Act or SBX 7-7 and was most recently amended in The Water Conservation Act is described in Division 6, Part 2.55, Section The Act requires every urban water supplier that provides water for municipal purposes to more than 3,000 connections, or supplying more than 3,000 acre-feet (ac-ft) of water annually, to adopt and submit a Plan every five years to the California Department of Water Resources (DWR). The Act describes the required contents of the Plan as well as how urban water suppliers should adopt the Plan. 1.2 Plan Organization This section provides a summary of the sections in the Plan. Section 2 presents the basis for preparing the Plan, linkage to regional planning, and coordination and outreach. Section 3 provides the system description including SCWA s organization, service area, climate, and demographics. Section 4 presents current and projected water uses. Section 5 presents the per capita water demand baselines and targets. Water supply sources are described in Section 6. Section 7 describes the reliability of the water supplies. Section 8 presents the water shortage contingency planning and Section 9 addresses water demand management measures. Section 10 addresses the Plan adoption and submittal. Section 11 presents the references used to help prepare this Plan. Appendices A through J provide relevant supporting documents. DWR has provided a checklist of the items that must be addressed in each Plan based upon the Act. The checklist is completed for this Plan and provided in Appendix D. It references the sections and page numbers where the specific items can be found. 1-1
14
15 Section 2 Plan Preparation This section presents the basis for preparing the Plan; Plan identification, coordination, and outreach; and Plan notification. 2.1 Basis for Preparing the Plan SCWA is both a retail urban water supplier and a wholesale water supplier. Table 2-1 presents the public water system name and number for the applicable water systems that are owned and operated by SCWA. As shown in Table 2-1, SCWA owns and operates several smaller water systems that are below the size threshold for Plan reporting. The smaller water systems are included in this Plan. SCWA has selected individual reporting for this Plan, as identified in Table 2-2. This Plan is reporting on a calendar year basis using ac-ft as the unit of measure as noted in Table 2-3. Table 2-1. (DWR Table 2-1 R) Retail Only: Public Water Systems Public water system number Public water system name Number of municipal connections, 2015 Volume of water supplied, ac-ft 2015 CA Hood Water Maintenance District CA East Walnut Grove CA Southwest Tract Water Maintenance District CA Northgate ,074 CA Arden Park Vista 2,979 2,803 CA Laguna Vineyard (a) 43,767 21,618 CA Mather-Sunrise (b) 5,482 3,531 Metro Air Park (c) 0 0 Total 52,758 29,150 Notes: Source of data is spreadsheet workbook file entitled SCWA 2015 UWMP_ Connection and Consumption Data.xlsx provided by Dan Gwaltney in dated January 12, Source of 2015 Elk Grove wholesale deliveries is memo provided by Dave Zuccaro on April 15, (a) Corresponds to SCWA s Zone 40 Central and South Service Areas. Includes raw water and recycled water. Excludes wholesale water deliveries to Elk Grove and City of Sacramento, with a 7.5% and 3.0% assumed loss respectively. See Section 4.1 for explanation. (b) Corresponds to SCWA s Zone 40 North Service Area. (c) Inactive water system. 2-1
16 2015 Urban Water Management Plan Section 2 Table 2-2. (DWR Table 2-2) Plan Identification Individual UWMP Water Supplier is also a member of a RUWMP Water Supplier is also a member of a Regional Alliance Regional UWMP Name of RUWMP or Regional Alliance if applicable Table 2-3. (DWR Table 2-3) Agency Identification Type of Agency (select one or both) Agency is a wholesaler Agency is a retailer Fiscal or calendar year (select one) UWMP tables are in calendar years UWMP tables are in fiscal years If using fiscal years Provide month and day that the fiscal year begins Day Month Units of measure used in UWMP (select one) acre feet (ac-ft) 2.2 Coordination and Outreach This section presents the coordination that SCWA conducted in the preparation of this Plan with other agencies Coordination between Wholesaler and their Retailers SCWA supplies wholesale water to a retail water agency and is supplied water by a wholesale water agency. The Act requires that both wholesale and retail water agencies that rely on each other for water supply provide each other information regarding projected water supply and demand. SCWA coordinated with its current retail water agency customer, Elk Grove Water District, by identifying and quantifying water supplies available from SCWA. Elk Grove Water District provided their projected use of wholesale water as well as their population projections. A possible future wholesale customer is California American Water Company (Cal-Am) in the western portion of the Rio del Oro planning subarea. Recently, SCWA has supplied a small amount of water to the City of Sacramento. SCWA coordinated with Cal-Am by 2-2
17 2015 Urban Water Management Plan Section 2 providing an estimate of the water demand for that future wholesale area. Table 2-4 presents the water supplier information exchange that was done. Table 2-4. (DWR Table 2-4 W) Wholesale: Water Supplier Information Exchange Supplier has informed more than 10 other water suppliers of water supplies available in accordance with CWC Completion of the table below is optional. If not completed include a list of the water suppliers that were informed. Supplier has informed 10 or fewer other water suppliers of water supplies available in accordance with CWC Complete the table below. Water supplier name Elk Grove Water District California American Water Company City of Sacramento SCWA is supplied wholesale water by the U.S. Bureau of Reclamation (Reclamation) and the City of Sacramento. Reclamation does not prepare a Plan. SCWA provided the Reclamation and the City of Sacramento its projected water demand for the wholesale water supply. Table 2-5 presents the information exchange with the wholesale suppliers. Table 2-5. (DWR Table 2-4 R) Retail: Water Supplier Information Exchange The retail supplier has informed the following wholesale supplier(s) of projected water use in accordance with CWC Wholesale water supplier name US Bureau of Reclamation City of Sacramento Coordination with Other Agencies and the Community The Act requires SCWA to coordinate the preparation of its Plan with other appropriate agencies in the area, including other water suppliers that share a common source, water management agencies, and relevant public agencies, to the extent practicable. Table 2-6 provides a summary of the Plan coordination with the appropriate agencies. SCWA coordinates with other water agencies in the region through its participation and membership in the Regional Water Authority (RWA). RWA is a joint powers authority that serves and represents the interests of member water providers in the greater Sacramento, Placer, and El Dorado County region. The RWA's primary mission is to help its members protect and enhance the reliability, availability, affordability and quality of 2-3
18 2015 Urban Water Management Plan Section 2 water resources. SCWA participates in RWA s regional water efficiency program designed to help local purveyors implement best management practices on a regional basis. Table 2-6. Coordination of Plan Preparation Was contacted for input Was sent a copy of the draft Plan Commented on the draft Plan Was sent a notice of public hearing Attended the public hearing Golden State Water Company California American Water Company City of Elk Grove East Bay Municipal Utility District Elk Grove Water District City of Folsom Fruitridge Vista Water Company Omochumne-Hartnell Water District City of Rancho Cordova Regional Water Authority Sacramento Groundwater Authority City of Sacramento Sacramento Suburban Water District Sacramento Central Groundwater Authority Sacramento Regional County Sanitation District US Bureau of Reclamation Notices to Cities and Counties As required by the Act, SCWA notified cities and counties within the service area at least 60 days before the public hearing that the Plan was being prepared. Section 10 presents the information on this notice to cities and counties. SCWA is part of the County of Sacramento, so it did not need to provide notification to Sacramento County. 2-4
19 Section 3 System Description This section describes the SCWA s service area, organization, water supply facilities, service area climate, and population. 3.1 General Description SCWA was formed in 1952 by a special legislative act of the State of California called the Sacramento County Water Agency Act (Agency Act). SCWA is governed by a Board of Directors. Under the Agency Act, the Board may contract with the federal government and the State of California with respect to the purchase, sale, and acquisition of water. SCWA may also construct and operate any required capital facilities. SCWA provides retail water supply to portions of unincorporated Sacramento County, the City of Rancho Cordova, and the City of Elk Grove. SCWA also provides wholesale water supply to a portion of the service area of Elk Grove Water District. It is anticipated that SCWA will also provide wholesale water supply in the future to Cal Am s service area in Rio del Oro. Elk Grove Water District operates a retail water system serving customers within a portion of the City of Elk Grove. The combined Mather Sunrise and Laguna Vineyard public water systems are known as Zone 40. The Mather Sunrise system consists of the Zone 40 North Service Area (NSA). The Laguna Vineyard water system consists of both the Zone 40 Central Service Area (CSA) and South Service Area (SSA) Figure 2-1 illustrates SCWA s service area and relevant jurisdictional boundaries. The service area of the water distribution system is also shown Mather Sunrise The Mather Sunrise water system is also known as the NSA. The NSA is located south of the American River and includes part of the City of Rancho Cordova. The NSA is currently supplied exclusively by groundwater. The NSA is the least developed of the three service areas, with currently less than 10 percent of the projected build out population. This service area includes the old Mather and Sunrise Corridor systems, as well as the newer Sunridge system. SCWA assumed ownership of the Mather System shortly after the County of Sacramento took over the old Mather Air Force Base after it was shut down by the US Air Force in the mid- 1990s. In the case of the Sunrise Corridor System, SCWA was asked to take ownership and provide water service after the system was constructed through an assessment district in the late 1980 s. The majority of the land within the NSA boundary is rural and undeveloped Laguna Vineyard The Laguna Vineyard water system consists of the CSA and the SSA. The CSA is located to the south of the NSA and includes a portion of the City of Elk Grove. The CSA is supplied by surface water from the Vineyard Surface Water Treatment Plant (SWTP) and groundwater. SCWA provides wholesale water to Elk Grove Water District within the CSA. This service area includes the old Grantline-99 system, as well as the newer Vineyard, Vineyard Springs, and North Vineyard Station areas. 3-1


20 Metro Air Park Northgate 880 City of Sacramento Arden Park Vista City of Rancho Cordova Southwest Tract Mather Sunrise Laguna Vineyard Document Path: BCSACFP01P:\48000\ SCWA 2015 UWMP\Engineering\GIS\Fig3-1_SCWA_SubAreas_8x11_ mxd DATE 4/25/16 East Walnut Grove PROJECT Yolo County Sacramento County SITE TITLE Hood Elk Grove Water District City of Elk Grove Elk Grove Wholesale Legend Sacramento County Water Agency Urban Water Management Plan Sacramento County Water Agency Service Area SCWA Public Water System Boundaries Potable Water System Service Area California American Water Company Service Area Elk Grove Wholesale Area Elk Grove Water District Recycled Water System Area Sacramento County City of Elk Grove City of Rancho Cordova City of Sacramento Source: Basemap provided by ESRI & Affiliates Miles Figure 3-1
21 2015 Urban Water Management Plan Section 3 The CSA is predominately residential with a small amount of commercial and institutional customers and a large rural component to the east. The SSA is located south of the CSA and to the west of Highway 99 and includes a portion of the City of Elk Grove. The SSA is supplied by a mix of surface water, groundwater, and recycled water. The SSA is predominantly residential with some commercial and institutional customers as well Arden Park Vista The Arden Park Vista water system is located north of the American River and to the east of the City of Sacramento. The system began with the development of the Sierra Oaks and Arden Park areas approximately 80 years ago. The service area predominantly consists of single family residential customers. The Arden Park Vista water system is supplied by groundwater wells East Walnut Grove The East Walnut Grove service area is located in the southern part of Sacramento County along the east side of the Sacramento River within the town of Walnut Grove. The East Walnut Grove service area is supplied by groundwater wells and consists of one pressure zone. SCWA took over operation and maintenance of this water system in Hood The Hood service area is located in the southern part of Sacramento County along the east side of the Sacramento River north of the East Walnut Grove service area. The Hood service area is supplied by groundwater wells and consists of one pressure zone. SCWA took over operation and maintenance of this water system in 1970s Northgate 880 The Northgate 880 service area is located in the northern part of Sacramento County bordered by Interstate 80. The service area consists of all non-residential commercial and industrial customers. The Northgate 880 service area is supplied by groundwater wells and consists of one pressure zone Southwest Tract The Southwest Tract service area is located in central Sacramento County, south of the American River, near Fruitridge Road and Stockton Boulevard. Southwest Tract is a small service area (33 flat rate connections) where SCWA operates and maintains the distribution system, but the water is supplied by the Fruitridge Vista Water Company (FVWC). The Southwest Tract service area does not use any water produced by SCWA. The original agreement between FVWC and the Southwest Tract Water Maintenance District (SWTWMD), which later was annexed to SCWA, was adopted on March 2, In the agreement, the SWTWMD agreed to buy water from FVWC and to sell water to SCWA to satisfy the water supply needs for the parcels within the Southwest Tract service area. SWTWMD agreed to maintain its own mains, hydrants, and services, and to let the FVWC transmit water through the SWTWMD mains to certain parcels east of the Southwest Tract Metro Air Park The Metro Air Park service area is located in the northern part of Sacramento County adjacent to the east side of the Sacramento International Airport. Water supply and distribution facilities within the Metro Air Park service area will be constructed by the developer and then dedicated over to SCWA. A water storage tank and booster pump as well as the pipeline distribution system are in place in the Metro Air Park service area. These facilities are not active and there are currently no water demands in the Metro Air Park system. The water supply for Metro Air Park will be provided by the City of Sacramento through a wheeling/wholesale agreement between the City of Sacramento and SCWA. 3-3
22 2015 Urban Water Management Plan Section Service Area Climate The SCWA s service area experiences cool and humid winters and hot and dry summers. Based on the historical data obtained from the Western Regional Climate Center, the average minimum and maximum monthly temperature ranges from 38 to 93 degrees Fahrenheit. The combination of hot and dry weather results in higher water demands during the summer than in the winter months. Table 3-1 summarizes the Sacramento region s climate conditions. Month Table 3-1. Monthly Average Climate Data Summary Standard monthly average ET o (inches)(a, c) Average rainfall (inches) (b) Average temperature (degrees Fahrenheit) (b) Max Min January February March April May June July August September October November December Total (a) Data recorded from Sacramento Valley, Fair Oaks station 131, CIMIS (April 1997 (b) (c) October 2015). Data recorded from Sacramento Executive Airport, WRCC Station Number wrcc.dri.edu (November January 2015) ETo (evapotranspiration) is the loss of water from the soil both by evaporation and by transpiration from the plants growing thereon. 3.3 Service Area Population and Demographics This section presents the historical and projected population within the service areas of the eight public water systems. Table 3-2 presents the current and projected future population for SCWA s retail water systems. The 2015 population is estimated using the DWR population tool. The DWR population tool uses a GIS map of the water distribution system service area to calculate the 2010 population using the 2010 census and then estimates the 2015 population based on a correlation of the number of single family and multi family connections in 2015 compared to The projected populations for the Mather Sunrise and Laguna Vineyard water systems are based on the projections developed in the Water System Infrastructure Plan Update (SCWA, 2016). That document developed buildout land use acreage by type of approved land use, which was used to quantify the buildout number of dwelling units and water system connections. That assessment included the proposed West Jackson, Jackson Township, and NewBridge projects. The number of buildout dwelling units was used to estimate the buildout population. Buildout is projected to occur after 2040 in Zone 40. The annual growth in 3-4
23 2015 Urban Water Management Plan Section 3 population was developed from the assumed annual numbers of new connections. The populations for the Arden Park Vista, East Walnut Grove, Hood, and Southwest Tract systems are expected to remain stable at since those service areas are built out. The Metro Air Park and Northgate 880 water systems do not have residential population and are expected to remain with only nonresidential customers. The projected populations for SCWA s wholesale customers presented in Table 3-3 were developed by SCWA and shared with those retail agencies (SCWA, 2016). Table 3-2. (DWR Table 3-1 R) Retail: Population - Current and Projected Water system Arden Park Vista (a) (b) 9,372 9,372 9,372 9,372 9,372 Hood Water Maintenance District (a) (b) East Walnut Grove (a) (b) Southwest Tract Water Maintenance District (a) (b) Northgate 880 (a) (b) Zone 40, Laguna Vineyard and Mather-Sunrise (c) (b) 186, , , , ,229 Metro Air Park (a) (b) Population served 165, , , , , ,454 (a) Based on projection in 2010 UWMP. (b) Not quantified separately with DWR population tool. (c) Population developed in Water System Infrastructure Plan Update (SCWA, 2016). Table 3-3. (DWR Table 3-1 W) Wholesale: Population - Current and Projected Retail agency Elk Grove Water District Wholesale Area 12,053 12,963 13,845 14,697 15,520 Cal-Am Rio del Oro - - 2,500 5,000 7,500 10,000 Total 12,053 15,463 18,845 22,197 25,520 Note: Developed by SCWA. No population projection has been received from the retail agencies Other Demographic Factors Other demographic factors that affect water management planning include the uncertainty in estimating future population growth and per capita water use. The actual population growth that has occurred since the preparation of the 2005 and 2010 Plans has been generally less than anticipated. The recession that started in 2008 and the accompanying slow down in the construction of dwelling units resulted in population not growing as much as previously estimated. The adoption of 2020 per capita demand targets in 2010 along with the mandated demand reductions announced by the Governor in 2015 due to the drought have resulted in a significant decline in per capita water use. It is not known to what extent per capita water use will rebound to pre-drought levels once the drought ends. The uncertainties with both future population and per capita water use are considered in SCWA s water management planning. 3-5
24
25 Section 4 System Water Use This section presents the current and projected retail water demands by sector and the demands of SCWA s wholesale water customers, distribution system water losses, passive water savings, low income household water use, and climate change impacts on water use. 4.1 Water Uses by Sector The 2015 retail water demands by customer sector are presented in Table 4-1. Since SCWA s water system connections are not fully metered, the 2015 water sales by use type in Table 4-1 is estimated. The total water production in Table 4-1 excludes the deliveries to wholesale water customers plus an assumed amount for system losses. The 2015 wholesale water demands are presented in Table 4-2. Table 4-1. (DWR Table 4-1 R) Retail: Demands for Potable and Raw Water Actual 2015 Actual Use type Additional description Level of treatment when delivered Volume, ac-ft/yr Single family Drinking water 16,526 Multi-family Drinking water 759 Commercial Drinking water 2,442 Industrial Drinking water 311 Institutional/Governmental Drinking water 586 Landscape Drinking water 1,510 Landscape Raw water 170 Losses Drinking water 6,270 Total 28,574 Note: Source of data is spreadsheet workbook file entitled SCWA 2015 UWMP_ Connection and Consumption Data.xlsx provided by Dan Gwaltney in dated January 12, System losses may include some non metered water uses since not all connections are metered. The total water production excludes deliveries to wholesale customers and water losses associated with those deliveries as presented in Table
26 2015 Urban Water Management Plan Section 4 Table 4-2. (DWR Table 4-1 W) Wholesale: Demands for Potable and Raw Water - Actual 2015 Actual Use type Additional description Level of treatment when delivered Volume, ac-ft/yr Sales to other agencies Elk Grove Water District Drinking water 1,987 Sales to other agencies City of Sacramento Drinking water 627 Losses Transmission losses Drinking water 78 Total 2,692 Note: Source of Elk Grove data provided in memo provided by Dave Zuccaro on April 15, The data identified as Water Deliveries to EGWD as reported from customer s meters of 1,901 ac-ft is used. Assumed 4.5 percent loss added for system losses from wholesaler/retailer interconnections to retail agency's customers. Losses are calculated as a percent of the sales amount. Source of City of Sacramento data provided in spreadsheet workbook file entitled SCWA 2015 UWMP_ Connection and Consumption Data.xlsx provided by Dan Gwaltney in dated January 12, Transmission system losses estimated as 3.0 percent from water sources to interconnections. Transmission system losses are calculated as a percent of the sales amount for Elk Grove and the wholesale delivery amount for the City. Table 4-3 presents the current and projected future water demand by system, excluding recycled water and raw water. Tables 4-4 and 4-5 present the projected retail and wholesale water demands by use type through The projected retail water demands for the Laguna Vineyard and Mather Sunrise water systems are based on the projections developed in the 2016 Water System Infrastructure Plan (SCWA, 2016). In that document the buildout land use analysis was used to develop the buildout water demands. The assumed growth rate in water system connections was used to develop the water demand projections for the years before buildout. The portion of the demand projection for the other water systems are the same as the projections developed in the 2010 Plan since that is the most recent projection that has been developed. The projection of the wholesale demands for the Elk Grove wholesale area are based on coordination with Elk Grove Water District. The projection of the wholesale demands for Cal-Am are based on an analysis prepared by SCWA (SCWA, 2016). Tables 4-6 and 4-7 present the 2015 and projected total potable and recycled water demands. Table 4-3. Water Demands by System Retail Zone 40, Laguna Vineyard and Mather Sunrise 24,403 41,312 48,881 56,816 64,786 72,921 Arden Park Vista 2,803 3,630 3,527 3,412 3,315 3,315 East Walnut Grove Hood Northgate 880 1,074 1,264 1,168 1,148 1,131 1,131 Southwest Tract Retail subtotal 28,404 46,421 53,790 61,588 69,443 77,
27 2015 Urban Water Management Plan Section 4 Table 4-3. Water Demands by System Wholesale Elk Grove 1,986 4,000 4,200 4,560 4,560 4,560 Cal-Am Rio del Oro ,006 1,491 2,012 City of Sacramento Transmission system losses Wholesale subtotal 2,691 4,120 4,826 5,733 6,233 6,769 Total potable demand, retail and wholesale 31,095 50,541 58,616 67,321 75,676 84,346 Recycled and raw water 745 1,700 1,700 1,700 1,700 1,700 Total demand 31,840 52,241 60,316 69,021 77,376 86,046 Retail demand w/ RW 29,149 48,121 55,490 63,288 71,143 79,278 Table 4-4. (DWR Table 4-2 R) Retail: Demands for Potable and Raw Water Projected Use type Projected water use, ac-ft/yr Single family 30,840 34,322 37,540 40,282 42,663 Multi-family 2,139 3,257 4,629 6,245 8,118 Commercial 5,223 6,057 7,060 8,145 9,360 Industrial 524 1,084 1,801 2,670 3,699 Institutional/Governmental 1,109 1,251 1,391 1,517 1,635 Landscape 3,196 3,920 4,730 5,604 6,554 Losses 3,390 3,898 4,437 4,982 5,549 Total 46,421 53,790 61,588 69,443 77,578 Notes: Projected demands for all of SCWA s retail water systems. Table 4-5. (DWR Table 4-2 W) Wholesale: Demands for Potable and Raw Water - Projected Use type Additional description Projected water use, ac-ft/yr Sales to other agencies Elk Grove Water District 4,000 4,200 4,560 4,560 4,560 Sales to other agencies California American Water Company ,006 1,491 2,012 Losses Losses from supply sources to wholesale/retail interconnections projected to be 3.0% of wholesale delivery amounts Total 4,120 4,826 5,733 6,233 6,
28 2015 Urban Water Management Plan Section 4 Table 4-6. (DWR Table 4-3 R) Retail: Total Water Demands, ac-ft/yr Potable and raw water from Tables 4-1 and ,574 46,421 53,790 61,588 69,443 77,578 Recycled water demand from Table ,700 1,700 1,700 1,700 1,700 Total water demand 29,149 48,121 55,490 63,288 71,143 79,278 Table 4-7. (DWR Table 4-3 W) Wholesale: Total Water Demands, ac-ft/yr Potable and raw water from Tables 4-2 and 4-4 2,692 4,120 4,826 5,733 6,233 6,769 Recycled water demand from Table Total water demand 2,692 4,120 4,826 5,733 6,233 6, Distribution System Water Losses Water losses in SCWA s water system for 2015 are presented in Table 4-8. A detailed water system loss analysis is provided in Appendix G. The water audit is an accounting exercise that tracks all sources and uses of water within a water system over a specified period. Metered records are available for the retail customers that are located in the Elk Grove Water District s wholesale area. SCWA does not currently meter the wholesale water supplied to Elk Grove Water District at the multiple points of interconnection. Therefore, the water losses that occur between the wholesale/retail interconnections and each retail customer is projected to be 4.5 percent of the retail customer water sales amount and 3.0 percent from SCWA s production sources to the wholesale/retail interconnections. Table 4-8. (DWR Table 4-4R) Retail and Wholesale: 12 Month Water Loss Audit Reporting Reporting Period Start Date (Month/Year) Volume of Water Loss, ac-ft/yr 1/2014 2,858 *Taken from the field Water Losses (a combination of apparent losses and real losses) from the AWWA worksheet. 4.3 Water Savings from Codes, Standards, Ordinances, or Transportation and Land Use Plans Water savings from codes, standards, ordinances, or transportation and land use plans decrease the future water use for both existing and future customers compared to past water use characteristics. These water savings have been partially included in the water demand projections as noted in Table 4-9. Table 4-10 has been developed to quantify the projected water demand that includes the total water savings. The requirements that will result in future water savings include: Model Water Efficient Landscape Ordinance Effective on December 1, 2015, this new ordinance is projected to reduce the typical residential outdoor landscape demands for new construction by up to
29 2015 Urban Water Management Plan Section 4 percent from the estimated demand using the prior ordinance provisions. Commercial landscape for new construction may reduce outdoor water demand by up to 35 percent over the prior ordinance. California Energy Commission Title 20 appliance standards for toilets, urinals, faucets, and showerheads This standard will impact both new construction and replacement fixtures in existing homes. This is included in the CALGreen assumption for new construction described below. CALGreen Building Code Requires residential and non-residential water efficiency and conservation measures for new buildings and structures. For the development of Table 4-10, it is assumed that the reduction in unit water demands for customers in 2040 compared to existing older customers will be approximately 25 percent lower for residential customers, 15 percent lower for nonresidential customers, and 20 percent lower for landscape water customers. Table 4-9. (DWR Table 4-5 R) Retail Only: Inclusion in Water Use Projections Are future water savings included in projections? Yes If "Yes" to above, state the section or page number where citations of the codes, ordinances, etc utilized in demand projections are found. Location in UWMP on page 4-4. Are lower income residential demands included in projections? Yes Table Water Demand Projections with Savings due to Codes and Standards Customer category Demand with no future savings Demand as presented in Table 4-4 Demand with full savings Single family 48,697 42,663 36,752 Multi-family 10,532 8,118 7,697 Commercial 10,008 9,360 8,543 Industrial 3,990 3,699 3,446 Institutional 1,749 1,635 1,495 Landscape irrigation 7,294 6,554 5,758 Losses 6,170 5,549 4,777 Total 88,440 77,578 68, Water Use for Lower Income Households The Act requires that the water demand projections include the projected water use for lower income households. The demand projections presented in this Plan include all of the households in SCWA s service area, therefore lower income household water use is included in the demand projections. DWR states that 4-5
30 2015 Urban Water Management Plan Section 4 water suppliers should determine the number of low income housing units projected for the service area as identified in housing elements of applicable general plans and estimate their projected water use. The income limits for lower income households are to be established by DWR based on 80 percent of area median income, adjusted for family size. The Sacramento County median household income is $55,615 and $79,051 for the City of Elk Grove. None of the applicable housing elements quantify the number of low income households in SCWA s service area, and none of them present projections. The Housing Element of the Sacramento County General Plan, which was adopted on October 8, 2013, states that the Vineyard Community Area has 23.1 percent low income households (Sacramento County, 2013). The City of Elk Grove Housing Element (City of Elk Grove, March 2015) does not quantify the number of low income households. The Sacramento Area Council of Governments (SACOG) estimates that the low income households are 43 percent of the total for Sacramento County, 25 percent for the City of Elk Grove, and 48 percent for the City of Rancho Cordova (SACOG, 2012). Based on these information sources, it is likely that the proportion of low income households within SCWA s service area is within the range of 23 to 48 percent of the total number of households. 4-6
31 Section 5 SB X7-7 Baselines and Targets This section presents the updated per capita water demand baseline and target analysis including the baseline periods, service area population, gross water use, resulting updated baseline and target per capita water use, and comparison of the 2015 per capita water use to the 2015 target. This analysis replaces the analysis prepared for the 2010 Plan. The Senate Bill (SB) X7-7 verification tables are presented in Appendix E. 5.1 Baseline Periods SCWA selected the 1995 to 2004 as its 10-year baseline period and 2003 to 2007 as its 5-year baseline period in the 2010 Plan. SCWA has decided to use the same baseline periods for this Plan. The baseline period ranges are presented in Table Service Area Population In order to calculate the annual baseline gallons per capita per day (GPCD), SCWA re-estimated the served population for each baseline year in both the baseline periods and for the 2015 compliance year. SCWA conducted a baseline population analysis as part of the 2010 Plan based on the year 2000 census and using the population of all of its public water systems. The year 2010 census data was not available until after the 2010 Plan submittal deadline. For this 2015 UWMP, SCWA re-calculated its baseline population using 1990, 2000, and 2010 census data for its public water systems. The DWR population tool was used as noted in Table SBX7-7 Table 2, located in Appendix E. The boundaries of areas served by the water distribution systems in 1990 and 2010 were used with the population tool. The population for the noncensus years was determined by correlating the population to the number of single and multifamily residential connections for each of those years. The updated population results are presented in Table SBX7-7 Table 3, located in Appendix E. 5.3 Gross Water Use Gross water use is the measure of water that enters the SCWA distribution system over a 12-month period with certain allowable exclusions. SCWA s gross water use for the baseline years and 2015 are shown in Table SBX7-7 Table 4 located in Appendix E. 5.4 Baseline Daily Per Capita Water Use The daily per capita water use for each of the baseline years is calculated by dividing the gross water use for each year by the service area population for each year as presented in Table SBX7-7 Table 5, located in Appendix E. The resulting 5-year and 10-year baseline per capita water use are shown in Table 5-1. The 10- year baseline per capita water use determined in the 2010 Plan was 278 GPCD compared to the 295 GPCD determined in this updated analysis and 2020 Targets SCWA has selected Method 1 to determine its per capita water use targets as noted in SBX7-7 Tables 7 and 7-A, located in Appendix E. SBX7-7Table 7-F located in Appendix E confirms that the minimum reduction for the 2020 target is met. This is the same method selected in the 2010 Plan. Method 1 determines the per 5-1
32 2015 Urban Water Management Plan Section 5 capita water demand target as 80 percent of the baseline per capita water use. The resulting per capita water demand targets are summarized in Table 5-1. The 2020 per capita demand target of 236 GPCD compares to the 222 GPCD from the 2010 Plan. Table 5-1. (DWR Table 5-1 R) Baselines and Targets Summary: Retail Agency or Regional Alliance Only Baseline period Start year End year Average GPCD 2015 interim target, GPCD Confirmed 2020 target, GPCD year Year N/A N/A 5.6 Compliance Daily per Capita Water Use As shown in Table 5-2, SCWA s 2015 per capita water demand was less than the 2015 interim target. There are allowable adjustments that can be made to the gross water use for extraordinary events, economic adjustments, or weather normalization. SCWA did not adjust their 2015 gross water use, as noted in Table 5-2. Table 5-2. (DWR Table 5-2 R) 2015 Compliance: Retail Agency or Regional Alliance Only Actual 2015 GPCD (a) 2015 Interim target GPCD (a) Extraordinary events (a) Optional adjustments to 2015 GPCD from Methodology 8 Economic adjustment (a) Weather normalization (a) TOTAL adjustments (a) Adjusted actual 2015 GPCD (a) 2015 GPCD (a) (adjusted if applicable) Did supplier achieve targeted reduction for 2015? Y/N Yes (a) All values are in gallons per capita per day (GPCD) 5-2
33 Section 6 Water Supplies SCWA uses purchased water, surface water, groundwater, and recycled water as its sources of water supply. DWR defines purchased water as water purchased from other suppliers, including non self-supplied surface water. Surface water is defined by DWR as self-supplied water that is drawn from streams, lakes, and reservoirs (DWR, 2016). These water supply definitions are used in this Plan for the purpose of describing SCWA s water supplies. This section describes each of the water supplies, future water projects, and climate change impacts to supply. 6.1 Purchased Water SCWA has two sources of purchased surface water supplies, as described below Central Valley Project The Central Valley Project (CVP) water supply consists of the CVP contract held by SCWA and the two Sacramento Municipal Utilities District (SMUD) assignments that total 45,000 acre feet per year (ac-ft/yr). Most of the CVP water is diverted at the Freeport diversion on the Sacramento River and treated at the Vineyard SWTP. Some of the CVP supplies are diverted from the Sacramento River and treated at the City s Sacramento River Surface Water Treatment Plant and delivered to SCWA at the Franklin Intertie. SCWA entered into a contract in April 1999 with the Reclamation for 22,000 ac-ft/yr of CVP supplies pursuant to Public Law (PL) This contract is often referred to as Fazio Water in recognition of the efforts by Congressman Vic Fazio to secure this contract. Of this 22,000 ac-ft/yr, 7,000 ac-ft/yr has been subcontracted to the City of Folsom for diversion from Folsom Lake, with 15,000 ac-ft/yr available for SCWA through the Freeport diversion or Franklin Intertie. SCWA has entered into two three-party agreements with the City of Sacramento and SMUD for the assignment to SCWA for a total of 30,000 ac-ft/yr of water from SMUD s existing contract with Reclamation. These assignments are often referred to as SMUD I and SMUD II. SCWA s total CVP supply is subject to reductions in dry years. The water supply allocations are defined by Reclamation on a year to year basis and are expressed as a percentage of either the contract amount or amount of average use. For the 21 year period of 1995 to 2015, the lowest allocation was in 2015 when it was established as 25 percent of the previous three years average unconstrained use. The water supply allocations are based on a draft policy that defines water shortage terms and conditions. Reclamation initiated the development of a Municipal and Industrial (M&I) Water Shortage Policy in 1992, with several proposals prepared through The 2001 draft water shortage policy states that Reclamation would reduce M&I water to a contractor once irrigation water allocations are reduced below 75 percent of the contract amount. Reclamation has a provision in the draft policy for a minimum M&I shortage allocation of 75 percent that is applied to the last three years of historical use with certain adjustments, although the actual allocation in 2014 was 75 percent and in 2015 it was 25 percent of the use during the previous three unconstrained years. In 2010, Reclamation convened several workshops that will lead to the development of an Environmental Impact Statement that could potentially modify the existing policy or develop a new policy (US, 2011). This process has not been completed. 6-1
34 2015 Urban Water Management Plan Section City of Sacramento s American River Place of Use Water Supply A portion of Zone 40 lies within the City of Sacramento s American River Place of Use (POU). The City of Sacramento has a pre-1914 water right to the American River with a POU boundary that extends beyond the City s boundary and includes a portion of Zone 40. The amount of water available to serve the POU area within Zone 40 is estimated to be 9,300 ac-ft/yr. SCWA is planning for the future wholesale delivery of American River water within the POU. A connection would be constructed to supply the Florin Vineyard Community Plan area of the Laguna Vineyard water system, with the timing based on when the supply is actually needed. The City of Sacramento s diversions from the American River at the Fairbairn Water Treatment Plant are reduced when American River flows are less than the Hodge Flow Criteria, which would likely result in no POU water being available for SCWA in these circumstances. The City of Sacramento may decide to divert water during these restricted times at their Sacramento River diversion, although additional infrastructure might need to be constructed by the City of Sacramento to be able to convey this water to SCWA. It might be possible for SCWA to divert the POU water at the Freeport diversion. Given the uncertainty of the availability of POU water during dry periods, a supply allocation of zero percent is assumed for dry years and 100 percent for normal climate years. 6.2 Surface Water SCWA has an appropriative water supply that is self-supplied surface water that is drawn from the Sacramento River. In February 2008, the State Water Resources Control Board (SWRCB) approved SCWA s appropriative right permit application to divert water from the American and Sacramento Rivers (Permit 21209). The amount of appropriated water available for use could range up to 71,000 ac-ft/yr in wet years, primarily during the winter months. This water would be diverted at the Freeport diversion on the Sacramento River. Since SCWA s demands are low in the winter months, it is possible that not all of this supply could be utilized without the ability to store the water. 6.3 Groundwater Groundwater is a vital source of supply for SCWA. Groundwater is supplied by SCWA s system of groundwater wells and as remediated groundwater that is extracted by others. The Arden Park Vista, Northgate 880, Hood, East Walnut Grove, and Mather Sunrise water systems are completely reliant on groundwater. The Mather Sunrise system is planned to be supplied also by purchased water and surface water in the near future. The Laguna Vineyard system is supplied by groundwater as well as purchased water, surface water, and a small amount of recycled water. Laguna Vineyard system depends on mostly groundwater during dry years when available surface water supplies are reduced. The groundwater is supplied by a system of groundwater wells and groundwater treatment plants. This section provides a description of SCWA s groundwater supplies including descriptions of the applicable groundwater basins, the status of groundwater management, overdraft conditions, historical groundwater pumping, and the remediated groundwater supply Groundwater Basin Description The Arden Park Vista system is supplied by groundwater from the Sacramento Valley Groundwater Basin, North American Subbasin ( ) and Zone 40 system is supplied groundwater from the South American Subbasin ( ). The Water Forum Agreement divided the groundwater basin in Sacramento County into three portions as shown on Figure 6-1. The North Basin identified in Figure 6-1 is the southern portion of the North American Subbasin ( ). The Central Basin s boundaries shown on Figure 6-1 are similar to the boundaries of the 6-2
35 2015 Urban Water Management Plan Section 6 South American Subbasin ( ), although there are some differences. Both the North and Central Basins have had on going groundwater management efforts as described below in Section Some of the other groundwater purveyors in the North American and South American Subbasins are listed in Table 6-1. Table 6-1. Other Known Groundwater Basin Purveyors North American Subbasin ( ) South American Subbasin ( ) City of Sacramento City of Sacramento Sacramento Suburban Water District Golden State Water Company California American Water Company California American Water Company Rio Linda/Elverta Community Water District Fruitridge Vista Water Company Golden State Water Company Elk Grove Water District Citrus Heights Water District Florin County Water District Fair Oaks Water District Tokay Park Orangevale Mutual Water Company Del Paso Manor Water District Carmichael Water District City of Roseville Natomas Central Mutual Water Company 6-3

36 2015 Urban Water Management Plan Section 6 Figure 6-1. Groundwater Basins in Sacramento County 6-4
37 2015 Urban Water Management Plan Section 6 North American Subbasin ( ) The historical use of groundwater in the North American Subbasin ( ) has resulted in a general lowering of groundwater levels that have stabilized in recent years. These depressions have grown and coalesced into a single cone of depression centered in the area of the prior McClellan Air Force Base. Groundwater elevations in the eastern and western areas of the North American Subbasin ( ) have been fairly stable, while the central area (within the cone of depression) experienced continuing decline every year until groundwater levels stabilized and had some recovery starting in the late 1990s. The groundwater level stabilization in the cone of depression was due, at least in part, to expanded conjunctive use operations by water agencies in this area. The groundwater quality in the North American Subbasin ( ) is generally excellent. Most municipal wells do not need any treatment to meet drinking water standards other than disinfection. However, there are some wells that have iron and manganese treatment, as well as locations with elevated levels of arsenic and hexavalent chromium. There are several groundwater contaminant plumes and some point sources of contamination (e.g., leaking underground storage tanks). The three groundwater contaminant plumes emanate from source areas at the prior McClellan Air Force Base, the Roseville railroad yard, and the Aerojet in Rancho Cordova. The presence of these contaminant plumes has damaged some existing municipal wells and limits the construction of new municipal wells in the vicinity of the contaminant plumes. Significant remediation efforts/programs by federal, state, and local government agencies are in progress to confine and clean up the contaminated groundwater. South American Subbasin ( ) Intensive groundwater extraction from the South American Subbasin ( ) in the past has resulted in a general lowering of groundwater elevations. These depressions have grown and coalesced into a single cone of depression centered near Elk Grove. With the completion of the Freeport Regional Water Authority (FRWA) project and SCWA s Vineyard SWTP, the groundwater levels are anticipated to stabilize as the conjunctive use program is fully implemented. The groundwater quality in the South American Subbasin ( ) is generally good, although iron and manganese is common and there are some occurrences of arsenic and nitrate. Most of SCWA s Zone 40 wells have iron and manganese treatment facilities. Principal groundwater contaminant plumes within the South American Subbasin ( ) emanate from source areas including Mather Field, Aerojet, Boeing, the former Army Depot, and various landfills. The presence of these contaminant plumes has impacted some existing municipal wells. Significant remediation efforts/programs by federal, state, and local government agencies are in progress to clean up the contaminated groundwater and to confine the contaminant plumes from further spreading. Currently, remediated groundwater is discharged into natural water bodies and flows out of the South American Subbasin ( ). There are on-going discussions and negotiations between purveyors and parties responsible for the clean-up to keep the remediated groundwater in the South American Subbasin ( ) and put it to beneficial use Groundwater Management This section describes the groundwater management efforts that have been occurring in the North American Subbasin ( ) and the South American Subbasin ( ). Neither subbasin has been adjudicated. Activities to meet the Sustainable Groundwater Management Act (SGMA) requirements are also described. North American Subbasin ( ) The groundwater in the North Basin portion of the North American Subbasin ( ) is managed by the Sacramento Groundwater Authority (SGA). SGA draws its authority from a joint powers agreement signed by the cities of Citrus Heights, Folsom, and Sacramento and the County of Sacramento to exercise their 6-5
38 2015 Urban Water Management Plan Section 6 common police powers to manage the underlying groundwater basin. The goal of the SGA is to ensure a viable groundwater resource for beneficial uses including agricultural, industrial, and municipal supplies that support the Water Forum Agreement s co-equal objectives of providing a reliable and safe water supply and preserving the fishery, wildlife, recreational, and aesthetic values of the lower American River. The SGA Groundwater Management Plan was first completed in December 2003 and updated in December The SGA prepares a biannual report to evaluate progress on Groundwater Management Plan (GMP) implementation and to report on basin conditions. The most recent groundwater management plan and biennial report are located at SGA s website at South American Subbasin ( ) The groundwater in the Central Basin portion (as shown in Figure 4-2) of the South American Subbasin ( ) is managed by the Sacramento Central Groundwater Authority (SCGA). SCGA was formed in 2006 through a joint powers agreement signed by the Cities of Elk Grove, Folsom, Rancho Cordova, and Sacramento, and the County of Sacramento. SCGA was formed for several purposes including maintaining the long-term sustainable yield of the Central Basin, managing the use of groundwater in the Central Basin, and facilitating the implementation of a conjunctive use program. The SCGA Groundwater Management Plan, which was adopted in 2006, establishes a framework for maintaining sustainable groundwater resources in the Central Basin. This framework includes specific goals, objectives, and an action plan to manage the basin. The SCGA Groundwater Management Plan also prescribes a well protection program to protect existing private domestic well and agricultural well owners from declining groundwater levels resulting from increased groundwater pumping due to new development in the basin. The SCGA Groundwater Management Plan includes a detailed groundwater management implementation plan to comply with the requirements of their basin management objectives. Additionally, SCGA prepares a biennial report to evaluate progress on Groundwater Management Plan implementation and to report on basin conditions. The most recent groundwater management plan and biennial report are located at SCGA s website at Sustainable Groundwater Management Act The Sustainable Groundwater Management Act (SGMA) was enacted by the legislature in 2014, with subsequent amendments in SGMA requires groundwater management in priority groundwater basins, which includes the formation of Groundwater Sustainability Agencies (GSAs) and the development of Groundwater Sustainability Plans (GSPs) for groundwater basins or subbasins that are designated by DWR as medium or high priority. The designation of the priority of groundwater basins was done as part of the California Statewide Groundwater Elevation Monitoring (CASGEM) Program. CASGEM was developed in response to legislation enacted in California's 2009 Comprehensive Water package. The CASGEM Groundwater Basin Prioritization is a statewide ranking of groundwater basin importance that incorporates groundwater reliance and focuses on basins producing greater than 90 percent of California's annual groundwater. The CASGEM Program has ranked both the North American Subbasin ( ) and the South American Subbasin ( ) as high priority. SGMA directs DWR to identify groundwater basins and subbasins in conditions of critical overdraft. DWR identified such basins in Bulletin-118, 1980 and Bulletin 118, Update DWR issued an updated draft list of critically overdrafted basins in July Neither of the two subbasins that supply SCWA are on the list. Groundwater basins designated as high or medium priority and critically overdrafted must be managed under a GSP by January 31, All other high and medium priority basins must be managed under a GSP by January 31, The two subbasins that supply SCWA are covered by the latter deadline. 6-6
39 2015 Urban Water Management Plan Section 6 A GSA must be formally established by June 30, The GSA will have enforcement authority over their designated portion of the basin. There are three options for preparing a GSP and forming a GSA, as follows: A single GSP covering the entire basin developed and implemented by one GSA. A single GSP covering the entire basin developed and implemented by multiple GSAs. Multiple GSPs implemented by multiple GSAs and coordinated pursuant to a single coordination agreement that covers the entire basin. The various agencies that are located in the North American Subbasin ( ) have been in discussions to explore options for the organization of one or more GSA s. It is likely that the North American Subbasin ( ) will have several GSAs and possibly several GSPs. SGA filed a notice with DWR on October, 20, 2015 that it intends to be the GSA for a portion of the North American Subbasin ( ). The SCGA is currently in discussions with other groundwater basin users of the South American Subbasin ( ) to evaluate options for management of the basin Overdraft Conditions As mentioned in the previous subsection, the North American Subbasin ( ) and the South American Subbasin ( ) are not on the draft list of critically overdrafted basins issued by DWR in July According to the Water Forum Agreement, the long-term average annual groundwater pumping from the North Basin is limited to 131,000 ac-ft/yr and the Central Basin is limited to 273,000 ac-ft/yr. No specific annual groundwater pumping amount has been defined for SCWA in the Central Basin. In June 2010, the SGA developed Phase III of the Water Accounting Framework which established a combined sustainable pumping estimate of 4,288 ac-ft/yr for SCWA s Arden Park Vista and Northgate 880 systems (SGA, 2010). It is expected that the GSPs that will be developed for the North American Subbasin ( ) and the South American Subbasin ( ) will establish the safe yields Historical Groundwater Pumping Table 6-2 presents the amount of groundwater pumping by SCWA that has occurred over the last five years. Table 6-2 (DWR Table 6-1) Retail and Wholesale: Groundwater Volume Pumped, ac-ft/yr Groundwater type Location or basin name Alluvial basin Alluvial basin Sacramento Valley Groundwater Basin, North American Subbasin ( ) Sacramento Valley Groundwater Basin, South American Subbasin ( ) 4,654 5,076 5,316 4,602 3,877 29,972 25,553 23,512 23,179 20,775 Total 34,626 30,629 28,828 27,781 24,652 Notes: Source of data is spreadsheet workbook file entitled SCWA 2015 UWMP_ Connection and Consumption Data.xlsx provided by Dan Gwaltney in dated January 12, Amounts include groundwater that was supplied to wholesale customers. Groundwater remediation water not included because it was not pumped by SCWA. 6-7
40 2015 Urban Water Management Plan Section Remediated Groundwater SCWA has a remediated groundwater supply of 8,900 ac-ft/yr in accordance with the terms and conditions in the agreement entitled Agreement between Sacramento County, SCWA, and Aerojet-General Corporation With Respect To Transfer of GET Water dated May 18, The timing and amount of remediated groundwater available is subject to change as a result of on-going negotiations with water purveyors affected by groundwater contamination and with Aerojet/Boeing as their remediation plans may change as directed by various regulatory agencies. The remediated groundwater is pumped from the northern portion of the South American Subbasin ( ) and discharged into the American River from Aerojet s Groundwater Extraction and Treatment (GET) facilities located in the Rancho Cordova area that are used for groundwater clean-up operations. This remediated groundwater supply is diverted by SCWA from the Sacramento River at Freeport along with SCWA s surface water supplies. 6.4 Stormwater Stormwater is not currently used as an urban water supply source. SCWA may consider the use of stormwater at a future time. 6.5 Wastewater and Recycled Water The purpose of this section is to provide information on recycled water and its potential as a resource for Zone 40. The elements of this section include: (1) the quantity of wastewater generated in the service area, (2) description of the collection, treatment, and disposal/reuse of that wastewater, (3) current water recycling systems, and (4) the potential for water recycling in the service area Recycled Water Coordination The Sacramento Regional County Sanitation District (SRCSD) is responsible for the collection, treatment, disposal, and reuse of wastewater throughout most of the urbanized areas of Sacramento County. This includes much of the area where SCWA provides retail water service. Through an agreement, SRCSD has successfully implemented a nominal capacity of 5 million gallons per day (MGD) water recycling program with SCWA. Starting in 2003, this program provides recycled water for SRCSD on-site uses and for large commercial irrigation customers within a portion of the Laguna Vineyard water system service area (e.g., commercial, industrial, right-of-way landscaping, schools, and parks). Recycled water is a desirable source of water for outdoor landscape irrigation and other non-potable uses because of its high reliability and its independence of hydrologic conditions in any given year. In 2007, SRCSD completed the Water Reuse Opportunity Study (WROS) to identify opportunities for water recycling program growth through 2030 (SRCSD, 2007). SRCSD s objective is to increase water recycling usage in the Sacramento region during peak irrigation months to 30 MGD to 40 MGD. Water recycling on this scale will allow SRCSD to better manage its effluent discharge to the Sacramento River and could help Sacramento area water purveyors improve water supply availability and reliability. The WROS effort included significant outreach to stakeholders that could participate in SRCSD s future water recycling plans. The WROS provides the following: 1. Studied areas throughout the Sacramento region to identify potential water recycling opportunities, 2. Engaged potential water recycling partners and stakeholders, 3. Developed, assessed, and prioritized potential water recycling projects, and 4. Provided a strategy to further develop and implement the projects initially selected to move forward in achieving the stated goals of a large-scale water recycling program. 6-8
41 2015 Urban Water Management Plan Section 6 The WROS examined and identify potential opportunities to use recycled water for landscape irrigation, agriculture irrigation, commercial irrigation, golf course irrigation, as well as use as industrial processing water. The agencies and their respective roles in water reuse planning are described in Table 6-3. Participating agencies Sacramento Regional County Sanitation District Regional Water Authority Sacramento Central Groundwater Authority Sacramento County Water Agency Table 6-3. Participation in Reuse Planning Role As the only agency with wastewater collection and treatment authority, SRCSD developed a Water Recycling Opportunities Study (WROS) to identify reuse supply and projects for implementation. SRCSD is a member of RWA and actively seeks input from water purveyors on reuse supply and planning issues. Provides input and review of SRCSD s reuse planning process and recommendations. Updates SRCSD on supply issues and where/how reuse could become part of supply integration. Provides input and review of SRCSD s reuse planning process and recommendations. Updates SRCSD on supply issues and where/how reuse could become part of supply integration. Provides input to SRCSD on localized water demands and supply to highlight where reuse is most feasible. SCWA is responsible for recycled water distribution system operation and maintenance for the current recycled water system in the South Service Area Wastewater Collection, Treatment, and Disposal Municipal wastewater is generated from a combination of residential and commercial sources. The quantity of wastewater generated is proportional to the population and water use in the service area. An estimates of wastewater generated within SCWA s service area is presented in Table 6-4. Wastewater is collected by gravity in a series of main, trunk, and interceptor sewers owned and operated by SRCSD. Collected wastewater is transported to the Sacramento Regional Wastewater Treatment Plant in Elk Grove. This facility serves the entire Sacramento metropolitan area including the unincorporated county area adjacent to the Cities of Elk Grove, Citrus Heights, Folsom, and Rancho Cordova. The current capacity of the plant to treat dry weather flows is approximately 181 MGD. The plant produces a disinfected secondary effluent that is discharged to the Sacramento River downstream from the community of Freeport. The principal treatment processes are primary sedimentation, pure-oxygen activated sludge, secondary sedimentation, and chlorination/dechlorination. The Sacramento Regional Wastewater Plant is currently being upgraded to produce cleaner water for discharge to the Sacramento River and for water reuse. Upgrades to the treatment plant include nutrient removal, filtration, and additional disinfection. Upgrades are planned to be completed by
42 2015 Urban Water Management Plan Section 6 Table 6-4. (DWR Table 6-2 R) Wastewater Collected Within Service Area in Percentage of 2015 service area covered by wastewater collection system 100 Percentage of 2015 service area population covered by wastewater collection system Wastewater collection Receiving wastewater treatment Name of wastewater collection agency Wastewater volume metered or estimated? Volume of wastewater collected from UWMP service area 2015, acft/yr Name of wastewater treatment agency receiving collected wastewater Treatment plant name Is WWTP located within UWMP area? Is WWTP operation contracted to a third party? Add additional rows as needed Sacramento Regional County Sanitation District estimated 15,000 Sacramento Regional County Sanitation District Sacramento Regional Wastewater Treatment Plant No No Total wastewater collected from service area in ,000 Notes: A summary of wastewater volumes treated, discharged, and recycled by SRCSD in 2015 is provided in Table 6-5. Table 6-5. (DWR Table 6-3 R) Retail: Wastewater Treatment and Discharge Within Service Area in 2015, ac-ft/yr Wastewater treatment plant name Discharge location name or identifier Discharge location description Wastewater discharge ID number Method of disposal Does this plant treat wastewater generated outside the service area? Treatment level Wastewater treated 2015 volumes (ac-ft) Discharged treated wastewater Recycled within service area Recycled outside of service area Sacramento Regional Wastewater Treatment Plant Sacramento River Near Freeport River or creek outfall Yes Secondary, Disinfected , ,688 Sacramento Regional Wastewater Treatment Plant Zone 40 recycled water system West part of City of Elk Grove in Laguna- Vineyard system Other Tertiary 575 Total 142, ,
43 2015 Urban Water Management Plan Section Recycled Water System Tertiary treated wastewater is supplied from SRCSD s Water Reclamation Facility to a part of the Laguna Vineyard system that is shown on Figure 3-1 as the Recycled Water System Area. The 5 MGD Water Reclamation Facility is located at the Sacramento Regional Wastewater Treatment Plant site. SCWA owns and maintains the recycled water distribution system. This program is called the Phase I SRCSD/SCWA Water Recycling Pilot Program (WRPP). The Phase 1 portion of the program has 54 user sites which include parks, schoolyards, commercial landscaping, and roadway medians. Phase I recycled water usage has reached a peak operation of 3.0 MGD and an average daily water recycling usage in the range of MGD. All operations are conducted in accordance with the Regional Water Quality Control Board (RWQCB) and State Water Resources Control Board recycled water standards and SRCSD s Master Reclamation Permit Waste Discharge Requirement (WDR) #97-146) Recycled Water Beneficial Uses The most commonly used category of recycled water is defined as wastewater that has been treated to tertiary standards that meet Title 22 of the California Code of Regulations. Recycled water treated to this level can be used for many types of beneficial uses, including for outdoor irrigation demands such as for parks, schools, street medians, residential front and backyard landscaping, and public open space, as well as for industrial uses such as cooling water. Additionally, recycled water is commonly used for environmental purposes such as wetland and habitat restoration. SRCSD is currently in the process of implementing the South Sacramento County Agriculture and Habitat Lands Recycled Water Program. Benefits include protecting surface water and groundwater supplies by providing 52,000 ac-ft/yr of recycled water to irrigate permanent agriculture and habitat lands. Another benefit is the augmentation of regional water supplies and restoration of groundwater elevations in that area. Facilities that will be needed include water transmission and distribution pipelines and treatment, pumping, and storage facilities. SCWA could potentially tap into the proposed pipeline to access recycled water supply. Since the proposed area where this recycled water would be used is outside of SCWA s service area, it is not included in the recycled water projections. Table 6-6 presents the projected possible reuse water demands for landscape irrigation in SCWA s service area. SCWA is planning to initiate a recycled water feasibility study in 2016 that will take a comprehensive look at various options for expanding recycled water use. 6-11
44 2015 Urban Water Management Plan Section 6 Table 6-6. (DWR Table 6-4 R) Retail: Current and Projected Recycled Water Direct Beneficial Uses Within Service Area, ac-ft/yr Recycled water is not used and is not planned for use within the service area of the supplier. Name of agency producing (treating) the recycled water: Sacramento Regional County Sanitation District Name of agency operating the recycled water distribution system: Sacramento County Water Agency Supplemental water added in Source of 2015 supplemental water Raw water Beneficial use type General description of 2015 uses Level of treatment (opt) Agricultural irrigation Landscape irrigation (exc golf courses) Tertiary 575 1,700 1,700 1,700 1,700 1,700 Golf course irrigation Commercial use Industrial use Geothermal and other energy production Seawater intrusion barrier Recreational impoundment Wetlands or wildlife habitat Groundwater recharge (IPR) Surface water augmentation (IPR) Direct potable reuse Other (provide general description) *IPR Indirect Potable Reuse Total 575 1,700 1,700 1,700 1,700 1,700 Notes: The projected future amount of recycled water could be increased as a result of the recycled water feasibility study that SCWA is preparing in Table 6-7 shows actual recycled water use in 2015 compared to what was projected in the previous Plan. The goal was under achieved primarily because of the recent downturn in development and lack of available funding. 6-12
45 2015 Urban Water Management Plan Section 6 Table 6-7. (DWR Table 6-5 R) Retail: 2010 UWMP Use Projection Compared to 2015 Actual, ac-ft/yr Use type 2010 Projection for actual use Agricultural irrigation Landscape irrigation (ex golf courses) 1, Golf course irrigation Commercial use Industrial use Geothermal and other energy production Seawater intrusion barrier Recreational impoundment Wetlands or wildlife habitat Groundwater recharge (IPR) Surface water augmentation (IPR) Direct potable reuse Other Total 1, Notes: An additional 170 ac-ft of raw water was also used Actions to Encourage and Optimize Future Recycled Water Use The installation of a recycled water distribution system as a retrofit, or the installation of a recycled water system after development entitlements have been granted or where infrastructure is already in place, is highly unlikely for economic reasons. New growth areas, as well as areas that are currently served nonpotable water supplies from another source, are good candidates for recycled water use. Since much of the potential for new growth in Sacramento County is in SCWA s service area, the opportunity for expanding the recycled water program is more likely in that area. The economic question of obtaining additional surface water supplies or making best use of recycled water will be one of many factors in determining which areas are likely to move forward with recycled water. Other factors include environmental benefits, long-term sustainability of regional water supplies, as well as other societal and long-term benefits. In areas where groundwater supplies are not readily available or constrained or where surface water supplies are constrained based on hydrologic year type, recycled water is often seen as reliable source of supply that could extend existing water supplies to meet demands beyond those previously contemplated. Another method to encourage recycled water use is meeting groundwater basin management objectives. For example, providing recycled water for landscape and/or agriculture irrigation that currently relies on groundwater would reduce total groundwater extraction in the basin. Lastly, providing a financial incentive can also encourage recycled water use. Table 6-8 shows that SCWA is planning to prepare a recycled water feasibility study to evaluate the projected recycled water demand in SCWA s service area and the actions to encourage recycled water use. Alternatives that will be evaluated consist of expansion of the existing recycled water program, direct reuse, indirect reuse, and the status quo. 6-13
46 2015 Urban Water Management Plan Section 6 Expanding recycled water use is the result of combined efforts including planning, financial incentives, as well as environmental benefits. It is not possible to separate the results for each individual action taken. A combination of factors will result in the projected use of recycled water in the future including a lower recycled water unit cost compared to the potable water unit cost, the requirement of recycled water use in the future, the increased reliability of recycled water as compared to the water supply from groundwater and surface water supply sources, and the increase in installation of dedication landscape meters. Customers may be allotted a higher water use budget for recycled water use compared to those customers using potable water for their landscape water needs. Table 6-8. (DWR Table 7-1) Retail: Methods to Expand Future Recycled Water Use Supplier does not plan to expand recycled water use in the future. Supplier will not complete the table below but will provide narrative explanation. Provide page location of narrative in UWMP. Name of action Description Planned implementation year Expected increase in recycled water use Prepare recycled water feasibility study Notes: Expanding the existing recycled water system, indirect potable reuse, and direct potable reuse will be considered. Recycled Water Feasibility Study to be completed in Total Unknown until Recycled Water Feasibility Study is completed. Will be identified in Recycled Water Feasibility Study. 6.6 Desalinated Water Opportunities While limited sources of brackish groundwater do exist within the region, it would be cost prohibitive to install desalination treatment to be able to use these supplies. SCWA has no plans to develop or implement a desalination program as a future supply source. 6.7 Exchanges or Transfers Other sources of water for SCWA are water transfers. The water transfer supply would be obtained from various water users that hold surface water rights on the Sacramento River and the American River upstream of SCWA s point of diversion. To obtain these supplies, SCWA would enter into purchase and transfer agreements with other entities that hold surface water rights upstream of SCWA s points of diversion. There are Sacramento River water supplies available for transfer in dry years, although the costs of these dry year supplies can exceed $500 per ac-ft. The assumed quantity of other water supplies is 9,600 ac-ft/yr in dry years and no supplies transferred in wet years. The amount of water transfer supplies that would be needed would vary depending on the amount of supplies actually needed to close the gap between SCWA s other supplies and demands. 6.8 Future Water Projects Table 6-9 provides a summary and schedule of the SCWA s planned water supply projects that are planned through 2040 to meet projected water demands and continue to provide supply reliability. SCWA has plans to construct additional water supply projects after
47 2015 Urban Water Management Plan Section 6 Table 6-9. (DWR Table 6-7) Retail and Wholesale: Expected Future Water Supply Projects or Programs No expected future water supply projects or programs that provide a quantifiable increase to the agency's water supply. Supplier will not complete the table below. Some or all of the supplier's future water supply projects or programs are not compatible with this table and are described in a narrative format. Provide page location of narrative in the UWMP Name of future projects or programs Joint project with other agencies? (Y/N) If yes, agency name Description (if needed) Planned implementation year Planned for use in year type Expected increase in water supply to agency, ac-ft/yr Phase A NSA Project No 2020 All year types 9,000 Disconnection of Anatolia GWTP (a) No 2020 All year types -4,000 Phase B NSA Project No 2025 All year types 27,000 (b) Poppy Ridge GWTP Expansion No 2025 All year types 4,000 West Jackson GWTP No 2035 All year types 10,000 Big Horn GWTP Expansion No 2035 All year types 5,000 Notes: These projects will expand infrastructure capacity to allow SCWA to utilize more of its available water supplies. The expected increase in supplies includes supply for the wholesale customers. The retail and wholesale breakdown of the supplies from each project is not specifically known. (a) The decline in groundwater capacity is because the Excelsior wells will be put on standby until the West Jackson GWTP is constructed. (b) With the existing capacity of the Vineyard SWTP, this project plus the Phase A NSA Project will combined be able to deliver 18,000 ac-ft/yr of surface water to the NSA. The full capacity of this project will not be utilized until the Vineyard SWTP is expanded. 6.9 Summary of Existing and Planned Sources of Water Table 6-10 presents SCWA s water supplies and amounts delivered in 2015 for its retail water systems. Table 6-11 presents the wholesale water supplies delivered in
48 2015 Urban Water Management Plan Section 6 Table (DWR Table 6-8 R) Retail: Water Supplies Actual, ac-ft/yr Water supply Additional detail on water supply Actual volume 2015 Water quality Total right or safe yield Purchased or imported water CVP water 115 Surface water Appropriative water 2,125 Groundwater 21,963 Groundwater Remediated groundwater 4,176 Transfers Other surface water supplies 0 Recycled water 575 Drinking water Drinking water Drinking water Drinking water Drinking water Drinking water 45,000 71,000 8,900 9,600 1,700 Raw water 170 Raw water Other Supply for SW Tract 25 Drinking water Total 29, ,500 Notes: Water supplies for SCWA s retail systems determined by using total production and then subtracting out the deliveries to wholesale customers that include system losses. The amount of CVP water, appropriative water, and remediated groundwater supplied in 2015 based on the Freeport intake amounts provided in from Dave Zuccaro dated April 19, The amounts have been proportioned down to reflect the supply provided from the Vineyard SWTP using a total of 6,959 ac-ft at Freeport versus a supply of 6,416 ac-ft/yr at Vineyard SWTP. The safe yield of the groundwater supply has not been determined. Table (DWR Table 6-8 W) Wholesale: Water Supplies Actual, ac-ft/yr Water supply Additional detail on water supply Actual volume 2015 Water quality Total right or safe yield Purchased or imported water CVP water 0 Drinking water 0 Surface water Appropriative water 0 Drinking water 0 Groundwater 2,689 Drinking water Groundwater Remediated groundwater 0 Drinking water 0 Transfers Other surface water supplies 0 Drinking water 0 Recycled water 0 Total 2,689 Recycled water 0 Notes: It is assumed for the purpose of this Plan that wholesale water is supplied by groundwater. There could be varying amounts of some surface water included in the wholesale supply that have not been quantified. 6-16
49 2015 Urban Water Management Plan Section 6 The projected annual availability of each water supply is constrained by available water infrastructure capacity. The projected reasonably available water supply volume for SCWA s retail water systems for the next 25 years during a normal climate year considering facility capacity constraints is projected in Table The availability of each water supply type on an annual basis is projected based on the assumption that the proportional annual mix of supplies is the same as that on the day of maximum demand. The actual annual use of supplies could somewhat differ from the presented values if SCWA took an operational approach that would result in the annual mix of supplies being different than the mix of supplies used during the day of maximum demand. Table 6-13 presents the projected water supplies available for wholesale customers. It is assumed in Table 6-13 that wholesale water customers would be provided the supply needed to meet their demands. The supply available for SCWA s retail water systems is assumed to be the total supply available minus the supply available for the wholesale customers. 6-17
50 2015 Urban Water Management Plan Section 6 Table (DWR Table 6-9 R) Retail: Water Supplies Projected, ac-ft/yr Water supply Purchased or imported water Purchased or imported water Surface water Groundwater Groundwater Transfers Additional detail on water supply CVP water. SCWA may vary this amount in combination with the appropriative surface water, remediated groundwater, and transfer supplies so that the combined total does not exceed the total annual demand that the Vineyard SWTP can supply of approximately 34,200 ac-ft/yr. City of Sacramento supply. Not planned for use until the interconnection with the City is constructed after Appropriative water. SCWA may vary this amount as described for purchased water. Available volume based on groundwater supply capacity. Safe yield not quantified. Remediated groundwater. SCWA may vary this amount as described for purchased water. Other surface water supplies. SCWA may vary this amount as described for purchased water. Reasonably available volume Projected Water Supply Report To the Extent Practicable Total right or safe yield Reasonably available volume Total right or safe yield Reasonably available volume Total right or safe yield Reasonably available volume Total right or safe yield Reasonably available volume Total right or safe yield 21,300 45,000 21,300 45,000 21,300 45,000 21,300 45,000 21,300 45, , , , , ,300 4,000 71,000 4,000 71,000 4,000 71,000 4,000 71,000 4,000 71,000 47,000 47,000 52,000 62,000 62,000 8,900 8,900 8,900 8,900 8,900 8,900 8,900 8,900 8,900 8, , , , , ,600 Recycled water 1,700 1,700 1,700 1,700 1,700 1,700 1,700 1,700 1,700 1,700 Total 82, ,500 82, ,500 87, ,500 97, ,500 97, ,
51 2015 Urban Water Management Plan Section 6 Table (DWR Table 6-9 W) Wholesale: Water Supplies Projected, ac-ft/yr Water supply Additional detail on water supply Reasonably available volume Projected water supply report to the extent practicable Total right or safe yield Reasonably available volume Total right or safe yield Reasonably available volume Total right or safe yield Reasonably available volume Total right or safe yield Reasonably available volume Total right or safe yield Groundwater 5,000 5,000 6,000 7,000 7,000 Total 5,000 5,000 6,000 7,000 7,
52 2015 Urban Water Management Plan Section Energy Intensity Reporting of the energy intensity associated with sources of water is a voluntary item. Water energy intensity is the total amount of energy on a per ac-ft basis associated with water management processes occurring within the SCWA s operational control. SCWA has selected to report its energy intensity using the total utility approach option B. Table 6-14 presents the energy intensity of SCWA s water supplies for the year Table Voluntary Energy Intensity-Total Utility Approach Urban water supplier: Sacramento County Water Agency Water delivery product Retail and wholesale potable water deliveries Table O-1B: Voluntary energy intensity - total utility approach Enter start date for reporting period 1/1/2015 End date 12/31/2015 Urban water supplier operational control Sum of all water management processes Non-consequential hydropower Total utility Hydropower Net utility Volume of water entering process (ac-ft) 31, Energy consumed (kwh) 21,792, Quantity of self-generated renewable energy Energy intensity (kwh/ac-ft) Data quality kwh Metered data Data quality narrative: Data obtained from power billings based on metered usage. Power amount includes power for the administrative and shop buildings at the Vineyard SWTP. Volume of water is total water production from wells and Vineyard SWTP and includes supplies for both retail and wholesale customers Climate Change Climate change is anticipated to have an impact on water demands and supplies. SCWA is a member of the Regional Water Authority that prepared the American River Basin Integrated Regional Water Management Plan (IRWMP) (RWA, 2013). One of the elements in the IRWMP is the identification and prioritization of areas of potential vulnerability to climate change impacts. The resulting Climate Change Vulnerability Assessment is presented in Appendix J. The vulnerability assessment highlights the water resources that are important to the region and are sensitive to climate change. The identified highest priority vulnerabilities in the region pertinent to urban water demands and supplies are as follows: 6-20
53 2015 Urban Water Management Plan Section 6 Increased potential for summer water shortage due to increased summer demand caused by warming temperatures. Reduced water supply reliability due to the region s reliance on snowpack, existing storage capacity limitations, and increased drought potential. The projected reductions of Sierra snowpack, earlier snowmelt runoff, and more frequent and longer periods of drought would reduce water supply reliability for the region. A quantitative vulnerability assessment was done in the IRWMP to evaluate the impacts of climate change on water resources in the region. The quantitative assessment indicates that surface water supplies would be reduced and would be mostly associated with reduced diversions from the American River. The analysis projected that the annual surface water deliveries at Freeport would increase by 2 percent. The long-term average monthly surface water deliveries would increase by 3 to 9 percent from May to July and decrease by 9 percent from August to September under climate change conditions. Increased groundwater pumping would occur to meet urban and agricultural demands. The long term average groundwater pumping in the central groundwater basin would increase by 6 percent. Groundwater elevations would decrease from 6 to 15 feet from the baseline condition in SCWA s service area. Planned actions to address noted vulnerabilities from the climate change assessment include decreasing urban per capita water demand and continuing current efforts such as implementing conjunctive use management, recycled water use, and interconnections between adjacent water purveyors. SCWA will update this Plan every five years and utilize the latest available data to plan for climate change effects. Purchased wholesale CVP water from Reclamation is SCWA s primary source of surface water supply. Reclamation recently completed the Sacramento and San Joaquin Basins Study (Reclamation, 2016) that evaluates the potential impacts of climate and socioeconomic changes. The evaluation concluded that unmet water demands would increase slightly in the Sacramento River watershed. Unmet demands are the gaps between supplies and demands. No specific conclusions were made regarding the impacts of climate change on the specific availability of CVP supplies. 6-21
54
55 Section 7 Water Supply Reliability This section describes constraints on water sources and reliability by climate year type and provides a comparison of projected water supplies and demands. 7.1 Constraints on Water Sources Constraints on SCWA s surface water supplies includes the significant variation of supplies that are available depending on the climate year type as described in Section 6. Even though the surface water supplies are not available at a consistent level of use, SCWA has available groundwater supplies to be able to replace the reduction in surface water supplies in dry years. While groundwater is more consistently available over different climate year types, it has been constrained by groundwater contamination plumes, some naturally occurring contaminants, and the long term need to not exceed the safe yield. The capacity of supply and conveyance facilities is also a constraint on both surface water and groundwater supplies. SCWA has plans to construct additional water supply facilities as presented in Table 6-9. In general, water quality does not have a significant impact on SCWA s current and projected water supplies. The Vineyard SWTP and groundwater treatment plants provide treatment meet to drinking water standards. 7.2 Reliability by Type of Year The basis of water year data for determining surface water supply reliability is provided in Table 7-1. The water supply allocation from the CVP supply in 2015 was a historical low. The CVP allocation for the three year 2013 to 2015 period was also the lowest historical three year sequence. As can be seen in Table 7-2, the CVP allocation for 2013 to 2015, was 100 percent, 75 percent, and 25 percent of the prior three year average constrained use for each of the years respectively. The CVP supply represents SCWA s most significant surface water supply source. Even with the low CVP allocation in 2015, as shown in Table 7-1 the overall water supply was still 90 percent of normal because of the availability of other water supply sources. Table 7-2 shows the breakdown of the estimated availability of each supply source for 2013 to Table 7-3 shows the basis of the wholesale water supply reliability. As stated earlier, it is assumed that wholesale water supplies would be fully available as required to meet wholesale water demands. 7-1
56 2015 Urban Water Management Plan Section 7 Year type Table 7-1. (DWR Table 7-1) Retail: Basis of Water Year Data Base year Available supplies if year type repeats Quantification of available supplies is not compatible with this table and is provided elsewhere in the UWMP. Location Quantification of available supplies is provided in this table as either volume only, percent only, or both. Volume available % of avg supply Average year % Single-dry year % Multiple-dry years 1st year % Multiple-dry years 2nd year % Multiple-dry years 3rd year % Notes: Percent of average supply based on amount used as determined in Table 7-2. These percentages of average supply will change in the future as the dry year allocation amount of CVP water increases as the normal year use of CVP water increases. Table 7-2. Calculation of Percent of Average Supply, ac-ft/yr Water supply Purchased water, surface water, and remediated groundwater 13,969 7,933 6,416 Groundwater 28,828 27,781 24,652 Recycled water and raw water Total 43,628 36,493 31,813 Normal year 43,628 43,628 43,628 Supply as % of normal year 100% 84% 73% Notes: In 2014 and 2015, demand was reduced due to the drought and the required reduction in demands. 7-2
57 2015 Urban Water Management Plan Section 7 Table 7-3. (DWR Table 7-1 W) Wholesale: Basis of Water Year Data Year type Base year Available supplies if year type repeats Quantification of available supplies is not compatible with this table and is provided elsewhere in the UWMP. Location Quantification of available supplies is provided in this table as either volume only, percent only, or both. Volume available % of avg supply Average year % Single-dry year % Multiple-dry years 1st year % Multiple-dry years 2nd year % Multiple-dry years 3rd year % Notes: Supply was provided to retail agencies to meet their demands. In 2014 and 2015 demand was reduced due to the drought and the required reduction in demands. 7.3 Supply and Demand Assessment This section provides a comparison of normal, single-dry, and multiple dry water year supply and demand for SCWA. Table 7-4 presents the normal year supply to demand comparison for the retail water system, and Table 7-5 presents the comparison for the wholesale water system. The projected supplies are based on the approximate amount that can be delivered with the capacity constraints of the water supply infrastructure that is planned to exist at that time. Table 7-4. (DWR Table 7-2 R) Retail: Normal Year Supply and Demand Comparison, ac-ft/yr Supply totals 82,900 82,900 87,900 97,900 97,900 Demand totals 48,121 55,490 63,288 71,143 79,278 Difference 34,779 27,410 24,612 26,757 18,622 Table 7-5. (DWR Table 7-2 W) Wholesale: Normal Year Supply and Demand Comparison, ac-ft/yr Supply totals 5,000 5,000 6,000 7,000 7,000 Demand totals 4,120 4,826 5,733 6,233 6,769 Difference
58 2015 Urban Water Management Plan Section 7 The projected water supplies are compared to the demands for a single dry year for the SCWA retail systems in Table 7-6. Table 7-7 presents the single dry year comparison for the wholesale supplies and demands. The dry year demands are assumed to be the same as the normal year demands in Table 7-6. In actuality, demands in dry years can be a few percentage points higher due to the hotter and drier climate in dry years that leads to higher outdoor water use. On the other hand, during 2015 the State Water Resources Control Board mandated demand reductions that amounted to 32 percent for SCWA. It is possible that future years that are the same water supply conditions as 2015 may have similar demand reductions. Table 7-6. (DWR Table 7-3 R) Retail: Single Dry Year Supply and Demand Comparison, ac-ft/yr Supply totals 70,200 70,500 74,600 83,600 83,800 Demand totals 48,121 55,490 63,288 71,143 79,278 Difference 22,079 15,010 11,312 12,457 4,522 Notes: See Table 7-10 for a break down of the supplies by source. Table 7-7. (DWR Table 7-3 W) Wholesale: Single Dry Year Supply and Demand Comparison, ac-ft/yr Supply totals 5,000 5,000 6,000 7,000 7,000 Demand totals 4,120 4,826 5,733 6,233 6,769 Difference Notes: See Table 7-10 for a break down of the supplies by source. The projected water supplies are compared to the demands for a multiple dry year for the SCWA retail systems in Table 7-8. Table 7-9 presents the multiple dry year comparison for the wholesale supplies and demands. The multiple dry year scenario mimics the water supply conditions of 2013 to 2015 when CVP allocations were 100 percent, 75 percent, and 25 percent of the average use of supplies during the previous three years. The demands presented in Tables 7-8 and 7-9 are the same as the normal year demands, but as discussed for the single dry year scenario, the second and third year demands might be lower if demand reduction mandates are imposed by the State of California. 7-4
59 2015 Urban Water Management Plan Section 7 Table 7-8. (DWR Table 7-4 R) Retail: Multiple Dry Years Supply and Demand Comparison, ac-ft/yr Supply totals 77,900 77,900 81,900 90,900 90,900 First year Demand totals 48,121 55,490 63,288 71,143 79,278 Difference 29,779 22,410 18,612 19,757 11,622 Supply totals 77,900 77,900 81,900 90,900 90,900 Second year Demand totals 48,121 55,490 63,288 71,143 79,278 Difference 29,779 22,410 18,612 19,757 11,622 Supply totals 70,200 70,500 74,600 83,600 83,800 Third year Demand totals 48,121 55,490 63,288 71,143 79,278 Difference 22,079 15,010 11,312 12,457 4,522 Notes: Based of the selected base years in Table 7-3, the first year is normal year supplies, the second year is based on a 75% allocation of CVP water, and the third year is the same as the single dry year with a 25% CVP allocation. Table 7-11 presents the second year supplies by source. Table 7-10 presents the third year supplies by source. Table 7-9. (DWR Table 7-4 W) Wholesale: Multiple Dry Years Supply and Demand Comparison, ac-ft/yr Supply totals 5,000 5,000 6,000 7,000 7,000 First year Demand totals 4,120 4,826 5,733 6,233 6,769 Difference Supply totals 5,000 5,000 6,000 7,000 7,000 Second year Demand totals 4,120 4,826 5,733 6,233 6,769 Difference Supply totals 5,000 5,000 6,000 7,000 7,000 Third year Demand totals 4,120 4,826 5,733 6,233 6,769 Difference Determining the amount of CVP supplies available in the dry years requires first a projection of the use of the CVP supply in normal years. The CVP dry year allocation is determined based on a percentage of the previous three years of use. The projected availability of single dry year supplies is presented in Table 7-10 with facility capacity constraints. During dry years SCWA would seek to supplement its reduced CVP supplies with the use of other surface water supplies. Table 7-11 presents the projected availability of supplies for the second year of a multiple dry year with facility capacity constraints. Tables 7-10 through 7-11 are for the combined total of water supplies for SCWA s retail service area and wholesale customers. 7-5
60 2015 Urban Water Management Plan Section 7 Table Projected Available Single Dry Year Water Supplies with Facility Constraints, ac-ft/yr Water Supply Surface water, all types Purchased water CVP 8,000 8,300 8,400 8,400 8,600 City of Sacramento Surface water (appropriative) Transfers (other surface water supplies) 9,600 9,600 9,600 9,600 9,600 Other (remediated groundwater) 8,900 8,900 8,900 8,900 8,900 Subtotal 26,500 26,800 26,900 26,900 27,100 Groundwater for Zone 40 41,000 41,000 46,000 56,000 56,000 Groundwater for non Zone 40 systems 6,000 6,000 6,000 6,000 6,000 Recycled water 1,700 1,700 1,700 1,700 1,700 Total 75,200 75,500 80,600 90,600 90,800 Wholesale supply to retailers 5,000 5,000 6,000 7,000 7,000 Retail supply w/ recycled water 70,200 70,500 74,600 83,600 83,800 Notes: This table is also applicable for the third year of the multiple dry year scenario. Table Projected Available Multiple Dry Years Water Supplies for Second Year with Facility Constraints, ac-ft/yr Water Supply Surface water, all types Purchased water CVP 24,000 24,900 25,050 25,125 25,650 City of Sacramento Surface water (appropriative) Transfers (other surface water supplies) 1, Other (remediated groundwater) 8,900 8,900 8,900 8,900 8,550 Subtotal 34,200 34,200 34,200 34,200 34,200 Groundwater for Zone 40 41,000 41,000 46,000 56,000 56,000 Groundwater for non Zone 40 systems 6,000 6,000 6,000 6,000 6,000 Recycled water 1,700 1,700 1,700 1,700 1,700 Total 82,900 82,900 87,900 97,900 97,900 Wholesale supply to retailers 5,000 5,000 6,000 7,000 7,000 Retail supply w/ recycled water 77,900 77,900 81,900 90,900 90,900 Notes: See Table 6-12 for the first year and Table 7-10 for the third year for a breakdown of supplies for the multiple dry year scenario. 7-6
61 2015 Urban Water Management Plan Section Regional Supply Reliability SCWA relies fully on local water supplies with no use of imported water. Water programs that SCWA utilizes to maximize regional supply reliability are described as follows. RWA - SCWA is member of RWA and participates in RWA s American River Integrated Regional Water Management Plan (IRWMP) as well as RWA s water efficiency program. The IRWMP identifies specific projects and implementation programs and agreements between different affected agencies to identify projects to put conjunctive use in place. An intended purpose of this IRWMP is to provide and encourage regional opportunities for water resources planning and project development. Water Forum Successor Effort - SCWA is a member of the Water Forum Successor Effort and is a signatory to the Water Forum Agreement. The Water Forum process brought together a diverse group of stakeholders that included water managers, business and agricultural leaders, environmentalists, citizen groups, and local governments to evaluate available water resources and the future needs of the Sacramento metropolitan region. The coequal objectives of the Water Forum Agreement are to: 1) provide a reliable and safe water supply for the region s economic health and planned development through the year 2030; and 2) preserve the fishery, wildlife, recreational, and aesthetic values of the lower American River. The Water Forum Agreement contains seven major elements to meet its objectives including purveyor specific agreements. SGA - SCWA, through the County of Sacramento, is a Board member of the SGA. SGA has adopted a regional groundwater management plan. SCGA SCWA, through the County of Sacramento, is a Board member of the SCGA. SCGA has adopted a regional groundwater management plan for the Central Basin. Through active participation in the above referenced programs, SCWA has access to and participates in the development of various water management tools that provide opportunities for regional cooperation and resource optimization. 7-7
62
63 Section 8 Water Shortage Contingency Planning This section describes SCWA s planning for responding to water shortages including stages of action, prohibitions, penalties, consumption reduction methods, mechanisms for determining actual reductions in use, revenue and expenditure impacts, a shortage contingency resolution, plans for catastrophic events, and the estimated multiple dry-year minimum water supply. In its role as a water wholesaler, SCWA does not have the ability to impose use restrictions or other requirements directly on end users of water in the event of a shortage; such actions must be taken by the SCWA s retail water agencies. 8.1 Stages of Action Table 8-1 presents SCWA s stages of action. SCWA updated its stages of action in a Water Shortage Contingency Plan document in 2014, as presented in Appendix I. Table 8-1 (DWR Table 8-1 R). Retail : Stages of WSCP Stage Percent supply reduction Complete both Water supply condition Normal 0 Normal 1 10% Water alert - probability that supplies will not be able to meet all demands 2 25% Water warning - supplies not meeting current demands 3 50% 4 Greater than 50% Water crisis - major failure of a supply, storage, or distribution system, supplies not meeting current demands Water emergency - major failure of a supply, storage, or distribution system, supplies not meeting current demands 8.2 Prohibitions on End Uses Prohibitions on end uses are presented in Table 8-2. The prohibitions in Table 8-2 are based on the prohibitions for each stage that are presented in the 2014 Water Shortage Contingency Plan document presented in Appendix I. 8-1
64 2015 Urban Water Management Plan Section 9 Table 8-2 (DWR Table 8-2 R). Retail Only: Restrictions and Prohibitions on End Uses Stage Restrictions and prohibitions to end users Additional explanation or reference Penalty, charge, or other enforcement? Y/N Landscape irrigation Normal Restrict or prohibit runoff from landscape irrigation Y Normal to 3 Limit landscape irrigation to specific days per week and times Varies from 3 days per week to 1 day per week. Y 4 Prohibit all landscape irrigation Y CII Normal Restaurants may only serve water only upon request Y Water features and swimming pools 2 Water use for decorative water features, such as fountains, is prohibited Y 3 Prohibit filling of residential swimming pools Y Normal Require recirculating water pumps for pools, ponds, and fountains. Y Other Normal Customers must repair leaks, breaks, and malfunctions in a timely manner Y Normal Require automatic shut off hoses Y Normal Prohibit use of potable water for washing hard surfaces Y 3 Prohibit residential car washing and charity car wash events Y 4 New connection moratorium Y 2 Use of potable water for construction Y In May 2015, the State Water Resources Control Board adopted an emergency conservation regulation in response to four Executive orders issued by Governor Brown to address California s severe drought condition. The emergency conservation regulation prohibited the following water uses: Using potable water to irrigate ornamental turf on public street medians 8-2
65 2015 Urban Water Management Plan Section 9 Using potable water to irrigate landscapes of new homes & buildings inconsistent with California Building Standards and Code (CBSC) and Department of Housing and Community Development (DHCD) requirements Using outdoor irrigation during and 48 hours following measurable precipitation Using potable water in decorative water features that do not recirculate the water Using hoses with no shutoff nozzles to wash cars Runoff when irrigating with potable water Using potable water to wash sidewalks & driveways Requirements for water suppliers include: Notify customers about leaks that are within the customer's control Report on water use, compliance & enforcement Requirements for businesses (commercial users) include: Hotels & motels must provide guests with the option of not having towels & linens laundered daily Restaurants & other food service establishments can only serve water to customers on request 8.3 Penalties, Charges, and Other Enforcement of Prohibitions SCWA utilizes several approaches to enforce water use prohibitions including notices of violation, fines, and termination of service. Section of the Water Agency Code describes a fine for unauthorized actions. 8.4 Consumption Reduction Methods Consumption reduction methods are actions that SCWA can take to reduce its water consumption. Table 8-3 presents these methods. Table 8-3 (DWR Table 8-3 R). Retail Only: Stages of WSCP - Consumption Reduction Methods Stage Consumption reduction methods by water supplier Additional explanation or reference 1 Expand public information campaign 2 Increase frequency of customer billing and meter reading 1 Offer water use surveys 3 Provide rebates for plumbing fixtures and devices 1 Provide rebates for landscape irrigation efficiency 3 Provide rebates for turf replacement 2 Decrease line flushing 2 Reduce system water loss 2 Increase water waste patrols 4 Moratorium or net zero demand increase on new connections 4 Implement or modify drought rate structure or surcharge 4 Other Reduce pressure in water lines 2 Other Flow restriction 8-3
66 2015 Urban Water Management Plan Section 9 Table 8-3 (DWR Table 8-3 R). Retail Only: Stages of WSCP - Consumption Reduction Methods Stage Consumption reduction methods by water supplier Additional explanation or reference 2 Other Restrict use of potable water for construction 4 Other Per capita water allotment by customer type 1 Other Voluntary rationing 4 Other Mandatory rationing w Other-Water shortage pricing 8.5 Determining Water Shortage Reductions To determine reductions in demand, SCWA can monitor the individual water use of its metered customers. SCWA bills its customer s bi-monthly. These bills show the amount of water used by the customer during the previous billing period as well as previous month s usage. These billing reports can be generated more frequently to verify if a customer has reduced their water usage during a water shortage period or after the customer has received a Water Shortage Advisory. Currently, about ninety percent of SCWA s customers are metered and SCWA is seeking opportunities to install meters on all existing services. All new connections are required to have meters. Upon completion of this program, SCWA will have the ability to fully monitor their customers water use. To determine reductions in production, SCWA maintains records of how much groundwater produced at each groundwater well and how much surface water is being supplied. This production data is typically summarized monthly, but can be generated more frequently if there is a water shortage and there is a need to target specific areas for conservation. The following Table 8-4 summarizes SCWA s procedure for monitoring its various water shortage actions for effectiveness. Table 8-4. Reduction Measuring Mechanisms Mechanism for determining actual reduction Use normalized or average water use baseline to determine reductions More frequent review of production More frequent meter reading at customer location More frequent leak detection and repair More frequent meter checking and repair System audit Automated sensors and telemetry Monitor utility actions 8-4
67 2015 Urban Water Management Plan Section Revenue and Expenditure Impacts Approximately ninety percent of the connections within SCWA s service areas are metered. Therefore, if there were a water supply shortage or a catastrophe that would significantly reduce water demand, either voluntarily or involuntarily, SCWA would see a loss in revenue. Costs would also decrease, but at a slower rate than revenues because SCWA continues to incur fixed costs during a water shortage. To address revenue reductions during a water shortage, SCWA would consider utilizing a portion of the Rate Stabilization Fund, delaying capital projects, and seeking funding assistance from the state or federal government through loans and/or grants. SCWA will consider adopting a drought surcharge in its rate structure the next time water rates are updated. 8.7 Resolution or Ordinance According the Section 350 of the Water Code, the SCWA Board of Directors must declare a water shortage emergency if there is insufficient water for human consumption, sanitation, and fire protection. The emergency declaration would prompt SCWA to implement its Water Shortage Contingency Plan. Appendix I presents the water shortage contingency resolution. 8.8 Catastrophic Supply Interruption Plan SCWA has various procedures and contingencies prepared in order to be able to continue to deliver water to its customers after a catastrophe. These include water storage capacity, backup power generators at every pump station and treatment plant, the ability to accommodate portable electric generators, use of backup/standby facilities, and utilization of interties with adjacent water purveyors. SCWA would also dedicate all necessary maintenance staff to repair and isolate major distribution system failures. SCWA would also notify the public regarding water supply shortages through mailers, newspaper notices, and television and radio announcements. SCWA and the County have planned for the possibility of a catastrophe. The following is a summary of some of the plans that have been developed: Sacramento County Multi-Jurisdictional Local Hazard Mitigation Plan The Multi-Jurisdictional Local Hazard Mitigation Plan (LHMP) was prepared in accordance with the requirements of the Disaster Mitigation Act of 2000 (PL ). The LHMP functions as the Community Rating System (CRS) Floodplain Management Plan for the County. The LHMP identifies and assesses the risks from potential natural hazards in Sacramento County, reviews the County s current capabilities to reduce the impacts from hazards, and includes recommended actions to reduce vulnerability to potential disasters. The natural hazards identified and investigated in the LHMP include severe weather, flood, dam and levee failure, earthquakes, wildfires, and drought (Sacramento County). Sacramento County Multi-Hazard Disaster Plan This existing plan was developed pursuant to the Disaster Mitigation Act of 2000 regulations published in the Federal Register, Volume 67, Number 38, Tuesday, February 26, 2002 (Sacramento County, 2004). This plan identifies goals, objectives, and measures for hazard mitigation and risk reduction to make communities less vulnerable and more disaster resistant and sustainable. Information in the plan can also be used to help guide and coordinate mitigation activities and local policy decisions for future land use decisions. Dam Emergency Preparedness Plans The County has copies of the emergency plans and inundation maps for Folsom Dam that were prepared by the Reclamation. 8-5
68 2015 Urban Water Management Plan Section 9 County Sandbag Locations The County has an inventory of sandbag stockpiles and a map showing where these resources are located. These sites are posted on the web at Sandbag locations are stocked and opened when there is a recognized threat of impending high intensity storms. Sacramento County Flood ALERT System Automated Local Evaluation in Real Time (ALERT), developed by the National Weather Service (NWS), signals the County Department of Water Resources of possible flooding. It provides continuous and automatic reports from river levels and rainfall gauges. These monitoring stations provide data to determine when to initiate evacuation procedures. Sacramento County Website Emergency information can be found on the County s website at ( or Also included are links to several agencies serving the County to contact if an emergency condition occurs. 8.9 Minimum Supply Next Three Years The estimated three-year minimum water supply is presented in Tables 8-5 and 8-6 assuming the historical multiple dry year hydrology of 2013 to Table 8-5. (DWR Table 8-4 R). Retail: Minimum Supply Next Three Years, ac-ft/yr Available water supply 77,900 77,900 70,200 Table 8-6. (DWR Table 8-4 W). Wholesale: Minimum Supply Next Three Years, ac-ft/yr Available water supply 5,000 5,000 5,
69 Section 9 Demand Management Measures SCWA is a member of the California Urban Water Conservation Council (CUWCC) and has submitted its best management practices (BMP) annual reports, as presented in Appendix F. This section briefly describes the progress in implementing several specific measures that can be optionally described in the Plan in addition to providing the BMP reports. 9.1 Demand Management Measures Common for Retail and Wholesale Water Agencies This section describes demand management measures (DMMs) that are implemented by SCWA for both its retail and wholesale customers Water Waste Prevention Ordinances Water waste is prohibited by ordinance SCWA Code Title 3 Section Section 3.40 of Title 3 of the SCWA Code is provided in Appendix H. Water waste can be reported online on SCWA s website or by calling either SCWA or our 875-RAIN hotline. The conservation staff responds to complaints by conducting a site visit and making contact with the consumer typically in the form of a door hanger letter Metering The SCWA water system currently has meters installed on most of the connections. The wholesale interconnections that supply Elk Grove Water District are not currently metered due to the large number of interconnections and the high cost of metering all of these interconnections. SCWA is investigating how to most efficiently meter all wholesale/retail agency interconnections Conservation Pricing SCWA implements conservation pricing in accordance with the CUWCC Memorandum of Understanding Public Education and Outreach In addition to local public education and outreach programs, SCWA also participates in a regional public education and outreach program through the RWA. The RWA is a joint powers authority formed in 2001 to promote collaboration on water management and water supply reliability programs in the greater Sacramento, Placer, El Dorado, Yolo, and Sutter counties. In collaboration with 22 water provider members and other wastewater, stormwater and energy partners, RWA formed the Water Efficiency Program (WEP) in 2001 to bring cost effectiveness through economies of scale to public education and outreach activities. The remainder of this subsection describes the regional program. The WEP operates on an average annual budget of $411,000 and is supplemented by grant funding. In response to the 2015 drought, the WEP collected an additional $150,000 in funding from participating water providers for additional media and advertising buys to help meet the SWRCB s mandatory conservation targets. Grant funding is an important funding resource for the WEP. Since 2003, the WEP has been awarded $9.1 million in grant funding for public outreach and education as well as rebate, direct install, water loss, individualized customer usage reports, large landscape budgets and more. 9-1
70 2015 Urban Water Management Plan Section 9 The main function of the WEP is to develop and distribute public outreach messages for customers in the region by collaborating with its water provider members on their outreach activities. The WEP distributes these messages on a regional scale through regional media and advertising buys. From , the WEP created a series of public outreach campaigns. Below is a summary of each campaign and highlighted achievements. The Blue Thumb campaign ran from and was focused on reducing outdoor water use. While most people have heard of a "Green Thumb," which describes someone with a skill for gardening, the campaign showcased people who earned their "Blue Thumb" by making a personal commitment to using water wisely outdoors. The iconic blue thumb gardening gloves were given away at public events and were worn by local celebrities like Sacramento s Mayor Johnson during promotional activities. The Do the Sprinkler campaign launched in 2013 and featured the vintage sprinkler dance from the 1970 s as the celebration residents would do after saving water outdoors. This campaign focused on finding and fixing problems with your sprinkler system to make sure it was running efficiently. The WEP created a public service announcement, mash-up videos and a series of how to videos to show residents how to fix their sprinkler systems. The How Low Can You Go campaign launched in 2014 and asked residents how low they could get their water use down. The campaign focused on providing three water savings tips, each with increasing water savings and then one tip that went too far such as having Rover the dog do the dishes. Campaign posters were mounted in all the bathroom stalls at Raley Field. The Water Myths Busted! campaign was launched in 2015 to challenge residents to decide what water conservation tips were fact or myth. The main message behind this campaign was to communicate that most of a household s water use is used outdoors. Also in 2015, the WEP partnered with Save Our Water to collaborate on campaign messages and advertising buys. These campaigns are implemented through both paid advertising buys and earned media from public service announcements. Every year the campaigns can be heard on local radio stations such as Capital Public Radio and online (since 2013) through google, Facebook and YouTube advertisements. Television advertising was also used when funding was available. For example, in 2015, the WEP partnered with News10 to deliver water conservation messages during the weather forecast. From , the WEP public outreach campaigns generated more than 134 million impressions through advertising and public service announcement activities, 617,000 impressions through video views and 82,000 impressions through online clicks. Impressions represent the number of times an advertisement is served, seen or heard. The WEP also continues messaging through its own Facebook page. From , the WEP has made 350 Facebook posts about water saving tips and other relevant information. In 2014 and 2015, the WEP hosted several sweepstakes contests including Drought Face, where participates had to proudly submit pictures of their fully bearded face in an effort to save water. The winners of the Drought Face sweepstakes had their photo displayed on a prominent billboard near downtown Sacramento that created 773,000 impressions. The other contest was called Naughty or Nice?, where participates took a holiday theme water conservation quiz to determine if they were naughty or nice in terms of saving water. In 2014, the WEP s website bewatersmart.info was redesigned to simplify use for visitors. The website contains regional and local water provider information on rebates and services, top ways to save, drought information including an interactive drought map, watering day times and restrictions, a water-wise gardening database, recent press releases, the Sacramento Smart Irrigation Scheduler tool, information about RWA s Carwash Program and more. In 2015, the website received 80,000 unique visitors. Twice a year the WEP distributes an e-newsletter to residents. The e-newsletters are filled with water savings tips, upcoming events and other interesting articles. They are usually timed around changes in the weather 9-2
71 2015 Urban Water Management Plan Section 9 to help signal the need for residents to adjust their irrigation systems, such as day light savings coupled with a message to dial back sprinkler systems. Every year the WEP selects three to five public events to attend and to have a booth for the public to interact with local water conservation staff. This provides an opportunity for the region to communicate its messages. Events have included the Sacramento Home & Garden Show, Creek Week, Harvest Day, Farm-to-Fork Festival and several Earth Day events. From , all the public events that WEP participated in had an estimated attendance of 362,383 people, which represents about 20 percent of the region s total population. The WEP is also very active in communicating to local media outlets such as the Sacramento Bee. RWA regularly issues press releases on WEP activities and regionally significant news. From , the RWA and the WEP were mentioned in 569 news articles published by local and regional media outlets both within and outside of the Sacramento region. From , the WEP averaged about 38 media stories per year. However, media coverage dramatically increased in response to the drought in 2014 and 2015 generating about 200 media stories in the last two years. In addition to public outreach, the WEP also coordinates public education activities in partnership with the Sacramento Bee s Media in Education (MIE) program. Since 2012, the WEP has hosted the Water Spots contest. The contest is for high school and middle school students. The WEP provides a new theme each year and provides the region s teacher and students with relevant facts and images to help with the development of 30 second PSAs. Students submit their videos to a judging panel of local celebrities who decide on a first, second and third place winner. The top 10 videos are posted online for voting through the MIE program to select a people s choice winner as well. Both teachers and student receive cash prizes. The winning PSAs are incorporated into the WEP s media activities as well. Past themes include BET THE LEAK: Find and Fix Leaks Fast! and BE A DROUGHT CHAMP: Conserve Water! Between 2012 and 2015, 352 videos were submitted. Also in partnership with MIE, the WEP started a new effort in 2015, the Be Water Smart Poster Contest. A theme was chosen focusing on Fix a Leak Week in March and a poster featuring the region s mascot, Les Leaky, fixing leaks on one side and a water conservation infographic on the other side. This double sided poster was included in the Sacramento Bee s paper on March 15, 2015 and distributed to all zip codes within RWA s members service areas. The contest received 450 entries and the top five winners posters were posted online and received gift cards Programs to Assess and Manage Distribution System Real Loss SCWA s water loss control program consists of annual water audits and an ongoing leak detection and repair within the system focused on the high probability leak areas. This includes an ongoing meter calibration and replacement program for all production and distribution meters. SCWA's activities include: Standard water audit and water balance annually. Validation: Staff has collected data on well production meters (90 percent complete) and test for accuracy. SCWA is making the necessary improvements to increase data accuracy in a phased approach based on feasibility, cost, reduction in overall error and other relevant factors. Interventions: Operations locates and repairs leaks when they are discovered and proactively looks for leaks when time allows and in the vicinity of daily work. Customer leaks: A consulting water auditor assists customers in locating leaks both inside and outside the home or business. 9-3
72 2015 Urban Water Management Plan Section Water Conservation Program Coordination and Staffing Support A conservation coordinator is a key component for implementing SCWA s water conservation program. The conservation coordinator is responsible for implementing and monitoring the SCWA s water conservation activities. This is a full time position. Additional staff members that contribute to the conservation program are Engineering Technicians Other Demand Management Measures SCWA implements other DMMs that are documented in the CUWCC reports in Appendix F. 9.2 Additional Demand Management Measures Specific for Wholesale Water Agencies This section describes additional DMMs that are implemented by SCWA for its wholesale customers Asset Management Wholesale water agencies are required to describe their distribution system asset management program in the Plan. Asset management is typically considered to include asset information, level of service and performance measures, risk management, condition assessment, maintenance management, and asset needs. SCWA s water system assets consist of pipelines, groundwater wells, pump stations, storage facilities, the surface water treatment plant, and groundwater treatment plants. SCWA places a high priority on properly maintaining the water system asset to keep it as reliable as possible. SCWA has a comprehensive inventory of all of its infrastructure assets that is maintained on a database that can be accessed using GIS mapping tools. SCWA actively assesses the condition of the water system. SCWA uses a computerized maintenance management system to help manage the ongoing maintenance of the water system. Asset needs are identified and included in the capital improvement plan that is updated annually Wholesaler Supplier Assistance Program SCWA and its retail agencies are members of the RWA and SGA. The membership organization partners on mutually beneficial programs. SCWA s participation and financial contributions to these programs benefit the agencies to which the SCWA provides wholesale water. 9.3 Planned Implementation to Achieve Water Use Targets SCWA will have to meet its 2020 per capita demand target. As described in Section 5, SCWA has met its 2015 interim target and is on track to meet the 2020 target. A combination of the installation of low flow plumbing devices, replacement of older plumbing fixtures, reduction of distribution system and customer leaks, conversion to metered rates, implementation of outdoor landscaping measures, and price elasticity impacts will maintain or reduce per capita demands. The priority will be focused on measures that reduce long term maximum day and peak hour demands that would benefit cost-effective infrastructure planning efforts. Focusing SCWA s water conservation program on reducing peak demands would provide the best benefits by reducing summer water supply capacity needs and the use of higher cost peak period energy. A continuation of SCWA s present conservation measures, programs, and policies will help SCWA to reduce current per capita water use. 9-4
73 Section 10 Plan Adoption, Submittal, and Implementation SCWA notified cities and counties within the service area more than 60 days before the public hearing was held as presented in Tables 10-1 and A Notice of Public Hearing was published twice in the Sacramento Bee more than 14 days prior to the hearing to notify all customers and local governments of the public hearing, and copies of the draft Plan were made available for public inspection at SCWA s administration building and on-line. Appendix A provides documentation of the 60 days notification to cities and counties. Appendix B documents the notice of public hearing. The public hearing on May 24, 2016 provided an opportunity for SCWA s customers to learn and ask questions about their water supply and SCWA s plans for providing a reliable water supply. This Plan was adopted by SCWA s elected body on May 24, A copy of the adoption resolution is provided in Appendix C. The adopted Plan was provided to DWR, the State library, and the appropriate cities and counties within 30 days of adoption. The Plan was also submitted electronically to DWR. The adopted Plan is available for public review during normal business hours at the SCWA administration building and on-line at Supporting documentation is presented in Appendix C. Table (DWR Table 10-1 R) Retail: Notification to Cities and Counties City name 60 day notice Notice of public hearing City of Elk Grove City of Rancho Cordova City of Sacramento County name 60 day notice Notice of public hearing Sacramento 10-1
74 2015 Urban Water Management Plan Section 9 Table (DWR Table 10-2 W) Wholesale: Notification to Cities and Counties Supplier has notified more than 10 cities or counties in accordance with CWC (b) and Include a separate list of the cities and counties that were notified. Location of this list in the UWMP Supplier has notified 10 or fewer cities or counties. Complete the table below. City name 60 day notice Notice of public hearing City of Elk Grove City of Rancho Cordova City of Sacramento County name 60 day notice Notice of public hearing Sacramento 10-2
75 Section 11 References City of Elk Grove Housing Element. March Department of Water Resources. Bulletin Evaluation of Ground Water Resources: Sacramento County Department of Water Resources. California s Groundwater Bulletin 118, Sacramento Valley Groundwater Basin, North American Subbasin. January 20, Department of Water Resources. California s Groundwater Bulletin 118, Sacramento Valley Groundwater Basin, South American Subbasin. February 27, Department of Water Resources. Methodology for Calculating Baseline and Compliance Urban Per Capita Water Use. October 1, Department of Water Resources. Final Guidebook to Assist Urban Water Suppliers to Prepare a 2015 Urban Water Management Plan. March Regional Water Authority. American River Basin Integrated Regional Water Management Plan. July Sacramento Area Council of Government. Housing Element Data Profiles. December Sacramento County. Housing Element of the Sacramento County General Plan. October Sacramento County. Sacramento County Multi-Jurisdictional Local Hazard Mitigation Plan. Sacramento County. Sacramento County Multi-Hazard Disaster Plan. Dec Sacramento County Water Agency. Water Shortage Contingency Plan. Revised January Sacramento County Water Agency. Water Code. Title 3 Wholesale and Retail Water Services. Updated July Sacramento County Water Agency. Zone 40 Water System Infrastructure Plan Update. March Sacramento Groundwater Authority. Water Accounting Framework Phase III. June 10, Sacramento Regional County Sanitation District. Water Recycling Opportunities Study. February US Department of the Interior, Bureau of Reclamation. Central Valley Project Municipal and Industrial Water Shortage Policy Scoping Report. July US Department of the Interior, Bureau of Reclamation. Sacramento and San Joaquin Rivers Basin Study Basin Study Report and Executive Summary, March
76
77 2015 Urban Water Management Plan Appendix A: Documentation of City/County Notification and Water Supplier Coordination A
78
79 Dawn Schock From: Sent: To: Cc: Subject: Paul Selsky Friday, March 25, :11 PM Notification of Urban Water Management Plan Update To: Mr. Cyrus Abhar City Manager City of Rancho Cordova Dear Mr. Abhar: This is being sent on behalf of Sacramento County Water Agency (Water Agency) to notify you that the Water Agency is updating its Urban Water Management Plan (Plan) and will hold a public hearing to discuss these efforts. The California Water Code (CWC) (b) requires that agencies notify cities and counties to which they serve water that the Plan is being updated and reviewed. The CWC specifies that this must be done at least 60 days prior to the public hearing. The public hearing will take place at the Sacramento County Board of Supervisors Chambers, located at 700 H Street, Suite 1450, Sacramento, CA The exact date and time of the public hearing will be announced online at The Water Agency s Urban Water Management Plan will discuss and describe the following: Existing water supplies; Projected water demands in the Water Agency s service area over the next 25 years; Projected water supplies available to the Water Agency over the next 25 years, the reliability of that supply, and general schedules for water supply projects; Water Agency water conservation activities; And a comparison of water supply and water demand over the next 25 years under different hydrological assumptions (normal year, single dry year, multiple dry years). Please share this notification with anyone in your organization that might be interested. If you have any questions or comments regarding the Urban Water Management, please contact Mr. Dave Zuccaro at or at ZuccaroD@SacCounty.NET. Sincerely, Paul Selsky, P.E.* Brown and Caldwell Rancho Cordova, CA PSelsky@brwncald.com T C *Licensed in California Get water industry news delivered to your desktop, free, from BCWaterNews.com Sign up now! 1
80 Dawn Schock From: Sent: To: Cc: Subject: Paul Selsky Friday, March 25, :11 PM Notification of Urban Water Management Plan Update To: Mr. David Underwood County of Sacramento Dear Mr. Underwood, This is being sent on behalf of Sacramento County Water Agency (Water Agency) to notify you that the Water Agency is updating its Urban Water Management Plan (Plan) and will hold a public hearing to discuss these efforts. The California Water Code (CWC) (b) requires that agencies notify cities and counties to which they serve water that the Plan is being updated and reviewed. The CWC specifies that this must be done at least 60 days prior to the public hearing. The public hearing will take place at the Sacramento County Board of Supervisors Chambers, located at 700 H Street, Suite 1450, Sacramento, CA The exact date and time of the public hearing will be announced online at The Water Agency s Urban Water Management Plan will discuss and describe the following: Existing water supplies; Projected water demands in the Water Agency s service area over the next 25 years; Projected water supplies available to the Water Agency over the next 25 years, the reliability of that supply, and general schedules for water supply projects; Water Agency water conservation activities; And a comparison of water supply and water demand over the next 25 years under different hydrological assumptions (normal year, single dry year, multiple dry years). Please share this notification with anyone in your organization that might be interested. If you have any questions or comments regarding the Urban Water Management, please contact Mr. Dave Zuccaro at or at ZuccaroD@SacCounty.NET. Sincerely, Paul Selsky, P.E.* Brown and Caldwell Rancho Cordova, CA PSelsky@brwncald.com T C *Licensed in California Get water industry news delivered to your desktop, free, from BCWaterNews.com Sign up now! 1
81 Dawn Schock From: Sent: To: Cc: Subject: Paul Selsky Friday, March 25, :11 PM Notification of Urban Water Management Plan Update To: Ms. Laura Gill City Manager City of Elk Grove Dear Ms. Gill: This is being sent on behalf of Sacramento County Water Agency (Water Agency) to notify you that the Water Agency is updating its Urban Water Management Plan (Plan) and will hold a public hearing to discuss these efforts. The California Water Code (CWC) (b) requires that agencies notify cities and counties to which they serve water that the Plan is being updated and reviewed. The CWC specifies that this must be done at least 60 days prior to the public hearing. The public hearing will take place at the Sacramento County Board of Supervisors Chambers, located at 700 H Street, Suite 1450, Sacramento, CA The exact date and time of the public hearing will be announced online at The Water Agency s Urban Water Management Plan will discuss and describe the following: Existing water supplies; Projected water demands in the Water Agency s service area over the next 25 years; Projected water supplies available to the Water Agency over the next 25 years, the reliability of that supply, and general schedules for water supply projects; Water Agency water conservation activities; And a comparison of water supply and water demand over the next 25 years under different hydrological assumptions (normal year, single dry year, multiple dry years). Please share this notification with anyone in your organization that might be interested. If you have any questions or comments regarding the Urban Water Management, please contact Mr. Dave Zuccaro at or at ZuccaroD@SacCounty.NET. Sincerely, Paul Selsky, P.E.* Brown and Caldwell Rancho Cordova, CA PSelsky@brwncald.com T C *Licensed in California Get water industry news delivered to your desktop, free, from BCWaterNews.com Sign up now! 1
82 Dawn Schock From: Sent: To: Cc: Subject: Paul Selsky Friday, March 25, :11 PM Jim Peifer Notification of Urban Water Management Plan Update To: Mr. Jim Peifer City of Sacramento Dear Mr. Peifer: This is being sent on behalf of Sacramento County Water Agency (Water Agency) to notify you that the Water Agency is updating its Urban Water Management Plan (Plan) and will hold a public hearing to discuss these efforts. The California Water Code (CWC) (b) requires that agencies notify cities and counties to which they serve water that the Plan is being updated and reviewed. The CWC specifies that this must be done at least 60 days prior to the public hearing. The public hearing will take place at the Sacramento County Board of Supervisors Chambers, located at 700 H Street, Suite 1450, Sacramento, CA The exact date and time of the public hearing will be announced online at The Water Agency s Urban Water Management Plan will discuss and describe the following: Existing water supplies; Projected water demands in the Water Agency s service area over the next 25 years; Projected water supplies available to the Water Agency over the next 25 years, the reliability of that supply, and general schedules for water supply projects; Water Agency water conservation activities; And a comparison of water supply and water demand over the next 25 years under different hydrological assumptions (normal year, single dry year, multiple dry years). Please share this notification with anyone in your organization that might be interested. If you have any questions or comments regarding the Urban Water Management, please contact Mr. Dave Zuccaro at or at ZuccaroD@SacCounty.NET. Sincerely, Paul Selsky, P.E.* Brown and Caldwell Rancho Cordova, CA PSelsky@brwncald.com T C *Licensed in California Get water industry news delivered to your desktop, free, from BCWaterNews.com Sign up now! 1
83 2015 Urban Water Management Plan Appendix B: Notice of Public Hearing B
84
85 2015 Urban Water Management Plan Appendix C: Adoption Resolution and Supporting Documentation C
86
87 2015 Urban Water Management Plan Appendix D: DWR Urban Water Management Plan Checklist D
88
89 Appendix D Checklist Final Checklist Arranged by Subject CWC Section 10620(b) UWMP Requirement Subject Guidebook Location Every person that becomes an urban water supplier shall adopt an urban water management plan within one year after it has become an urban water supplier (d)(2) Coordinate the preparation of its plan with other appropriate agencies in the area, including other water suppliers that share a common source, water management agencies, and relevant public agencies, to the extent practicable Provide supporting documentation that the water supplier has encouraged active involvement of diverse social, cultural, and economic elements of the population within the service area prior to and during the preparation of the plan (a) Describe the water supplier service area. System Description 10631(a) Describe the climate of the service area of the supplier (a) Provide population projections for 2020, 2025, 2030, and (a) 10631(a) 10631(e)(1) 10631(e)(3)(A) (a) (b) Describe other demographic factors affecting the supplier s water management planning. Indicate the current population of the service area. Quantify past, current, and projected water use, identifying the uses among water use sectors. Report the distribution system water loss for the most recent 12-month period available. Include projected water use needed for lower income housing projected in the service area of the supplier. Retail suppliers shall adopt a 2020 water use target using one of four methods. UWMP Location (Optional Column for Agency Use) Plan Preparation Section 2.1 Appendix C Plan Preparation Section Pages 2-2 to 2-4 Plan Preparation Section Pages 2-2 to 2-4 and Appendices A and B System Description System Description System Description System Description and Baselines and Targets System Water Use System Water Use System Water Use Baselines and Targets Section 3.1 Pages 3-1 to 3-3 Section 3.3 Page 3-4 Section 3.4 Page 3-5 Section 3.4 Page 3-5 Sections 3.4 and 5.4 Section 4.2 Page 3-5 and Appendix E Pages 4-1 to 4-4 Section 4.3 Page 4-4 and Appendix G Section 4.5 Page 4-5 Section 5.7 and App E Page 5-2 and Appendix E D - 1
90 Appendix D Checklist Final (e) Retail suppliers shall provide baseline daily per capita water use, urban water use target, interim urban water use target, and compliance daily per capita water use, along with the bases for determining those estimates, including references to supporting data Retail suppliers per capita daily water use reduction shall be no less than 5 percent of base daily per capita water use of the 5 year baseline. This does not apply if the suppliers base GPCD is at or below (a) Retail suppliers shall meet their interim target by December 31, (d)(2) If the retail supplier adjusts its compliance GPCD using weather normalization, economic adjustment, or extraordinary events, it shall provide the basis for, and data supporting the adjustment Wholesale suppliers shall include an assessment of present and proposed future measures, programs, and policies to help their retail water suppliers achieve targeted water use reductions. Baselines and Targets Baselines and Targets Baselines and Targets Baselines and Targets Baselines and Targets Chapter 5 and App E Page 5-2 and Appendix E Section Page 5-2 and Appendix E Section 5.8 and App E Section Page 5-2 and Appendix E N/A Section 5.1 Page Retail suppliers shall report on their progress in meeting their water use targets. The data shall be reported using a standardized form. Baselines and Targets Section 5.8 and App E Page (b) 10631(b) 10631(b)(1) Identify and quantify the existing and planned sources of water available for 2015, 2020, 2025, 2030, and Indicate whether groundwater is an existing or planned source of water available to the supplier. Indicate whether a groundwater management plan has been adopted by the water supplier or if there is any other specific authorization for groundwater management. Include a copy of the plan or authorization. System Supplies Chapter 6 Pages 6-16 to 6-19 System Supplies Section 6.2 Page 6-2 System Supplies Section Page (b)(2) Describe the groundwater basin. System Supplies Section Pages 6-2 to (b)(2) Indicate if the basin has been adjudicated and include a copy of the court order or decree and a description of the amount of water the supplier has the legal right to pump. System Supplies Section Page 6-6 D - 2
91 Appendix D Checklist Final 10631(b)(2) 10631(b)(3) 10631(b)(4) 10631(d) 10631(g) 10631(h) 10631(j) For unadjudicated basins, indicate whether or not the department has identified the basin as overdrafted, or projected to become overdrafted. Describe efforts by the supplier to eliminate the long-term overdraft condition. Provide a detailed description and analysis of the location, amount, and sufficiency of groundwater pumped by the urban water supplier for the past five years Provide a detailed description and analysis of the amount and location of groundwater that is projected to be pumped. Describe the opportunities for exchanges or transfers of water on a short-term or longterm basis. Describe the expected future water supply projects and programs that may be undertaken by the water supplier to address water supply reliability in average, single-dry, and multiple-dry years. Describe desalinated water project opportunities for long-term supply. Retail suppliers will include documentation that they have provided their wholesale supplier(s) if any - with water use projections from that source (j) Wholesale suppliers will include documentation that they have provided their urban water suppliers with identification and quantification of the existing and planned sources of water available from the wholesale to the urban supplier during various water year types For wastewater and recycled water, coordinate with local water, wastewater, groundwater, and planning agencies that operate within the supplier's service area (a) 10633(b) 10633(c) Describe the wastewater collection and treatment systems in the supplier's service area. Include quantification of the amount of wastewater collected and treated and the methods of wastewater disposal. Describe the quantity of treated wastewater that meets recycled water standards, is being discharged, and is otherwise available for use in a recycled water project. Describe the recycled water currently being used in the supplier's service area. System Supplies Section Page 6-7 System Supplies Section Page 6-8 System Supplies Sections 6.2 and 6.9 Pages 6-18 to 6-19 System Supplies Section 6.7 Page 6-14 System Supplies Section 6.8 Page 6-15 System Supplies Section 6.6 Page 6-14 System Supplies Section Page 2-2 to 2-3 and Appendix A System Supplies Section Page 2-2 and Appendix A System Supplies (Recycled Water) System Supplies (Recycled Water) System Supplies (Recycled Water) System Supplies (Recycled Water) Section Section Section Section and Page 6-8 to 6-9 Pages 6-9 to 6-11 Page 6-11 to 6-12 Page 6-12 to 6-13 D - 3
92 Appendix D Checklist Final 10633(d) 10633(e) 10633(f) 10633(g) 10620(f) 10631(c)(1) 10631(c)(1) 10631(c)(2) Describe and quantify the potential uses of recycled water and provide a determination of the technical and economic feasibility of those uses. Describe the projected use of recycled water within the supplier's service area at the end of 5, 10, 15, and 20 years, and a description of the actual use of recycled water in comparison to uses previously projected. Describe the actions which may be taken to encourage the use of recycled water and the projected results of these actions in terms of acre-feet of recycled water used per year. Provide a plan for optimizing the use of recycled water in the supplier's service area. Describe water management tools and options to maximize resources and minimize the need to import water from other regions. Describe the reliability of the water supply and vulnerability to seasonal or climatic shortage. Provide data for an average water year, a single dry water year, and multiple dry water years For any water source that may not be available at a consistent level of use, describe plans to supplement or replace that source Provide information on the quality of existing sources of water available to the supplier and the manner in which water quality affects water management strategies and supply reliability 10635(a) 10632(a) and 10632(a)(1) 10632(a)(2) 10632(a)(3) Assess the water supply reliability during normal, dry, and multiple dry water years by comparing the total water supply sources available to the water supplier with the total projected water use over the next 20 years. Provide an urban water shortage contingency analysis that specifies stages of action and an outline of specific water supply conditions at each stage. Provide an estimate of the minimum water supply available during each of the next three water years based on the driest threeyear historic sequence for the agency. Identify actions to be undertaken by the urban water supplier in case of a catastrophic interruption of water supplies. System Supplies (Recycled Water) System Supplies (Recycled Water) System Supplies (Recycled Water) System Supplies (Recycled Water) Water Supply Reliability Assessment Water Supply Reliability Assessment Water Supply Reliability Assessment Water Supply Reliability Assessment Water Supply Reliability Assessment Water Supply Reliability Assessment Water Shortage Contingency Planning Water Shortage Contingency Planning Water Shortage Contingency Planning Section Pages 6-11 to 6-12 Section Pages 6-12 to 6-13 Section Pages 6-13 to 6-14 Section Page 6-13 to 6-14 Section 7.4 Pages 7-6 Section 7.1 Page 6-21, 7-1 and 7-6 Section 7.2 Page 7-2 Section 7.1 Page 7-1 Section 7.1 Page 7-1 Section 7.3 Pages 7-2 to 7-11 Section 8.1 Page 8-1 Section 8.9 Page 8-6 Section 8.8 Page 8-5 D - 4
93 Appendix D Checklist Final 10632(a)(4) 10632(a)(5) 10632(a)(6) 10632(a)(7) 10632(a)(8) 10632(a)(9) 10631(f)(1) Identify mandatory prohibitions against specific water use practices during water shortages. Specify consumption reduction methods in the most restrictive stages. Indicated penalties or charges for excessive use, where applicable. Provide an analysis of the impacts of each of the actions and conditions in the water shortage contingency analysis on the revenues and expenditures of the urban water supplier, and proposed measures to overcome those impacts. Provide a draft water shortage contingency resolution or ordinance. Indicate a mechanism for determining actual reductions in water use pursuant to the water shortage contingency analysis. Retail suppliers shall provide a description of the nature and extent of each demand management measure implemented over the past five years. The description will address specific measures listed in code (f)(2) Wholesale suppliers shall describe specific demand management measures listed in code, their distribution system asset management program, and supplier assistance program (i) CUWCC members may submit their CUWCC BMP annual reports in lieu of, or in addition to, describing the DMM implementation in their UWMPs. This option is only allowable if the supplier has been found to be in full compliance with the CUWCC MOU (a) 10621(b) 10621(d) Retail suppliers shall conduct a public hearing to discuss adoption, implementation, and economic impact of water use targets. Notify, at least 60 days prior to the public hearing, any city or county within which the supplier provides water that the urban water supplier will be reviewing the plan and considering amendments or changes to the plan. Each urban water supplier shall update and submit its 2015 plan to the department by July 1, Water Shortage Contingency Planning Water Shortage Contingency Planning Water Shortage Contingency Planning Water Shortage Contingency Planning Water Shortage Contingency Planning Water Shortage Contingency Planning Demand Management Measures Demand Management Measures Demand Management Measures Plan Adoption, Submittal, and Implementation Plan Adoption, Submittal, and Implementation Plan Adoption, Submittal, and Implementation Section 8.2 Page 8-2 Section 8.4 Page 8-3 Section 8.3 Page 8-3 Section 8.6 Page 8-5 Section 8.7 Appendix I Section 8.5 Page 8-4 Sections 9.2 and 9.3 Sections 9.1 and 9.3 Section 9.5 Page 9-1 to 9-4 and Appendix F Pages 9-1 to 9-4 Appendix F Section 10.3 Page 10-1 and Appendix B Section Pages 10-1, 10-2, and Appendix A Sections and 10.4 Page 10-1 D - 5
94 Appendix D Checklist Final 10635(b) Provide supporting documentation that Water Shortage Contingency Plan has been, or will be, provided to any city or county within which it provides water, no later than 60 days after the submission of the plan to DWR Provide supporting documentation that the urban water supplier made the plan available for public inspection, published notice of the public hearing, and held a public hearing about the plan The water supplier is to provide the time and place of the hearing to any city or county within which the supplier provides water Provide supporting documentation that the plan has been adopted as prepared or modified (a) 10644(a)(1) Provide supporting documentation that the urban water supplier has submitted this UWMP to the California State Library. Provide supporting documentation that the urban water supplier has submitted this UWMP to any city or county within which the supplier provides water no later than 30 days after adoption (a)(2) The plan, or amendments to the plan, submitted to the department shall be submitted electronically Provide supporting documentation that, not later than 30 days after filing a copy of its plan with the department, the supplier has or will make the plan available for public review during normal business hours. Plan Adoption, Submittal, and Implementation Plan Adoption, Submittal, and Implementation Plan Adoption, Submittal, and Implementation Plan Adoption, Submittal, and Implementation Plan Adoption, Submittal, and Implementation Plan Adoption, Submittal, and Implementation Plan Adoption, Submittal, and Implementation Plan Adoption, Submittal, and Implementation Section Page 10-1 and Appendix C Sections , 10.3, and 10.5 Sections Section Section Section Sections and Appendices A and B Page 10-1 and Appendix B Appendix C Appendix C Appendix C Page 10-1 Section 10.5 Page 10-1 D - 6
95 2015 Urban Water Management Plan Appendix E: SB X7-7 Verification Forms E
96
97 WUEdata Main Menu Page 1 of 2 WUEdata - Sacramento County Water Agency Please print this page to a PDF and include as part of your UWMP submittal. Confirmation Information Generated By Water Supplier Name Confirmation # Generated On May Huang Sacramento County Water Agency /25/2016 8:58:41 AM Sign Out Boundary Information Census Year Boundary Filename Internal Boundary ID _SCWA_incl_H_NG_SWT.kml _SCWA_incl_APV_H_NG_SWT.kml _SCWA_All.kml 1025 Baseline Period Ranges 10 to 15-year baseline period Number of years in baseline period: 10 Year beginning baseline period range: 1995 Year ending baseline period range 1 : year baseline period Year beginning baseline period range: 2003 Year ending baseline period range 2 : The ending year must be between December 31, 2004 and December 31, The ending year must be between December 31, 2007 and December 31, Persons-Per-SF Connection and Persons-Per-MF/GQ Connection Census Block Group Level % Population in SF Housing Service Area Population Census Block Level Population in SF Housing Population in MF/GQ Housing Persons per SF Connection Persons per MF/GQ Connection # SF # MF/GQ Year (calculated) (calculated) Connections Connections % 22,223 19,725 2, % 73,421 67,838 5, % 151, ,802 16, * * 4/25/2016
98 WUEdata Main Menu Page 2 of 2 Year # SF Connections Population Using Persons-Per-SF Connection and Persons-Per-MF/GQ Connection # MF/GQ Connections Persons per SF Connection Persons per MF/GQ Connection SF Population MF/GQ Population Total Population 10 to 15 Year Baseline Population Calculations Year ,722 1,123 46,845 Year ,217 1,126 50,343 Year , ,710 Year ,892 2,022 56,913 Year ,809 5,444 70,252 Year ,838 5,583 73,421 Year ,413 6,813 80,227 Year ,089 7,649 89,738 Year ,590 7, ,372 Year ,766 8, ,711 5 Year Baseline Population Calculations Year ,590 7, ,372 Year ,766 8, ,711 Year ,964 12, ,204 Year ,813 13, ,383 Year ,866 14, , Compliance Year Population Calculations * * 146,335 19, ,895 Hide Print Confirmation QUESTIONS / ISSUES? CONTACT THE WUEDATA HELP DESK 4/25/2016
99 SB X7 7 Table 0: Units of Measure Used in UWMP* (select one from the drop down list) Acre Feet *The unit of measure must be consistent with Table 2 3 NOTES:
100 SB X7 7 Table 1: Baseline Period Ranges Baseline 10 to 15 year baseline period 5 year baseline period Parameter Value Units 2008 total water deliveries 42,823 Acre Feet 2008 total volume of delivered recycled water 903 Acre Feet 2008 recycled water as a percent of total deliveries 2.11% Percent Number of years in baseline period 1, 2 10 Years Year beginning baseline period range 1995 Year ending baseline period range Number of years in baseline period 5 Years Year beginning baseline period range 2003 Year ending baseline period range If the 2008 recycled water percent is less than 10 percent, then the first baseline period is a continuous 10 year period. If the amount of recycled water 2 delivered in 2008 is 10 percent or greater, the first baseline period is a continuous 10 to 15 year period. The Water Code requires that the baseline period is between 10 and 15 years. However, DWR recognizes that some water suppliers may not have the minimum 10 years of baseline data. 3 The ending year must be between December 31, 2004 and December 31, The ending year must be between December 31, 2007 and December 31, NOTES:
101 SB X7 7 Table 3: Service Area Population Year Population 10 to 15 Year Baseline Population Year ,845 Year ,343 Year ,710 Year ,913 Year ,252 Year ,421 Year ,227 Year ,738 Year ,372 Year ,711 Year 11 Year 12 Year 13 Year 14 Year 15 5 Year Baseline Population Year ,372 Year ,711 Year ,204 Year ,383 Year , Compliance Year Population ,895 NOTES:
102 SB X7 7 Table 4: Annual Gross Water Use * Baseline Year Fm SB X7 7 Table 3 Volume Into Distribution System This column will remain blank until SB X7 7 Table 4 A is completed. Exported Water Change in Dist. System Storage (+/ ) Deductions Indirect Recycled Water This column will remain blank until SB X7 7 Table 4 B is completed. Water Delivered for Agricultural Use Process Water This column will remain blank until SB X7 7 Table 4 D is completed. 10 to 15 Year Baseline Gross Water Use Year ,220 15,220 Year ,322 19,322 Year ,725 19,725 Year , ,992 Year , ,965 Year , ,591 Year , ,969 Year ,937 1,724 28,213 Year ,559 1,977 28,582 Year ,888 2,648 33,240 Year 11 0 Year 12 0 Year 13 0 Year 14 0 Year year baseline average gross water use 23,782 5 Year Baseline Gross Water Use Year ,559 1,977 28,582 Year ,888 2,648 33,240 Year ,800 3,027 35,773 Year ,651 3,306 35,345 Year ,625 3,403 38,222 5 year baseline average gross water use 34, Compliance Year Gross Water Use ,093 2,689 28,404 * NOTE that the units of measure must remain consistent throughout the UWMP, as reported in Table 2 3 NOTES: Annual Gross Water Use
103 SB X7 7 Table 4 A: Volume Entering the Distribution System(s) Complete one table for each source. Name of Source Groundwater This water source is: The supplier's own water source A purchased or imported source Baseline Year Fm SB X7 7 Table 3 Volume Entering Distribution System Meter Error Adjustment* Optional (+/ ) Corrected Volume Entering Distribution System 10 to 15 Year Baseline Water into Distribution System Year ,706 13,706 Year ,924 16,924 Year ,175 18,175 Year ,309 16,309 Year ,375 21,375 Year ,940 23,940 Year ,612 23,612 Year ,789 24,789 Year ,657 25,657 Year ,103 31,103 Year 11 0 Year 12 0 Year 13 0 Year 14 0 Year Year Baseline Water into Distribution System Year ,657 25,657 Year ,103 31,103 Year ,048 33,048 Year ,321 34,321 Year ,222 36, Compliance Year Water into Distribution System ,652 24,652 NOTES: * Meter Error Adjustment See guidance in Methodology 1, Step 3 of Methodologies Document
104 SB X7 7 Table 4 A: Volume Entering the Distribution Name of Source Surface Water This water source is: The supplier's own water source A purchased or imported source Baseline Year Fm SB X7 7 Table 3 Volume Entering Distribution System Meter Error Adjustment* Optional (+/ ) Corrected Volume Entering Distribution System 10 to 15 Year Baseline Water into Distribution System Year 1 1, ,514 Year 2 1, ,398 Year 3 1, Year 4 1, ,712 Year 5 1, ,788 Year 6 2, ,595 Year 7 2, ,044 Year 8 2, ,355 Year 9 2, ,040 Year 10 2, ,202 Year 11 0 Year 12 0 Year 13 0 Year 14 0 Year Year Baseline Water into Distribution System Year 1 2, ,040 Year 2 2, ,202 Year 3 2, ,040 Year 4 2, ,253 Year 5 2, , Compliance Year Water into Distribution System ,416 6,416 NOTES: * Meter Error Adjustment See guidance in Methodology 1, Step 3 of Methodologies Document
105 SB X7 7 Table 4 A: Volume Entering the Distribution Name of Source Purchased from Golden State and SSWD This water source is: The supplier's own water source A purchased or imported source Baseline Year Fm SB X7 7 Table 3 Volume Entering Distribution System Meter Error Adjustment* Optional (+/ ) Corrected Volume Entering Distribution System 10 to 15 Year Baseline Water into Distribution System Year 1 1, Year 2 1, Year 3 1, Year 4 1, Year 5 1, Year 6 2, Year 7 2, ,230 Year 8 2, Year 9 2, Year 10 2, Year 11 0 Year 12 0 Year 13 0 Year 14 0 Year Year Baseline Water into Distribution System Year 1 2, Year 2 2, Year 3 2, Year 4 2, Year 5 2, Compliance Year Water into Distribution System NOTES: * Meter Error Adjustment See guidance in Methodology 1, Step 3 of Methodologies Document
106 SB X7 7 Table 5: Gallons Per Capita Per Day (GPCD) Baseline Year Fm SB X7 7 Table 3 10 to 15 Year Baseline GPCD Service Area Population Fm SB X7 7 Table 3 Annual Gross Water Use Fm SB X7 7 Table 4 Daily Per Capita Water Use (GPCD) Year ,845 15, Year ,343 19, Year ,710 19, Year ,913 17, Year ,252 22, Year ,421 25, Year ,227 26, Year ,738 28, Year ,372 28, Year ,711 33, Year 11 0 Year 12 0 Year 13 0 Year 14 0 Year Year Average Baseline GPCD Year Baseline GPCD Baseline Year Fm SB X7 7 Table 3 Service Area Population Fm SB X7 7 Table 3 Gross Water Use Fm SB X7 7 Table 4 Daily Per Capita Water Use Year ,372 28, Year ,711 33, Year ,204 35, Year ,383 35, Year ,991 38, Year Average Baseline GPCD Compliance Year GPCD 2015 NOTES: 165,895 28,
107 SB X7 7 Table 6: Gallons per Capita per Day Summary From Table SB X7 7 Table Year Baseline GPCD Year Baseline GPCD Compliance Year GPCD 153 NOTES:
108 SB X7 7 Table 7: 2020 Target Method Select Only One Target Method NOTES: Method 1 Method 2 Supporting Documentation SB X7 7 Table 7A SB X7 7 Tables 7B, 7C, and 7D Contact DWR for these tables Method 3 SB X7 7 Table 7 E Method 4 Method 4 Calculator
109 SB X7 7 Table 7 A: Target Method 1 20% Reduction Year Baseline GPCD 2020 Target GPCD NOTES:
110 SB X7 7 Table 7 F: Confirm Minimum Reduction for 2020 Target 5 Year Baseline GPCD From SB X7 7 Table 5 Maximum 2020 Target 1 Calculated Confirmed 2020 Target Target Maximum 2020 Target is 95% of the 5 Year Baseline GPCD Target is calculated based on the selected Target Method, see SB X7 7 Table 7 and corresponding tables for agency's calculated target. NOTES: Used Method
111 SB X7 7 Table 8: 2015 Interim Target GPCD Confirmed 2020 Target Fm SB X7 7 Table 7 F NOTES: year Baseline GPCD Fm SB X7 7 Table Interim Target GPCD
112 SB X7 7 Table 9: 2015 Compliance Actual 2015 GPCD 2015 Interim Target GPCD Optional Adjustments (in GPCD) Enter "0" if Adjustment Not Used Extraordinary Events Weather Normalization Economic Adjustment TOTAL Adjustments Adjusted 2015 GPCD 2015 GPCD (Adjusted if applicable) Did Supplier Achieve Targeted Reduction for 2015? From Methodology 8 (Optional) From Methodology 8 (Optional) From Methodology 8 (Optional) YES NOTES:
113 2015 Urban Water Management Plan Appendix F: 2013 and 2014 Best Management Practices Annual Reports to the California Urban Water Conservation Council F
114

115

116

117

118


119


120

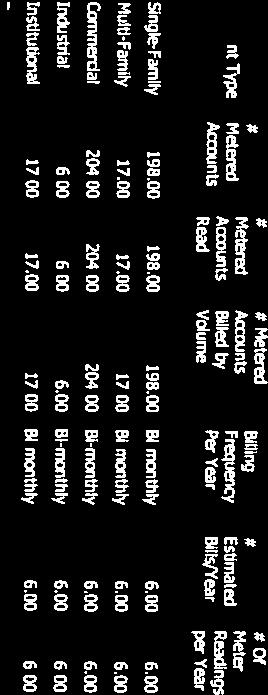
121
122

123
124
125

126


127


128
129

130


131

132


133
134


135


136


137
138


139

140
141
142


143


144
145

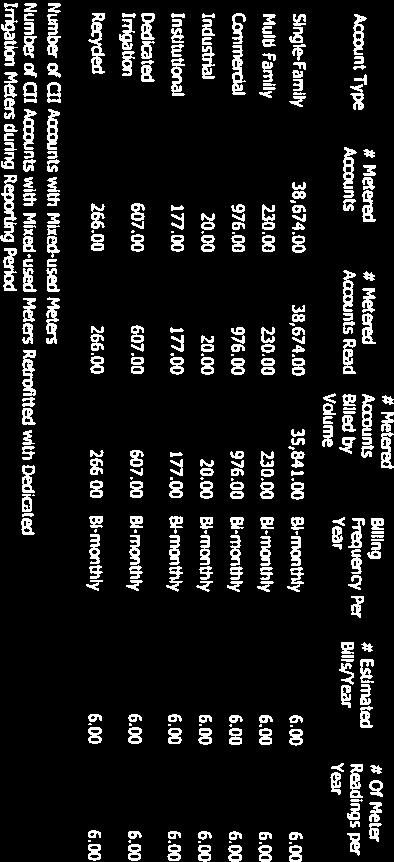
146

147
148
149


150


151


152


153

154


155
156


157

158


159

160

161

162

163


164

165

166

167

168


169

170

171


172


173


174
175
176

177

178

179

180


181


182


183
184


185
186


187


188

189


190


191


192


193

194


195


196
2015 Urban Water Management Plan
 Prepared for City of Stockton 2015 Urban Water Management Plan July 2016 11020 White Rock Road, Suite 200 Rancho Cordova, California 95670 Tel: 916-444-0123 Fax: 916-635-8805 www.brownandcaldwell.com
Notice of Public Hearing. Notice of Public Hearing
 2015 URBAN WATER MANAGEMENT PLAN Table 8-2: Notification to Cities and Counties Retail: Notification to Cities and Counties City Name 60 Day Notice Notice of Public Hearing Dana Point Mission Viejo County
2015 Urban Water Management Plan for District 40
 2015 Urban Water Management Plan for District 40 County of Los Angeles Department of Public Works Los Angeles County Waterworks District No. 40, Antelope Valley Alhambra, California February 2017 Table
FINAL JUNE 2016 CITY OF WOODLAND Urban Water Management Plan
 FINAL JUNE 2016 CITY OF WOODLAND 2015 Urban Water Management Plan (THIS PAGE LEFT BLANK INTENTIONALLY) 2015 Urban Water Management Plan Prepared for City of Woodland June 2016 204-12-15-53 Project Manager
UWMP Checklist Arranged by Subject
 Checklist Arranged by CWC 10620(b) 10620(d)(2) Requirement Every person that becomes an urban water supplier shall adopt an urban water management plan within one year after it has become an urban water
FINAL - MAY 2016 CITY OF ROSEVILLE Urban Water Management Plan
 FINAL - MAY 2016 CITY OF ROSEVILLE 2015 Urban Water Management Plan (THIS PAGE LEFT BLANK INTENTIONALLY) Final 2015 Urban Water Management Plan Prepared for The City of Roseville May 2016 415-12-15-26
UWMP Standardized Tables. Livermore District Urban Water Management Plan Appendix H
 UWMP Standardized Tables Livermore District 2015 Urban Water Management Plan Appendix H Table 2-1 Retail Only: Public Water Systems Public Water System Number Public Water System Name Number of Municipal
Zone 40 Water System Infrastructure Plan
 SACRAMENTO COUNTY WATER AGENCY Sacramento County Water Agency April 2006 Sacramento County Water Agency Staff: Darrell Eck, Senior Civil Engineer Dan Barry, Senior Civil Engineer Mike Crooks, Senior Civil
UWMP Standardized Tables. Palos Verdes District Urban Water Management Plan Appendix H
 UWMP Standardized Tables Palos Verdes District 2015 Urban Water Management Plan Appendix H Table 2-1 Retail Only: Public Water Systems Public Water System Number Public Water System Name Number of Municipal
UWMP Standardized Tables. City of Hawthorne District Urban Water Management Plan Appendix H
 UWMP Standardized Tables City of Hawthorne District 2015 Urban Water Management Plan Appendix H Table 2-1 Retail Only: Public Water Systems Public Water System Number Public Water System Name Number of
CHAPTER 4 Water Demand
 CHAPTER 4 4.1 OVERVIEW OF WATER USE As described in Chapter 2, the City s water service area consists of one large contiguous service area and several outlying non-contiguous service areas. The City is
2015 Urban Water Management Plan
 East Niles Community Services District 2015 Urban Water Management Plan June 2016 Prepared for: East Niles Community Services District 1417 Vale Street Bakersfield, CA 93306 Prepared by: MKN & Associates
UWMP Standardized Tables. King City District Urban Water Management Plan Appendix H
 UWMP Standardized Tables King City District 2015 Urban Water Management Plan Appendix H Table 2-1 Retail Only: Public Water Systems Public Water System Number Public Water System Name Number of Municipal
The City and MID adopted this 2010 UWMP in Copies of the adoption resolutions are included in Appendix B. ES-1
 ES.1 INTRODUCTION This (UWMP) has been prepared for the City of Modesto (City) and the Modesto Irrigation District (MID) by West Yost Associates (West Yost) as a joint UWMP. This 2010 UWMP for the City
2015 Urban Water Management Plan. Adopted: June 14, 2016
 2015 Urban Water Management Plan Adopted: June 14, 2016 This page intentionally left blank City of Folsom 2015 Urban Water Management Plan Final June 2016 Prepared by: [This page intentionally left blank]
UWMP Standardized Tables. Salinas District Urban Water Management Plan Appendix H
 UWMP Standardized Tables Salinas District 2015 Urban Water Management Plan Appendix H Table 2-1 Retail Only: Public Water Systems Public Water System Number Public Water System Name Number of Municipal
UWMP Standardized Tables. Los Altos Suburban District Urban Water Management Plan Appendix H
 UWMP Standardized Tables Los Altos Suburban District 2015 Urban Water Management Plan Appendix H Table 2-1 Retail Only: Public Water Systems Public Water System Number Public Water System Name Number of
UWMP Standardized Tables. Chico-Hamilton City District Urban Water Management Plan Appendix H
 UWMP Standardized Tables Chico-Hamilton City District 2015 Urban Water Management Plan Appendix H Table 2-1 Retail Only: Public Water Systems Public Water System Number Public Water System Name Number
UWMP Standardized Tables. Dominguez District Urban Water Management Plan Appendix H
 UWMP Standardized Tables Dominguez District 2015 Urban Water Management Plan Appendix H Table 2-1 Retail Only: Public Water Systems Public Water System Number Public Water System Name Number of Municipal
UWMP Standardized Tables. Kern River Valley District Urban Water Management Plan Appendix H
 UWMP Standardized Tables Kern River Valley District 2015 Urban Water Management Plan Appendix H Table 2-1 Retail Only: Public Water Systems Public Water System Number Public Water System Name Number of
California Water Service Urban Water Management Plan. Antelope Valley District June Quality. Service. Value. Quality. Service. Value.
 2015 Urban Water Management Plan June 2016 Quality. Service. Value. Quality. Service. Value Table of Contents List of Tables... 5 List of Figures... 7 List of Acronyms... 8 Chapter 1 Introduction and
California Water Service Urban Water Management Plan. Visalia District June Quality. Service. Value
 2015 Urban Water Management Plan June 2016 Quality. Service. Value Table of Contents List of Tables... 5 List of Figures... 7 List of Acronyms... 8 Chapter 1 Introduction and Overview... 9 1.1 Background
City of Rio Vista Urban Water Management Plan 2010
 1. Plan Preparation: City of Rio Vista Urban Water Management Plan 2010 The City of Rio Vista (City), as defined in the California Waster Code section 10617, qualifies as an "Urban Water Supplier". The
Final Draft City of Manteca 2015 Urban Water Management Plan
 10850 Gold Center Drive, Suite 350 Rancho Cordova, CA 95670 916-858-2700 916-858-2754 (Fax) Final Draft 2015 Urban Water Management Plan July 2016 Prepared for 1001 W. Center St. Manteca, California 95337
Urban Water Management Plan
 DR af t 2015 Urban Water Management Plan June 8, 2016 2015 Urban Water Management Plan Santee, California June 8, 2016 Prepared by: 9665 Chesapeake Dr., Suite 201 San Diego, CA 92123 Project Participants
City of Anaheim. Amendments to 2015 Urban Water Management Plan
 City of Anaheim Amendments to 2015 Urban Water Management Plan December 2016 City of Anaheim Amendments to 2015 Urban Water Management Plan (Plan) Contents Revisions to Section 5.2.3 - Provide an outline
2015 Urban Water Management Plan
 2015 Urban Water Management Plan FINAL June 2016 Prepared by Page intentionally left blank. 2015 Urban Water Management Plan Final Prepared By: June 27, 2016 Sweetwater Authority 2015 Urban Water Management
California Water Service Urban Water Management Plan. East Los Angeles District June Quality. Service. Value
 2015 Urban Water Management Plan June 2016 Quality. Service. Value Table of Contents List of Tables... 5 List of Figures... 8 List of Acronyms... 9 Chapter 1 Introduction and Overview... 11 1.1 Background
City of Arcata Urban Water Management Plan 2015
 City of Arcata Urban Water Management Plan 2015 Completed: May 2016 UPDATED FEBRUARY 2018 Table of Contents Chapter 1 Introduction and Overview... 6 Chapter 2 Plan Preparation... 7 2.1 Basis for Preparing
2015 Urban Water Management Plan
 2015 Urban Water Management Plan DRAFT Temescal Valley Water District 22646 Temescal Canyon Road Corona, California 92883 (951) 277-1414 December 2017 Prepared by: 2015 Urban Water Management Plan Page
California Water Service Urban Water Management Plan. Dominguez District June Quality. Service. Value. Quality. Service. Value.
 2015 Urban Water Management Plan June 2016 Quality. Service. Value. Quality. Service. Value Table of Contents List of Tables... 5 List of Figures... 8 List of Acronyms... 9 Chapter 1 Introduction and
California Water Service Urban Water Management Plan. Bakersfield District June Quality. Service. Value
 2015 Urban Water Management Plan June 2016 Quality. Service. Value Table of Contents List of Tables... 7 List of Figures... 9 List of Acronyms... 10 Chapter 1 Introduction and Overview... 11 1.1 Background
INDIAN WELLS VALLEY WATER DISTRICT 2010 URBAN WATER MANAGEMENT PLAN MAY Prepared by
 INDIAN WELLS VALLEY WATER DISTRICT (760) 375-5086 500 WEST RIDGECREST BOULEVARD POST OFFICE BOX 1329 RIDGECREST, CALIFORNIA 93556 RIDGECREST, CALIFORNIA 93556-1329 INDIAN WELLS VALLEY WATER DISTRICT 2010
2015 URBAN WATER MANAGEMENT PLAN VOLUME 1 FINAL REPORT
 CITY OF HEMET 2015 URBAN WATER MANAGEMENT PLAN VOLUME 1 FINAL REPORT JUNE 2016 Prepared by CITY OF HEMET 2015 URBAN WATER MANAGEMENT PLAN VOLUME 1 FINAL REPORT JUNE 2016 PREPARED FOR CITY OF HEMET 445
LONG-TERM CONSERVATION FRAMEWORK BRIEFING DEPARTMENT OF WATER RESOURCES. EDUCATION ADVOCACY LEADERSHIP March 15, 2019
 LONG-TERM CONSERVATION FRAMEWORK BRIEFING DEPARTMENT OF WATER RESOURCES EDUCATION ADVOCACY LEADERSHIP March 15, 2019 THANK YOU TO OUR HOST THANK YOU TO OUR SPONSORS MEDIA CONTRIBUTER Dawn Hodson, reporter
WATER RESOURCES - WATER SUPPLY
 EXECUTIVE SUMMARY Sacramento County Water Agency (SCWA) constructs water supply improvement projects to serve both newly developing areas and existing customers. This report summarizes those construction
APPENDIX A. Legislative Requirements. Urban Water Management Planning Act SBx7-7 Water Conservation Act of 2009 SB1478
 APPENDIX A Legislative Requirements Urban Water Management Planning Act SBx7-7 Water Conservation Act of 2009 SB1478 Section K: California Water Code, Division 6, Part 2.6: Urban Water Management Planning
City of Escondido 2010 Urban Water Management Plan. July 2011
 City of Escondido 2010 Urban Water Management Plan July 2011 City of Escondido 2010 Urban Water Management Plan July 2011 Project No. 139583 9665 Chesapeake Drive, Suite 201 San Diego, California 92123
2010 Urban Water Management Plan San Dimas
 Final Report 2010 Urban Water Management Plan San Dimas Corporate Office 630 E. Foothill Blvd. San Dimas CA 91773 August 2011 Final Report 2010 Urban Water Management Plan San Dimas Corporate Office 630
Las Virgenes Municipal Water District 2010 Urban Water Management Plan Contact Sheet
 2010 Urban Water Management Plan Contact Sheet Date plan submitted to the Department of Water Resources: June 29, 2011 Name of person(s) preparing this plan: Mr. David Lippman, P.E., Director, Facilities
1.1 Introduction
 Table of Contents Executive Summary ES.1 Introduction... ES-1 ES.2 Plan Adoption... ES-1 ES.3 Plan Overview... ES-2 ES.3.1 Service Area... ES-2 ES.3.2 Water Demand... ES-3 ES.3.3 Projected Water Supply...
Draft 2015 Urban Water Management Plan
 Prepared for Stockton East Water District Draft 2015 Urban Water Management Plan May 2016 11020 White Rock Road, Suite 200 Rancho Cordova, California 95670 Tel: 916-444-0123 Fax: 916-635-8805 www.brownandcaldwell.com
This page is intentionally left blank.
 This page is intentionally left blank. STATE OF CALIFORNIA CALIFORNIA NATURAL RESOURCES AGENCY EDMUND G. BROWN JR., Governor DEPARTMENT OF WATER RESOURCES 1416 NINTH STREET, P.O. BOX 942836 SACRAMENTO,
2015 Urban Water Management Plan for the City of Redwood City
 2015 Urban Water Management Plan for the City of Redwood City June 2016 1. INTRODUCTION AND PLAN PREPARATION... 1 1.1 Compliance with the UWMP Act, Including Changes Since 2010... 1 1.2 Coordination and
Eastern Municipal Water District 2015 Urban Water Management Plan
 FINAL Prepared by June 2016 Table of Contents EXECUTIVE SUMMARY ES-1 PLAN PURPOSE AND OVERVIEW... XI ES-2 SERVICE AREA AND WATER SUPPLIES... XII ES-3 WATER DEMANDS... XIII ES-4 WATER SUPPLY FORECAST...
URBAN WATER MANAGEMENT PLAN
 CITY OF POMONA URBAN WATER MANAGEMENT PLAN 2010 Final City of Pomona 2010 Urban Water Management Plan Prepared by: July 2011 City of Pomona 2010 Urban Water Management Plan FINAL Table of Contents Section
Urban Water MANAGEMENT PLAN UPDATE. Prepared by:
 2015 Urban Water MANAGEMENT PLAN UPDATE Draft Report May 2016 Prepared by: Table of Contents 1 Introduction and Executive Summary... 1-1 1.1 Plan Preparation... 1-1 1.2 District Overview... 1-1 1.3 District
CHAPTER 2 Water Demands
 CHAPTER 2 Water Demands This chapter provides an overview of the City s water service area and describes the City s historical annual water use. Subsequent sections of this chapter examine projected water
2015 Urban Water Management Plan
 Final for the San Lorenzo Valley Water District Prepared by 12/2/2016 Table of Contents TABLE OF CONTENTS Table of Contents... i List of Tables... v List of Figures... vi List of Terms and Acronyms...
Mammoth Community Water District 2015 URBAN WATER MANAGEMENT PLAN
 Mammoth Community Water District 2015 URBAN WATER MANAGEMENT PLAN January 2017 (This page intentionally blank.) Table of Contents Executive Summary... 1 ES.1 Scope and Purpose of the 2015 Urban Water Management
Appendix F. LOCAL WATER PLANNING DOCUMENTS AND EFFORTS
 Appendi xf L oc alwat erpl anni ng Doc ument sandef f or t s o nt e m a r c Sa n o i eg R B AR Local Water ning Documents and Efforts 2 3 4 5 6 7 8 9 0 2 3 4 5 6 7 8 Appendix F. LOCAL WATER PLANNING DOCUMENTS
20. UTILITIES AND SERVICE SYSTEMS
 June 28, 2018 Page 20-1 20. UTILITIES AND SERVICE SYSTEMS This EIR chapter describes existing conditions for and distribution, collection and, and solid waste disposal and recycling in the planning area.
SB 606 (Hertzberg) Summary As Chaptered on 5/31/18
 Summary As Chaptered on 5/31/18") SB 606 (Hertzberg) Summary As Chaptered on 5/31/18 Urban Water Use Objectives and Water Use Reporting Requirements: SB 606 requires the State Water Resources Control Board (State Water Board) and the Department
SB 606 (Hertzberg) Summary As Chaptered on 5/31/18 Urban Water Use Objectives and Water Use Reporting Requirements: SB 606 requires the State Water Resources Control Board (State Water Board) and the Department
URBAN WATER MANAGEMENT PLAN
 URBAN WATER MANAGEMENT PLAN 2 0 1 5 U P JUNE 2016 PREPARED BY: D A T E Table of Contents 1.0 Introduction and Executive Summary...1-1 Plan Preparation... 1-1 District Overview... 1-2 District Supplies
MCKINLEYVILLE COMMUNITY SERVICES DISTRICT 2015 URBAN WATER MANAGEMENT PLAN
 MCKINLEYVILLE COMMUNITY SERVICES DISTRICT 2015 URBAN WATER MANAGEMENT PLAN July 6, 2016 Approved by MCSD Board of Directors July 6, 2016 Prepared by: MCSD Staff McKinleyville Community Services District
MAKING WATER CONSERVATION A CALIFORNIA WAY OF LIFE
 Public Review Draft MAKING WATER CONSERVATION A CALIFORNIA WAY OF LIFE Primer of 2018 Legislation on Water Conservation and Drought Planning PREPARED BY California Department of Water Resources AUGUST
Suisun-Solano Water Authority Urban Water Management Plan
 Suisun-Solano Water Authority Urban Water Management Plan FINAL August 8, 2016 TABLE OF CONTENTS LIST OF FIGURES...4 LIST OF TABLES...5 LIST OF ACRONYMS...6 1. INTRODUCTION AND OVERVIEW...8 1.1 Background
MILNER-VILLA CONSULTING. Appendix E. UWMP Required Tables. Draft UWMP/AWMP, May 2016 Casitas Municipal Water District
 MILNER-VILLA CONSULTING Appendix E UWMP Required Tables Draft UWMP/AWMP, May 2016 Casitas Municipal Water District Table 2 2: Plan Identification Select Only One Individual UWMP Type of Plan Name of RUWMP
The report is organized according to the recommended format established by the California Department of Water Resources (DWR) as follows:
 as follows:") October 31, 2011 City of West Sacramento 1110 West Capitol Ave., 2nd Floor West Sacramento, CA 95691 Attention: Subject: Mr. Vin Cay 2010 Urban Water Management Plan Dear Mr. Cay: We are pleased to submit
October 31, 2011 City of West Sacramento 1110 West Capitol Ave., 2nd Floor West Sacramento, CA 95691 Attention: Subject: Mr. Vin Cay 2010 Urban Water Management Plan Dear Mr. Cay: We are pleased to submit
URBAN WATER MANAGEMENT PLAN
 2015 URBAN WATER MANAGEMENT PLAN FINAL JUNE 2016 2015 URBAN WATER MANAGEMENT PLAN 2015 URBAN WATER MANAGEMENT PLAN City of Anaheim FINAL Prepared for: Thomas McCarthy Water Planning and Resources Manager
2015 Urban Water Management Plan. for the City of Lompoc
 2015 Urban Water Management Plan for the City of Lompoc June 21, 2016 Final 2015 Urban Water Management Plan Final for the City of Lompoc Prepared Under the Responsible Charge of: Ron Munds Associate Planner,
6.7 Desalinated Water Opportunities Exchanges or Transfers Future Water Projects Summary of Existing and Planned
 TABLE OF CONTENTS LIST OF FIGURES... 4 LIST OF TABLES... 4 LIST OF ACRONYMS... 5 1. INTRODUCTION AND OVERVIEW... 6 1.1 Background and Purpose... 6 1.2 Urban Water Management Planning and the California
City of Pittsburg 2015 Urban Water Management Plan Final Draft
 Final Draft June 2016 Final Draft City Council Ben Johnson, Mayor Will Casey, Vice Mayor Pete Longmire Sal Evola Merl Craft City Manager Joe Sbranti Prepared by: RMC Water and Environment Walter C. Pease,
Appendix D: Public Meeting Notice
 California Water Service 2015 Urban Water Management Plan Kern River Valley District Appendix D: Public Meeting Notice Notice of Intent Proof of Publication Public Meeting Agenda Public Meeting Comment
2010 Urban Water Management Plan Claremont
 Final Report 2010 Urban Water Management Plan Claremont Corporate Office 630 E. Foothill Blvd. San Dimas CA 91773 September 2011 Final Report 2010 Urban Water Management Plan Claremont Corporate Office
City of Roseville General Plan 2035, as amended June 2016 (City of Roseville 2016a)
") 4.7 WATER SUPPLY 4.7.1 INTRODUCTION This section evaluates potential impacts associated with demand for water supply associated with implementation of the VillaSport Athletic Club and Spa Project (proposed
4.7 WATER SUPPLY 4.7.1 INTRODUCTION This section evaluates potential impacts associated with demand for water supply associated with implementation of the VillaSport Athletic Club and Spa Project (proposed
URBAN WATER MANAGEMENT PLAN UPDATE FOR 2010
 URBAN WATER MANAGEMENT PLAN UPDATE FOR 2010 City of Shafter Public Works Department 336 Pacific Avenue Shafter, CA 93263 Michael James, P.E. Public Works Director City of Shafter R.C.E. #60021 Exp. 6-30-12
URBAN WATER MANAGEMENT PLAN JUNE Prepared By
 2015 URBAN WATER MANAGEMENT PLAN F I N A L JUNE 2016 Prepared By This page intentionally left blank. Final Prepared by: June 2016 This page intentionally left blank. Page ii Table of Contents Executive
2015 Urban Water Management Plan for Mojave Water Agency
 Courtesy: Google Earth FINAL 2015 Urban Water Management Plan for Mojave Water Agency Prepared by Kennedy/Jenks Consultants June 2016 300 North Lake Avenue, Suite 1020 Pasadena, California 91101 626-568-4300
Marin Municipal Water District 2015 Urban Water Management Plan Water Demand Analysis and Water Conservation Measures Update FINAL
 2015 Urban Water Management Plan Water Demand Analysis and Water Conservation Measures Update FINAL July 1, 2015 TABLE OF CONTENTS LIST OF FIGURES...4 LIST OF TABLES...4 LIST OF ACRONYMS...5 EXECUTIVE
WATER USES PROJECTED WATER USES THROUGH Table 4 2: 2015 Water Customers
 4.2.3 2015 WATER USES As of December 2015, the City serves approximately 53,193 water customers. Of those customers, 89% serve residential land uses while approximately 5% serve commercial land uses. The
MONTE VISTA WATER DISTRICT 2015 URBAN WATER MANAGEMENT PLAN
 MONTE VISTA WATER DISTRICT 2015 URBAN WATER MANAGEMENT PLAN PUBLIC REVIEW DRAFT MAY 2016 Prepared by Monte Vista Water District Staff: General Manager Public Affairs Director/ Water Use Efficiency Practitioner
Water Conservation Workshop
 Water Conservation Workshop February 24, 2009 Workshop Agenda Introduction State and Regional Outlook Water Conservation Efforts Tools for Water Savings Proposed Changes Next Steps Our Water Rights American
2015 URBAN WATER MANAGEMENT PLAN Final Report
 PREPARED FOR Coachella Valley Water District 2015 URBAN WATER MANAGEMENT PLAN Final Report July 1, 2016 This page left intentionally blank TABLE OF CONTENTS Section 1 Introduction and Overview... 1-1 1.1
2015 Water Resources Status Report
 CITY OF SAN LUIS OBISPO 2015 Water Resources Status Report This Report Covers the Time Period of October 1, 2014 through September 30, 2015 Salinas Reservoir Dam, February 2015. Photo credit: County of
Water Shortage Contingency Planning
 Section 8: T Water Shortage Contingency Planning he Act requires water agencies to incorporate a water shortage contingency plan (WSCP) focusing on the allocation of water supplies and the management of
2O15 Urban Water Management Plan
 2O15 Urban Water Management Plan CITY OF SANTA ROSA 2015 URBAN WATER MANAGEMENT PLAN PREPARED BY: In conjunction with: West Yost Associates & Maddaus Water Management JUNE 2016 This page intentionally
Urban Water Management Plan
 North Tahoe Public Utility District Urban Water Management Plan 2015 Board Adopted: 6 13 2017 2 Table of Contents Table of Contents... 3 1 Introduction and Overview... 5 2 Plan Preparation... 7 3 System
Water Conservation Workshop. February 24, 2009
 Water Conservation Workshop February 24, 2009 1 1 Workshop Agenda Introduction State and Regional Outlook Water Conservation Efforts Tools for Water Savings Proposed Changes Next Steps 2 2 Our Water Rights
CHAPTER 2 POPULATION, LAND USE & WATER USE TRENDS
 Population CHAPTER 2 POPULATION, LAND USE & WATER USE TRENDS 2.1 PAST POPULATION IEUA s service area experienced rapid growth over the past ten years (see Figure 2-1). In 2000, the population within the
Cost Sharing Agreement For The Los Vaqueros Reservoir Expansion Project Planning. ACWD Board Meeting December 8, 2016
 Cost Sharing Agreement For The Los Vaqueros Reservoir Expansion Project Planning ACWD Board Meeting December 8, 2016 Los Vaqueros Reservoir (LV) Owned and operated by CCWD Off-stream reservoir, adjacent
URBAN WATER MANAGEMENT PLAN
 2015 URBAN WATER MANAGEMENT PLAN FINAL DRAFT JULY 2016 2015 URBAN WATER MANAGEMENT PLAN City of San Juan Capistrano DRAFT [Signature 1 Name] [Title] Prepared for: Eric Bauman Utilities Department City
APPENDIX S EL DORADO COUNTY WATER AGENCY DRAFT WATER USE AND CONSERVATION ANALYSIS
 APPENDIX S EL DORADO COUNTY WATER AGENCY DRAFT WATER USE AND CONSERVATION ANALYSIS Appendix S El Dorado County Water Agency Draft Water Use and Conservation Analysis Prepared by El Dorado County Water
2010 Urban Water Management Plan. July 1, 2011 Board of Public Utilities
 2010 Urban Water Management Plan July 1, 2011 Board of Public Utilities 2010 Urban Water Management Plan UWMPs are a requirement of the State for retail and wholesale water suppliers The purpose of these
URBAN WATER MANAGEMENT PLAN
 2015 URBAN WATER MANAGEMENT PLAN FINAL May 2016 2015 URBAN WATER MANAGEMENT PLAN 2015 URBAN WATER MANAGEMENT PLAN City of Buena Park FINAL Prepared for: Francisco Gutierrez Associate Engineer City of Buena
Ventura County Waterworks District No. 8. Amended 2015 Urban Water Management Plan for. Ventura County Waterworks District No. 8
 Ventura County Waterworks District No. 8 Amended 2015 Urban Water Management Plan for Ventura County Waterworks District No. 8 April 2017 RESOLUTION NO. WWD-263 A RESOLUTION OF THE BOARD OF DIRECTORS
Adopt the Long-Term Conservation Plan and revised policy principles on water conservation
 Board of Directors Water Planning and Stewardship Committee 8/16/2011 Board Meeting Subject Adopt the Long-Term Conservation Plan and revised policy principles on water conservation Description In February,
CHAPTER SEVEN: UTILITIES
 CHAPTER SEVEN: UTILITIES 7.1 Introduction The Water Works Board of the City of Auburn (AWWB) is the primary potable water service provider for the City of Auburn (City) and Auburn University. There are
Honorable Mayor and Members of the City Council through City Manager. Dan St. John, F. ASCE Director, Public Works and Utilities
 TIM, ED j85` u' DATE: July 16, 2018 TO: Honorable Mayor and Members of the City Council through City Manager FROM: Dan St. John, F. ASCE Director, Public Works and Utilities Leah Walker, P. E. Environmental
URBAN WATER MANAGEMENT PLAN
 2015 URBAN WATER MANAGEMENT PLAN FINAL DRAFT APRIL 2016 2015 URBAN WATER MANAGEMENT PLAN City of Brea FINAL DRAFT [Signature 1 Name] [Title] Prepared for: Ron Krause Project Manager City of Brea 1 Civic
City of Morro Bay Urban Water Management Plan
 City of Morro Bay 2015 Urban Water Management Plan Prepared by: MNS Engineers 811 El Capitan Way, Suite 130 San Luis Obispo CA 93401 June 24, 2016 City of Morro Bay i Contents INTRODUCTION AND OVERVIEW...
URBAN WATER MANAGEMENT PLAN
 2015 URBAN WATER MANAGEMENT PLAN FINAL JUNE 2016, 2015 URBAN WATER MANAGEMENT PLAN 2015 URBAN WATER MANAGEMENT PLAN City of Santa Ana FINAL Prepared for: City of Santa Ana Public Works Agency Water Resources
Water Conservation Demand Study for Newland Sierra (San Diego County, California)
") Technical Memorandum To: Rita Brandin Newland Sierra, LLC From: John Porcello GSI Water Solutions, Inc. Cindy Ryals GSI Water Solutions, Inc. Date: September 8, 2016 Re: Water Conservation Demand Study
Technical Memorandum To: Rita Brandin Newland Sierra, LLC From: John Porcello GSI Water Solutions, Inc. Cindy Ryals GSI Water Solutions, Inc. Date: September 8, 2016 Re: Water Conservation Demand Study
1.0 Executive Summary Introduction Area Growth and Population
 TABLE OF CONTENTS TABLE OF CONTENTS 1.0 Executive Summary... 1.0-1 2.0 Introduction... 2.0-1 3.0 Area Growth and Population... 3.0-1 4.0 Services, Infrastructure, and Facilities... 4.0-1 4.1 Water... 4.0-2
WATER FORUM WATER CONSERVATION PLANS
 INTRODUCTION: WATER FORUM WATER CONSERVATION PLANS The Water Conservation Plans provide the way for water purveyors to identify and then report their progress toward implementation of the Best Management
Assessment. Appendix I: Water Supply Assessment
 I Appendix I: Water Supply Assessment Please see the next page. CITY OF SAN LUIS OBISPO ASSESSMENT OF WATER SUPPLY Water Code 10910 et seq. To: City of San Luis Obispo 990 Palm Street San Luis Obispo,
DRAFT. Recycled Water Cost of Service and Rate Study Report. Napa Sanitation District
 DRAFT Recycled Water Cost of Service and Rate Study Report Napa Sanitation District December 2011 DRAFT Executive Summary Recycled Water Cost of Service and Rate Study Report 2 The Napa Sanitation District
2010 Urban Water Management Plan City of Morro Bay
 P u blic Review Draft Report 2010 Urban Water Management Plan City of Morro Bay Prepared for City of Morro Bay 955 Shasta Ave Morro Bay, CA 93442 June 2011 325 E. Hillcrest Drive Suite 125 Thousand Oaks,
Prepared by: Fallbrook Public Utility District staff
 Fallbrook Public Utility District 2015 Urban Water Management Plan Prepared by: Fallbrook Public Utility District staff Table of Contents 1. Introduction and Overview... 1 1.1 California Urban Water Management