Arkansas Discovery Farms in the Illinois River Watershed
|
|
|
- Brook Sharp
- 5 years ago
- Views:
Transcription
1 Arkansas Discovery Farms in the Illinois River Watershed The Moore Discovery Farm Activity Report December 31, 2016 Walton Family Foundation Discovery Farm 1
2 Table of Contents Executive Summary... 3 The Moore Discovery Farm Operation... 4 The Moore Discovery Farm: A Virtual Tour... 5 Site Description... 5 Soil Descriptions and Distribution... 9 RCS Spillway Design Time Sequence of ew House Construction ad Construction at Front of ew Houses Installing the Sampling Equipment Original house cleanout Original houses and sampling location Water Quality Results Site Background Flow, utrient, and Sediment Runoff Data Conservation ractices to Minimize utrient Runoff otential from oultry Houses age 2
3 Executive Summary On the Moore Discovery Farm we are monitoring the potential for nutrient runoff from around poultry houses and evaluating the effectiveness and cost benefits of conservation practices that minimize nutrient runoff. There are four sites instrumented with flow meters and automated water samplers, which collect information and water samples from each rainfall runoff event occurring on the farm. One site monitors runoff from an adjacent row crop and pasture that has been fertilized with poultry litter and mineral fertilizer as needed by the crop and as determined by the required nutrient management plan for the farm. Another site monitors runoff from three original poultry houses. These sites came on line at the middle of On completion of four new poultry houses, two additional sites have monitored runoff from the front of the new and original houses, where the new houses are constructed with larger pads that minimize spillage of litter during bird harvest and litter cleanout. These sites became operation in May, The major findings to date are; 1. Amounts of nutrients running of from around the poultry houses are slightly greater than that from the pasture and row crop area. This is mainly attributed to an appreciably great volume and energy of water running from around the poultry houses, which have a greater proportion of impervious areas that limit rainwater infiltration. 2. During the period we have been sampling runoff at the Moore Farm, there has been a greater amount of rainfall during 2015 than This increase is partially reflected in the larger number of runoff events that occurred and amount of flow in 2015 as compared to 2014, translating to a general increase in nutrient loss from around the original houses in 2015 compared to utrient runoff from the front of the new houses with larger concrete pads at the front, was less than from the original houses. While it is too early to draw reliable conclusions, the lowers losses from the new houses, likely reflect the fact that there have been fewer bird harvests and litter cleanouts on the new compared to original houses. The appreciably greater sediment loss from the new than original houses, indicates that more work is needed to establish a complete vegetative cover around those houses as quickly as possible. 4. In the context of three other farms in northwest Arkansas where we have been monitoring nutrient runoff from around poultry houses for three to five years, losses were very similar to those from the original houses with no conservation practices at the Moore Farm. 5. We will continue to monitor the effectiveness of the larger concrete pads to eliminate spillage of litter during normal operation of the houses and expect their reduction efficiency to increase with time in place. 6. We plan to construct a retention spillway at the rear of the new poultry houses in early 2017, which will capture runoff from the rear of the new houses. The base spillway will be filled with slag waste by product from a new power generation plant. The slag has a large affinity to bind phosphorus (). We will monitor water entering and leaving the spillway area to determine the effectiveness of the structural measure as an additional conservation practice to minimize nutrient runoff from poultry production areas. age 3

4 The Moore Discovery Farm Operation The Moore WFF ADF was established to work with a poultry grower who was building new broiler houses, to determine if they could be constructed in a way that minimizes water and nutrient footprints. This is in response to recent inspections of poultry operations in the IRW by U.S. EA Region 6 over that last year. The focus of these inspections were concerns of nutrient loss in runoff generated around the immediate area surrounding the production facilities. These concerns and inspections have also occurred in the Chesapeake Bay Watershed. On this WFF ADF we are proactively working with a farmer and integrator operating in the IRW to document the reduction and cost effectiveness of several production area conservation practices (Cs). More information on the farm operation can be obtained from We established Cs around newly constructed poultry houses, at minimal cost to the farmer, to demonstrate reducing the nutrient and water footprint and to monitor runoff onto and off the site to document water quality benefits. On the same farm, we will eventually retro fit poultry houses with Cs and assess their similar effectiveness. An advisory committee comprised of farmers, RCS, integrators, and research and extension specialists will oversee possible options, which will include, but not limited to: 1. A larger concrete pad at the front of the new houses, with a gutter around it. This would make it easier for a farmer to clean any unavoidable spillage of litter following bird or litter removal. The gutter might direct any water to a French drain, minimizing surface flows. 2. Use of an existing farm pond to collect any runoff and trap nutrients. 3. Establish forage cover around the new houses to minimize runoff and erosion. 4. Divert any concentrated flowing water away from the new houses where possible. age 4

5 The Moore Discovery Farm: A Virtual Tour Available at and below. Site Description Source: USGS, ESRI Figure 1. Location of the Morrow Discovery Farm in the Illinois River Watershed. age 5

6 Figure 2. Original Moore Farm layout prior to becoming a Discovery Farm. Image taken age 6

7 Moore Discovery Farm Figure 3. Sub watershed delineations on the Moore Farm. age 7


8 Figure 4. lan of planned Conservation ractices around the new Moore poultry houses. age 8

9 Soil Descriptions and Distribution Figure 5. Soil type distribution on the Moore Farm. age 9
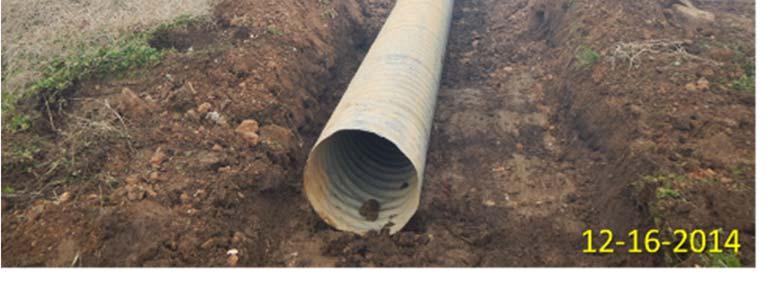
10 RCS Spillway Design We collaborated with RCS, who completed an on site drainage design for berms to divert upslope surface runoff away from the new poultry house. This is important to the long term reduction in nutrient runoff from poultry houses by minimizing the potential for any surface water to flow passed the houses and carry with it nutrients and sediment. This design follows. age 10
11 age 11
12 age 12
13 age 13
14 age 14

15 age 15


16 Time Sequence of ew House Construction age 16


17 age 17


18 age 18


19 ad Construction at Front of ew Houses age 19


20 age 20


21 Installing the Sampling Equipment age 21


22 age 22


23 age 23


24 Original house cleanout age 24


25 Original houses and sampling location age 25
26 Water Quality Results Site Background Collection of water at two sites collecting runoff from the original poultry houses and an adjacent fields in pasture and row crops (corn/soybeans) was initiated in August, 2014 (i.e., Sites Moore 1 and 2; Table 1). After construction of the new poultry houses was complete, runoff sampling at two new sites draining the front of the original and new houses was initiated in May, 2015 (Moore 3 and 4; Table 1). The areas draining the respective sampling sites are given in Table 1. Table 1. Watershed areas for the Moore Farm sites. Site Watershed Area Description Acres Hectares Moore Collects runoff from a steep pasture/row cropped drainage area Moore Collects runoff draining from the rear (near ventilation fans) of three of the original poultry houses Moore Collects runoff draining from the front of the four original houses Moore Collects runoff draining from the front of the four new houses Flow, utrient, and Sediment Runoff Data Mean flow weighted concentrations of nitrogen (), phosphorus (), sediment, and flow from the four sites on the Moore Farm are given in Table 2. The amount of runoff from the sites draining the pasture and crop land (Moore 1; Table 2) was appreciably less than that from around the poultry production areas (Moore 2, 3, and 4; Table 2), likely due to the impervious nature of much of the latter s drainage area with house, roof, and access roads. Data for each sampling event is given at the end of this report in Table 6. The greater runoff volumes were reflected in generally lower concentrations of and in runoff from the houses when compared with the adjacent pasture and crop land (Table 2). For sediment concentrations, concentrations at sites 1 and 2 in both years were similar, but extensive age 26
27 construction work at the front of both the original and new house resulted in elevated levels in As the grass around the houses and graveled areas becomes more established, we expect these concentrations to decrease, particularly for site 4, which averaged 2,363 mg/l sediment in This also suggests the need for stormwater management during construction, such as with sediment fences. Table 2. Mean flow weighted concentration of, and sediment at each sampling site in 2014, 2015, and 2016 on the Moore Discovery Farm. Site # runoff events Flow Dissolved itrate Solids L/ha mg/l 2014 asture , Rear of original houses 11 1,880, asture 26 4,188, Rear of original houses Front of original houses Front of new houses 20 9,185, ,853, , ,034, , asture 7 219, Rear of original houses Front of original houses Front of new houses 6 231, , , age 27
28 utrient concentrations of runoff from pastures and a row crop field that have received poultry litter according to the farm s nutrient management plan, are elevated compared with runoff from around the poultry houses (Table 2). These fields have traditionally received annual applications of poultry litter at a rate of 2 tons/acre. This rate is recommended to meet the nitrogen requirements of cool season grasses. Table 3. Flow and nutrient loss per unit area (metric units) at each sampling site in 2014, 2015, and 2016 on the Moore Discovery Farm. Site # runoff events Flow Dissolved itrate L/ha kg/ha 2014 asture , Rear of original houses 11 1,880, asture 26 4,188, Rear of original houses Front of original houses Front of new houses 20 9,185, ,853, , ,034, , asture 7 1,535, Rear of original houses Front of original houses Front of new houses 6 1,391, ,490, , ,991, ,598 age 28
29 The loss of nutrients and sediment from the Moore sites are given in Tables 3 (in metric units) and 4 (in English units). When represented on a per unit area basis, the runoff and loads of nutrients and sediment are seen in a different perspective that reflects the properties of the drainage area of each site, as well as land use and management. The amounts of water running off the adjacent pastures is much less than that from around the poultry houses, which has a greater proportion of impervious areas that limit infiltration of rainwater. Given that there is more water running off from around the houses, implies that this water will have a much greater energy of flow and will transport nutrients and sediments more easily than from pastures. This supports then need for appropriate conservation of the house production areas to minimize the potential for nutrient and sediment runoff. During the period we have been sampling runoff at the Moore Farm, there has clearly been a greater amount of rainfall during 2015 than This increase is partially reflected in the larger number of runoff events that occurred and amount of flow in 2015 as compared to 2014, translating to a general increase in nutrient loss from around the original houses (Moore 2) in 2015 compared to While it is too early to draw any conclusions from a comparison of runoff and nutrient loss from the new (Moore 4) compared to original houses (Moore 3), the sites are working and more information will be collected over the next four years. The lower nutrient runoff from the new houses as compared to that from the original houses, may reflect there have only been five bird harvests to date for the new houses. Additionally, residual and will have accumulated around the original house that started receiving birds about six years ago. The appreciably greater sediment loss from the new houses (3,359, compared to 1,930 lbs/acre/year for the new and original houses, respectively, averaged for 2015 and 2016, Table 5 and Figure 6), indicate that more work is needed to establish a complete vegetative cover around those houses as quickly as possible and as weather permits. For individual years, nutrient runoff reduction occurred for houses with concrete pads compared to those without (Figure 7). Table 4. Flow and nutrient loss per unit area (English units) at each sampling site in 2014, 2015, and 2016 on the Moore Discovery Farm. Site # runoff events Flow Dissolved itrate gals/acre lbs/acre 2014 asture 10 16, Rear of original houses , age 29


30 2015 asture , Rear of original houses Front of original houses Front of new houses , , , , , asture 7 164, Rear of original houses Front of original houses Front of new houses 6 148, , , , ,427 Figure 6. Mean annual percent change in annual runoff, nutrient and sediment loss between old and new houses (for 2015 and 2016). age 30


31 Figure 7. ercent change in annual runoff, nutrient and sediment loss between old and new houses for 2015 and To put sediment and nutrient losses into a broader context, Table 5 compares nutrient runoff data from the Moore WFF ADF with other sites across northwest Arkansas where we have been monitoring nutrient runoff from poultry production areas. This monitoring program was initially established to determine if and how much nutrients were moving in runoff from production areas. Once baseline data have been collected and reviewed, then potential conservation practices would be selected and installed, if needed, and monitored to determine effectiveness. While there are site specific differences among sites that influence nutrient runoff, loss was surprisingly similar, ranging from an average of 2.05 to 3.05 lbs/acre for all sites except Lincoln 2 (5.73 lbs total /acre) (Table 5). The loss of was more variable, ranging from 7.44 to lbs total /acre (Table 5). age 31
32 Table 5. Flow and nutrient loss per unit area (English units) at the Moore Discovery Farm and similar sites across northwest Arkansas where we are monitoring nutrient runoff from poultry production areas. Site Year Events # Flow Diss. itrate gals/ac/yr lbs/ac/yr Moore rear , , , Average 2015 & , Moore, front original houses , , , ,760 Average 2015 & , ,930 Moore, front new houses , , , ,427 Average 2015 & , ,359 Elkins 1, 17.4 acres , , , , , Elkins 1 average 444, age 32
33 Site Elkins 2, 3.6 acres Year Events # Flow Diss. itrate , , , , ,348, Elkins 2 average 219, Lincoln 1, 1.54 acres , , ,106, , , , Lincoln 1 average 445, Lincoln 2, 3.45 acres , , , , , , Lincoln 2 average 294, age 33
34 Site Year Events # Flow Diss. itrate Savoy , , , Savoy 1 average 191, Savoy , , , Savoy 2 average 189, age 34

35 Table 6. Flow, nutrient, and sediment data collected in runoff from each site on the Moore Discovery Farm during 2014 and Date collected Rainfall runoff Diss. itrate Diss. itrate cm gal gal/acre L/ha mg/l g/ha Moore /9/ , , ,037 9/2/ , , ,151 9/6/ , , ,208 10/10/ ,041 1,630 15, /12/ ,400 6,169 57, ,528 11/4/ , , /22/ , , /6/ ,351 1,640 15, /15/ ,938 2,734 25, ,212 12/18/ ,853 2,210 20, ,474 Moore /10/ ,665 24, ,255 3/14/ , , ,822 3/26/ ,355 96, ,503 5/8/ ,618 89, ,534 5/10/ , , ,914 35
36 Date collected Rainfall runoff Diss. itrate Diss. itrate 5/17/ ,323 31, ,319 5/20/ ,633 15, /23/ , , ,626 5/24/ , , ,174 5/26/ ,385 41, ,449 5/28/ ,299 21, /30/ ,030 56, ,269 6/15/ ,964 55, ,210 6/18/ , , ,930 6/26/ , , ,744 7/2/ ,942 12, , ,958 7/7/ ,588,711 51, , ,260 7/8/ ,185 10, , ,048 7/9/ ,347 14, , ,477 7/21/ ,033 13, , ,375 8/19/ ,518 8,453 79, ,689 8/23/ ,142 8,604 80, ,623 11/5/ ,059 1,924 17, ,051 11/17/ ,430 20, , ,463 age 36
37 Date collected Rainfall runoff Diss. itrate Diss. itrate 11/29/ ,718,157 55, , ,365 12/13/ ,013,908 65, , ,897 Moore /9/ ,395, ,604 1,034, ,416 4/29/ ,236 3,982 37, ,620 5/12/ ,539 2,558 23, ,989 5/25/ ,715 7,548 70, ,257 5/30/ ,194 6,912 64, ,172 7/25/ ,676 14, , ,735 7/30/ ,143 17, , ,817 Moore /10/ ,463 97, ,730 8/9/ ,625 80, ,396 9/3/ , , ,124 9/6/ , , ,494 10/10/ , , ,585 10/12/ , , ,273 11/4/ , , ,838 12/6/ , , ,333 age 37
38 Date collected Rainfall runoff Diss. itrate Diss. itrate 12/15/ , , ,010 12/18/ , , ,840 7/10/ ,463 97, ,730 Moore /10/ ,887 73, ,537 3/14/ , , ,211 3/26/ , , ,590 5/8/ , , ,320 5/10/ ,958 83, /17/ ,691 71, /23/ , , ,839 5/24/ , , ,356 6/15/ , , ,037 6/18/ , , ,266 6/26/ ,668 2,391, ,242 7/7/ , ,723 1,035, , ,510 7/8/ ,968 15, , ,989 7/9/ ,411 17, , ,570 7/21/ ,032 25, , ,649 age 38
39 Date collected Rainfall runoff Diss. itrate Diss. itrate 8/19/ ,043 43, , ,235 11/5/ ,350 16, , ,471 11/17/ ,967 87, , ,757 11/29/ ,089 59, , ,525 12/13/ , , , ,492 Moore /9/ , , ,521 5/12/ , , ,504 5/25/ , , ,144 5/30/ , , ,732 7/25/ , , ,707 7/30/ , , ,894 Moore /8/ , , , ,876 5/10/ , , ,953 5/17/ ,424 88, , ,351 5/20/ ,332 77, ,580 5/23/ , , , ,153 5/24/ , , ,038 age 39
40 Date collected Rainfall runoff Diss. itrate Diss. itrate 5/26/ ,608 61, ,463 5/30/ ,302 58, ,931 6/15/ , , ,214 6/18/ ,172 1,086, ,935 6/26/ , , , ,452 7/7/ ,086 56, , , ,091 7/8/ ,067 19, , , ,962 7/21/ ,515 7,406 69, , ,682 8/19/ ,993 25, , , ,381 8/23/ ,604 5,042 47, , ,687 10/31/ ,563 6,225 58, ,557 11/5/ ,198 8,479 79, , ,351 11/17/ ,765 25, , ,801 11/29/ ,992 35, , ,030 Moore /9/ ,802 16, , ,794 4/29/ ,785 40, , ,990 5/12/ ,662 11, , , ,893 5/25/ ,617 17, , , ,963 age 40
41 Date collected Rainfall runoff Diss. itrate Diss. itrate 5/30/ ,453 10,181 95, , ,185 7/4/ ,405 6,962 65, ,608 7/15/ ,373 14, , ,305 7/25/ ,628 28, , , ,229 7/30/ ,764 13, , , ,598 Moore /8/ , , , ,414,352 5/10/ , , , ,774 5/17/ ,122 94, , ,999 5/20/ ,874 54, , ,382 5/23/ , , , ,988 5/24/ , , , ,299 5/26/ ,965 65, , ,845 5/28/ ,483 51, , ,744 5/30/ ,360 78, , ,496 6/15/ , , , ,531 6/18/ , , ,063 6/26/ , , , ,386,882 7/2/ ,057 6,078 56, , ,073 age 41
42 Date collected Rainfall runoff Diss. itrate Diss. itrate 7/7/ ,457 87, , ,169 7/8/ ,381 11, , , ,660 7/9/ ,716 15, , , ,653 7/21/ ,785 41, , , ,439 8/19/ ,163 35, , , ,853 8/23/ ,437 20, , , ,743 10/31/ ,867 6,626 61, , ,338 11/5/ ,261 17, , , ,818 11/17/ ,863 66, , ,363 11/29/ ,924 71, , ,856 12/13/ ,626 72, , ,336 Moore /9/ ,022 30, , ,287 4/29/ ,996 42, , ,037 5/12/ ,209 15, , ,552 5/25/ ,619 28, , , ,071 5/30/ ,171 16, , ,234 7/4/ ,815 11, , ,735 7/15/ ,141 13, , ,354 age 42
43 Date collected Rainfall runoff Diss. itrate Diss. itrate 7/25/ ,231 28, , ,668 7/30/ ,504 26, , ,295 age 43
44 Conservation ractices to Minimize utrient Runoff otential from oultry Houses Table 7. Best management practices to minimize nutrient runoff potential from poultry production facilities. Type Description Action Cost Reduction potential revent Movement with Runoff French grain under roof line Roof gutters over fans Capture clean water and directs from operational area Minimizes direct runoff potential of ground immediately below fans Medium Trays of residuals below fans Binds deposited in dust Medium Larger concrete pads outside house entrance rovides a larger area that can be scrapped clean of spillage after bird removal and house cleanout Low Medium High Medium Source still present High can be removed with residual High Control / Reduce Concentration in Runoff Maintain grassed (non grazed) waterways between houses and those directing runoff away from houses Aeration of land around houses Spread residual around houses May already exist and should be managed to maintain good grass cover Decreases potential for runoff and may improve grass growth and cover Binds that may be in runoff but does not remove from the system Low Low Medium Medium Reduces runoff energy and erosive power; uptakes and dilutes transported Medium Less runoff translates to less nutrient loss risk Medium Trap in Runoff Infiltration zone intercepting runoff Collects nutrient rich runoff. ond must be dredged and material handled and land applied in a manner to not cause risk to water quality 1 Costs are low if already exists otherwise medium or high. Low / high 1 High age 44
CONSERVATION PRACTICES INSTALLED IN THE ILLINOIS RIVER WATERSHED
 CONSERVATION PRACTICES INSTALLED IN THE ILLINOIS RIVER WATERSHED Arkansas Discovery Farms in the Illinois River Watershed Activity Report October 1, 2012 to September 3, 2015 Andrew Sharpley, Distinguished
Statewide Results (Final Target)
") Statewide Results (Final Target) Nutrient Trading in Maryland 2017 National Watershed and Stormwater Conference April 4, 2016 Jason Keppler Watershed Implementation Program Nitrogen Sector 2009 2025 Allocation
Statewide Results (Final Target) Nutrient Trading in Maryland 2017 National Watershed and Stormwater Conference April 4, 2016 Jason Keppler Watershed Implementation Program Nitrogen Sector 2009 2025 Allocation
Although poultry litter is considered
 A R K A N S A S Long-Term Effects of Treating Poultry Litter with Alum on Phosphorus Availability in Soils By P.A. Moore, Jr. and D.R. Edwards Repeated use of poultry litter as a nutrient source can lead
A Primer on Stormwater Management, your Facility and the Chesapeake Bay. Tom Schueler Chesapeake Stormwater Network June
 A Primer on Stormwater Management, your Facility and the Chesapeake Bay Tom Schueler Chesapeake Stormwater Network June 5. 2017 Key Themes Why do we need to be concerned about Stormwater? What are all
beneficial management practices
 beneficial management practices introduction Phosphorus is an essential nutrient for crop growth. Alberta soils are generally deficient or low in phosphorus for optimum crop production (
MINIMIZING THE RISK OF MANURE RUNOFF THIS FALL/WINTER. Nichole Embertson, Ph.D. Whatcom Conservation District
 MINIMIZING THE RISK OF MANURE RUNOFF THIS FALL/WINTER Nichole Embertson, Ph.D. Whatcom Conservation District Whatcom Speaker Series October 16, 2014 What is on your mind right now?? Agronomics = Nutrient
Streamlines V2, n2 (May 1997) A Newsletter for North Carolina Water Supply Watershed Administrators
 A Newsletter for North Carolina Water Supply Watershed Administrators") Page 1 of 5 STREAMLINES A Newsletter for North Carolina Water Supply Watershed Administrators Volume 2, Number 2 May 1997 Non-Point Source (NPS) Pollution This issue of Streamlines provides basic information
Page 1 of 5 STREAMLINES A Newsletter for North Carolina Water Supply Watershed Administrators Volume 2, Number 2 May 1997 Non-Point Source (NPS) Pollution This issue of Streamlines provides basic information
Controlling runon and runoff:
 Chapter 8. Surface Water Management This chapter explores: runon and runoff what they are, and the risks associated with them. various management options runon reductions, runoff catchbasins, vegetated
University of Wisconsin Discovery Farms Staff 2013 Wisconsin Corn / Soy Expo Wisconsin Dells, WI
 University of Wisconsin Discovery Farms Staff 2013 Wisconsin Corn / Soy Expo Wisconsin Dells, WI Overview 1. UW-Discovery Farms, unique program and information, since 2001 Data from private working farms
From the Ground Up- Field Soil Considerations
 From the Ground Up- Field Soil Considerations Ted Bilderback Nursery Extension Specialist Department of Horticulture Science North Carolina State University Ted_Bilderback@ncsu.edu http://www.ces.ncsu.edu/depts/hort/nursery/
Degradation of the resource Fertility loss Organic matter Tilth degradation. Water quality Sediment Nutrients
 Near Blue River ca. 1980 Degradation of the resource Fertility loss Organic matter Tilth degradation Water quality Sediment Nutrients Program cost Cheaper to prevent Still expensive Long-term productivity
BUREAU OF CLEAN WATER
 COMMONWEALTH OF PENNSYLVANIA DEPARTMENT OF ENVIRONMENTAL PROTECTION BUREAU OF CLEAN WATER NATIONAL POLLUTANT DISCHARGE ELIMINATION SYSTEM (NPDES) STORMWATER DISCHARGES FROM SMALL MUNICIPAL SEPARATE STORM
Agricultural Model Data Inputs and Assumptions: Presentation to the Water Quality GIT October, 2014
 Agricultural Model Data Inputs and Assumptions: Presentation to the Water Quality GIT October, 2014 Curtis Dell Chair, Agricultural Modeling Subcommittee USDA-ARS PSWMRU October 8, 2014 Precipitation Phase
Telling Pennsylvania s Local Stories: A Lancaster Example
 Telling Pennsylvania s Local Stories: A Lancaster Example Emily Trentacoste EPA Chesapeake Bay Program Office Matt Johnston University of Maryland Chesapeake Bay Program Office Agriculture Workgroup Meeting
Targeting Best Management in Contrasting Watersheds
 Targeting Best Management in Contrasting Watersheds Andrew Sharpley, Tommy Daniel, Sheri Herron & Bil Gburek University or Arkansas, BMP s Inc. & USDA-ARS ARS Today s s P Cycle is Fragmented Grain P Manure
Fact Sheet. Chesapeake Bay Water Quality
 Fact Sheet Chesapeake Bay Water Quality Water quality is a critical measure of the Chesapeake Bay s health. For the Bay to be healthy and productive, the water must be safe for people and must support
Center for Nutrient Solutions (CNS) Nutrient Solution Scenarios Concept Paper September 5, 2014 Draft
 Nutrient Solution Scenarios Concept Paper September 5, 2014 Draft") I. Introduction Center for Nutrient Solutions (CNS) Nutrient Solution Scenarios Concept Paper September 5, 2014 Draft A key goal of the CNS is to develop and test tools for evaluating tactics and strategies
I. Introduction Center for Nutrient Solutions (CNS) Nutrient Solution Scenarios Concept Paper September 5, 2014 Draft A key goal of the CNS is to develop and test tools for evaluating tactics and strategies
MANAGING PHOSPHORUS LOSSES. Rich. McDowell, AgResearch
 MANAGING PHOSPHORUS LOSSES Rich. McDowell, AgResearch BIOAVAILABILITY: N-, CO-, OR P-LIMITATION Co-Limited Co-Limited 14% 19% N-Limited 13% P-Limited 73% N-Limited 17% P-Limited 64% Where does it come
Small-Scale Farmers and the Environment: How to be a Good Steward
 L P E S Small Farms Fact Sheet series Livestock and Poultry Environmental Stewardship < L P E S > Curriculum : How to be a Good Steward By Mark Rice, North Carolina State University Summary Good stewardship
Modeling the Urban Stormwater (and the rest of the watershed) Katherine Antos, Coordinator Water Quality Team U.S. EPA Chesapeake Bay Program Office
 Katherine Antos, Coordinator Water Quality Team U.S. EPA Chesapeake Bay Program Office") Modeling the Urban Stormwater (and the rest of the watershed) Katherine Antos, Coordinator Water Quality Team U.S. EPA Chesapeake Bay Program Office May 13, 2010 Management Actions Chesapeake Bay Program
Modeling the Urban Stormwater (and the rest of the watershed) Katherine Antos, Coordinator Water Quality Team U.S. EPA Chesapeake Bay Program Office May 13, 2010 Management Actions Chesapeake Bay Program
Nutrient Management in. A presentation to the West Metro Water Alliance
 Nutrient Management in Developing and Agricultural Areas A presentation to the West Metro Water Alliance Chris Meehan, P.E. May 25, 2011 Agenda Physical Improvements Planning Improvements How to get it
Introduction. Definitions of Land Use Terms Used in Spreadsheets. Tar-Pamlico Stormwater Rule 15A NCAC 2B.0258 Last Modified 3/20/2017
 Tar-Pamlico Stormwater Rule 15A NCAC 2B.0258 Last Modified 3/20/2017 Introduction The set of worksheets included in this file will enable stormwater permit applicants to comply with, and local governments
LPES Small Farms Fact Sheets* Small-Scale Farmers and the Environment: How to be a Good Steward. By Mark Rice, North Carolina State University
 LPES Small Farms Fact Sheets* Small-Scale Farmers and the Environment: How to be a Good Steward By Mark Rice, North Carolina State University Summary Good stewardship is important for everyone, including
Understanding Nutrients in the Chesapeake Bay Watershed and Implications for Management and Restoration the EASTERN SHORE
 Understanding Nutrients in the Chesapeake Bay Watershed and Implications for Management and Restoration the EASTERN SHORE Scott W. Ator and Judith M. Denver A summary of U.S. Geological Survey Circular
University of Kentucky College of Agriculture, Food and Environment ID-211. Cooperative Extension Service
 University of Kentucky College of Agriculture, Food and Environment ID-211 Cooperative Extension Service Kentucky Nutrient Management Planning Guidelines (KyNMP) Steve Higgins and Kylie Schmidt, Biosystems
Nutrient Management in Kentucky
 IP-71 Nutrient Management in Kentucky Nutrient Management Focus Group, Environmental and Natural Resource Issues Task Force AGRICULTURE & NATURAL RESOURCES FAMILY & CONSUMER SCIENCES 4-H/YOUTH DEVELOPMENT
Reservoir age, increasing human population,
 B-6249 02/12 Eagle Mountain Watershed Management Brent Clayton, Justin Mechell, David Waidler and Clint Wolfe* Reservoir age, increasing human population, and changing land uses have prompted the development
Permitting Animal Feeding Operations in Maryland
 Permitting Animal Feeding Operations in Maryland Presented by Gary F. Kelman, MS, CEP Chief, Animal Feeding Operation Division Maryland Department of the Environment May 10, 2017 Topics MDE and MDA; Watershed
Appendix 11. Erosion and Sediment Control Management Plan. Appendix 11
 Appendix 11 Erosion and Sediment Control Management Plan Appendix 11 OTAIKA QUARRY - PROPOSED OVERBURDEN DISPOSAL AREA Application for Land Use Consent and Assessment of Environmental Effects Otaika Quarry
Appendix X: Non-Point Source Pollution
 Appendix X: Non-Point Source Pollution Sources Nonpoint source of pollution, unlike pollution from industrial and sewage treatment plants, comes from many different sources. Nonpoint source pollution is
Maryland Phase II WIP Strategies. MONTGOMERY Agriculture - Annual Practices
 Maryland Phase II Strategies MONTGOMERY Agriculture - Annual Practices BMP Name Conservation Tillage Acres/Year 28,436 27,984 27,677 Cover Crop Acres/Year 4,275 10,816 11,000 Cropland Irrigation Management
MANURE MANAGEMENT IMPACTS ON PHOSPHORUS LOSS WITH SURFACE RUNOFF AND ON-FARM PHOSPHORUS INDEX IMPLEMENTATION. AN OVERVIEW OF ONGOING RESEARCH
 MANURE MANAGEMENT IMPACTS ON PHOSPHORUS LOSS WITH SURFACE RUNOFF AND ON-FARM PHOSPHORUS INDEX IMPLEMENTATION. AN OVERVIEW OF ONGOING RESEARCH Antonio P. Mallarino, professor Brett. L. Allen and Mazhar
Economics of Utilizing Poultry Litter from Northwest Arkansas for Eastern Arkansas Crops. K.B. Young, R.I. Carreira, H.L. Goodwin, E.J.
 Economics of Utilizing Poultry Litter from Northwest Arkansas for Eastern Arkansas Crops K.B. Young, R.I. Carreira, H.L. Goodwin, E.J. Wailes Abstract According to a GAMS optimization model, the cost of
BMP Verification: What is it and How Will it Impact Pennsylvania?
 BMP Verification: What is it and How Will it Impact Pennsylvania? Chesapeake Bay Program Conservation District and Agency Staff Meeting March 13, 2017 + over 400 other unique practices approved by the
Description. Installation and Implementation Requirements
 Earth Dike SC-6 Source: Caltrans Construction Site Best Management Practices Manual, 2003. Description Structure that prevents erosion by intercepting, diverting, and conveying surface run-on (storm water
PART 1 GENERAL REQUIREMENTS
 PART 1 GENERAL REQUIREMENTS Contract Closeout Plan 110 Arrow diagram for project close-out...3 Erosion Control 121 Straw bale barrier... 5 122 Silt fence... 7 123 Diversion dike... 9 124 Inlet protection...
Sustainable Production Practices in Mushroom Farming Jean Lonie, AMI Consultant and Laura Phelps, AMI President
 Sustainable Production Practices in Mushroom Farming Jean Lonie, AMI Consultant and Laura Phelps, AMI President U.S. mushroom farmers produce more than 861 million pounds of mushrooms annually, contributing
VILLAGE OF BELLAIRE WATER QUALITY ACTION PLAN
 VILLAGE OF BELLAIRE WATER QUALITY ACTION PLAN Elk-River-Chain-of-Lakes Gaps Analysis Project The Watershed Center Grand Traverse Bay Tip of the Mitt Watershed Council Michigan Department of Natural Resources
Best Management Practices to Minimize Nutrient Losses from Manured Fields. Hailin Zhang. Oklahoma State University
 Best Management Practices to Minimize Nutrient Losses from Manured Fields Hailin Zhang Oklahoma State University Pathways of P Transport Inputs Manure Outputs Fertilizer Erosion of particulate P NPK Release
Livestock and Poultry Environmental Learning Center Webcast Series June 20, From: G. Albrecht P. Ristow
 Nutrient Management Practices for Small Livestock Farms Dr. Michael L. Westendorf Extension Specialist Rutgers University Fred Kelly New Jersey USDA-Natural Resources Conservation Service Basic Nutrient
ORDINANCE # 854. Stormwater Management / Operation and Maintenance Requirements
 ORDINANCE # 854 Stormwater Management / Operation and Maintenance Requirements Section 1. Purpose and Authority In accordance with the provisions of Chapters 98, 124, 126, 440, 444, and 446h of the General
A Nutrient Mass Balance of the Watershed Research and Education Center: Where, When and How Much?
 A Nutrient Mass Balance of the Watershed Research and Education Center: Where, When and How Much? BRIAN E. HAGGARD, JOHN T. METRAILER, DIRK PHILIPP, J. VAUGHN SKINNER, J. THAD SCOTT, AND ANDREW N. SHARPLEY
Agricultural Production in the United States: Second Report, (Version 2), December Available at:
, December Available at:") U.S. Environmental Protection Agency Office of Environmental Information Docket Docket ID No. EPA-HQ-OA-2013-0582 1200 Pennsylvania Avenue NW. Washington, DC 20460 RE: U.S. EPA Draft Report: Connectivity
U.S. Environmental Protection Agency Office of Environmental Information Docket Docket ID No. EPA-HQ-OA-2013-0582 1200 Pennsylvania Avenue NW. Washington, DC 20460 RE: U.S. EPA Draft Report: Connectivity
Report for 2001SD1941B: Alternative Conservation Practices to Improve Soil and Water Quality
 Report for 2001SD1941B: Alternative Conservation Practices to Improve Soil and Water Quality Other Publications: Kathol, John. 2002. Using a Precipitation-Runoff Model to Predict Runoff for Frequency Based
Chesapeake Bay Program Watershed Modeling. Gary Shenk, Lewis Linker, Rich Batiuk Presentation to STAC 3/22/2011
 Chesapeake Bay Program Watershed Modeling Gary Shenk, Lewis Linker, Rich Batiuk Presentation to STAC 3/22/2011 1 Chesapeake Bay Partnership Models 2 Recent History of the Chesapeake Bay Program s Watershed
Wintering in Southland and South Otago
 Wintering in Southland and South Otago A land management guide to good environmental practice TEAR OUT WINTERING PLANNER INCLUDED Wintering Good environmental practice Winter in the southern South Island
Commercial Poultry. Interested Landowners and Nature By Mike Dryden
 Commercial Poultry V O L U M E 3, I S S U E 1 N E W S L E T T E R A P R I L 2 0 1 4 New Commodity Crop to Benefit Interested Landowners and Nature By Mike Dryden I N S I D E T H I S I S S U E : New Commodity
HOW CHANGES IN NUTRIENT MANAGEMENT REGULATIONS WILL AFFECT FORAGE PRODUCTION
 HOW CHANGES IN NUTRIENT MANAGEMENT REGULATIONS WILL AFFECT FORAGE PRODUCTION Dick Wolkowski and Larry Bundy Department of Soil Science University of Wisconsin What are the issues Forage producers typically
EXECUTIVE SUMMARY DES PLAINES RIVER WATERSHED-BASED PLAN WHY A WATERSHED-BASED PLAN? WHAT IS A WATERSHED?
 Des Plaines River Watershed-Based Plan EXECUTIVE SUMMARY June 2018 EXECUTIVE SUMMARY DES PLAINES RIVER WATERSHED-BASED PLAN WHY A WATERSHED-BASED PLAN? Water is elemental to our lives. Plants and animals,
Straw Bale Barrier. - Along the face and at grade breaks of exposed and erodible slopes to shorten slope length and spread runoff as sheet flow
 Straw Bale Barrier SE-9 Objectives EC Erosion Control SE Sediment Control TR Tracking Control WE Wind Erosion Control Non-Stormwater NS Management Control Waste Management and WM Materials Pollution Control
City of Texarkana, Arkansas. Storm Water Pollution
 City of Texarkana, Arkansas Storm Water Pollution STORM WATER GUIDE What is Storm Water Pollution? Stormwater can provide a toxic discharge which can enter into a lake, river or coastal water system. As
Conservation Practices. Conservation Choices. These five icons will show the benefits each practice offers... 6/4/2014
 Conservation Choices Your guide to conservation and environmental farming practices. Conservation Choices These five icons will show the benefits each practice offers... The practice reduces soil erosion
Passive Phosphorus Removal Systems
 Passive Phosphorus Removal Systems Chad Penn, Josh Payne, Jeff Vitale: Oklahoma State University Josh McGrath: University of Maryland Delia Haak: Illinois River Watershed Partnership P FILTER BACKGROUND
Manure Management Plan Nutrient Balance Worksheet User Guide Completing Nutrient Balance Worksheets for Manure Management Plans
 Manure Management Plan Nutrient Balance Worksheet User Guide Completing Nutrient Balance Worksheets for Manure Management Plans The Manure Management Plan (MMP) must include manure application rates for
Module 2: Basic Stormwater Principles
 Module 2: Basic Stormwater Principles 2a. Overview... 2 Inspectors and stormwater management...2 Definition of stormwater runoff...3 VSMP technical criteria...3 Environmental Site Design...4 Best management
Typical Local Erosion Control Requirements (Storm Water Management Authority, Inc.)
") Module 2: Selection of Controls and Site Planning for Construction Site Erosion Prevention Robert Pitt Department of Civil, Construction, and Environmental Engineering University of Alabama Tuscaloosa,
Module 2: Selection of Controls and Site Planning for Construction Site Erosion Prevention Robert Pitt Department of Civil, Construction, and Environmental Engineering University of Alabama Tuscaloosa,
Port of Brisbane Stormwater Management
 Port of Brisbane Stormwater Management The Port of Brisbane Pty Ltd is committed to managing our activities to help protect our surrounding natural environment and ensuring our Port operations do not adversely
Role of Soils in Water Quality. Mike Marshall Extension Associate Texas A&M-Institute of Renewable Natural Resources
 Role of Soils in Water Quality Mike Marshall Extension Associate Texas A&M-Institute of Renewable Natural Resources Water Quality in Texas Water is a finite resource that can be impaired by pollution from
Wisconsin s Improving Nutrient Management WI Dept. of Agriculture, Trade and Consumer Protection
 Wisconsin s Improving Nutrient Management Sue.Porter@WI.gov 608-224-4605 WI Dept. of Agriculture, Trade and Consumer Protection 2011 NM Highlights 1.8 M acres planned in 2011 up 23% 238 more farmers wrote
Manure Applications on Frozen and Snow Covered Soils
 Manure Applications on Frozen and Snow Covered Soils Kevan Klingberg University of Wisconsin Discovery Farms / Extension Livestock & Poultry Environmental Learning Center Webcast January 25, 2013 Negative
LPES Small Farms Fact Sheets* Got Barnyard Runoff? By Chris Henry, University of Nebraska-Lincoln, and Joe Harner, Kansas State University
 LPES Small Farms Fact Sheets* By Chris Henry, University of Nebraska-Lincoln, and Joe Harner, Kansas State University Summary Uncontrolled runoff from barnyards and open lots can contain nutrients and
ORDINANCE APPENDIX C RUNOFF COEFFICIENTS AND CURVE NUMBERS
 ORDINANCE APPENDIX C RUNOFF COEFFICIENTS AND CURVE NUMBERS TABLE C-1. RUNOFF CURVE NUMBERS Source: Table 2-2a, Table 2-2b, and Table 2-2c from U. S. Department of Agriculture, Natural Resources Conservation
Produced by Virginia Cooperative Extension, Virginia Tech, 2018
 Publication CSES-22P Manure Injection in No-Till and Pasture Systems Rory Maguire, Professor, School of Plant and Environmental Sciences, Virginia Tech Douglas Beegle, Professor, Crop and Soil Sciences,
Mississippi River Basin Healthy Watersheds Initiative
 Helping People Help the Land www.nrcs.usda.gov Mississippi River Basin Healthy Watersheds Initiative Overview To improve the health of the Mississippi River Basin, including water quality and wildlife
Manure Management Manual Revisions
 Manure Management Manual Revisions Jim Spontak PA DEP Farms In PA 63,136 farms in PA 33813 have livestock Average farm is 124 acres, about 75% under 200 acres Women as the primary farm operator increased
Appendix 12. Pollutant Load Estimates and Reductions
 Appendix 12. Pollutant Load Estimates and Reductions A pollutant loading is a quantifiable amount of pollution that is being delivered to a water body. Pollutant load reductions can be calculated based
storage There are three basic systems for storing liquid SYSTEM DESCRIPTIONS
 There are three basic systems for storing liquid manure: formed tanks, earthen basins, and lagoons. The type of storage affects the manure volume, the nutrient concentration, and ultimately, the land application
Eliminating Runoff Water from Your Farm
 SUSTAINABLE AGRICULTURE TECHNIQUES Ext/CrS 142 August 2012 SUSTAINABLE AGRICULTURE TECHNIQUES Eliminating Runoff Water from Your Farm J.L. Harden, K.M. Foley, C.C. Shock, and T.K. Welch Figure 1. Runoff
E. STORMWATER MANAGEMENT
 E. STORMWATER MANAGEMENT 1. Existing Conditions The Project Site is located within the Lower Hudson Watershed. According to the New York State Department of Environmental Conservation (NYSDEC), Lower Hudson
What Does It All Mean? CWA? Sara Esposito, P.E. DNREC Division of Watershed Stewardship
 What Does It All Mean? CWA? Sara Esposito, P.E. DNREC Division of Watershed Stewardship sara.esposito@state.de.us Why are we here? Just like pavement has helped move cars faster; it has also helped water
Lake Creek Watershed Management Plan Public Meeting. Arrowhead Lake May 3, :00 PM
 Lake Creek Watershed Management Plan Public Meeting Arrowhead Lake May 3, 2018 6:00 PM Agenda I. Welcome and Introductions II. III. IV. Watershed Basics Overview of Lake Creek Watershed Elements of a Successful
Dry Matter Intake and Manure Production for Management Intensively Grazed Dairy Cattle
 Understanding Nutrient & Sediment Loss at Breneman Farms - 7 Introduction Dry Matter Intake and Manure Production for Management Intensively Grazed Dairy Cattle Fall 2009 Kevan Klingberg, Dennis Frame,
E3 Model Scenario Purpose and Definitions
 E3 Model Scenario Purpose and Definitions Gary Shenk (USGS) Jeff Sweeney (EPA) Chesapeake Bay Program Office Water Quality GIT Meeting August 14, 2017 Documentation of E3 and Planning Targets Chesapeake
Phosphorus Kyle Minks Land and Water Resources Scientist Land Conservation Division
 Phosphorus Kyle Minks Land and Water Resources Scientist Land Conservation Division Overview Phosphorus 101 Phosphorus transport What is legacy phosphorus How phosphorus is managed to reduce environmental
BMP 5.4.2: Protect /Conserve/Enhance Riparian Areas
 BMP 5.4.2: Protect /Conserve/Enhance Riparian Areas The Executive Council of the Chesapeake Bay Program defines a Riparian Forest Buffer as "an area of trees, usually accompanied by shrubs and other vegetation,
Wakefield Lake TMDL Public Meeting 3/17/2014. Jen Koehler, PE Barr Engineering
 Wakefield Lake TMDL Public Meeting 3/17/2014 Jen Koehler, PE Barr Engineering Outline Project Contacts Introduction to Wakefield Lake Thoughts/Questions/Concerns About TMDL Studies Lake Water Quality and
PA Chesapeake Bay Phase II Watershed Implementation Plan Schuylkill County Planning Targets
 PA Chesapeake Bay Phase II Watershed Implementation Plan Schuylkill County Planning Targets What are Planning Targets? The Chesapeake Bay TMDL established regulatory waste load allocations and load allocations
4. Ponds and infiltration BMPs can achieve 60 to 100% removal efficiencies for sediment.
 Landscape BMPs For the purposes of this project, preventive measures have been categorized into two categories: landscape BMPs and source prevention BMPs. Landscape BMPs includes both vegetative practices
Annual Phosphorus Loss Estimator (APLE) Model Sensitivity Analysis. Guido Yactayo - UMCES
 Model Sensitivity Analysis. Guido Yactayo - UMCES") Annual Phosphorus Loss Estimator () Model Sensitivity Analysis Guido Yactayo - UMCES 4-22-5 Objectives To implement 2.4 in our suite of models To estimate model sensitivity to change in phosphorus inputs
Annual Phosphorus Loss Estimator () Model Sensitivity Analysis Guido Yactayo - UMCES 4-22-5 Objectives To implement 2.4 in our suite of models To estimate model sensitivity to change in phosphorus inputs
Maryland Nutrient Management Program
 Maryland Nutrient Management Program Nutrient management planning plays a key role in reducing nutrients from agricultural non-point sources Maryland Nutrient Management Program (MNMP) was established
Straw Bale Barrier. Parallel to a roadway to keep sediment off paved areas
 Categories EC Erosion Control SE Sediment Control TC Tracking Control WE Wind Erosion Control Non-Stormwater NS Management Control Waste Management and WM Materials Pollution Control Legend: Primary Objective
CHAPTER 15 WATER POLLUTION. INTO THE GULF Researchers try to pin down what s choking the Gulf of Mexico
 CHAPTER 15 WATER POLLUTION INTO THE GULF Researchers try to pin down what s choking the Gulf of Mexico SAVING THE BAY Teams of researchers try to pin down what s choking the Chesapeake Water pollution
1985 Scenario Scenario. Tributary Strategy Scenario. Appendix J
 Appendix J Key Chesapeake Bay TMDL Reference and Management Modeling Scenarios: Definitions and Descriptions 1985 Scenario This scenario uses the estimated 1985 land uses, animal numbers, atmospheric deposition,
Nutrient Management Issues in Tennessee
 Nutrient Management Issues in Tennessee CAFOs in Tennessee 2.1 million head of beef cattle = no CAFOs Tennessee s dairy herd is about 90,000 head and diminishing rapidly Swine industry in Tennessee also
Guidance on each of the 23 basic elements follows: Plan Index showing locations of required items: The plan index should include a list of the
 Guidance on each of the 23 basic elements follows: A1 Plan Index showing locations of required items: The plan index should include a list of the required items in the rule and where they occur in the
Silver Lake Watershed Management Plan. F. X. Browne, Inc.
 Silver Lake Watershed Management Plan F. X. Browne, Inc. Eutrophication Trophic means food or energy level Oligotrophic ecologically young lake with low nutrients, low populations of algae and macrophytes
Guidance Document for Storm Water Pollution Prevention Plan (SWPPP) Submittal. A2 Plat showing building lot numbers/boundaries and road layout/names:
 Submittal. A2 Plat showing building lot numbers/boundaries and road layout/names:") Exhibit SW12-3 Page 1 of 10 Guidance Document for Storm Water Pollution Prevention Plan SECTION A CONSTRUCTION PLAN ELEMENTS A1 Plan Index showing locations of required items: The plan index should include
Exhibit SW12-3 Page 1 of 10 Guidance Document for Storm Water Pollution Prevention Plan SECTION A CONSTRUCTION PLAN ELEMENTS A1 Plan Index showing locations of required items: The plan index should include
Simple Method for Estimating Phosphorus Export
 Appendix L Simple Method for Estimating Phosphorus Export 1. The Simple Method The Simple Method is a technique used for estimating storm pollutant export delivered from urban development sites. The method
CAFO Fact Sheet series Fact Sheet #12: CAFO Requirements for the Beef Production Area By Brent Auvermann, Texas A&M University
 CAFO Fact Sheet series Fact Sheet #12: CAFO Requirements for the Beef Production Area By Brent Auvermann, Texas A&M University Disclaimer This fact sheet reflects the best professional judgment of the
Chapter 3: Post Construction Water Quality Best Management Practices
 Chapter 3: Post Construction Water Quality Best Management Practices 3.1 Introduction to Stormwater Quality Under the regulations governing the NPDES Stormwater Phase II program, Montgomery County is required
Edge-of-Field Monitoring
 Edge-of-Field Monitoring Karma Anderson Water Quality Specialist National Water Quality and Quantity Team NRCS Edge-of-Field Monitoring NRCS WQ monitoring first introduced in 2010 as Interim CPS 799 in
Assessment Schedule 2013 Agricultural and Horticultural Science: Analyse a New Zealand primary production environmental issue (91532)
") NCEA Level 3 Agricultural and Horticultural Science (91532) 2013 page 1 of 6 Assessment Schedule 2013 Agricultural and Horticultural Science: Analyse a New Zealand primary production environmental issue
NCEA Level 3 Agricultural and Horticultural Science (91532) 2013 page 1 of 6 Assessment Schedule 2013 Agricultural and Horticultural Science: Analyse a New Zealand primary production environmental issue
Discovery Farms Minnesota N and P, what is happened in Farm Fields? Jerome Lensing January 9, 10, 11, 2018 AgVise Labs
 Discovery Farms Minnesota N and P, what is happened in Farm Fields? Jerome Lensing January 9, 10, 11, 2018 AgVise Labs Jerome.lensing@hotmail.com Discovery Farms is a farmer led water quality research
Filtering phosphorus out of surface runoff with a phosphorus removal structure
 Filtering phosphorus out of surface runoff with a phosphorus removal structure Dustin Stoner, Chad Penn, and Jason Warren Department of Plant and Soil Science Oklahoma State University chad.penn@okstate.edu
Modeling the Influence of Agricultural Practices on Watershed Export of Phosphorus
 Modeling the Influence of Agricultural Practices on Watershed Export of Phosphorus Rem Confesor Jr., Ph.D. Sr. Research Scientist NCWQR, Heidelberg University 310 E. Market St., Tiffin, OH rconfeso@heidelberg.edu
Using AnnAGNPS to Evaluate On-Farm Water Storage Systems (OFWS) as a BMP for Nutrient Loading Control in a Small Watershed in East Mississippi
 as a BMP for Nutrient Loading Control in a Small Watershed in East Mississippi") Using AnnAGNPS to Evaluate On-Farm Water Storage Systems (OFWS) as a BMP for Nutrient Loading Control in a Small Watershed in East Mississippi Ritesh Karki Graduate Student, Mississippi State University
Using AnnAGNPS to Evaluate On-Farm Water Storage Systems (OFWS) as a BMP for Nutrient Loading Control in a Small Watershed in East Mississippi Ritesh Karki Graduate Student, Mississippi State University
BUREAU OF WATERSHED MANAGEMENT PROGRAM GUIDANCE. Feed Storage Area Runoff Controls for CAFOs X/X/2016. EGAD Number: 3800-XXXX-XX
 The Feed Storage Area Runoff Controls for CAFOs guidance was developed to provide assistance to the DNR Runoff Management Program, CAFO owners and operators, and consultants who work with CAFOs. The guidance
This section provides useful information on the characteristics of soil and important soil management practices.
 7.0 SOIL MANAGEMENT This section provides useful information on the characteristics of soil and important soil management practices. What Is Soil? The four main components of soil are mineral and organic
Action Packet for Agriculture
 Pennsylvania Water Quality Action Packet for Agriculture A Self Assessment and Planning Tool for Water Quality Protection Under the PA Clean Streams Law Funded by Pennsylvania Department of Environmental