Development and Application of a Nutrient Attenuation Assessment Methodology for Chesapeake Bay Watershed Onsite Wastewater Treatment Systems
|
|
|
- Lydia Craig
- 5 years ago
- Views:
Transcription

1 Development and Application of a Nutrient Attenuation Assessment Methodology for Chesapeake Bay Watershed Onsite Wastewater Treatment Systems November 14, 2017 Victor D Amato, PE
2 Outline Development: Chesapeake Bay Expert Panel on Nutrient Attenuation in OWTS Background Approach/conceptual framework Results Caveats and recommendations Application: Maryland OWTS Gap Closer Analysis Project objectives and approach Results of analysis Implications and next steps
3 ChesBay OWTS Attenuation Panel History On-Site Wastewater Treatment Systems Nitrogen Reduction Technologies Panel Initial BMP report approved in February 2014 Currently considering two additional BMPs Attenuation Panel formed in June 2014 Approximately 20 conference calls/meeting Approx. 13 engineers, 10 soil scientists, 4 modelers, 3 geologists, 2 hydrologists, others Final report approved in October 3
4 Attenuation Panel Charge Review available science on how to factor nutrient attenuation into Chesapeake Bay TMDL onsite wastewater treatment system load estimates and BMP efficiency factors Determine whether the Bay TMDL model can be improved by using variable total nitrogen (TN) attenuation rates Determine whether the currently used 100% removal of total phosphorus (TP) is warranted Recommend methodologies to be used and specific attenuation rates to be used in different contexts
5 Methods Develop conceptual framework for evaluating and reporting nutrient removal in OWTS Literature review Modeling, which was used to corroborate findings from the literature STUMOD (Soil Treatment Unit Model) by CSM SPARROW (Spatially Referenced Regression on Watershed Attributes) by USGS

6 Current CBP OWTS Assumptions Panel Task: can we improve upon 20% and 60% TN reduction assumptions throughout watershed?
7 Attenuation Panel Conceptual Framework
8 Zone Descriptions Zone 1 Soil-Based Treatment Zone Extends cm below infiltrative surface; outer edge similar to current edge-of-drainfield Defined by biogeochemistry induced by wastewater infiltration CBP currently assumes 20% TN reduction watershed-wide Zone 2 Vadose Zone TN reduction magnitude and rates similar to background conditions Typically insignificant TN reduction in comparison to other zones Zone 3 Groundwater Zone Mostly horizontal flow toward outlet/stream TN reduction function of decay rate and travel time TN reduction varies with hydrogeomorphology Zone 4 Transitional Zones Includes floodplain and riparian areas, hyporheic zone, small streams TN reductions can be significant (e.g., >50%) Being partially addressed by other CBP efforts CBP currently assumes 60% for Zones 2-4 watershed-wide
9 TN Reductions in OWTS Components Component Comment Exsitu unit 1 (e.g., septic tank) No TN reduction assumed in septic tank (e.g., TN = 5 kg/cap /day) Exsitu unit 2 (e.g., intermittent sand filter) Insitu Zone 1 (Soil-Based Treatment) Insitu Zone 2 (Vadose Zone) Insitu Zone 3 (Groundwater Zone) Insitu Zone 4 (Transitional Zones) TN reductions based on CBP approved BMP credits Varies by soil texture, based on STUMOD and field observations Assumed low in comparison to Zones 1 and 3; not explicitly addressed by Panel Varies by physiography and geology, informed by SPARROW modeling and field observations Small stream and riparian processing being partially addressed by other CBP efforts
10 Zone 1 Results and Recommendation Soil textural class Loading rate (cm/day) TN reduction for a specified depth to groundwater and actual hydraulic loading rate applied 30 cm/100% 30 cm/50% 60 cm/100% 60 cm/50% Sand 4 7% 16% 16% 31% Loamy sand 4 Sandy loam 3 Loam 3 Silt loam % 30% 34% 59% Clay loam 1.8 Sandy clay loam 1.8 Silty clay loam 1.8 Silt 1.8 Sandy clay 1 29% 54% 54% 80% Silty clay 1 Clay 1

11 Zone 1 Implications Change to spatially variable Zone 1 TN reduction rates results in a total OWTS sector load decrease of approximately 4 percent ~ 3 percent increase for sandy soils ~ 16 percent decrease for loamy soils ~ 45 percent decrease for clayey soils
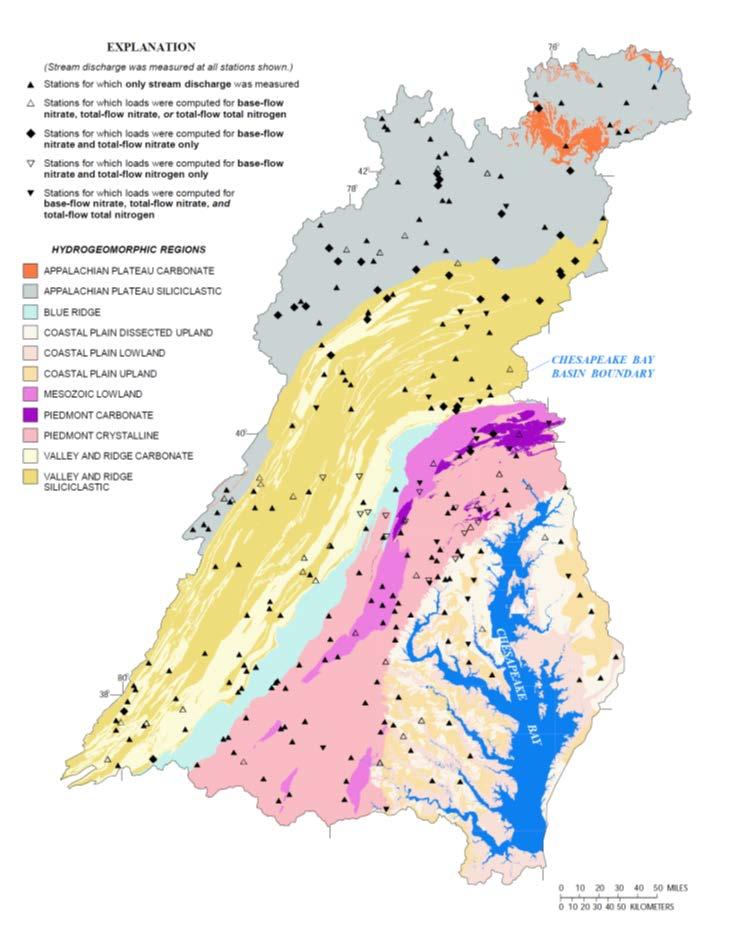
12 Zone 3 Results and Recommendation Hydrogeomorphic Region 1 Relative TN Transmission Classification Recommended Zone 3 Attenuation Factor (Transmission Factor) Fine Coastal Plain - Coastal Lowlands Low 75% (25%) Fine Coastal Plain - Alluvial and Estuarine Valleys Low 75% (25%) Fine Coastal Plain - Inner Coastal Plain - Upland Sands and Gravels Medium 60% (40%) Fine Coastal Plain - Middle Coastal Plain mixed sediment texture Medium 60% (40%) Fine Coastal Plain - Middle Coastal Plain fine sediment texture Low 75% (25%) Coarse Coastal Plain - Middle Coastal Plain Sands with Overlying Gravels (also dissected) High 45% (55%) Coarse Coastal Plain - Inner Coastal Plain - Dissected Outcrop Belt High 45% (55%) Crystalline Piedmont High 45% (55%) Crystalline Blue Ridge High 45% (55%) Carbonate Piedmont Very High 35% (65%) Carbonate Valley and Ridge Very High 35% (65%) Carbonate Appalachian Plateau Very High 35% (65%) Siliciclastic Mesozoic Lowland High 45% (55%) Siliciclastic Valley and Ridge Medium 60% (40%) Siliciclastic Appalachian Plateau Low 75% (25%)

13 Zone 3 Implications
14 Overall Panel Recommendations Soil Textural Classification USDA Soil Textures Low TN Transmission Area Medium TN Transmission Area High TN Transmission Area Very High TN Transmission Area Sandy Sand, Loamy Sand, Sandy Loam, Loam 1.1 kg/cap/yr (-31%) 1.7 kg/cap/yr (6%) 2.3 kg/cap/yr (44%) 2.7 kg/cap/yr (69%) Loamy Silt loam, Clay Loam, Sandy Clay Loam, Silty Clay Loam, Silt 0.8 kg/cap/yr (-50%) 1.3 kg/cap/yr (-19%) 1.8 kg/cap/yr (13%) 2.1 kg/cap/yr (31%) Clayey Sandy Clay, Silty Clay, Clay 0.6 kg/cap/yr (-63%) 0.9 kg/cap/yr (-44%) 1.3 kg/cap/yr (-19%) 1.5 kg/cap/yr (-6%) Represents delivery to Zone 4 (additional removal possible) Change from current CBP load (1.6 kg/cap/yr) in parentheses
15 Caveats Recommendations are generally applicable to modern conventional OWTS in the Chesapeake Bay watershed Some conservatism built into Zone 1 estimates to account for OWTS performing suboptimally Some conservatism built into Zone 3 to account for uncertainties Panel did not explicitly discriminate between modern and legacy systems Numerous factors can have an impact on nutrient reductions in OWTS Cannot define factors nor determine how they vary from system to system Findings and recommendations represent average systems within the context (i.e., soil texture for Zone 1, hydrogeomorphic region for Zone 3) Care should be taken when using the findings to draw inferences about specific individual systems or in areas known to include an unusually high percentage of legacy or malfunctioning systems
16 Recommendations for Future Efforts Improve understanding of factors affecting nutrient processing Additional, deeper literature and existing data reviews Collect new empirical and modeling data, including better documentation of existing systems and sites within the watershed Address phosphorus treatment and attenuation Explicitly differentiate between conventional OWTS, and malfunctioning and legacy systems Consider BMPs for reducing malfunctions and upgrading legacy systems Consider time distribution of load delivery Long-term system lags that might impact nutrient loading dynamics Short-term nutrient load delivery dynamics (e.g., stormflows) Travel time with respect to Zone 3 TN load reduction estimates
17 Maryland Gap Closer Analysis for Chesapeake Bay TMDL Implementation US EPA funded support for states to implement Chesapeake Bay nutrient TMDL Objective Help determine how to best reduce Chesapeake Bay Watershed nitrogen loading from OWTS in Maryland Approach First assess the relative nitrogen loading associated with individual systems to establish priority: Nutrient Loading Analysis Then assess the most appropriate approach for reducing nutrient loading associated with individual systems: Nutrient Reduction Analysis GIS analysis of ~420,000 existing individual onsite systems
 proximity to streams proximity to lakes and ponds proximity to Bay tidal waters watershed vulnerability housing")
18 Nutrient Loading Analysis Indicators system age soil suitability (depth to restrictive layer, saturated hydraulic conductivity, and drainage class) proximity to streams proximity to lakes and ponds proximity to Bay tidal waters watershed vulnerability housing density

19 Nutrient Reduction Analysis Indicators parcel size proximity to collection systems proximity to large parcels Results 216,737 onsite upgrades 93,901 advanced cluster systems 106,652 sewer connections

20 Eastern Shore - North

21 Meadows Sewer District: Parcel Prioritization Map

22 Meadows Sewer District: Multiple Cluster Option Cost effective Sewer connection $22K/home Single cluster $12.8K/home Multi-cluster $8.8K/home Smaller clusters?
23 Conclusions and Recommendations Inventory-Prioritize-Management framework for addressing OWTS in CBW Refine GIS analyses to identify priority areas Use Attenuation Panel results with distance related delivery rates Mine existing records and collaborate with local staff to fill data gaps Consider other important attributes (e.g., management capacity) Develop specific implementation plans for nutrient reduction noting that soil treatment can be very effective Build program capacity for implementation Develop costing and decision-making tools Help adapt administration of SRF, other funding programs Pilots, demonstrations, studies

24 Conclusions and Recommendations Improve understanding of nutrient reduction in OWTS Use Attenuation Panel results with distance related delivery rates Consider legacy systems, malfunctions, etc. Consider fate and transport mechanisms
25 Contact Information Victor A. D'Amato, PE Tetra Tech Engineering, P.C. P.O. Box Park Drive, Suite 200 Research Triangle Park, NC Direct: victor.damato@tetratech.com
Nutrient Attenuation in Chesapeake Bay Watershed Onsite Wastewater Treatment Systems
 Nutrient Attenuation in Chesapeake Bay Watershed Onsite Wastewater Treatment Systems September 1, 2016 Victor D Amato Panel History On-Site Wastewater Treatment Systems Nitrogen Reduction Technologies
Onsite Wastewater Treatment System Nutrient Management for the Eastern Shore of Maryland
 Onsite Wastewater Treatment System Nutrient Management for the Eastern Shore of Maryland December 14, 2016 Victor D Amato, PE Outline Maryland OWTS Gap Closer Analysis Project objectives and approach Results
DEVELOPMENT AND APPLICATION OF A NUTRIENT ATTENUATION ASSESSMENT METHODOLOGY FOR CHESAPEAKE BAY WATERSHED ONSITE WASTEWATER TREATMENT SYSTEMS
 DEVELOPMENT AND APPLICATION OF A NUTRIENT ATTENUATION ASSESSMENT METHODOLOGY FOR CHESAPEAKE BAY WATERSHED ONSITE WASTEWATER TREATMENT SYSTEMS Victor A. D Amato, PE 1 ABSTRACT The United States Environmental
Development and Application of a Nutrient Attenuation Assessment Methodology for Chesapeake Bay Watershed Onsite Wastewater Treatment Systems
 Development and Application of a Nutrient Attenuation Assessment Methodology for Chesapeake Bay Watershed Onsite Wastewater Treatment Systems October 23, 2017 Victor D Amato, PE Outline Development: Chesapeake
Chesapeake Bay Watershed and North Carolina Piedmont Project Experiences
 Reducing Nutrient Loading from Onsite Wastewater Systems Chesapeake Bay Watershed and North Carolina Piedmont Project Experiences Victor A. D Amato, PE Presentation outline Introduction - Nutrient removal
SUPPORTING CHESAPEAKE BAY RESTORATION BY MODELING NUTRIENT SOURCES AND TRANSPORT
 SUPPORTING CHESAPEAKE BAY RESTORATION BY MODELING NUTRIENT SOURCES AND TRANSPORT USGS and EPA Applications and Results of SPARROW Models Goals Update on recently released SPARROW models of Nitrogen and
On-Site Wastewater Treatment Systems Nitrogen Reduction Technology Expert Review Panel. Drip Irrigation and Peat Treatment System BMP Review
 On-Site Wastewater Treatment Systems Nitrogen Reduction Technology Expert Review Panel Drip Irrigation and Peat Treatment System BMP Review May 1, 2018 Marcia J. Degen VA Department of Health Victor D
SUPPORTING CHESAPEAKE BAY RESTORATION BY MODELING NUTRIENT AND SEDIMENT SOURCES AND TRANSPORT
 SUPPORTING CHESAPEAKE BAY RESTORATION BY MODELING NUTRIENT AND SEDIMENT SOURCES AND TRANSPORT Applications and Results of SPARROW Models John W. Brakebill jwbrakeb@usgs.gov Scott W. Ator swator@usgs.gov
Chesapeake Bay s Problems
 Environmental Issues for the Chesapeake Bay Russ Perkinson Virginia State Feed Association Conference February 16, 2011 Chesapeake Bay s Problems Congressional appropriation of $27 million for six year
Presentation of Final Report to Water Quality Goal Implementation Team
 On-Site Wastewater Treatment Systems Nitrogen Reduction Technology Expert Review Panel Presentation of Final Report to Water Quality Goal Implementation Team July 14, 2014 Marcia J. Degen, Ph.D., PE VA
Restoring the Water-Quality Conditions in the Chesapeake Bay: What is working and what still needs to be done
 Restoring the Water-Quality Conditions in the Chesapeake Bay: What is working and what still needs to be done Scott Phillips, USGS Water-Quality Goal Team January 12, 2015 Many Contributors Authors: Christina
DRAFT. Tidal Trends in Water Quality: Potomac River 2017 Tributary Summary
 DRAFT Tidal Trends in Water Quality: Potomac River 2017 Tributary Summary Sept 26, 2018 1 Contents 1. Location... 3 1.1 Watershed Physiography... 3 1.2 Tidal Waters and Stations... 4 2. Tidal Water Quality
Natural Resources & Environmental Stewardship
 Natural Resources & Environmental Stewardship Fundamentals of Nutrient Management Melissa L. Wilson Department of Environmental Science & Technology Ag Nutrient Management Program University of Maryland,
On-site Systems and Groundwater Washington State Department of Health February 6, 2014
 On-site Systems and Groundwater Washington State Department of Health February 6, 2014 1 Nancy Darling, LHG, CPSS Office of Shellfish and Water Protection Key Groundwater Considerations Type and strength
URBAN STREAM RESTORATION BMP
 FREQUENTLY ASKED QUESTIONS: URBAN STREAM RESTORATION BMP OVERVIEW In May of 2013, the Water Quality Goal Implementation Team (WQGIT) approved the Final Recommendations of the Expert Panel to Define Removal
Incorporating monitoring, modeling and trends analyses into management decisions: a Choptank River example
 Incorporating monitoring, modeling and trends analyses into management decisions: a Choptank River example Emily Trentacoste, PhD EPA Chesapeake Bay Program WQGIT Meeting 7/10/2017 DRAFT. DO NOT CITE OR
Proposed Drip Irrigation BMP
 On-Site Wastewater Treatment Systems Nitrogen Reduction Technology Expert Review Panel Proposed Drip Irrigation BMP July 23, 2018 Marcia J. Degen VA Department of Health Victor D Amato Tetra Tech 1 1 Agenda
ITAT Workshop on Integrating Findings to Explain Water Quality Change
 ITAT Workshop on Integrating Findings to Explain Water Quality Change December 12-13, 2017 Annapolis, MD STAC publication 18-005 1 Workshop Purpose Interdisciplinary Dialogue To convene research synthesis
FREQUENTLY ASKED QUESTIONS: URBAN STREAM RESTORATION BMP. David Wood Chesapeake Stormwater Network. Lisa Fraley-McNeal Center for Watershed Protection
 FREQUENTLY ASKED QUESTIONS: David Wood Chesapeake Stormwater Network URBAN STREAM RESTORATION BMP Lisa Fraley-McNeal Center for Watershed Protection Bill Stack Center for Watershed Protection FREQUENTLY
Modeling the Urban Stormwater (and the rest of the watershed) Katherine Antos, Coordinator Water Quality Team U.S. EPA Chesapeake Bay Program Office
 Katherine Antos, Coordinator Water Quality Team U.S. EPA Chesapeake Bay Program Office") Modeling the Urban Stormwater (and the rest of the watershed) Katherine Antos, Coordinator Water Quality Team U.S. EPA Chesapeake Bay Program Office May 13, 2010 Management Actions Chesapeake Bay Program
Modeling the Urban Stormwater (and the rest of the watershed) Katherine Antos, Coordinator Water Quality Team U.S. EPA Chesapeake Bay Program Office May 13, 2010 Management Actions Chesapeake Bay Program
Background. Literature Review
 Ms. Joanna Helms Economic Development Director Town of Apex 73 Hunter Street P.O. Box 250 Apex, North Carolina 27502 October 23, 2015 Reference: Report of Wetland Determination Cash Perkins Site ECS Project
Appendix A Literature Review - Septic System Performance Criteria, Technologies, and Cost Factors
 Appendix A Literature Review - Septic System Performance Criteria, Technologies, and Cost Factors TECHNICAL MEMORANDUM Appendix A - Literature Review Septic System Performance Criteria, Technologies,
TP Reduction Efficiency
 MassDEP Appendix 1 Last Updated: February 9, 2011 page 1/8 Non-Point Source Best Management Practices and Efficiencies currently used in Scenario Builder Values in parentheses are in progress of official
Proposal for Responsive STAC Workshop: Chesapeake Bay Program Climate Change Modeling 2.0
 Proposal for Responsive STAC Workshop: Chesapeake Bay Program Climate Change Modeling 2.0 Steering Committee *Confirmed Co-Chair: Mark Bennett (USGS)*: CBP Climate Resiliency Workgroup Co-Chair and Director
Chesapeake Bay Program Indicator Analysis and Methods Document Reducing Pollution Indicators Updated May 2018
 1 Chesapeake Bay Program Indicator Analysis and Methods Document Reducing Pollution Indicators Updated May 2018 Indicator Title: Reducing Pollution Relevant Outcome(s): 2017 Watershed Implementation Plans
Full Title of Priority: Enhanced Analysis and Explanation of Water-Quality Data for the TMDL Mid-Point Assessment
 MIDPOINT ASSESSMENT PRIORITY WORK PLAN: MEASURE AND EXPLAIN WATER-QUALITY CHANGES LEAD: SCIENTIFIC, TECHNICAL ANALYSIS, AND REPORT (STAR) TEAM 2016-17 EXPECTATIONS Full Title of Priority: Enhanced Analysis
Urban Stream Restoration Expert Panel March 4, 2013
 Urban Stream Restoration Expert Panel March 4, 2013 Tom Schueler, Chesapeake Stormwater Network Bill Stack, Center for Watershed Protection Summary of Stream Restoration Credits for Individual Restoration
Water for Virginia Master Naturalists. What are the types What is important to know about: Functions Values Issues
 Water for Virginia Master Naturalists What are the types What is important to know about: Functions Values Issues Francis J. Reilly, Jr. http://advancedmastergardener.org/water.htm Frank@TheReillyGroup.net
2017 Revised Guide for Chesapeake Bay Water Quality Two-year Milestones
 2017 Revised Guide for Chesapeake Bay Water Quality Two-year Milestones Purpose Based upon agreements by the Chesapeake Executive Council beginning in 2008, EPA created an accountability framework that
Permeable Pavement: A New Chapter
 Permeable Pavement: A New Chapter Annette Lucas, PE (919) 807-6381 annette.lucas@ncdenr.gov NC Division of Water Quality Wetlands & Stormwater Branch Final Chapter Released: October 16, 2012 We Bring Engineering
Bayesian Uncertainty Quantification in SPARROW Models Richard B. Alexander
 Bayesian Uncertainty Quantification in SPARROW Models Richard B. Alexander National Water Quality Assessment Project U.S. Geological Survey Reston, VA Chesapeake Bay STAC, Assessing Uncertainty Workshop,
Integrating Water Quality and Natural Filters into Maryland s Marine Spatial Planning Efforts
 Integrating Water Quality and Natural Filters into Maryland s Marine Spatial Planning Efforts Nicole Carlozo NOAA Coastal Management Fellow July 31, 2014 Watershed-scale restoration targeting helps direct
Prepared by Douglas L. Moyer and Joel D. Blomquist, U.S. Geological Survey, February 3, 2016
 Summary of Nitrogen, Phosphorus, and Suspended-Sediment Loads and Trends Measured at the Chesapeake Bay Nontidal Network Stations: Water Year 2014 Update Prepared by Douglas L. Moyer and Joel D. Blomquist,
Source of Pollution or Groundwater Solution?
 Acknowledgement Source of Pollution or Groundwater Solution? Kitt Farrell-Poe, Ph.D. Water Quality Extension Specialist & Professor Agricultural & Biosystems Engineering University of Arizona This work
Observations on Nutrient Management and the Chesapeake Bay TMDL
 Observations on Nutrient Management and the Chesapeake Bay TMDL Introduction William J. Rue and Sadie B. Barr EA Engineering, Science & Technology, Inc. 15 Loveton Circle, Sparks, MD 21152 On 29 December
Session I: Introduction
 STAC Workshop M O N I T O R I N G A N D A S S E S S I N G I M P A C T S O F C H A N G E S I N W E A T H E R P A T T E R N S A N D E X T R E M E E V E N T S O N B M P S I T I N G A N D D E S I G N Session
Council of Governments
 Metropolitan Washington Council of Governments Anne Arundel County Draft Phase II Watershed Implementation Plan January 18, 2011 Chesapeake Bay TMDL Pollutants of Concern Nitrogen Phosphorus Sediment 2
Achieving Nutrient and Sediment Reduction Goals in the Chesapeake Bay. Introduction. An Evaluation of Program Strategies and Implementation
 Achieving Nutrient and Sediment Reduction Goals in the Chesapeake Bay An Evaluation of Program Strategies and Implementation Introduction The NRC Study Tasks Tracking and Accounting Two-Year Milestones
A Model Program for Onsite Management in the Chesapeake Bay Watershed Response to Comments
 A Model Program for Onsite Management in the Chesapeake Bay Watershed Response to Comments This document provides a response to comments on the November 2012 EPA document titled A Model Program for Onsite
Onsite Wastewater System Nutrient Transport in the North Carolina Piedmont
 Onsite Wastewater System Nutrient Transport in the North Carolina Piedmont Charlie Humphrey, PhD Associate Professor of Environmental Health Sciences East Carolina University Humphreyc@ecu.edu Co-authors:
Modelling Onsite Wastewater Systems in SWAT
 Modelling Onsite Wastewater Systems in SWAT J. Jeong, C. Santhi, J. G. Arnold, R. Srinivasan Contents Overview Motivation Biozone algorithm SWAT integration Assumption/limitation SWAT data processing Study
Practical Applications of Stormwater BMPs for addressing Nutrient & Water Quality Challenges in Watersheds
 Practical Applications of Stormwater BMPs for addressing Nutrient & Water Quality Challenges in Watersheds Florida Water Quality Challenges in 2016 St. Lucie River Lake Okeechobee July 2, 2016 Port Mayaca
Land Conservation & Chesapeake Restoration
 Land Conservation & Chesapeake Restoration Peter Claggett Research Geographer, U.S. Geological Survey Coordinator, CBP Land Use Workgroup May 17, 2018 Maryland Land Conservation Conference Linthicum Heights,
Our Eastern Shore Groundwater Part IV Groundwater Quality on the Eastern Shore: How safe is our groundwater and are there ways we can protect it?
 Our Eastern Shore Groundwater Part IV Groundwater Quality on the Eastern Shore: How safe is our groundwater and are there ways we can protect it? Britt McMillan, Malcolm Pirnie, Inc. Mercury Venus Mars
MARYLAND TRADING and OFFSET POLICY and GUIDANCE MANUAL CHESAPEAKE BAY WATERSHED
 MARYLAND TRADING and OFFSET POLICY and GUIDANCE MANUAL CHESAPEAKE BAY WATERSHED Marya Levelev Maryland Department of the Environment May 17, 2017 1 Overview of Presentation Background 2017 Trading Manual
The Impact of Nonpoint Source Contamination on the Surficial Aquifer of the Delmarva Peninsula
 The Impact of Nonpoint Source Contamination on the Surficial Aquifer of the Delmarva Peninsula Judith M. Denver National Water-Quality Assessment Program (NAWQA) September 28,2010 U.S. Department of the
Mike Langland USGS PA Agricultural Advisory Board April 28, 2016
 Mike Langland USGS PA Agricultural Advisory Board April 28, 2016 Chesapeake Bay Nontidal Monitoring Network - Loads to the Bay (1) How are nitrogen, phosphorus, and suspendedsediment loads responding to
FIELD PHOSPHORUS RISK ASSESSMENT
 NEBRASKA DEPARTMENT OF ENVIRONMENTAL QUALITY AGRICULTURE SECTION * 1200 N STREET, SUITE 400 * LINCOLN, NE 68509-8922 TEL: (402)471-4239 *FAX: (402) 471-2909 * WEB SITE: www.ndeq.state.ne.us APPENDIX F
Upper Eastern Shore WIP Workshop November 21, 2014
 Clean Water Optimization Tool for Maryland s Eastern Shore Karen Cappiella Program Director Center for Watershed Protection Upper Eastern Shore WIP Workshop November 21, 2014 Funded by the Town Creek Foundation
Supplemental Guide II-Delineations
 Supplemental Guide II-Delineations Contents Source Water Protection Area Delineation... 1 Delineation Criteria for Systems Using Groundwater Sources... 2 Time of Travel... 4 Flow Boundaries... 4 Delineation
PROTECTING OUR WATERWAYS: STORMWATER POLLUTION REDUCTION EFFORTS
 PROTECTING OUR WATERWAYS: STORMWATER POLLUTION REDUCTION EFFORTS Public Information Meeting ~ May 2, 2018 Public Works Stormwater Management Division OVERVIEW Surface Water Quality Protection Municipal
STAC Review of Chesapeake Bay Program Phase 6 Watershed Model
 STAC Review of Chesapeake Bay Program Phase 6 Watershed Model Gary Shenk USGS - Chesapeake Bay Program 9/14/16 This information is being provided to meet the need for timely best science. The information
Crediting On-Site Wastewater Treatment Systems in the Bay Watershed
 Crediting On-Site Wastewater Treatment Systems in the Bay Watershed Photo Credit: The Animal Foundation in Las Vegas Nevada, treats its wastewater by a Tidal Flow Wetland Living Machine system. Photo Credit:
Lag-Times in the Watershed and their Influence on Chesapeake Bay Restoration. STAC Workshop October 16-17, 2012 Annapolis, MD
 Lag-Times in the Watershed and their Influence on Chesapeake Bay Restoration STAC Workshop October 16-17, 2012 Annapolis, MD Steering Committee Bob Hirsch, chair Jack Meisinger Marc Ribaudo Claire Welty
Roadside Ditch Management in the Chesapeake Bay Watershed
 Roadside Ditch Management in the Chesapeake Bay Watershed Photo Credit: Schneider, 2014 Roadside Ditch Management in the Bay Watershed STAC Report Re-plumbing the Bay released Agricultural Ditch Expert
7 Section 7: Land to Water
 7 Section 7: Land to Water 7.1 Introduction As discussed in Section 1, the multiple modeling approach permits P6 to represent processes on a finer scale than previous versions of the Watershed Model. Table
Transitioning from the Percolation Test to Soils Evaluation Colorado Environmental Health Association Annual Education Conference 2015
 Transitioning from the Percolation Test to Soils Evaluation Colorado Environmental Health Association Annual Education Conference 2015 Roy Laws, P.E. Jefferson County Public Health Warren S. Brown, P.E.
Monitoring Data in Support of Mid-Point Assessment
 Monitoring Data in Support of Mid-Point Assessment Doug Moyer Joel Blomquist, Jeni Keisman Based on contributions from dozens of incredibly smart and dedicated scientists 1 Using Monitoring Data To Measure
What is the Vadose Zone? Why Do We Care? Tiffany Messer Assistant Professor Biological Systems Engineering School of Natural Resources University of
 What is the Vadose Zone? Why Do We Care? Tiffany Messer Assistant Professor Biological Systems Engineering School of Natural Resources University of Nebraska-Lincoln Learning Objectives History of Vadose
RI Site Specific Soil Mapping Standards and Procedures
 RI Site Specific Soil Mapping Standards and Procedures Understanding Hydrologic Soil Groups and Site Specific Mapping URI Coastal Institute, Kingston June 28 th 2012 Jillian Phillips URI Cooperative Extension
Clean Water Optimization Tool Case Study: Kent County
 Clean Water Optimization Tool Case Study: Kent County Through a grant from the Town Creek Foundation, the Center for Watershed Protection created a userfriendly and simple Clean Water Optimization Tool
Onsite Wastewater Treatment Systems
 Onsite Wastewater Treatment Systems Municipal Officials Conference: Managing Onsite Wastewater Treatment Systems to Protect Long Island s Waters March 25, 2014 George Loomis New England Onsite Wastewater
EC Farm*A*Syst Nebraska s System for Assessing Water Contamination Risk Worksheet 2: Site Evaluation
 University of Nebraska - Lincoln DigitalCommons@University of Nebraska - Lincoln Historical Materials from University of Nebraska- Lincoln Extension Extension 1998 EC98-748 Farm*A*Syst Nebraska s System
Chesapeake Bay Maryland Phase I WIP Strategy Key Concepts: Septics and Stormwater June 13 th, 2011
 1 Chesapeake Bay Maryland Phase I WIP Strategy Key Concepts: Septics and Stormwater June 13 th, 2011 Topics Covered Purpose of Reviewing Phase I WIP Context of our WIP Planning Urban Stormwater Septic
So, Is the Chesapeake Bay. Yet After Going on The Bay Pollution Diet?
 So, Is the Chesapeake Bay Watershed Losing Weight Yet After Going on The Bay Pollution Diet? Rich Batiuk Associate Director for Science Chesapeake Bay Program Office U.S. Environmental Protection Agency
Nontidal Wetland Rehabilitation, Enhancement and Creation BMP Expert Panel
 Nontidal Wetland Rehabilitation, Enhancement and Creation BMP Expert Panel The Center for Watershed Protection, Inc. (the Center) in partnership with The Nature Conservancy (TNC). submits the following
In my Backyard: an Innovative Look at the Advances of Onsite Decentralized Wastewater Treatment
 In my Backyard: an Innovative Look at the Advances of Onsite Decentralized Wastewater Treatment Held December 17 and 18, 2013 National Association of Home Builders Washington, DC Status of the Workshop
Modeling Nutrient and Sediment Losses from Cropland D. J. Mulla Dept. Soil, Water, & Climate University of Minnesota
 Modeling Nutrient and Sediment Losses from Cropland D. J. Mulla Dept. Soil, Water, & Climate University of Minnesota Watershed Management Framework Identify the problems and their extent Monitor water
Chapter 2: Conditions in the Spring Lake Watershed related to Stormwater Pollution
 Chapter 2: Conditions in the Spring Lake Watershed related to Stormwater Pollution To identify the primary causes and consequences of stormwater discharges to Spring Lake and its adjoining waterbodies,
Deep River-Portage Burns Waterway Watershed 2015
 2.4 Soils Soil development is the product of the interaction of parent material, topography, climate, organisms and time. Understanding the types of soils that exist within a watershed and their characteristics
North Dakota s Nutrient Reduction Strategy. Presented to the 2016 ND Water Quality Monitoring Conference March 4, 2016
 North Dakota s Nutrient Reduction Strategy Presented to the 2016 ND Water Quality Monitoring Conference March 4, 2016 Nutrients Nutrients, in appropriate amounts, are essential to the growth and health
Division of Watershed Stewardship Drainage Program
 Not Your Father s Tax Ditch Enhancing Delaware s Drainage Network Through the Use of Natural Channel Design Techniques Division of Watershed Stewardship Drainage Program Presented at the National Conference
SOIL P-INDEXES: MINIMIZING PHOSPHORUS LOSS. D. Beegle, J. Weld, P. Kleinman, A. Collick, T. Veith, Penn State & USDA-ARS
 SOIL P-INDEXES: MINIMIZING PHOSPHORUS LOSS D Beegle, J Weld, P Kleinman, A Collick, T Veith, Penn State & USDA-ARS Part of a larger national effort to improve the P Index and P Management Chesapeake Bay
********** Objectives
 Title: Nitrate leaching hazard index developed for irrigated agriculture Author(s): David Birkle, Christine French, John Letey, Yvonne Wood and Laosheng Wu Source: Journal of Soil and Water Conservation.
Restoring a National Treasure: Chesapeake Bay. Presented by Dan Nees, Director Environmental Finance Center University of Maryland April 27, 2007
 Restoring a National Treasure: Chesapeake Bay Presented by Dan Nees, Director Environmental Finance Center University of Maryland April 27, 2007 Agenda Introduction to the Chesapeake Bay Restoration challenges
On-site Wastewater Groundwater Quality Risk. July 2013
 On-site Wastewater Groundwater Quality Risk July 2013 by Hamish Ogilvie, Clinton Rissmann, Brydon Hughes and George Ledgard Environment Southland is the brand name of Southland Regional Council Community
MAST Training Webinar for Federal Partners
 MAST Training Webinar for Federal Partners (Maryland s Assessment and Scenario Tool) August 16, 2011 1 Overview of Today s Webinar Introduction: (30 min) Brief background of Phase WIP process Define local
Appendix 12. Pollutant Load Estimates and Reductions
 Appendix 12. Pollutant Load Estimates and Reductions A pollutant loading is a quantifiable amount of pollution that is being delivered to a water body. Pollutant load reductions can be calculated based
Pennsylvania s Chesapeake Bay Tributary Strategy Implementation Plan for NPDES Permitting
 The strategy outlined in this guidance document is intended to supplement existing requirements. Nothing in the strategy shall affect regulatory requirements. The information herein is not an adjudication
APPENDIX A. Nutrient Trading Criteria Specific for the Chesapeake Bay Watershed
 Purpose: APPENDIX A Nutrient Trading Criteria Specific for the Chesapeake Bay Watershed The purpose of Appendix A is to provide additional program specific information regarding the use and incorporation
Project Team Members
 Picture from USGS Scientific Investigations Report 2008 5220 Developing a GIS-Based Software for Estimating Nitrate Fate and Transport in Surficial Aquifers: from Septic Systems to Surface Water Bodies
Qian Zhang (UMCES / CBPO) Joel Blomquist (USGS / ITAT)
 Joel Blomquist (USGS / ITAT)") CBP STAC Water Clarity Workshop Solomons, MD, 02/06/2017 Long-term Riverine Inputs from Major Tributaries to Chesapeake Bay Relevant to Water Clarity Qian Zhang (UMCES / CBPO) Joel Blomquist (USGS / ITAT)
CBP STAC Water Clarity Workshop Solomons, MD, 02/06/2017 Long-term Riverine Inputs from Major Tributaries to Chesapeake Bay Relevant to Water Clarity Qian Zhang (UMCES / CBPO) Joel Blomquist (USGS / ITAT)
From Coal Country to the Chesapeake:
 From Coal Country to the Chesapeake: USGS Water Science in West Virginia and Virginia John Jastram USGS Virginia & West Virginia Water Science Center What we do Operate streamgages, observation wells,
Recommendations for Refinement of a Spatially Representative Non-tidal Water Quality Monitoring Network for the Chesapeake Bay Watershed
 Recommendations for Refinement of a Spatially Representative Non-tidal Water Quality Monitoring Network for the Chesapeake Bay Watershed August 2005 Report of the Task Force on Non-tidal Water Quality
MILTON TOWNSHIP WATER QUALITY ACTION PLAN
 MILTON TOWNSHIP WATER QUALITY ACTION PLAN Elk-River-Chain-of-Lakes Gaps Analysis Project The Watershed Center Grand Traverse Bay Tip of the Mitt Watershed Council Michigan Department of Natural Resources
Sustaining Our Water Resources Public Health. April 27, 2011
 Sustaining the the Bay Bay Environmental Environmental Health Health Sustaining Our Water Resources Public Health Sustaining i i Our Our County Economic i Health Health lh IMPLEMENTATION: 2011 and Beyond
Regenerative Stormwater Conveyance Performance: The Groundwater Connection
 Regenerative Stormwater Conveyance Performance: The Groundwater Connection Jordan, T. E., J. J. D. Thompson, W. R. Brogan III, and C. E. Pelc Smithsonian Environmental Research Center Muddy Creek Restoration
Estimation of Nitrate Load from Septic Systems to Surface Water Bodies Using ArcNLET: an ArcGIS-Based Nitrate Load Estimation Toolkit
 Picture from USGS Scientific Investigations Report 2008 5220 Estimation of Nitrate Load from Septic Systems to Surface Water Bodies Using ArcNLET: an ArcGIS-Based Nitrate Load Estimation Toolkit Richard
Submitted by: Zoë Johnson (NOAA Chesapeake Bay Office) and Susan Julius (EPA/ORD, STAC Member) on behalf of Climate Resiliency Working Group
 and Susan Julius (EPA/ORD, STAC Member) on behalf of Climate Resiliency Working Group") Proposal for Responsive STAC Workshop on: Monitoring and Assessing Impacts of Changes in Weather Patterns and Extreme Events on BMP Siting and Design Submitted by: Zoë Johnson (NOAA Chesapeake Bay Office)
Proposal for Responsive STAC Workshop on: Monitoring and Assessing Impacts of Changes in Weather Patterns and Extreme Events on BMP Siting and Design Submitted by: Zoë Johnson (NOAA Chesapeake Bay Office)
The Relationship of Agriculture, Water and the Environment
 The Relationship of Agriculture, Water and the Environment Marcia Fox DNREC, Division of Watershed Stewardship, Nonpoint Source Program Delaware s Watersheds Piedmont Delaware Basin Chesapeake Basin Inland
Background What is the Integrated Report (IR)? CWA Background
? CWA Background") Department of the Environment Monday, September 8th, 2014 6:00 pm Montgomery Park, Lobby Conference Rooms Purpose of This Meeting Provide General Information/Updates on 2014 IR Encourage public dialogue,
Department of the Environment Monday, September 8th, 2014 6:00 pm Montgomery Park, Lobby Conference Rooms Purpose of This Meeting Provide General Information/Updates on 2014 IR Encourage public dialogue,
CHESAPEAKE BAY TMDL PHASE III WIP NORTHERN VIRGINIA OPENING STAKEHOLDER MEETING AUGUST 17, 2018 NORMAND GOULET NVRC
 CHESAPEAKE BAY TMDL PHASE III WIP NORTHERN VIRGINIA OPENING STAKEHOLDER MEETING AUGUST 17, 2018 NORMAND GOULET NVRC TODAYS AGENDA TMDL BACKGROUND WIP DEVELOPMENT PROGRESS AND TIMELINE 2017 NUTRIENT PROGRESS
Draft March 31, Estimate of Nitrogen Loading from Septic Systems in Martin County. Gary Goforth, P.E., Ph.D. 1
 EXECUTIVE SUMMARY Gary Goforth, P.E., Ph.D. 1 In a recent report to the Martin County Board of County Commissioners and the Martin County Utilities Department, Harbor Branch Oceanographic Institute (HBOI)
Florida TMDLs and Biosolids. A Topic for Concern Related to Florida Surface Waters By: Gary N. Roderick
 Florida TMDLs and Biosolids A Topic for Concern Related to Florida Surface Waters By: Gary N. Roderick - 2018 Research in Florida has shown that bahiagrass may produce satisfactorily without phosphorus
Recommendations for the Phase 6 Watershed Model from the Wetland Expert Panel
 Recommendations for the Phase 6 Watershed Model from the Wetland Expert Panel Friday, December 2, 2016 Webinar 1 Photo courtesy of UMD-Extension Some logistics can can you hear us now? You have two options
Chesapeake Bay Program Wastewater Treatment Workgroup s BMP Verification Guidance
 Chesapeake Bay Program Wastewater Treatment Workgroup s BMP Verification Guidance A. Need for Verification and the CBP Process to define it Over the past two years there have been numerous requests and
BMP 5.4.2: Protect /Conserve/Enhance Riparian Areas
 BMP 5.4.2: Protect /Conserve/Enhance Riparian Areas The Executive Council of the Chesapeake Bay Program defines a Riparian Forest Buffer as "an area of trees, usually accompanied by shrubs and other vegetation,
Protecting & Restoring Local Waters and the Chesapeake Bay
 Protecting & Restoring Local Waters and the Chesapeake Bay Restore America s Estuaries National Conference Gregory Barranco Chesapeake Bay Program Office November 2010 The Chesapeake Bay and Watershed
BANKS TOWNSHIP WATER QUALITY ACTION PLAN
 BANKS TOWNSHIP WATER QUALITY ACTION PLAN Elk-River-Chain-of-Lakes Gaps Analysis Project The Watershed Center Grand Traverse Bay Tip of the Mitt Watershed Council Michigan Department of Natural Resources
Bringing It All Together: Accounting for Practices Across the Watershed
 Bringing It All Together: Accounting for Practices Across the Watershed IMPROVING AND PROTECTING REGIONAL WATER QUALITY Stormwater Best Practices Workshop November 21, 2014 Acknowledgements Mike Haire