The West Midlands Area Multi-Modal Study
|
|
|
- Francine Willis
- 6 years ago
- Views:
Transcription


1 The West Midlands Area Multi-Modal Study Aspen Burrow Crocker In association with Transport Planning (International) Transport & Travel Research Tony Young Consultancy ECOTEC WMAMMS TRANSPORT STUDY
2 Aspen Burrow Crocker in association with Transportation Planning (International) Transport & Travel Research Tony Young Consultancy ECOTEC Government Office for the West Midlands Department of the Environment Transport and the Regions 77 Paradise Circus Queensway Birmingham B1 2DT Aspen Burrow Crocker Ltd Stratford Court Cranmore Boulevard Shirley Solihull West Midlands B90 4QT Job Number Prepared by Approved by Status Issue Number Date JHB/JPW TM/LCD Final 01 15
3 PREFACE
4
5
6
7 WEST MIDLANDS AREA MULTI-MODAL STUDY CONTENTS: 1.0 EXECUTIVE SUMMARY BACKGROUND TO THE STUDY TRANSPORT PROBLEMS AND RELATED ISSUES STRATEGY AND PLAN IDENTIFICATION PLAN DEVELOPMENT AND APPRAISAL RECOMMENDED MODAL SCHEMES AND MEASURES RECOMMENDED ECONOMIC INTERVENTION RECOMMENDED BEHAVIOURAL CHANGE INITIATIVES CONSULTATION NATIONAL, REGIONAL AND LOCAL OBJECTIVES ECONOMIC AND SOCIAL REGENERATION IMPACTS IMPLEMENTING THE STRATEGY AND PLAN 118 APPENDICES: APPENDIX A YEAR 2031 RECOMMENDED PLAN NETWORK SCHEMATICS APPENDIX B IMPLEMENTATION PROGRAMME APPENDIX C REFERENCE CASE SCHEMES APPENDIX D STEERING GROUP MEMBERS APPENDIX E STUDY TERMS OF REFERENCE GLOSSARY OF ABBREVIATIONS
8 1.0 EXECUTIVE SUMMARY 1.1 BACKGROUND TO THE STUDY Following the publication of the Integrated Transport White Paper A New Deal for Transport in July 1998, a number of multi-modal studies were announced. These are intended to look at the total demand for travel over a comparatively long time period and to establish a thirtyyear framework that would provide for an integrated transport system covering all modes, including the more sustainable means of travel such as walking and cycling. The Study Area for the West Midlands Area Multi-Modal Study (WMAMMS) is shown in Figure 1.1. It includes an area outside the six Metropolitan Districts extending into the surrounding Shire Counties which are also part of the Study, but only insofar as it is necessary to look at their relationship, in transport terms, to the conurbation. The aim of the Study is to investigate and seek solutions to problems on or with all modes of surface transport. A large number of options comprising behavioural, economic and modal interventions have been developed and appraised. The appraisals have been undertaken to determine the effectiveness of the various options against National, Regional, Local and Specific Locational Objectives. Apart from the national objectives of integration, economy, safety, accessibility and environment, the primary aim of the Study was derived from a vision suggested by the West Midlands Regional Forum of Local Authorities. to create a safe, modern, efficient and cohesive network of integrated transport facilities and services throughout the Study Area which serves the accessibility and mobility needs of both individuals and the business community in an environmentally friendly manner. The Study was undertaken by a consortium of consultants led by Aspen Burrow Crocker Ltd and managed by a Steering Group chaired by the Government Office for the West Midlands. The Study began in December 1999 and this report is the final output. 1.2 THE TRANSPORT IN THE STUDY AREA PROBLEMS AND ISSUES The Transport System Within the Study Area, delays due to congestion on the Midlands Motorway Box have gained national notoriety and are said to affect business confidence as far away as Scotland and the North-West of England. On the non-motorway network, congestion is particularly apparent in Birmingham City Centre, and other centres and environs at Wolverhampton, Dudley, Walsall, West Bromwich, Solihull and Halesowen. All radial approaches to Birmingham City Centre suffer severe congestion at peak periods near to the city centre and at their junctions with the motorway system. Traffic growth on much of the primary route network in the central areas of the conurbation has slowed to less than 1% per annum (daily flows), due to the limiting factor of congestion. Conditions on the motorways are rapidly becoming similar except that the effects of flow breakdown are more severe, with longer queues, due to the lack of alternative routes. New information systems such as variable message signs and RDS traffic information are helpful in providing early warning of delays, but the motoring public still has to acquire confidence in them. For all vehicles travelling on the road network including private cars, public transport vehicles and commercial traffic, the cost of congestion is increasing as more of the network becomes overloaded and congestion spreads into off-peak periods. Pressures on the network result in traffic using unsuitable routes, road traffic casualties and problems for vulnerable road users, unreliable and delayed bus services, delays to commercial traffic and environmental degradation. 1

9 Figure 1.1: The Study Area The road network in the west of the conurbation has a variable, often poor, mixture of standards and lacks a clearly defined hierarchy. The business community maintain that regeneration of the south and west of the Black Country area has been limited by the absence of good road communications. This is evidenced by lower development land values and commercial rents. In terms of structural road integrity, the National Road Maintenance Condition Survey has shown that roads in the West Midlands are probably in a worse condition than anywhere else in the country. Structural maintenance provision is a concern to the local highway authorities and road users alike. A lack of investment has historically led to a decline in the condition of the West Midlands road network. Inadequate maintenance causes particular problems to the slow modes, walking and cycling, where uneven surfaces are a particular hazard. 2
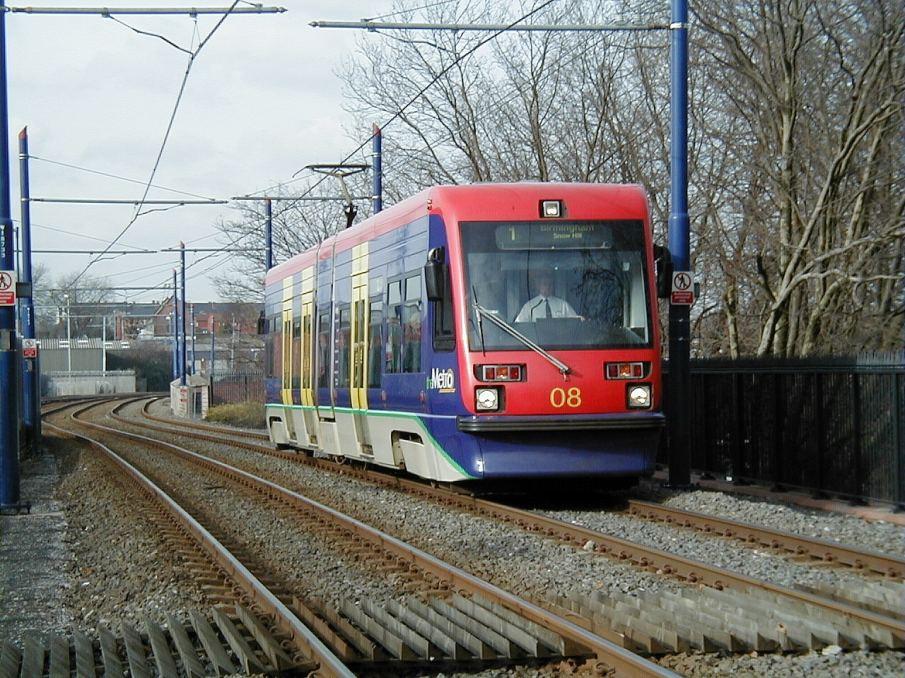
10 Bus and coach travel is the backbone of public transport in the conurbation and will remain so for the foreseeable future. No data is available on the reliability of bus services but road congestion causes slow journey times and unreliability. Other perceived problems are poor access to the network, lack of integration, uncomfortable seating, infrequent services in the evenings and weekends and a general lack of information. The relevant authorities are well aware of these issues and steps are being taken to improve the situation, but a step change in the investment will be required to deliver the quality of service envisaged in the transport vision. The rail system is an important part of the local transport network and Birmingham New Street is a major hub on the national rail network. Mirroring the situation on the motorway network, major rail capacity problems exist at Birmingham New Street station, and on the Wolverhampton Birmingham Coventry - Rugby, Cross-City, Coventry-Leamington, and Snow Hill-Leamington lines. Capacity problems also exist at other stations, particularly Wolverhampton and Walsall. There is overcrowding on some routes at peak times, rail services are perceived as unreliable and there is inadequate Park and Ride capacity at some stations. The first Midland Metro line between Wolverhampton and Birmingham began operating in May Initial technical problems affected both service frequency and reliability. Although very popular, patronage is below forecast at present. The location of Birmingham Snow Hill terminal limits its attractiveness for some journeys. The location of the Wolverhampton terminal does not afford easy interchange with buses or trains and delays occur on the street running section in Wolverhampton which adversely affect reliability. On the eastern side of the conurbation the rapid and continuing expansion of Birmingham International Airport presents surface access problems across all modes. The potential scale of growth will require major investment in new infrastructure, both externally and within the airport complex. Cycle usage accounts for around 2% and walking 26% of all trips in the conurbation. There is nominally an extensive local cycle network in each of the local authorities, however in most cases these facilities are not of a standard which is likely to encourage cycle usage. Achievement of current Government targets looks unlikely without a major change in behaviour and significant investment in improved facilities Environmental Issues Transport-related degradation of the environment in the conurbation takes the usual form of air pollution, noise and visual intrusion. All of these are strongly related to road traffic volumes and congestion, and are widespread across the area, particularly at peak periods. If the objectives of the Study are met, substantial mitigation of these adverse effects, particularly those caused by road traffic, will be achieved Socio-Economic Issues The most obvious aspect of the Study Area s economic problems is the above average unemployment rates which have persisted following the demand shocks of the and recessions. These are concentrated in the areas of the Black Country and Birmingham which were most dependent on manufacturing. Very often these problems are accompanied by other facets of joblessness such as low economic activity rates and concentrations of attendant health and social problems. The area has made a major effort and has had significant successes in diversifying into service activities and higher value added sectors more generally, in part through attracting mobile domestic and foreign direct investment. However, as discussed further below, this investment appears to have been constrained and shaped to a substantial extent by transport-related issues. 3
11 1.2.4 The Influence of Transport on Regeneration Work for SACTRA highlighted that good transport access is not always necessary and is never a sufficient condition for development and regeneration to occur. Nevertheless, the Regional Economic Strategy highlights the...major traffic problems at certain points in the region. And argues that, If these are sorted out, it will help improve the development of the region. It is not possible to accurately quantify the influence of transport on regeneration and economic development. However, the least accessible parts of the conurbation (in relation to external markets) are those which show the lowest commercial rental and land values. The Study has identified six key transport issues that appear to constrain economic development or regeneration in the Study Area: Congestion problems on the M6; Lack of good access to the southern Black Country; Lack of access to the west side of the conurbation; Peak period congestion on the M42 corridor; Access to the main urban centres, particularly Birmingham City Centre; and Social exclusion to employment opportunities due to inadequate public transport. 1.3 DEVELOPING A STRATEGY The Process Transport is a derived demand and the decision to make a journey and the characteristics of that journey such as destination, mode of travel, time of departure are governed by four main influences or drivers. These are economic, land use, behaviour and modal characteristics. By changing one of these four parameters the way some journeys are made will change. Reference Case Travel Demand Economic Intervention Modal Measures Behavioural Change Land Use Policies changing the cost of travel changing the transport network changing travel choices changing the need to travel Strategy Options Institutional Change Chosen Strategy Figure 1.2 The Strategy Development Process 4
12 Development of a genuinely strategic approach to transport provision has been difficult to achieve in previous studies because of the problems of estimating the total demand for travel by all modes. In this Study, the strategy development process was able start from a total number of trips which need to be accommodated. By changing the relative influence of the drivers of change, the number of trips by each mode is changed and an optimum strategy can be developed which satisfies both national and local objectives. The approach used in the Study for the development of an overall strategy is illustrated in a simplified form in Figure 1.2. In summary the process begins with the definition of a Reference Case, which encompasses the forecast demand for travel by the various modes given the continuation of present trends in transport provision, travel costs and behaviour. This is followed by an examination of the main effect of interventions under the four identified Drivers of Change, i.e. Economic, Modal, Behavioural and Land Use. A number of Sensitivity Tests then follow to assess the effect of more extreme interventions to each of the drivers The Elements of A Strategy The Reference Case is designed to indicate future conditions if levels of investment and changes in behaviour and economic trends are generally in line with current conditions. It acts as the base against which strategy and plan options are assessed. The make-up of the Reference Case has been based on the current Local Transport Plan, Centro s 20 Year Plan, investment proposals by SRA/Railtrack, the Highways Agency (including the privately funding Birmingham Northern Relief Road) and other known proposals. A Strategy Option can be created by changing the level of intervention of one or more of the drivers as follows: Behavioural Change this intervention seeks to change attitudes and hence travel behaviour to encourage travel by more sustainable modes, shorter journeys, linked journeys for more than one purpose, etc. Economic Instruments the cost of travel represents a strong influence on the choice of mode. By reducing the perceived differential between using a car and public transport, more people will travel by the sustainable modes. Because much of the cost of car travel is fixed and prepaid, it will be necessary to change car travel costs to point of use charges. Modal Measures these include all the physical infrastructure changes to the transport system, roads and public transport, that require investment to effect an improvement. Land Use Polices the interventions under this driver aim to reduce the need for travel by changing the spatial location of transport generators such as housing, employment, shopping and other large developments. In consultation with the Study Team, the West Midlands Local Government Association considered three options for population distribution for the Land Use driver and recommended that the Study should adopt the assumption that the historic drift of population out of the conurbation could be halted. 5
13 Some examples of how the effects of the remaining three drivers are inter-related are illustrated in Figure 1.3 below. Initially these effects were assessed individually and collectively using moderate levels of intervention which, on the basis of best judgement, were thought to be achievable in the short to medium term. A more extreme level of intervention in each driver was then used as a sensitivity test and each combination assessed against the Study objectives. Behavioural Change Raises awareness of true cost of transport choices Road pricing encourages behavioural change Implemented Strategy Improved public transport encourages behavioural change Relieves congested networks Economic Measures Funding generated for transport improvements Public transport improvements provide viable alternatives to paying road user charges Modal Improvements Figure 1.3 The Inter-relationship of Drivers of Change Towards a Preferred Strategy The strategy option phase of the Study confirmed that a strategy focussed on a single driver of change or, in the case of the modal driver, a single mode be it walk/cycle, roads, bus, Metro or heavy rail would not achieve the Study Objectives. A balance needs to be achieved across all modes, building on the strengths of each mode, but investment in transport infrastructure alone will not be sufficient. Viable modal improvements will need to be underpinned by significant behavioural changes and economic measures to influence such changes. In particular, if the aims of the Ten Year Plan for Transport such as reducing congestion levels, are going to be achieved within a realistic funding regime, all three drivers have to be incorporated within the strategy. Consideration of the appraisal of strategy options led to the identification of the combination of options which appeared to best meet the Regional and Local Objectives in the short and longer term. The probable levels of intervention required in the four drivers of change to achieve the Objectives are summarised in Table
14 Table Strategic Intervention Levels Drivers of Change Short Term (2011) Long Term (2031) Behavioural Change 5% reduction in car trips* 10% reduction in car trips* Economic Instruments Reduce differential between car and public transport travel costs Equalise car and public transport travel costs. Modal Measures Moderate intervention in all modes Moderate to high intervention in all modes Land Use Halt current population drift Halt current population drift * in addition to the 5% reduction in car trips included in the Reference Case 1.4 PLAN DEVELOPMENT AND APPRAISAL The Audit Phase of the Study examined current and future transport networks and problems in the Study Area. During this phase the Study team carried out a detailed review of local transport objectives and assessed current and future problems and opportunities. The wide range of proposed schemes and measures identified in the West Midlands and Shire Counties Local Transport Plans together with current programmes from Centro, Railtrack and the Highways Agency were included in the modal interventions considered in the subsequent phases of the Study. During both the Strategy and Plan Development Phases, consultations continued with members of the Study Steering Group and sub-groups, and the Wider Reference Group. The membership of these groups included representatives of transport authorities and operators, environmental groups, business and freight interests and others. From these consultations and other work by the Study Team, previously identified problems and their causes were examined further and possible solutions developed. In particular the interactions of problems and proposed solutions for individual transport modes were considered. Many of the potential improvements and changes considered in the Plan Development Phase are already well known, and often tried and tested. They may include better information systems, high quality public transport, improved junctions, better highway maintenance, persuading people to use cars less, etc. Very few changes in transport provision are likely to be radical, but there will be some. These could involve high-tech approaches to control of speed (to improve safety) and electronic linking of vehicles (to improve safety and road capacity). These measures are not expected to be in universal use until the second half of the plan period because of the infrastructure required and the need to equip most vehicles with the necessary equipment. The Plan Development process has therefore had to take into account changes that are already available and some that are still being developed. The process broadly covered possible plan options for the following sub-areas as well as area-wide schemes, measures and initiatives: The western conurbation including the Black Country; The central conurbation around Birmingham; The eastern side of the Study Area including the M42 corridor. The Plan Option Appraisal process was based on the Guidance on Methodology for Multi- Modal Studies (GOMMMS) issued by DETR in March The approach adopted worked within the appraisal framework provided by the five Government objectives for transport of 7
15 environment, safety, economy accessibility and integration. This approach is geared to three purposes: choosing between different options for solving the problem; prioritising between proposals; and assessing value for money. The process relied on the use of full or partial Appraisal Summary Tables for elements and layers of the Plan together with an assessment of performance against Regional and Local Objectives. Plan options were explicitly modelled as far as possible using a Strategic Transportation Model (STM) to assess the operational performance of each package. Outputs from the STM were input into the TUBA (Transport User Benefit Assessment) computer programme to determine transport economic efficiency on a multi-modal basis. 1.5 A SUMMARY OF THE 2031 PLAN The development of the 2031 Plan from the identified outline Strategy involved the package testing of over 150 different scheme suggestions many of which came from Local Authorities, special interest groups, Centro, and Government Agencies in addition to the Study Team. The recommended plan incorporates modal investment, behavioural change targets and economic measures which when implemented will deliver the selected strategy and achieve the transport vision Modal Measures Bus Transport Bus travel will remain the most important and dominant public transport mode in the Study Area and the proposed improvements are designed to raise its share of the peak travel usage from one-fifth in 1999 to nearly one-third by Improvements required will involve Showcase type improvements on all strategic routes with significant priority on routes with heavy passenger loading designed to achieve a journey time equivalent to 95% of car speeds at peak periods. Bus Priority will need to be virtually continuous through most important junctions and if road space is not to be reduced for other vehicles, widening will be required. These routes will be designated Super Showcase Routes. The schematic bus network is illustrated in Fig 1.4. Rail Transport The recommended 2031 light rail (Metro) network, shown schematically Fig. 1.5, consists of the following ten routes, mainly centred on Birmingham, Wolverhampton and Walsall (these are in addition to Midland Metro Line One and the currently planned extensions to Five Ways and Brierly Hill) :- Birmingham to Walsall Birmingham to BIA via Chelmsley Wood Birmingham to BIA via Sheldon Birmingham to Shirley Solihull Birmingham to Moseley Kings Heath Maypole Birmingham to Northfield Birmingham to Quinton Halesowen (with possible branches to Bartley Green and Londonderry) Walsall to Wednesbury Walsall to Wolverhampton Wolverhampton to Dudley The two routes in East Birmingham to BIA, via Chelmsley Wood and Sheldon, would be connected into a loop to form a continuous route. 8
16 The major heavy rail innovation in the 2031 Plan is the introduction of a Regional Express Rail Network (RER). The RER concept, characterised by high performance, high quality vehicles and infrastructure, would provide an integrated modern rail system that would connect towns and cities within and around the edge of the conurbation with central Birmingham. The schematic heavy rail network, as illustrated in Fig. 1.5, has been discussed with all the major rail industry partners, including the SRA, Railtrack and Centro and the appraisal process has indicated that there would be economic and operational benefits delivered by developing such a network. The RER system would include services that continue through the centre providing cross-conurbation links operating on the following lines :- Coventry Birmingham Wolverhampton Cannock Walsall Birmingham Nuneaton Lichfield Birmingham Redditch Tamworth Birmingham Worcester Leamington Spa/Warwick Birmingham Kidderminster Walsall - Birmingham Shirley Stratford Depending on viable passenger demand, services could also be extended to other centres such as Telford, Shrewsbury, Stafford and Rugby. The development of a series of major strategic Park and Ride sites is suggested, mainly on the edge of the conurbation, to operate in conjunction with the RER. The following major heavy rail schemes are identified as part of the 2031 Plan. These schemes, though essential for the full implementation of the RER, would also have major benefits to longer distance, through rail services. Birmingham New Street: new Underground Station and Tunnels Four-tracking West Coast Main Line (WCML), Coventry to Wolverhampton Four-tracking Birmingham to Water Orton A further three schemes are included in the 2031 Plan which would enable freight diversion away from the central Birmingham rail network:-. Electrification Walsall Rugeley Electrification Nuneaton Walsall via Sutton Park Re-open Stourbridge Walsall Lichfield Line (Freight only) Highway Network As a result of the appraisal process, the following key highway components, as illustrated in the schematic highway network shown in Fig. 1.4, have been identified for the 2031 Plan:- The M5/M6 corridor should retain a role as the north-south strategic route for long distance through traffic; A link should be provided between the M54 and the M6/Birmingham Northern Relief Road to improve access to and from the M54; Western Bypasses of Wolverhampton and Stourbridge, coupled with strengthening of the road hierarchy in the Black Country, to improve access and assist regeneration. Widening of the M42 between Junctions 3 and 7 together with junction improvements is necessary to accommodate the projected growth in this corridor. The widening should be designed to provide a continuous dual four-lane carriageway with an additional lane between junctions; The introduction of Active Traffic Management (ATM) on the existing motorway box to make best use of existing routes; and The introduction of Red Route and local highway capacity improvements mainly to facilitate public transport priorities both for Super Showcase bus and LRT. 9

17 Figure 1.4: Bus and Highway Schematic Networks 10

18 Figure 1.5: Heavy Rail and Light Rail (Metro) Schematic Networks 11
19 1.5.2 Economic Intervention In terms of the overall objectives of the Study, road user charging, in the form of cordon or area based congestion charging or ultimately full electronic road pricing, appears to offer greater flexibility and mode shift potential than other possible economic interventions. This is not to rule out such measures as lower bus fares, workplace parking levies, or motorway sliproad tolling which may have a role to play in the shorter term. A key part of the Strategy and Plan is the introduction of road user charges to bring the perceived cost of travel by car nearer to public transport travel costs. In the medium to long term the introduction of full electronic road pricing is recommended and this would need to be delivered at regional, if not national, level. In the shorter term, it is anticipated that congestion charging schemes could be gradually introduced based on cordons around the major centres in the conurbation, possibly starting with Birmingham City centre. The responsibility for implementing such schemes would rest with the individual Metropolitan Councils but an integrated approach across the area would be desirable Behavioural Change The primary goal of this element of the strategy is to develop the role of hearts and minds measures to encourage sustainable travel behaviour. The challenge is to change travel habits in favour of alternative modes to the private car such that people use their cars less and travel in a more sustainable way. The assessment of current and future initiatives revealed how travel behaviour programmes have been developed throughout the West Midlands. However, these are not co-ordinated, and suffer from a lack of continuity. Travel Awareness initiatives are generally planned at district level, although Centro has promoted some wider initiatives, and is often a partner at a local level. Current programmes would achieve a modest change in travel behaviour and it is believed that these existing initiatives cost in the order of 1m per annum over the whole conurbation. In view of the major economic and social benefits which will potentially accrue from such initiatives, it is recommended that resources for behavioural change should be substantially increased to at least 5m per annum. As a complementary measure in encouraging behavioural change it is also recommended that expenditure across the Study Area on improving walking and cycling facilities is increased from the current level of 4m to 10m per annum. 1.6 KEY TRANSPORT FORECASTS Demand for person movement in the Study Area, over the thirty-year period, increases from nearly 2.5 billion trips per annum to over 3.1 billion, an increase of almost 27%. Regardless of how people travel this change presents a significant challenge. Table 1.2 compares the Base Year and Reference Case with the situation if the component modal, economic and behavioural measures of the 2031 Plan are implemented. Implementation of the full strategy in respect of modal, economic and behavioural measures limits the total number of person trips by road vehicle in 2031 to close to 1999 base year levels both in the am peak hour and in terms of total annual trips. The reduction in occupant mileage by road vehicle (excluding bus) compared with the Reference Case is not so marked because the reduction in levels of road congestion leads to an increase in average trip length in the model. The behavioural and economic measures tend to counter this trend. 12
20 Table Travel Forecasts by Mode 1999 Base Year 2031 Reference Case 2031 Plan Modal Measures Only 2031 Plan Modal & Economic Measures 2031 Plan Modal & Economic Measures and Behaviour Change Million trips per annum (% change from Reference Case) Road Vehicles (except Bus) 1,923 2,324 2,245 (-3.4%) Bus (-0.8%) Rail (Heavy and Light) ,222 (-4.4%) 735 (1.1%) 155 (139.3% (154.1%) Total 2,457 3,112 3,112 3,112 3,112 Million occupant-km pa (%Change from Reference Case) Road Vehicles (except Bus) 34,871 40,168 39,443 (-1.8%) Bus 3,373 4,466 4,702 (5.3%) 1,870 2,329 4,037 (73.3%) Modal Split Road - AM Peak Hour Trips Modal split in AM Peak Hr Bus - AM Peak Hour Trips Modal split in AM Peak Hr Rail (Heavy and Light) - AM Peak Hour Trips Modal split in AM Peak Hr 475, % 135, % 15, % 573, % 203, % 25, % 547, % 207, % 55, % 38,661 (-3.8%) 4,708 (5.4%) 4,277 (83.6%) 534, % 218, % 63, % 2037 (-12.3%) 920 (26.5%) 155 (154.1%) 36,646 (-8.8%) 5,718 (28.0%) 4,246 (82.3%) 481, % 255, % 63, % 1.7 INVESTMENT COSTS The broad investment costs of the 2031 Plan over the 30-year implementation period are shown in Table 1.3 and these total 7.67bn at year 2000 prices. This is in addition to the investment required for the Reference Case, which is estimated to cost approximately 2bn over the same period. The bulk of the investment, (approximately 80%) is in respect of public transport networks but it should be noted that this includes substantial expenditure, in the order of 2.6bn for national heavy rail schemes at Birmingham New Street and the fourtracking of the Coventry Birmingham Wolverhampton main line. 13
21 Table Estimated Investment Costs: Recommended 2031 Plan 2031 Plan Component 2031 Plan Investment Costs in Current Prices ( million) Modal Measures Heavy Rail/RER Network Light Rail Network Showcase Bus Network Highway Network Economic Intervention Road User Charging Systems Behavioural Initiatives* Changing Travel Behaviour 4,180 1, , ECONOMIC BENEFITS Total Investment Costs 7,670 * includes investment in walking and cycling facilities The transport economic efficiency of the Plan components are summarised below. The analyses are based on the use of the TUBA software over the period 2001 to 2051 using two modelled years, 2011 and The 2011 scenario includes all schemes likely to be in place by that date whilst the 2031 scenario includes all of the Plan elements. The benefits and costs indicated are at year 2000 prices discounted to 2000 at a discount rate of 6%. Table Summary of Economic Evaluation Economic Impacts 2031 Plan Modal Measures Only 2031 plan Modal plus Economic Measures 2031 Plan Modal Plus Economic Measures and Behavioural Change Net Present Value NPV 2.7bn 3.4bn 5.4bn Present Value of Costs, PVC - 5.5bn - 5.7bn - 5.8bn Present Value of Cost to Government - 4.5bn - 2.7bn - 2.7bn Benefit/Cost Ratio, BCR Value/Cost to Government Ratio, VCGR CONSULTATION Consultation Activities Extensive consultation was undertaken throughout the Study covering problem identification, strategy and plan options and recommendations. Specific activities have included: Focus Groups; Structured Questionnaire Survey; Informal Questionnaire in Study Leaflet; Wider Reference Group Meetings; Meetings with Special Interest Groups; Attendance at LTP Consultation Events; Presentation to MEPs, MPs and local elected Members; and Radio Interviews 14
22 The final consultation stage involved a questionnaire on the plan recommendations sent to a randomly selected sample of 10,000 people. A response exceeding 2,500 indicated strong support for virtually all the recommendations Key Consultation Conclusions The consultation phase of WMAMMS has identified a number of key conclusions which are as follows: Before the Study was initiated there was no multi-modal consultation covering the transport sector across the West Midlands. A wide-ranging consultation involving focus groups, questionnaires and group discussions has been undertaken throughout the life of the Study. This has been supported by dissemination activities through the local media. Special efforts have been made to ensure the participation of groups who might otherwise be excluded from consultation exercises. A range of key stakeholders, including representatives of the business community and environmental activists as well as local authorities and public transport operators, were consulted throughout the Study. There is a broad level of support for the 2031 Plan, but it is readily apparent that, whilst some measures are strongly supported, others have attracted less support, possibly due to the lack of detailed proposals at this stage. A number of measures did not attract public support. Whilst this is unsurprising in the case of concepts such as road user charging, the importance of such a measure to the success of the overall 2031 plan means that further work to build public acceptance by explaining the links between road user charging and investment will be essential. The scope of this Study was very wide and, as such, the range of issues to be considered during consultation was highly complex whilst the level of detail which could be supplied was, of necessity, restricted. Whilst the consultation undertaken to date provides comfort that the approach proposed in the 2031 Plan is in line with public opinion, it does not signify public approval for the individual components of the Plan EFFECT ON THE ENVIRONMENT It is likely that any new infrastructure will have an adverse effect on the environment. Four tracking of the heavy rail line between Coventry and Wolverhampton, widening of the M42 and the western bypasses of Stourbridge and Wolverhampton are examples. However, if the recommended Strategy and Plan is implemented, substantial environmental gains will be achieved over the conurbation as a whole. A summary of the principal quantitative changes, relative to the Reference Case, is shown below in Table 1.5 and the full Appraisal Summary Table can be found at Table Road Usage and Congestion Delay With the implementation of the Plan, average delays due to congestion within the conurbation will decrease and should reduce to below existing levels. This reduction in congestion, one of the targets of the Government s 10 Year Plan, will help in developing a more environmentally friendly transport system. It will also enable buses and road-based Metro vehicles to operate more efficiently with improved journey time reliability. The 2031 Plan produces an overall 8.9% decrease in total road vehicle kilometres, made up of a 15% reduction on the non-motorway network and a 2.1% decrease on the motorways in the area. This alone will give a reduction in traffic emissions and a slight decrease in noise across the Study Area with the urban centres benefiting most. 15
23 Air Quality Area-wide, the effect of the 2031 Plan is to reduce emissions of Nitrogen Dioxide (NO 2 ) by 460 tonnes/annum and Airborne Particles (PM 10 ) by 20 tonnes/annum. Greenhouse gas emissions would also reduce as a result of the 2031 Plan measures, giving a reduction in the emission of CO 2 by 375,000 tonnes/annum. These forecasts take into account reductions in vehicle emissions in 2031 due to predicted advances in clean engine technology Public Transport Usage Public transport patronage under the 2031 Plan will increase significantly, with a significant shift away from the use of the car compared with the Reference Case. Total rail patronage, in terms of passenger kilometres travelled for both heavy rail and Metro, will almost double. Modal share by rail in the am peak, in terms of total trips, will increase to 7.9% compared with the 2031 Reference Case share of 3.2%. Modal share by bus in the am peak will increase from 25.3% in the Reference Case to 31.9%. Overall bus passenger kilometres travelled will increase by around 30%. However, bus services will still carry six times as many passengers as rail Road Safety Road accidents are predicted to decrease by 14%, with an estimated 35 fewer fatalities in This reduction will be a significant contribution to the Government s 10 Year Plan target for accident reduction. The improved facilities for pedestrians and cyclists recommended as part of the 2031 Plan will incorporate measures to improve safety for vulnerable road users. Table Key Environmental Indicators Relative to the Reference Case 2031 Plan Modal Measures Only 2031 Plan Modal, Economic & Behavioural Measures Road usage (vehicle-kilometres per annum) - 1.8% - 8.9% Congestion delay Change in vehicle-hrs per annum (%age reduction) Air Quality: NO 2 PM 10 CO 2 Public Transport usage (passenger kilometres per annum) bus rail million (16% reduction) - 93 tonnes/annum - 4 tonnes/annum - 76,000 tonnes/annum million (40% reduction) tonnes/annum - 20 tonnes/annum - 375,000 tonnes/annum + 5.3% % % % Road Accidents - 4.4% - 14% 16
24 TABLE 1.6 Appraisal Summary Table Recommended 2031 Plan (Modal, Economic and Behavioural Change Measures) Option 2031 Plan including Modal, Economic and Behavioural Change Measures. Description: Package comprising: 14 no. heavy rail schemes incl. Regional Express Rail network 12 no. Park and Ride Sites 13 no. light rail schemes 15 no. cross border showcase bus routes + showcase bus priority measures on all routes 25 no. highway improvements schemes Increased walking/cycling provision, Electronic Road Pricing and Behavioural Change Measures. Problems Refer to Chapter 3 for Summary of Transport-related Problems Present Value Cost To Government bn OBJECTIVE SUB-OBJECTIVE QUALITATIVE IMPACTS QUANTITATIVE MEASURE ASSESSMENT ENVIRONMENT Noise Local Air Quality Greenhouse Gases Landscape Decrease in total road vehicle kilometres will give a very slight decrease in noise across the Study Area. Notwithstanding mitigation some significant noise increases will be experienced arising from new highway routes. The greatest impact will be on the west side where approximately houses could be significantly adversely affected by the Stourbridge and Wolverhampton Western Bypasses. Four-tracking of the WCML (between Wolverhampton and Coventry via Birmingham) will have noise impacts dependent on scheme details to be determined. Slight worsening of air quality will occur around new road schemes but overall there will be a slight improvement within the conurbation due to reduced road traffic. A slight reduction in greenhouse gases produced within the Study Area will occur. Most light rail, heavy rail and highway schemes will have an adverse impact, generally slight or moderate. However four-tracking of the West Coast Main Line (between Wolverhampton and Coventry via Birmingham), the Western Bypasses of Wolverhampton and Stourbridge and the highway links between the M54 and the Birmingham Northern Relief Road and between the A449 and the Dudley Southern Bypass are assessed as having large adverse impacts. 5 No. schemes large adverse; 11 No. moderate adverse; Remainder slight adverse or neutral Townscape Heavy rail four-tracking, light rail and most highway schemes will have a slight or moderate impact. 9 Schemes moderate adverse; Remainder slight adverse or neutral Heritage of Historic Most heavy rail, some light rail and most highway schemes will have a slight or moderate adverse impact. 6 Schemes moderate adverse; Resources Remainder slight adverse or neutral Possibly houses could be significantly adversely affected by noise (i.e. >3dB(A) increase). Reductions in emissions: NO2 460 Tonnes/yr PM10 _ 20 Tonnes/yr CO2 375,000 Tonnes/yr Large Adverse Moderate Adverse Moderate Adverse SAFETY ECONOMY ACCESSIBILITY Biodiversity Water Environment Physical Fitness Journey Ambience Accidents Security Transport Economic Efficiency Most heavy rail, light rail and highway schemes will have a slight or moderate adverse impact. The Birmingham International Connection rail scheme will have a large adverse impact. Most schemes will enable improvements through incorporation of Sustainable Development principles and run-off treatments but some heavy rail, light rail and highway schemes will have a slight adverse impact. The Birmingham International Connection rail scheme will have a large adverse impact on water quality objectives. All public transport schemes will include an element of walk/cycling. Walking and cycling schemes will give a significant increase in walking/cycling from current level of about 26% and 2% of all trips. Further behavioural change measures including pedestrian and cycle facilities should encourage further modal shift to walking and cycling particularly for short trips including access to bus and rail services. Bus improvements provide moderate beneficial impact. RER and LRT Metro schemes provide large beneficial impact. Western Bypasses will give further beneficial impacts on the West side of the Conurbation due to the use of less congested roads designed to current standards. 1 Scheme large adverse 13 Schemes moderate adverse Remainder slight adverse or neutral 1 Scheme large adverse; 20 Schemes slight adverse; Other schemes neutral. Target is for cycling trips to increase from approx. 2% to 10% of all trips. Distance walked likely to increase due to increased public transport usage - approx. 30% on a 24hr basis Impacts: 19 Schemes large beneficial; 22 Schemes moderate beneficial; Remainder slight beneficial or neutral The Plan will reduce accident numbers primarily due to the reduction in annual road vehicle kms. Public transport improvements will afford increased security to users. Estimated annual reduction of 35 fatalities, 349 serious, and 1786 slight accidents. Current analysis has evaluated TEE over the period 2001 to 2050 using two modelled years 2011 and Forecast User benefits by mode: Private User Travel Time 3,717m Bus User Travel Time 3,526m Rail User Travel Time 2,511m Vehicle Operating Costs 226m User Charges - 1,645m Large Adverse Large Adverse Large beneficial Large beneficial 80million annual benefits (Year 2031 benefits at present day costs) Overall NPV 5,375m Overall PVC - 5,848m PVC to Gov - 2,701m Overall BCR = 1.92 Overall VCGR = 1.99 Reliability Reduced difference between off peak and peak hour flows indicates improved journey time reliability. 45% increase in reliability Large beneficial Wider Economic Impacts Significant potential to support efforts to secure regeneration and shift focus of development/investment to North and West. Will also alleviate potential constraints on Birmingham City Centre and M42 corridor and support initiatives to tackle social exclusion 3 RDA designated Regeneration Zones should benefit. Parts of areas which will benefit covered by Objective 2, Tier 2 or 3 assisted area status and/or SRB. Large beneficial Option Values RER and LRT Metro network will increase travel options throughout the Study Area, particularly to Birmingham and other centres. Large beneficial Severance Transfer to improved public transport will reduce severance by slightly reducing vehicle numbers on the road network. Western bypasses will reduce severance on local roads relieved of traffic. Large beneficial Access to the transport The RER, LRT Metro and additional/improved bus services will substantially improve access to the transport system. Improved public transport services on an extended +46% change in accessibility index Large beneficial system network will improve access for disadvantaged sections of the community. INTEGRATION Transport Interchange RER, LRT Metro and bus schemes will greatly improve transport interchange options and quality. All areas will benefit with well over 100 Large beneficial new interchange locations 17
25 1.11 IMPLEMENTATION It is crucial that all aspects of the Plan are implemented as part of the overall package at the appropriate time if the full benefits are to be delivered. Non-delivery of any specific elements will have an impact on the benefits received from other elements. For example, if congestion charging is not introduced at the appropriate time, further behavioural change or improved infrastructure will be required. The alternative would be a worsening of congestion even over current conditions. Appendix B, Table B1, sets out the main components of the proposed 30-year Implementation Programme and these are additional to the Reference Case Short-term (10 year) Programme (2011) Behavioural Change The primary goal of the Plan options under this driver would be to develop the role of hearts and minds measures to encourage sustainable travel behaviour. In the short-term it is believed that a target of a 5% shift from car to other modes, principally bus, cycle and walk, is achievable by strengthening and co-ordinating the existing initiatives and interventions. A start-up cost of 10m has been allowed for setting up an organisational framework for delivering the targeted behavioural change followed by a annual expenditure of 5m across the Study Area to coordinate, develop and expand hearts and minds initiatives. In conjunction with the behavioural change initiatives, a further 6m per annum expenditure on improving walking and cycling facilities is envisaged, in addition to the 4m current annual spend. Modal Measures Based on discussions with SRA and Railtrack and the results of the West Midlands Rail Capacity Study, the first phase of the Regional Express Railway, based around the Snow Hill services is considered to be deliverable by Over this period improvements would also provide much improved passenger circulation at Birmingham New Street Rail Station, reduced headways on the Birmingham to Wolverhampton line and additional platforms at Wolverhampton station. Re-modelling of the Water Orton line and freight enhancements on the Stourbridge to Walsall and Sutton Park lines are also anticipated in the first ten years. The implementation of strategic Park and Ride sites will begin in the first ten years, although the rate of progress will depend on the availability of suitable sites. In addition to the Reference Case schemes, a further 4 Metro extensions are included in the short-term programme: Birmingham to Sheldon Birmingham to Halesowen via Hagley Road and Quinton Sheldon - BIA - Chelmsley Wood Wolverhampton - Wednesfield-Walsall The substantial upgrading of all Showcase Bus routes to an enhanced or Super Showcase standard is critical to the success of achieving modal shift away from car. This should be completed by the middle of the Plan period (2015) together with 14 cross-border (i.e. outside Centro s core area of operation) routes to current Showcase standards. The introduction of Red Route type traffic management and junction improvements on designated parts of the strategic highway network is complementary to the proposed Super Showcase routes 18
26 Major highway schemes in the short-term plan include: the widening of the M42 from 3 to 4 lanes between Junction 3 to 3A and to 4 lanes plus auxiliary lanes between Junction 3A and 7, together with major improvements to reduce congestion around Junctions 6 and 7; a 2-lane motorway standard link from the M54 to the M6/BNRR; a new link from Dudley Southern Bypass to the A449 at Himley. Elsewhere on the strategic highway network the introduction of Active Traffic Management (ATM) is anticipated on the motorway box by 2011 and, as mentioned above, the Red Route measures on the non-motorway strategic highway network. On-line improvements of a number of routes, generally within the existing highway corridor, are also recommended as part of the 2011 plan in order to strengthen the hierarchy of roads in the Black Country. Economic Intervention The cost of travel is a strong influence on personal travel. The primary goal of this intervention is to redress the existing perceived cost of the use of public transport over private transport. The short-term assumption is that central area congestion charging could be introduced by 2011 but because of the potential political difficulties of implementation probably only in a few areas e.g. central Birmingham and Wolverhampton. The total net revenue generated will depend on the number of centres included and the level of charges set but this income would be used to further develop transport systems Medium Term Programme (2011 to 2021) Behavioural Change In the medium term further progress towards the target of 10% shift from car to other modes can be achieved by consolidating the short-term measures. Modal Measures Major heavy rail improvements are included in the medium term programme involving the main works for the underground station at New Street together with the completion of the four-tracking of the Coventry-Birmingham- Wolverhampton line. However, to complete the works in this timescale planning needs to start in the short-term The completion of the New Street Station works and widening would facilitate the introduction of a number of additional RER services. In addition to the infrastructure improvements, the RER network will have new, high performance rolling stock delivered in the medium/long term. Development of strategic Park and Ride sites should continue through this period. A further 5 Metro extensions are envisaged in the medium term programme:- Birmingham - Chelmsley Wood Birmingham Walsall Walsall Wednesbury Metro Extension to Bartley Green from Hagley Road Birmingham - Bristol Road - Northfield Western bypasses of Wolverhampton and Stourbridge/Wall Heath are included in the medium term Plan. A link from the Black Country Spine Road into the Darlaston Regeneration Area is also included in this period. Economic Intervention Electronic road pricing using satellite-based Global Positioning Systems (GPS) and in-vehicle units is already technically feasible. Although there will be concerns over personal privacy and evasion of charges it is considered that an area-wide road user charging system could be 19
27 introduced within the next 20 years. This would allow road user charging to be related to each vehicle s location on the network, time of day and congestion Longer Term Programme (2021 to 2031) Behavioural Change The longer term target for behavioural change is the achievement of a 10% shift from car to other modes, over and above the Reference Case assumptions. Modal Measures Between 2021 and 2031 the RER system would be completed with delivery of new rolling stock across the entire network and the introduction of the Birmingham International Connection, linking the Tamworth line to Birmingham International Rail Station. Four further extensions of the Midland Metro LRT network are also programmed: Birmingham - Shirley Solihull Birmingham - Moseley - Kings Heath - Maypole Wolverhampton - Dudley (via Priestfield) Extension to Londonderry from Hagley Road Highway schemes included in this period include limited widening and capacity improvements for specific sections of the strategic highway network on the A34, A441, A435 and the A457. Economic Intervention Full electronic road pricing will continue to operate throughout the latter part of the plan period, with road user charges being varied to suit traffic conditions COMPLEMENTARY INSTITUTIONAL CHANGE The implementation programme for the recommended Strategy and Plan and the complexity and diversity of existing delivery mechanisms leads to some concerns regarding the institutional capacity to take a long term view for the whole conurbation and determine priorities for spending within an overall budget. A wide range of authorities, agencies and operators will need to work towards implementing the strategy. Existing partnership arrangements will need to be reviewed to focus on delivery and monitoring of the impact of elements as they are delivered. Although many of the recommended measures will be delivered by other bodies, the local authorities within and around the conurbation and the WMPTA will be responsible for delivering the majority of the measures resulting from the recommendations. These authorities currently jointly prepare a Local Transport Plan (LTP) and it is recommended that this should be developed to form the basis for the implementation and monitoring of the strategy. Although the powers exist for Centro to extend its area of operation to beyond the Metropolitan boundary this requires subsidy from the neighbouring transport authority. The County Councils generally consider subsidy of services to the Metropolitan area to be of little benefit. Under current institutional arrangements this situation is unlikely to change. However, the renewal of the Central Trains franchise provides an opportunity to re-consider the service levels and other issues over a wide area. The aim should be to provide a level of service across the journey to work area which does not result in discontinuities and offers users the most attractive service from their actual origin. 20
28 Behavioural change A (sub)regional team would be ideally suited to organise this promotion on a concerted and co-ordinated basis. Regional because it needs to operate across all the local authorities, concerted because it has to be undertaken on a long-term basis. Short, sharp campaigns can be effective but their effect tends to dissipate. Promotion of attitude and behavioural change will need to be continuous, and co-ordinated to achieve the same level of awareness across the region Integration Integration of all aspects of transport provision is essential to make best use of the overall system. This applies to information and ticketing as well as services. The current large number of providers across the area of influence of the conurbation makes this difficult. A major step forward in integration would be achieved by introducing integrated ticketing on all public transport modes: bus, light rail and heavy rail. The Transport Act 2000 now allows the local transport authority (or more acting jointly) to make joint ticketing schemes, between different bus operators, to cover the whole, or part of their area(s). Centro is developing a customer driven, flexible integrated ticketing scheme, as part of their Network West Midlands aspirations Alternative Delivery Institutions If the partnership approach outlined above is unable to deliver the recommended package some institutional changes may be required. The establishment of a Regional Transport Authority (RTA) would combine the powers of the WM Passenger Transport Authority (PTA), some local authority responsibility and some Highways Agency responsibility. Apart from the incorporation of the functions of the Passenger Transport Executive (the executive arm of the PTA), the new Authority would be responsible for the strategic road network. The actual definition of the strategic road network would require detailed consideration at the stage of establishing an RTA but would generally conform to the network used in this Study. The local authorities would retain responsibility for all local distributor, local access and residential roads. The national remit of the Highways Agency would suggest that it should retain responsibility for the motorway network in the Study Area. Similarly the Strategic Rail Authority should retain its current strategic role in relation to Railtrack and the Train Operating Companies. Both the SRA and the HA would need to work in partnership with the RTA. The regional structure of the Highways Agency is conducive to this approach and a regionally structured SRA would also assist the process of delivery SUMMARY The West Midlands Area Multi-Modal Study has considered the future of transport across the West Midlands conurbation for the next 30 years. Transport affects everyone who lives, works, or passes through the Study Area. Currently the transport problems lead to delays and congestion which have an impact on both the economy and the environment of the Study Area. Road, rail, Metro, bus, walking and cycling all have a role in satisfying the future demand for movement of people and goods. Current transport problems are severe and it will not be possible to solve them simply by building new roads and railways. The Study recommends that in addition to providing some new infrastructure, a significant change in travel behaviour will be required. People will need to be provided with attractive alternatives to when and how they use the car. Improved public transport, Workplace Travel Plans, Safer Routes to School and Work, car sharing, and teleworking will all contribute to these alternatives. In the future, charging for the use of congested roads is also recommended to support these measures. 21
29 Recommended improvements to infrastructure include: improved facilities for walking and cycling, red route traffic management measures to improve reliability for all road traffic, especially buses, bus improvements, including Super Showcase Routes, with extensive bus priority, a network of Metro lines, major heavy rail investment including 4-tracking between Coventry and Wolverhampton and new tunnels under Birmingham New Street Station, a Regional Express Rail network, providing a high quality, frequent suburban rail service, bypasses of Stourbridge and Wolverhampton with new links and improved roads within the Black Country, and M42 widening between Junctions 3 and 7. If implemented the recommendations will benefit everyone in the Study Area: overall, hours lost to congestion should be reduced to below 1999 levels, average delay per vehicle due to congestion should be reduced by around 20% relative to 1999 levels, the share of travel by car in peak periods will reduce from 76% now to about 60% by 2031, the share by train will increase from 2% now to about 8% by 2031, the reliability of journey times should increase significantly, all Regeneration Zones within the conurbation will have improved accessibility. If the Study s recommendations are not fully implemented then all the above benefits will not be realised. In particular, transport problems will get worse with increased environmental impacts, such as emissions of greenhouse gases and road accidents. Regeneration and economic development, both largely dependent on good transport links, will be inhibited. In summary, the recommendations will result in an efficient, integrated transport system where users will have a real choice between public and private transport. Overall, the impact of the transport system on the environment and health will be significantly reduced, with less air pollution but increased physical activity. Accessibility to businesses and other locations will be improved, easing the movement of people and goods and benefiting both employment and the economy. 22
30 2.0 BACKGROUND TO THE STUDY 2.1 STUDY CONTEXT Following the publication of the Integrated Transport White Paper A New Deal for Transport in July 1998 a number of multi-modal studies were announced. These are intended to look at the total demand for travel over a comparatively long time period and to establish a framework that would provide for an integrated transport system covering all modes including the more sustainable means of travel such as walking and cycling. The Study Area for the West Midlands Area Multi-Modal Study (WMAMMS) is shown in Figure 1.1. The core Study Area includes the six West Midlands Metropolitan Districts of Birmingham, Dudley, Sandwell, Solihull, Walsall and Wolverhampton together with an extension south-westwards to cover the approaches to the Black Country. An area outside the six Metropolitan Districts extending into the surrounding Shire Counties is also part of the Study, but only insofar as it is necessary to look at its relationship (in transport terms) to the conurbation. Liaison has been maintained with adjacent multi-modal studies, principally the Midlands to Manchester (MidMan) Study, and also with other studies as appropriate. The timing of the WMAMMS was set to ensure that the initial Study outputs would be available by Spring This has enabled the Study recommendations to be considered by the Regional Planning Body in finalising the Regional Planning Guidance, which incorporates the Regional Transport Strategy. The progress of the Study has been monitored and guided by a Steering Group, chaired by GO-WM, with representatives from a range of bodies including the Local Authorities, the Regional Development Agency, the Strategic Rail Authority, Centro, the Highways Agency, transport operators, user, business and environmental groups. (see Appendix D) 2.2 STUDY AIMS AND OBJECTIVES The aim of the Study is to investigate and seek solutions to problems on or with all modes of transport. A large number of options comprising behavioural, economic and modal interventions have been developed and appraised. The appraisals have been undertaken to determine the effectiveness of the various options against National, Regional, Local and Specific Locational Objectives. The five National Objectives, as set out in A New Deal for Transport, are summarised as:- integration to ensure that all decisions are taken in the context of the Government s integrated transport policy, economy to support sustainable economic activity and get good value for money, safety to improve safety for all road users, accessibility to improve access to everyday facilities for those without a car and to reduce community severance; environment to protect the built and natural environment A Primary Transport Objective for WMAMMS has been derived from the vision suggested by the West Midlands Regional Forum of Local Authorities in the current Regional Transport Strategy and this is stated as follows:- to create a safe, modern, efficient and cohesive network of integrated transport facilities and services throughout the Study Area which serves the accessibility and 23
31 mobility needs of both individuals and the business community in an environmentally friendly manner. The Study Terms of Reference (see Appendix E) set out a number of specific locational issues for consideration and also list the following issues for this Study to specifically address:- The opportunities for changing strategic travel behaviour through the implementation of a coherent and integrated series of strategic and/or local initiatives, including demand-management aimed at modal transfer and reducing traffic volumes; The interaction between land use development options and the transport system; The role of hearts and minds measures designed to promote sustainable travel behaviour; Opportunities to reduce the environmental impacts associated with the strategic transport networks; The potential role of public transport, including mass rapid transit systems in improving accessibility within the conurbation; The potential role of rail service improvements in meeting regional transport objectives; The need for strategic improvements to maintain network integrity and safety. Table 2.1 illustrates how the issues identified in the Terms of Reference, the Primary Transport Objective and the Specific Locational Objectives nest within the five over-arching National Objectives. In addition we have developed a number of Regional and Local Sub- Objectives which also nest within the National Objectives. 24
32 TABLE STUDY OBJECTIVES STUDY AIMS: To make recommendations for a strategy to address strategic transport problems in and around Birmingham and the Black Country; and To develop a plan to address the most urgent strategic transport problems across all modes, looking in particular at opportunities for modal transfer, whilst ensuring that all measures are consistent with the strategy. Government s five National Objectives for transport Issues identified in the Study Terms of Reference PRIMARY TRANSPORT OBJECTIVE SPECIFIC LOCATIONAL OBJECTIVES SUB-OBJECTIVES INTEGRATION ECONOMY SAFETY ACCESSIBILITY ENVIRONMENT To ensure that all decisions are taken in the context of the Government s integrated transport policy. To support sustainable economic activity and get good value for money. The opportunities for changing strategic travel behaviour through the implementation of a coherent and integrated series of strategic and/or local initiatives aimed at modal transfer and traffic reduction. The interaction between land use development options and the transport system To improve safety for all road users. The need for strategic improvements to maintain network integrity and safety. To improve access to everyday facilities for those without a car and to reduce community severance. The potential role of public transport, including mass rapid transit systems in improving accessibility within the conurbation. The potential role of rail service improvements in meeting regional transport objectives. To protect the built and natural environment. The role of hearts and minds measures designed to promote sustainable travel behaviour. Opportunities to reduce the environmental impacts associated with the strategic transport networks. To create a safe, modern, efficient and cohesive network of integrated transport facilities and services throughout the Study Area which serves the accessibility and mobility needs of both individuals and the business community in an environmentally friendly manner To define the role of the M5/M6 corridors through the conurbation and to improve integration and safety and to balance economic benefits to through and local traffic including public transport. To achieve a significant modal shift to non-car modes within the Study Area. To ensure integration of the transport strategy with the Regional Planning Guidance and the Regional Economic Strategy. To alleviate congestion and improve safety and journey time reliability on the M42 between the M40 and M6. To improve conditions at transport network stress points across any mode which might affect economic vitality. To improve access to the regeneration areas in Birmingham and the Black Country and to BIA. To assist in improving of the efficiency and reliability of freight movements within and through the Study Area. Generally included in the Primary Transport Objective above. To reduce accidents (particularly to vulnerable users i.e. cyclists and pedestrians) on the Strategic Highway network To improve accessibility to the west side of the conurbation To improve the quality of service for passengers and freight by tackling congestion on the rail network between Coventry and Wolverhampton and around Birmingham New Street Station. To aid social inclusion by improving transport systems and access to public transport in areas identified for regeneration in Birmingham and the Black Country. Generally included in the Primary Transport Objective above. To reduce local traffic emissions and noise in urban centres in the Study Area 25
33 3.0 TRANSPORT PROBLEMS AND RELATED ISSUES 3.1 THE EXISTING TRANSPORT SYSTEM The Highway Network Delays due to congestion on the Midlands motorway box, particularly the M6 and M42, are well known at a national level. Through traffic as well as local traffic is often seriously delayed, and, in an attempt to avoid these delays, re-routing occurs over a wide area ranging from the local use of rat-runs to the use of the A50 (Stoke-Derby) and the M1 to avoid the M6. At peak times, with the motorways and their junctions operating at or near capacity, any incident or maintenance work has a significant impact, often causing long delays. The level of delays on the motorway box and interconnecting roads has led to concerns over the level of inward economic investment into the area. The interfaces of the local network with the motorway network at the motorway junctions and approach roads are known stress points. At peak times, traffic has difficulty either joining or leaving the motorway, the latter being of particular concern due to safety issues. Traffic that is able to join the motorway often slows through traffic at the junction causing tailbacks upstream. Such action causes the motorway flow to become unstable, leading to driver stress and accident risk. On the non-motorway network, congestion is particularly apparent in Birmingham City Centre, and other centres and environs at Wolverhampton, Dudley, Walsall, West Bromwich, Solihull and Halesowen. All radial approaches to Birmingham City Centre suffer severe congestion at peak periods near to the city centre and at their junctions with the motorway system. Often these radials pass through residential and commercial areas with conflicts from access and service roads, on-street parking and competing requirements for both pedestrians and cyclists. Modelling of the highway network indicates that total hours lost to congestion in the Study Area compared with free flowing conditions, will increase from about 80 million vehicle-hours in 1999 to 133 million vehicle-hours in 2031, even with the implementation of currently planned transport improvements. As detailed in Table 3.1 this represents an increase of 67% in congestion over the period which will further affect the reliability of freight deliveries and road-based public transport and will increase costs to businesses. Table Congestion Delay 1999 and 2031 Year Total annual veh-kms (x10 6 ) Total annual vehicle-hrs (x10 6 ) Congestion delay in annual vehicle-hrs (x10 6 ) Index of average congestion delay per vehicle-km Base Year 22, Forecast Year 28, Percentage increase 15% 35% 67% 28% For all vehicles travelling on the road network including private cars, public transport vehicles and commercial traffic, the cost of congestion is increasing as more of the network becomes overloaded and congestion spreads further into off-peak periods. Pressures on the network result in traffic using unsuitable routes, road traffic casualties and problems for vulnerable road users, unreliable and delayed bus services, delays to commercial traffic and environmental degradation. Again highway modelling has been used to compare current conditions with modelled forecast conditions in Figures 3.1 and 3.2 illustrate the likely worsening in conditions, despite an assumed 5% travel behaviour change in the Reference Case, with significant reductions in network speeds and increased capacity problems over the Study Area. 26

34 Figure 3.1: Comparison of Modelled Network Speeds in 1999 and

35 Figure 3.2: Comparison of Modelled Flow/Capacity Ratios in 1999 and
36 Traffic growth on much of the primary route network in the central areas of the conurbation has slowed to less than 1% per annum daily, due to the limiting factor of congestion. Small increases in aggregate flow are achieved through minor improvements and peak spreading. Conditions on the motorways are rapidly becoming similar except that the effects of flow breakdown are more severe, with longer queues, due to the lack of alternative routes. New information systems such as variable message signs and RDS traffic information are helpful in providing early warning of delays, but the motoring public still has to acquire confidence in the veracity of the information system. The road network to the west of the conurbation has a variable, often poor, mixture of standards and lacks a clearly defined hierarchy. Regeneration of the south and west of the Black Country area has been limited by the absence of good road communications. This is evidenced by lower development land values. In terms of structural road integrity the National Road Maintenance Condition Survey has shown that roads in the West Midlands are probably in a worse condition than anywhere else in the country. Structural maintenance provision is a concern to the local highway authorities and road users alike. A lack of investment has historically led to a decline in the condition of the West Midlands road network. Inadequate maintenance causes particular problems to the slow modes, walking and cycling, where uneven surfaces are a particular hazard Bus And Coach The major problem for the bus network in the West Midlands conurbation is congestion, affecting bus reliability and journey times. With traffic conditions varying across the network, bus operating speeds also vary and there are very few examples where whole routes offer journey speeds in excess of 20kph, in the peak periods. For most services average speeds are much lower. For many years after deregulation (1986) there was very little investment in new vehicles or infrastructure. Even though deregulation allows for changes of services within 42 days, the current bus network has remained virtually unchanged since deregulation, with service frequencies, routes and stopping places much as they were in This is probably due to the influence of Travel West Midlands, the major bus operator, which has allowed an element of continuity in the network. The network has improved in recent years, with Centro and the local authorities providing new bus stations, interchanges and priority measures and the bus operators investing in new buses and service improvements, but there is still much to do. Bus patronage has dropped by about 25% since 1986, but it is still the dominant public transport mode (over 90% of all public transport trips in the West Midlands area are by bus) but it is difficult to attract new users onto the bus. Car ownership in many parts of the conurbation is low. For example, in 1999, as set out in Table 3.2, around 45% of households in Birmingham did not have access to a car, but bus usage is also low. In 1998/9 the maximum modal share for bus trips into the major centres, was in the order of 30% (Birmingham and West Bromwich). The lack of investment and the uncertain future of bus routes has compounded the problem of low usage. Table Modal Split for Inbound Journeys (AM Peak Period ) and Household Car Ownership in 1999 District Centre Modal Split % Bus Train Car Bus Occupancy (%) % households with no car Birmingham Wolverhampton Dudley Walsall West Bromwich Merry Hill N/A N/A 29
37 The travelling public s perception of the bus is very negative. Service frequencies are irregular and tail-off outside of the peak periods, so reliance is placed on other modes e.g. cars and taxis. In the peak periods the bus is unreliable and slow, as traffic congestion impinges on service performance. The bus also suffers from a poor image in terms of journey ambience. Passenger comfort, ease of boarding and personal security are major problems for all users, but specifically the vulnerable user, affecting passengers on board the bus and at the bus stop/station. There are other significant problems: the fare structure is complicated, with different types of tickets and season tickets and there is inadequate provision of up to date information and inadequate integration of services. These are problems faced by the regular users who may be familiar with fare levels and have the correct change (or season ticket), know when the bus should arrive and know the best place to get on and off the bus. This information is even more difficult to obtain for the irregular or new user. Integration is the most severe of these problems. Timetables are not comprehensively coordinated. Passengers have to wait for unknown time periods, for their connecting services and in many cases they have to walk from one bus stop to another to complete their interchange. The seamless journey by bus (or any other public transport service) is very much the exception rather than the rule in the Study Area. These problems are not only found on the local bus network, traffic congestion affects national coach services. With Birmingham at the hub of the national coach network, most coach services are affected by delays on the motorway network. Coach services also suffer from poor journey ambience, security, comfort and unreliability. A new coach terminus closer to the City Centre is planned to replace the existing facility at Digbeth which has inadequate passenger facilities and is poorly integrated with other modes LRT Midland Metro The Midland Metro line between Wolverhampton and Birmingham began operating in May 1999 almost ten years after Centro received Royal Assent to the Private Member s Bill. Since then technical problems have continued to affect service frequency and reliability. This is a major problem affecting the image of this potentially high quality service. Although the service is very popular, patronage is below the forecast levels and it is likely that reliability problems are affecting people s mode choice. These on-going technical problems will have to be resolved if the passengers and business community s confidence is to be rejuvenated. The locations of the Wolverhampton and Birmingham termini are not ideal. In Wolverhampton it is difficult to integrate LRT with bus and heavy rail services, while the station in Birmingham does not penetrate the core of the City centre. The major problem for the development of a Midland Metro network is the lengthy timescale taken to deliver new services. The necessary consultation, technical and financial procedures need to be streamlined and the Government is currently considering how the Transport and Works Act process could be improved. For new routes the level of segregation from other modes should be maximised, in order to optimise journey time and reliability. The location of stops should be considered carefully to ensure integration with other modes and adjacent land uses Heavy Rail The heavy rail system in the West Midlands is an important part of the local and national transport network, providing regional, cross-country and long distance passenger services, and freight services. Meeting the needs of these various service providers and their customers is difficult, as the railway industry is fragmented with a multitude of key stakeholders, with various powers, duties and responsibilities. 30

38 A major constraint on the Study Area s rail network is the West Coast Main Line (WCML), between Coventry, Birmingham and Wolverhampton. This route provides for long distance and local movements, within the conurbation. There are 17 stations on the WCML, between Coventry and Wolverhampton, with some trains stopping at all stations. Inter city services stop only at key stations, such as Birmingham International, so there is competing demand for limited train paths, which affects the reliability of all services. The problem is compounded at Birmingham New Street Station, which is not only the busiest station in the Study Area, but is also the hub of the national rail network. Problems at New Street station have ripple effects across the whole of the rail network. The major capacity problems at Birmingham New Street Station affect both train and passenger movements. The physical layout of the station acts as a throttle, limiting the number of trains through the station. The total number of train movements is therefore constrained; this has led to reliability problems, limited future expansion and created a negative image for the travelling public and the business community. The passenger environment is poor, with inadequate circulation area, particularly during the peak periods. There are similar problems at other stations in the Study Area i.e. Wolverhampton and Walsall. At Snow Hill station the heavy rail capacity has been limited with the introduction of the Midland Metro Line 1, Wolverhampton to Birmingham LRT service, although the extension to Five Ways will remove this restriction. Figure 3.3 shows the extent of the capacity problems predicted by the West Midlands Rail Capacity Study, as commissioned by the SRA, indicating that the majority of the local rail network will be at or above maximum practical capacity in 2020 (even assuming additional four tracking on the WCML, between Beechwood and Stechford). Figure Long-Term (2020) Capacity Constraints (Assuming 4-Tracking Beechwood Tunnel-Stechford) (Source: West Midlands Rail Capacity Study) Despite the effects of capacity restraints and unreliability the local rail services have seen an increase in the number of rail passengers travelling into Birmingham City Centre in the last few years. This increase has led to overcrowding on a number of services in the peak periods. The existing local park and ride facilities are also inadequate and most car parks are 31
39 full before the end of the AM peak period, leaving little opportunity for peak growth or off-peak park and ride. Experience elsewhere in Europe suggests that there is potential for a further increase in the number of rail trips in the West Midlands. When comparing the Study Area with similar conurbations in Germany, the West Midlands has 143 public transport trips, per head of population, per annum, compared with 234 in Hamburg and 258 in Munich (both of these areas have extensive suburban heavy rail systems) Public Transport Overview Though many current problems are addressed in Centro s 20 Year Plan, a key factor in determining the extent to which specific solutions can be implemented is the financial and institutional framework for transport investment. The timescale for implementing a typical light rail scheme is not less than 10 years, most of which are spent dealing with the statutory processes. Investment is also crucially important to the objective of increasing the level of transport integration. Provision of transport facilities is fragmented between a multiplicity of agencies, public and private, with widely differing objectives. The degree of integration commonly found in European urban and regional transport systems is not evident in the British provincial context. A key element is bus deregulation, which hinders full integration of bus and rail services including common fares, through ticketing and information. Potential opportunities exist from having one major operator, National Express Group including Travel West Midlands (buses), Travel Midland Metro (light rail) and Central Trains (heavy rail), but current competition and deregulation legislation impose limitations. On the basis of recent growth at Birmingham International Airport, air passenger numbers are likely to grow substantially over the next 30 years. This scale of growth would inevitably require major investment in new infrastructure across all modes but with a particular emphasis on improving the modal share by public transport Integration Between Modes A major problem with integration is the absence of integrated timetables and ticketing, for all public transport modes: buses, light rail and heavy rail. This is very difficult to achieve given that the public transport industry relies on formal and informal agreements between a wide variety of stakeholders: numerous bus operators, train operating companies, local authorities, the Centro, SRA, Railtrack, the Rail Regulator, the Traffic Commissioner and the Midland Metro consortium. Good transport interchange facilities will often influence mode choice, but these have also suffered from lack of investment and uncertainty in the public transport network. Centro is the only local body with powers to influence integration. The Centro 20 Year Plan outlines proposals for Network West Midlands, which would provide a radical change in the public transport system, but Centro s power to implement integration are limited and rely on partnerships between multiple stakeholders. The current geographical coverage of Centro remains essentially consistent with the Metropolitan Districts, although a few services extend into neighbouring authorities. The subsidy and service levels applying over the Centro area result in discontinuities at the Metropolitan boundary. This tends to encourage rail-heading from the surrounding shire areas to certain stations. Although powers exist for Centro to extend its area of operation beyond the Metropolitan boundary, which currently requires subsidy from the neighbouring transport authority. 32
40 3.1.7 Travel And Passenger Information Systems Reliable and easily obtained information is essential to journey planning and existing sources of information are perceived as poor or in many cases non-existent. Although significant improvements in the provision of information have been made in recent years, particularly by the Highways Agency, Centro and Travel West Midlands, there is scope for much more to be done and new technology offers increasing opportunities for information delivery Cycling And Walking Cycle usage currently accounts for around 2% and walking about 26% of all trips in the Study Area. The National Cycleway Network is well developed within the West Midlands and there is an extensive local cycleway network in each of the metropolitan districts. Most facilities are underused, mainly due to perceived safety and vulnerability concerns. Over the latter half of the 1990 s, pedestrian and cyclist casualties in the Study Area were around 21% and 7% respectively of all road accidents. Almost half of all pedestrian accidents related to child casualties. Often facilities are inadequate, both in terms of linking centres of demand and integration with public transport. If these problems can be overcome there is potential for transfer from car to walk and cycle modes. A major increase in cycle lanes and facilities is needed, along with education and awareness campaigns, if cycle usage is to increase from its current level of around 2% of all trips to become a significant mode other than for leisure use Freight Movements Industry needs to move goods between supply points and consumers reliably, cheaply and if possible quickly. Road congestion is a major problem particularly on the motorway network and modelling indicates that, within the Study Area, average congestion delay per vehicle-km travelled could increase by almost 30% over the next 30 years with the absolute total of vehicle hours lost to congestion increasing by 67% in the same period. This represents a very significant economic burden on business in general as well as being socially and environmentally damaging to the area. Though the majority of goods traffic will continue to be moved by road, Government has set a target to increase the current rail freight share by 80% over the next ten years. In order to achieve this, rail operations will need to be competitive in terms of cost, journey time and reliability. Limitations on rail capacity and facilities hinder the scope for transfer from road to rail but a number of new multi-modal freight terminals are under consideration in the north of the Study Area with some smaller facilities at the periphery of the conurbation. Greater use of rail transport for freight movement should be possible by ensuring that these transfer terminals become available and that freight train movements are not unduly subordinated to the needs of passenger traffic. Detailed information covering the movement of freight by road in and through the Study Area is not currently available but, according to the Freight Haulage Association, the 1998 tonnage of freight moved by road, to and from the West Midlands, was m. tonnes and m. tonnes respectively, with a further m. tonne moving within the West Midlands. It should be noted that non-uk vehicles are not included. The approximate distribution within the UK of this tonnage is listed in Table 3.3. Total road freight traffic passing through the region in 1998 was estimated at 136 million tonnes and, with the inclusion of freight movements with origins or destinations in the West Midlands, the total annual freight tonnage on the Region s roads was estimated at 234 million tonnes. This represented around 15% of the total freight moved by road in the UK in 1998 by GB vehicles only. 33
41 Table Tonnage of Freight by Road to/from the West Midlands (Figures are in million tonnes per annum) Region To West Midlands From West Midlands South East South West East Anglia East Midlands West Midlands North East North West Wales Scotland N.Ireland Waterways The extensive network of canals in the Study Area is only capable of accommodating standard narrow boats. There is very little freight movement and it is unlikely that there will be any significant shift of freight onto the waterways. The main growth area is the tourist and leisure sector with some 4,500 pleasure crafts currently based in the area. 3.2 ENVIRONMENTAL ISSUES Introduction Reducing the adverse environmental and health impacts from transport is one of the five National Objectives for transport and a key requirement for sustainable development. Consultations have been undertaken with Statutory Bodies, including the Environment Agency, the Countryside Agency, English Heritage and English Nature to confirm key environmental issues, the environmental capital for the Study Area and overall impacts on noise, local air quality, green-house gas emissions, landscape, townscape, heritage, biodiversity and water-environment sub-objectives. A summary of these key environmental issues related to transport systems in the Study Area follows Environmental Problems Noise It is recognised that noise ( unwanted sound ) can cause disturbance of sleep, speech etc leading to annoyance and at higher levels to ill-health. Noise emissions from vehicles are dependent on many factors, including speed, acceleration and deceleration, whilst noise levels experienced can be mitigated by measures including silencers at source, barriers, distance and absorbent surfaces between source and recipient. Annoyance resulting is again dependent on various factors, notably time and activity or the noise recipient. Noise is a potential problem emanating from all forms of transport in the Study Area including road, rail and air but on an area wide basis, road traffic is the dominant transport noise source. Particular noise problems are evident in the motorway corridors, notably near to the M6 and the M5 in the north of the conurbation and the M42 to the east. Further problems are associated with Birmingham International Airport. Local Air Quality Impacts of air pollution are wide ranging and include quality of health, water, soil, ecology and property. Levels of pollution are heavily influenced by weather conditions and in respect of road traffic distance from source of emissions is significant. 34
42 Pollutants covered by the Government s National Air Quality Strategy (2000) and known to be significant problems in the West Midlands are principally Nitrogen Dioxide and Airborne Particles (PM 10 ), but also other oxides of nitrogen and Sulphur Dioxide. Particular concerns resulting from these pollutants and the contribution to national emissions are as follows: - Nitrogen Dioxide: health impacts particularly to the north of Birmingham and related to traffic on motorways and major trunk roads approximately 48% deriving from road traffic. - Sulphur Dioxide and other oxides of Nitrogen: impact on vegetation and ecosystems and cause acidification of soils and water environments approximately 2% of Sulphur Dioxide deriving from road traffic. - Airborne Particles (PM 10 ): impact on human health and causes soiling of buildings approximately 26% deriving from road traffic. Greenhouse Gas Emissions Greenhouse gas emissions, notably CO 2 which accounts for 98% of these emissions, are thought to be contributing to forecast climate changes for the region. Using current trends the estimated increase in road vehicle-kilometres in the Study Area will be around 15% over the next 30 years. The corresponding estimated increase in road vehicle emissions of carbon dioxide between 1999 and 2031 is 560,000 tonnes per annum with some assumed advances in clean engine technology. Landscape Much of the countryside surrounding the urban parts of the Study Area is of good quality and some is of designated importance. Cannock Chase is an Area of Outstanding Natural Beauty and there are locally designated Special Landscape Areas or Areas of Great Landscape Value, including the Clent Hills. It is highly valued by rural residents and visitors from the urban parts of the conurbation but elements of the rural economy and rural environment are under pressure and vulnerable. Aspects of concern include an affluent population migrating into the countryside, increasing commuting and pressures on local services but reducing availability of affordable housing. Loss of village shops and schools has been accompanied by reductions in public transport increasing dependency on private cars for essential journeys. This is occurring against a background of intensification of agriculture leading to loss of employment and traditional landscape features including hedgerows, semi-natural woodlands and natural habitats. Biodiversity Existing habitats and wildlife sites may suffer from road traffic emissions, increased ease of access and are under pressure from development. The most important sites are designated as Sites of Special Scientific Interests and within the Study Area these notably include: Sutton Park, some 10km north of Birmingham; River Blythe which drains much of south and east Birmingham and Solihull; Wren s Nest Nature Reserve in Dudley. Water Environment Pollution, habitat degradation and low flows are concerns for the quality of watercourses in the Study Area. Groundwater, which provides water supply and is used to maintain watercourse flows and wetland habitats, is also at risk from pollution. Of greatest concern to surface and ground water quality are major incidents, from agriculture, construction and industry. 35
43 Whilst road traffic emissions are, and construction activities can be, sources of water environment pollution, infrastructure projects can provide opportunities for water treatment measures to be installed for run-off from new and existing catchment areas. 3.3 ECONOMIC AND SOCIAL REGENERATION ISSUES Overview The most obvious aspect of the Study Area s economic problems is the above average unemployment rates which have persisted following the demand shocks of the and recessions. These are concentrated in the areas of the Black Country and Birmingham that were most dependent on the manufacturing activities which were the main focus of these recessions and, at a more local level, in the communities within those areas which have been least well able to adapt to the associated changes in the pattern of economic opportunities typically older inner urban areas and some overspill estates. Very often these problems are accompanied by other facets of joblessness such as low economic activity rates and concentrations of attendant health and social problems. The severity of these recessions and the persistence of their effects reflect a series of supply side weaknesses. Efforts to address these through two decades or more of interventionist policies have been only partially successful : Continued dependence on manufacturing in general and a number of traditional low value added sectors in particular. The area still has a particular dependence on motor manufacturing and related activities; Relatively low productivity and profitability and long standing problems of underinvestment within important parts of the local economy; A relatively poor performance in terms of business formation and survival in many areas; Underlying weaknesses in educational performance and skills development; Limitations of much of the stock of industrial and commercial premises. The area has made a major effort - and has had significant successes - in diversifying into service activities and higher value added sectors more generally, in part through attracting mobile domestic and foreign direct investment. However, as discussed further below, this investment appears to have been constrained and shaped to a substantial extent by transport related issues The Policy Context The socio-economic problems of the Study Area have made it a focus of a range of domestic and EU policy initiatives, particularly from the mid-1980s onwards, notably: Objective 2 status for the purposes of EU regional policy with substantial areas of the Black Country and Birmingham retaining status even following the last cutbacks; Assisted area status under domestic regional policy, with much of the area now enjoying Tier 2 or 3 status; Development Corporations which operated in the Black Country and Birmingham Heartlands. Although now wound up, their legacy in the form of development sites has provided a significant part of the foundation for recent development activity within the conurbation; A range of locally led interventions such as the current activities of a substantial number of SRB partnerships and the former City Challenge partnerships, as well as major locally promoted developments and initiatives; 36
44 New AWM funded interventions in the form of three emerging Regeneration Zones (North Black Country, South Black Country and East Birmingham) which cover much of the Study Area. The RZs are founded upon the principles of securing development within areas of opportunity which can be linked into nearby areas of economic and social need The Influence Of Transport On Regeneration Work for SACTRA highlighted that good transport access is not always necessary and is never a sufficient condition for development and regeneration to occur. Nevertheless, the Regional Economic Strategy highlights the major traffic problems at certain points in the region. and argues that, If these are sorted out, it will help improve the development of the region. In our judgement there are six key transport issues which are constraining the economic development of the Study Area. The likely impacts of alternative transport options on the regeneration of the Study Area need to be assessed on the basis of their contribution to resolving these issues. (i) The problems of the M6 through the conurbation associated in particular with the bottleneck of the M5/M6 junction, in our view the key strategic issue. The Regional Economic Strategy notes that, The problems of the M6 reflect badly on the region and do not help to attract visitors and investment. The recent Employment Land study for the West Midlands Local Government Association showed that this problem acts as a significant barrier to investment flowing from, or geared towards serving, South East England and that it has had the effect of concentrating development interest in the South Eastern parts of the region, especially the M42 corridor. As a result the Solihull sub-region has the highest industrial rentals and land values in the Study Area (in excess of 6 per sq ft and perhaps 350,000 an acre, with values of at least twice this for land on business parks). (ii) Problems of internal access to and from the motorway network, especially on the congested all-purpose road network of the Black Country. The significance of these constraints is reflected in the success of the Black Country Route and Spine Road in attracting a mix of foreign investment, local relocations and distribution related developments. Over the late 1990s sites within a mile of the road accounted for more than half of all development in the Black Country (Table 3.4). Table Industrial Land Redevelopment, 1991/ /2000 Hectares Black Country Spine Roads Buffers Year 0 to 0.5 Mile 0.5 to 1 Mile Total Black Country Area Source : Analysis of RILS (Regional Industrial Land Survey) Rentals (at per sq ft, with a premium of 0.25 per sq ft for sites adjacent to the road) and land values (of up to 300,000 an acre) are notably higher than in other parts of the Black Country. However, little in the way of readily developable land remains in the corridor and, whilst development interest has spread from the immediate corridor to Great Bridge to the South and to the North of Wolverhampton, internal access remains a general constraint on its wider spread. 37
45 (iii) Access to the West Side of the Conurbation. Related to point (ii) above, poor road access means that the western fringe is essentially a secondary location in industrial property terms. Much of the building stock dates back to the 1960s/70s. Development for example, at Pensnett tends to be focussed on redevelopment to meet existing/local company requirements. Rents at per sq ft are probably still too low to make general speculative development very attractive, even at this stage of the property market cycle. Reflecting this, land values are relatively low (typically only around 125,000 an acre). (iv) Congestion within the M42 Corridor. Whilst the corridor has seen a number of outstandingly successful developments in particular Birmingham Business Park and development interest remains strong, with the major Blythe Valley development in the pipeline, growing congestion particularly in peak periods has emerged as a major threat. Work for Advantage West Midlands has highlighted the potential conflicts between the growth of the business parks and the continued expansion of the Airport/NEC complex. (v) Access to the urban centres, in particular Birmingham City Centre. Access problems hinder the capacity of the established centres to compete and in particular to attract retail trade. Work has highlighted the fact that Birmingham in particular is undershopped for such a major regional centre. Strategic accessibility also influences the City s capacity to compete with other regional centres such as Manchester for major office based investments. The growth of the airport has clearly been a helpful factor in building the City s strategic accessibility but the reliability problems of the rail system have reduced the value to the City of its position as a major hub in the network. The capacity of the road and rail system at peak periods is also at least a potential limitation on the longer term development of the central business district, in particular because of its role in constraining the supply of labour. (vi) Access to employment opportunities from deprived communities and for deprived individuals more generally. Transport represents one of the potential barriers to encouraging active labour market participation and tackling problems of social exclusion as manifested, for example, in low activity rates or in the form of long term unemployment or underemployment. The availability of good public transport links to areas of opportunity particularly from the areas where deprivation is most concentrated - is clearly a key consideration in this context. Recent research for DETR (Social Exclusion and the Provision and Availability of Public Transport, TRaC, 2000) concludes from a review of relevant literature that, there is, a clear link between travel barriers and employment possibilities. These are related to routes, affordability, timing (particularly for shift or Sunday working) and in particular reliability. Choice of job, or even the possibility of taking a job at all, is thus positively correlated with the ability to travel. This research draws in part on an earlier study in the West Midlands for Centro which looked at a range of deprived communities and employment areas. This confirmed that, although issues of skills are important, the other critical factor in ensuring access to jobs is the level of actual and perceived accessibility through the public transport system, with access by bus identified as the dominant concern The Assessment The approach to considering potential regeneration impacts is one of qualitative assessment using professional judgements informed by a combination of :- the results from the transport modelling; our knowledge of the local context; previous relevant studies such as the recent work on employment land requirements for the West Midlands Local Government Association cited above; and, some specific pieces of local research and data gathering for example, on site availability and the links between access to the transport network, property market indicators and recent levels of development. The strategic nature of the Study have limited the focus for the most part to the broad pattern of effects likely to be associated with particular packages and policy options rather than a detailed scheme by scheme appraisal. Where possible we try to indicate the likely extent of the significance of the effects involved but we have not sought to quantify or otherwise model 38
46 these. Nor, given the timescales and attendant uncertainties involved, do we think it would have been practicable or sensible to do so. The analytical framework for the assessment is based largely on three propositions: (i) The decline in inward investment, rentals and land values moving West and North within the Study Area as highlighted above - reflects the decline in accessibility to the motorway network moving westwards and the problems of the network through the conurbation, both of which are essentially the result of congestion. The effects are that in much of the heart of the conurbation speculative development is, at best, only marginally viable and that returns are generally insufficient to secure industrial and commercial development on sites with any significant abnormal development costs. As most brownfield sites in the area confront some such problems, there are significant problems of market failure and the development of a high proportion of sites away from the motorway and spine road corridors even if it could be secured at all - has depended on substantial public sector grant aid; (ii) Improvements in accessibility in these areas brought about by improvements in the network or reductions in congestion on existing routes have the potential to enhance the market potential of sites in the vicinity, making them attractive to a broader range of end users and boosting rentals, thus reducing the level of grant necessary for development to occur or even raising returns sufficiently to make schemes viable in some cases. There are, of course, a range of other barriers to the regeneration of the conurbation as highlighted above including problems of : education and skills; weaknesses in the existing local economic base and in the demands it generates; the quality of local sites and premises; environment; and, crime and social exclusion none of which, of course, can be overcome directly by transport measures. However, the experience of the Spine Road indicates that, providing the rest of the policy framework is supportive, transport improvements can make the difference to whether development occurs or not and that a proportion of the development (perhaps a third in the case of the Black Country Spine Road) will comprise projects originating outside the sub-region which might otherwise go elsewhere. (iii) Provision of well-accessed peripheral sites has the potential to attract investment to locations where it most unlikely to go under other circumstances. The case studies in the Employment Land study report cited above suggested that market interest in such areas may well be predominantly B1a (office) uses rather than the B1c/B2 uses which dominate brownfield redevelopment. They also suggest that the occupiers of such sites are much more likely to be national operations and that, presumptively, the jobs involved are more likely to be additional to the region. 39
47 4.0 STRATEGY AND PLAN IDENTIFICATION 4.1 DEVELOPING THE STRATEGY Transport is a derived demand and the decision to make a journey and the characteristics of that journey such as destination, mode of travel, time of departure are governed by four main influences or drivers. These are economic, land use, behaviour and modal characteristics. By changing one of these four parameters the way some journeys are made will change. Development of a genuinely strategic approach to transport provision has been difficult to achieve in previous studies because of the problems of estimating the total demand for travel by all modes. The strategy development process therefore starts from a total number of trips which need to be accommodated. By changing the relative influence of the drivers of change the number of trips by each mode is changed and an optimum strategy can be developed which satisfies both national and local objectives. The approach used in the Study for the development of an overall strategy as illustrated in a simplified form in Figure 4.1 below. The appraisal process, as summarised in this Chapter, is fully reported in the Phase 3 Strategy Development Report. In summary the process begins with the definition of a Reference Case, which encompasses the forecast demand for travel by the various modes given the continuation of present trends in transport provision, travel costs and behaviour. This is followed by an examination of the main effect of interventions under the four identified Drivers of Change i.e. Economic, Modal, Behavioural and Land Use. A number of Sensitivity Tests then follow to assess the effect of more extreme interventions to each of the drivers. Reference Case Travel Demand Economic Intervention Modal Measures Behavioural Change Land Use Policies changing the cost of travel changing the transport network changing travel choices changing the need to travel Strategy Options Institutional Change Chosen Strategy Figure 4.1 The Strategy Development Process 40
48 4.2 THE ELEMENTS OF THE STRATEGY The Reference Case The Reference Case is designed to indicate future conditions if current levels of investment, changes in behaviour and economic trends are generally in line with present conditions. The corresponding investment in transport has been confined to that identified in the current Local Transport Plans for the West Midlands and surrounding Shire Counties together with identified investment by Centro in an approved strategy of Showcase Bus schemes and extensions to Midland Metro Line 1 and other bodies such as the SRA and Railtrack and the Highways Agency (including the privately-funded Birmingham Northern Relief Road). During the course of the Study, Central Government have announced increased spending in the form of the Ten Year Plan, which in turn could provide increased resources for the constituent Public Authorities. This additional spending is not included in the Reference Case investment levels.. A summary of Reference Case schemes and initiatives is shown in Appendix C. Levels of intervention in the four fundamental influences or drivers that could bring about significant change in the way people travel have been identified and these are summarised below Behavioural Change changing travel choices. The primary goal of interventions under this sub-strategy would be to develop the role of hearts and minds measures to encourage sustainable travel behaviour. The challenge is to change travel habits in favour of alternative modes to the private car such that people use their cars less and travel in a more efficient, economic and sustainable way. The 1998 Integrated Transport White Paper (ITWP) identifies ways of delivering an integrated transport system and places great emphasis on the need for a change in travel behaviour and attitudes. A number of travel behaviour programmes have been developed throughout the West Midlands but there is a perception these have lacked co-ordination and continuity. Measures that are designed to influence and change travel behaviour but do not form part of an integrated package would individually only be expected to achieve a small modal shift. However it is likely that existing travel behaviour programmes will continue to develop over the coming years. Bearing in mind the lack of institutional capacity at present for a regional programme to be introduced we would not expect more than perhaps a 5% modal shift to be achieved by a combination of measures and this value was used in the Reference Case. With greater investment and coordination of efforts, including promotional activities to raise awareness of the benefits of using alternatives such as Bus Showcase and Midland Metro and the consequences of travel choices, a reduction of 5% in car trips would be achievable and this was used as the main intervention level. The sensitivity test initially postulated an additional 10% reduction in car driver trips Economic Instruments changing the cost of travel. The cost of travel represents a strong influence on personal travel characteristics. Because a large proportion of the cost of car travel is fixed and paid in advance; depreciation, insurance and maintenance, the actual perceived cost of car journeys is often little more than the price of fuel. Consequently a major change in external point of use cost is required to effect a significant modal shift. These changes in cost can be effected in a variety of ways including congestion charging, parking (workplace and publicly available) and fuel costs. Alternatively the change could be effected by substantially reducing the cost of public transport fares. 41
49 For the main intervention level the effect of a 20% reduction in the perceived generalised cost of private motoring relative to public transport was assessed. The sensitivity test assumed that a much larger change in costs such that the perceived generalised cost of travelling by car equalled that by public transport Modal Measures changing the transport network. All the currently available modes of travel in the Study Area including walk, cycle, bus, car, and rail as well as air for longer distance travel must play an appropriate part in any realistic transportation strategy. No single transport mode can satisfy all the objectives of a preferred strategy. The interventions that are appropriate under the Modal driver consist of complementary measures and schemes for the various modes together with specific proposals for achieving an improved integration between modes. Details of the levels of intervention incorporated in the modal driver and sensitivity tests are given in the Phase 3 Strategy Development Report and vary from moderate levels of infrastructure investment for each mode to a significantly higher level for the sensitivity test Land Use Policies changing the need to travel. The interventions made under this driver heading aim to reduce the need to travel by changing the spatial location of transport generators. These include housing and attractors, such as employment. The main land use intervention examined in this Study relates to halting or reversing the population drift away from the central urban areas. Two sensitivity tests were used at the strategy development stage. These land use scenarios were developed in conjunction with representatives of the Government Office for the West Midlands (GO-WM) and the planners working with the Local Government Association on the Regional Planning Guidance Review. These scenarios were defined as follows:- The Base Case assumption that the drift of population away from the central urban area would continue. Sensitivity Test 1 assumed that the population drift is halted. For the period , the household target figure for Metropolitan Area zones has been increased by household (the level of intra-regional migration implied by RPG11) and the figures for the period by the same amount. The figures for the rest of the region have been reduced by the same amounts. The increase in households has been allocated on the basis of the existing number of households in each zone. Population figures were derived by applying forecast household size figures. Sensitivity Test 2 represented a reversal of the present trend to reintroduce residential development into the urban centres of the conurbation. This would represent a major land use change increasing the in population in central Birmingham by an additional 66,000 people, with some increase in the other main urban centres and a corresponding reduction in outer Study Area population. The distribution of employment and other trip attractions remained the same as for the Reference Case for both land use sensitivity tests. The Local Government Association subsequently recommended that the Multi-Modal Study should adopt Sensitivity Test 1 halting the population drift as the preferred land use strategy and this was agreed by the Steering Group. 42
50 4.3 STRATEGY OPTIONS A series of what if scenarios were tested for 2011 and 2031, combining various levels of intervention over and above the Reference Case which represents the continuation of present trends and initiatives. The following sequence of tests was used:- Each of the economic, behavioural and modal drivers at moderate levels of intervention were applied individually to the Reference Case to determine their separate effects; All three of these drivers were applied together, at moderate level, to the Reference Case to form the Central Case Finally the variable drivers, economic, behavioural and modal (land use being fixed), were applied individually to the Central Case at the higher level of intervention. An Appraisal Summary Table, (AST), was prepared for each scenario using the Multi-Modal version of the standard AST procedure covering environmental, economic, safety, accessibility and integration issues and the performance of each was also compared with the Study s other stated objectives. The scenarios were also assessed from an operational point of view using the Strategic Transportation Model and using main indicators such as modal share, total vehicle-kilometres, vehicle-hours and decongestion benefits. The results of the appraisal process, which are fully detailed in the Phase 3 Strategy Development Report, suggested four initial possible options for a chosen strategy :- Option A Option B Option C Option D The Central Case using moderate intervention levels in three drivers i.e. behavioural change, economic instruments and modal measures; The Behavioural Sensitivity Case using the Central Case measures plus the higher level of behavioural change; The Economic Sensitivity Case using Central Case plus the higher level of economic intervention; The Modal Sensitivity Case which adds the higher level of modal intervention to the Central Case. Option A, the Central Case, would address the more immediate transport problems of the Study Area, requiring an overall transport investment of around 3bn over the 30 year Study period in addition to the estimated 2bn worth of investment (including BNRR) included in the Reference Case. This option reduces peak hour car trips (excluding motorway traffic) by 10% relative to the Reference Case. In the short term (2011) Option A reduces the demand for car travel to current day levels. Option B includes the effect of a 15% modal shift due to behavioural change relative to the Reference Case which also includes an assumed 5% change. Again comparing growth in demand for car travel, excluding motorway trips, in the long-term only Option B could keep car trip making to current levels or below. The Study s Steering Group has expressed doubts as to whether such a level of behavioural change could be realistically achieved. If the probable maximum behavioural change achievable is considered to be somewhere between the two levels tested then higher intervention levels in modal and economic measures would be required to keep car trips to current levels. This is not the same as keeping congestion levels at the current levels because the modal intervention adds some capacity to the highway system, targeted to achieve the wider objectives of the Study. Option C contains a higher level of economic intervention that is equivalent to adding 2.50 to 3.00 to the average car trip in the conurbation (compared with the Central Case figure of around 1.00 per trip). The modelled effect of this intervention is a shortening of average trip length in the conurbation over the 30-year period as well as a decrease in car trips compared with the Central Case. 43
51 Although Option D, the Modal Sensitivity test, satisfies significantly more in terms of the Objectives, the scale of investment of 9bn to 12bn is of an order of magnitude higher than the other Options described above. The practicability of achieving this step change level of transport infrastructure provision for all modes even in 30 years was assessed during the Plan Development and Option Appraisal phase of the Study. 4.4 TOWARDS A PREFERRED STRATEGY A principal target of the strategy adopted by the Study was to stabilise car usage in terms of total car trips while satisfying total travel demand. However, it was recognised that concentrating on traffic reduction in congested urban areas without providing real alternatives would: Encourage more and longer single-purpose trips to be made to out-of town locations Increase pressures for Greenfield employment and housing sites Reduce investment in urban areas; and Reduce the potential re-use of brown-field sites. A strategy focused on a single driver or, in the case of the modal driver, a single mode be it walk/cycle, roads, bus, Metro or heavy rail will not achieve the objectives. An optimum balance needs to be achieved across all modes, building on the strengths of each mode, but investment in transport infrastructure alone will not be sufficient. Viable modal improvements will need to be underpinned by significant behavioural changes and economic measures to influence such changes. In particular, if the aims of the Ten Year Plan for Transport, such as reducing congestion levels, are going to be achieved within a realistic funding regime, all three drivers have to be incorporated within the strategy. Table Strategic Intervention Levels Drivers of Change Short Term (2011) Long Term (2031) Behavioural Change 5% reduction in car trips* 10% reduction in car trips* Economic Instruments Reduce differential between car and public transport travel costs Equalise car and public transport travel costs. Modal Measures Moderate intervention in all modes Moderate to high intervention in all modes Land Use Halt current population drift Halt current population drift * in addition to the 5% reduction in car trips included in the Reference Case The appraisal of strategy options identified the combination of options which appeared to best meet the Regional and Local Objectives in the short and longer term. The probable levels of intervention that would be required in the four drivers of change to achieve the Objectives are summarised in Table
52 5.0 PLAN DEVELOPMENT AND APPRAISAL 5.1 APPROACH TO PLAN DEVELOPMENT The Audit Phase of the Study examined current and future transport networks and problems in the Study Area. During this phase the Study team carried out a detailed review of local transport objectives and current and future problems and opportunities. The wide range of proposed schemes and measures identified in the West Midlands and Shire Counties Local Transport Plans together with the current programmes from Centro, Railtrack and the Highways Agency were included in the modal interventions considered in the subsequent phases of the study. During both the Strategy and Plan Development Phases, consultations continued with members of the Study Steering Group and sub-groups, and the Wider Reference Group. The membership of these groups includes representatives of transport authorities and operators, environmental groups, business and freight interests and others. From these consultations and other work by the Study Team, previously identified problems and their causes have been further examined and possible solutions developed. In particular the interactions of problems and proposed solutions for individual transport modes have been considered. Many of the potential improvements and changes considered in the Plan Development phase are already well known, and often tried and tested. They may include better information systems, high quality public transport, improved junctions, better highway maintenance, persuading people to use cars less, etc. Very few changes in transport provision are likely to be radical, but there will be some. These could involve high-tech approaches to control of speed (to improve safety) and electronic linking of vehicles (to improve safety and road capacity). These measures are not expected to be in universal use until the second half of the plan period because of the infrastructure required and the need to equip most vehicles with the necessary equipment. The Plan Development process has therefore had to take into account changes that are already available and some that are still being developed. The process broadly covered possible plan options for sub-areas as well as area-wide schemes, measures and initiatives i.e. The western conurbation including the Black Country, The central conurbation around Birmingham The eastern side of the Study Area including the M42 corridor, Area-wide schemes, measures and initiatives based on behavioural change and the use of economic instruments in addition to modal intervention measures across the transport spectrum 5.2 PLAN APPRAISAL METHODOLOGY The Plan Option Appraisal process was based on the Guidance on Methodology for Multi- Modal Studies (GOMMMS) issued by DETR in March The approach adopted worked within the appraisal framework provided by the five Government objectives for transport of environment, safety, economy accessibility and integration as outlined in Chapter The Appraisal Process The New Approach to Appraisal (NATA) was introduced in the Government s white paper A New Deal for Transport. This approach is geared to three purposes: choosing between different options for solving the problem prioritising between proposals; and assessing value for money. An important element of NATA is the inclusion of an Appraisal Summary Table. The process adopted in this Study relied on the use of full or partial Appraisal Summary Tables for elements and layers of the Plan together with an assessment of performance against 45
53 Regional and Local Objectives. Plan options were explicitly modelled as far as possible using the Strategic Transportation Model (STM) to assess the operational performance of each package. Outputs from the STM were input into DETR TUBA (Transport User Benefit Assessment) computer programme to determine transport economic efficiency on a multimodal basis. The Plan Development and Appraisal process is comprehensively reported in the Study s Phase 4 and 6 Report Model Forecasts To ensure that the best estimate of the current trend is included in future forecasts, a group representing Local Government Association planners have provided district level indications of population, households, employment and employed persons for 2011, 2021 and Household figures were controlled to DETR regional forecasts at 2011, 2021 and an extrapolated forecast to Population figures were derived by applying forecast average household size figures and car ownership projections from National Road Traffic Forecasts (NRTF 1997). Motorway through-traffic movements, which were not included in the STM, have been estimated from other traffic survey sources and future year forecasts are based on NRTF An additional important forecasting issue for WMAMMS is the likely future growth at Birmingham International Airport. Estimates of potential additional future trips by mode for the Airport have been made and these have been incorporated into the WMAMMS forecasts. It is noted that rail trips with both origin and destination outside of the Core Study Area and Rail Freight movements are not included in the STM and consequently benefits to these trips cannot be quantified and included in the economic assessment. The overall benefits that would accrue to rail users will therefore be underestimated Economic Analysis The model outputs from the package tests have been input into the TUBA programme to enable assessment of user benefits compared with the Reference Case and a comparison of discounted benefits with costs. In view of the minimum data input required for the economic evaluation i.e. 60 input matrices per year tested, the economic evaluation has been based on a single year, 2031, with incremental comparison of each package. This is in line with advice in GOMMMS for initial testing of Plan Options. All economic results quoted in this paper are in year 2000 values discounted at 6% from 2031 to The transport user benefits referred to relate principally to user timesavings plus vehicle operating costs for private vehicles. Accident savings are not incorporated in TUBA. Cost Estimates for all measures tested in the 2031 options have been undertaken using the best available data. We believe that the accuracy of package costs is to within +/-10%, although this level of accuracy should not be ascribed to individual schemes within packages. 5.3 SEQUENCE OF PLAN OPTION APPRAISAL A logical sequence of incremental package tests shown in Figure 5.1 has been structured to appraise the relative performance of options without resorting to one-off tests for each and every option, which in the context of the scale and complexity of the Study Area would have been impracticable. The layered tests take the Reference Case as a baseline and incrementally apply four layers of packaged Plan Options. Some re-iteration is required in order to identify the merits of individual plan options where these are likely to be either exceptionally contentious or to have marginal economic viability. 46
54 Reference Package REFERENCE CASE Reference Case including Land Use Sensitivity Level 1 (stopping the drift) and 5% behavioural change. 1 st Layer Package MODIFIED CENTRAL CASE Modal Driver schemes (as Central Case) plus Land use Sensitivity 1. No additional Behavioural change or Economic measures 2 nd Layer Packages WESTERN CONURBATION Base + enhanced Highway Package Base + enhanced P.T. (1) Package CENTRAL CONURBATION Base Package Base + enhanced P.T. package EAST SIDE Base Package Base + enhanced Highway Package Base + enhanced P.T. Package (no M42 widening) 3 rd Layer Package (1) Public Transport COMBINED PACKAGE Selected Plan Options from Layer 1 and 2 4 th Layer Packages Heavy Rail Regional Express Rail Strategic Highways Motorway Box; Western Bypasses Bus Park & Ride Economic Measures Alternative Rail-based, Cordon Super strategic charging and Showcase P&R (2) ERP (3) standards Behavioural Change Additional 10% shift away from car (2) (3) Park and Ride Electronic Road Pricing DRAFT RECOMMENDED 2031 PLAN FIGURE 5.1: LAYERED PACKAGES USED IN PLAN OPTION TESTING 47
55 The Reference Case The baseline for the incremental testing and economic evaluation of Plan Option packages was the Reference Case. This encompasses the schemes and initiatives that are currently committed across the spectrum of transport authorities and providers in the Study Area. Where there are identifiable trends in the provision of transport these have also been included, for example the Showcase Bus routes. The Reference Case forms the baseline against which all other possible interventions are compared and it s main components, which are either committed or reasonable extrapolations of existing trends, are shown in Fig. A1 of Appendix A and are listed in Appendix C. 1 st Layer Package - Modified Central Case This package included additional and enhanced Showcase Bus, LRT Metro and heavy rail schemes, highway and integration measures that could be implemented in the short to medium term. The package, developed from the Strategy Phase Central Case, was modified by the exclusion of the behavioural and economic changes. 2 nd Layer Packages Western, Central and East Side Conurbation A series of Plan Options Packages have been appraised for the western, central and eastern parts of the conurbation with varying degrees of emphasis on either public transport or highway options. 3 rd Layer Package Combined Package An area-wide Combined Package was formulated, selecting those Layer 1 and 2 Plan Options which the appraisal process indicated to be economically and operationally viable and which contributed towards the achievement, based on qualitative assessments, of national, regional and local objectives. 4 th Layer Area-wide Measures and Initiatives The appraisal of the 4 th Layer packages of area-wide plan options have been based on additions and modifications to the 3 rd Layer combined package of measures. In summary these appraisals have identified the following area-wide components for incorporation into the development of the 2031 Plan as detailed in the following Chapters of this Report: - The Behavioural Change initiatives; - Economic Measures (Road User Congestion Charges); - An alternative Super Showcase Bus standard; - A Regional Express Rail system; - A proposal for strategically located Park and Ride sites; - Strategic Highway proposals. 5.4 A SUMMARY OF THE 2031 PLAN The development of the 2031 Plan from the identified outline Strategy involved the package testing of over 150 individual plan options and schemes. Many of these suggestions came from Local Authorities, special interest groups, Centro, and Government Agencies in addition to the Study Team s own ideas. There are three principal differences between the Multi-Modal Study and previous work. Firstly the starting point is the overall demand for movement up to the end of the Study 48
56 period. Secondly, the influence and incorporation of behavioural changes and economic changes which affect driver trips has been used to develop the strategy and hence the Plan measures. Thirdly the interaction between different modal measures, particularly innovative public transport improvements and highway schemes, has been considered within the same study process. This approach reflects current Government thinking encapsulated within the Study objectives of integration, economy, safety, accessibility and environment. However not all the measures are capable of being assessed within a strategic transport model; they include such intangibles as improving the image of public transport, integrated ticketing and the effect of health education on the increased use of sustainable modes such as walking and cycling. It is important to stress the integration aspects of the proposals in each area which have strongly influenced the Study approach and it should be noted that all measures incorporated in the 2031 Plan include those contained in the Reference Case. The strategy chosen envisaged the levels of intervention shown in Table 4.1 and the results of the plan option appraisals have been used to confirm the level of intervention required in terms of modal, behavioural and economic measures to achieve the objectives. The outcomes of the Plan Development and Option Appraisal process has led to the formulation of our recommendations for a 2031 Plan covering the three main components of the Strategy, that is Modal, Economic and Behavioural Measures. These are set out in detail in the following Chapters of this report. The main components of the 2031 Plan, as identified by the Option Appraisal process, are summarised below: Modal Infrastructure Networks The 2031 Plan recommends an integrated public transport network, with a variety of modes including heavy rail, light rail and bus services in conjunction with complementary improvements to the strategic highway network. Appendix A contains a series of network plans illustrating the Reference Case and recommended 2031 Plan networks for each mode. Showcase and Super Showcase Bus The Bus Showcase improvements will continue to be delivered through the Local Transport Plan, with highway authorities endeavouring to introduce greater levels of bus priority, compared to those currently provided, on the existing Bus Showcase routes. Bus priority measures will be introduced where possible to improve service reliability and journey times, with a target for improving average bus speeds to an average of around 95% of car speeds in the peak periods. In addition to bus priority, on-street improvements for passengers will include easy boarding facilities, improved shelters and real time information. The bus companies will renew their fleets with a variety of low floor vehicles, including both single and double deck buses and articulated buses. Well before 2031 the majority of the West Midlands Journey to Work Area bus routes should be improved to this standard, with the Bus Showcase network extended out of the core of the conurbation to the peripheral towns. LRT Metro The recommended 2031 light rail network consists of the following ten routes, mainly centred on Birmingham, Wolverhampton and Walsall (these are in addition to Midland Metro Line One and the currently planned extensions to Five Ways and Brierly Hill):- Birmingham to Walsall Birmingham to BIA via Chelmsley Wood Birmingham to BIA via Sheldon Birmingham to Shirley Solihull Birmingham to Moseley Kings Heath Maypole 49
57 Birmingham to Northfield Birmingham to Quinton Halesowen (with branch lines to Bartley Green and Londonderry) Walsall to Wednesbury Walsall to Wolverhampton Wolverhampton to Dudley The two routes in East Birmingham to BIA, via Chelmsley Wood and Sheldon, would be connected into a loop to form a continuous route. Regional Express Rail The major heavy rail innovation in the 2031 Plan is the introduction of the Regional Express Rail network. The network has been discussed with all the major rail industry partners, including the SRA, Railtrack and Centro. The appraisal process has indicated the economic and operational benefits offered by developing such a network. The RER network would operate on the following lines: Coventry Birmingham Wolverhampton Cannock Walsall Birmingham Nuneaton Lichfield Birmingham Redditch Tamworth Birmingham Worcester Leamington/Warwick Birmingham Kidderminster Walsall - Birmingham Shirley Stratford A series of major strategic Park and Ride sites are suggested on the edge of the conurbation to operate in conjunction with the RER. Heavy Rail In addition to the RER network a number of heavy rail schemes are identified as part of the 2031 Plan. The following major schemes, although essential for the full implementation of the RER would have major benefits to Inter-city through rail services and passengers. It has not been possible within the remit of this Study to quantify such benefits and therefore the economic analyses completed rely solely on benefits to local and regional travel:- Birmingham New Street: new Underground Station and Tunnels Four-tracking WCML Coventry-Birmingham (Beechwood Tunnel to Stechford) Four-tracking WCML Birmingham -Wolverhampton Four-tracking Birmingham to Water Orton A further three schemes are included in the 2031 Plan which would enable freight diversion away from the central Birmingham rail network: -. Highways Electrification Walsall Rugeley Electrification Nuneaton Walsall via Sutton Park Re-open Stourbridge Walsall Lichfield Line (Freight only) As a result of the appraisal process, the following main highway components of the 2031 Plan have been identified as being most appropriate in terms of the overall strategy:- The M5/M6 corridor should retain its role as the north-south strategic route for long distance through traffic; A link between the M54 and the M6/Birmingham Northern Relief Road to relieve M6 Junction 8 to 10A and to improve access to the M54 and Telford; 50
58 Western Bypasses of Wolverhampton and Stourbridge, coupled with strengthening of the road hierarchy in the Black Country, to improve access to and within the Black Country and to assist regeneration; Widening of the M42 between Junctions 3 and 7 to generally to 4 lanes with an additional auxiliary lane between Junctions 3a and 7 together with junction improvements is necessary to accommodate the projected growth in this corridor, including the expansion of Birmingham International Airport; The introduction of Active Traffic Management (ATM) on the existing motorway box to make best use of the existing routes; and The introduction of Red Route and local highway capacity improvements mainly to facilitate public transport priorities for both bus and LRT Economic Intervention In terms of the overall objectives of the Study, road user charging in the form of cordon or area based congestion charging or full electronic road pricing appears to offer greater flexibility and mode shift potential than other possible economic interventions. This is not to rule out such measures as lower bus fares, workplace parking levies or motorway slip-road tolling which may have a less strategic role to play in the shorter term. A key part of the Strategy and Plan is the introduction of road user charges to bring the perceived cost of travel by car nearer to public transport travel costs. In the shorter term, it is anticipated that congestion charging schemes would be gradually introduced based on cordons around the major centres in the conurbation, possibly starting with Birmingham City centre. The responsibility for implementing such schemes would rest with the individual Metropolitan Councils but an integrated approach across the area would be desirable. In the medium to long term the introduction of full electronic road pricing is recommended and this would need to be delivered at regional if not national level Behavioural Change The primary goal of this element of the strategy is to develop the role of hearts and minds measures to encourage sustainable travel behaviour. The challenge is to change travel habits in favour of alternative modes to the private car such that people use their cars less and travel in a more efficient, economic and sustainable way. From the Strategy development phase the Steering Group agreed the feasibility of a targeted intervention of 10% modal shift due to changes in travel behaviour. Overall, it is believed that this is a conservative estimate. The social changes that will take place over the next thirty years will be considerable. Whilst historically car usage has followed an increasing trend, it is conceivable that changes in the awareness of global issues and local behavioural changes will see a slowing down of this trend. Nevertheless, we believe the estimate of 10% modal shift due to behavioural change is one that can be achieved on the basis of comparative experience. As part of the Study s audit phase an assessment of current and future measures to raise travel awareness was completed to determine the extent to which Local Authorities have implemented and monitored initiatives to influence or change behaviour. A state of knowledge review on the effectiveness of such measures was carried out to help the WMAMMS Team examine the expected benefits and long-term impact of the Study s proposed Behavioural Driver as part of the Strategy Development process. The assessment of current and future initiatives revealed how travel behaviour programmes have been developed throughout the West Midlands, however, these are not co-ordinated, and suffer from a lack of continuity. Travel Awareness initiatives are generally planned at district level, although Centro has promoted some wider initiatives, and is often a partner at a local level. These programmes would achieve a modest change in travel behaviour and car 51
59 usage. It is believed that these existing initiatives cost in the region of perhaps 1m per annum over the whole conurbation. In view of the major economic and social benefits which might accrue from such initiatives, it is recommended that resources for influencing and changing travel behaviour should be substantially increased to at least 5m per annum. As a complementary measure in encouraging behavioural change it is also recommended that expenditure across the Study Area on improving walking and cycling facilities is increased from the current level of 4m to 10m per annum. 5.5 INVESTMENT COSTS The broad investment costs of the 2031 Plan over the 30-year implementation period are shown in Table 5.1 and these total 7.67bn at year 2000 prices. The bulk of the investment, 80% is in respect of public transport networks but it is again noted that this includes substantial expenditure, in the order of 2.6bn for national heavy rail schemes at Birmingham New Street and the four-tracking of the Wolverhampton to Birmingham WCML. This figure also includes the four-tracking of the Coventry to Birmingham WCML from Beechwood Tunnel to Stechford, originally considered as a committed scheme in the Reference Case, which has now been added to the 2031 Plan at an estimated cost of 400m. Annual operating and maintenance costs for the schemes and measures proposed, as summarised in Table B.1 (Appendix B), have been included in the economic analyses. These are of course additional to the annual operating and maintenance cost associated with the Reference Case. Table 5.1 Estimated Investment Costs: Recommended 2031 Plan 2031 Plan Component 2031 Plan Modal Measures Only 2031 plan Modal plus Economic Measures 2031 Plan Modal Plus Economic Measures and Behavioural Change Investment Costs in Year 2000 Prices ( m) Modal Measures Heavy Rail/RER Network Light Rail Network Showcase Bus Network Highway Network Economic Intervention Road User Charging Systems Behavioural Initiatives Changing Travel Behaviour* 4,180 1, ,052-4,180 1, , ,180 1, , Total Investment Costs 7,215 7,335 7,670 * includes investment in walking and cycling facilities KEY TRANSPORT FORECASTS Total Demand In the Study Area, total demand for person movement increases from current levels of nearly 2.5 billion trips per annum to over 3.1 billion by 2031, an increase of almost 27%. Regardless of how people travel this change presents a significant challenge in accommodating this level of movement. Table 5.2 compares the change in travel movement by each mode if only the Reference Case measures are implemented with the situation if the component modal, economic and behavioural measures of the 2031 Plan are implemented. 52
60 It has been noted earlier that a 5% behavioural change is assumed in the Reference Case i.e. 5% of existing car trips transfer to other modes. In addition the major improvements in the Reference Case include over 30 Bus Showcase Routes, Metro extensions and heavy rail improvements. Major road improvements are largely confined to Birmingham Northern Relief Road. These changes are reflected in the increase in public transport movement which is significantly higher than road traffic because of behavioural change and the scale of the public transport changes. Implementation of the full strategy in respect of modal, economic and behavioural measures limits the total number of person trips by road vehicle in 2031 to close to 1999 base year levels both in the am peak hour and in terms of total annual trips. The reduction in occupant mileage by road vehicle (excluding bus) compared with the Reference Case is not so marked because the reduction in levels of road congestion leads to an increase in average trip length in the STM. The behavioural and economic measures tend to counter this trend. Table 5.2 Travel Forecasts by Mode 1999 Base Year 2031 Reference Case 2031 Plan Modal Measures Only 2031 Plan Modal and Economic Measures 2031 Plan Modal and Economic Measures and Behaviour Change Million trips per annum (% change from Reference Case) Road Vehicles (except Bus) 1,923 2,324 2,245 (-3.4%) Bus (-0.8%) Rail (light and heavy) ,222 (-4.4%) 735 (1.1%) 155 (139.3% (154.1%) Total 2,457 3,112 3,112 3,112 3,112 Million occupant-km pa (%Change from Reference Case) Road Vehicles (except Bus) 34,871 40,168 39,443 (-1.8%) Bus 3,373 4,466 4,702 (5.3%) Rail (light and heavy) 1,870 2,329 4,037 (73.3%) Modal Split Road - AM Peak Hour Trips Modal split in AM Peak Hr Bus - AM Peak Hour Trips Modal split in AM Peak Hr Rail (light and heavy) - AM Peak Hour Trips Modal split in AM Peak Hr 475, % 135, % 15, % 573, % 203, % 25, % 547, % 207, % 55, % 38,661 (-3.8%) 4,708 (5.4%) 4,277 (83.6%) 534, % 218, % 63, % 2037 (-12.3%) 920 (26.5%) 155 (154.1%) 36,646 (-8.8%) 5,718 (28.0%) 4,246 (82.3%) 481, % 255, % 63, % Modal Measures Only The effect of the recommended 2031 Plan Modal measures, including the substitution of Showcase Bus along the Metro routes included within the Plan, is to reduce the total road vehicle-kilometres travelled by about 1.8% relative to the Reference Case. As set out in Table 53
61 5.2, the total number of passenger-kilometres travelled by bus and rail increase by about 5% and 73% respectively relative to the Reference Case. The proportion of total trips by public transport in the am peak period increases from 29% in the Reference Case to 32%. Modal and Economic Measures The main effect of the 2031 Plan with Electronic Road Pricing (ERP) would be a 4% reduction in annual road vehicle-kilometres travelled relative to the Reference Case. During the am and pm peak periods the reduction would be greater at around 9%. With the introduction of ERP, in addition to modal measures, bus passenger kilometres would increase by about 5% and rail passenger kilometres by about 84% relative to the Reference Case. Overall the proportion of trips by public transport in the am peak period would increase from 29% in the Reference Case to 35% with the 2031 Plan including a full ERP scheme. Modal and Economic Measures plus Behavioural Change Applying the targeted behavioural change to the 2031 Modal and Economic measures produces a further shift of 10% of car trips to other modes. For the purposes of assessment this shift is assigned to the bus mode but in reality a significant number of these trips, particularly the shorter trips, are expected to transfer to the slow modes i.e. walk and cycle. The main effect of the combination of Modal and Economic measures and Behavioural Change would be a 9% reduction in annual road vehicle occupant kilometres travelled relative to the Reference Case. The am and pm peak reduction would be greater at around 12 to 13%. Bearing in mind the comment above relating to slow mode transfer, the modelled proportion of trips by public transport in the am peak increases from 29% in the Reference Case to 40% with the full implementation of the 2031 Plan Corridor Movements Figure 5.2 shows the screen lines used to assess changes in person movement in a number of principal corridors across the Study Area. Table 5.3 shows total two-way trips across each screen line in the morning peak in 1999 and 2031, modal share and peak uni-directional road traffic flows.. The screen line around the centre of Birmingham (1-5) shows the lowest proportionate increase in the 2031 Reference Case. This is compatible with what has happened over the last decade where car trips into Birmingham have increased by less than 1% per annum whilst rural traffic has increased significantly more. Several other factors are responsible for the difference between the area-wide total trip increases and modal shares shown in Table 5.2 and the individual screen line measures shown in Table 5.3:- trips on the regional motorway links, increase proportionately more than inside the conurbation; the 2031 Plan LRT network is centred on Birmingham, Wolverhampton and Walsall and improved public transport accessibility to these zones increases the total number of trips attracted to each, particularly for non-work, shopping and leisure purposes; the RER and LRT services included in the Plan and centred on Birmingham will mean that more cross conurbation public transport trips will pass through the centre. 54
 Screen Lines Total Trips One-way peak flow Mode Split by %age (total motorised trips) (2-way) vehs/hr Bus Light Rail Heavy Rail Road Screen")
62 Figure Screen Line Locations Table Screen Line Vehicle and Person Movements (AM Peak Hour) Screen Lines Total Trips One-way peak flow Mode Split by %age (total motorised trips) (2-way) vehs/hr Bus Light Rail Heavy Rail Road Screen Lines 1-5 (Central Birmingham) Base Year Reference Case Modal Measures Only Full Plan Screen Line 6 (M42 Corridor) Base Year Reference Case Plan Modal Measures Only Full Plan Screen Line 7 (E. Birmingham/Solihull) Base Year Reference Case Plan Modal Measures Only Full Plan Screen Line 8 (N. Wolverhampton/Walsall) Base Year Reference Case Plan Modal Measures Only Full Plan Screen Line 9 (North Black Country) Base Year Reference Case Plan Modal Measures Only Full Plan Screen Line 10 (Stourbridge/Black Country) Base Year Reference Case Plan Modal Measures Only Full Plan Screen Line 11 (M5 / A38 Corridor) Base Year Reference Case Plan Modal Measures Only Full Plan
63 5.6.3 Congestion and Journey Times As links in the highway network approach capacity a small increase in traffic produces a disproportionate increase in delay per vehicle. Conversely a small decrease in flow can produce a large decrease in congestion. The provision of additional highway capacity and better traffic management measures can also help in reducing congestion. Compared with the Reference Case, the 2031 Plan produces an overall decrease of 8.9% in total road vehicle kilometres but that this is made up of a 15% reduction on the non-motorway network and a 2.1% decrease on motorways in the area. The STM incorporates all the above factors and has been used to model the congestion delays in the Study Area compared to free-flow conditions for the base year 1999, and years 2011 and The results of this analysis are contained in Table 5.4 below. This indicates that the Ten Year Plan targets for congestion are met by the 2011 Plan proposals, with absolute annual congestion delay slightly lower at 78.9 million vehicle-hours than the 1999 base year value of 79.9 million vehicle-hours. The full 2031 Plan shows absolute congestion delay reduced to 72.9 million vehicle-hours, almost 10% below 1999 levels. Table Congestion Delay 1999, 2011 and 2031 Year Total annual vehicle-kms (x10 9 ) Total annual vehicle-hrs (x10 6 ) Total congestion delay annual vehicle-hrs (x10 6 ) Average congestion delay per vehicle-km. (1999 index=100) 1999 Base Year Reference Case Plan Reference Case Modal Measures Only Modal + Economic Measures Full Plan The improvement in highway network conditions is shown diagrammatically in Figures 5.3 and 5.4 in terms of network speeds and flow/capacity ratios respectively for the recommended 2031 Plan Modal Measures and for the full 2031 Plan. These can be compared with the Reference Case situation in 2031 as shown in Figure 3.1 and 3.2. Table 5.5 shows the change in modelled centre to centre peak hour journey times by mode for the 2031 Reference Case and the 2031 Plan compared with It illustrates the general improvement in both public transport and car journey times with the implementation of the 2031 Plan. Table 5.5 Changes in Modelled Average AM Peak Journey Times to Birmingham City Centre Compared with Base Year 1999 (in minutes) Year and Scenario Walsall Sutton Coldfield Solihull Redditch Bromsgrove Kidderminster Wolverhampton West Bromwich Dudley 2031 Reference Case - Car Bus Rail Full Plan - Car Bus Rail

64 Figure 5.3: Modelled Highway Network Speeds

65 Figure 5.4: Modelled Highway Flow/Capacity Ratios
Project Appraisal Using PRISM Simon Hubbard 28 th September 2004
 Project Appraisal Using PRISM Simon Hubbard 28 th September 2004 Introduction : Overview of Presentation - Option Appraisal Policy Context - Potential PRISM Applications - Use of the Model / Scale of the
150Intr Transport and Strategic Regeneration Welsh Assembly Government New M4 Project Magor to Castleton WelTAG Appraisal Report Stage 1 DRAFT 3 WORKI
 150Intr Transport and Strategic Regeneration Welsh Assembly Government WelTAG Appraisal Report Stage 1 DRAFT 3 WORKING DOCUMENT 1 Transport and Strategic Regeneration Welsh Assembly Government WelTAG Appraisal
Welsh Government M4 Corridor Enhancement Measures (CEM) Participation Report Executive Summary
 Participation Report Executive Summary") M4 Corridor Enhancement Measures (CEM) Participation Report Executive Summary Issue 5 August 2013 This report takes into account the particular instructions and requirements of our client. It is not intended
M4 Corridor Enhancement Measures (CEM) Participation Report Executive Summary Issue 5 August 2013 This report takes into account the particular instructions and requirements of our client. It is not intended
Executive Summary. Introduction
 Executive Summary 01 Introduction The City of Southampton lies at the western end of the South Hampshire sub-region. The wider urban South Hampshire area, consisting of Southampton, Eastleigh, Fareham,
UK Road Pricing Feasibility Study: Modelling the Impacts Elizabeth Cox 1 UK
 Abstract UK Road Pricing Feasibility Study: Modelling the Impacts Elizabeth Cox 1 UK In July 2003, the UK government set up a comprehensive study to examine how a new system of charging for road use could
MOVEMENT FOR GROWTH: The West Midlands Strategic Transport Plan Summary Report Public Consultation Draft
 MOVEMENT FOR GROWTH: The West Midlands Strategic Transport Plan Summary Report Public Consultation Draft The West Midlands Integrated Transport Authority (ITA) has developed a strategic transport plan
SWDP 4: Moving Around South Worcestershire. SWDP 4: Moving Around South Worcestershire. Managing Travel Demand
 SWDP 4: Moving Around South Worcestershire Managing Travel Demand A. Proposals must demonstrate that: the layout of development will minimise demand for travel, they offer genuinely sustainable travel
IPSWICH NORTHERN ROUTES STUDY. Stage 1 Progress
 IPSWICH NORTHERN ROUTES STUDY Stage 1 Progress 17 th January 2017 STUDY CONTEXT 2 The study is being funded in partnership with the Suffolk district and borough councils. Work forms part of the Suffolk
Long-term Plan Transport Proposal. 29 October 2014
 Long-term Plan Transport Proposal 29 October 2014 2 Table of Contents Introduction... 4 The Two Networks... 5 What will it cost?... 12 What are the benefits?... 15 Meeting the government s transport objectives...
Consultation response. February 2014
 Department for Transport National road and rail networks: draft national policy statement Consultation response pteg Support Unit Wellington House 40-50 Wellington Street Leeds LS1 2DE 0113 251 7445 info@pteg.net
Local Transport Plan. Implementation Plan ( )
") Local Transport Plan Implementation Plan (2011-2015) www.cheshireeast.gov.uk/travel Contents 1 Introduction 2 Initiatives to Ensure a Sustainable Future 3 Initiatives to Create Conditions for Business
Local Transport Plan Implementation Plan (2011-2015) www.cheshireeast.gov.uk/travel Contents 1 Introduction 2 Initiatives to Ensure a Sustainable Future 3 Initiatives to Create Conditions for Business
PUBLIC TRANSPORT LONG TERM VISION FOR MILTON KEYNES
 PUBLIC TRANSPORT LONG TERM VISION FOR MILTON KEYNES CONSULTATION January 2004 We are seeking comments on the final results and recommendations from a study (November 2003) of a long term vision for public
Greater Cambridge City Deal Executive Board. A428/A1303 Better Bus Journeys Scheme Public Consultation Outcomes and Next Steps
 Report To: Greater Cambridge City Deal Executive Board 3 rd March 2016 Lead Officer: Graham Hughes, Executive Director of Economy, Transport and Environment, Cambridgeshire County Council A428/A1303 Better
A Better Connected South Hampshire
 A Better Connected South Hampshire DfT Local Sustainable Transport Fund Bid December 2011 Executive Summary Executive Summary Transport for South Hampshire (TfSH) is delighted to submit a business case
Regional Travel Demand Management Plan
 Regional Travel Demand Management Plan Adopted October 2009 Quality for life Regional Travel Demand Management Plan Adopted October 2009 For more information, contact: Greater Wellington 142 Wakefield
Proposed Petone to Grenada Link Road Options
 Report 15.41 Date 2 March 2015 File TP/03/29/02 Committee Author Regional Transport Committee Chris Upton, Chair Chief Executives Forum Proposed Petone to Grenada Link Road Options 1. Purpose This report
Project Appraisal Guidelines for National Roads Unit CBA Audit Checklist
 Project Appraisal Guidelines for National Roads Unit 6.6 - CBA Audit Checklist October 2016 TRANSPORT INFRASTRUCTURE IRELAND (TII) PUBLICATIONS About TII Transport Infrastructure Ireland (TII) is responsible
Executive Summary ma. White. Black. paving blo. ving blocks. 0 mm wide
 4450 1250 min min max 120 Concrete blo 1500 ma White ving blocks 0 mm wide Black paving blo RAC Foundation for Motoring Motoring towards 2050 Roads and Reality 7 Road congestion is already seriously harming
ITC / CURACAO Seminar Managing Congestion in the West Midlands
 ITC / CURACAO Seminar Managing Congestion in the West Midlands 22 March 2007 Tom Magrath Projects Director, Centro West Midlands agenda Growth and regeneration City Region Development Plan to drive future
DAVID CARTER, DIRECTOR OF INFRASTRUCTURE
 REPORT TO: WECA COMMITTEE DATE: 30 NOVEMBER 2018 REPORT TITLE: DIRECTOR: AUTHOR: TRANSPORT UPDATE DAVID CARTER, DIRECTOR OF INFRASTRUCTURE JASON HUMM, HEAD OF TRANSPORT Purpose of Report: 1. To update
1. Background to the West Midlands 1.1 West Midlands and Future Transport
 1. Background to the West Midlands 1.1 West Midlands and Future Transport The West Midlands is at the heart of the UK s motorway network with the M6, M5, M40, M42 converging on and passing through the
Input from Engineers Ireland Into the Department of Transport s Statement of Strategy
 Input from Engineers Ireland Into the Department of Transport s Statement of Strategy 2008 2010 Table of Contents Page Executive Summary 3 Department of Transport Mandate and Mission (2005-2007) 4 The
Report to: Greater Cambridge Partnership Joint Assembly 18 January 2018
 Report to: Greater Cambridge Partnership Joint Assembly 18 January 2018 Lead officer: Chris Tunstall Greater Cambridge Partnership Recommendations from the Ely to Cambridge A10 Transport Study and proposed
WELLINGTON NORTHERN CORRIDOR. Project Summary Statement 21 December 2009
 WELLINGTON NORTHERN CORRIDOR Project Summary Statement 21 December 2009 1 Table of Contents 1. Purpose of Document 2. Strategic Context 3. Benefits 4. Project Scope and Economics 5. Implementation Plan
Milton Keynes South Midlands Growth Area Modal Shift Strategy. Stakeholder Workshop
 Milton Keynes South Midlands Growth Area Modal Shift Strategy Stakeholder Workshop 22 nd July 2008 Consultancy Team - Introductions Appointed by the MKSM Strategic Transport Board to help develop the Modal
THE APPLICATION OF SCOTTISH TRANSPORT APPRAISAL GUIDANCE TO THE ROAD TRAFFIC REDUCTION ACT. Paul Finch FaberMaunsell
 THE APPLICATION OF SCOTTISH TRANSPORT APPRAISAL GUIDANCE TO THE ROAD TRAFFIC REDUCTION ACT 1. INTRODUCTION Paul Finch FaberMaunsell In March 2002, the Scottish Executive published their Transport Delivery
SUSTAINABLE URBAN MOBILITY PLAN TRAINING WORKSHOP. Module 4 Problems, Vision and Objectives
 SUSTAINABLE URBAN MOBILITY PLAN TRAINING WORKSHOP Module 4 Problems, Vision and Objectives SUMP Problem Analysis: Important to know current mobility status: Draws from the data collection on urban mobility
Fishermans Bend Integrated Transport Plan Peer Review John Kiriakidis, GTA Consultants 28/03/2018
 Fishermans Bend Integrated Transport Plan Peer Review John Kiriakidis, GTA Consultants 28/03/2018 GTA creating transport that works 01 Preliminaries GTA creating transport that works Review scope : Review
Appraisal Summary Table (AST)
") Appraisal Summary Table (AST) TAG Reference Guidance for the Senior Responible Officer, Guidance for the Technical Project Manager Version Control Date Description Jan14 Definitive release 17/10/2013 Release
Appraisal Summary Table (AST) TAG Reference Guidance for the Senior Responible Officer, Guidance for the Technical Project Manager Version Control Date Description Jan14 Definitive release 17/10/2013 Release
Hilary Holden, City Access Programme. City Access congestion reduction proposals: Consultation Responses and Next Steps
 Report To: Greater Cambridge City Deal Executive Board 25 January 2017 Lead Officer: Hilary Holden, City Access Programme City Access congestion reduction proposals: Consultation Responses and Next Steps
This presentation is one of the support materials prepared for the capacity building program Building Leaders in Urban Transport Planning (LUTP).
.") 1 Cluster 1/Module 2 (C1/M2): Complexity of Urban Transport. This presentation is one of the support materials prepared for the capacity building program Building Leaders in Urban Transport Planning (LUTP).
1 Cluster 1/Module 2 (C1/M2): Complexity of Urban Transport. This presentation is one of the support materials prepared for the capacity building program Building Leaders in Urban Transport Planning (LUTP).
Freight transport policy and measures in Norway
 PIARC meeting and seminar 13-15 June 2005 in Ouagadougou Freight transport policy and measures in Norway Senior Adviser Hans Silborn, Norwegian Public Roads Administration Norway is a sparsely inhabited
campaigning by the Railway Development Society Limited
 campaigning by the Railway Development Society Limited Department for Transport A14 Challenge Team Roads Policy Great Minster House, 33 Horseferry Road, London SW1P 4DR Please Reply to: 24 Bure Close St.
9. Asset Management. 9. Asset Management. 9.2 Asset Management and the Shared Priorities. 9.1 Introduction. Headline Targets
 Headline Targets BVPI 223 - Principal Road Condition. BVPI 224a - Non-Principal Classified Road Condition. BVPI 224b - Unclassified Road Condition. BVPI 187 - Footway Condition. How we will tackle Asset
Northern Virginia Region Draft Needs Summary
 Needs Map: Need A A DEMAND The ability of communities around transit stations (particularly the areas within 1-2 miles of the stations and other travel hubs) to attract skilled workers and grow businesses
England s Economic Heartland Strategic Transport Forum 14 October 2016
 England s Economic Heartland Strategic Transport Forum 14 October 2016 A Major Road Network for England - a fresh approach to the roads that matter most David Quarmby CBE Rees Jeffreys Road Fund 2 3 Key
13. Traffic and Transport
 13. Traffic and Transport 13.1 Executive Summary The traffic impact of the Facility has been examined for both transport of materials and staff, and with regard to the latter, accessibility of the site
That will also contribute to achievement of a number of objectives and policies in the Regional Policy Statement.
 Board of Inquiry MacKays to Peka Peka Expressway Proposal Submitters Evidence Public Transport Voice 5 October 2012 Executive Summary Increasing modal share for public transport is a key outcome in the
3. THE RANGE OF PROJECTS PROPOSED FOR EVALUATION
 Prioritisation process for funding of competing Transport related projects (Auckland Perspective) Ayokunle Martins (Land Transport Programme Coordinator) Auckland Regional Transport Authority ABSTRACT
Henson, RR and Yousif, S
 A summary of freight issues raised in selected multi modal and roads based studies with reference to the North West of England Henson, RR and Yousif, S Title Authors Type URL Published Date 2002 A summary
Cheshire & Warrington Local Transport Body
 Cheshire & Warrington Local Transport Body Date of Meeting: Friday 21 December 2018 Report of: Roy Newton Subject/Title: Priorities for Studies and Business Case Development 1. Report Summary 1.1. The
Findings to Date UBC LINE RAPID TRANSIT ALTERNATIVES ANALYSIS 1. UBC Line Rapid Transit Alternatives Analysis Findings to Date
 Findings to Date LINE RAPID TRANSIT ALTERNATIVES ANALYSIS 1 Line Rapid Transit Alternatives Analysis Findings to Date March 2013 Findings to Date LINE RAPID TRANSIT ALTERNATIVES ANALYSIS 2 This document
PLANNING FOR TRANSPORT CAPACITY TO DELIVER THE WEST MIDLANDS REGIONAL ECONOMIC STRATEGY. Jo Baker, Mott MacDonald Kerry Schofield, Mott MacDonald
 PLANNING FOR TRANSPORT CAPACITY TO DELIVER THE WEST MIDLANDS REGIONAL ECONOMIC STRATEGY 0 ABSTRACT Jo Baker, Mott MacDonald Kerry Schofield, Mott MacDonald The nine Regional Development Agencies (RDAs)
Evaluation of Alternatives
 Chapter 9.0 Evaluation of Alternatives Chapter 9.0 provides a summary evaluation of the No Build Alternative and the Preferred Alternative. The evaluation contained within this chapter is an assessment
Consultation on Integrated Transport Block Funding FINAL. March Consultation Response. pteg Support Unit
 Consultation Response Consultation on Integrated Transport Block Funding FINAL Pedro Abrantes pteg Support Unit Wellington House 40-50 Wellington Street Leeds LS1 2DE 0113 251 7445 info@pteg.net 1. pteg
Swindon Joint Strategic Needs Assessment Bulletin
 Swindon Joint Strategic Needs Assessment Bulletin Bulletin: Economic Strategy Land and Infrastructure Key Points: Capacity constraints on Swindon s road and rail network pose a threat to securing sustainable
improving infrastructure
 Advantage West Midlands improving infrastructure heat mapping and decentralised energy feasibility study Malcolm Semple, Eccleshall Biomass Ltd, Staffordshire Advantage West Midlands The Regional Development
As acknowledged in the draft CCP, very little progress has been made in tackling emissions from transport. Transport emissions
 Transform Scotland Draft Climate Change Plan: Evidence to the REC Committee 2 February 2017 1. Introduction Transform Scotland welcomes the opportunity to give evidence to the REC Committee on the Policies
MOVEMENT FOR GROWTH: The West Midlands Strategic Transport Plan Public Consultation Draft
 MOVEMENT FOR GROWTH: The West Midlands Strategic Transport Plan Public Consultation Draft CONTENTS 1. 2. 3. 4. 5. 6. 7. 8. INTRODUCTION...01 CHALLENGES FOR THE WEST MIDLANDS...03 04 OUR VISION...05 06
A428 / Western Corridor brief. Background
 A428 / Western Corridor brief Background The Transport Strategy that has been developed to support the current Local Plan review outlines major investment in public transport as a pre-requisite to support
2004 FEASIBILITY STUDY UPDATE
 Austin-San Antonio Intermunicipal Commuter Rail District 2004 FEASIBILITY STUDY UPDATE December 2004 EXECUTIVE SUMMARY INTRODUCTION Almost 3 million people in Central Texas, living and working between
SECTOR ASSESSMENT (SUMMARY): URBAN TRANSPORT 1
: URBAN TRANSPORT 1") Greater Dhaka Sustainable Urban Transport Project (RRP BAN 42169) Sector Road Map SECTOR ASSESSMENT (SUMMARY): URBAN TRANSPORT 1 1. Sector Performance, Problems, and Opportunities 1. Dhaka, the capital
Greater Dhaka Sustainable Urban Transport Project (RRP BAN 42169) Sector Road Map SECTOR ASSESSMENT (SUMMARY): URBAN TRANSPORT 1 1. Sector Performance, Problems, and Opportunities 1. Dhaka, the capital
Government Policy Statement on Land Transport 2018/ /28. DRAFT (FOR ENGAGEMENT ) NOT GOVERNMENT POLICY February 2017
 NOT GOVERNMENT POLICY February 2017") DRAFT (FOR ENGAGEMENT ) NOT GOVERNMENT POLICY February 2017 Government Policy Statement on Land Transport 2018/19 2027/28 DRAFT GOVERNMENT POLICY STATEMENT Contents 1 Land transport context 1 A: Role of
DRAFT (FOR ENGAGEMENT ) NOT GOVERNMENT POLICY February 2017 Government Policy Statement on Land Transport 2018/19 2027/28 DRAFT GOVERNMENT POLICY STATEMENT Contents 1 Land transport context 1 A: Role of
BLACK COUNTRY STRATEGIC TRANSPORT
 Appendix 23 Guidance Notes BLACK COUNTRY STRATEGIC TRANSPORT February 2017 This Guidance Note has been produced by the Black Country Director of Transport. Any enquiries relating to the Framework should,
Report of the Strategic Director Regeneration and Culture to the meeting of Executive to be held on 9 October AD
 Report of the Strategic Director Regeneration and Culture to the meeting of Executive to be held on 9 October 2012. AD Subject: West Yorkshire Plus Transport Fund Summary statement: This report outlines
North Central Bedfordshire Growth Options Study Appendix 5 part 2
 Central Bedfordshire Council www.centralbedfordshire.gov.uk rth Central Bedfordshire Growth Options Study Appendix 5 part 2 July 2017-1 - Location ID: N14 Name: Potton West Location area: 93.2 hectares
Intelligent Transport Systems Action Plan - Key questions and answers
 MEMO/08/789 Brussels, 16 December 2008 Intelligent Transport Systems Action Plan - Key questions and answers Summary Typical and well known ITS application are the so-called "GPS" navigation systems in
Long Term Rail Strategy Key Messages. Based on updated draft strategy January 2018
 Long Term Rail Strategy Key Messages Based on updated draft strategy January 2018 The North of England plays a vital role in powering the UK economy. It is home to 16 million people and 7.2 million jobs
Local Transport Plan 3 March Frank Baxter Travel and Transport Policy Manager Southampton City Council
 Local Transport Plan 3 March 2012 Frank Baxter Travel and Transport Policy Manager Southampton City Council 02380 832079 Transport enables delivery of aspirations Port growth New housing Low Carbon City
APPENDIX B - GLOSSARY FEBRUARY 2017
 APPENDIX B - GLOSSARY FEBRUARY 2017 DENVERMOVES Transit Denver Moves: Transit - ii - APPENDIX B TRANSIT AND MOBILITY GLOSSARY Amenities, stop or station: Objects or facilities (such as a shelter, bench,
Kings Dyke Level Crossing Option Assessment Report
 Kings Dyke Level Crossing Option Assessment Report January 2015 Kings Dyke Level Crossing Option Assessment Report Cambridgeshire County Council January 2015 This document has 52 pages (not including Appendices).
Transport Model for Scotland. Kevin Lumsden MVA
 1. INTRODUCTION Transport Model for Scotland Kevin Lumsden MVA Transport Model for Scotland (TMfS) is a multi-modal transport demand and assignment model with an interactive Land Use model. The model area
The London Land-Use and Transport Interaction Model (LonLUTI)
") The London Land-Use and Transport Interaction Model (LonLUTI) October 2014 Contents 3 Introduction 4 Why do we need transport models? 6 TfL s suite of models 8 What is LonLUTI? 12 How was LonLUTI developed?
The London Land-Use and Transport Interaction Model (LonLUTI) October 2014 Contents 3 Introduction 4 Why do we need transport models? 6 TfL s suite of models 8 What is LonLUTI? 12 How was LonLUTI developed?
In addition, they now have a flexible role in working towards reducing emissions and concentrations of Fine Particulate Matter (PM 2.5 ).
.") Appendix A: UK National Air Quality Strategy The air quality objectives set out at national level in the Air Quality (Standards) Regulations 2010, provide the statutory basis for the air quality objectives
Appendix A: UK National Air Quality Strategy The air quality objectives set out at national level in the Air Quality (Standards) Regulations 2010, provide the statutory basis for the air quality objectives
GO RAIL NIAGARA SERVICE EXTENSION
 Business Case: Finch Avenue West Rapid Transit GO RAIL NIAGARA SERVICE EXTENSION INITIAL BUSINESS CASE Date: November, 2014 NOVEMBER 2015 Page 1 TABLE OF CONTENTS 1.0 Executive Summary...p.5 2.0 Introduction....p.6
Local Transport Plan 4
 Central Bedfordshire Council Executive 5 April 2016 Local Transport Plan 4 Report of Cllr Nigel Young, Executive Member for Regeneration (nigel.young@centralbedfordshire.gov.uk) Advising Officers: Marcel
Transport User Benefit Calculation
 TAG Unit 3.5.3 April 2004 Department for Transport Transport Analysis Guidance (TAG) This Unit is part of a family which can be accessed at www.webtag.org.uk Contents 1 Introduction 1 2 Transport user
National Productivity Investment Fund for the Local Road Network Application Form
 National Productivity Investment Fund for the Local Road Network Application Form The level of information provided should be proportionate to the size and complexity of the project proposed. As a guide,
Melbourne Airport heavy rail line MAH
 Melbourne Airport heavy rail line MAH Option type New assets Location Melbourne central subregion, Melbourne western subregion and Melbourne northern subregion Melbourne Airport north west state-significant
PROSPECTS TASK 13. A Report on Policy Measures
 PROSPECTS TASK 13 A Report on Policy Measures Prepared by Bryan Matthews Version of Report: Final Date: 1 March 2001 PROJECT FUNDED BY THE EUROPEAN COMMISSION UNDER THE ENVIRONMENT AND SUSTAINABLE DEVELOPMENT
EIGHT PLANNING FACTORS
 EIGHT PLANNING FACTORS Under the provisions of SAFETEA-LU, all Metropolitan Planning Organizations (MPOs) are required to consider eight (8) broad planning factors in the development of multi-modal transportation
E13: MANAGEMENT OF TRAFFIC DURING CONSTRUCTION
 HIGH SPEED TWO INFORMATION PAPER E13: MANAGEMENT OF TRAFFIC DURING CONSTRUCTION This paper outlines the framework for the control and management of traffic associated with the construction of the Proposed
Summary of transportation-related goals and objectives from existing regional plans
 SMTC 2050 Long Range Transportation Plan Appendix A: Summary of transportation-related goals and objectives from existing regional plans SMTC 2050 Long Range Transportation Plan Summary of transportation-related
Low Emission Bus Workshop: Local Challenges in Leeds. Gwyn Owen
 Low Emission Bus Workshop: Local Challenges in Leeds Gwyn Owen Summary of Key Transport Challenges Significant population growth of up to 15% by 2028 to 860,000 Most congested part of the Leeds highway
South Bristol Link Major Transport Scheme Bid
 West of England Partnership Joint Transport Executive Committee 1 October 2009 Agenda item 10 South Bristol Link Major Transport Scheme Bid Purpose of Report 1. To inform Members of progress and seek their
Greater Golden Horseshoe Transportation Plan
 Greater Golden Horseshoe Transportation Plan Transportation Profile Executive Summary October 2017 PREPARED BY Urban Strategies Inc. and HDR for the Ministry of Transportation TRANSPORTATION PROFILE -
SEARs project justification and conclusion
 31 Project justification and conclusion This chapter presents a justification for the project and a conclusion to the environmental impact statement (EIS). The justification is based on the strategic need
N4 Collooney to Castlebaldwin Road Scheme
 Traffic Analysis Brief of Evidence N4 Collooney to Castlebaldwin Road Scheme Presented by: Declan Keenan and Shane Dunny of AECOM Designer AECOM Lower Ground Floor Grand Canal House Upper Grand Canal Street
SECTOR ASSESSMENT (SUMMARY): TRANSPORT
: TRANSPORT") Country Partnership Strategy: Pakistan, 2015 2019 SECTOR ASSESSMENT (SUMMARY): TRANSPORT Sector Road Map 1. Sector Performance, Problems, and Opportunities 1. Sector performance and problems. The transport
Country Partnership Strategy: Pakistan, 2015 2019 SECTOR ASSESSMENT (SUMMARY): TRANSPORT Sector Road Map 1. Sector Performance, Problems, and Opportunities 1. Sector performance and problems. The transport
1 Introduction 4. 2 Our vision 5. 3 Critical transport challenges 6. 4 Keeping it customer-focussed 10
 GREATER MANCHESTER TRANSPORT STRATEGY 2040 EXECUTIVE SUMMARY 2040 A sustainable urban mobility plan for the future February 2017 2 GREATER MANCHESTER TRANSPORT STRATEGY 2040 EXECUTIVE SUMMARY Contents
Tours-Based LUTI Modelling
 Tours-Based LUTI Modelling Leicester and Leicestershire Integrated Transport Model Mark Dazeley, Associate Director 16 th October 2014 Presentation Structure Introduction Team technical skills, clients
The Victorian Transport Plan (Department of Transport, 2008).
.") 18 TRANSPORT Planning should ensure an integrated and sustainable transport system that provides access to social and economic opportunities, facilitates economic prosperity, contributes to environmental
18 TRANSPORT Planning should ensure an integrated and sustainable transport system that provides access to social and economic opportunities, facilitates economic prosperity, contributes to environmental
Transportation Problems and Issues Excerpts from WWW Links
 Transportation Problems and Issues Excerpts from WWW Links Reference Bok, D. (2018). Transportation policy and planning. https://www.hks.harvard.edu/courses/transportation-policy-and-planning Transportation
Methodological Approach
 Appendix B Methodological Approach This section sets out the methodology which was utilised in the production of this analysis. It is informed by international literature and knowledge of the Irish transport
Please complete this checklist by referencing locations where the relevant material can be found in the OBC document
 Large Local Major Schemes: Bid for construction funding Part Two: Checklist Please complete this checklist by referencing locations where the relevant material can be found in the OBC document Strategic
Final Report South Coast Corridor Multi-Modal Study. Prepared for Government Office for the South East
 Final Report South Coast Corridor Multi-Modal Study Prepared for Government Office for the South East August 2002 Halcrow In association with: Accent Chris Blandford Associates DTZ Pieda Baxter Eadie Ltd
WIDER PAN-REGIONAL RESPONSE TO THE CREWE HUB CONSULTATION
 WIDER PAN-REGIONAL RESPONSE TO THE CREWE HUB CONSULTATION WIDER PAN-REGIONAL RESPONSE TO THE CREWE HUB CONSULTATION Delivering the right Crewe Hub is of critical importance to a wide area. Get it right
1 EXECUTIVE SUMMARY. 1.1 Introduction
 1 EXECUTIVE SUMMARY 1.1 Introduction 1.1.1 As part of the Second East Sussex Local Transport Plan (LTP2) an accompanying Accessibility Strategy was published in March 2006. The strategy identified a number
Department for Transport Consultation: proposals for the creation of a Major Road Network
 Department for Transport Consultation: proposals for the creation of a Major Road Network ACE response March 2018 The Association is Registered as a company in England with the number 132142, it is limited
Developing a Strategy for Smart and Integrated Ticketing
 Developing a Strategy for Smart and Integrated Ticketing A response by CPRE to the DfT's consultation October 2009 Introduction 1. The Campaign to Protect Rural England (CPRE) welcomes the opportunity
5 Kapiti Coast: Community, Transport and Travel Behaviour
 5 Kapiti Coast: Community, Transport and Travel Behaviour 5.1 Population Of all territorial authorities in the region, Kapiti Coast has the highest population. It also has the fourth highest population
Improving air quality: national plan for tackling nitrogen dioxide in our towns and cities
 Improving air quality: national plan for tackling nitrogen dioxide in our towns and cities About Living Streets We are Living Streets, the UK charity for everyday walking. We want to create a walking nation,
Passenger service for the Dudding Hill line: brief for feasibility study
 Appendix 1: Specification for a Study Passenger service for the Dudding Hill line: brief for feasibility study Introduction The West London Alliance is currently investigating ways of accommodating the
This document has been developed to provide context to the Board as part of the strategic planning process. Regional development and travel trends
 1 This document has been developed to provide context to the Board as part of the strategic planning process. Regional development and travel trends and forecasts are provided, including population, employment,
CHAPTER 4 FUTURE TRENDS
 CHAPTER 4 FUTURE TRENDS 4.1 LAND USE SCENARIO PLANNING Scenario planning represents the next generation of analytical processes created to evaluate the influence of development intensities and land use
Transport2025. Transport vision for a growing world city
 Transport2025 Transport vision for a growing world city MAYOR OF LONDON Transport for London Contents Introduction by the Mayor...6 Foreword by the Commissioner...8 Executive summary...10 1 Background...16
3 Planning and design of the transport network. Chapter State highway and local road networks
 3 Planning and design of the transport network Chapter 3 Delivering the Integrated Planning Policy through planning and design of the transport network This chapter contains the following sections: Section
Transportation, Mobility and Access
 Transportation, Mobility and Access In The City of North Vancouver A Discussion Paper Prepared to Inform the Direction of a New Official Community Plan 2021 & Beyond Dragana Mitic Assistant City Engineer
North Yorkshire County Council. County Area Committee for the Harrogate District. 7 December Harrogate Relief Road Review Progress Report
 North Yorkshire County Council County Area Committee for the Harrogate District 7 December 2017 Harrogate Relief Road Review Progress Report Report of the Corporate Director Business and Environmental
6.0 CONGESTION HOT SPOT PROBLEM AND IMPROVEMENT TRAVEL DEMAND MODEL ANALYSIS
 6.0 CONGESTION HOT SPOT PROBLEM AND IMPROVEMENT TRAVEL DEMAND MODEL ANALYSIS 6.1 MODEL RUN SUMMARY NOTEBOOK The Model Run Summary Notebook (under separate cover) provides documentation of the multiple