North America Trade Report. US Trade Report. US Imports. US Exports. US Exports 2018, Gulf Vs West. US Sectors Auto.
|
|
|
- Eustace Sanders
- 6 years ago
- Views:
Transcription


1 Release date: February 22nd 2018

2 North America Trade Report US Trade Report US Imports US Exports US Exports 2018, Gulf Vs West US Sectors Auto US Sectors Pharma US Sectors Retail, Amazon US Trucking Driver Crisis About Maersk Line
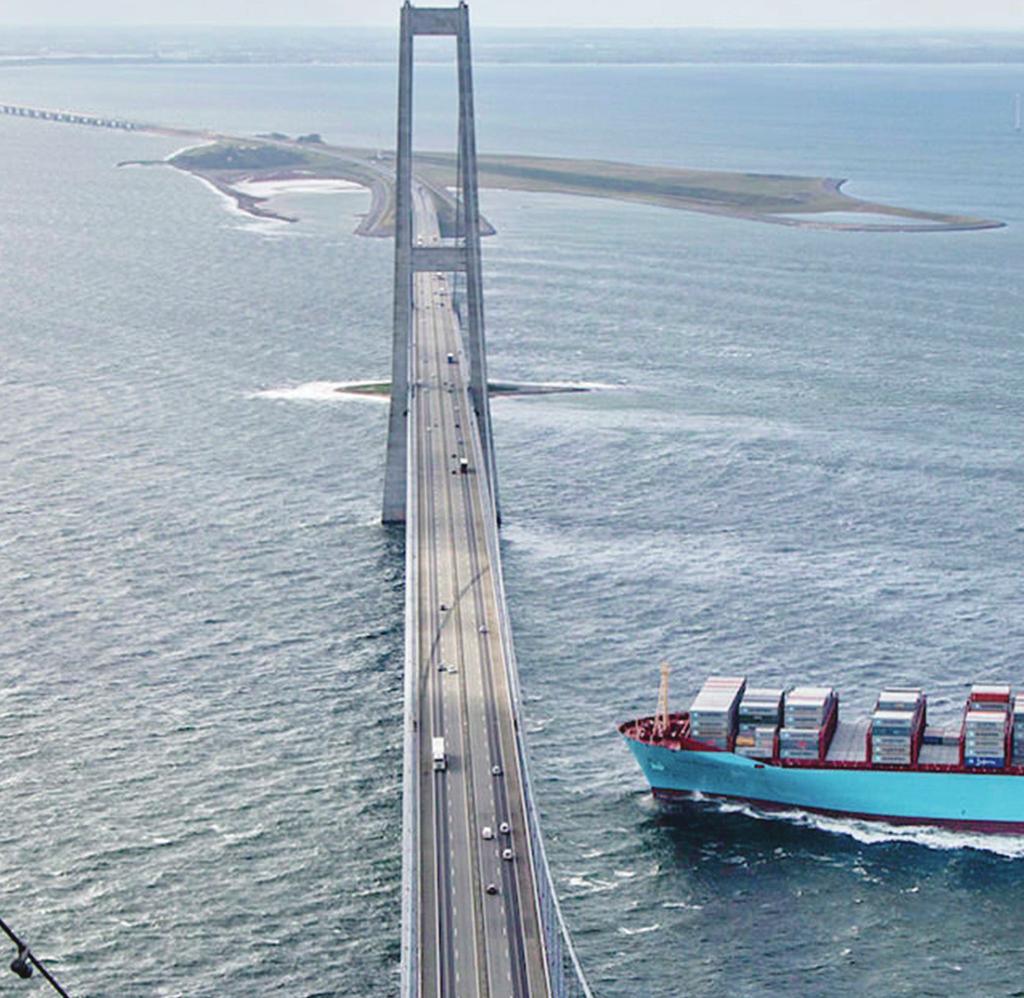
3 North America Trade Report North American trade is set to deliver another year of robust growth. The US and Canada will benefit from an expected increase of more than 3% in global trade volumes this year as US consumers underpin imports and Canadians gain from the signing of a free trade agreement covering a US$12.6 trillion market, according to the world s largest shipping company Maersk Line. However, the US and Canada, which have grown at similar accumulative rates of 8.7% and 8.3% from 2015 to 2017, have two very different tales to tell this year. For the US, gains will come from retail, chemicals, consumer electronics and grains sectors but the nation faces a number of homegrown issues as the import-to-export gap continues to widen. The The US is facing a trucking crisis, rail infrastructure needs to be updated, terminal competitiveness lags behind other countries, while digital transformation is putting pressure on the way the US does trade not to mention the bunker fuel hikes and terminal congestions persist. Meanwhile, the outlook is more positive for Canada, which promises to be one of the fastest growing markets in terms of container trade across the Americas this year. In 2017, US total maritime container imports and exports grew 4.7%, up from 3.9% in 2016, while Canadian total imports and exports expanded 6.9%, up from 1.4% in The US accounts for 24% of all global container trade, which moves more than US$4 trillion worth of goods a year. Maersk Line moves approximately one in five containers around the world. The US and Canada are growing and yet they are in two very distinct moments. The US is in digital disruption and transformation, putting pressure on the way the nation trades, so much so that the end-goal must change so that booking a container and moving it across continents becomes as easy as posting a parcel, helping US business flourish locally and globally, says Omar Shamsie, President for Maersk Line North America. It sounds far-fetched when you consider how the industry does business now, but the future of the whole supply chain needs to be discussed at the highest levels, US competitiveness needs to come under a magnifying glass so the whole industry and authorities can address new ways of narrowing the everincreasing gap with imports and update itself in the face of digital disruption and increasing competition from Asia, Latin America and Europe, he adds. Parent company A.P. Moller- Maersk is already taking steps to help overhaul global trade after unveiling in January a joint venture with IBM to create an industry-wide paperless platform that is aimed at speeding up trade transactions, boosting transparency for clients and ultimately saving billions of dollars. 3
4 US Trade Between 2015 and 2017 in TEUs* 7,000,000 6,000,000 5,000,000 4,000,000 3,000,000 Export Import Linear (export) Linear (import) 2,000,000 1,000,000 0 Q1 Q2 Q3 Q4 Q1 Q2 Q3 Q4 Q1 Q2 Q3 Q Imports show steady growth since 2017 but exports hover as the gap between imports and exports grow. *TEU: Twenty-foot equivalent sized container 4
5 2018 FORECAST For 2018, Maersk Line forecasts total US exports and imports will grow a minimum of 2% to up to 4% and for Canada, the country is seen expanding 7% or more as it benefits from its first full year of free trade with the European Union after securing CETA, or The Comprehensive Economic and Trade Agreement, at the end of last September. Now, Canada is moving closer to signing the CPTPP (Comprehensive and Progressive Agreement for Trans-Pacific Partnership) accord, involving 11 nations including Japan, Chile, Australia, Malaysia, Singapore, Vietnam, and more, accounting for 15.8% of the world s GDP. The CPTPP will boost trade further, this time on the Pacific, adding to CETA s positive impact on the Atlantic. We can expect gains to come through the West coast ports of Vancouver and Prince Rupert, the latter offering the shortest distance between North America and Asia. They are both growing as competitive gateways for West Coast North America volumes. Jack Mahoney President for Maersk Line Canada Total Exports and Imports With Year-on-Year Growth and Forecast E US 3.9% 4.7% 3%+ Canada 1.3% 6.9% 7%+ 5

6 US Imports Imports underpinned overall US trade growth in 2017 thanks to healthy consumer demand. Imports grew 6.8% in 2017 versus 4.1% growth in Maersk Line forecasts that imports will grow from a minimum of 3% up to 5% in 2018 thanks to factors such as higher wages, lower unemployment and slightly higher GDP growth this year. We are optimistic on US imports this year thanks to strong consumer growth, historically low unemployment and strong consumer confidence, says Christian Pedersen, Head of Trade & Marketing for Maersk Line North America. Last year far exceeded our growth expectations and we still foresee strong imports growth in the range of 3% to 5% for 2018, he adds. 9,00% 8,00% 7,00% 6,00% 5,00% 4,00% 3,00% 2,00% 1,00% 0,00% 7,19% 0,17% Imports from China alone accounted for more than a third of all imports after US demand for its products grew 7% in 2017 to 677,424 TEUs. Imports from Asia as a whole (PACIFIC trade), represented nearly three quarters of all imports to the US in US Imports ,09% 8,50% Q1 Q2 Q3 Q4 5,79% 8,36% Q1 Q2 Q3 Q ,06% 6,07% 6

7 While we saw some of the strongest import performances from countries like India, Germany, China, Vietnam and Turkey in 2017, the results underscore that the US is ultimately a net importer with a growing trade imbalance. For every two containers that are imported into the country approximately one is exporter; however, on the west coast this ratio is closer to three to one. Legislative, commercial and investment initiatives are necessary to boost exports to create a better weighted trade balance. Christian Pedersen Head of Trade and Marketing for Maersk Line North America. In 2017, the nations to enjoy some of the biggest gains when taking into account the size of their TEU volumes and leadership in their own region were: TEUS % Diff China 677,424 7% Costa Rica 55,411 30% Germany 46, % India 60,177 11% Mexico 29,691 23% Nigeria 1,397 77% % Diff is the growth in TEU volumes imported from each country in 2017, compared to

8 Given the widening gap between imports and exports in the US, you end up shipping more empty containers this adds unnecessary costs in supply chains. Putting the spotlight on US competitiveness, there s more to be done in existing infrastructure and processes like reducing paperwork and streamlining the number of handovers involved in the administration of a container entering and exiting a country. This for us is just the start. Going digital and reducing the time is takes to book a container as well as move it through a terminal is another part of the equation. Omar Shamsie President for Maersk Line North America 8
9 US Imports 2017 In terms of commodities, furniture, appliances, plastics and miscellaneous manufactured materials were among the biggest movers in 2017, respectively up 13%, 7%, 7% and 10%. Commodities IMPORTS 2017 Diff (TEUS) Diff (%) ART AND ANTIQUES 1, % BEVERAGES 19, % BONE AND MEAL % CHEMICALS 38, % DAIRY PRODUCTS, BIRDS EGGS AND HONEY % FERTILIZERS % FISH -1, % FOOD RESIDUE & WASTE 3, % FOODSTUFF 36, % FRUIT AND NUTS 71, % FURNITURE 332, % GLUE & ADHESIVES 3, % HIDES, FUR, LEATHER AND SKIN 28, % HOUSEHOLD GOODS -4, % MACHINERY, APPLIANCES (HOME AND INDUSTRIAL) 192, % MEAT 5, % METAL (SEMI-FINISHED AND FINISHED) 121, % METAL (WASTE AND SCRAP) 5, % MINERAL FUELS, OILS, WAXES 1, % MISCELLANEOUS MANUFACTURED MATERIALS 108, % MUSICAL INSTRUMENTS % OILS AND FATS % ORES, SLAG AND ASH % OTHER % PAPER (SEMI-FINISHED AND FINISHED) 21, % PERSONAL CARE AND CLEANING PRODUCTS 12, % PHARMACEUTICALS 2, % PLANTS % PLASTIC AND RUBBER 132, % PYROTECHNIC PRODUCTS % SALT, SULPHUR, EARTH, STONE, PLASTER, LIME, CEMENT 14, % SEEDS, BEANS, CEREALS, SPICES AND FLOUR 17, % SHELLFISH 5, % SPORTING GOODS 5, % TANNING / DYEING EXTRACTS, PAINTS, VARNISHES 5, % TEA AND COFFEE 4, % TEXTILES, APPAREL AND ACCESSORIES 30, % TILE, STONE AND GLASS 58, % TOBACCO -1, % TOOLS AND CUTLERY (HOME AND INDUSTRIAL) 9, % TOYS AND GAMES 37, % VEGETABLES 7, % VEHICLES AND TRANSPORTATION EQUIPMENT 17, % WASTEPAPER % WOOD, CORK, STRAW AND OTHER 62, % WOODPULP AND OTHER PULP 3, % 9
10 US Exports ,00% 6,93% 6,00% 5,92% 4,62% 4,00% 3,14% 2,44% 2,00% 0,52% 0,00% Q1 Q2 Q3 Q4 Q1 Q2 Q3 Q4-2,00% -2,02% For Maersk Line, US exports are expected to show moderate growth between 0% to 2% in The better performance is largely owed to expectations that resin exports will increase out of the Gulf Coast this year as companies like Chevron Phillips Chemical brings plants online and have announced investments in the 20billion dollar mark. The Gulf Coast is going to steal the limelight in 2018 and 2019 with the coming online of new chemicals plants as well as investments in new distributions centers, helping provide a positive impact on US trade, says Pedersen. However, the West Coast is expected to underperform this year and next, losing trade to Canada because of cost inefficiencies in its infrastructure and need for greater rail competition, he adds. -4,00% 1,09% -6,00% -4,80% US total exports grew 1% in 2017 versus a 3.1% expansion in Exports last year were impacted by China s decision to crack down on pollutants as well as suspending import licenses of recyclable goods and banning some materials to reduce pollution. This decision impacted the West Coast exports trade the most as wastepaper exports dropped 14% to 164,906 TEUs in The Chinese government s decision impacted US as well as Mexican exports in the fourth quarter, but countries such as India as well as other Southeast Asian nations have the capacity to pick up at least some of the trade, says Pedersen. 2018E Total Imports and Exports Gulf Coast 4% East Coast 3% West Coast 1% 10

11 US Sectors Auto For auto, new car sales growth is expected to decline in the US in 2018 but used car exports represent a growth opportunity, especially after the hurricanes of last year, providing more trade volumes out of the Gulf Coast this year. Used cars exports are expected to go primarily to Africa and the Middle East. The US is the world s largest exporter of used cars, especially to developing nations. We are going to see a big jump in used car exports in 2018 once delays in the processing of their claims are resolved. Jebel Ali in Dubai is expected to attract significant volumes as it is a major hub for used auto auctions worldwide. We also see on the horizon volumes going to South East Asia but this will be in smaller quantities, says Pedersen. In 2017, vehicles and transportation equipment grew 11% to 89,198 TEUs. We see some volumes on the horizon going to S.E. Asia as well, but very small in comparison, says Pedersen. Cars is one of the biggest export items for the US. 11
12 Pharmaceuticals Retail, Electronics and Apparel The US exports pharmaceuticals products to approximately 126 countries around the world. Pharmaceutical exports grew 13% in The top five buyers of US pharma worldwide in 2017 in terms of volume were Indonesia, up 180%, Belgium 39%, Netherlands 26%, United Arab Emirates 32%, Latvia 303% and Colombia 29%. 12 Retail is undergoing a shift as the biggest players continue to increase their weighting in terms of volumes and impact on US trade, primarily on the imports front, whilst the smaller and nimbler e-commerce companies slowly move up the ranks. It is almost as if we are watching a game of musical chairs between brick-and-mortar and e-commerce retailers, Says Pedersen The top 45% of all companies moving the biggest volumes in US trade are predominantly retail and are focused and succeeding in consolidating their positions further. The bottom 30% is declining but it seems the middle layer, or 25%, remains fairly balanced, says Pedersen. This serves as a mirror reflection of how e-commerce and bricks and mortar retailers are largely tussling it out as we see online retail increasingly leading the way and concentrating further in US trade, he adds. However, US retailers, which Maersk Line forecasts will post another year of steady growth at 4% or more, are putting more pressure on shipping lines to change. Boosting the customer experience online and offline, further enhancing omnichannel strategies or exploring digital innovation such as augmented reality for apparel are changing the way the US retailers do trade as well as how consumers behave. This is having a knock-on effect on trade. Volumes grow steadily but the shift in the pie in favor of e-commerce means demands for simpler, faster and real-time services from shipping lines increase, says Pedersen. Consequently, going digital and reducing paperwork and administrative processes significantly are some of the ways of meeting growing demands from e-commerce retailers, which are focused on disruption by breaking down barriers to satisfy consumers with same-day deliveries.
13 Everyone is upping their game when it comes to retail, Says Shamsie. For Maersk, our vision is to offer an end-toend integrated global supply chain online to speed up deliveries and find smarter ways of getting goods in and out of a country either through Maersk Line, our global ports operator APM Terminals and freight forwarder Damco. We are working on key areas such as boosting reliability and transparency across the whole supply chain. We have introduced online quoting and booking tools, an APP to track goods, emote container management for refrigerated foods and launching pilots with digital companies in and outside our industry. But we believe there are more opportunities and Maersk is keeping an eye out for smaller companies that bring technology, skill or new capabilities to our global story. Our final goal is to bring positive change to our customers. Container bookings have gone from hours in 2014 to minutes in We want to make shipping simple, fast and online. Omar Shamsie President for Maersk Line North America Country & Territory Top Electronics Imports Growth By Country in 2017 Volume in TEUs % Growth China 760k 2 South Korea 55k 3 Hong Kong 50k 2.3 Vietnam 44k 31.2 Country & Territory Top Apparel Imports Growth By Country in 2017 Volume in TEUs % Growth China 990k 3.1% Vietnam 241k 7.6% Indonesia 87k -1.8% India 81k -0.5% 13
14 US Exports 2017 Commodities EXPORTS 2017 Diff (TEUS) Diff (%) ART AND ANTIQUES % BEVERAGES -5, % BONE AND MEAL 2, % CHEMICALS 10, % DAIRY PRODUCTS, BIRDS EGGS AND HONEY 1, % FERTILIZERS % FISH 16, % FOOD RESIDUE & WASTE -95, % FOODSTUFF -34, % FRUIT AND NUTS % FURNITURE 3, % GLUE & ADHESIVES % HIDES, FUR, LEATHER AND SKIN 8, % HOUSEHOLD GOODS 9, % MACHINERY, APPLIANCES (HOME AND INDUSTRIAL) 24, % MEAT 14, % METAL (SEMI-FINISHED AND FINISHED) -30, % METAL (WASTE AND SCRAP) 10, % MINERAL FUELS, OILS, WAXES 3, % MISCELLANEOUS MANUFACTURED MATERIALS 71, % MUSICAL INSTRUMENTS % OILS AND FATS 5, % ORES, SLAG AND ASH % OTHER % PAPER (SEMI-FINISHED AND FINISHED) 38, % PERSONAL CARE AND CLEANING PRODUCTS -2, % PHARMACEUTICALS 5, % PLANTS % PLASTIC AND RUBBER -70, % PYROTECHNIC PRODUCTS % SALT, SULPHUR, EARTH, STONE, PLASTER, LIME, CEMENT 5, % SEEDS, BEANS, CEREALS, SPICES AND FLOUR 6, % SHELLFISH 2, % SPORTING GOODS % TANNING / DYEING EXTRACTS, PAINTS, VARNISHES % TEA AND COFFEE % TEXTILES, APPAREL AND ACCESSORIES 57, % TILE, STONE AND GLASS 4, % TOBACCO -5, % TOOLS AND CUTLERY (HOME AND INDUSTRIAL) 1, % TOYS AND GAMES 9, % VEGETABLES -1, % VEHICLES AND TRANSPORTATION EQUIPMENT 89, % WASTEPAPER -164, % WOOD, CORK, STRAW AND OTHER 144, % WOODPULP AND OTHER PULP -27, % 14

15 Trucking Driver Shortage The US is caught up in a driver hiring crisis at the start of At its worst point, the US was nearly 250,000 drivers short of where it needed to be to support the nation s supply chain in Ten US cities are currently suffering delays of at least one week in moving goods. among those who need the supply chain, says Pedersen. There are key issues here that need to be discussed among all interested parties to find a way to overcome or reverse the current trend before it starts to hurt US business, he adds. Hiring activity is going to be unable to keep up with the number of drivers required to move goods around the country in 2018, something has to give to bring trained drivers back to this industry and this will probably involve sharing the extra cost Key barriers include: Diminishing driver workforce Limited availability of specialty drivers Strained infrastructure causing congestion Tightening truck regulatory requirements Growing operational costs for Trucking companies Fuel prices spike after hurricane season last year 15

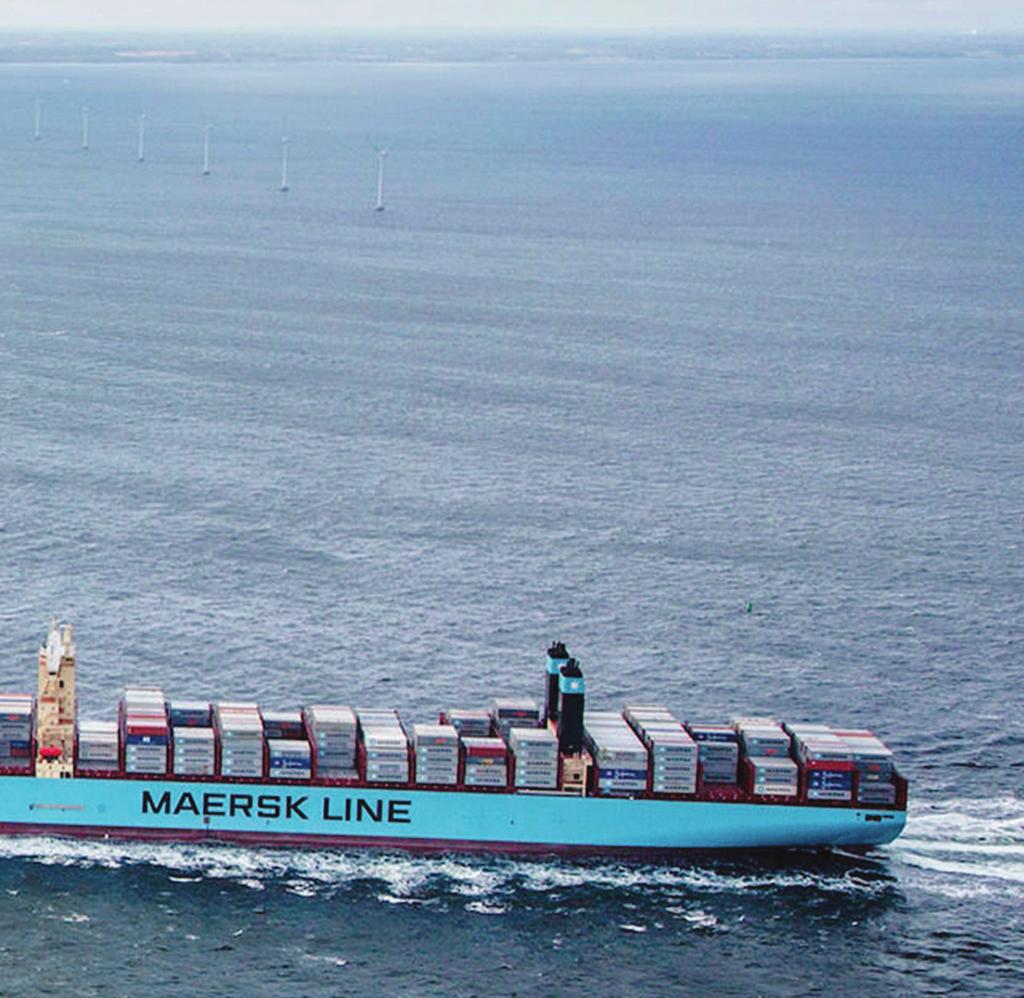
16 About Maersk Line Maersk Line is the world s largest container shipping company with more than 33,000 employees and 630 plus vessels Maersk Line serves customers through 306 offices in 114 countries. About A.P. Moller-Maersk The first Maersk vessel to arrive in North America was the Laura Maersk in December 1913 when she docked at Galveston, Texas. Maersk has more than 89,000 staff in the world and is present in more than 130 countries. Other subsidiaries include Svitzer, which operates 430 tugs, Maersk Supply Service runs 70 support ships and Maersk Drilling has 22 vessels. Maersk vessels call at a port every 15 minutes. For more information, please contact PR Consulting Brasil Anthony Dovkants Senior Partner anthony@prconsultingbrasil.com Gabriela Forlin Account Manager gabriela@prconsultingbrasil.com + 55 (11) (11) (11) (11) Katherine Mosquera Regional Communications Manager katherine.mosquera@maersk.com +1 (973)
17 US statistics are provided by IHS Markit to Maersk Line and also include Maersk Line data. 17


18 18
European Union, Trade in goods with Thailand
 European Union, Trade in goods with Thailand Table of Contents pg - Key Figures 2 - / 2016 2 - - AMA/NAMA product Groups 2 - - SITC product Groups 2 - - Top 5 - HS sections 2 - - Top 5 - SITC sections
North Carolina Exports by Quarter (in constant 2Q 2013 dollars)
") P. 1/6 in Billions in Billions 1 North Carolina Trade Report 1, First Half of 2013 Exports from North Carolina play an increasingly important role in the state s economic recovery and job growth. That
P. 1/6 in Billions in Billions 1 North Carolina Trade Report 1, First Half of 2013 Exports from North Carolina play an increasingly important role in the state s economic recovery and job growth. That
Southern Alberta: Growth of Import and Export Opportunities for West Coast Ports
 Southern Alberta: Growth of Import and Export Opportunities for West Coast Ports Stakeholders for the Study Port of Prince Rupert Province of Alberta Calgary Regional Partnership Calgary Economic Development
The Economic Impacts of Virginia s Maritime Industry
 The Economic Impacts of Virginia s Maritime Industry PORT COMMERCE Million Tons of Cargo Moved 0,00 Jobs $. Billion In Wages $. Billion In Spending $. Billion In State/Local Taxes.% of Virginia Gross State
European Union, Trade in goods with South Korea
 European Union, Trade in goods with South Korea Table of Contents pg - Key Figures 2 - / 2016 2 - - AMA/NAMA product Groups 2 - - SITC product Groups 2 - - Top 5 - HS sections 2 - - Top 5 - SITC sections
Canadian International Merchandise Trade
 Catalogue no. 65-001-X Vol. 69, no. 12. Canadian International Merchandise Trade. Statistical tables Table 1 Merchandise trade of Canada, balance of payments basis, seasonally adjusted - Current dollars
Revision of Product Map
 Market Analysis Section Trade and Business Promotion in SADC Training of Trainers Workshop in Market Analysis and ITC Tools Business information for going global Gabriela Alvarez and Bastiaan Bijl Market
Canadian International Merchandise Trade
 Catalogue no. 65-001-X Vol. 69, no. 9. Canadian International Merchandise Trade. Statistical tables Table 1 Merchandise trade of Canada, balance of payments basis, seasonally adjusted - Current dollars
Canadian International Merchandise Trade
 Catalogue no. 65-001-X Vol. 69, no. 7. Canadian International Merchandise Trade. Statistical tables Table 1 Merchandise trade of Canada, balance of payments basis, seasonally adjusted - Current dollars
Canadian International Merchandise Trade
 Catalogue no. 65-001-X Vol. 66, no. 9. Canadian International Merchandise Trade. Statistical tables Table 1 Merchandise trade of Canada, balance of payments basis, seasonally adjusted Current dollars Export
European Union, Trade in goods with ACP -- West Africa
 European Union, Trade in goods with ACP -- West Africa ACP -- West Africa Benin, Burkina Faso, Cape Verde, Gambia, Ghana, Guinea, Guinea Bissau, Ivory Coast, Liberia, Mali, Mauritania, Niger, Nigeria,
MONTHLY OVERSEAS CONTAINER TRADE UPDATE: SEPTEMBER 2017
 MONTHLY CONTAINER TRADE REPORT - Overseas Containers MONTHLY OVERSEAS CONTAINER TRADE UPDATE: SEPTEMBER 217 Overseas container trade September 217 Full overseas container imports Full overseas container
LITHUANIA-DENMARK BILATERAL TRADE review
 LITHUANIA-DENMARK BILATERAL TRADE review Published: 01.08.2017 SUMMARY Denmark is one of the most important trade partners for Lithuania. In 2016 the trade turnover in goods between the two countries slightly
STRENGTHENING YOUR PORT S FINANCIAL STABILITY THROUGH DIVERSIFICATION
 STRENGTHENING YOUR PORT S FINANCIAL STABILITY THROUGH DIVERSIFICATION A Case Study of the Vancouver Fraser Port Authority s Natural Advantages and Diversification Strategies Larry Sawrenko, Director Finance
2008 Census of Industrial Production (NACE Rev 2)
") 30 November 2009 Census of Industrial Production (NACE Rev 2) Early Estimates Other 33% Chemicals 7% Computers 18% Food Products 19% Basic Pharmaceutical 23% Industrial Gross value Wages & Year added salaries
30 November 2009 Census of Industrial Production (NACE Rev 2) Early Estimates Other 33% Chemicals 7% Computers 18% Food Products 19% Basic Pharmaceutical 23% Industrial Gross value Wages & Year added salaries
Analyst: Meilin C. Pierce Spring Recommendation: Hold Target Stock Price (12/31/2016): $120
: $120") Recommendation: Hold Target Stock Price (12/31/2016): $120 1. Reasons for the Recommendation My recommendation is to hold Union Pacific Corporation (UNP) because my forecast shows that the stock is currently
Recommendation: Hold Target Stock Price (12/31/2016): $120 1. Reasons for the Recommendation My recommendation is to hold Union Pacific Corporation (UNP) because my forecast shows that the stock is currently
MANUFACTURING IN IOWA
 MANUFACTURING IN IOWA NOVEMBER 2011 INSIDE: SECTOR SIZE 2 KEY INDUSTRIES EARNINGS 4 EXPORTS 5 JOB TRENDS 6 GDP TRENDS 7 COUNTY DEPENDENCE 3 8 OVERVIEW Iowa s competitive strengths in manufacturing emerged
MONTHLY OVERSEAS CONTAINER TRADE UPDATE: FEBRUARY 2016
 MONTHLY CONTAINER TRADE REPORT - Overseas Containers MONTHLY OVERSEAS CONTAINER TRADE UPDATE: FEBRUARY 216 Overseas container trade February 216 Full overseas container imports Full overseas container
Distribution & Global Logistics
 Say Yes To Aerospace in Virginia Distribution & Global Logistics 1 Virginia s Distribution & Global Logistics Industry Employs over 69,000 people, primarily in Trucking, Warehousing, and Transportation
Table 1. U.S. Agricultural Exports as a Share of Production, 1992
 Export markets are important to U.S. agriculture, absorbing a substantial portion of total production of many important commodities. During the last two decades there have been periods of expansion and
The European chemical industry Facts & Figures 2013
 The European chemical industry Facts & Figures 2013 Overview Chemical Industry Profile World chemicals sales: geographic breakdown 6 World chemicals sales by region 8 Chemicals sales by country: top 30
LITHUANIAN-RUSSIAN BILATERAL TRADE overview
 SUMMARY LITHUANIAN-RUSSIAN BILATERAL TRADE overview Published: 16.11.2016 Trade turnover between Lithuania and Russia amounted to 7.3 billion euro in 2015 and decreased 3.2 billion euro or 30% compared
Opportunities & Challenges in Multimodal Logistics An Indian Perspective
 Opportunities & Challenges in Multimodal Logistics An Indian Perspective CONTENTS Logistics in India Current Status Multimodal Logistics Opportunities Challenges Logistics in India Current Status India
Pakistan s International Competitiveness over Asia and Europe
 Pakistan Journal of Commerce and Social Sciences 2016, Vol. 10 (2), 359-367 Pak J Commer Soc Sci Pakistan s International Competitiveness over Asia and Europe Abstract Shujaat Abbas Department of Economics,
Chemicals Industry Outlook
 Chemicals Industry Outlook VERSION 02 YEAR 13 OUTLOOK: Positive fundamentals & outlook www.eulerhermes.us Key Points The U.S. chemical manufacturing industry is growing and is supported by increasing demand
LNG in the Asia Pacific
 2016/EWG52/WKSP1/004 LNG in the Asia Pacific Submitted by: APERC Asia Pacific Energy Research Centre Workshop Moscow, Russia 18 October 2016 APERC Workshop at EWG52 Moscow, Russia, 18 October, 2016 3-2.
ECONOMIC DRIVERS FOR THE CHEMICAL INDUSTRY
 ECONOMIC DRIVERS FOR THE CHEMICAL INDUSTRY 3 October 2017 Pittsburgh Chemical Day Pittsburgh, PA Martha Gilchrist Moore Sr. Director Policy Analysis and Economics Outline Global Situation and Outlook U.S.
Central Bank of the Islamic Republic of Iran. Wholesale Price Index in Iran
 Central Bank of the Islamic Republic of Iran General Directorate of Economic Statistics Wholesale Price Index in Iran Mordad 1383 (July 22 - August 21, 2004) Monthly Report Economics Statistics Department
Pakistan & Tajikistan Country Information:
 Country Information: Tajikistan's economic situation remains fragile due to the uneven implementation of structural reforms, corruption, weak governance, seasonal power shortages, and its large external
Embassy of Denmark in Vietnam 2 / 10
 Date July 2015 1. Keywords... 2 2. Abstract... 2 3. Introduction... 2 4. Sector Overview... 3 5. Government policy... 7 6. Opportunities for Danish companies... 8 7. Conclusion... 8 Transport, Logistics,
Indonesia s Energy Requirements Part One: Current Energy Dynamics
 10 February 2015 Indonesia s Energy Requirements Part One: Current Energy Dynamics Stewart Patterson FDI Associate Key Points Domestic consumption has been a key driver of Indonesian economic growth and,
The Emergence of. Florida s Seaports and Inland Ports. Florida League of Cities - International Relations Committee November 17, 2011
 The Emergence of Florida s Seaports and Inland Ports Florida League of Cities - International Relations Committee November 17, 2011 History of the Global Supply Chain 2 Supply Chain, Circa 1950 Regional
Alberta s Manufacturing Industry is Recovering in 2017
 ECONOMIC COMMENTARY Alberta s Manufacturing Industry is Recovering in 2017 Highlights: Alberta s manufacturing industry was in recession in 2015 and 2016 as a result of the dramatic drop in crude oil prices.
Global Digital Economy - E-Government, E-Health and E-Education Trends
 Brochure More information from http://www.researchandmarkets.com/reports/1094537/ Global Digital Economy - E-Government, E-Health and E-Education Trends Description: This annual report offers a wealth
INTERNATIONAL TRADE REPORT ON ADRIATIC AND IONIAN AREA. STATISTICS DATA Update 2014
 INTERNATIONAL TRADE REPORT ON ADRIATIC AND IONIAN AREA STATISTICS DATA Update 2014 Ancona, May 2015 The aim of this work is to provide a contribution to identify the economic and commercial dimension of
Canpotex: Growing Relationships
 Canpotex: Growing Relationships June, 2011 Canpotex Canpotex is a world-class marketing and logistics company that sells and delivers Saskatchewan potash to international markets Canpotex enhances the
T he Asian economic and financial crisis
 Patricia S. Pollard is an economist and Research Officer at the Federal Reserve Bank of St. Louis. Cletus C. Coughlin is a vice president and the Associate Director of Research at the Federal Reserve Bank
THE DYNAMICS OF THE US CONTAINER MARKET AND IMPLICATIONS FOR THE US PORT INDUSTRY
 THE DYNAMICS OF THE US CONTAINER MARKET AND IMPLICATIONS FOR THE US PORT INDUSTRY A PRESENTATION TO: CHANGING TRADE PATTERNS JANUARY 24, 2013 MARTIN ASSOCIATES 941 Wheatland Avenue, Suite 203 Lancaster,
INTERNATIONAL CONSUMER MARKETS
 INTERNATIONAL CONSUMER MARKETS 2016-2017 January 2016 2 nd Edition 535 pages ISBN# 9781577832324 Published by Richard K. Miller & Associates (RKMA) PART I: GLOBAL MARKET OVERVIEW 1 GLOBAL GDP 1.1 Overview
Vertical Specialisation in Trade: the case of Malaysia*
 Preliminary Draft Vertical Specialisation in Trade: the case of Malaysia* Wai-Heng Loke Division of Economics University of Nottingham Ningbo China waiheng.loke@nottingham.edu.cn Abstract: The development
Trading patterns: Global and regional perspectives
 Chapter V Trading patterns: Global and regional perspectives World merchandise trade in value terms fell by 3 per cent in 2016 following a 13 per cent slump recorded in 2015, with trade growth remaining
HR Connect Asia Pacific
 China and Hong Kong Compensation Trends and Outlook By Peter Zhang, Vice-President, Aon Hewitt China and Tzeitel Fernandes, Principal and Broad Based Rewards and Executive Compensation Leader, Aon Hewitt
DUBAI BUSINESS SURVEY Q Department of Economic Development, Dubai. Economic Information Division Economic Policies & Studies Sector
 DUBAI BUSINESS SURVEY Q4-2016 Department of Economic Development, Dubai Economic Information Division Economic Policies & Studies Sector INTRODUCTION The Department of Economic Development (DED) was established
THE EVOLVING PANAMA CANAL ROUTE FOR CHEMICALS
 1 THE EVOLVING PANAMA CANAL ROUTE FOR CHEMICALS Peter Tirschwell Senior Director for Editorial Content Maritime & Trade, IHS Markit 2 New era under way for the Panama Canal Ten-year, roughly $5.4 billion
August IPI Beats Expectation up 6.8%, Highest in 2 ½ Years.
 12 October 20 ECONOMIC REVIEW August 20 Industrial Production Index August IPI Beats Expectation up 6.8%, Highest in 2 ½ Years. IPI expanded above market expectations. Malaysia s industrial production
Trade and Clean Energy in the Pacific Alliance Monica Araya, Founder & Director, Nivela
 Trade and Clean Energy in the Pacific Alliance Monica Araya, Founder & Director, Nivela 1 Twitter: @MonicaArayaTica @NivelaOrg www.nivela.org 2 Structure I. The Pacific Alliance s drivers Overview of the
Emerging Global Trade Patterns: USDA s Long-term Agricultural Projections
 Emerging Global Trade Patterns: USDA s Long-term Agricultural Projections Midwest Agriculture s Ties to the Global Economy Federal Reserve Bank of Chicago November 28, 217 Chicago Jim Hansen, Ph.D. USDA,
UN List of Industrial Products
 UN List of Industrial Products United Nations Statistics Division Workshop on Classifications, Montevideo, Uruguay, 14-18 March 2005 25/04/2005 1 History UN list of industrial products was developed in
SUB-SAHARAN AFRICA S EXPORT TRENDS AND THE EPAS
 SC/TDP/AN/EPA/28 Original: English SUB-SAHARAN AFRICA S EXPORT TRENDS AND THE EPAS EXECUTIVE SUMMARY Trade trends are changing quite rapidly for Africa. A careful analysis of Africa s export statistics
GUIDELINES FOR DESCRIBING THE ACCREDITATION SCOPE OF CERTIFICATION BODIES CERTIFYING MANAGEMENT SYSTEMS
 GUIDELINES FOR DESCRIBING THE ACCREDITATION SCOPE OF CERTIFICATION BODIES CERTIFYING MANAGEMENT SYSTEMS Reviewed by: Natalija Jovičić Zarić MSc, Quality Manager (QM) Approved by: Dejan Krnjaić PhD, Director
LNG Market Outlook and Development Pierre Cotin. 3 rd Annual LNG Shipping Forum 2013, Lillestrøm, 6 June 2013
 LNG Market Outlook and Development Pierre Cotin 3 rd Annual LNG Shipping Forum 2013, Lillestrøm, 6 June 2013 Who we are GLE is one of the three columns of GIE (Gas Infrastructure Europe), the European
Sustainable Efforts & Environmental Concerns Around the World. A Nielsen Report August 2011
 Sustainable Efforts & Environmental Concerns Around the World A Nielsen Report August 2011 Global unease over the use of pesticides, packaging waste and water shortages overtake global warming as top concern
The Battle of Big versus Small. Zenith Adspend Forecast 2017
 The Battle of Big versus Small Zenith Adspend Forecast 2017 The global ad market will continue to grow steadily +5,9 Year-on-year growth (%) +5,6 +5,6 +5,5 +4,0 +4,1 +4,2 +4,1 2017 2018 2019 2020 Adspend
Agricultural Trade Flows through Texas Ports: Recent Trends and Outlook
 Agricultural Trade Flows through Texas Ports: Recent Trends and Outlook Texas Roundup APHIS CBP TDA August 18, 2016 College Station, TX Flynn Adcock, International Program Coordinator Luis A. Ribera, Associate
World Manufacturing Production
 World Manufacturing Production Statistics for Quarter I, 2017 Report on world manufacturing production This report presents the observed growth rates and growth estimates of world manufacturing production
A global meat industry outlook
 A global meat industry outlook Capturing business opportunities in a fast changing world Copenhagen Nan-Dirk Mulder, 18 February 2017 Rabobank international introduction and global network of branches
The latest MAP looks at developments in trade over the
 No. 1-11 May 211 MAP Monitoring Agri-trade Policy European Commission Directorate-General for Agriculture and Rural Development Global and EU agricultural exports rebound Editorial CONTENTS EU still a
Freight Transportation Megatrends
 Freight Transportation Megatrends Copyright 2006 Global Insight, Inc. Freight Demand Modeling: Tools for Public-Sector Decision Making Conference Paul Bingham Global Insight, Inc. Washington, DC September
Barriers to Global Maritime Trade
 to Global Maritime Business Perspectives on and Frictions in the Pacific Rim University of Southern California Marshall School of Business Busan, Korea November 15, 2005 Exponential growth initiates potential
Global IT Procurement and Logistics. Simplifying the complex: an end-to-end IT supply chain solution
 Global IT Procurement and Logistics Simplifying the complex: an end-to-end IT supply chain solution We make the complex simple Managing an international IT supply chain isn t an easy task, and comes with
International Seminar on Early Warning and Business Cycle Indicators. 14 to 16 December 2009 Scheveningen, The Netherlands
 ESA/STAT/AC.202/S4.5 International Seminar on Early Warning and Business Cycle Indicators 14 to 16 December 2009 Scheveningen, The Netherlands Tracking the Mexican business cycle Yuriko Yabuta Mexico 2
Logistics Overview for North Carolina
 June 2, 2016 Logistics Overview for North Carolina Charles HW Edwards Outline Evolving Freight Logistics Network Why Logistics Is Important We Now Know Who We Are North Carolina s Supply Chain New Challenges
WORLD ENERGY OUTLOOK Dr. Fatih Birol Chief Economist Head, Economic Analysis Division
 WORLD ENERGY OUTLOOK 2002 Dr. Fatih Birol Chief Economist Head, Economic Analysis Division World Energy Outlook Series World Energy Outlook 1998 World Energy Outlook - 1999 Insights: Looking at Energy
The World Cotton Situation * Terry Townsend, Executive Director Armelle Gruere, Statistician. Projections to 2020
 INTERNATIONAL COTTON ADVISORY COMMITTEE 1629 K Street NW, Suite 72, Washington, DC 26 USA Telephone (22) 463-666 Fax (22) 463-695 e-mail secretariat@icac.org The World Cotton Situation * Terry Townsend,
Commodity Market Monthly
 Commodity Market Monthly 1 Research Department, Commodities Team* January 1, 214 www.imf.org/commodities Commodity prices rose by 2.4 percent in December, with increases in most main indices. During 213,
EXECUTIVE SUMMARY. Economic Outlook for Southeast Asia, China and India Special supplement: Update June 2016 UPDATE
 EXECUTIVE SUMMARY Economic Outlook for Southeast Asia, China and India 2016 Special supplement: Update June 2016 UPDATE JUNE 2016 Executive Summary: update on the Economic Outlook for Southeast Asia, China
Placed to Win Emerging Nations Set to Shake Up Natural Order
 Release date: 16 December 2015 Placed to Win Emerging Nations Set to Shake Up Natural Order Castrol releases its latest Natural Products Trade Barometer, part of the Castrol Global Trade Barometer Index
GE Global Innovation Barometer 2018 Full Report. Edelman Intelligence / 2017
 GE Global Innovation Barometer 2018 Full Report Edelman Intelligence / 2017 1 Contents ONE: Introduction to the GE Global Innovation Barometer (GIB) 2018 TWO: Methodology THREE: Key findings FOUR: Deep
CANADIAN AGRIFOOD EXPORT PERFORMANCE AND THE GROWTH POTENTIAL OF THE BRICS AND NEXT- 11
 CANADIAN AGRIFOOD EXPORT PERFORMANCE AND THE GROWTH POTENTIAL OF THE BRICS AND NEXT- 11 CATPRN Trade Policy Brief 2012-05 December 2012 Alexander Cairns Karl D. Meilke Department of Food, Agricultural
Rod Arenas Food Innovation Australia Ltd
 Rod Arenas Food Innovation Australia Ltd FOOD INNOVATION AUSTRALIA LTD About us National initiative set up by the Australian government through department of industry innovation and science Not-for-profit
Rice Outlook and Baseline Projections. University of Arkansas Webinar Series February 13, 2015 Nathan Childs, Economic Research Service, USDA
 Rice Outlook and Baseline Projections University of Arkansas Webinar Series February 13, 2015 Nathan Childs, Economic Research Service, USDA THE GLOBAL RICE MARKET PART 1 The 2014/15 Global Rice Market:
I. The world economy and trade in 2013 and early 2014
 WORLD TRADE REPORT I. The world economy and trade in and early Growth in world merchandise trade remained subdued in at. per cent, nearly identical to the previous year s increase of. per cent. The increases
The chemical industry in Italy: situation and outlook
 The chemical industry in Italy: situation and outlook August 2017 For information: Centro Studi Federchimica Phone 02/34565.337 - Mail aei@federchimica.it A good start in 2017 for chemical industry in
Asia s Fashion Jewellery & Accessories Fair March Exhibitors Survey Report
 Asia s Fashion Jewellery & Accessories Fair March Exhibitors Survey Report 1 Survey Summary Total number of exhibitors 383 Total number of collected onsite survey 254 Overall onsite survey response rate
Landscape of the European Chemical Industry 2017
 EU28 Cefic Number of companies Turnover 28,221 520.2 billion National contact Direct Employees 1,155,000 René van Sloten Executive Director rvs@cefic.be A CORNERSTONE OF THE EUROPEAN ECONOMY The chemical
New Brunswick agrifood. and seafood export. highlights
 New Brunswick agrifood and seafood export highlights 2016 New Brunswick agrifood and seafood export highlights 2016 Province of New Brunswick P.O. Box 6000, Fredericton NB E3B 5H1 CANADA www.gnb.ca Printed
RECENT TRENDS OF NEW ZEALAND S INTERNATIONAL FREIGHT TRANSPORT
 RECENT TRENDS OF NEW ZEALAND S INTERNATIONAL FREIGHT TRANSPORT Haobo Wang and Joanne Leung Ministry of Transport 1, PO Box 3175, Wellington 6140, New Zealand ABSTRACT This paper investigates the extent
Industrial Estates and Business Parks
 Industrial Estates and Business Parks 25 February 2016 Michael Kilgariff, Managing Director, Australian Logistics Council Focus Areas An overview of Melbourne s industrial estate market as it relates to
APM Terminals Lazaro Cardenas. Mexico s new gateway to the Pacific
 APM Terminals Lazaro Cardenas Mexico s new gateway to the Pacific 2 Mexico s new gateway to the Pacific 2.2% expansion in the Mexico economy in 2016 90% of Mexico s Pacific Coast trade passes through either
Agricultural Outlook Forum Presented: February 24-25, 2011 U.S. Department of Agriculture. Poultry Export Markets- Present and Future.
 Agricultural Outlook Forum Presented: February 24-25, 2011 U.S. Department of Agriculture Poultry Export Markets- Present and Future Thierry Murad USDA Agricultural Outlook Forum Thierry Murad 25 February
Digital leadership in the Public Sector
 Leaders 2020: The next-generation executive Digital leadership in the Public Sector Digital transformation promises great things for the Public Sector and the constituents it serves, from lower costs and
Who Gained Market Share in Indonesian Manufacturing?
 Who Gained Market Share in Indonesian Manufacturing? Sadayuki Takii and Eric D. Ramstetter ICSEAD and Graduate School of Economics, Kyushu University Working Paper Series Vol. 2008-14 March 2008 The views
Preface. Dear Shareholders
 Preface Dear Shareholders Prof. Dr. Hans Peter Wehrli Chairman of the Board of Directors Belimo can look back at a successful year. Sales in Swiss francs increased 8.2 percent to CHF 533.7 million. In
Material Flow in Japan
 Material Flow in Japan 26 Ministry of the Environment Government of Japan Overview of the Material Flow in Japan The first step in building a sound material-cycle society is to understand the flows of
Top 5 US Export and Import Commodities
 WWW.IBISWORLD.COM Special Report Month 2012 1 Follow on head on Master page A Special Report July 2012 Top 5 US Export and Import Commodities By Josh McBee and Justin Waterman Dominated by oil, cars and
WHITE PAPER MADE IN AUSTRALIA EXPORTING GLOBALLY. Your guide to exporting overseas.
 WHITE PAPER MADE IN AUSTRALIA EXPORTING GLOBALLY Your guide to exporting overseas. 1. WHITE PAPER Contents 01. A national exporting outlook 02. Opportunities for Victorian exporters 03. Advantages to exporting
I. MAIN ECONOMIC INDICATORS OF INDUSTRY
 I. MAIN ECONOMIC INDICATORS OF INDUSTRY MAIN INDICATORS OF INDUSTRY * 1995 Number of establishments 773 1050 1177 1234 1713 1816 2053 Output volume (at current prices), mln. drams 172048.2 261167.6 283484.8
Food and Beverage Sales and Pricing Challenges By Kevin Grier, Senior Market Analyst April 2008
 Food and Beverage Sales and Pricing Challenges By Kevin Grier, Senior Market Analyst April 2008 The Canadian grocery sector is exceptionally competitive. In fact, grocery chains continue to lose share
GLOBAL AD SPEND FORECASTS
 DENTSU AEGIS NETWORK GLOBAL AD SPEND FORECASTS JANUARY 2018 1 FIVE AD SPEND TRENDS YOU NEED TO KNOW IN 2018 1. 2. 3. 4. 5. Our latest forecasts show ad spend growth accelerating to 3.6% in 2018, up from
Confindustria-BDI Bilateral Summit
 Contents Page Confindustria-BDI Bilateral Summit Bolzano / Bozen, 21 st - 22 nd October 2013 Roland Berger Strategy Consultants 1 2 Acknowledgements > Roland Berger Strategy Consultants would like to thank
Are We Prepared for the Energy Movements? JEANNIE BECKETT THE BECKETT GROUP ENERGY EXPORT PERMITTING IN THE NW JUNE SEA-TAC CONFERENCE CENTER
 Are We Prepared for the Energy Movements? JEANNIE BECKETT THE BECKETT GROUP ENERGY EXPORT PERMITTING IN THE NW JUNE 16 2014 SEA-TAC CONFERENCE CENTER Topics Capacity existing infrastructure Further rail/port
Container Flows in World Trade, U.S. Waterborne Commerce and Rail Shipments in North American Markets
 Container Flows in World Trade, U.S. Waterborne Commerce and Rail Shipments in North American Markets Dr. William W. Wilson University Distinguished Professor Department of Agribusiness and Applied Economics
IAL Consultants CP House, Uxbridge Road Ealing, London W5 5TL UK Tel: Fax:
 IAL Consultants CP House, 97 107 Uxbridge Road Ealing, London W5 5TL UK Tel: + 44 20 8832 7780 Fax: + 44 20 8566 4931 PRESS RELEASE SEPTEMBER 2015 POLYURETHANE CHEMICALS AND PRODUCTS IN ASIA PACIFIC (APAC),
Omnichannel. Retail Index. Omnichannel. on the march
 The 2017 Global Omnichannel Retail Index Omnichannel on the march Contacts Berlin Birger Maekelburger Principal, PwC Strategy& Germany +49-170-2238856 birger.maekelburger @strategyand.de.pwc.com Frankfurt
Taiwan. Business information
 Business information Electronic components Taiwan is the world leader in semiconductor foundries, packaging and testing of integrated circuits, and production of blank optical disks and MROMs (mask read-only
Beef - UK Cattle prices continue to strengthen Young bulls proving to be adaptable
 JULY 2015 JUNE 2017 Beef - UK Cattle prices continue to strengthen The cattle trade continued its bullish feel recorded through April. The GB all prime average moved up almost 3p on the previous month
Economic System & Factors of Economic Growth
 Economic System & Factors of Economic Growth Standards SS6E1 The student will analyze different economic systems. a. Compare how traditional, command, and market, economies answer the economic questions
CONECT: Northeast Trade & Transportation Conference. New Trends in Overseas Sourcing: Sourcing from China
 CONECT: Northeast Trade & Transportation Conference New Trends in Overseas Sourcing: Sourcing from China March 11, 2010 Prepared by The JLJ Group Solutions for China Entry & Growth 1 DISCUSSION COVERS