Cheboygan Port & Community Asset Inventory
|
|
|
- Hubert Nigel Parker
- 5 years ago
- Views:
Transcription

 Funding Support: Community Foundation of")

1 UP 494 / 894 Cheboygan Port & Community Asset Inventory Practicum Project Prepared by: Andrew Baglini, Brad Beck, Shiraz Gillani, Priyamvada Kayal, Matt Lafferty, Graham Malott & Eric Phillips Assisted by: City of Cheboygan, Port of Cheboygan, Northeast Michigan Council of Governments (NEMCOG) Funding Support: Community Foundation of Northeast Michigan; US Economic Development Administration; Michigan DEQ Coastal Management Program; National Oceanic and Atmospheric Administration, and U.S. Department of Commerce
2 ACKNOWLEDGEMENTS... vi EXECUTIVE SUMMARY... vii LIST OF FIGURES... ix LIST OF TABLES... xii Explanation of Practicum... 1 Introduction... 1 Project Overview... 1 Client and Project Requirement... 1 Scope of Work... 4 Methodology... 4 Chapter 2 BACKGROUND... 5 Location... 5 Area of Study... 6 History... 9 Climate Topography Soil Wetlands Chapter 3 DEMOGRAPHICS Population Age Housing Analysis Chapter 4 SOCIO-ECONOMIC ACTIVITY Employment Income Industries Chapter 5 UTILITIES i
3 Water & Sewer Electricity Gas Broadband/High Speed Internet Analysis Chapter 6 COMMUNITY PLANNING AND ZONING City of Cheboygan Zoning Description City of Cheboygan Multi-Use Trail System City of Cheboygan Land Use Plan Land Use Permit Activity Analysis: Chapter 7 Transportation Roads US Highway Michigan Highway Michigan Highway Railways Freight rail service Intermodal Connectivity Public Transportation Airport Port of Cheboygan Public Boat Launch (Inventory Board 1, #4) Turning Basin Non-Motorized Transit Bike Share Analysis Chapter 9 ECONOMIC ONSITE ANALYSIS Riverfront Inventory Maps ii
4 Riverfront Development North Section South Section Marine Facilities Private Marine Facilities Public Marine Facilities Other Business Support Facilities Imports & Exports Communication Facility Analysis Chapter 9 ECONOMIC OFFSITE ANALYSIS Economy Cultural Downtown The Opera House Tourism / Recreation Michigan Inland Waterway City Parks Biking Winter Sports Marinas Bois Blanc Island and Plaunt Transportation, Inc Lighthouses Shipwrecks Analysis Chapter 10 PORT CITY COLLABORATIVE Mission Policy priorities Chapter 11 MICHIGAN PORTS- A POLICY FRAMEWORK iii
5 Historic Policy Overview PORT DISTRICTS - Act 234 of HERTEL-LAW-T. STOPCYNSKI PORT AUTHORITY ACT - Act 639 of Other Regulations Senate Bill 332 of Enforcement of State Laws Analysis Summary Chapter 12 PORT CASE STUDIES Port of Detroit, Michigan Port of Green Bay, Wisconsin Port of Muskegon, Michigan Port of Toledo, Ohio Port of Hamilton, Ontario, Canada Port of Monroe, Michigan Conclusion Chapter 13 SWOT ANALYSIS Strengths Weaknesses Opportunities Threats Chapter 14 RECOMMENDATIONS AND STRATEGIES SHORT TERM (0 5 years) Promote investment in the river and increase accessibility Increase recreation opportunities Promote Cheboygan s cultural activities Increase marketing of the City and the POC Create an identity for the City Planning related Expand opportunities for industries/business iv
6 Great Lakes Cruise / Tall Ships Port Improvements LONG TERM (6 10 Years) River related Regional networking and sharing of services Great Lakes Cruise / Tall Ships Port Improvements Business related Chapter 15 APPENDIX APPENDIX A PORT OF CHEBOYGAN BUSINESS SURVEY APPENDIX B Details of Bike Share programs in US Case Study: Capital Bike Share in Washington D.C APPENDIX C IRS Form v
7 ACKNOWLEDGEMENTS The MSU Practicum team would like to express their gratitude to Mr. Richard Deuell, our client and the Deputy Director & Senior Planner and Lisa Fought the Economic Development Specialist of the Northeast Michigan Council of Governments (NEMCOG), for his constant support and assistance in gathering the data and information. We also thank him for keeping us on track and updated on the constantly changing information for the project. We would also like to thank Mr. Jim Chamberlain, Ms. Mary Hebert, Mr. David Peters and Mr. Tom Spedding, members of the Port of Cheboygan Committee, for taking the time to meet with us on their weekend in the early stages of the project and providing us with a wealth of knowledge and the future plans of the Port of Cheboygan that was instrumental to our success. We would also like to thank Mr. Tom Eustice, the City of Cheboygan Assessor and all of his staff, who aided in our project to seek the unknown information and background information that we required. We also thank Mr. Greg Elliott, Partner of Elliott & Sangster CPA, who provided us with useful information pertaining to the organization and non-profit status of the Port of Cheboygan. We would also like to thank Mr. John Kerr, the Director of Economic Development & Grants Management of the Detroit/Wayne County Port Authority, for his knowledge imparted to us through a lengthy phone interview. He provided valuable insights as to how ports function, their operation, as well as the many regulations concerning them. We would also like to thank our supporting group that worked on Port of Alpena for their support and contribution in some sections of the report. Last but not least, we would like to thank our professors, Dr. Rex LaMore and Mr. John Melcher for their constant and continuous oversight and guidance in this process and helping us to achieve our goals with this project. "This project is supported in part pursuant to the receipt of financial assistance from the United States Department of Commerce-Economic Development Administration. The statements, findings, conclusions and recommendations are solely those of the authors and publishers and do not necessarily reflect the views of any federal agency or Michigan State University." vi
8 EXECUTIVE SUMMARY The City of Cheboygan is located at the northern tip of Michigan s Lower Peninsula, 16 miles east of the Straits of Mackinac and Mackinaw City. US-23 runs east-west through the city connecting, in the center of the city, with M-27 which runs south-southwest toward I-75. The city is approximately 270 miles north of Detroit. Since the city is strategically situated at the intersection of two Great Lakes, and near the intersection of a third, it is has very good access to the largest fresh water system in the world. The city has a strong history of industry and trade since the 1700 s with a major lumber boom in the late 1800 s. A subsequent paper industry emerged in 1904 with the creation of what is now known as the Great Lakes Tissue Company. Today, the city s economy is mostly dependent on tourism and recreational activities. In this practicum project our goal was to determine the parameters that are responsible for the economic growth and development for both the Port and the City of Cheboygan. This goal was accomplished by developing a comprehensive inventory of assets, a SWOT analysis and key demographic and socio economic information for the City of Cheboygan, as well as determining the existing economic assets. The completed inventory will complement NEMCOG s efforts to build upon the regional ports assets, as well as build a stronger and expanded economic foundation for the ports and cities of Cheboygan, Rogers City, and Alpena. The City of Cheboygan s population has fluctuated tremendously in the past 20 years as compared to Cheboygan County and the State of Michigan s population. The median age of the City of Cheboygan and Cheboygan County are increasing at a faster rate when compared with the State of Michigan. The population of the City comprises a higher number of residents that are 65 and above as compared to the state totals. The socio-economic status of the city shows trends of fluctuation from 1990 to The overall income levels for the City of Cheboygan have consistently been lower from 1990 to 2000 when compared to Cheboygan County and the State of Michigan. The employment rates for the City of Cheboygan and Cheboygan County have continuously decreased from 1990 to 2000 while Michigan s employment has fluctuated during that time, but has also decreased overall. The service industry is the largest employment sector in the City and County of Cheboygan. The greatest fluctuation has been demonstrated in the production, transportation and material moving industries. The employment numbers in this sector have increased in the City of Cheboygan itself; however, they have decreased in the County. For the City of Cheboygan, the rate of families below the poverty line has continuously increased from 1990 to In 2010, the rate of individuals and families below the poverty line in the City of Cheboygan was almost double that of Cheboygan County. The City is well-connected by major highways, including M-27(which is a major business route in the heart of downtown Cheboygan) and I-75, which is less than 25 miles due west of the city. The two vii
9 airports (Pellston Regional Airport, which offers both charter and commercial flights, and Cheboygan County Airport) are transportation assets for the region and the city. The lack of rail transportation, however, may be a hindrance for future development and expansion of industry in the area as well as the port itself. There is also a lack of intermodal connection. The Port of Cheboygan already has many valuable on-site port assets that can be expanded on and with the addition of new infrastructure and facilities could become a functioning commercial and industrial port in addition to the recreational aspect that it currently has going for it. There are several marinas and two marine maintenance facilities that cater to the recreational boaters and are imperative to the success of the port and support the local businesses. US Oil and the US Coast Guard have a strong presence in the deep-water portion of the river and could benefit from an expansion of the port and the dredging of the river. The team looked into the Michigan Port Collaborative and the port policy framework. The Michigan Port Collaborative helps in uniting the port cities and developing and creating opportunities for the communities and the ports themselves. We also studied the ports of Monroe, Detroit, Toledo, Muskegon, Hamilton, and Green Bay in order to better understand the characteristics of ports on the Great Lakes. The ports of Monroe, Detroit, Toledo, Muskegon, and Green Bay have similar water depths, recreational activities and transportation access. Dock space at these ports is comparable, although Hamilton reports the largest amount of dock space, while Monroe has the smallest. Four of the eight have port authorities. The City of Cheboygan has an opportunity to learn from what port authorities have to offer and how it can better the city and the port as a whole. As a team, we came up with several short and long term recommendations for the Port and City of Cheboygan. In the short term, we first recommend an investment in the positive promotion of the river on both a regional and state wide scale. Second, we recommend an increase in accessibility to the river. Third, we recommend an increase in recreational activities. Fourth, we recommend an increase in marketing which is paramount to creating an identity for the city and promoting Cheboygan s cultural activities. Lastly, we recommend specific port improvements which are detailed in this report. For the long term, we first recommend aesthetic enhancements and commercial investments along the riverfront. Second, we recommend bringing in Great Lakes Cruise Ships and/or the Tall Ships to expand opportunities for tourism and economic growth. Third, we recommend exploring the possibilities of regional marketing, which may lead to a partnership with other neighboring ports and cities. Lastly, we recommend continued physical port improvements to give Cheboygan a legitimate chance of success and prosperity in the future. viii
10 LIST OF FIGURES Figure 1-1 NEMCOG Region, Cheboygan County and City of Cheboygan Locator Map... 3 Figure 2-1 Location of City of Cheboygan... 5 Figure 2-2 City of Cheboygan and Cheboygan County boundaries... 6 Figure 2-3 Area of Study... 8 Figure 2-4 View of McArthur s Dock in Figure 2-5 View of Large Freighters Docked on the Cheboygan River in Figure 2-6 City of Cheboygan Opera House and City Hall Figure 2-7 Graph showing Climate for City of Cheboygan Figure 2-8 Digital Elevation Map Figure 2-9 Soil Map for Cheboygan County and City of Cheboygan Figure 2-10 Map showing Wetlands of City of Cheboygan Figure year Flood Map of City of Cheboygan Figure 3-1 Graph Comparing Total Population of City of Cheboygan and Cheboygan County for 1990, 2000 & Figure 3-2 Comparing Median Age Figure 3-3 Comparing Percent of Population by Age Group between City of Cheboygan, Cheboygan County and Michigan for Figure 3-4 Comparing Vacant units for Seasonal, Recreational or Occasional Use of City of Cheboygan, Cheboygan County and Michigan for 1990, 2000 & Figure 4-1 Income Comparison between City of Cheboygan, Cheboygan County & Michigan for Figure 4-2 Comparing Unemployment Status between City of Cheboygan, Cheboygan County and Michigan for 1990, 2000 & Figure 4-3 Occupation Distribution for City of Cheboygan for 2000 & Figure 4-4 Occupation Distribution for Cheboygan County for 2000 & Figure 5-1 Gas Utility Service area for Michigan and Cheboygan County Figure 6-1 City of Cheboygan Zoning Map Figure 6-2 City of Cheboygan Multi - Use Trail System Plan Figure 6-3 City of Cheboygan Current Land Use Plan Figure 6-4 Graph showing Zoning Permits for Cheboygan County from 2002 to Figure 6-5 Graph showing Zoning Permits by Type for Cheboygan County from Figure 7-1 Port Area Transportation Plan Figure 7-2 City of Cheboygan Traffic System Master Plan Figure 7-3 Cheboygan County Major Roads Figure 7-4 Map showing Connection between I-75 and City of Cheboygan through M Figure 7-5 Map showing Connection between I-75 and City of Cheboygan through M Figure 7-6 Cheboygan County Roads by Functional Classification and Miles Figure 7-7 Cheboygan County Class A Roads ix
11 Figure 7-8 Map showing Railroads Operating in Michigan Figure 7-9 Map showing Key Regional Links for Michigan Commodities Moving by Railroad Figure 7-10 Example of a Port Intermodal Facility with Rail-to-Water Figure 7-11 Major Airports near the City of Cheboygan Figure 7-12 Port of Cheboygan and River Depths Figure 7-13 Detailed map of the Turning Basin on Cheboygan River Figure 9-1 Riverfront Inventory Locator Map Figure 9-2 Inventory Board for City of Cheboygan - North Section Figure 9-1 Business Cluster Analysis for Cheboygan County Figure 9-2 Graph showing the Distribution of Employees Figure 9-3 City of Cheboygan Downtown Figure 9-4 Map showing Inland Water Way of MI Figure 9-5 City of Cheboygan Parks Figure 9-6 Map showing Marinas in City of Cheboygan Figure 9-7 Map showing Shipwrecks and Lighthouses near the City of Cheboygan Figure 12-1 Aerial of the one of the ports under the control of the Detroit Wayne County Port Authority Figure 12-2 Picture demonstrating the use of one of the many terminals found in the 32 mile stretch of the Detroit River that is included in the Port Authorities jurisdiction Figure 12-3 Aerial of the Port of Green Bay and its loading docks Figure 12-4 Bird s Eye View of the Channel of Port of Green Bay leading to Lake Michigan Figure 12-5 Aerial of the Port of Muskegon s various loading docks and Terrace Point Marina located in the upper right portion Figure 12-6 Birds eye view of the ports major loading dock and the Terrace Point Marina, Port of Muskegon Figure 12-7 Arial of the Port of Toledo and its Railways Leading to the Docks for Fast and Efficient Multimodal Transportation Figure 12-8 Birds Eye View of Large Cargo Ships Docked Near the Toledo Port with Various Railway Spurs Figure 12-9 Aerial of the Largest Dock at the Port of Hamilton Figure Birds Eye View of a Cargo Ship Docked on Port of Hamilton near Bulk Storage Tanks Figure Aerial View of the Port Of Monroe and its Close Proximity to I-75 Which Increases Their Efficiency and Reduces Handling Figure Birds Eye View of the Port of Monroe and its Channel connecting it to Lake Erie Figure 14-1 Waterfront Restaurants Figure 14-2 Water View Decks Figure 14-3 Park Amphitheatre Figure 14-4 Park Furniture Figure 14-5 Street Amenities x
12 Figure 14-6 Street Furniture Figure 14-7 Floating Docks Figure 14-8 Interpretive Signage Figure 14-9 Vision Figure Open Café or a Restaurant Figure Aesthetic Enhancement of Building Figure Join hands with the regional Port Authorities Figure Proposed Relocation of Ferry and Expansion of Turning Basin Figure Proposed Ferry Parking Lot Improvements Figure 15-1 Possible locations of stations and cycle lanes xi
13 LIST OF TABLES Table 2-1 Climate Comparison between United States and Cheboygan County Table 3-1 Comparing Total Population Change of City of Cheboygan, Cheboygan County and Michigan from 1990, 2000 and Table 3-2 Race Distribution of City of Cheboygan for 1990, 2000 & Table 3-3 Median age and Age Distribution for City of Cheboygan for 1990, 2000 & Table 3-4 Median age and Age Distribution of Cheboygan County for 1990, 2000 & Table 3-5 City of Cheboygan Household Types for 1990, 2000 & Table 3-6 City of Cheboygan Vacancy Status Table 3-7 Cheboygan County Vacancy Units Table 4-1 Comparing Education between City of Cheboygan, Cheboygan County and Michigan for 1990, 2000 & Table 4-2 Income for City of Cheboygan for 1990, 2000 & Table 4-3 Income for Cheboygan County Table 4-4 Employment for City of Cheboygan Table 4-5 Employment for Cheboygan County Table 4-6 Employment for Michigan Table 4-7 Poverty Status of City of Cheboygan for 1990, 2000 & Table 4-8 Poverty Status of Cheboygan County for 1990, 2000 & Table 7-1 List of Truck Bypass Roads and Downtown Roads Table 7-2 The Traffic Counts Table 7-3 The Distance of Major Cities by the Automobile Table 7-4 Major Intermodal Terminals in Michigan Table 7-5 Major Depots in Michigan Table 7-6 Operation of Vehicles Subject to the ISTEA Freeze Max Size and Weight Limits Table 7-7 Freight and Passenger Activity at Pellston Regional Airport Table 7-8 Comparing Pellston s usage to other Airports Statewide Table 8-1 Number of Slips Issued by Marinas in City of Cheboygan Table 8-2 Annual Contract and Dredging Report for Cheboygan Harbor, MI Table 9-1 Business Cluster Classification for NEMCOG Region Table 9-2 Private Sector employers in City of Cheboygan Table 10-1 Michigan Port Collaborative Analysis Table 11-1 Legislation for Port Districts Table 11-2 Legislation for Port Authorities Table 11-4 Port of Cheboygan Governing Body Table 12-1 Comparison between the Port Case Studies Table 15-1 United States Bike Share Programs Table 15-2 Capital Bike Share Operation Costs xii
14 i
15 CHAPTER 1 OVERVIEW AND OBJECTIVES Explanation of Practicum Practicum is a fundamental course for an Urban and Regional Planning major. In this course, a group of graduate and undergraduate students worked together on a project sponsored by a community or by an organization. The project helps in gaining practical knowledge and experience while also serving the community. It also contributes to understanding the problems of the community and solving them through an analytical approach. The projects undertaken by the groups were directed and guided by Professors - Dr. Rex LaMore and Mr. John Melcher. Introduction Andrew Baglini, Urban and Regional Planning Brad Beck, Master in Urban and Regional Planning Eric Phillips, Urban and Regional Planning Graham Malott, Urban and Regional Planning Matt Lafferty, Urban and Regional Planning Priyamvada Kayal, Master in Urban and Regional Planning Shiraz Gillani, Urban and Regional Planning Project Overview In 2011, the Northeast Michigan Council of Governments (NEMCOG) received a grant from the Michigan Coastal Zone Management Program and has both long and short term goals. The short term goal - is to provide the foundation for further development of existing ports by completing an inventory of port and community assets; and identifying opportunities, and constraints, and strategies for future activities; and identifying opportunities for regional collaboration. The long term goal - is to expand opportunities for commerce and recreation at the ports of Cheboygan, Rogers City, Presque Isle and Alpena. The project aims to provide a detailed inventory of assets for NEMCOG in order to enhance the opportunities and economic viability of the region. In the long term, the inventory will help in expanding the regional opportunities of trade, commerce and recreation at the ports of Cheboygan, Rogers City, Presque Isle and Alpena. Client and Project Requirement NEMCOG is a multi county organization established in 1968 with a mission to provide assistance and planning services to local governments. The organization is governed by a policy board that includes elected officials, business leaders and citizen representatives from throughout the eight-county region as demonstrated in Figure 1-1. Services are supported by local government appropriations, special services contracts and state and federal grants. It provides strategic planning for counties, cities and townships, offers grant writing services, as well as comprehensive land use planning, zoning, 1
16 transportation plans and much more. They also guide and assist in economic and community development (NEMCOG, 2010). NEMCOG proposes to create a Regional Port Committee comprising various stakeholders including communities, organizations, individuals, businesses and users. The Committee will discuss the assets, constraints and opportunities for the region and make an effort for regional collaboration for economic enhancement. In order to support and assist NEMCOG, the MSU Practicum Team has created both an onsite (port) and offsite (community) inventory, and also gathered background information about the community and port including demographics and economic activity. The Practicum team has also identified the opportunities and constraints of port, utilizing community input; and identified strategies that can be implemented in order to enhance the region s economy. 2

17 Figure 1-1 NEMCOG Region, Cheboygan County and City of Cheboygan Locator Map Source 1: ( & Practicum Team 2012) 3
18 Scope of Work The goal of the project is to determine the potential for development and economic growth of Cheboygan s port in congruence with the surrounding regional ports to promote a synergistic and sustainable regional resource. This goal will be accomplished by developing a comprehensive inventory of assets, a SWOT analysis, key demographic and socio economic information for the City of Cheboygan, as well as determining the existing economic assets. The completed inventory will complement NEMCOG s efforts to further utilize the regional ports of Alpena, Rogers City and Cheboygan assets, as well as build a stronger and expanded economic foundation for these ports. Methodology The aforementioned scope was developed through site visits to Cheboygan and its port, allowing the team to directly examine the existing conditions as well as their current assets and liabilities. The project team also met the Port of Cheboygan, a 501(c)4 committee of local activists and professionals, to more clearly determine the community s inventory, needs and future priorities. The project team divided the asset inventory framework, as provided by NEMCOG, into tasks broken down into onsite and offsite categories including land use, demographics, tourism, transportation, utilities, and economic viability. The Port of Cheboygan, as well as State and Federal resources was utilized in the gathering of information and the subsequent analysis of it. Additionally, collaboration with Team Alpena was essential to maintain common consistency between the two separate port studies and also allowed for increased efficiency in our research efforts. All of the efforts listed resulted in a final project paper, presentation posters and a PowerPoint presentation which elaborates the present findings and future recommendations for NEMCOG, the community of Cheboygan, and the other regional port communities. The student practicum team, under the direction and support of the MSU faculty and NEMCOG, also conducted a short telephonic survey through a set of pre-determined set of questions (see Appendix A). The purpose of the survey was to gain input and support from the major stakeholders and businesses that are adjacent to the Cheboygan River in the area of study (Figure 2-3). The information that was gathered is very valuable and insightful because it came from locals and those that see and use the riverfront area on a frequent basis. The compiled data was instrumental in the analysis and recommendation section. 4
.")
19 CHAPTER 2 BACKGROUND Location The Great Lakes Lakes Superior, Huron, Michigan, Erie and Ontario - and their connecting channels are the largest fresh water system in the world. The channels are the most important part of the Great Lakes connectivity (Great Lakes Information Network [GLIN] 1993). They link the heartland of North America with numerous ports of call and markets around the world. Outdoor recreation, the tourism industry, a strong maritime transportation system, and a diverse and extensive agriculture base support the Great Lakes region s economy. Along with this economic activity, the region is supported by industrial manufacturing, steel production and commercial and recreational fisheries (GLIN, 1993). Figure 2-1 Location of City of Cheboygan Source: ( 5

20 The City of Cheboygan is located on the northeast side of Michigan's lower peninsula on the Lake Huron shore. It is 16 miles south of the Straits of Mackinac, and approximately 270 miles north of Detroit. The main thoroughfares for the City of Cheboygan include M-27 and US-23, which runs along the Lake Huron coastline. I-75 is less than 20 miles from the City and is accessible via M-27 or other well-maintained county roads, as indicated in Figure 2-2. Figure 2-2 City of Cheboygan and Cheboygan County boundaries Source: ( Area of Study The area of study for the Port of Cheboygan extends from the locks and dams at the south end of the Cheboygan River where the river empties into Lake Huron see(figure 2-3). The State Street Bridge prevents larger ships from continuing down the river. Our main area of focus is the turning basin and the stretch of river from the State Street Bridge to the Lake Huron. 6
21 There are many recreational facilities, such as baseball fields and parks, located near the dam and along the shores of Lake Huron by the mouth of the river. The focus area of the port includes US Oil, the coast guard station, lumber and construction companies, marinas, restaurants, and businesses along the river. There is an industrial park located just west of the port. A large parcel of vacant land is located on the western coast of the river across from US Oil with another vacant lot on the east side between US Oil and the turning basins. 7

22 Figure 2-3 Area of Study Source: (Practicum Team 2012) 8

23 History The City of Cheboygan was first inhabited by Native American tribes living in the region. The Cheboygan River was widely used for trade between the Ottawa and Chippewa Indians, and, eventually the European settlers. The river mouth was used for the popular fur trade industry in the late 1700 s and early 1800 s. As the fur trade waned, more people moved near the river in order to fish for a living. The fishing industry brought in the first permanent settler and resulted in the creation of a sawmill in 1844 that was needed to make barrels to pack the fish for shipping (Cheboygan City History). Like most of Michigan, Cheboygan had an abundance of white pines that could be used for lumber, which, in turn, boosted the popularity of Northern Michigan. Cheboygan practically grew overnight due to the lumber boom of the late 1800 s. Cheboygan was incorporated as a village in 1877 and ultimately as a city in 1889 (Cheboygan City History). By the mid 1890 s Cheboygan s population had peaked and began to decline correspondingly with the lumber industry. Since 1904, the paper industry has had a large presence in Cheboygan. Originally a Proctor and Gamble site, the large factory at the south end of the river is now known as Great Lakes Tissue. (Cheboygan County Comprehensive Plan). Due to the America s new desire to travel post - World War II, Cheboygan became a large tourist destination and summer homes became more plentiful. Figure 2-4 View of McArthur s Dock in 1905 Source: ( Cheboygan continues to promote tourism, however their economy largely relies on the manufacturing and service industries. Many of the city s historic buildings can still be seen today and are under 9

24 preservation with help of local organizations. Cheboygan's success has centered on its river access to Lake Huron and its history of being a recreational port city. Figure 2-5 View of Large Freighters Docked on the Cheboygan River in 1936 Source: ( 10
 Climate Cheboygan, receives the full spectrum of weather throughout the year with cold winters and warm summers.")
25 Figure 2-6 City of Cheboygan Opera House and City Hall Source: ( Climate Cheboygan, receives the full spectrum of weather throughout the year with cold winters and warm summers. This makes the area unique as each season attracts tourists for a variety of reasons such as the snowmobile crowd in the winter and boaters in the summer. The waters of Lake Huron cause variations in the climate as well as the precipitation. Figure 2-7 shows the temperature and amount of precipitation for the city of Cheboygan. The temperature peaks in July while the greatest precipitation occurs in September. 11
")
26 Figure 2-7 Graph showing Climate for City of Cheboygan Source: ( Table 2-1 displays the climate difference between Cheboygan and the average for the United States. The total amount of snowfall is drastically greater in Cheboygan (83.6 in.) compared to the rest of the United States (25 in.). The UV Index predicts UV intensity levels on a scale of 1 to 11+, where 1 indicates a low risk of overexposure and 11+ signifies an extreme risk. It takes into account clouds and other local conditions that affect the amount of UV radiation reaching the ground in different parts of the country. The Comfort Index is based on humidity during the hot months on a scale of 1 to 100, where the higher score is more comfortable. 12
27 Table 2-1 Climate Comparison between United States and Cheboygan County Climate Cheboygan, MI United States Rainfall (in.) Snowfall (in.) Precipitation (in.) Sunny Days Avg. July High ( F) Avg. January Low ( F) Comfort Index (higher = better) UV Index Elevation (Ft) 592 1,060 Source: ( Topography The Cheboygan County landscape is one of lakes, streams, rivers, and trails. The landscape is primarily flat with very little undulation. The area near the shores of Lake Huron is varying from wetland to rocky outcroppings and mostly undeveloped. There is also a good amount of open fields for future development and recreational uses still available due to low population demands when compared with the shorelines on the western side of the state. The elevation changes from a low of feet near the Lake Huron shoreline, to a high of 1,303.1 feet just east of where the Cheboygan River splits, near Mullet Lake. Soil According to the General Soils map of Cheboygan County, the City of Cheboygan contains a single primary soil type known as the Roscommon/Charity-Augury Association of soils, through much of the City limits. This is characterized as a clay loamy soil. The soils within the city can be further described as deep, nearly level, very poorly drained to somewhat poorly drained, mucky, loamy and sandy soils that formed in sandy and lacustrine deposition lake plains. As a result of these soil types, existing drainage-ways and relatively flat elevations, storm water drainage will be major challenge for the City of Cheboygan as future development is considered in order to properly distribute storm and springtime runoff (Land Use plan, 2007). Wetlands Figure 2-10 shows the low lying areas of in the City of Cheboygan, traditionally the wetlands along the Lake Huron shoreline. These wetlands are indicated as environmental land uses both on the existing Land Use and the Projected Land Use. 13
")
28 Figure 2-8 Digital Elevation Map Source: (Cheboygan County & Practicum Team 2012) 14
 15")
29 Figure 2-9 Soil Map for Cheboygan County and City of Cheboygan Source: ( 15
 16")
30 Figure 2-10 Map showing Wetlands of City of Cheboygan Source: ( City of Cheboygan & Practicum Team 2012) 16

31 Figure year Flood Map of City of Cheboygan Source: (Federal Emergency Management Agency) 17
32 CHAPTER 3 DEMOGRAPHICS Population The City of Cheboygan is a small northern Michigan coastal community with a population of 4,867 according to 2010 US Census. The overall population has not been consistent over the past 20 years. The population rose about 5.6% from 1990 to 2000 and then the population decreased by 8.1% from 2000 to Over the past 20 years the overall population has dropped about 2.8% or 130 less people in the City. Cheboygan County also follows this trend where the population change from 1990 to 2000 increased by 19.1% and decreased from 2000 to 2010 by 1.5%. Table 3-1 Comparing Total Population Change of City of Cheboygan, Cheboygan County and Michigan from 1990, 2000 and Percent Change Percent Change City of Cheboygan % % Cheboygan County 21,398 26, % 26, % Michigan 9,295,297 9,938, % 9,883, % Source: (City of Cheboygan NWMCOG Census 1990, City of Cheboygan General Population 2010, Cheboygan County NWMCOG Census 1990, Michigan Demographic Profile 2010, Michigan General Characteristics 1990, Michigan General Demographics 2000, Michigan Demographic Profile) The City of Cheboygan, Cheboygan County, and the State of Michigan have all experienced population decreases over the last ten years. However, while the County and the State of Michigan have experienced an overall increase in their populations in the last 20 years, the City has experienced a decrease as mentioned in Table
 The City of Cheboygan is comprised mostly of Caucasians, accounting for about 91% of the population.")
33 Figure 3-1 Graph Comparing Total Population of City of Cheboygan and Cheboygan County for 1990, 2000 & 2010 Source: (Cheboygan City NWMCOG Census 1990 & 2000, Cheboygan City General Population 2010, Cheboygan County NWMCOG Census 1990 & 2000, Michigan Demographic Profile 2010) The City of Cheboygan is comprised mostly of Caucasians, accounting for about 91% of the population. The largest minority group is American Indian or Alaskan Native with about 5% of the population. The minority population of City of Cheboygan has increased from 2.8% in 1990 to 8.2% in 2010 (See Table 3-2). 19
34 Table 3-2 Race Distribution of City of Cheboygan for 1990, 2000 & 2010 City of Cheboygan 1990 Percent 2000 Percent 2010 Percent One Race (N/A) (N/A) 5, , White 4, , , Black or African American Hispanic or Latino by origin American Indian or Alaska Native Asian Native Hawaiian & Other Pacific Islander Some other race Two or more races (N/A) (N/A) Source: (Cheboygan City NWMCOG Census 1990, 2000), (Cheboygan City General Population 2010) Age The median age of the City of Cheboygan has increased from 34.1 years in 1990 to 40.8 years as of 2010 (See Figure 3-2). This is also the tread in Cheboygan County where the median age increased from 41.3 years in 2000 to 47.1 years as of The age group of 45 to 65 years has the highest percent of the population with 26.0% for City of Cheboygan, which has shifted from the 2000 census where the highest percent of the population age group was 25 to 44 years as seen in Table 3-3. This population shift in age groups is also demonstrated in the County. 20
 34.1 (X) 37.4 (X) 40.")
35 Figure 3-2 Comparing Median Age Source: (Cheboygan City General Population 2010), (Michigan Demographic Profile 2010), (Michigan General Characteristics 1990) Table 3-3 Median age and Age Distribution for City of Cheboygan for 1990, 2000 & 2010 City of Cheboygan 1990 Percent 2000 Percent 2010 Percent Median age (years) 34.1 (X) 37.4 (X) 40.8 (X) Total Population 4, , , Under 5 yrs to 14 yrs to 24 yrs to 44 yrs 1, , , to 64 yrs , , yrs and over Source: (Cheboygan City NWMCOG Census 1990, 2000), (Cheboygan City General Population 2010) 21
36 Table 3-4 Median age and Age Distribution of Cheboygan County for 1990, 2000 & 2010 Cheboygan County 1990 Percent 2000 Percent 2010 Percent Median age (years) 37.1 (X) 41.3 (X) 47.1 (X) Total Population 21, , , Under 5 yrs 1, , , to 14 yrs 3, , , to 24 yrs 2, , , to 44 yrs 5, , , to 64 yrs 4, , , yrs and over 3, , , Source: (Cheboygan County NWMCOG Census 1990, 2000), (Michigan Demographic Profile 2010) The City of Cheboygan and Cheboygan County have a significantly higher percentage of persons 65 years and older when compared to Michigan as a whole. Over the past 20 years the City of Cheboygan and Cheboygan County have shown a trend of having a higher median age than Michigan. 22
 Housing Since 1990 there has been a steady increase of about 100 housing units per decade although the number of vacant housing has shown a large increase from 2000 to 2010.")
37 Figure 3-3 Comparing Percent of Population by Age Group between City of Cheboygan, Cheboygan County and Michigan for 2010 Source: (Cheboygan City General Population 2010), (Michigan Demographic Profile 2010) Housing Since 1990 there has been a steady increase of about 100 housing units per decade although the number of vacant housing has shown a large increase from 2000 to There is a large amount of housing units that are only used seasonally, recreationally or occasionally, although obtaining an accurate number is difficult since the US census only occurs in April each decade and information from owners of the housing unit may not be available (County Comprehensive Plan 2002). A vacant housing unit means that the unit is not occupied at the time that the census was taken, unless the occupants were temporarily absent. A unit may also be considered vacant if the occupied persons have a usual residence elsewhere (US Census Bureau, 2011). The housing units used seasonally, recreationally or occasionally make up 4.3% of the City of Cheboygan s total housing units, and 30.4% of the County s total housing units as seen in Table 3-6. The average household size for the City of Cheboygan for an owner-occupied unit is 2.27 persons, as compared to 2.18 persons for a renter-occupied unit as seen in Table 3-5. The average household sizes have been decreasing slowly from 1990 to
38 Table 3-5 City of Cheboygan Household Types for 1990, 2000 & 2010 City of Cheboygan 1990 Percent 2000 Percent 2010 Percent Total Households 1, , , Family Households (families) 1, , , With own children under Married-couple family With own children under Nonfamily households Householder living alone Householders 65 years and over Average Household Size owner-occupied 2.61 (X) 2.46 (X) 2.27 (X) Average Household Size renter-occupied 2.26 (X) 2.19 (X) 2.18 (X) Source: (Cheboygan City NWMCOG Census 1990, 2000, Cheboygan City General Housing 2010) (Note: Family Households and Nonfamily Households have sub-categories; therefore, all percentages are relative to the total household.) For the City of Cheboygan, married-couple families have decreased significantly from 2000 to Householders living alone have increased by almost 25% over the past 20 years. Householders that are 65 and older have increased by 12% over the past 20 years. Family households have been decreasing over the years and nonfamily households have been on the rise. Table 3-6 City of Cheboygan Vacancy Status City of Cheboygan 1990 Percent 2000 Percent 2010 Percent Vacant Housing Units For seasonal, recreational, or occasional use Source: (Cheboygan City NWMCOG General Census 2000, Cheboygan City General Housing 2010, City of Cheboygan Land Use Plan) Table 3-7 Cheboygan County Vacancy Units Cheboygan County 1990 Percent 2000 Percent 2010 Percent Vacant Housing Units 5, , , For seasonal, recreational, or occasional use 4, , , Source: (Cheboygan County NWMCOG Census 1990, 2000, Cheboygan County General Demographic 2000, Cheboygan County Households and Families 2010) 24
, (Cheboygan County General Demographic 2000), (Cheboygan County Households and Families 2010), (Michigan Social Characteristics 1990), (Michigan General Housing 2000), (Michigan Demographic")
39 Figure 3-4 Comparing Vacant units for Seasonal, Recreational or Occasional Use of City of Cheboygan, Cheboygan County and Michigan for 1990, 2000 & 2010 Source: (Cheboygan County NWMCOG Census 1990, 2000), (Cheboygan County General Demographic 2000), (Cheboygan County Households and Families 2010), (Michigan Social Characteristics 1990), (Michigan General Housing 2000), (Michigan Demographic Profile 2010) Cheboygan County has a much higher rate of vacant units used for seasonal, recreational or occasional use than the City of Cheboygan and Michigan as a whole. Over the past 20 years the City of Cheboygan and Cheboygan County s rate of vacancy for units of seasonal, recreational, or occasional use has remained relatively the same, while Michigan s rate has decreased by almost 15%, as seen in Image 3-5. Although the City of Cheboygan s rate of vacancy for these units of has remained relatively the same, the number of units has increased over the past 20 years. This follows the trend that vacant housing units as a whole have been increasing over the past 20 years. Analysis The City of Cheboygan has shown the most fluctuation in population over the past 20 years when compared to Cheboygan County and State of Michigan. This makes future population trends difficult to predict. Median ages of the City of Cheboygan and Cheboygan County are increasing at a faster rate as compared to Michigan. 25
40 The City of Cheboygan shows a high number of persons 65 years and over when compared to State of Michigan totals. Cheboygan County shows a higher percentage of persons 45 to 64 years and 65 years and over than both the City of Cheboygan and Michigan. The City of Cheboygan has an increasing trend of vacant housing units which are either for seasonal, recreational or occasional use. 26
41 CHAPTER 4 SOCIO-ECONOMIC ACTIVITY This section will examine the social and economic trends, employment and occupation status along with income trends, and how they compare between the City of Cheboygan, Cheboygan County, and the State of Michigan. Employment The City of Cheboygan has a 7.4% higher rate of high school graduates and a 6.0% higher rate of persons with a Bachelor s degree or higher (Table 4-1). The percentage of those with a high school degree or higher has increased from 1990 to 2010 from 76.2% to 80.8% in Cheboygan County. The percentage of those with a bachelor s degree or higher has increased from 7.8% to 11.1%. The City of Cheboygan has a lower percentage of high school graduates and persons with a bachelor s degree or higher over the past 20 years. Michigan has a 1.7% higher rate of high school graduates than the City of Cheboygan and 11.2% higher rate of persons with a bachelor s degree or higher for Table 4-1 Comparing Education between City of Cheboygan, Cheboygan County and Michigan for 1990, 2000 & 2010 Education Percent High School Graduate or Higher Percent Bachelor's degree or higher City of Cheboygan Michigan City of Cheboygan Michigan Cheboygan County Cheboygan County Source: (Cheboygan City NWMCOG Census 1990, 2000, Cheboygan City NWMCOG Census 2010, 2000, Michigan Labor 1990, Cheboygan County NWMCOG Census 1990, 2000, Cheboygan County NWMCOG Census 2010, 2000, Michigan General Demographics 2000, Michigan Education 2010) Income The median household and family income along with per capita income is significantly less for the City of Cheboygan as compared to Cheboygan County (Table 4-2 and 4-3). The median household and family income as well as per capita income has continued to increase for the County since the 2000 US Census. For the City of Cheboygan, only the per capita income has increased. The median household income for the City of Cheboygan has increased over the last 20 years but has slightly decreased from 2000 to 2010 (Note: Income for 1990 is in 1989 dollars and income for 2000 is in 1999 dollars and 2010 data is in 2009 dollars). Cheboygan County does not follow this trend as its median household income has been continuously increasing over the past 20 years. The median family income for the City of Cheboygan has also increased over the past 20 years. It has increased greatly from 1990 to 2000 and slightly decreased from 2000 to The median family income for Cheboygan County steadily increased from the 1990 census to the 2010 census. The State of Michigan also follows these trends (Figure 4-1) (Michigan 27
42 Income 1990, Michigan Economic Characteristics 2000, Michigan Economic Characteristics 2010). The per capita income for the City of Cheboygan has had a steady increase over the past 20 years. The per capita income for Cheboygan County has almost doubled from 1990 to 2000 and has increased about $5,000 from 2000 to Cheboygan County overall has had higher income in each of the three categories. The County has also had a more consistent trend of steadily rising income in the three categories of median household income, median family income, and per capita income as seen in Figure 4-1. Table 4-2 Income for City of Cheboygan for 1990, 2000 & 2010 City of Cheboygan Median Household Income 19,120 25,033 22,702 Median Family Income 22,816 32,692 29,583 Per Capita Income 8,567 14,318 17,367 Source: (Cheboygan City NWMCOG Census 1990, 2000, Cheboygan City General Housing 2010) Note: Income for 1990 is in 1989 dollars and income for 2000 is in 1999 dollars and 2010 data is in 2009 dollars, Cheboygan City General Housing 2010). Table 4-3 Income for Cheboygan County Cheboygan County Median Household Income 21,006 33,417 37,100 Median Family Income 24,396 38,390 45,977 Per Capita Income 9,568 18,088 23,038 Source: (County NWMCOG Census 1990, 2000, Cheboygan County NWMCOG Census 2010, 2000) Note: Income for 1990 is in 1989 dollars and income for 2000 is in 1999 dollars and 2010 data is in 2009 dollars, Cheboygan County Households and Families 2010) 28
 Note: City of")
43 Figure 4-1 Income Comparison between City of Cheboygan, Cheboygan County & Michigan for 2010 Source: (Cheboygan County NWMCOG Census 1990, 2000, Cheboygan County Households and Families 2010, Cheboygan City NWMCOG Census 1990, 2000, Michigan Income 1990, Cheboygan City General Housing 2010, Michigan Economic Characteristics 2000, Michigan Economic Characteristics 2010) Note: City of Cheboygan 2010 income analysis is based on American Community Survey 5- Year Estimates, 02/06/2012. Michigan 2010 data is based on the 2010 American Community Survey 1- year estimates. Employment for the City of Cheboygan decreased by percentage of population over the past 20 years but has overall increased by number of persons as seen in Table 4-4. The increasing number of unemployed has increased for City of Cheboygan, but not as drastically as Cheboygan County as seen in Figure 4-2. Unemployment has increased by 0.6% from 1990 to 2010 for the City of Cheboygan while Michigan unemployment has increased by 1.2% from 1990 to 2010 as seen in Tables 4-4 and 4-6 (Michigan Labor 1990, Michigan Economic Characteristics 2000, Michigan Economic Characteristics 2010). 29
44 Table 4-4 Employment for City of Cheboygan City of Cheboygan 1990 Percent 2000 Percent 2010 Percent Population 16 years and over 3, , , In Labor Force 2, , , Employment 1, , , Unemployment Not in Labor Force 1, , , Source: (Cheboygan City NWMCOG Census 1990, 2000, Michigan Income 1990, Cheboygan City General Housing 2010) Table 4-5 Employment for Cheboygan County Cheboygan County 1990 Percent 2000 Percent 2010 Percent Population 16 years and over 16, , , In Labor Force 9, , , Employed 8, , , Unemployed 1, , , Not in Labor Force 7, , , Source: (County NWMCOG Census 1990, 2000, Cheboygan County Households and Families 2010) Table 4-6 Employment for Michigan Michigan 1990 Percent 2000 Percent 2010 Percent Population 16 years and over 7,102, ,630, ,833, In Labor Force 4,554, ,926, ,874, Employed 4,082, ,637, ,141, Unemployed 582, , , Not in Labor Force 2,547, ,704, ,958, Source: (Michigan Labor 1990, Michigan Economic Characteristics 2000, Michigan Economic Characteristics 2010) For the City of Cheboygan, unemployment has risen over the past 20 years. The City of Cheboygan s unemployment rate has not risen as fast as Cheboygan County and Michigan since The City of Cheboygan has a slightly higher rate of unemployment than Michigan. Cheboygan County has the highest rate of unemployment of the three. 30
")
45 Figure 4-2 Comparing Unemployment Status between City of Cheboygan, Cheboygan County and Michigan for 1990, 2000 & 2010 Source: (Cheboygan County NWMCOG Census 1990, 2000, Cheboygan County Households and Families 2010, Cheboygan City NWMCOG Census 1990, 2000, Cheboygan City General Housing 2010, Michigan Income 1990, Michigan Economic Characteristics 2000, Michigan Economic Characteristics 2010) Note: Michigan 2010 data is based on the 2010 American Community Survey 1-year estimates. Industries The two largest industries for the City of Cheboygan are service occupations and sales and office occupations. In 2000, service occupations had the highest employment. In 2010 the highest employment shifted to the sales and office occupations. The industry with the largest change is production, transportation, and material moving occupations with a 4% rise and 79 more employed from 2000 to For Cheboygan County the two largest industries are management, professional and related occupations and sales and office occupations. The industry with the largest change for Cheboygan County is also production, transportation, and material moving occupations with a 2% decrease and 367 less employees from 2000 to

46 Figure 4-3 Occupation Distribution for City of Cheboygan for 2000 & 2010 Source: (City of Cheboygan NWMCOG Census 2010, 2000) 32
 26.7 Individuals 905 36.0 1,001 19.9 (N/A) 31.7 18 years and over 581 17.1 577 15.6 (N/A) 25.")
47 Figure 4-4 Occupation Distribution for Cheboygan County for 2000 & 2010 Source: (Cheboygan County NWMCOG Census 2010, 2000) Table 4-7 Poverty Status of City of Cheboygan for 1990, 2000 & 2010 City of Cheboygan 1990 Percent 2000 Percent 2010 Percent Families (N/A) 26.7 Individuals , (N/A) years and over (N/A) years and over (N/A) 11.2 Source: (Cheboygan County NWMCOG Census 1990, 2000, Cheboygan County Households and Families 2010) 33
48 Table 4-8 Poverty Status of Cheboygan County for 1990, 2000 & 2010 Cheboygan County 1990 Percent 2000 Percent 2010 Percent Families (N/A) 11.8 Individuals 3, , (N/A) years and over 2, , (N/A) years and over (N/A) 6.5 Source: (Cheboygan City NWMCOG Census 1990, 2000, Cheboygan City General Housing 2010) Note: Poverty status is based on persons whose income for the past 12 months is below the poverty level for when the decennial census was taken. Individuals and families below the poverty line in the City of Cheboygan have increased since 2000 following County and State trends. Unemployment rates for Cheboygan County have been on a steady increase, following state trends, but the City s unemployment rates have remained relatively the same. Unemployment in the City of Cheboygan has increased 0.4% from 1990 to 2010 while the County s unemployment has increased 5% since that time (Tables 4-7 and 4-8). 34
49 CHAPTER 5 UTILITIES An inventory of the City and port s available utilities is important because these services can be used as a tool to attract and encourage development in the port area. An assessment of Cheboygan s utilities will indicate whether expansion or improvement is needed in order to increase activity in Cheboygan s port. It will also indicate if these utilities can be used as leverage to encourage development from new investors or other parties. Water & Sewer Public Water Supply The City of Cheboygan water department maintains approximately 49 miles of distribution piping, four production wells and one 500,000 gallon water storage tower. The average daily production is about 910,000 gallons. There are roughly 2,000 residential and commercial billing accounts, including some accounts the department serves outside the City limits via established intergovernmental agreements. The City s water source is groundwater, which is disinfected before distribution (Water & Wastewater Departments, 2012). Sewer System The City of Cheboygan wastewater department maintains about 40 miles of piping, six lift stations, and the wastewater treatment facility. It provides service to about 2,000 residential and commercial accounts. The treatment facility treats an average of approximately 2 million gallons per day. The plant is rated for an average of 2.5 million gallons per day, and has a peak capacity of 5 million gallons per day during wet weather conditions. During heavy rain, a 1.3 million gallon flow equalization basin holds overflow until it can be treated when the flow returns to normal. The facility also treats sewage from a small portion of Inverness Township, and has a contract to maintain their collection system and four main lift stations. The treatment facility was expanded in 1978 to provide secondary treatment using Rotating Biological Contractors. This discharges effluent, clean enough to meet the requirements of the National Pollution Discharge Elimination System (NPDES) permit. Additionally, the facility is equipped with a full laboratory and staff, which monitor the effluent quality. The water is discharged into the Cheboygan River, about half a mile from the mouth, where it flows into Lake Huron (Water & Wastewater Departments, 2012). Electricity Consumers Energy provides electricity to the City of Cheboygan for residential and commercial purposes. Consumers Energy is a private energy company that supplies electricity as well as natural gas to many surrounding communities and across the state as well (Consumers Energy, 2012). Gas 35

50 Natural gas is distributed by DTE Energy (DTE). DTE provides natural gas through Michigan Consolidated Gas Company (MichCon) (DTE Energy, 2012). Figure 5-1 shows the distribution of natural gas by utility providers for the state of Michigan. The blown up map shows the gas utility providers for Cheboygan County. Figure 5-1 Gas Utility Service area for Michigan and Cheboygan County Source: (DTE Energy, 2012) Broadband/High Speed Internet High speed internet is an important economic tool for businesses because it allows buying and selling to occur over the internet, where customers can purchase from home instead of appearing in person for 36
51 goods. In many rural areas across the country, broadband availability is becoming an increasing problem and a detriment to economic growth when unavailable. Typically there are three types of broadband high-speed internet service. Satellite internet is one possibility, but it is usually limited in speed and high in price. Satellite based broadband will have speeds usually between 1-3 megabits, and is ideal for areas where cable or DSL broadband may not reach. DSL broadband is typically the least expensive among high-speed internet alternatives. Speeds range from 1.5 megabits per second to as high as 6 mbps. Many people don't know what exactly DSL is--it is delivered to a business or home via telephone wire, as in the current network of telephone wires that already exists in the community. Cable internet service comprises the vast majority of broadband service in the United States. Cable internet comes to your home or business through a standard coaxial cable, the same cable that provides you with television channels. Typical speeds are 6-20 mbps, at moderate prices, although cable can reach speeds of up to 105 mbps in some areas. Analysis Cheboygan s utilities are adequate for current operations. In the event of a major expansion, as with most major projects, additional utilities may be necessary. Particularly in the areas of water and sewer, development of unused or undeveloped parcels may require the expansion of basic services. 37
52 CHAPTER 6 COMMUNITY PLANNING AND ZONING City of Cheboygan Zoning It is important to know the zoning and land use planning of the city because this is a major factor in the attraction of investment to the city. Understanding the zoning ordinance can help the city encourage development in key areas of the city, particularly on the riverfront along the Cheboygan River. The land use plan shows the uses of parcels within the city. Reading and understanding this plan can paint a clearer picture of the city s current land uses. It also allows the city to develop a workable future land use plan. Description One family residential (R-1): Residential districts intended for one-family parcels Two family residential (R-2): Used as buffer district along major streets or between single and multifamily districts where apartments may be located Multi-Family residential (R-M): Provide sites for multi-family dwelling structures, generally serving as zones of transition between business or industrial districts and lower density single-family districts Mobile Home residential (R-MH): Residential zones designated specifically for mobile home parks Tourist Service (T-1): Designed to accommodate activities necessary to service tourists needs, including retail, accommodations, amusement parks, and public uses Local Business (B-1): Intended for basic day-to-day shopping and service needs for people residing in nearby residential areas. Located on major streets providing party stores and some professional services Central Business (B-2): Provides for a combination of office buildings and a variety of retail stores related to activities that occupy prime retail frontage to serve the needs of the entire city. Along main street from US-23 to Nelson St General Business (B-3): Provides for the widest array of commercial uses, including car sales, lodge halls, theatres, assembly halls, and other outdoor sales General Commercial (B-4): Designed to accommodate businesses which require large land areas and generate automobile and truck traffic rather than pedestrians. Generally the Wal-Mart/Glens shopping area Office (O-1): Located along major highway routes within the city and are intermingled with more intense commercial uses 38
53 Water Front Marine (W-M): Designed to accommodate recreational boating and activities and services related to waterways Light Industrial (L-1): Includes the City of Cheboygan s industrial park, which is currently about 50% developed Planned Project (P-P): No data available 39

54 Figure 6-1 City of Cheboygan Zoning Map Source: (City of Cheboygan) 40

55 City of Cheboygan Multi-Use Trail System The multi-use trail system master plan identifies the proposed locations for trail heads and major park pathways, as well as pathways for specific parks including Cattail Park, Joseph Doyle Recreational Pathway, and l for the proposed Consumers Energy Department of Natural Resources pathway. The map (Figure 6-2) also highlights existing trails that are provided by the State of Michigan. Figure 6-2 City of Cheboygan Multi - Use Trail System Plan Source: (City of Cheboygan) 41

56 City of Cheboygan Land Use Plan Figure 6-3 City of Cheboygan Current Land Use Plan Source: (City of Cheboygan) 42
57 Land Use Permit Activity In 2006 there began a steep decline in both the economic health of our nation and the amount of new construction. The number of permits in the County for most types of building activity was declining gradually in 2002 (Figure 6-4) and has only begun to increase from the previous year s numbers since Those increases have been very gradual. Figure 6-4 Graph showing Zoning Permits for Cheboygan County from 2002 to 2010 Source: (Cheboygan County Community Development Department, 2010) 43
58 Figure 6-5 Graph showing Zoning Permits by Type for Cheboygan County from Source: (Cheboygan County Community Development Department, 2010) The City of Cheboygan s projected land use map evaluates specific categories of Cheboygan s land use: Single Family Residential Areas: New single-family residential growth will continue to take place, and many street right-of-ways within these areas are currently undeveloped. These areas are meant to be the most restrictive of residential districts. Commercial Districts: These provide the widest array of commercial uses, including office buildings, car sales, lodge halls, theatres, assembly halls, and other outdoor sales. Main Street contains a major portion of Cheboygan s general business land use inventory. Waterfront Districts: Property with Cheboygan River frontage and Waterfront Marine Districts as well as the Business & Recreational Use. Institutional Uses: Schools, churches, hospitals, and municipal facilities. Industrial Uses: Includes the City of Cheboygan Industrial Park. 44
59 Recreational Uses: Areas indicated as recreational uses are publicly owned and include city parks, boat launches, the Cheboygan County Fairgrounds and school athletic facilities. The City of Cheboygan s projected land use map omitted the following categories from the City of Cheboygan s current land use plan: Multi-Family Residential Districts: These districts are designed to provide sites for multi-family dwelling structures, which ideally serve as transition zones between Business & Industrial districts and lower density Single-Family districts. Mixed-Uses: The city of Cheboygan provides for Tourist Service Districts, Local Business Districts and Office Districts. Tourist Service Districts are designed for activities serving the needs of tourists, including retail, amusement parks, and public uses. Family & Multi-Family Districts allow uses regulated in One- Family Zoning Districts, making them multi-use. Environmental Area: Indicate wetland areas along the Lake Huron Shoreline. Very limited development allowed. 45
")
60 Image 6-1 City of Cheboygan Projected Land Use Map Source: (City of Cheboygan) 46
61 Analysis: The zoning and land use plans offer a look at Cheboygan s current land uses. A strong future land use plan will help the city make short and long term priorities to redevelop the port and waterfront. Additionally, information about the Multi-Use Trail System Plan may be useful in developing future trail plans for the city of Cheboygan. 47
62 CHAPTER 7 TRANSPORTATION An inventory of the City of Cheboygan s transportation system is particularly important for development of the port because it will allow developers as well as existing business owners to evaluate viable routes for shipping and delivery of their products, in addition to the receipt of raw materials or other products needed for their business operations. This inventory will help to determine whether the existing transportation network is adequate or if expansion could be beneficial in certain areas to encourage development and investment in the port. 48
 49")
63 Figure 7-1 Port Area Transportation Plan Source: (City of Cheboygan) 49

64 Figure 7-2 City of Cheboygan Traffic System Master Plan Source: (City of Cheboygan) 50
65 Figure 7-3 Cheboygan County Major Roads Source: (NEMCOG) 51
66 Roads US Highway 23 US-23, or US 23 Heritage Route, follows Lake Huron through Cheboygan County and past Cheboygan State Park. On the eastern edge of the city, the highway intersects county road F-05 before following State Street through Cheboygan s commercial district. State Street then crosses the Cheboygan River, where US-23 meets M-27 s northern endpoint (Figure 7-2). From there, State Street continues westerly as C-66, and US-23 turns north on Main St. for one block before resuming west on Mackinaw Ave. The highway then continues to follow Lake Huron toward Mackinaw City, where it terminates at I-75 s exit 338. US Highway 23 has several major junctions, most importantly with I-75 at its northern end (Image 7-3), and I-94, I-69, I-96 as well as two other intersections with I-75 in southern Michigan, over 250 miles away. US-23 provides a key connection for the port of Cheboygan s potential future industrial and commercial development and is a valuable transportation asset (US-223, 2012). Michigan Highway 27 M-27 is a north-south state trunk line highway; the southern terminus of M-27 is at I-75 (Exit 313), north of Indian River and its northern terminus is at US 23 in downtown Cheboygan (Figure 7-3). M-27 is sometimes referred to as Old 27, as it follows the path of what used to be US-27 before it was supplanted by I-75. The entire highway is in Cheboygan County (M-27 N, 2012). M-27 follows old US-27 through Topinabee and Cheboygan. It runs along the western shore of Mullett Lake and is the main street of Topinabee. M-27 meets M-33 (Figure 7-4) near the confluence of the Cheboygan and Black Rivers. North of this junction, M-27 runs parallel to the Cheboygan River on the west riverbank into downtown Cheboygan (Federal Highway Administration 2011). M-27 is designated Main Street in Cheboygan and Straits Highway outside of the city. State Street (US-23) and Main Street (M-27) are the two major thoroughfares in the Cheboygan street grid (Figure 7-1). Most of Cheboygan s main businesses are located along Main Street. Although the highway is designated as a US route and is maintained by the State of Michigan, it has not been listed on the National Highway System, a designation given on the basis of importance to the country s defense, economy and mobility (M-27 N, 2012, Federal Highway Administration 2011). 52
67 Figure 7-4 Map showing Connection between I-75 and City of Cheboygan through M-27 Source: (Cheboygan County) Michigan Highway 33 M-33 (Figure 7-5) parallels the Cheboygan Presque Isle county line as it runs north along the Black River toward Onaway. M-33 then turns west with M-68 toward Cheboygan County. The highway passes through Power and Afton before turning north and running along the east shore of Mullet Lake past 53
 Cheboygan County's road network is critical in providing the flow of goods and services")
68 Aloha and M-212. North of Aloha, M-33 crosses the Cheboygan River and meets M-27, where the route ends (Alger Rd, 2012). Figure 7-5 Map showing Connection between I-75 and City of Cheboygan through M-33 Source 2: (Cheboygan County) Cheboygan County's road network is critical in providing the flow of goods and services and for enabling people to move efficiently to and from employment, shopping and recreation sites (Figure 7-6). The major roads within the county are Interstate 75, running north and south; M-68, running east and west; US-23, running east and west along the Lake Huron shoreline; M- 27, from Otsego County running 54

69 through Wolverine, continuing north through Indian River to the City of Cheboygan; and M-33 running north and south, connecting M-68 with M-27. Cheboygan County Roads 66 and 64 provide east and west connections for the City of Cheboygan and Douglas and Burt Lakes and continue westerly into Emmet County. County Road F-05 connects the City of Cheboygan in the north, to Black Lake and southern portions of the county. Several other countymaintained, paved roads link outlying sections of the county with the major road network. In addition to these paved roads, an extensive system of dirt and gravel roads covers all the portions of the county, providing access to the lakes and forests that serve as sites for residential and recreational activities, as well as forestry activities. Figure 7-6 Cheboygan County Roads by Functional Classification and Miles Source: (Cheboygan County Data Book: Land Use & Transportation) 55
70 Figure 7-7 Cheboygan County Class A Roads Source: (Cheboygan County Data Book: Land Use & Transportation) 56
71 Table 7-1 List of Truck Bypass Roads and Downtown Roads Downtown Road Bypassing Road & Route Western Ave. NB & Lincoln US-23 using C-64 to I-75 Lincoln Ave. Western US-23 N using C-64 to I-75 or M-27 S Lincoln Ave. Western US-23 N/S using M-27 N/S State St. Western US-23 N/S and M-27 S using C-66 to I-75 Western Ave. State St. US-23 N using C-66 to I-75 Western Ave. State St. M-27 S using C-66 to I-75 US-23/Mackinaw Ave. N/S at Western M-27 S using C-66 to I-75 M-27 Lincoln US-23 N/S using C-64 to I-75 M-27 Lincoln US-23 S using C-64 to I-75 M-27 Townline US-23 N using C-64 or C-66 to I-75 Lincoln Ave. Lafayette Use downtown US-23 N US-23 Eastern Ave M-27 S using C-66 to I-75 Source: (Cheboygan Land Use Plan) Table 7-2 The Traffic Counts Name Average Daily Traffic (ADT) M-27 between US-23 & Lincoln 9600 US-23 between M-27 & Eastern 4000 Source: (MDOT) Table 7-3 The Distance of Major Cities by the Automobile Name Distance (Miles) Time (Hrs) Detroit 279 4:33 Lansing 220 3:37 Mackinaw City 15 0:18 Traverse City 109 2:07 Grand Rapids 220 3:53 Flint 214 3:33 Iron Mountain 213 4:17 Escanaba 162 3:17 Saginaw 181 2:58 Source: (MDOT) Railways Currently there is no active rail within the city of Cheboygan. Previous rail lines in the area, including the line that connected the city s industrial park to the statewide rail network, have been converted to 57
72 recreational rail trails. However, the following information about rail transit in Michigan may prove helpful to the city of Cheboygan for any future planning or investment opportunities. Freight rail service Freight rail service is provided from Alpena to Bay City by Lake State Railway Company but there is no rail service for the City of Cheboygan (Figure 7-9). The rail line is classified as Class III Local/Short-Line Rail. Railroads in the United States are grouped into classifications based on operating revenue. The classifications are defined by the Surface Transportation Board as follows (Michigan State Rail Plan, 2010): A Class I railroad is a major rail company that has annual revenues in excess of $401.4 million per year. A Class II railroad is a line-haul rail company with revenues of less than $401.4 million but in excess of $40 million. Class III railroads are defined as having annual operating revenues of less than $40 million. Class III railroads include short-line railroads and switching and terminal railroads. Class I Railroads The Class I railroads are national companies that primarily offer services for national and intermodal shippers and markets. Four of the seven Class I railroads in the United States own track in Michigan. The Class I railroads that operate in Michigan are- Canadian National (CN), Norfolk Southern (NS), CSX Transportation (CSX), and Canadian Pacific/Soo Line (CP/SOO). These four Class I railroads own 2,137 miles of track in Michigan (Michigan State Rail Plan, 2010). Class II Regional Railroads Michigan s Class II railroads are mid-sized freight-hauling railroads. The State of Michigan has two Class II railroads: Great Lakes Central Railroad and the Indiana and Ohio Railway. The Great Lakes Central Railroad (GLC) is headquartered in Owosso, Michigan and operates on tracks extending through the central and northern portions of Lower Michigan. The GLC operates on 350 miles of state-owned tracks under a lease agreement, and another 50 miles of track which it owns. Major commodities hauled by GLC include sand, grain, plastics, coke (by product of coal), fertilizers, sand, lumber and other chemicals. The other Class II railroad is the Indiana and Ohio Railway (IORY) headquartered in Cincinnati, Ohio, and owned and operated by Rail America. The IORY owns and operates 570 miles of track, of which 44 miles are in southeastern Michigan. The main commodities hauled by IORY include automobiles, pig iron and other metal products, chemicals, plastics, lumber, paper, and grain products (Michigan State Rail Plan, 2010). 58
73 Class III Local / Short-Line Railroads The Class III short-line railroads in the United States are primarily former branch lines of larger railroads that now serve a limited area on their own. These railroads operate on over 1,500 miles of track in Michigan and are engaged primarily in providing connections between local industries and the national rail network operated by the Class I railroads. Michigan has 15 Class III short-line railroads (including that which supplies Alpena), each operating over distances ranging from two miles to 365 miles. The percentage of the total rail mileage operated by short-line railroads has been increasing steadily in recent years as the Class I railroads have sold or leased the least productive segments of their rail networks. Short-line railroads generally can operate rail lines at a significantly lower cost than the large railroad companies, but often do not have the capital resources to maintain the physical plant to higher FRA track classifications (Michigan State Rail Plan, 2010). Class III Switching and Terminal Railroads A switching and terminal railroad is a Class III freight railroad company whose primary purpose is to perform local switching services or to own and operate a terminal facility. Michigan has eight switching and terminal railroads, ranging in length from two miles to 98 miles. These switching and terminal railroads operate just over 220 miles of track and play a key role in getting materials to and from their final destinations (Michigan State Rail Plan, 2010). The Michigan State Rail Plan of 2010 established several goals mentioned below, to promote the efficient movement of freight. Encourage frequent, reliable and efficient freight rail service to un-served or under-served communities, businesses and shippers. Provide public investments for railroad projects where public benefits exceed public costs. Pursue public-private partnerships to improve service and reduce freight rail congestion. Identify corridors where 286,000-pound rail car load capacity is needed based on market demand. Identify corridors where 315,000-pound rail car load capacity is needed based on market demand. 59

74 Figure 7-8 Map showing Railroads Operating in Michigan Source: (MDOT) 60
, without any handling of the freight itself when changing modes.")
75 Figure 7-9 Map showing Key Regional Links for Michigan Commodities Moving by Railroad Source: (MDOT) Intermodal Connectivity Intermodal freight transport involves the transportation of freight in an intermodal container or vehicle, using multiple modes of transportation (rail, ship, and truck), without any handling of the freight itself when changing modes. The method reduces cargo handling, and so improves security, reduces damages and losses, and allows freight to be transported faster. Reduced costs over road trucking are the key benefits for intercontinental use. This may be offset by reduced timings for road transport over shorter distances. The intermodal concept draws from each mode of transportation, providing flexibility and nearly unlimited access to industrial and commercial locations. Rail intermodal shipments are most often used for consumer goods and subassembly components. In the early 2000s, railroad intermodal volume grew at approximately 32 percent (Michigan State Rail Plan, 2011). At that time, intermodal was the number one source of railroad freight revenue. Michigan does not have any intermodal rail movements that are 61
76 completely internal within the state, but there are significant interstate and international intermodal movements. Michigan s intermodal terminals handle traffic that primarily originates or terminates in Ontario, Quebec, Nova Scotia, Maryland, Virginia, Mexico, California and British Columbia. The world s largest bilateral trade relationship exists between the United States and Canada, with Michigan positioned as a leader in international trade. Michigan is at the head of continuing strong trade growth between the United States and Canada. The Michigan State Rail Plan has established several objectives to encourage and promote intermodal connectivity throughout the state of Michigan. The objectives are as follows: Support the development of intermodal freight facilities which will provide seamless connectivity between rail and truck and water modes. Focus on facilities which have the greatest potential to increase the efficiency and accessibility of the rail mode and provide lower transportation costs for shippers. Support the connectivity of Michigan passenger rail service to other corridors regionally, nationally, and internationally to maximize network benefits in terms of increased ridership, revenues and passenger mobility. Support intermodal connectivity between intercity passenger rail and other passenger modes including air, local transit, auto, intercity bus, and nonmotorized transportation. Focus on intermodal investments which have the most potential to increase the efficiency of the rail mode and provide greater accessibility to travelers including those with special needs and limited access to automobile transportation. Support enhanced freight and passenger rail service as a part of an overall state energy conservation policy and to protect Michigan travelers and shippers from the adverse mobility and economic impacts of expected increases in future transportation energy costs Promote state policies and programs to provide increased freight rail service to Michigan communities and businesses as a means of increasing their attractiveness for the expansion of existing businesses and the recruitment of new businesses. Promote freight rail service, infrastructure improvements, and intermodal connectivity to increase the efficiency of freight rail service and to lower transportation costs for Michigan businesses. Existing Michigan Rail Intermodal Conditions Michigan has 36 active ports which accommodate bulk cargoes moving in the Great Lakes and the St. Lawrence Seaway. Nineteen of these active ports support outbound commodity movements. As of 2008, the ports that produce the most outbound tonnage are Stoneport, Marquette, Calcite, Port Inland, 62
 or water-to-rail intermodal cargo transfers exist at Michigan")
77 Escanaba, Alpena, Port Dolomite, Charlevoix, Port Drummond and Detroit (Michigan State Rail Plan, 2010). With the exception of the iron ore ports at Escanaba and Marquette in the Upper Peninsula, no significant rail-to-water (Figure 7-10) or water-to-rail intermodal cargo transfers exist at Michigan ports. The principal reason is that Michigan s marine cargo facilities are designed for local or regional distribution and do not lend themselves to rail transport. Michigan s businesses and industries generate a large volume of overseas trade, but the vast majority of these shipments are transported by truck or rail to Pacific, Atlantic, or Gulf coast ports for ocean shipping. Figure 7-10 Example of a Port Intermodal Facility with Rail-to-Water Source: (The Center for the Commercial Deployment of Transportation Technologies) Intermodal connectivity has become a crucial linkage to port freight shipping across the country. As defined by MDOT s Economic Regions Corridor Summary, there are six major rail intermodal terminals located in the Southeast Michigan region. The purpose of the terminals is to connect larger carriers to 63
78 other modes of transportation or other rail carriers. The major railroad intermodal terminals in Michigan are identified below (Table 7-4). Table 7-4 Major Intermodal Terminals in Michigan Highest Volume Railroad Intermodal Terminals in Michigan Terminal Name Terminal Address Terminal Owner CN /Moterm 600 Fern Street, Ferndale Canadian National CP Expressway Westwood, Detroit, MI Canadian Pacific CSX Livernois Yard 2725 Livernois Avenue, Detroit, MI CSX Corporation NS Triple Crown 2500 Wabash Street, Melvindale, MI Norfolk Southern NS Delray 8501 West Fort Street, Detroit, MI Norfolk Southern NS Livernois Yard 2725 Livernois Avenue, Detroit, MI Norfolk Southern Source: (Michigan State Rail Plan) Seven major equipment depots are located in Michigan. These depots provide inland terminal and cargo transportation services to shipping lines, railroads, and shippers/receivers of containerized cargoes. The depots are strategically located to cover all major port locations and major rail sites. The primary services that are provided to Michigan include intermodal container drayage (the act of transporting something a short distance by truck or other vehicle), terminal and rail operations, warehousing logistics, container/trailer maintenance and repair. The depot names and respective locations are listed in Table 7-5. Table 7-5 Major Depots in Michigan Major Equipment Depots in Michigan Depot Name Depot Bridge Terminal Transport C&D Classic Transportation ContainerPort Group Inc Mason Dixon Intermodal Masserlink Brothers Inc. Reliable Transportation Specialists Source: (Michigan State Rail Plan) Address Wick Road, Romulus, MI 700 Leigh Street, Detroit, MI 4729 Division, Wayland, MI 312 South Westend St, Detroit, MI 4440 Wyoming Ave, Dearborn, MI 901 Freeman Ave SW, Grand Rapids, MI 7100 Dix Avenue, Detroit, MI Intermodal and highway restrictions and limitations create unequal competition between Michigan, Ohio, Indiana and Illinois ports and intermodal facilities. The Intermodal Surface Transportation Efficiency Act of 1991 (ISTEA) enforced a freeze limiting the use of longer, heavier double and triple trailer combinations to those states in which they were already operating in (fhwa.dot.gov) ISTEA is still enforced today. The size and weight limits included in the 1991 grandfather provisions are 64
79 summarized in the table below, for the corridor states. Table 7-6 below shows the truck size and weight rules on the corridor's turnpikes and toll roads. This shows the disadvantage Michigan has in coaxing freight liners to dock at state ports, due to increased cost of transportation with more trucks needed to transport goods from port to destination. Table 7-6 Operation of Vehicles Subject to the ISTEA Freeze Max Size and Weight Limits State Truck Tractor and Two Trailing Units Truck Tractor and Three Trailing Units Other Length in Feet ('), Weight in 1,000 pounds (K) Indiana 106', 127.4K 104.5', 127.4K 58' Michigan 58', 164K No No New York 102', 143K No No Ohio 102', 127.4K 95', 115K No Source: (USDOT) Lastly, public roads leading to major intermodal terminals are designated NHS connectors by the USDOT, in cooperation with State departments of transportation and metropolitan planning organizations. Several criteria are considered, including the level of activity of an intermodal terminal and its importance to a State's economy. Public Transportation The Straits Regional Ride (SRR) is the current form of public and regional bus transit serving the City of Cheboygan as well as Cheboygan County. The SRR was established in 2000 under the Regional Transportation Program. In 2003, SRR completed a regional program and became eligible for state and federal funding. SRR currently supports the counties of Cheboygan, Emmet, and Presque Isle, and also assists the cities of Alanson, Cheboygan, Indian River, Mackinaw City, Onaway, Petoskey, and Rogers City with local service as well. The SRR is available Monday-Friday from 6am thru 5pm, with an operating fleet of 12 vehicles (MDOT 2010). Private bus transportation to destinations outside of Cheboygan County is provided by Indian Trails, Inc., with a bus stop in Mackinaw City at the Village Hall, 102 South Huron. Indian Trails provides two bus routes serving Mackinaw City. The Chicago-Flint-St. Ignace line connects Mackinaw City and points along the eastern side of Michigan s Lower Peninsula and connecting service to Greyhound buses in St. Ignace and Flint. The Chicago-Kalamazoo-St. Ignace line connects Mackinaw City and points along the western side of Michigan s Lower Peninsula (Cheboygan County Data Book: Land Use & Transportation). Airport The Cheboygan County Airport is located west of the City of Cheboygan on Levering Road (County Road 64). This public airport provides the needs of private and charter aircraft throughout the region. The 65

80 community of Indian River also maintains an airport for private and chartered aircraft. In 2006 the Cheboygan Airport acquired 10 acres at the southeast corner of Levering and Airport Roads to pave the approach clearance for one of the runways. In 2007 the airport constructed and paved a parallel taxiway A to runway number 1028 for safety improvements. In 2010 runway 1735 was paved and lighted and a new parallel taxiway C was constructed and paved. It is expected that the airport will soon build an equipment storage building and make improvements to the terminal. The Michigan Aeronautics Commission requires the Cheboygan County Airport as well as some privately owned airports to file Airport Approach Protection Plans and Airport Layout Plans. These plans ensure safe use of the airport and protect against encroachment of the safe takeoff and landing area by structures on neighboring parcels. Two other airports have filed such plans with the Michigan Aeronautics Commission as well as Cheboygan County Planning Department, which is required by state law. In Mullett Township there is a privately owned, publicly accessible airport called Peabeaaye Airport. Another such airport is called Hoffman s Black Mt. Aerodrome in Grant Township. Figure 7-11 Major Airports near the City of Cheboygan Source: (Practicum Team 2012) 66
81 While there are no commercial flights available anywhere within Cheboygan County, Pellston Regional Airport lies within neighboring Emmet County and is about 20 miles west of the Cheboygan city limits. Pellston provides daily inbound and outbound flights to Detroit-Wayne International Airport, as well as Friday and Sunday flights to Chicago s Midway Airport. Pellston Regional constructed a new terminal in 2003 allowing for daily commercial flights and boasts the atmosphere and aesthetics of a rustic lodge, catering to the Up North feel of the region. Aside from Cheboygan County and Pellston, other facilities include. Alpena County Regional Airport in Alpena, Chippewa County International Airport in Sault Ste. Marie, and Cherry Capital Airport in Traverse City. Table 7-7 Freight and Passenger Activity at Pellston Regional Airport PELLSTON Year Freight (Ibs.) Passenger Inbound. outbound Source: (MDOT, Alpena Group) 67
82 Table 7-8 Comparing Pellston s usage to other Airports Statewide City Freight (Inbound) Freight (outbound) Passenger Ibs. Share Ibs. Share lbs. Share Detroit % % % Grand Rapids % % % Lansing % % % Flint % % % Traverse City % % % Iron Mountain % % % Alpena % % % Pellston % % % Escanba % % % Statewide % % % Source: (MDOT, Alpena Group) Port of Cheboygan The Port of Cheboygan is very important to the community and a vital resource of the northeast Michigan region. Starting from Lake Huron and heading south down the river there are several port and marine services. As mariners exit Lake Huron and enter the Cheboygan River, they will pass, on the west side they will pass a 775 foot long rubble mound breakwater, before coming across the Cheboygan County Marina. (US Army Corps of Engineers, 2012) Public Boat Launch (Inventory Board 1, #4) The next landmark on the west side is the public boat launch. Two ramps are available for boaters to launch their boats at no cost. Turning Basin At 21 feet deep, 400 feet wide and 770 feet long at its longest, the turning basin allows large ships and barges to turn around after docking at US Oil. (US Army Corps of Engineers, 2012) Across the river from the turning basin, on the west side of the river, is the Durocher Marine Division of Kokosing Construction Company. 68

83 Figure 7-12 Port of Cheboygan and River Depths Source: (US Army Corps of Engineers, 2012) 69

84 Figure 7-13 Detailed map of the Turning Basin on Cheboygan River Source: (US Army Corps of Engineers, 2012) Non-Motorized Transit Cheboygan has an extensive network of old rail lines that are now utilized by snow mobiles, bicyclists, and walkers. There are walking trails around the wetlands near the mouth of the river as well as state wide paths such as the 70 mile long Alpena to Mackinac Trail, 12.6 mile long Rogers City Spur Trail, and the 10 mile long Huron-Sunrise Trail (Michigan, 2012). Bike Share A bike share program would increase the amount of people biking in the City. Bike-sharing started in Amsterdam in the 1960s. Station along the trails and in residential or commercial areas will offer bicycles that can be rented for the day and returned to any station. Bicycles can be accessed through a variety of means at the docking stations. People can pay for the bicycles using a smart card, their mobile phone, or a bank/credit card (Bike). The stations themselves can be a fixed station that runs on electricity or a mobile one which is secured into place similarly to other street furniture and is often 70
85 powered by solar panels (Bike). Some successful bike-share systems in America are B-Cycle and Collegiate Bikes (Bike). E bikes are a new technology that is a bicycle equipped with an electric motor. This allows for traditional biking as well as that feature an electric motor for long distance travel. Cheboygan has the necessary infrastructure in place for such innovations in bicycling. The 61 mile long North Central State Trail and the 70 mile North Eastern State Trail are two of the rail trails, converted railways for nonmotorized transit, in the area (Bicycle, 2012). However, there is a lack of bicycle related business for services such as bike repairs and bike purchases. Some noteworthy international bike share programs: SmartNike in Norway Bicincitta in Italy Call a Bike in Germany Velossimo Libre Service in Paris, France Cyclocity in Neuilly-sur-Seine, France Nextbike in Leipzig, Germany Bixi in Canada Forever Public Bicycle System in Shanghai, China Smoove Key and Smoove Box in Montpellier, France A bike-share program in Cheboygan along with more bicycling related stores in town will benefit the community and increase the non-motorized transit in the area in the summer, complementing the snow mobile and cross country skiing in the country. This will benefit the tourism industry in Cheboygan and the region. The bike share program can be utilized in the Straits of Mackinac region to complement the City of Cheboygan. Also, bikes can be transported by ferry to Bois Blanc Island where stations will be located as well. Cross country skiing is also popular along these trails in the winter but there are no supporting businesses for skiing either. A combination of the two services would be economically viable and help to increase the amount of non-motorized transportation in the area. This will benefit the environment as well as make for a healthier community (See Appendix B for further details). Analysis The City of Cheboygan s transportation options include several strengths as well as weaknesses. The port and city have major highway access available, including US-23 (which is a major business route in the heart of downtown Cheboygan) and I-75, which is less than 20 miles away. Several areas are 71
86 adequate for current use but will require expansion for most future development for example the depth of the channel and the turning basin are currently sufficient, but will require expansion for most substantial development in industry or tourism. Additionally, the lack of rail transportation may be a hindrance for future development and expansion of industry in the area, as well as the lack of immediate availability of commercial flights, as there are none offered in the City and County. 72
87 CHAPTER 9 ECONOMIC ONSITE ANALYSIS Riverfront Inventory Maps The inventory is an important step in any project because it allows the client, consultants and community an opportunity to observe the existing conditions which, in turn, leads to a greater understanding of the community and the potential of the project. The two inventory photo boards were created by the MSU practicum team to serve as visual aids in the process and to facilitate productive discussions between the client and the community at large. The Locator Map (Figure 8-1) demarks the approximate boundaries of the two maps and how they relate to the study area and the City. They are set up in a fashion that walks the user through the port study area by section and begins with the northern section of the river on the western side and works up the river to the State Street Bridge and then crosses the Cheboygan River to the eastern portion and continues north again. The second board is set up in the same fashion working south from the State Street Bridge on the western portion down to the dam and locks and then crossing the river again to the eastern portion and working downriver again to the north to the bridge. The numbers in the yellow circles found on the Riverfront Inventory Maps, are linked with the picture of the intended site and are placed on the map where the pictures may have been taken from. We did this to provide as realistic feel and view of the site as possible and to easily allow the user to get their bearings and gain a better understanding of the site and how it relates to its surroundings. 73

88 Figure 9-1 Riverfront Inventory Locator Map Source: (Practicum Team 2012) 74


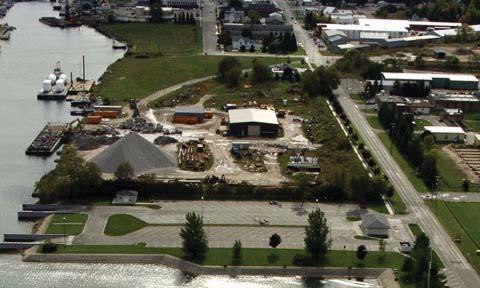
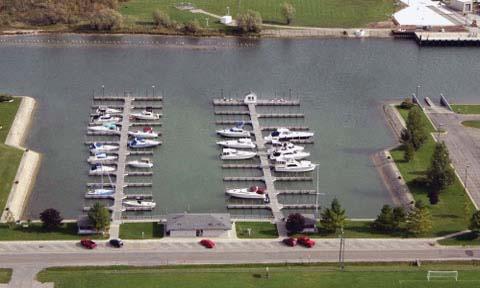

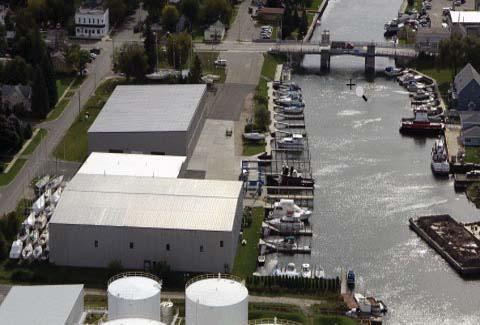
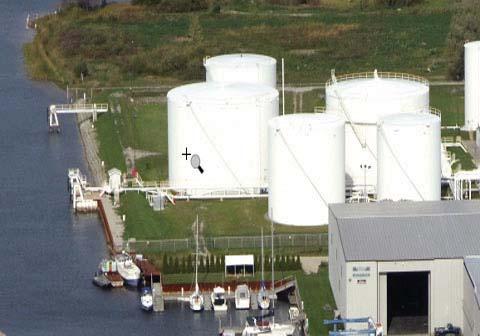
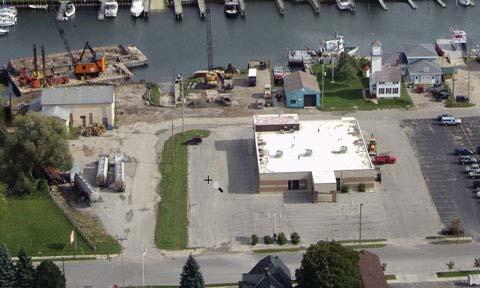
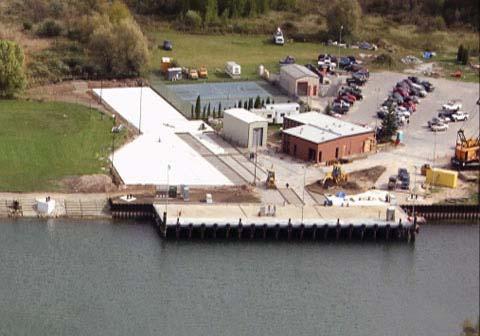
89 1 photo: NEMCOG View looking northeast over the marsh & towards the bridge from the Gorden Turner Park. 2 photo: NEMCOG View looking northeast over the marsh & towards the bridge from the Gorden Turner Park. i Gordon Turner Park 3 1 i 2 i County Marina State Property Cheboygan River Lake Huron 3 View of the County Marina and its many docks looking towards the east. There are ample docks and 4 boat ramps directly south. Municipal Wastewater Treatment i Durocher Marine Const. 4 9 i U.S. Coast Guard 9 View of the US Coast Guard facility located just north of US Oil. Notice the the easy access for docking of both large or small Coast Guard Cutters. 4 View looking south twards the public boat launch with Durocher Marine Const. in the background. Notice the large amounts of construction materials & equipment onsite. 5 View of Ryba Marine Const. from above looking east towards the marina. Notice the close proximity of the working dock to the residential use to the south. Legend Exst. Roads Prop. Roads Prop. Wastewater Extension Picture Location 5 23 i 27 Main St. 5 i 23 Huron St. Ryba Marine Const. USGS Water St. Condos. 6 i State St. Port of Cheboygan 7 i i U.S. Oil Walstrom Marine turning basin vacant parcel 8 Coast Guard Dr. Not to Scale Spring View of the US Coast Guard facility located just north of US Oil. Notice the the easy access for docking of both large or small Coast Guard Cutters. 8 View looking south at the facilities of Walstrom Marine. Notice the constraint of the channel width at this point due to the uses on both sides of the river. photo: NEMCOG View of the US Oil bulk storage facility located just north of Walstrom Marine. Notice the the easy access for docking and small amount of useable land currently available. Riverfront Inventory 1 - North Section 7


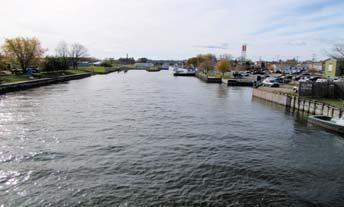
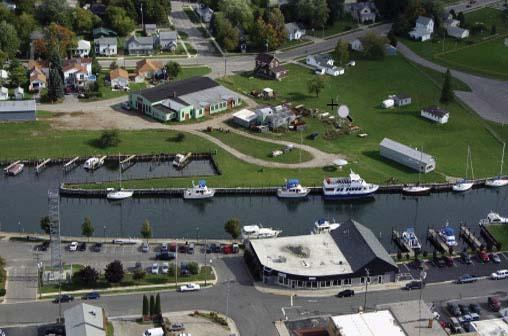

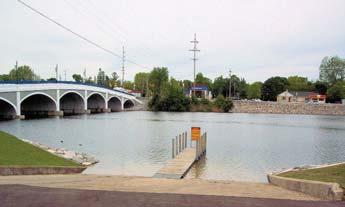
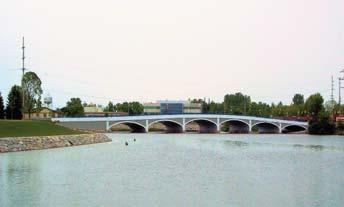
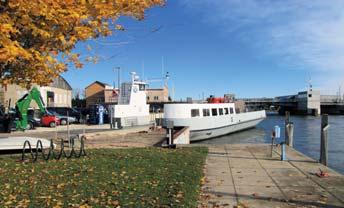
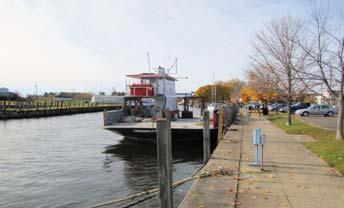


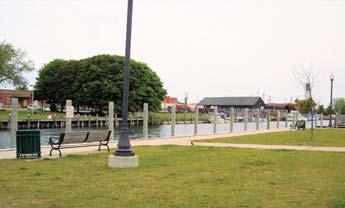


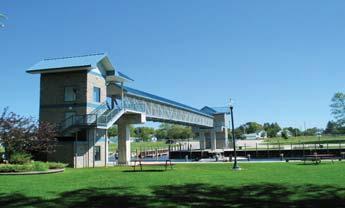
90 Ma in S t. photo: NEMCOG photo: NEMCOG View looking east toward the Cheboygan Harbor Marina, which is located just north of East Park & presents pedestrian circulation opportunities photo: NEMCOG This truck could be anywhere in town, but presents a good opportunity for activities along the waterfront and in the parks available. i Cheboygan Village Marina Major City Park View looking west from above the Cheboygan Harbor Marina towards the downtown buildings & some additional dock space nr ive r View looking north towards the Plaunt Ferry dock and the State St. bridge. There is an ample width of green available for pedestrian circulation as well. 5 Water St. Unlimited Cheboygan Harbor Marina WA. Park i 8 DNR i 6 4 i Sta te 2 St. i View looking northeast from the alley which leads to the parking lot of the Plaunt Ferry which sails to Bois Blanc Island multiple times daily in season. i View looking south of the main ferry dock. This presents great opportunity for increased & improved pedestrian circulation. 5 3 i View looking south from the State St. bridge towards the ferry dock and pedestrian bridge. It presents great opportunity for pleasure boaters. photo: NEMCOG i 2 photo: NEMCOG i 1 Plaunt Ferry 1 photo: NEMCOG 27 photo: NEMCOG View looking north toward the boat lock and the Great Lake Tissue Company. The sidewalk width looks ample for circulation of pedestrians. i 5 Not to Scale Spring 2012 Main Exst. Roads photo: NEMCOG View looking northwest from the boat ramp area. Notice the pavement and site amenities present for pedestrian comfort & circulation photo: NEMCOG 12 photo: NEMCOG View looking west from the Lincoln Street Boat Access Site at two public boat ramps south of the dam and boat lock.. 13 photo: NEMCOG Closeup view looking north towards the lock while a pleasure craft is gaining entry to the lower portions of the Cheboygan River. Lock 9 i Legend Picture Location photo: NEMCOG 15 View of the dam located just south of the tissue company. The spillway is located directly below this and there is sidewalk to provide circulation and good views of the river. Great Lakes Tissue Company St. View looking south towards the Lincoln Avenue bridge. The stone seawall looks to be in good condition and fits in the surroundings very well i i 10 Dam 11 i Spillway i 9 photo: NEMCOG View looking west toward the park across the river and the downtown via the boat ramp located north of the pedestrian bridge. eb Similar view of the new pedestrian bridge to the park, but this one emphasizes the mature trees found in Washington (WA.) park. Ch View looking east at the new pedestrian bridge with connections to East Park. The bridge is also a good landmark for pedestrian circulation. 14 oy ga 8 photo: NEMCOG Riverfront Inventory 2 South Section
91 Riverfront Development North Section The north section of the riverfront extends from the mouth of the river in the north to the State Street Bridge to the south. Current zoning of the north corridor is primarily Waterfront Marina (W-M) with a small portion designated to General Business (B 3). A Planned Unit Development (PUD) is also indicated in this area for residential condominium development. This part of the riverfront has a Downtown Development Authority District (Riverfront). The north section is an essential part for the commercial activities due to its direct connection to Lake Huron and, therefore, all of the Great Lakes. The area can be utilized to its full capacity as a deep water port. The US Oil facility and the US Coast Guard facility is located in this area, as well as a couple of marine facilities are located at this end of the riverfront. There are three street rights-of-way in the north section that play an important role in expanding the commercial activities along the corridor. There is United States Geological Survey (USGS) facility where research work is carried out and in this section we also have a licensed ferry service for Bois Blanc Island Township by Plaunt Transportation Inc. Other commercially feasible activities along this corridor are hotel and motel facilities, multifamily residential units and municipal and private beaches for recreational purposes in front of the marina zoning (Riverfront). South Section The south section is currently zoned as Central Business (B 2), General Business (B 3) and Light Industrial zone (L 1).This area includes the Great Lakes Tissue Company at the southern end of the corridor. In this section most of the land is under public use under City of Cheboygan ownership. It has a marina facility and a parking lot on Water Street. Also, a new footbridge is constructed in the south section in order to provide connection between the west side and the east side of the river. The footbridge opens at the City of Cheboygan Major City Park which is currently developing including softball and baseball fields, a Recreation Center, Rotary Skate Park and Ralph J. Ice Rink. Along with this, the Park provides a boat launch area, walkway along the river and fishing piers. The Michigan Department of Natural Resources is located adjacent to the dam and boat locks facility that controls the river levels and the levels of Mullet Lake and Burt Lake in the south (Riverfront). Further south of this section is a narrow space extending from the River Bank to M 27 (Main Street). The section is primarily commercial in use with a few motels and restaurants. Also, Cheboygan Village Marina is located in this corridor. The remainder of the corridor contains Single Family Residential units (Riverfront). 77
92 Marine Facilities Private Marine Facilities Durocher Marine Division of Kokosing Construction Company Inc. (Inventory 1, #4) The Marine Contractor of the Midwest as it is known, provides marine construction services above and below water to the Great Lakes and beyond. Originally known as Durocher Dock and Dredge, the company specializes in building commercial docks and piers, breakwaters and sea defense walls, in-take and outfall pipelines and submarine power cables. The company will work at depths of up to 250 feet (Kokosing Construction Company, Inc. 2009). Walstrom Marine (Inventory 1, #8) Walstrom Marine is a large, full service marina that offers many amenities to permanent residents and transients alike. They offer 40 slips and 88,000 square feet of indoor storage, 78,000 of which is heated, as well as 32,000 square feet outside. The marina has a 70 ton Travelift so haul-outs, launches, and repairs can be made easy. The marina also has a sales office and a service center with parts available for maintenance (Walstrom Marine, 2012). Across from US Oil on the west side is more vacant land. This land stretches from Durocher Marine south to Ryba Marine Construction. The City of Cheboygan is looking to purchase this land in hopes of building new port facilities there. Ryba Marine Construction (Inventory 1, #5) Ryba Marine Construction Co. is a full-service marine construction company that specializes in barges and tugs up to 200 tons. Ryba also offers crane and excavator-mounted spud barges with associated support equipment. They work in all phases of marine construction including break walls, dredging, pipelines, pile driving, and dock construction. Ryba has recently been named the US Army Corps of Engineers Civil Works Contractor of the Year (Ryba Marine). South of this are a few private businesses and an apartment building across from Walstrom s. At this point, the US-23 drawbridge crosses the river. Immediately south of the bridge, on the east side, is Plaunt Transportation Inc., which provides ferry service to Bois Blanc Island in the summer months. Cheboygan Harbor Marina /Lund Brothers Marina (Inventory 2, #16) On the east side of the river, just south of the State Street Bridge, a boater will find the Cheboygan Harbor Marina. This very small marina has virtually no amenities for a boater. The marina has slips for about 30 boats, and not much else. A few of the slips are in a small basin off the main river, while the rest of the slips are right on the river. This marina reportedly went through an ownership change to the Lund Brothers, but that could not be confirmed. On the east side about a quarter mile south of the bridge is Major City Park. The pedestrian bridge which connects the west side of the river with downtown Cheboygan is located here. 78
93 Cheboygan Village Marina Across from Major City Park is the Cheboygan Village Marina. In the summertime Cheboygan Village Marina is a valet service indoor storage marina. Rather than having docks and slips in the Cheboygan River, they offer dry storage for clients boats. When the client wants to use their boat, they call ahead and have the marina launch the boat to get it ready for use. Boats are kept in large storage racks in their indoor, heated, 35,000 square foot building. In the summertime the Village Marina also offers pump out service and boat cleaning after use. The marina also has restrooms, showers, laundry services, and a gazebo and picnic area. In the winter the Village Marina offers heated storage. Cheboygan Village Marina is the only marina in northern Michigan that offers dry stack storage with in/out valet service. This brand new marina was completed in Spring 2012 and hopes to be the premier indoor boat storage facility on the Great Lakes in northern Michigan (Cheboygan Village Marina, 2012). About a half mile south of the park and the Cheboygan Village Marina is a lock and waterfall, allowing only smaller recreational boats access further up river. There is also a large factory located here. While the river remains navigable for another 78 miles in the inland waterway, this is the end of the port of Cheboygan and the services and opportunities that go with it. Public Marine Facilities Cheboygan County Marina (Inventory1, #3) The Cheboygan County Marina is a medium - sized marina providing many services to mariners. Their services include electrical hook - up, pump out, laundry, showers, telephones, fresh water, and grocery delivery. The marina has two docks with a total of 84 slips for permanent residents boats and is located in a small basin outside of the main channel of the marina. This basin is well protected from the elements and offers a great place for safe refuge in a storm. Table 9-1 Number of Slips Issued by Marinas in City of Cheboygan Marinas Cheboygan County Marina Number of Slips Occupied in Season by Permanent Boats Total number of Slips sq. ft. Winter Storage Capacity Walstrom Marine ,000 sq. ft. (150 boats) Cheboygan Harbor Marina/Lund Brothers Unknown 32 0 sq. ft. Cheboygan Village Marina Source: (Authors) N/A N/A 35,000 sq. ft. (summer valet storage as well) 79
94 Other Business Great Lakes Tissue Company (Inventory 2, #10) The Great Lakes Tissue Company is located in the southern end of our area of study. U.S. Oil (Inventory 1, #7) On the east side of the river, south of the turning basin, is U.S. Oil. This fuel storage and wholesale fuel distribution facility is a dominant use in the Port of Cheboygan. (U.S. Oil, 2010) Barges and small ships come in here to load and unload fuel from the tanks. Support Facilities Dock Facility There are no loading and unloading dock facilities currently existing at the Port of Cheboygan. Harbor Maintenance & Dredging Facility According to the annual report and contract dredging report by the US Army Corps of Engineers, the following table was compiled for Cheboygan Harbor. The harbor has not been dredged since Table 9-2 Annual Contract and Dredging Report for Cheboygan Harbor, MI Year Start Date Completion Date Volume (Cubic Yards) Cost ($) Cost/Yard($) Contractor Placement/ Dredged Area 1964 N.A. N.A. 22,784 14, Govt/Hoffman Open Water /10/66 8/19/66 55,601 28, Govt/Hains Open Water /15/67 8/24/67 12,031 19, Govt/Hains Open Water /1/70 8/10/70 43,826 28, Govt/Hains Open Water /14/72 8/18/72 11,240 16, Govt/Hains Open Water /12/76 7/14/76 10,273 19, Govt/Hains Open Water TOTAL 155, ,461 Source: (US Army Corps of Engineers, 2012) N.A.: Not Available US Coast Guard (Inventory 1, #9) On the east side, directly across the river from the public boat launch, is the United States Coast Guard and the home port of the Coast Guard Cutter Mackinaw. This base is the main station in the northern Lower Peninsula. South of the Coast Guard Station is the turning basin. Imports & Exports Annual Shipping Volume & Materials Handled According to the Great Lakes and St. Lawrence Seaway Ports Report, the Port of Cheboygan only receives liquid bulk, sand and gravel in terms of the materials handled. 80
95 Communication Facility Port Communication & Terminal Operator The port of Cheboygan is not well - equipped with a port communication and terminal operator facility. In order to carry out communication, the port only has radio and telephone services. Analysis In conclusion, Cheboygan has many on - site port assets, but still lacks in port communication, terminal operator, and dockage and harbor maintenance facilities as the requirements for a major port destination. There are four marinas that suffice the current requirement of the city, and two very good marine maintenance facilities i.e. Ryba and Durocher. US Oil and the US Coast Guard also have a strong presence here. The port is in an ideal location at the intersection of three Great Lakes near a popular tourist destination in Mackinaw City. Yet the port still lacks aesthetically and can expand recreational opportunities. These points will be explored further in our Recommendations section. In conclusion Cheboygan has many on site port assets, but still lacks when being considered as a big time port destination. There are several great marinas, and two very good marine maintenance facilities. US Oil and the US Coast Guard also has a strong presence here. The port is in an ideal location at the intersection of three Great Lakes near a popular tourist destination in Mackinaw. Yet the port still lacks a little bit aesthetically and can do more with recreational opportunities. These points will be explored further in our Recommendations section. 81
96 CHAPTER 9 ECONOMIC OFFSITE ANALYSIS Economy The economy of a region is measured by median household income which is the midpoint of income for all the households. The result of the 2008 downturn in economy had greater effect on the Northeast Michigan Counties. Furthermore, northeast Michigan is a noted magnet for retirees, based upon the area s desirable rural character and lifestyle. Therefore, it is not surprising to find that all of northeast Michigan s counties have large percentages of residents 65 years old or older (NEMCOG, pg. 3-4). As more retirees move into the region, the local economy becomes more reliant on service and tourism job sectors, thus creating a wide gap between regional and state median household income. Lower incomes create challenges for balanced economic growth. As expenses for gas, food and housing continue to increase, families will be forced to move to areas that offer higher incomes. This creates an imbalance in the labor force which is necessary for positive economic growth (NEMCOG, pg. 3-6). In addition to increasing retiree population, commuting to nearby communities and even adjacent counties for employment is a common practice in northern Michigan region. The current road quality, road capacity, and gasoline costs are limiting factors for economic development in the region. As people drive farther for employment and commute times increase, a greater economic strain is placed on area residents. The end result is more time and money spent on transportation to and from work for residents and potentially increased cost to counties to keep road conditions at current levels (NEMCOG, pg. 3-21). In 2010, the Michigan State University Land Policy Institute (MSULPI) conducted a state-wide business analysis to support the regional decision making process. The information gathered was used to develop a new economic growth strategy for the eight NEMCOG counties. The MSULPI conducted an analysis of economic performance and then used the information in developing new economic growth strategies. Traditionally, sectors are kept in focus of any economic study but in this specific study clusters were taken into account. Here clusters are defined as geographical concentrations of interconnected companies and institutions in a particular field. The MSULPI conducted the analysis of 23 industrial clusters to help the region in deciding the potential for new development strategies. The clusters selected by MSULPI are based on economic development literature, successful case studies, and Michigan s traditional strengths with special consideration given to clusters projected to experience growth in the U.S. and global markets. The following table classifies the clusters into five categories as shown below. 82
97 Table 9-1 Business Cluster Classification for NEMCOG Region Green Technology Advanced Transportation Traditional Strengths Construction and Deconstruction Quality of Life Arts and Culture Emerging Opportunities Defense and Security Advanced Technology and Information Advanced and Flexible Manufacturing Advanced Waste Management Engineering Technology and Design Film Education and Knowledge Creation Aerospace Energy Mining Tourism Finance and Insurance Information Technology Environmental Technology Supply Chain Logistics - Health Care Robotics and Automation Fisheries and Freshwater Industries - - Life Sciences - Food Innovation Forestry and Wood Products Source: (NEMCOG, pg. 3-11) The Figure 9-1 shows the economic strategy for Cheboygan County. According to the research and analysis conducted by MSU s Land Policy Institute, Cheboygan County s economy has experienced a decline in the Fisheries and Freshwater Industries Cluster(includes activities such as: processing, canneries, transportation, port operations, and boat building) along with troubled clusters of Energy (includes activities in utilities, electricity transmission, traditional energy storage, component manufacturing, renewable energy and advanced waste, waste to energy, industries that manage, dispose, recycle and clean-up waste). Opportunities for growth include: growth clusters of Advanced Transportation Manufacturing (includes: automotive, train, ship manufacturing, high-speed rail, energy storage and transfer), Environmental Technology (activities such as: wastewater management, drinking water treatment, environmental analysis, environmental technology manufacture and service), Food Innovation, and Forestry Wood Products (NEMCOG, pg. 3-15). 83
 Although the study provides useful information for the economic development of the region, it was limited to the county level analysis.")
98 Figure 9-1 Business Cluster Analysis for Cheboygan County Source: (NEMCOG, pg. 3-15) Although the study provides useful information for the economic development of the region, it was limited to the county level analysis. Since the City of Cheboygan is the largest city in the County, some of the results from the study can be used in order to determine the potentially viable business for the City of Cheboygan. Furthermore, the City of Cheboygan has a great potential and ample amount of opportunities to increase the economic activity of the City. The City of Cheboygan serves as a deep water harbor (greater than 20 feet) and an entrance to the Michigan s Inland Waterway. The waterway winds up from the City of Cheboygan to Mullet Lake, then to Burt Lake and on to Crooked Lake near Petoskey and Harbor Springs. The waterway gives opportunity to various water sports and other outdoor activities and also attracts tourists as it is the only waterway in northern Greater Lakes area ( Cheboygan Economic, 2011). 84

99 Apart from the recreational and tourist attraction, the City of Cheboygan has other commercial activities that help its economy. Table 9-2 below indicates some of the major private sector employers of the City. Table 9-2 Private Sector employers in City of Cheboygan S. No. Company Name Location # Industry Emp. 1. Cheboygan memorial City of Cheboygan 458 Health Care service Hospital 2. Wal Mart Stores Inc. City of Cheboygan 200 Department Store 3. Vital Care Inc. City of Cheboygan 200 Health Care service & Medical equip. 4. Tendercare Inc. City of Cheboygan 120 Nursing/personal care 5. Spartan Stores Inc. City of Cheboygan 105 Groceries, Wholesale market 6. Kmart Corporation City of Cheboygan 101 Department Store 7. Great Lakes Tissue Company City of Cheboygan 73 Sanitary Paper Product 8. Cheboygan Cements City of Cheboygan 40 Concrete block & brick Products Co. 9. Michigan Lake Products City of Cheboygan 12 Railing & deck manufacturing Source: Local County Economic Development Contact, 2011 (Northern Lakes Economic Alliance, 2011) Figure 9-2 Graph showing the Distribution of Employees Source: (Practicum Team 2012) 85
100 According to the Figure 9-2 the major employers for the City of Cheboygan is the health care service sector and then are the big box stores like Wal-Mart, K mart and Spartan stores. Therefore, it is essential for the community to maintain these sectors and improve them. Also, they should market their major sectors in order to attract younger generation. Cultural The City of Cheboygan conducts various festivals, fairs and numerous competitions throughout the year. These are great options to be able to enjoy life and the place where one lives. The following is a list of fairs and festivals that are held in the City of Cheboygan. The Riverfest is organized in the month of August that brings together visitors and residents to celebrate an exciting summer weekend. The Riverfest features fish fry nights, Bratwurst and Hamburger night, concerts, raffles and various tournaments. The World Championship Wanigan Race is one of the special events that take place on the Saturday of the Riverfest. This race is a modern version of a traditional race that was done in the late 19th and early 20th century. In which the lumbermen would make the rafts, cook on them and gather around and eat the hot meal. To keep this tradition alive, a race is held starting from the Highway 33 Bridge and goes down the Cheboygan River up to the Lincon Street Bridge. Teams of 5 people, in which one is a cook, compete as well as cook on the boat. A kayak and canoe event is organized in the Riverfest after its popularity in the last year s fest. The Cheboygan Salmon Tournament, which is also conducted during the first week of August, is quite an entertaining event. The event is sponsored by the Cheboygan Sportsfishing Association and is the highlight of the fishing season. Up to a hundred boats gather along the Straits of Mackinac and Lake Huron from Cheboygan s harbor. Another interesting and popular event for the month of August is the Cheboygan County Fair. The Fair was started in 1878 on the Cheboygan Horse Association Grounds. The Fair goes on for a period of eight days, resulting in economic gains for the local economy. It organizes various competitions, tournaments and is famous for its signature concert night. The Top O Michigan Marathon Power Boat Race is has been running continuously for the past 63 years. The race caters to participants not only from Michigan but from all over the country and sometimes even South America. The race takes place on the Inland Waterway of starting at DeVoe Beach in Indian River and goes up the full length of the Cheboygan River. It is one of the biggest power boat races in northern Michigan. During the winter season the Waterways Ice Festival is a very common festival which is celebrated during the month of February. It is by the Mullet Lake Marina and has great winter events like a bon fire, ice fishing, ice diving, sleigh riding and more that are enjoyed by the residents. 86
101 Lastly, another exciting event of the winters is the Great Lakes Antique Snowmobile Series, The Rusty Stud. This event takes place in the month of January immediately after New Years. It is 100 to 250 miles of racing that includes the various towns of Upper Peninsula like Cedarville, Drummond Island, Newberry, Sault St. Marie and Cheboygan. Downtown The downtown Music Fest is a two day event which is held on the last Friday and Saturday for the month of July. During the fest the heart of downtown Cheboygan celebrates all types of music along with dining and shopping at the local eateries and retail shops, respectively. Figure 9-3 City of Cheboygan Downtown Source: ( 2012) 87
102 The Opera House The Opera House in Cheboygan is a great community asset. In 1984, after being closed for 20 years, the restored Opera House was reopened to the public. The 582 seat Opera House is the premier performing arts and entertainment venue in the Straits of Mackinac region. Concerts and shows are held year-round in the acoustically superb Victorian-style theatre. Tourism / Recreation With its strategic location at the tip of the Lower Peninsula of Michigan on Lake Huron, the City of Cheboygan and Cheboygan County have ample tourism and recreational opportunities. Four major inland lakes of Michigan (Mullet, Burt, Black and Douglas) are located in Cheboygan County and provide a wide range of water sports like swimming, boating, sailing, water skiing, and fishing. The County is also a crossroads of Northern Michigan s trail system. The trail is maintained and groomed for scenic views and outdoor activities like walking, hiking, bicycling, and snowmobiling (Cheboygan Economic Development Group [CEDG], 2011). Furthermore, the US 23 Heritage Route connects all the coastal counties starting from Arenac County and ends at the western boundaries of Cheboygan County (Discover Heritage Route 23, 2011, para. 1). Michigan Inland Waterway The Michigan Inland Waterway is yet another attraction that draws people to Cheboygan. The Inland Waterway is a series of rivers and lakes that form a navigable route for small craft connecting Lake Huron and Lake Michigan across the Northern Michigan region. The route is in Emmet and Cheboygan counties and consists of Round Lake, Iduna Creek, Crooked Lake, Crooked River, Burt Lake, Indian River, Mullett Lake, and the Cheboygan River. The route passes through or near the communities of Conway, Oden, Ponshewaing, Alanson, Indian River, Topinabee, and Cheboygan. With the advent of the railroad, the waterway lost some its strategic advantage of transporting goods. However, the railroad brought more people into the area, which benefited the waterway from a tourist perspective, becoming one of the busiest inland water routes in the country with 32 steamers running the route at its peak. From 1876 until 1920, nearly 100 commercial water craft were in business on the Inland Waterway, including boats such as the steam tugboats, side-wheel steamers, stern paddlewheel steamers, propeller driven steamers, naphtha steamers, and gas-powered water craft. Today the region surrounding the route is still a tourist destination. The Inland Water Route Historical Society for the region was founded in 2004 and is home to a museum in Alanson. 88

103 Figure 9-4 Map showing Inland Water Way of MI 89
104 Source: (Practicum Team 2012) City Parks Cheboygan currently has many great recreational opportunities it can capitalize on in the future. The first of these is the large number of parks along the Cheboygan River and on the Lake Huron waterfront. The City of Cheboygan Major City Park is located across the river from downtown and has numerous ball fields as well as an ice rink nearby for year round-ice activities. Gordon Turner Park, which is located on the north end of town along the Straits, features a large playground, a fine sand beach, an elevated boardwalk through the marsh as well as beautiful views of Bois Blanc Island, the Straits of Mackinac and the Mackinac Bridge (Michigan Interactive, 1995). This is a popular area for boaters and visitors to stretch their legs after a long day on the water. On the west side of the bay is the large Cheboygan State Park. There is a large network of well-marked hiking trails here that offer scenic views Lake Huron. There are also several camping opportunities, including tent camping, cabins, and tepees. The remains of the Cheboygan Point Light are also located here. While no longer operating, the Light offers some interesting sights. A large amount of wildflowers can be found along the waterfront, as well as trout fishing opportunities in Little Billy Elliot Creek and general fishing in Duncan Bay. There is electricity offered, as well as modern restrooms and a sandy beach (Cheboygan State Park, Online). Three more parks including the Washington Park on the west side of the Foot Bridge, Kiwanis Park, and Veteran's Memorial Park (Figure 9-5). These parks are located throughout the City of Cheboygan and add to the beauty and recreational opportunities found in and around the City. 90
")
105 Figure 9-5 City of Cheboygan Parks Source: (City of Cheboygan & Practicum Team 2012) 91
106 Biking There are several biking options in the Cheboygan area, including the North Central State Trail. This trail runs on an old railroad bed from Mackinaw City to Gaylord. There is also the Sunrise Side Coastal Highway State Heritage Route which can be a beautiful driving or biking tour. The route runs from Standish to Mackinaw City along the Lake Huron shoreline. (NEMCOG Map) Winter Sports Snowmobiling and ice hockey are very popular and important pastimes in the area. Resident expenditures on winter recreation equipment is quite high. This shows how important it is to the people of Cheboygan and northeast Michigan (Census 2010 Summary Profile). Ice fishing is also a popular activity in the Cheboygan area on some of the inland lakes including Mullett, Black, and Burt. While there are no ski resorts in the Northeast Michigan Region, Nubs Nob and Boyne Highlands ski resorts are both located near Petoskey and are less than an hour s drive from Cheboygan. Treetops Resort near Gaylord, and Boyne Mountain in Boyne Falls are also nearby skiing options. There are numerous crosscountry skiing options as well, including Nubs Nob and Boyne Highlands. Snowshoeing is also popular in the area, with designated trails located at several state parks, as well as ski resorts and other winter resorts and lodges located throughout the region. Marinas Four marinas are located in and around Cheboygan. The Cheboygan County Marina has several slips located in a basin near the mouth of the Cheboygan River. Walstrom Marine, just north of the State St. Bridge, offers slips as well as extensive winter storage capabilities and services. The Cheboygan Harbor Marina/Lund Brothers Marina has a limited number of slips further up the river, just south of the Plaunt ferry dock. Lastly, the Cheboygan Village Marina offers valet dry rack storage south of the State Street Bridge on the west side of the river. The largest of the marinas in Cheboygan is the Duncan Bay Boat Club, two miles to the east of downtown Cheboygan. This large, full service marina is located in a protected basin on the west side of the bay with a total of 216 slips. Many of these slips are capable of holding larger boats of 35 feet and longer. While this is partly a private marina, visitors and people looking for seasonal storage would find good services here (Duncan Bay Boat Club, Online). This marina is far and away the largest in Cheboygan with the most services for boaters. It is developing into a dockimiunium project (docks and condominiums on the same site). 92
")
107 Figure 9-6 Map showing Marinas in City of Cheboygan Source: (Practicum Team 2012) 93
108 Bois Blanc Island and Plaunt Transportation, Inc. One of the rather unique recreational opportunities in the Cheboygan area is Bois Blanc Island, located six miles off the coast. Ferry service to Bois Blanc, pronounced as Bob-lo by locals, is run by Plaunt Transportation Inc. Plaunt Transportation offers ferry service to and from the island May through November. The ferry has been operating since 1932 and is the only ferry service to and from the island. The ferry departs from Water Street just south of the State St. Bridge, one block east of Route 27. One negative aspect of the location of the ferry is the need to lift the drawbridge at State St. at every sailing, thus, stopping traffic momentarily. The main ferry boat, the Kristen D, can carry up to 17 vehicles and 149 passengers. The ferry company also offers several other services for their customers besides transportation. They offer pick-up and deliveries for people on the island, warehouse storage, freight forwarding from all shippers, dump trucks for site clean-up, trailers for hauling lumber, and appliance disposal. (Plaunt Transportation, 2010) Bois Blanc has only 71 year-round residents (as of 2000). The summer population swells to 1000, but still not enough to warrant a bigger ferry company. The island has a general store and a small airfield so there are other options for island residents. An ice road has also sometimes been established to access the island, depending on the ice pack in the winter. Lighthouses There are two lighthouses located within Cheboygan s city limits, plus two more that can be viewed from a beach on Cheboygan s shoreline. An additional three lighthouses are within a 30 minutes drive, and most are open for tours. (Cheboygan Area Chamber of Commerce, 2011) The Cheboygan River Front Range Lighthouse, as well as the Cheboygan Crib (located at the mouth of the Cheboygan River at the end of the breachway), are two lighthouses available for tours within the City limits. With the two lighthouses situated off the coast of Cheboygan, the Fourteen Foot Shoal Light and the Poe Reef Light, there are possibilities to do a combined lighthouse and shipwreck boat tour. Shipwrecks There are numerous shipwrecks located right off the coast of Cheboygan. The following wrecks are situated right outside the port of Cheboygan: Landbo, L.B. Coates, and the Myrtie M. Ross. The Islander, the Leviathan, and the Genesee Chief are located just east of the mouth of the river in Duncan Bay. The Perseverance, St. Andrew, I.H. Outhwaite, and the Albemarle are all located in the South Channel, south of Bois Blanc Island. Glass bottomed boats might even be a possibility. (NEMCOG Map) 94

109 Figure 9-7 Map showing Shipwrecks and Lighthouses near the City of Cheboygan Source: (NEMCOG & Practicum Team 2012) Analysis In spite of the deep water port of the City of Cheboygan, the major economic sector that thrives and helps the city economically is the health care sector. There are three health care service providers that employ almost 780 residents. According to the business cluster analysis done by MSU Land Policy Institute (LPI) there are four upcoming potential clusters for Cheboygan County. These are advanced transportation manufacturing, environmental technology, food innovation and forestry & wood products. The economy of the city also depends on various festivals, competitions and fairs that go yearround. There are several attractions in the city with historical importance. The strategic location of the city on the Inland water way is a valuable asset that should be harnessed to the fullest. A bike share program in Cheboygan would complement our recreational recommendations for the City. The bicycle share will increase tourism and provide another reason for tourists in the area to visit the City where they will be able to rent a bicycle for a day or the week or an extended period of time and bicycle around the City and region. The close proximity to Mackinac Island would give incentive for permanent residents in Cheboygan as well as visiting tourists to bicycle around the area. Bois Blanc 95
110 Island, the Cheboygan River, the Lake Huron shoreline, Mackinac Bridge, Mackinaw City and Island are all viable attractions one could reach on a bicycle. CHAPTER 10 PORT CITY COLLABORATIVE In 2007, forty leaders from various deep water port communities and state government officials met to discuss common issues and opportunities for port cities in the State of Michigan. After holding meetings in Traverse City, Detroit, and Lansing and recruiting additional communities and leaders, the Michigan Port Collaborative (MPC) was formed in In 2010 their first meeting was held in Muskegon to discuss issues facing the Port of Muskegon as well as current state and federal issues surrounding ports in the State of Michigan ( Our Mission ). The MPC has continued to hold regional and statewide meetings yearly to discover and discuss port successes and challenges. The MPC also holds meetings to ensure that state and federal policy makers remain informed about the mission to advance Michigan ports and the assets of clean and vibrant Great Lakes waters. Today, the MPC is a non-profit organization that is tax-deductible and tax-exempt. The Michigan Port Collaborative is important to this study because collaborating with other ports gives the City of Cheboygan an opportunity to prosper as a port city. With a united front in the State of Michigan, port cities have chance to help communities prosper together instead of competing against one another. Mission To be considered part of the Michigan Port Collaborative, a Michigan municipality or port authority must host one or more port functions and may become a voting member of the MPC. To be eligible, the governing body must adopt a resolution supporting the MPC and must identify a person within that governing body who is authorized to serve as the municipality s voting representative. The MPC defines a port function as: Cargo shipping Non-cargo shipping Non-cargo commercial operations such as commercial fishing; marine construction, maintenance and repair businesses; dredging; charter operations and other related businesses. Ferry freight or passenger services on the Great Lakes Recreational harbors receiving funding from the State of Michigan Policy priorities The Michigan Port Collaborative has instituted policy priorities they believe will foster opportunities to help port communities face common challenge they experience in their cities. These policy priorities include ( Our Mission ) 96
111 Expand Freight Transport on the Great Lakes and Exempt New Cargoes from the Federal Harbor Maintenance Tax - To conduct short sea shipping as a clean alternative to Michigan s congested highways. Maximize and Leverage Funding for Great Lakes Restoration and Protection - Michigan s freshwater seas define the state. MPC will increase funding for the Great Lakes to ensure our air, water, and land are kept clean. Promote Passenger Cruises Between Michigan Ports and other US Great Lakes Ports - Opening Michigan s front door to new opportunities for waterfront travel. Preserve and Share Michigan s Rich Natural and Maritime Heritage - State and Federal incentives and funding are essential to showcase Michigan s unique and splendid assets, state and national parks, shipwreck preservers, lighthouses and historic places. Table 10-1 depicts what the Port Collaborative considers a port to be, compared to what the City of Cheboygan and Rogers City have according to the MPC s definition. Table 10-1 Michigan Port Collaborative Analysis Port Cargo Shipping Non- Cargo Commercial Operations Ferry Freight or Passenger Service s Recreational Harbors receiving Funding Cheboygan Yes Yes Yes N/A Rogers City N/A N/A N/A Yes Alpena Yes Yes N/A Yes Source: (Practicum Team 2012) Therefore, the Michigan Port Collaborative is working hard in uniting port cities across Michigan so they can help one another face the challenges port cities experience. The MPC believes uniting these port cities will develop opportunities to help communities prosper from their ports. Environmental friendliness and job creation can improve both the local and state economy. 97
112 CHAPTER 11 MICHIGAN PORTS- A POLICY FRAMEWORK Michigan has been blessed with an abundance of water and freshwater lakes, the largest of which are the Great Lakes. In fact, the state is bordered by four of the five Great Lakes and Lake St. Claire, which translates into 3,224 miles of coastline in the State, and is also the longest freshwater coastline in the world (Ocean, 2011). Given that fact, it also presents great opportunities for the shipping of goods and merchandise from the many ports around the state. The regulation of those ports, port authorities and/or port districts in Michigan, can be a baffling and daunting task to decipher for a casual observer due to the lack of clarity in their regulations and governing body. It has been noted that the State of Michigan has a weaker model of port authorities than other neighboring states such as Ohio and Indiana. It is our intention, in this section, to assess Michigan policy regarding ports and to examine possible changes that may improve the state s port development capacity. Historic Policy Overview The following is a summary of major legislation in Michigan with respect to its ports. This material was gathered through researching the history of ports and the legislation in Michigan in printed and online sources. Much of the background information was also gathered through an interview conducted by the MSU student practicum team in the Spring of 2012 with Mr. (John) Kerr, the Director of Economic Development & Grants Management of the Detroit / Wayne County Port Authority, who is known as an a Michigan port authority expert and a very valuable resource. PORT DISTRICTS - Act 234 of 1925 AN ACT to provide for the creation and establishment of port districts; to prescribe their rights, powers, duties and privileges; to prescribe their powers of regulation in certain cases; to prescribe their powers in respect to acquiring, improving, enlarging, extending, operating, maintaining and financing various projects and the conditions upon which certain of said projects may extend into another state or county. (Port Districts) In simpler terms, the Port Districts Act 234 of 1925, allowed the creation of port districts with the intention of improving areas around the waterfront via land acquisition and expansion, as well as financing projects and other prescribed powers (Port Districts). This Act was the initial step in creating the port authorities as we know them today, but it was referred to in lesser known terms, the port district. A port district can be compared to our modern business improvement districts, but they are no longer in vogue due to the more modern and powerful alternative, the port authority. See Table 11-1, for further breakdown, details and explanation of Act 234 of 1925 and its intention when created. 98
113 HERTEL-LAW-T. STOPCYNSKI PORT AUTHORITY ACT - Act 639 of 1978 AN ACT to authorize the establishing of port authorities in cities and counties; to prescribe the powers and duties of port authorities, cities, and counties; to authorize the incurrence of contract obligations and the issuance and payment of bonds or other evidences of indebtedness; to provide for a pledge by a city or county of its full faith and credit for the payment of contract obligations entered into under this act and the levy of taxes without limitation as to rate or amount to the extent necessary; to validate obligations issued; to provide for the adoption of a port facilities plan; to provide for the financing of the operating budget of port authorities; to prescribe penalties and provide remedies; and to repeal acts and parts of acts. (Hertel) The Hertel-Law-T. Stopcynski Port Authority Act authorized the creation of port authorities in cities and counties (Hertel) and was first chaired by Mr. Henry Ford II, of the Ford Motor Company, from October 1980 to December 1981 (Kerr, 2008). This legislation authorized what is known as a Special-Purpose Authority with more latitude and power than the previous legislation of 1925 (Kerr, 2008) and it has the ability to: Own real/personal property Enter into contracts with public/private companies Capacity to issue bonds Ability to obtain government/foundation grant funding Condemnation abilities See Table 11-2 for further breakdown, details and explanation of Act 639 of 1978 and its intention when created. In an interview conducted by the MSU student practicum team in Spring of 2012 with Mr. Kerr, much valuable information was garnered from a very knowledgeable and respected port authority expert. Mr. Kerr also explained that it is many times collaboration between two or more entities, in any combination of cities and counties, like the Detroit/Wayne County Port Authority for instance. There are also stipulations regarding the make-up of the five member board of directors, as follows: One member to be appointed by the Governor Two members to be appointed by the county commission Two members to be appointed by the city The following tables (Tables 11-1 & 11-2) are intended to be tools for easily distinguishing what port districts and port authorities can do and also is useful in determining the major differences as well as the advantages and disadvantages between the two different entities as well. 99
114 Table 11-1 Legislation for Port Districts PORT DISTRICTS LEGAL CITATION: SERVICE OR FUNCTION: APPLICABILITY: Port Districts, Public Act 234 of 1925, MCL et seq To provide for the establishment of port districts which will be coextensive with the limits of any county government. Any county, independently or in combination with another county, may establish a port district. No more than five contiguous counties may combine to form a port district. FORM OF COOPERATION: IMPLEMENTATION METHOD: GOVERNANCE: Any city or township, or any two or more whole contiguous cities or townships, or any combination thereof may establish a port district. Joint service provision. County Port Districts. The board of county commissioners may act by resolution, or on petition of 10 per cent of the qualified electors of such county, the board of county commissioners may act to submit to the voters of such county the proposition of creating a port district. Municipal Port Districts. The question of establishment of a municipal port district must also be submitted to the voters using the same procedures as establishment of county port districts. County Port Districts. A port commission consisting of five members appointed by the boards of commissioners. In any port district located in more than one county, representation is in proportion to the state equalized value of each county in relation to the total state equalized value of the port district. Municipal Port Districts. In any port district, the boundaries of which are coterminous with one or more whole cities or townships, the appointment of members of the port commission shall be made by the governing bodies of the cities or townships in which the port district is located. FINANCIAL AUTHORITY: May fix and collect tolls, fees, rents and other charges. May levy a tax not exceeding two mills. May borrow money and issue bonds to an amount not greater 0.2 percent of the total assessed valuation of such port district in any one year, nor to a total amount including all outstanding bonded indebtedness of such district exceeding two percent of the assessed valuation of such district. APPLICATION: The Monroe Port Authority is the only authority that continues to operate under, and derive its power from this act. All other port authorities now operate under the Hertel-Law-T. Stopczynski Port Authority Act, Act 639 of Source: ( 100
115 Table 11-2 Legislation for Port Authorities HERTEL-LAW-T. STOPCYNSKI PORT AUTHORITIES LEGAL CITATION: Hertel-Law-T. Stopczynski Port Authority Act, Public Act 639 of 1978, MCL et seq. (Supersedes Public Act 234 of 1925 for the incorporation of SERVICE OR FUNCTION: APPLICABILITY: FORM OF COOPERATION: IMPLEMENTATION METHOD: GOVERNANCE: port authorities.) To provide for the establishment of port authorities. A city and county, a combination of counties or a combination consisting of at least one city and one county. Incorporation of special authority. Initiated by joint resolution of the respective governing bodies. Resolution requests the governor to authorize the incorporation of an authority. The governor is to consider the recommendations of the Department of Transportation and the Department of Labor and Economic Growth in authorizing the authority. The initial articles of incorporation must be approved by the governor and may thereafter be amended by resolution of the authority, subject to approval by the governor. After approval by the governor, the articles of incorporation and any amendments to those articles are effective upon filing with the secretary of state. An authority consists of five or seven members with one member appointed by the governor and the remaining members appointed by the governing body of each participating city and county. The interlocal agreement provides for representation on, and the number of members of, the authority. An authority that is established in a county having a population of 1,500,000 or more (Wayne County) consists of five members with one member appointed by the governor; two members appointed by the county board of commissioners (The members appointed are to be nominated by the commissioners on the board who do not reside within the political boundaries of a city having a population of 750,000 or more (e.g., outside of the City of Detroit)); and two members appointed by the mayor of a city having a population of 750,000 or more that is located in the county (the City of Detroit). 101
116 HERTEL-LAW-T. STOPCYNSKI PORT AUTHORITIES (cont.) FINANCIAL AUTHORITY: Participating units may enter contracts for the acquisition, improvement, enlargement, or extension of port facilities. Each contracting constituent unit pledges its full faith and credit for the payment of its obligations under the contract. If the constituent unit has taxing power, each year it must levy a tax upon all real and personal property within the constituent unit, which may be imposed without limitation as to rate or amount, to the extent necessary for the prompt payment of that part of the contract obligations. Contract may be settled also by service charge to users of the facilities, diversion of state shared revenues, special assessments upon lands benefited, or otherwise. The authority may issue revenue bonds. The state is to provide 50 percent of the operating budget of the authority. Fifty percent of the operating budget of an authority in which not more than one county and not more than one city participate shall be funded equally by the participating county and city. No additional taxing power is obtained for operating costs by cooperating through the provisions of this act. POWERS: An authority may acquire by condemnation lands, property rights, rights of way, franchises, easements, and other property, or parts thereof or rights therein. APPLICATION: All Michigan port authorities have transitioned to the provisions of this act, except that the Monroe Port Authority has not created an authority under the Hertel-Law-T. Stopczynski Port Authority Act and continues to operate under, and derive its power from, Act 234 of 1925, being MCL to Source: ( Other Regulations Senate Bill 332 of 2005 In addition to the PA 639 of 1978, there is newer legislation, Senate Bill 332 of 2005, requiring that all ocean-going vessels obtain a special permit from the Michigan Department of Environmental Quality (MDEQ) before dockage can occur at a port in State waters (Great, 2008). The Bill stipulates that the State of Michigan will only issue the permits when it is proven that specific methods or measures are in place on the vessel to prevent aquatic invasive species, like the Zebra Mussel, whose effect is to smother native species and cause extensive damage to both ecosystems and economies (Zebra, 2012), from being discharged into the Great Lakes water when ballast water is exchanged. The effect of this bill is that it is just another step that shipping companies would need to navigate through in order to do business in our state. In addition to the hassles, it negatively impacts the bottom line of business as well, which is to make a profit and to do it in an efficient manner. 102
117 Enforcement of State Laws Under the Clean Water Act (CWA), the Environmental Protection Agency (EPA) may authorize states to assume control of wastewater discharge under its National Pollutant Discharge Elimination System (NPDES) program. Michigan has assumed responsibility for the permitting program pursuant to 33 USC 1342(b). Once a state assumes authority, it promulgates its own statutes and regulations, which must meet minimum federal standards. The State then becomes the primary authority for issuing NPDES permits, not the EPA. As a precondition to assuming responsibility for the NPDES program, the state program must demonstrate that it has adequate authority to enforce permit requirements. Although the state is the primary permit enforcer, the federal government retains separate authority under the CWA to pursue civil, criminal, and administrative enforcement actions.therefore, the Michigan ballast water laws may be enforced by Michigan or the EPA. If a ship discharges ballast water without such a permit, the person responsible for the vessel will be subject to possible civil fines and imprisonment by the state. The Michigan DEQ s compliance staff will have the authority to board vessels discharging ballast water in ports. (Showalter, 2006, 16) The primary difference between Michigan s laws and the federal laws is that the Coast Guard program does not require ships that claim No Ballast Onboard (NOBOB) to comply with their ballast discharge programs. NOBOBs are vessels which have discharged ballast water in order to carry cargo and, as a result, have only unpumpable residual water and sediment remaining in the tanks. The Coast Guard has taken preliminary steps to regulate these vessels, however. NOBOBs must submit ballast water reporting forms and the Coast Guard recently established voluntary best management practices for NOBOB vessels, which include mid-ocean water exchange and saltwater flushing of empty tanks. However, although the Coast Guard may monitor the NOBOB ships, the requirements are not mandatory and vessels that are loaded with cargo may avoid the ballast water requirements. The MDEQ s draft permit will address this gap and requires all ocean-going ships to obtain a permit. (Showalter, 2006, 4) Analysis There are several different ways a port district and a port authority can achieve the goals of the port of Cheboygan. According to the Internal Revenue Service (IRS) Form 8718 submitted by the Port of Cheboygan in January of 2012 for their non-profit status, a few of their main goals are as follows: Help promote economic activity in and around Cheboygan for the good of the community Develop a local economic incubator to aid in the process and attract startup businesses Purchase land to allow the development of the port to proceed, supply the infrastructure and coordinate activities in and around the port Create a Customs department which will benefit the northern Michigan region Create a foreign trade zone (FTZ) to attract additional industries and businesses to area 103
118 The Port of Cheboygan may eventually transition into a port authority in a joint effort between the City and County of Cheboygan and the State of Michigan The aforementioned IRS non-profit status awarded was a large hurdle to cross that will allow for more efficient operation at a lower cost and hence a greater opportunity for success in the future. The Port previously applied for and received the same status from the State of Michigan as well, which is a prerequisite for the Federal designation. The following table provides the names, as well as their positions and salaries paid by the Port, of the members of the Port of Cheboygan s governing body. It is an important step because it substantiates the Port of Cheboygan s commitment to the establishment of the non-profit group with the intent of bringing economic development and stability to a small, northern Michigan City not unlike many other small coastal cities in and around Michigan. Table 11-3 Port of Cheboygan Governing Body Name Position Annual Compensation Mark Lolenz President $0 Tom Eustice Director $0 Chip Eichhorn Director $0 Greg Elliott Treasurer $0 David Kronberg Director $0 Ken Paquet Director $0 Source: (IRS Form 8718, Appendix C) Upon reviewing the aforementioned goals, it seems as though all of the goals are attainable given the correct circumstances and economic climate. It also is apparent that the Port of Cheboygan has done their due diligence and has received solid advice from different sources as to how to proceed at this point in their fledgling existence. The MSU Practicum Team is in agreement that the 501(c)4 status is a proven method that can work, given that there is cooperation between the major entities involved, those being the City, County and the Port of Cheboygan. The Port does not have the ability to issue bonds to raise funds according to their current status, but it seems apparent that there are assurances from Cheboygan County to assist in that process if and when it is deemed necessary at some point in the future. Summary Given the background of the Port Districts and Port Authority Acts along with the knowledge gained in the data gathering process it can be suggested at this point that small steps be taken according to a plan that will be determined by the Port of Cheboygan. It looks like this is exactly the course that the Port of Cheboygan has chosen to pursue given the recent non-profit status that has been achieved (see Appendix C) in conjunction with their existing Vision 2011 Plan. 104
119 It is also apparent that there is disparity between Michigan and many of the neighboring states in regards to the regulations. Although it would be easier to relax Michigan s regulations to that of the Coast Guard s or even the neighboring states, it is not in Michigan s best interest to do so at this time or at any point in the future. The Great Lakes are special and a very valuable resource and it is the people s responsibility and burden to protect them at all costs so they can be useful and enjoyed for future generations. One of the ways that the disparity can be lessened and to ease the burden on the environment at the same time is to seek an increase in vigilance and support from the neighbors on the Great Lakes, and even the United States, and develop a regional network that has the resources to teach and promote the importance on the regulations to incoming freighters and international boats entering Michigan s waters and ports. If everyone adopts a more stringent set of regulations on ballast water it will only serve to protect all of our interests now and into the future. This is why we are suggesting that the Port Of Cheboygan begin lobbying and garnering support first in the local and regional market including northern Michigan, then the entire state through the Michigan Port Collaborative and continue up the chain of command from there. The market of the Midwest and the United States is too important globally and economically to be passed over by international shipping due to an increase in the regulations and the extra costs that are inherent to shipping companies as well. 105
120 CHAPTER 12 PORT CASE STUDIES The objective of this study was to find port characteristics that could be compared to the Port of Cheboygan. In doing so six ports those are located on the Great Lakes: Monroe, Detroit, Toledo, Muskegon, Green Bay, and Hamilton were studied. All ports are located in the United States except the Port of Hamilton which is located in Canada. The characteristics reviewed were, water depth, the amount of cargo that goes through each port, dock space, recreational activities, and transportation accessibility in order to compare that information to the Port of Cheboygan. Understanding the strengths of other ports located on The Great Lakes will further improve our recommendations. Port of Detroit, Michigan Detroit was founded in 1701 by Antoine de La Mothe Cadillac when he staked France s claim to it by planting the flag in the ground of the current location of Griswold Street ( Detroit ). The location of Detroit was advantageous as it was between the upper and lower Great Lakes and was, therefore, in the middle of its most important resources at the time: the forest for timber, soil for agricultural uses, and various mining materials ( Detroit ). The city flourished upon creation of the Erie Canal, whose purpose was to provide a link between the Great Lakes and the Hudson River and consequently became a leading manufacturing center in the 1950 s to the 1960 s ( Detroit ). The legislature passed Public Act 234, the Ports District Act in 1925, which provided the ability to form Port Districts to oversee regional maritime actions ( Detroit ). The Detroit Wayne County Port District was then formed in 1933 and has jurisdiction of the waters and shoreline of Wayne County ( Detroit ). In 1978, the District was converted into the Detroit /Wayne County Port Authority due to a marked increase in the development of it and an increased need for port activities and supervision ( Detroit ). The Port Authority is controlled by a five member board consisting of one person appointed by the State of Michigan, two by the City of Detroit, and two by Wayne County ( Detroit ). 106

121 Figure 12-1 Aerial of the one of the ports under the control of the Detroit Wayne County Port Authority Source: ( 107
 The Port of Detroit has a water depth of 27 ft. and offers 5,500 ft. of dock space. There are 80 million tons of cargo imported/exported annually at the port.")
122 Figure 12-2 Picture demonstrating the use of one of the many terminals found in the 32 mile stretch of the Detroit River that is included in the Port Authorities jurisdiction Source: ( The Port of Detroit has a water depth of 27 ft. and offers 5,500 ft. of dock space. There are 80 million tons of cargo imported/exported annually at the port. Due to its prime location, the port is easily accessible via a nearby airport, highway, and railway. The Port of Detroit exports domestically as well as internationally and is a viable member of the Foreign Trade Zone. Tourists visiting the nearby port area can enjoy eco-tourism tours, restaurants and nightlife, as well as boating and fishing ( Detroit ). On July 18, 2011, the Detroit Wayne County Port Authority opened a new $22M facility that boasts 22,000 sf. of ship terminal and 250 ft. of public dock space to process international and domestic ships on the Great Lakes (Rogue HAA, 2011). The new facility will improve processing and expand possibilities for greater numbers of and varieties of ships than in the recent past. Port of Green Bay, Wisconsin The Port of Green Bay is the westernmost port of Lake Michigan and was established in the 1800 s when waterway trading was focused in fur and peltry (Port of Green Bay, 2012). During the 1800 s forts were built on the Fox River by French, British and Americans military forces. In 1816 the first vessel with US 108

123 flags arrived for Fort Howard. By 1867 major commodities exported from port were lumber, barrel, shingles, railroad ties and other forest products for Chicago and New York. The Peshtigo Fire destroyed the Northwestern Wisconsin forests and changed the port. In the late 1800 s it exported agricultural products with the largest flour export port on the Great Lakes. By the mid 1930 s, the port shifted from an export to an import port for petroleum coke and coal. Today it continues to import both dry and liquid bulk commodities (Port of Green Bay, 2012). Figure 12-3 Aerial of the Port of Green Bay and its loading docks Source: ( The Brown County Harbor Commission was created in 1956 in anticipation of the 1959 opening of the St. Lawrence Seaway. This gave the port international status due to the direct link to the Atlantic Ocean and 109

124 the world from the Midwest (Port of Green Bay, 2012). Now there are thirteen port businesses spread over a three mile span on Fox River. The Port of Green Bay has a depth of 26 and transports more than two million metric tons of coal, limestone, cement, salt, pig iron, fuel oil, forest products, liquid asphalt and many other essential commodities valued at more than $300 million. In 2010, the port received more than 1.7 million metric tons of cargo, supporting 823 jobs and had an annual economic impact on the Green Bay area of $83 million (Port of Green Bay, 2012). Figure 12-4 Bird s Eye View of the Channel of Port of Green Bay leading to Lake Michigan Source: ( The turning basin lies immediately above the Canadian National RR Bridge opposite Georgia-Pacific Corp. at the south limits of the City of Green Bay and is adjacent to the dredged channel. Its irregular shape is maintained at a depth of 22' (Port of Green Bay, 2012). The Port of Green Bay is situated close to an airport, railway, and highway making it an easily accessible port with intermodal connectivity. Recreational activities around the port include, golfing, boating, and hiking making it an attractive place to visit. Due to international exporting, the Port of Green Bay is apart of the Foreign Trade Zone. 110

125 Port of Muskegon, Michigan Muskegon, also known as the Port City, has a metropolitan area population of 170,000, with 40,000 people in the city itself. Lake Muskegon, separated from Lake Michigan by a small channel, makes up the Port of Muskegon, providing protected and calm waters on a large scale. A high speed ferry operates out of Muskegon, connecting it with Milwaukee, Wisconsin. Figure 12-5 Aerial of the Port of Muskegon s various loading docks and Terrace Point Marina located in the upper right portion Source: ( The port of Muskegon, located on the west side of the state about half way down the western coast of Michigan, is a large port (in comparison with Cheboygan), with several different marine terminals and services. The Port of Muskegon is run by the West Michigan Port Operators, which also runs ports located in Grand Haven, Holland, and Manistee. The Port of Muskegon has services that include bulk material storage and transport by both truck and rail. The Port also has covered storage, a 600 ton capacity crane, and tug and tow assistance. Muskegon has five main docks, all located on the south side of Lake Muskegon near downtown. All have drafts of over 27 feet and dock frontage of over 950 feet, including the Mart dock which has 2,500 feet of dockage. The port has many intermodal transit options, including the onsite Short Line (which is part of Michigan Shoreline Railroad), which connects with CSX. 111
. Figure 12-6 Birds eye view of the ports major loading dock and the Terrace Point Marina, Port of Muskegon Source: (www.google.")
126 US-31, which runs into downtown Muskegon along the shore of Lake Muskegon, connects the port with I-96, only six miles to the east. The Muskegon airport is also only 8.2 miles from the port terminals (Port of Muskegon). Figure 12-6 Birds eye view of the ports major loading dock and the Terrace Point Marina, Port of Muskegon Source: ( Port of Toledo, Ohio Toledo, Ohio is a multi-modal transportation hub with heavy waterborne, rail and highway activity. The seaport, rail station, two airports and Foreign Trade Zone 8 are managed by the Toledo-Lucas County Port Authority. The Port of Toledo has a water depth of 27 feet and handles over 12 million tons of cargo and 700 vessel calls each year. The Toledo Shipyard is one of the only few full service shipyards with graving docks. It is the largest land mass seaport on the Great Lakes. The port has 1,054 ft. of docks which includes 15 terminals linked to global markets. The shipping terminals serve lake trading vessels, salt water vessels and lake trading barges. The Port of Toledo is 100% navigable and can accommodate any sized vessel utilizing the Great Lakes St. Lawrence Seaway System up to and including 1000 laketrading vessels. The seaport terminals import and export fertilizers, corn, wheat, soybeans, oats, and other grains on barges, lakers, tankers, and ocean vessels. Toledo has the most cargo diverse inland port on the Great Lakes. 112
 113")
127 Figure 12-7 Arial of the Port of Toledo and its Railways Leading to the Docks for Fast and Efficient Multimodal Transportation Source: ( 113
 Port of Hamilton, Ontario, Canada The Hamilton Port Authority is governed by a seven member Board (Hamilton). The Board is responsible to the Federal Minister of Transport.")
128 Figure 12-8 Birds Eye View of Large Cargo Ships Docked Near the Toledo Port with Various Railway Spurs Source: ( Port of Hamilton, Ontario, Canada The Hamilton Port Authority is governed by a seven member Board (Hamilton). The Board is responsible to the Federal Minister of Transport. Directors serve a three-year term and are eligible for renewal only once. A period of 12 months must pass after the expiration of the second term before the individual may be eligible for another appointment (Hamilton). The Hamilton Port Authority officially came into existence on May 1, 2001 (Hamilton). Part of the Port Hamilton Port Authority s mission is to enhance and improve public access to the waterfront and enhance support the development of commercial enterprises like restaurants and shops there (Hamilton). The Port Authority has a 2020 vision of becoming The Great Lakes Port of Choice. The Port of Hamilton handles the largest volume of cargo and shipping traffic of all the Canadian Great Lakes ports (Hamilton). The Port of Hamilton is linked to two major Great Lakes shipping routes: the Welland Canal entrance sitting approximately 26 nautical miles from the Burlington Canal and the St. Lawrence River, approximately 151 nautical miles from the entrance into Hamilton Harbor (Hamilton). 114
. The marina in Port Hamilton can dock about 250 vessels and can store more than 400 vessels in the winter (Hamilton).")
129 The port has a water depth of 30 feet and a dock size of 36,089 feet which serves as the destination for 550 domestic vessels and 96 international vessels which visited the port from January 1, 2010 to December 31, 2010 (Hamilton). The marina in Port Hamilton can dock about 250 vessels and can store more than 400 vessels in the winter (Hamilton). Figure 12-9 Aerial of the Largest Dock at the Port of Hamilton Source: ( In 2006, Port Hamilton was recognized as an emerging arts and culture center, with several art galleries, production facilities for independent films, and recording studios (Hamilton). A marine railway and dockyard was constructed specifically for pleasure boaters and small commercial craft use that provides repairs as well as refitting and winter storage of smaller, privately owned vessels. Restrooms, showers, laundry and BBQ areas are conveniently located dockside. Restaurants and shops are only minutes 115

130 away. Today the marina offers dockage facilities for approximately 250 pleasure craft and houses over 400 vessels in winter storage (Hamilton). Figure Birds Eye View of a Cargo Ship Docked on Port of Hamilton near Bulk Storage Tanks Source: ( Port of Monroe, Michigan The Port of Monroe, Michigan Monroe is one of Michigan's gateway cities and is located 17 miles north of Toledo and 35 miles south of Detroit. It is the third oldest community in Michigan, with its earliest economic roots originating from Native American activity. Monroe was later settled by French missionaries and fur trappers, giving it the nickname "Frenchtown". During the War of 1812, 300 Americans were killed during the Battle of River Raisin, making it the deadliest battle of the war. The River Raisin Battlefield was placed on the National Register of Historic Places in

131 Figure Aerial View of the Port Of Monroe and its Close Proximity to I-75 Which Increases Their Efficiency and Reduces Handling Source: ( 117
 The Port of Monroe is home to several major industrial businesses that share easy access to the water, major highways, and class I rail transportation networks.")
132 Figure Birds Eye View of the Port of Monroe and its Channel connecting it to Lake Erie Source: ( The Port of Monroe is home to several major industrial businesses that share easy access to the water, major highways, and class I rail transportation networks. The port has a water depth of 27 feet and 3,500 feet of docks space. Some of these businesses include DTE Energy, Holcim, Inc., Gerdau MACSTEEL, The Mickow Corporation, Michigan Paving & Materials Company, and Omni Source, Inc. The Port of Monroe, as well as the county as a whole, has a history in the manufacturing industry. Other top employers in the area are Meijer, Monroe Public Schools, Mercy-Memorial Hospital, and Guardian Industries Corp. Monroe is home to several recreational attractions for tourism including the Historic Sawyer Homestead, River Raisin Centre for the Arts, and the Monroe County Labor Museum (The Port of Monroe). 118
133 Analysis: This study compared nine factors from ports all over the Great Lakes. They are, Water depth: To understand how big of a cargo ship each port could handle. Dock Space: In order to compare how much cargo each port is able to accommodate. Cargo handled yearly: Used to compare the amount of cargo each port experiences to the Port of Cheboygan. Transport Facilities: In order to see how easy it is for a port to ship cargo either by rail, highway, or by air. Recreation: Understanding the recreational activities each port has to offer for people visiting the surrounding area. Ferry & Cruise Service: Comparing Cheboygan s ferry ship to ferry services for ports used in this analysis. Import/Export: Used to determine whether each port imports, exports, or does both. International: Used to determine if any of the ports ship internationally. Foreign Trade Zone: Used to determine whether the ports that ship internationally are a part of this program that exempts duty payments for exports and exonerates tariffs until the goods leave the zone and are formally entered into the U.S for imports. The Port of Cheboygan has a water depth of 20 feet and 3,050 feet of dock space. On a yearly basis 120,000 tons of cargo pass through the port. The port has close access to highways, an airport, and a railroad. Recreational activities around the port include miles of biking trails, boating, and paddle boat rentals. The port is home to a family-run ferry cruise that provides service to the small island of Bois Blanc. Due to the port s smaller size compared to ports around the state of Michigan and the ports used in this study, the Port of Cheboygan only imports goods and does not export domestically and internationally, therefore not making it a part of the Foreign Trade Zone. 119
134 Table 12-1 Comparison between the Port Case Studies Ports Toledo Detroit Hamilton Green Bay Monroe Muskegon Cheboygan Rogers City Alpena Water Depth (Ft) Cargo (in Mi tons /yr) Trans-port Facili-ties Recrea - tion Ferry & Cruise Service Import / Export ,054 5,500 36,089 N/A 5,300 3,500 3,050 5,600 N/A Rail. Hwy, Airport Boat shows, kayakin g Rail. Hwy, Airport Eco tourism, boat rentals, fishing Rail. Airport Sailing school, water front trails Rail. Hwy, Airport Golfing boatin ghiking Rail. Hwy, Airport Bike trails, boat rentals, fishing Rail. Hwy, Airport Boat rentals, fishing Hwy, Airport Bike trails, paddle boat rentals Rail. Hwy, Airport Bike trails, hiking, fishing No Yes No No No Yes Yes No No Rail. Hwy, Airport Bike trails, Glass bottom boats, tall ships, fishing Both Both No Both No Both Import Both Both Interna - tional Foreign Trade Zone Port Authority Yes Yes No Yes No Yes No N/A Yes Yes Yes No Yes No No No N/A No Yes Yes Yes Yes No No No No No Source: (Practicum Team 2012) Conclusion Therefore, all the ports that were used in this case study besides the Port of Hamilton share similar characteristics. The ports of, Monroe, Detroit, Toledo, Muskegon, and Green Bay have similar water depths, recreational activities and transportation access. As for dock space, Hamilton has the largest out of all six ports and Monroe has the smallest, but the rest have dock space that is close to one another. Four out of the eight ports in this analysis have port authorities. The City of Cheboygan has an opportunity to learn from what port authorities have to offer and how it can better the City and the port as a whole. 120
135 CHAPTER 13 SWOT ANALYSIS SWOT analysis is a basic tool that identifies the strengths, weaknesses, opportunities and threats of a city, community or a business. It is a straightforward model that assesses what a city, community or a business can and cannot do as well as identifies potential opportunities and threats. The method of a SWOT analysis is to take the information from an environmental analysis and separate it into internal and external issues. Mostly the internal issues are the strength and weaknesses, while external issues are opportunities and threats (Investopedia, 2012). Before doing the SWOT analysis, a detailed study of the City of Cheboygan and the Port of Cheboygan was done in order to understand and infer the strengths, weaknesses, opportunities and threats for both. Strengths Location 3 of the Great Lakes Huron, Michigan, Superior Location, safe harbor from storms Recreation snowmobile and trailheads, trails, biking and tourism The Cheboygan River, the length of the river allows for a diverse opportunity for many users, Inland Waterway Ferry service Multiple marinas and various marine support facilities Weather many opportunities for different seasons Small town, tight knit community Cheboygan County Airport Highway access proximity to I-75 Festivals - Riverfest, Downtown Musicfest Proximity to downtown Natural environment and the surroundings Weaknesses Water depth Width of channel Lack of rail transportation Location Demographics older than the state average Lack of diversity businesses 121
136 Aesthetics of the riverfront / working port Lack of exports major industry The surrounding wetlands at mouth of river cannot develop it Lack of an identity Lack of slips for mega yachts, Over 96 long Opportunities Tourism river walk and trails More recreation promote fishing Available land for development Ferry service can expand services to the island Marketing Additional docks floating ones so small boats can unload and get into downtown ew marina Target area Port Authority functions and expansion of infrastructure and services Industrial park expansion Landuse plan alternative uses for properties along river Rail spur to encourage intermodal transportation Dredging the channel Widen the turning basin Sharing of resources within the region Diversification of industries and more reasons to go there Green energy solutions, manufacturing and shipping Threats Competition between various uses within the region. Surrounding states that have less regulation than MI ( on commercial ship) Surrounding towns Silting at the edges or river may need dredging Flooding Receding water depths ( in great Lakes) 122
137 CHAPTER 14 RECOMMENDATIONS AND STRATEGIES The recommendations and strategies portion of any project is an important step because it is the synthesis that results from all of the data collection and effort required by the team up to this point and it is really what drives the project and process forward. The practicum team broke down the recommendations into a more reasonable list which will have milestones and projects that are more easily attainable. This was accomplished by dividing them into two categories, short term and long term recommendations. The short recommendations are defined as having a time frame ranging between zero to five years in duration for this project. The long term recommendations are defined as having a time frame greater than five years to ten years in duration and beyond. Like any large project or long term planning project, the recommendations will need to be revisited and revised every five to ten years, or on an even shorter duration during times of great change in terms of resources and economic fluctuation. SHORT TERM (0 5 years) Promote investment in the river and increase accessibility As the City of Cheboygan is located along the Cheboygan River it is essential to enhance and maintain the beauty of the river. Some of the techniques to harness the advantage of accessing the river through downtown can be achieved via: Waterfront restaurants Shops on the docks Water view plazas 123
 Source: (www.bing.")


138 Figure 14-1 Waterfront Restaurants Figure 14-2 Water View Decks Source: ( Source: ( The Major City Park is located strategically by covering maximum frontage of the river from the east side; this could be utilized in enhancing the river walk by various means as follows; Interpretive signage telling the history of the City and Port and their beginning as a logging town on the river with close proximity to the Great Lakes. Decorative lighting with colorful street furniture or amenities along the river walk. Park amphitheater for downtown festivals and other events Figure 14-3 Park Amphitheatre Figure 14-4 Park Furniture Source: ( Source: ( 124
 Figure 14-7 Floating Docks Figure 14-8 Interpretive Signage Source: (www.google.com) Source: (www.")
 The proximity to downtown Cheboygan is a great asset, but it could be improved by")


139 Figure 14-5 Street Amenities Figure 14-6 Street Furniture Source: ( Source: ( Figure 14-7 Floating Docks Figure 14-8 Interpretive Signage Source: ( Source: ( The proximity to downtown Cheboygan is a great asset, but it could be improved by constructing better connections between the river and downtown. Floating docks along the river can help in achieving greater access of small boats travelling towards downtown. In addition, beautification of the North Central State Trail could be done by including local or historical landmarks, such as an anchor from the original Coast Guard Cutter stationed on the river, along the trail that demarcates the mileage of the trail and provides interest as well. 125
140 Increase recreation opportunities Cheboygan has many great recreational options both on land and on water that could be expanded on. The beautiful countryside and lakes make for an ideal recreational hot spot. There could be a greater promotion of the recreational trails and their opportunities, like biking, snowmobiling, and rental facilities offering different services depending on the season. They city could promote Bois Blanc Island as laid back day trip destination, away from the hustle and bustle and tourists that occupy Mackinac Island. Bois Blanc is a beautiful island in itself that has much to offer the more laid back, quiet vacationers. The Cheboygan River and the Inland Waterway could be better promoted and used as a place for recreation. Small boat rentals, like canoes, kayaks, and paddle boats might be nice for kids and adults alike on the protected waters of the waterway. The lighthouses and shipwrecks located a short distance offshore from the Port of Cheboygan could also be better taken advantage of. Boat tours from Cheboygan would be a great way for people to experience these sites; a possible glass bottomed boat might even be explored as an option for the shipwrecks. With ten shipwrecks and two lighthouses a short boat ride away from the harbor entrance, this would make for a very pleasant afternoon boat tour. Fishing options could be explored by offering half-day and full-day chartered fishing adventures to draw people to the city and the port and provide some additional economic activity. Walking tours of the city promoting the past, present, and the future might be an enjoyable way for people to take a glimpse into Cheboygan s diverse and vibrant history. Promote Cheboygan s cultural activities Expand opportunities for tourism without losing the small town experience by utilizing tourist destinations such as the Opera House, museum, lighthouses, and shipwrecks. Promote the close ties of the community and the sharing of services with the surrounding regions around Cheboygan to incur cost efficiencies. Increase marketing of the City and the POC For a small price, Cheboygan could gain valuable statewide and national attention through the Pure Michigan campaign commercials by generating support and interest within the community of Cheboygan. Promote the expansion of the ferry service to nearby areas to attract tourists to utilize this service by giving them an option to use the ferry to visit surrounding cities. Promote the close proximity of the airports near Cheboygan (County Airport, Pellston Airport) for the services that they can provide to businesses who import and export goods. Create an identity for the City Cheboygan s location is one of its best and most unique qualities. Not only is the city close to the Mackinac Bridge, a major tourist attraction, it is also very close to Lake Michigan, Lake Huron 126
141 and Lake Superior. Since the Great Lakes are a worldwide phenomenon and attraction, this puts Cheboygan in a great position to capitalize on its extraordinary location. Cheboygan s climate provides a unique opportunity for different types of recreational activities within the port and city. In winter months, snowmobiling and skiing are popular and could be useful in emphasizing Cheboygan s recreational potential. In summer months, the river and surrounding inland lakes (as well as the Great Lakes) provide opportunities for boating, tourism, and other water related recreation. Cheboygan s relatively small size and small-town feel allow the opportunity for residents to feel like they are part of a very close community, where faces are familiar and individuals are friendly and outgoing. Many find this close-knit feel to be desirable not only when considering a place of residence, but also of vacationing and tourism. Especially in summer months, Cheboygan could continue and even expand its annual festivals. Riverfest and the Downtown Musicfest are two annual festivals already in place, and with festivals come tourism and revenue for local businesses. Additionally, the more tourists that visit Cheboygan, especially new tourists, can help spread the word about the city s identity and amenities. Cheboygan has a beautiful natural environment that is an essential point of interest for tourists and especially those lucky enough to live within it. The Cheboygan River is very unique in the way that it connects many inland lakes, each with their own special beauty. Focusing on this aspect of the city and port will be very important in drawing tourism from those who are seeking a unique and beautiful natural environment. Cheboygan is about a twenty minute drive from I-75, which can be extremely beneficial to the city and port in terms of receiving raw materials, and exporting manufactured goods. It also provides a direct route to and from many populous areas of the state, in terms of tourism and travel. Cheboygan s available land for development could be used for many targeted purposes, including industrial or recreational. It also provides the opportunity for the city to create more dense development, particularly near downtown and the riverfront. Planning related A new Comprehensive Master Plan should be created, and it should encompass aspects of the last major rewriting of the plan as well as new concepts, and updates that occurred between revisions. A clear master plan is the most important way to plan for the city and its future growth in an efficient and defendable manner. 127
142 The park master plan and land use plan both are in need of revision and expansion. Some of the plans, particularly the park master plan, come with little explanation or insights concerning what the goals of the plan are. Community participation in any effort to improve the city or the port is essential to the success of the project. Especially if any major changes are expected to occur, the community needs to be informed and invested in whatever will be happening. In a community where a large percentage of the population is older in age, and therefore, likely to be more resistant to major changes, including these citizens in the planning process as much as possible is imperative. Expand opportunities for industries/business In order to improve the economy of the city, it is essential to know the weak and the strong businesses and industries. As the healthcare sector of the city is a major employer it will be beneficial to promote it. The city should also strive to improve its fishing and freshwater industries as they have declined for the past decade. Along with this the city has experienced an increase in employment in following sectors: Sales & office occupation Construction, extraction and maintenance occupation Production, transportation and material moving occupation There are some other sectors that has an upcoming potential not only for the county, but also for the City of Cheboygan, they are: Environmental technology Food innovation Forestry and wood products The city should further promote these sectors to attract the younger generation. Furthermore, the city should promote the industrial park in order to attract industries like green energy solutions i.e. manufacturing and shipping of wind turbines, which will ultimately help in increasing the port operations. Great Lakes Cruise / Tall Ships Increased tourism in Cheboygan will bring outside visitors to the city who will spend money in local restaurants and businesses. An Ann Arbor company is beginning to form a Great Lakes cruise line program which could benefit Cheboygan. The city should try to secure dockage from such cruise ships in addition to providing the necessary infrastructure for Tall Ships. There could be sailing events for these Tall Ships on Lake Huron with pre and post events in Cheboygan for the sailors and crew. 128
143 Port Improvements The Port of Cheboygan can be improved in a number of ways in the short term. First, we recommend for the port to be dredged again. The Cheboygan River is currently experiencing a bowling affect, in which the sides of the dredged channel are eroding and caving in. While the middle of the channel is still the expected depth, the outer edges of the channel are shallower and thus need to be dredged. The last dredging occurred in 1976 and therefore another round of dredging would be beneficial to the shipping industry. A second short term recommendation would be for at least one of the marinas (preferably the County Marina, due to the ease of access to Lake Huron) to construct new slips capable of handling mega yachts. While not common to Cheboygan, at least once a week a mega yacht inquires to dock in Cheboygan, and they currently have to be turned away if they are longer than 96 feet. Having mega yachts in the port would not only be good for the marinas with their large dockage and fuel bills, but would be good for the city too as these people would probably spend money on local goods and services in town. A third short term recommendation would be the continued exploration into the possibility of developing the large riverfront parcel between Durocher and Ryba Marine. Possibilities could include intermodal facilities like dry bulk transfer, truck scales, liquid holding and transfer. Waste and bilge transfer facilities could be another important option for a full-service port. All of these would be good, viable options for port improvements in the short term and the betterment of the port and city of Cheboygan in the long term. 129

144 Figure 14-9 Vision 2011 Source: (Port of Cheboygan) LONG TERM (6 10 Years) River related The City of Cheboygan should consider alternative land uses like an open café or a restaurant for the ferry parking lot that is located on Water Street. Along with considering an alternative land use for the ferry parking lot we recommend relocating the ferry service to the north side of the State St Bridge. We recommend buildings embrace the river through an aesthetic enhancement of building s walls that face the riverside. Lastly, we recommend that the construction of the proposed new marina be completed; this will help in maintaining the width of the river as it is narrowed due to boats that are parked along the river. 130


145 Figure Open Café or a Restaurant Figure Aesthetic Enhancement of Building Source: (Practicum Team 2012) Source: (Practicum Team 2012) Regional networking and sharing of services In this day and age of limited resources and finite budgets, it is almost a given that more will be required with less. The same applies to the provision of services as well, whether we are referring to City services or those provided by the POC is of little consequence at this point because, in the end, they likely will both be needed in some fashion or another. Cheboygan needs to continue their membership in the Michigan Port Collaborative to ensure that issues experienced in northern Michigan are conveyed and understood to the governing bodies so that changes to legislation may result. However, the Michigan Port Collaborative may not be enough to stimulate the regional ports of the NEMCOG area. We are therefore suggesting that the POC, in cooperation with the cities of Cheboygan, Alpena and Rogers City, consider forming their own regional planning committee to further their causes in a collective way that will benefit all equally and more efficiently represent their own. Greater good can be accomplished with the pooling of finite resources and using that larger sum to apply for grants and matching funds which will allow for improvements in the future. 131
 We have provided NEMCOG and the POC with a brief background of the regulations of Michigan pertaining to ports and port authorities, but there is still much information that requires additional")
146 Figure Join hands with the regional Port Authorities Source: ( We have provided NEMCOG and the POC with a brief background of the regulations of Michigan pertaining to ports and port authorities, but there is still much information that requires additional research and sweat equity. One area that needs further exploration is that of the regulations currently being employed by the neighboring states as well as Ontario, Canada. This information is important due to the disparity that exists between them and the State of Michigan. There are no easy fixes for this situation because relaxing our regulations to match theirs, while it may produce an increase in the short term imports, will produce devastating effects on our environment in the long term that is not acceptable to any of us in this great state. It is difficult to think of a more suitable saying for our situation than a famous one uttered by John F. Kennedy, A rising tide lifts all boats (JFK Quotations). It is through our networking with other ports, planning agencies and committees, and professionals in the industry that we can produce those needed positive effects. We have all seen how a stone dropped in calm water starts as a ripple and continues to spread out from the point of contact in a concentric fashion and, with added energy, the ripples can grow into small waves that continue to spread. Great Lakes Cruise / Tall Ships In the long term, shopping centers and other specific tourist destinations such as additional food options, a river walk, expanded parks and new lodging should be constructed to encourage the browsing of passengers and tourists, who in turn support the local economy. Overall, improved infrastructure such as docking and ships will increase the amount of tourist traffic in the Cheboygan area. Port Improvements There are a number of projects and improvements that the POC is already considering for port improvements as listed in their Vision 2011 plan and they should all be considered after the short term items have been accomplished. The following lists were compiled from the aforementioned Plan and are not listed in any particular order regarding importance or investment amount required. We also broke the list into two categories, land related and water related, to promote clarity and increase the readability. We have chosen not to discuss the Vision 2011 plan in detail due to the fact 132
147 that the POC already has determined that the proposed projects are of importance to their success and the fact that the needed background information required to make informed decisions was not readily available. Vision 2011: land related projects POC building rental POC marine cargo and storage POC dock lease facilities Vision 2011: water related projects Through communication with members of the POC it has been determined that the transient dockage as well as the marine facilities will not be a detriment to the width of the Cheboygan River. This is advantageous because any reductions to the current width would be counterproductive and a step backwards. POC marine maintenance facility POC transient dockage One of the issues that we consider important is the expansion of the existing turning basin located north of US Oil. By expanding the current turning basin to the east, it would allow for boats currently too long to use the river facilities to navigate in and out safely without requiring them to back themselves out to Lake Huron. To accomplish this goal, the US Coast Guard would be required to reroute their existing service drive further east by , depending upon the wants and needs of the POC and the continued safe and efficient use of the river and turning basin. In addition to the expansion of the turning basin (see Figure 14-13), the deep-water section of the river, north of the State Street Bridge, could benefit from additional width to allow for easier navigation and passing of large ships in the river as well as additional space for docks and transient parking. Furthermore, the current location of ferry service and the parking lot adjacent to it has been proposed as a river walk along with restaurants or cafés (see Image 14-14). This also includes a shopping center with other uses in order to utilize the west side of the riverfront to its maximum capacity. 133

148 Proposed Relocation of Ferry & Turning Basin Expansion Current Landuse US Coast Guard ive r Expanded width of river due to relocated parking US Coast Guard Vacant Parcel Vacant Parcel Ch eb oy ga nr Durocher Marine Proposed Turning Basin Existing Turning Basin Expanded CG Mooring Proposed POC Land US Oil Proposed Relocation of CG Drive Expanded Turning Basin Restoration of lawn, typical US Oil Ryba Marine Proposed Relocation of Ferry including: parking lot, building with plaza and sidewalk, dock for 2 ferry boats with easy access Spring 2012


149 Proposed Ferry Parking Lot Improvements Walstrom Marine Sta te Parking ive nr ga oy eb Riverwalk Ch Mixed Use Bldg. r Exst. Ferry & Parking Lot St. Gardens View from Bridge Restaurant View from South Spring 2012
150 The POC could also benefit by offering intermodal transportation, specifically by rail, to increase efficiency and decrease pollution, fossil fuel use and the costs per mile associated with over the road trucking. This option will not be as easy now since the old rail lines have now all been converted to recreational and multi-use trails. It appears the logical place to forge connections is Gaylord since there is rail still located there currently. It also makes sense to provide connections to both Rogers City and Alpena as well to promote regional rail and port use which will be beneficial to all. It has been noted by the Port of Cheboygan on their IRS Form 8718 as well as in the kickoff meeting that the MSU Practicum Team attended that the Port of Cheboygan could benefit in the future if a Foreign Trade Zone (FTZ) and Customs Office would be created in Cheboygan. The FTZ would allow for reduced costs for businesses in the form of saving s associated with taxes and fees of products and materials that they are importing/exporting. The establishment of a new Customs Office would be the first of northern Michigan and would increase efficiency for both the government and the shipping companies, so a cost savings again could be realized assuming that the port has established itself in the community and it is feasible. It has also been established by now that the Port of Cheboygan is operating as a 501(c)(4), a non-profit organization, as recommended to them by numerous sources originally to establish themselves in the market in a lower cost and risk method. We are suggesting in the future, based upon demand and viability, that the Port of Cheboygan expands its capabilities and services that it s able to provide by converting to a full port authority. There are numerous advantages of a port authority over their current status as a non-profit and they can be determined in the tables and information provided in the Michigan Ports A Policy Framework chapter. Business related We recommend that the City of Cheboygan expands the industrial park as needed to attract new industries to the City and to the Port. The recommendations and strategies that we compiled and published in this document are simply educated suggestions for NEMCOG and the POC to review and are intended to provoke thought and search for new ways to solve old problems and accomplish goals that may have seemed insurmountable in the past. It can be helpful to attain a fresh perspective on local issues from a new set of eyes as well as demographics and location, such as in our case on this regional port project. It has been a wonderful experience for all of us on the MSU 2012 practicum team due to the relationships formed and the new issues that we became knowledgeable on. We can only hope that we have stoked the collective fire and inspired you to strive for more and accomplish your dreams of building a successful port in the City of Cheboygan, the little known gem of the Northeast. 136
151 REFERENCES About Pellston Regional Airport. Pellston Airport Web. < AirportIQ Airport Master Records and Reports: Cheboygan County Airport. GCR (2010). Web. 4 Feb < American Fact Finder. Profile of Selected Economic Characteristics:2000: Cheboygan city, Michigan. US Census Bureau, Web. 31 Jan (Cheboygan City Economic Characteristics 2000) Alexander, Dave Port of Muskegon activity stable as community receives statewide attention. Muskegon Chronicle 30 Jan Online /01/ready_to_edit_2010_port_of_mus.html American Fact Finder. General Housing Characteristics:2010: Cheboygan city, Michigan. US Census Bureau, Web. 31 Jan (Cheboygan City General Housing 2010) American Fact Finder. Profile of General Population and Housing Characteristics:2010: Cheboygan City, Michigan. US Census Bureau, Web. 31 Jan (Cheboygan City General Population 2010) American Fact Finder. Profile of General Population and Housing Characteristics:2010: Cheboygan County, Michigan. US Census Bureau, Web. 31 Jan (Cheboygan County General Population 2010) American Fact Finder. Households and Families:2010: Cheboygan County, Michigan. US Census Bureau, Web. 31 Jan (Cheboygan County Households and Families 2010) American Fact Finder. Profile of Selected Social Characteristics:2000: Cheboygan County, Michigan. US Census Bureau, Web. 31 Jan (Cheboygan County Social Characteristics 2000) American Fact Finder. Profile of General Demographic Characteristics:2000: Cheboygan County, Michigan. US Census Bureau, Web. 31 Jan (Cheboygan County General Demographic 2000) American Fact Finder. Profile of Selected Economic Characteristics:2000: Cheboygan County, Michigan. US Census Bureau, Web. 31 Jan (Cheboygan County Economic Characteristics 2000) American Fact Finder. Educational Attainment:2000: Michigan. US Census Bureau, Web. 31 Jan (Michigan Education 2010) American Fact Finder. General Housing Characteristics 2000: Michigan. US Census Bureau, Web. 31 Jan (Michigan General Housing 2000) American Fact Finder. Profile of Selected Economic Characteristics: 2000: Michigan. US Census Bureau, Web. 31 Jan (Michigan Economic Characteristics 2000) 137
152 American Fact Finder. Profile of General Demographic Characteristics: 2000: Michigan. US Census Bureau, Web. 31 Jan (Michigan General Demographics 2000) American Fact Finder. Profile of General Demographic Characteristics: 2000: Michigan. US Census Bureau, Web. 31 Jan (Michigan General Demographics 2000) Bicycle Retailer and Industry News. Web. 04 Feb < "Bike Sharing Vendors: A to Z." Cyclingmobility 2 (June): Print. Capital Bikeshare. Web. 06 Feb < Cheboygan, City of. Riverfront Development Plan. Repot. City of Cheboygan: Planning Commission, Document. Cheboygan Economic Development Group. (2011). The Area. Retrieved from Cheboygan County. Cheboygan County Planning Commission. Cheboygan County Comprehensive Plan. Cheboygan County: Feb. 20, (Cheboygan County Comprehensive Plan) Cheboygan County. Cheboygan County Regional Plan City of Cheboygan. Cheboygan City Land Use Plan City of Cheboygan. City of Cheboygan Planning Commission. Land Use Plan. City of Cheboygan: (City of Cheboygan Land Use Plan) The Cheboygan Opera House. Cheboygan Opera House & The Cheboygan Area Arts Council, Web. March Cheboygan Village Marina. Cheboygan Village Marina, LLC, Web. March "Climate in Cheboygan, Michigan." Best Places to Live. Web. 21 Feb < "Climate Cheboygan - Michigan - Climate Graph." Climate. Web. 21 Feb < Company Owned Marine Fueling.US Oil, Web. 7 Feb Walstrom Marine Cheboygan. Walstrom Marine, Web. 7 Feb
153 Consumers Energy. Corporate Overview Web. < Detroit / Wayne County Port Authority. Date created: unknown. Detroit / Wayne County Port Authority. 24 Jan < Discover Heritage Route 23. (2011). About. Retrieved from DTE Energy. An Overview. DTE Web. < Economic Profiler Cheboygan County. (2011). Northern Lakes Economic Alliance. Cheboygan County. Retrieved from Fact Finder. Profile of Selected Economic Characteristics 2010: Michigan. US Census Bureau, Web. 31 Jan (Michigan Economic Characteristics 2010) Federal Aviation Administration. National Plan of Integrated Airport Systems. NPIAS (2010). Web. 4 Feb < Federal Highway Administration. The National Highway System. U.S. Department of Transportation (2011). Web. 3 Feb < Google Inc. Alger Rd. to M-27 N. / N Straits Highway. Google Maps (2012). Web. 5 Feb Google Inc. Map of US-223 N/US-23 N to Unknown Road. Google Maps (2012). Web. 5 Feb Great Lakes Commission. Summary of Great Lakes State Ballast Water Legislation. Ann Arbor: Great Lakes Commission. Jul Great Lakes Information Network. (1993). Economy. Overview. Retrieved from Great Lakes Information Network. (1993). The Great Lakes. Overview. Retrieved from Haines, Deb. "A Brief History of Cheboygan County." Cheboygan County MI Genealogy. MIGenWeb Project, 07 Dec Web. 09 Feb (Cheboygan County History) Hertel-Law-T. Stopcynski Port Authority Act, PA 639 of Michigan Legislature. 26 Jan pdf "Housing Vacancies and Homeownership - Definitions." Census Bureau Homepage. Census.gov, Web. 15 Feb (Housing Vacancies 2011) 139
154 John F. Kennedy Quotations. No date. John F. Kennedy Presidential Library and Museum. 24 Apr Kerr, John. Detroit/Wayne County Port Authority. Personal interview. 29 Jan Kerr, John. Detroit/Wayne County Port Authority. Personal interview. 29 Jan roguehaa. Detroit Port Authority Terminal Grand Opening. 8 Jul roguehaa. 29 Jan < Kerr, John. The Port Authority and its Value to the Community. Michigan Working Waterfront Conference. Detroit/Wayne County Port Authority. 17 Nov Michigan Department of Transportation. Straights Regional Ride Web. < Michigan Department of Transportation. Straights Regional Ride Web. < Michigan/Cheboygan Age Groups 2010 (also Median Age) "Michigan Trail Map & Directory." Map. Michigan Trails & Greenways Alliance. Web. 4 Feb < NEMCOG. Comprehensive Economic Development Strategy. Strategic Plan. NEMCOG, PDF. Northeast Michigan Council of Governments (NEMCOG), and Michigan Department of Transportation (MDOT). "Northeast Region: Road & Trail Bicycling Guide." Map. 2nd ed. Print. New Balance Hubway Your Bike Sharing System in Boston. Web. 06 Feb < Nice Ride MN - Home. Web. 06 Feb < North East Michigan Council of Government. (2010). About us. Retrieved from Northwest Michigan Council of Governments. 2010, 2000 Decennial Census, Cheboygan City. Northwest Michigan Council of Governments, 10 May Web. 30 Jan <(Cheboygan City NWMCOG Census 2010, 2000) Northwest Michigan Council of Governments. 2000, 1990 Decennial Census, Cheboygan City. Northwest Michigan Council of Governments, 10 May Web. 30 Jan (Cheboygan City NWMCOG Census 1990, 2000) 140
155 Northwest Michigan Council of Governments. 2010, 2000 Decennial Census, Cheboygan County. Northwest Michigan Council of Governments, 10 May Web. 30 Jan (Cheboygan County NWMCOG Census 2010, 2000) Northwest Michigan Council of Governments. 2000, 1990 Decennial Census, Cheboygan County. Northwest Michigan Council of Governments, 10 May Web. 30 Jan (Cheboygan County NWMCOG Census 1990, 2000) Northwest Michigan Council of Governments. Profiles from the 2000 and 1990 Decennial Census, Cheboygan City, Michigan. Northwest Michigan Council of Governments, 10 May Web. 30 Jan (Cheboygan City NWMCOG General Census 2000) Northwest Michigan Council of Governments. Profiles from the 2000 and 1990 Decennial Census, Cheboygan County, Michigan. Northwest Michigan Council of Governments, 10 May Web. 30 Jan (Cheboygan County NWMCOG General Census 2000) NYC Bike Share. Web. 06 Feb < Ocean and Coastal Management in Michigan. 4 Aug National Oceanic and Atmospheric Administration. 31 Jan Port Districts, Act 234 of Michigan Legislature. 26 Jan pdf. Port of Green Bay. (2012). About Us. Retrieved from Port of Green Bay. (2012). Business Opportunities. Retrieved from Port of Green Bay. (2012). Home Page. Retrieved frof Port of Green Bay. (2012). Turning Basin. Retrieved from Port of Monroe. Date published unavailable. Web. 7 Feb < > Port of Monroe. Date published unavailable. Web. 7 Feb Port of Muskegon. West Michigan Port Operators, Web. 29 Jan
156 Showalter, Stephanie. Michigan s New Ballast Water Regime: Navigating the Treacherous Waters of States Rights, Federal Preemption, and International Commerce. Sea Grant Law Center. October "SWOT Analysis." Investopedia. Web. 23 Mar < U.S. Census Bureau, 2010 Census, Demographic Profiles for Michigan. May 5, (Michigan Demographic Profile 2010) U.S. Census Bureau, 1990 Census, General Characteristics of Persons for Michigan. May 5, (Michigan General Characteristics 1990) U.S. Census Bureau, 1990 Census, General Characteristics of Housing Unit for Michigan. May 5, (Michigan General Housing 1990) U.S. Census Bureau, 1990 Census, Household, Family, and Group Quarters Characteristics for Michigan. May 5, (Michigan Household Characteristics 1990) U.S. Census Bureau, 1990 Census, Income and Poverty Status for Michigan. May 5, (Michigan Income 1990) U.S. Census Bureau, 1990 Census, Labor Force Characteristics for Michigan. May 5, (Michigan Labor 1990) U.S. Census Bureau, 1990 Census, Social Characteristics for Michigan. May 5, (Michigan Social Characteristics 1990) Water & Wastewater Departments. City of Cheboygan Water Department. City of Cheboygan Web. < "World Port Source - Port of Call Information for Port of Hamilton." World Port Source - Home Page. Web. 06 Feb < BMU_Port_of_Hamilton_1857.php>. "World Port Source - Port of Call Information for Port of Hamilton." World Port Source - Home Page. Web. 06 Feb < BMU_Port_of_Hamilton_1857.php> Zebra Mussels in the Great Lakes Region. (updated March 20, 2012). Great Lakes Information Network. March 20, < 142
157 CHAPTER 15 APPENDIX APPENDIX A PORT OF CHEBOYGAN BUSINESS SURVEY "Hello, my name is and I am a Michigan State University urban planning student working on a team of practicum students. We are partnering with NEMCOG, the Port of Cheboygan and the City of Cheboygan on a project to assess the potential of the port and recommending possible strategic actions to maximize this asset for the community to improve/upgrade the port facilities of Cheboygan. We are contacting the local businesses and major users of the current facilities to gather input on how they use the port and to determine what aspects function well and those that need improvements to further the efficiency and effectiveness of the port." SURVEY QUESTIONS: What do you currently use the port for? ie- pleasure craft, import/export, business asset Is the business port dependent? Yes / No What are the current limitations to the port and its setup? ie- depth, width, location, etc. Are there improvements that could be done to benefit your business or use of the port? Who are your clients that you serve? a) What are your products? b) What are their departure/destinations? If you import/export, what are the annual averages on amounts of materials? How much port related economic activity is generated by your business? 143
158 What do you envision the port looking like? ie- outdoor cafes along the water, more docks on the north side of the bridge, etc APPENDIX B Details of Bike Share programs in US. Table 15-1 United States Bike Share Programs Name of Program Location Population Number of bikes Number of stations Payment Options Annual usage Capital Bikeshare Washington, D.C. 601,723 1, hour $7 3-day $15 30-day $25 Annual $75 15,000 members NYC Bike Share New York 8,175,133 10, Daily fees Casual Registered N/A Nice Ride Minneapolis 382,578 1, hr $ day $ Year $60.00 Student 1 Year $50 217,530 trips Hubway Bikes Boston, MA 617, Hour $5 3 Day Casual $12 Annual Casual $85 130,000 rides 3,600 annual 30,000 casual Source: (Capital Bikeshare, NYC Bike Share, Nice Ride MN and The Hub Way) Case Study: Capital Bike Share in Washington D.C. Planning and implementation costs for Capital Bikeshare totaled $5 million, with additional first-year operating costs of US$2.3 million for 100 stations (Kaplan). The District's share of planning, implementation and first-year operating costs was partially financed by a $6 million grant by the United 144
159 States Department of Transportation. Arlington County's operating cost share of the plan was $835,000 for the first year, funded by public contributions including a grant from the Virginia Department of Rail and Public Transportation as well as subsidies from Arlington County Transportation, Crystal City Business Improvement District, and the Potomac Yard Transportation Management Association. In April 2011, Capital Bikeshare administrators said they expect earned revenue to cover 50% of the system's annual operating costs (Capital). The District of Columbia also plans to sell advertising on Capital Bikeshare stations with the goal of raising US$500,000 (Neibauer). Table 15-2 Capital Bike Share Operation Costs Station Size Equipment & Install 1st Year Monthly Operating 2nd Year Monthly Operating 3rd Year Monthly Operating 4thYear Monthly Operating 5thYear Monthly Operating 6 bikes & 11 docks $40,209 $1,156 $1,214 $1,275 $1,339 $1,406 8 bikes & 15 $48,387 $1,577 $1,656 $1,738 $1,825 $1, bikes & 19 docks 12 bikes & 23 docks $56,565 $1,997 $2,097 $2,202 $2,312 $2,428 $64,685 $2,418 $2,539 $2,666 $2,799 $2, bikes & 27 docks $72,687 $2,383 $2,980 $3,129 $3,286 $3,450 Source: ( 145
")
160 Figure 15-1 Possible locations of stations and cycle lanes Source: (Practicum Team 2012) 146
161 APPENDIX C IRS Form
162 148
163 149
164 150
165 151
166 152
167 153

168 154

169 155
170 156
171 157
172 158

173 159
The Port of Alpena: A Community Asset Inventory. Marc Coburn, Tatsuya Fukushige, Evan Gross, Corey Jackson, Mark Jones, and Elizabeth Masserang
 + The Port of Alpena: A Community Asset Inventory Marc Coburn, Tatsuya Fukushige, Evan Gross, Corey Jackson, Mark Jones, and Elizabeth Masserang + Introductions: Our Client Northeastern Michigan Council
Alpena Port & Community Asset Inventory
 Michigan State University: UP 494/894 Alpena Port & Community Asset Inventory Practicum Project: 2012 Prepared By: Marc Coburn, Tatsuya Fukushige, Evan Gross, Corey Jackson, Mark Jones, Elizabeth Masserang
2. POPULATION, LAND USE, AND SHORELINE DEVELOPMENT IN THE NORTH OLYMPIC COAST STUDY AREA
 2. POPULATION, LAND USE, AND SHORELINE DEVELOPMENT IN THE NORTH OLYMPIC COAST STUDY AREA Clallam County occupies a unique location at the northwest tip of the contiguous United States on the geographically
Waterfront Land Use. Michigan Coastal Community Working Waterfronts. Table of Contents. Case Studies
 Case Studies { Michigan Coastal Community Working Waterfronts Waterfront Land Use Table of Contents Land Use Analysis...2 Summary...4 Parcel Classification Summary...6 Figures and Tables Figure 1. Areas
2. POPULATION, LAND USE, AND SHORELINE DEVELOPMENT IN THE NORTH OLYMPIC COAST STUDY AREA
 Clallam County SMP Update - Inventory and Characterization Report 0 0 0. POPULATION, LAND USE, AND SHORELINE DEVELOPMENT IN THE NORTH OLYMPIC COAST STUDY AREA Clallam County occupies a unique location
CHAPTER 1 INTRODUCTION
 CHAPTER 1 INTRODUCTION CRYSTAL FALLS TOWNSHIP The image of a cold, snowy climate; a distant, northern, isolated location; and a dwindling economy are part of the folklore for Crystal Falls Township. In
Once known as warehousing and distribution, the process
 Map III-2.3 Proposed Agile Port Industrial Area AGILE PORT INDUSTRIAL AREA PLAN Once known as warehousing and distribution, the process of moving goods to market has evolved dramatically. No longer is
Port of Long Beach Port Master Plan Overview December 22, 2008
 Port of Long Beach Port Master Plan Overview December 22, 2008 PORT OF LONG BEACH PORT MASTER PLAN OVERVIEW INTRODUCTION In 1978 the California Coastal Commission certified the Port of Long Beach Port
Chapter 5 Transportation Draft
 Chapter 5 Transportation Draft Discussion Similar to the other elements in the Comprehensive Plan, the transportation element impacts the quality of life, economic development and public safety of the
Table 1: Population Growth, Area Percent Change ( ) Modoc 9,678 9,449 9, Alturas 3,190 2,890 2,
 Modoc 9,678 9,449 9, Alturas 3,190 2,890 2,") Economic Analysis Effects of Proposed Action Compared to No Action Alternative Information Sources Merchantable timber volumes for the economic appraisal were derived from inventory plot data that was
Economic Analysis Effects of Proposed Action Compared to No Action Alternative Information Sources Merchantable timber volumes for the economic appraisal were derived from inventory plot data that was
CITY OF EUCLID MASTER PLAN PUBLIC MEETING #1 CURRENT CONDITIONS & COMMUNITY VISION
 CITY OF EUCLID MASTER PLAN PUBLIC MEETING #1 CURRENT CONDITIONS & COMMUNITY VISION County Planning Team James Sonnhalter, Manager, Planning Services Patrick Hewitt, Senior Planner Alison Ball, Planner
Rural Transportation At A Glance
 Rural Transportation At A Glance Rural transportation has undergone significant changes over the last 15 years. The booming economy of the mid- to late 1990s, partly driven by expanded trade, has placed
SECTION V - STATE AND FEDERAL IMPLEMENTATION
 SECTION V - STATE AND FEDERAL IMPLEMENTATION A. State Actions Needed The State of New York is an active partner in the revitalization of the Buffalo LWRA. In addition to the ongoing implementation of the
RE-ISSUED NOTICE OF PREPARATION SUBSEQUENT ENVIRONMENTAL IMPACT REPORT
 RE-ISSUED NOTICE OF PREPARATION SUBSEQUENT ENVIRONMENTAL IMPACT REPORT Date: January 5, 2010 Subject: Re-Issue Notice of Intent to Prepare a Draft Subsequent Environmental Impact Report Project Title:
2 COMMUNITY P. average number of days with any measurable precipitation is 112. On average, there are 205 sunny days per year
 2 COMMUNITY P PROFILE Chapter 2 provides a profile of the City of Forest Hills planning area and identifies capabilities already in place in the city to help mitigate hazards addressed in this plan. 2.1
CHAPTER 3 LAND USE AND POPULATION
 CHAPTER 3 LAND USE AND POPULATION Introduction The Syracuse Metropolitan Transportation Council (SMTC) 2020 Long-Range Transportation Plan (LRTP) characterized land uses in the SMTC study area according
Public Notice. In Reply Refer To: Corps File No. LRE S18 Date: August 3, 2018 Expires: August 23, 2018
 US Army Corps of Engineers Detroit District Public Notice Applicant: Port of Monroe In Reply Refer To: Corps File No. LRE-2016-00098-5-S18 Date: August 3, 2018 Expires: August 23, 2018 Proposed Discharge
Providing local politically supported water access opportunities to the waterways of Virginia s Middle Peninsula
 Contact: Lewis Lawrence Title: Director of Regional Planning Affiliation: Middle Peninsula Planning District Commission Address: P.O. Box 286 Saluda, Virginia 23149 Email address: LLawrence@mppdc.com Phone:
2004 FEASIBILITY STUDY UPDATE
 Austin-San Antonio Intermunicipal Commuter Rail District 2004 FEASIBILITY STUDY UPDATE December 2004 EXECUTIVE SUMMARY INTRODUCTION Almost 3 million people in Central Texas, living and working between
Outcomes. Kelly Karll-SEMCOG Margaret Barondess - MDOT
 Eco-Logical: I-75 Corridor I-75 Conservation Transportation Action Planning in to Monroe Achieve County: Multiple Stormwater Environmental Considerations Outcomes Kelly Karll-SEMCOG Karll@semcog.org Margaret
CONTAINER PORT GOALS 10-2
 ten CONTAINER PORT CONTAINER PORT GOALS GOAL CP 1 Identify the core port and port-related container industrial area and protect the long-term function and viability of this area (see Figure 41, Core Area).
Greater Golden Horseshoe Transportation Plan
 Greater Golden Horseshoe Transportation Plan Transportation Profile Executive Summary October 2017 PREPARED BY Urban Strategies Inc. and HDR for the Ministry of Transportation TRANSPORTATION PROFILE -
Hiawatha: Your Great Lakes National Forest
 Outreach Lead Forestry Technician (Timber Sale Prep) Raco, Michigan HIAWATHA NATIONAL FOREST MARCH 29, 2013 Outreach Hiawatha National Forest will be filling a Lead Forestry Technician (Timber Sale Preparation)
Hiawatha: Your Great Lakes National Forest
 Outreach Lead Forestry Technician (Timber Sale Prep) Raco, Michigan HIAWATHA NATIONAL FOREST MARCH 29, 2013 Outreach Hiawatha National Forest will be filling a Lead Forestry Technician (Timber Sale Preparation)
Honorable Louise Slaughter
 NY-25 Honorable Louise Slaughter New York State 114th Congress 25th Congressional District & & 2 & 1, O&M, Irondequoit Harbor 2, O&M, Rochester Harbor 3, GI, Lake Ontario Coastal Resiliency 4, IIS, Braddock
America s Central Port is the St. Louis region s only full-service, public intermodal port. The 1,200-acre mixed-use business campus offers
 America s Central Port is the St. Louis region s only full-service, public intermodal port. The 1,200-acre mixed-use business campus offers development-ready industrial sites, over 1.7 million square feet
Waterways 1 Water Transportation History
 Waterways 1 Water Transportation History Water Transportation Propulsion History Human (oars, poles) - - 7,000-10,000 BC Wind (sails) - - 3,000 BC Steamboat invented - - 1787 AD First diesel-powered ship
HURON RIVER BOAT RAMP & PARKING LOT
 2010 National Award as Best Large Boating Access Facility States Organization for Boating Access (SOBA) 2010 Quality Asphalt Paving Awards Flexible Pavements of Ohio AWARD WINNING PROJECT Location Huron,
TRANSPORTATION 101 Today and Tomorrow. Moving People and Goods
 TRANSPORTATION 101 Today and Tomorrow Moving People and Goods What is the Transportation Commission? An independent, seven-member body of citizens appointed by the Governor for six-year terms and representing
Chapter 5 - Transportation
 Chapter 5 - Transportation Discussion Similar to the other elements in the Comprehensive Plan, the transportation element impacts the quality of life, economic development and public safety of the residents
NEW YORK TRANSPORTATION FACTS ECONOMIC IMPACTS
 The 2015 U.S. Transportation Construction Industry Profile: New York page 1 NEW YORK TRANSPORTATION FACTS ECONOMIC IMPACTS The design, construction and maintenance of transportation infrastructure in New
MEMORANDUM #4. DATE: November 4, Warrenton TSP Project Management Team. Ray Delahanty, AICP, DKS Associates Kate Petak, EIT, DKS Associates
 MEMORANDUM #4 DATE: November 4, 2015 TO: FROM: SUBJECT: Warrenton TSP Project Management Team Ray Delahanty, AICP, DKS Associates Kate Petak, EIT, DKS Associates Warrenton Transportation System Plan Update
STATEWIDE PORTS NEEDS AND MARKETING ASSESSMENT. Port of Amory
 STATEWIDE PORTS NEEDS AND MARKETING ASSESSMENT Port of Amory OCTOBER, 2014 PORT OF AMORY CONTENTS 3. Port of Amory 3-1 3.1. Location 3-1 3.2. Port Land and Facilities 3-5 3.3. Port Services 3-7 3.4. Typical
HARBOR INFRASTRUCTURE INVENTORIES Presque Isle Harbor, Michigan
 HARBOR INFRASTRUCTURE INVENTORIES Presque Isle Harbor, Michigan Harbor Location: Presque Isle Harbor is located on the south shore of Lake Superior near Marquette, MI. Authority: River & Harbor Acts of
HARBOR INFRASTRUCTURE INVENTORIES Oswego Harbor, New York
 HARBOR INFRASTRUCTURE INVENTORIES Oswego Harbor, New York Harbor Location: Oswego Harbor is located on the southern shore of Lake Erie at the mouth of the Oswego River, about 32 miles Northwest of Syracuse,
Niagara s Transportation Strategy 1. Introduction:
 Niagara s Transportation Strategy May 8, 2002 Niagara s Transportation Strategy 1. Introduction: Transportation is of pivotal importance in the development of Niagara. This, Niagara s first comprehensive
2009 Ohio Conference on Freight
 2009 Ohio Conference on Freight September 22, 2009 Hilton Toledo Inn The State of Ohio is an Equal Opportunity Employer and Provider of ADA Services. Mark Barbash Assistant Director and Chief Economic
US-2 is the busiest road in the Western Upper Peninsula outside of Houghton. Over 25,000 residents travel to the area for their grocery needs.
 US-2 is the busiest road in the Western Upper Peninsula outside of Houghton. Over 25,000 residents travel to the area for their grocery needs. This area has a very high market share that outperforms other
XI. Thornton Planning Area
 XI. A. OVERVIEW The covers 120 square miles in the northwest corner of San Joaquin County. It consists primarily of low-lying Delta islands, sloughs, and large farms. The town of Thornton, a small agriculturally-based
TRANSPORTATION AND ADAPTATION A Canadian Perspective. Elizabeth Smalley Manager, Adaptation Policy Transport Canada June 7-8, 2018
 TRANSPORTATION AND ADAPTATION A Canadian Perspective Elizabeth Smalley Manager, Adaptation Policy Transport Canada June 7-8, 2018 OVERVIEW 1 Canada s Transportation System 2 Climate Risks to the Canadian
Minnesota Statewide Freight System Plan Action Agenda Development Lead Agency (MnDOT or
 Economy What steps should be taken to ensure the freight system is used as a conduit for economic activity? E1 Intermodal and Intermodal and multimodal facility development to allow goods Multimodal Facilities
Ohio Department of Transportation Ohio Statewide Freight Study/ Plan
 Ohio Statewide Freight Study/ Plan Ohio Planning Conference July, 2014 Statewide Freight Plan Purpose: To understand to the greatest detail possible, how Ohio s freight infrastructure is being utilized.
Governor Baldacci s Transportation Bond Proposal
 Governor Baldacci s Transportation Bond Proposal Talking Points Highway and Bridge Investment The lifeblood of the Maine economy $100 HF Bond Maine s Bridges are old and getting older - Nearly 10% are
Public Notice October 21, 2016 U.S. Army Corps of Engineers Charleston District
 Public Notice October 21, 2016 U.S. Army Corps of Engineers Charleston District Notice of Intent to Prepare a Draft Environmental Impact Statement for the Proposed Jasper Ocean Terminal in Jasper County,
Chapter 3 - Goals, Objectives, & Strategies
 Chapter 3 - This chapter presents goals, objectives, and strategies that have been developed as part of the Richmond Area MPO 2026 Long-Range Transportation Plan (LRTP) update. Strategies have been developed
Environmental Setting
 Section 5.2 Environmental Justice This section describes the potential of the proposed changes to the approved project to result in disproportionately high and adverse health or environmental effects on
Ballard-Interbay MIC Summary Statistics
 BallardInterbay MIC Founded in 1869, the City of Seattle is the leading commercial, cultural and advanced technology center of the U.S. Pacific Northwest, and a major port city for transpacific and European
EIGHT PLANNING FACTORS
 EIGHT PLANNING FACTORS Under the provisions of SAFETEA-LU, all Metropolitan Planning Organizations (MPOs) are required to consider eight (8) broad planning factors in the development of multi-modal transportation
ECONOMIC IMPACTS. OF MARITIME SHIPPING in the GREAT LAKES - ST. LAWRENCE REGION EXECUTIVE SUMMARY JULY 2018 MARTIN ASSOCIATES LANCASTER, PA
 ECONOMIC IMPACTS OF MARITIME SHIPPING in the GREAT LAKES - ST. LAWRENCE REGION EXECUTIVE SUMMARY JULY 2018 MARTIN ASSOCIATES LANCASTER, PA Economic Impacts of Maritime Shipping in the Great Lakes-St. Lawrence
Texas Freight Mobility Plan. Chapter 1: Introduction
 Texas Freight Mobility Plan Chapter 1: Introduction Draft August 8, 2014 The Texas Freight Mobility Plan (the Freight Plan) gives Texas a road map for boosting our economic growth potential through a solid
PROJECTS. The KIPDA MPO s Central Location
 PROJECTS Freight The economy of the Louisville KY-IN) Metropolitan Planning Area MPA), similar to that of the United States as a whole, is largely dependent on the efficient, reliable, and safe movement
LAND USE POLICIES BY COMMUNITY DESIGNATION
 137 2040 138 Land Use Policies by Community Designation As discussed earlier in Thrive MSP 2040, the Council assigns a community designation to each city and township. This designation indicates the overall
MOBILITY 2045: A FOCUS ON TRANSPORTATION CHOICE:
 Mobility 2045: The Metropolitan Transportation Plan for North Central Texas is the defining vision for the multimodal transportation system in the Dallas- Fort Worth Metropolitan Planning Area. The plan,
PORT OF GREEN BAY Annual Report
 PORT OF GREEN BAY 2017 Annual Report 1 Message from the Director The Harbor Commission s 2015 strategic plan identifies strengths, weaknesses, opportunities and threats and assembles them into strategic
Centered on global trade.
 Centered on global trade. A world of customers and suppliers is as close as the Port of Little Rock. The Little Rock Port Authority (LRPA) was organized in 1959 to oversee the Port and provide intermodal
Section 5: Performance-Based Planning
 Section 5: Performance-Based Planning Mapping the Future: The Southwestern PA Plan establishes a performance-based foundation for regional transportation investment decisions consistent with MAP-21 1 guidance.
Transportation BUSINESS PLAN ACCOUNTABILITY STATEMENT
 Transportation BUSINESS PLAN 2003-06 ACCOUNTABILITY STATEMENT The for the three years commencing April 1, 2003 was prepared under my direction in accordance with the Government Accountability Act and the
Monmouth County Freight Profile
 Monmouth County Freight Profile 2040 Freight Industry Level Forecasts ABOUT THIS PROFILE The NJTPA has developed a set of alternative freight forecasts to support transportation, land use, and economic
Local Wetland Protection in a Changing Climate. Michigan Inland Lakes Convention May 1, 2014
 Local Wetland Protection in a Changing Climate Michigan Inland Lakes Convention May 1, 2014 LIAA is a Section 501(c)3 nonprofit corporation created in 1993 to stimulate & support greater civic engagement.
Chapter 1 Introduction
 Chapter 1 Introduction KEY POINTS The amount and value of freight are critical components of the overall economic health of Missouri. Missouri s multimodal freight system supports the movement of trucks,
The Three C s of Urban Transportation Planning
 The Three C s of Urban Transportation Planning Edward G. W etzel Engineer of Transportation Policy Port of New York Authority The need for continuing, comprehensive, urban transportation planning on a
Morris County Freight Profile
 Morris County Freight Profile 2040 Freight Industry Level Forecasts ABOUT THIS PROFILE The NJTPA has developed a set of alternative freight forecasts to support transportation, land use, and economic development
Climate Smart Cities: Healthy Connected Chattanooga
 Cool 29% Urban Heat Island Mapping Daytime Land Surface Temperature Hot Spots 33.0% This model identifies urban heat islands within Chattanooga city limits with elevated daytime land surface temperatures
Chapter 6: Land Use/Land Cover
 Chapter 6: Land Use/Land Cover The general historic land use pattern that emerged in Burt Township is similar to many other communities across the Upper Peninsula. Commercial fishing and lumbering were
PORTS AND THEIR USES
 PORTS AND THEIR USES NAMEPA s Mission Preserve and protect the marine environment Demonstrate maritime commitment to environmental protection and pollution prevention Support the marine industry Engage
DEVELOPMENT OPPORTUNITY
 Bank, Restaurant or Retail DEVELOPMENT OPPORTUNITY Skokie Boulevard Northbrook, IL contact: STEVEN BAER 847.412.9898 sbaer@metrocre.com 56 Skokie Valley Road n Highland Park, IL 60035 n 847.412.9898 main
METRO TRADE Regional Economies and the Role of Freight Transportation
 METRO TRADE Regional Economies and the Role of Freight Transportation @BrookingsMetro @adietomer Metropolitan Policy Program at BROOKINGS Minneapolis MN / December 4 Better Growth: We Need More Jobs Post-Recession
Ocean County Freight Profile
 Ocean County Freight Profile 2040 Freight Industry Level Forecasts ABOUT THIS PROFILE The NJTPA has developed a set of alternative freight forecasts to support transportation, land use, and economic development
Nevada s Logistics and Operations Sector
 Nevada s Logistics and Operations Sector Emsi Q4 2018 Data Set www.economicmodeling.com 1 Industry Summary for Logistics and Operations 85,353 32.5% $71,717 Jobs (2018) % Change (2010-2018) Avg. Earnings
TOWN OF ETTRICK Comprehensive Plan Trempealeau County, Wisconsin December 2017
 TOWN OF ETTRICK Comprehensive Plan 2017-2037 Trempealeau County, Wisconsin December 2017 MRRPC Prepared by the Mississippi River Regional Planning Commission and the Trempealeau County Department of Land
New York Metropolitan Transportation Council. Plan Regional Transportation Plan A Shared Vision for a Sustainable Region
 New York Metropolitan Transportation Council Plan 2040 Regional Transportation Plan A Shared Vision for a Sustainable Region ADOPTED ON SEPTEMBER 4, 2013 Disclaimer This document was funded in part through
2017 Freight System Plan
 2017 Freight System Plan Washington State Freight Advisory Committee (WAFAC) Meeting April 21, 2017 MP 1 Introductions WAFAC members are participating: at WSDOT headquarters (Olympia) over the phone MP
The Great Lakes. 35 million live in the basin (US and Canada). Regional production of
. Regional production of") 1 The Great Lakes 35 million live in the basin (US and Canada). Regional production of two trillion USD. Ontario parks located on the Great Lakes attract 11 million visitors a year. 2 The Great Lakes are
1 The Great Lakes 35 million live in the basin (US and Canada). Regional production of two trillion USD. Ontario parks located on the Great Lakes attract 11 million visitors a year. 2 The Great Lakes are
1.0 Introduction to Transportation Planning
 1.0 Introduction to Transportation Planning A good plan is like a road map: it shows the final destination and usually the best way to get there. H. Stanley Judd 1.1 Purpose Why is Transportation Planning
Appendix F: Scenario Planning
 Appendix F Scenario Planning Appendix F: Scenario Planning This technical memorandum discusses scenario planning, a visioning tool for the future of Missouri freight and freight planning. Why scenario
Industry Snapshot. Transportation, Distribution Logistics and Warehouse
 Industry Snapshot Transportation, Distribution Logistics and Warehouse Emsi Q2 2018 Data Set April 2018 Workforce Solutions for North Central Texas is an equal opportunity employer/program. Auxiliary aids
Project Application. General Information ODOT PID. Primary County (3 char abrv) HAM/CLE HAM/CLE HAM ODOT. District. Project Manager (Contact Person)
 HAM/CLE HAM/CLE HAM ODOT. District. Project Manager (Contact Person)") Current Status (Tier 1, Tier 2 or New) Proposed Status (Tier 1 or Tier 2) Tier 2 Tier 2 Project Application General Information ODOT PID 86462 86463 86461 Project Sponsoring Agency ODOT Project Manager
Current Status (Tier 1, Tier 2 or New) Proposed Status (Tier 1 or Tier 2) Tier 2 Tier 2 Project Application General Information ODOT PID 86462 86463 86461 Project Sponsoring Agency ODOT Project Manager
Hawthorne, Mineral County Nevada And the Intermountain West Corridor I-11
 Presentation by Mineral County Planning Commission Mark Nixon, Chairman Hawthorne, Mineral County Nevada And the Intermountain West Corridor I-11 1 The Hawthorne town site was founded in 1881 as a diversion
GENERAL PLAN CHAPTER 3.8, INFRASTRUCTURE
 Attachment D GENERAL PLAN CHAPTER 3.8, INFRASTRUCTURE Background- Senate Bill 244 (SB 244) requires that counties include in their Land Use Element identification and analysis of disadvantaged unincorporated
Summary of transportation-related goals and objectives from existing regional plans
 SMTC 2050 Long Range Transportation Plan Appendix A: Summary of transportation-related goals and objectives from existing regional plans SMTC 2050 Long Range Transportation Plan Summary of transportation-related
SECTOR ASSESSMENT (SUMMARY): LOGISTICS 1
: LOGISTICS 1") Chongqing Integrated Logistics Demonstration (RRP PRC 48024-002) SECTOR ASSESSMENT (SUMMARY): LOGISTICS 1 Sector Road Map 1. Sector Performance, Problems, and Opportunities 1. Logistics performance. Logistics
Chongqing Integrated Logistics Demonstration (RRP PRC 48024-002) SECTOR ASSESSMENT (SUMMARY): LOGISTICS 1 Sector Road Map 1. Sector Performance, Problems, and Opportunities 1. Logistics performance. Logistics
Williamsport Area Transportation Study Metropolitan Planning Organization
 Williamsport Area Transportation Study Metropolitan Planning Organization LONG RANGE TRANSPORTATION PLAN 2018-2038 CHAPTER 1 INTRODUCTION Purpose of a Long Range Transportation Plan Transportation infrastructure
EXECUTIVE SUMMARY REGIONAL TRANSPORTATION PLAN 2050
 EXECUTIVE SUMMARY REGIONAL TRANSPORTATION PLAN 2050 Introduction Goals Policies, and Performance Measures Growth Forecast and Planned Land Use Development Key Recommendations i Executive Summary April
EXCLUSIVELY AVAILABLE!! PRICE: $1,600,000. LKY Advisor s, LLC. Property Description
 Former Bank HQ & Data Center w/ Drive-Thru LOCATION: 2031 W. Camelback Rd., Phoenix, AZ 85015 Property Description Building Size: +/- 16,503 SF Lot Size: +/- 43,560 SF Zoning: C-2 (City of Phoenix) 2014
UPPER NORTH FORK FEATHER RIVER PROJECT FERC NO
 UPPER NORTH FORK FEATHER RIVER PROJECT Pacific Gas & Electric Company ) ) ) ) FERC NO. 2105-089 Magalie Roman Salas, Secretary Federal Energy Regulatory Commission 888 First Street, NE Washington, DC 20426
Notice No Closing Date: May 2, 2015
 Public Notice U.S. Army Corps of Engineers Pittsburgh District In Reply Refer to Notice No. below US Army Corps of Engineers, Pittsburgh District 1000 Liberty Avenue Pittsburgh, PA 15222-4186 Application
Port of New Bedford. AAPA Commissioners Seminar May 17, 2011 Prosperity through Economic Development Opportunities
 Port of New Bedford AAPA Commissioners Seminar May 17, 2011 Prosperity through Economic Development Opportunities Port of New Bedford, Massachusetts Niche Port You are here Connected to Global Markets
Town of Wheatfield Local Waterfront Revitalization Program
 Town of Wheatfield Local Waterfront Revitalization Program Adopted: Town of Wheatfield Town Board, March 25, 2013 Approved: NYS Secretary of State, February 25, 2014 Concurred: U.S. Office of Ocean and
(1)(A)Inventory of the following existing natural resources on the USFSP Campus or within the context area adjacent to the University.
(A)Inventory of the following existing natural resources on the USFSP Campus or within the context area adjacent to the University.") 13. 6C-21.208 CONSERVATION ELEMENT Information Sources George F. Young, Interview notes, June 2002 Sasaki Associates, Inc., interview notes, April, 2000 Interviews between DRMP Staff and USF Staff, May,
13. 6C-21.208 CONSERVATION ELEMENT Information Sources George F. Young, Interview notes, June 2002 Sasaki Associates, Inc., interview notes, April, 2000 Interviews between DRMP Staff and USF Staff, May,
PennDOT Office of Planning
 Every Voice Counts PennDOT Office of Planning Environmental Justice Plan Executive Summary Developed for: Pennsylvania Department of Transportation Office of Planning Center for Program Development and
Will County Freight Advisory Council Meeting. April 11, 2017
 Will County Freight Advisory Council Meeting April 11, 2017 1 Agenda Summary of Last Meeting Plan Progress and Update Performance Measures Break-Out Discussion Projects and Project Evaluation Criteria
Transform Milwaukee. Section 8 Freight Transportation and Logistics. Summary Findings
 Transform Milwaukee Section 8 Freight Transportation and Logistics Summary Findings Freight Originating in the Milwaukee CSA 2011 Estimates to 2040 Projections Mode 1000 s of Tons in 2011 1000 s of Tons
Appendix M. Criteria, Measures and Indicators for Effects Assessment
 Appendix M Criteria, Measures and Indicators for Effects Assessment Appendix M. Criteria, Measures and Indicators for Effects Assessment Objective 1: Naturalization Changes to Aquatic Habitat Disruption,
GP_ DISADVANTAGED UNINCORPORATED COMMUNITIES ASSESSMENT
 COUNTY OF MENDOCINO DEPARTMENT OF PLANNING AND BUILDING SERVICES 860 NORTH BUSH STREET UKIAH CALIFORNIA 95482 120 WEST FIR STREET FT. BRAGG CALIFORNIA 95437 STEVE DUNNICLIFF, DIRECTOR PHONE: 707-234-6650
Diesel and Heavy Equipment Technician Occupation Overview
 Diesel and Heavy Equipment Technician Occupation Overview Emsi Q1 2018 Data Set March 2018 Western Technical College 400 Seventh Street La Crosse, Wisconsin 54601 608.785.9200 Emsi Q1 2018 Data Set www.economicmodeling.com
3.8 SOCIOECONOMICS AND ENVIRONMENTAL JUSTICE
 3.8 SOCIOECONOMICS AND ENVIRONMENTAL JUSTICE 3.8.1 INTRODUCTION This section evaluates effects related to socioeconomics and environmental justice (as required under Executive Order [EO] 12898, Federal
Indirect and Cumulative Effects
 Chapter 21: Indirect and Cumulative Effects 21-1 INTRODUCTION The federal Council on Environmental Quality s (CEQ) regulations implementing the procedural provisions of the National Environmental Policy
Duluth-Superior Harbor Planning: A Model for Stakeholder Collaboration
 Duluth-Superior Harbor Planning: A Model for Stakeholder Collaboration Ron Chicka, Director Duluth-Superior Metropolitan Interstate Council TRB ADC-60 July 19, 2017 DECC Duluth, MN Harbor Technical Advisory
Innovation and Economic Development Advisory Group Report to Steering Committee May 29, 2015
 Innovation and Economic Development Advisory Group Report to Steering Committee May 29, 2015 Advisory Group membership Advisory Group Members The Honorable Doug Smith, Commissioner, Martin County (representing
Inland Waterway Navigation
 Inland Waterway Navigation Value of Inland Navigation As the sun rises over the Mississippi River a 15-barge tow slides slowly past the St. Louis Harbor and heads south to New Orleans where its cargo of