The effect of composition and temperature on the deformation behaviour of magnesium-aluminium binary alloys
|
|
|
- Alice Gilbert
- 6 years ago
- Views:
Transcription
1 The effect of composition and temperature on the deformation behaviour of magnesium-aluminium binary alloys by Ajay Kumar Mahato A Thesis Submitted in Fulfilment of the Requirements for the Degree of Doctor of Philosophy Institute of Frontier Materials Deakin University January 2016
2 DEAKIN UNIVERSITY ACCESS TO THESIS - A I am the author of the thesis entitled The effect of composition and temperature on the deformation behaviour of magnesium-aluminium binary alloys submitted for the degree of Doctor of Philosophy. This thesis may be made available for consultation, loan and limited copying in accordance with the Copyright Act 'I certify that I am the student named below and that the information provided in the form is correct' Full Name: Ajay Kumar Mahato.... (Please Print) Date: 01/02/

 are not in any way a violation or infringement of any co")
3 DEAKIN UNIVERSITY CANDIDATE DECLARATION I certify the following about the thesis entitled The effect of composition and temperature on the deformation behaviour of magnesium-aluminium binary alloys submitted for the degree of Doctor of Philosophy a. I am the creator of all or part of the whole work(s) (including content and layout) and that where reference is made to the work of others, due acknowledgment is given. b. The work(s) are not in any way a violation or infringement of any copyright, trademark, patent, or other rights whatsoever of any person. c. That if the work(s) have been commissioned, sponsored or supported by any organisation, I have fulfilled all of the obligations required by such contract or agreement. d. That any material in the thesis which has been accepted for a degree or diploma by any university or institution is identified in the text. e. All research integrity requirements have been complied with. 'I certify that I am the student named below and that the information provided in the form is correct' Full Name: Ajay Kumar Mahato.... (Please Print) Date: 01/02/
4 ABSTRACT Magnesium alloys suffer poor formability, particularly at room temperature. However, there is lack of understanding of how alloying additions affect the individual deformation modes of basal slip, non-basal slip and twinning. The present work is aimed at developing new knowledge of how alloying additions influence the properties of wrought magnesium alloys. In the present work, the effect of Al concentration was examined by using both tension and compression testing at -78 C, room temperature and 200 C. Six binary alloys were produced, and each was processed such that they all contained similar grain sizes and textures. Therefore, any change in the deformation behaviour can be attributed directly to the difference in composition. Visco-Plastic Self-Consistent Modelling was also used to assist in quantifying the critical resolved shear stress for the different modes. Mechanical testing showed that for three of the four test orientations, the yield point increased with increasing Al concentration. For one test type, in specimens cut at 45 from rolled plate, yielding remained unchanged with Al concentration. Increasing the deformation temperature produced a marked decrease in the flow stress and also increased the elongation at failure. Aluminium concentration had minimal effect on the tensile ductility. Ductility is known to be strongly influenced by grain size and texture in magnesium alloys. Since the starting materials used in this study were all processed to have similar grain sizes and textures, they all therefore showed very similar ductility s when tested in tension. It was concluded from these results that solutes do not appear to markedly effect the tensile ductility of magnesium alloys. An initial estimation of the critical resolved shear stress (CRSS) for each individual deformation mode was made by multiplying the Schmid factor by the yield point for the relevant test type. These estimates were used to guide VPSC simulations. These VPSC simulations were used to quantify the CRSS values. At all Al concentrations, the <c+a> slip system shows the highest CRSS values, followed by prismatic slip and twinning. Basal slip had the lowest CRSS value.
5 Increasing the deformation temperature caused a significant drop in the CRSS for the prismatic and <c+a> slip systems because these are thermally activated deformation modes that rely on cross-slip mechanisms for dislocation propagation. There was no significant effect of temperature on the CRSS values of twinning or basal slip. The effect of aluminium concentration was quite different for the three slip modes. Al did not harden the basal slip system, but did increase the CRSS for the two non-basal slip modes. Solute hardening of the twin system was also observed. Specimens deformed at 200 C were observed to exhibit dynamic recrystallization (DREX). It was found that that the volume fraction of DREX decreased with increasing Al concentration. Also, a smaller DREX grain size is observed with increasing solute content. The solute drag pressure was found to increase with an increase in Al concentration, and this was concluded to be the main cause of the decrease in volume fraction of DREX in more concentrated alloys. Solute drag can effect both nucleation and growth processes during DREX. However, in the current study, it was found that nucleation at grain boundaries is prolific even at high Al concentrations. Therefore, in the present case it is concluded that solutes hinder the growth of DREX grains, but do not appear to hinder their nucleation at the grain boundaries. This thesis examined the mechanical properties of Mg-Al alloys ranging in composition from 0.2 wt% Al to 5.0 wt% Al. This series of alloys was used to understand the solute hardening effects on the CRSS of the individual slip and twinning modes. Three temperatures were tested, -78 C, 25 C and 200 C. At the highest deformation temperature (200 C) dynamic recrystallization was observed, and the magnitude of the effect of Al concentration and flow stress on this phenomena was also studied.
6 ACKNOWLEDGEMENT I would like to sincerely thank all who have contributed towards the completion of this thesis. Firstly, a big thanks to, A/Prof. Nicole Stanford, for the enormous support and help throughout and providing me every fraction of opportunity to learn. I would like to thank My Supervisors Prof. Matthew Barnett and Prof. Peter Hodgson for the support given to me. I would like to thank the technical staff at Deakin University; David Gray for casting the alloys for experiments, Lynton Leigh for hot rolling of alloys, Alex for helping me to cut the samples, Katrina Robertson for helping with metallography and Dr. Andrew Sullivan for SEM and EBSD assistance. My sincere and special thanks to Ricardo Lebensohn and Carlos Tome for providing the VPSC code for modelling. Also, I would like to acknowledge all of the students I have had the privilege to work with at Deakin University. I am grateful for the support and encouragement of my parents and brothers, in particular to my mother for always motivating me. Finally, I am greatly indebted to my wife Rupinder and loving son Jay, who supported me in all aspect. It s their love and support that has helped me to complete this thesis.
7 Contents List of Figures... 9 List of Tables Literature review Introduction Crystallographic structure of magnesium Deformation mechanisms in magnesium Deformation by slip Deformation by twinning Representation of texture in hcp materials Mechanical behaviour of single crystals Deformation of single crystal oriented for basal <a> slip Deformation of single crystal oriented for prismatic <a> slip Deformation of single crystal oriented for pyramidal <c+a> slip Deformation of single crystal oriented for twinning Effect of temperature on CRSS in single crystals Solute hardening effects in single crystals Solid solution strengthening of Basal Slip Solute hardening of Prismatic Slip Mechanical behaviour of polycrystals Effect of texture Solute hardening effects in polycrystals Effect of temperature on polycrystal deformation Polycrystal plasticity modelling Dynamic recrystallization during hot deformation of magnesium Effect of solute on DREX Summary and scope of thesis Experimental Methodology Alloy composition and preparation Material preparation Recrystallization and grain size studies X-ray diffraction (XRD) Mechanical testing Tension Compression testing... 60
8 2.5.3 Determination of yield point Electron Backscattered Diffraction Experimental results Introduction Mechanical behaviour in tension Effect of temperature on tensile behaviour Mechanical behaviour of RD compression Mechanical behaviour of ND compression Mechanical behaviour of 45 samples in compression Microstructural Examination Texture measurement of starting materials Deformed microstructures Effect of aluminium concentration on twinning Discussion on mechanical behaviour Review of mechanical test data Tensile deformation to activate prismatic slip RD compression to activate twinning ND compression to activate pyramidal slip compression to activate basal slip Comparison of different deformation modes with varying solute concentration Effect of temperature on prismatic slip Effect of temperature on twinning The effect of temperature on <c+a> pyramidal slip Effect of temperature on basal slip Comparison of the different deformation modes at different temperatures Visco Plastic Self Consistent modelling Starting point for the VPSC model Tensile deformation to activate prismatic slip <a> axis compression to activate twinning c- axis compression to activate <c+a> slip Comparison of the different deformation modes Comparison of experimental and simulated CRSS values Discussion on Dynamic Recrystallization Effect of solute drag on dynamic recrystallization General Conclusions References
9 List of Figures Figure 1. 1 Ashby plot showing the density and strengths of common materials[4] Figure 1. 2 The hexagonal unit cell [21] Figure 1. 3 Common Slip modes seen in magnesium [6, 21, 30, 31]. Note that the dashed lines Figure 1. 4 A figure for explaining the critical resolved shear stress equation [36] Figure 1. 5 Deformation mechanisms for a single crystal subjected to shear stress τ (a) Slip Figure 1. 6 Common twin planes seen in magnesium[31] Figure 1. 7 Variation of twinning shear with the c/a ratio for various twinning modes in HCP metals [43] Figure 1. 8 Twinning stress as function of temperature for single crystals and polycrystals [52] Figure 1. 9 (a) Euler angle rotations according to Bunge s convention and (b) crystal Figure Ideal pole figures for magnesium (c/a = 1.624) [59, 61, 62] Figure Stress-strain curve for Mg single crystals oriented for basal slip [11, 65-67] Figure CRSS for glide on prismatic planes (P) and basal planes (B) for comparison Figure Stress-strain curves for magnesium single crystals oriented for {11222} <111123> Figure Stress-true strain curves for compression Mg crystals along [10110] [66, 67] Figure Stress-strain curves in pure magnesium single compressed along<10110> Figure Reported CRSS data for basal slip in pure Mg single crystals [11, 66, 71, 74-76] Figure Reported CRSS data for prismatic slip in pure Mg single crystals [12, 66, 68, 69, 77, 78] Figure Reported CRSS data for pyramidal slip in pure Mg single crystals [66, 72] Figure Reported CRSS data for tension twinning in pure Mg single crystals [64, 66, 79] Figure Mechanisms for cross slip of basal dislocations onto prismatic planes Figure The increase of CRSS for basal slip with solute concentration at room Figure CRSS for prismatic slip with Zn concentration [12] Figure Stress - Strain curves of (a) pure magnesium single crystal and (b) textured pure Figure , 5, 10 % yield loci for biaxial stresses in textured pure magnesium [79] Figure Yield loci for magnesium alloys (a) ZM61 (solution treated), (b) ZM61 (aged), Figure Effect of Zn concentration on the stress to activate prismatic slip for different Figure (a) Effect of atom concentration on the hardness (The dashed lines and solid Figure (a) Effect of temperature on R-value, Figure Stages of microstructural evolution during DRX [110] Figure SIBM mechanism in aluminium (a) SIBM of a boundary separating a grain of Figure A TEM micrograph showing the bulging of grain boundary in Mg-3Al-1Zn Figure Sketches of grain boundary nucleation processes at (a) 423 K, (b) K and Figure Schematic diagram of TDRX mechanism due to twin intersection (a) secondary Figure Figure showing (a) EBSD map of recrystallized twins and tensile twins, (b) High Figure Optical image showing PSN in rolled magnesium sheet [122, 123] Figure (a) Effect of Cu and Mg solutes on the growth rate of new grains in deformed Al, Figure 2. 1 As cast alloy of Mg-Al with 0.2 wt% Al.. 54 Figure 2. 2 Mg-Al Phase diagram [138]. 55 Figure 2. 3 Optical micrograph of 0.2 wt% Al 57 Figure 2. 4 Annealing temperature to achieve a standard grain size of (22 ± 3) μm.. 57 Figure 2. 5 Experimental setup on an X-ray diffraction system to measure intial texture.. 58 Figure 2. 6 Geometry of Tensile specimens Figure 2. 7 Set up to measure the temperature gradient across a tensile specimen 60
10 Figure 2. 8 Compression rig for low temperature (-78 C) testing. 61 Figure 2. 9 Compression rig for high temperature testing.. 62 Figure Schematic representation of compression sample orientation and dimensions cut from the rolled sheets Figure Method for calculation yield point during compression along 45 to activate basal slip Figure Experimental setup of EBSD system [139] 65 Figure Bunge s Euler angles [36].. 66 Figure 3. 1 Flow curves for the 0.2 wt% Al Figure 3. 2 Flow curves for the 0.5 wt% Al Figure 3. 3 Flow curves for the 1.0 wt% Al Figure 3. 4 Flow curves for the 2.0 wt% Al Figure 3. 5 Flow curves for the 3.0 wt% Al Figure 3. 6 Flow curves for the 5.0 wt% Al Figure 3. 7 Effect of temperature on mechanical behaviour in tension Figure 3. 8 Temperature dependence of yielding in tension Figure 3. 9 Alloying effect on yielding in tension Figure Effect of temperature on (a) ductility and (b) uniform elongation Figure Alloying effect on (a) total elongation and (b) uniform elongation at different Figure Flow curves for the 0.2 wt% Al Figure Flow curves for the 0.5 wt% Al Figure Flow curves for the 1.0 wt% Al Figure Flow curves for the 2.0 wt% Al Figure Flow curves for the 3.0 wt% Al Figure Flow curves for the 5.0 wt% Al Figure Alloying effect on yielding defined by twinning Figure Temperature dependence of yielding defined by twinning Figure Flow curves for the 0.2 wt% Al Figure Flow curves for the 0.5 wt% Al Figure Flow curves for the 1.0 wt% Al Figure Flow curves for the 2.0 wt% Al Figure Flow curves for the 3.0 wt% Al Figure Flow curves for the 5.0 wt% Al Figure Alloying effect on (a) yielding defined by <c+a> slip and (b) maximum compressive strength at different temperatures Figure Effect of temperature on (a) yielding and maximum compressive strength for various Al concentration Figure Flow curves for the 0.2 wt% Al Figure Flow curves for the 0.5 wt% Al Figure Flow curves for the 1.0 wt% Al Figure Flow curves for the 2.0 wt% Al Figure Flow curves for the 3.0 wt% Al Figure Flow curves for the 5.0 wt% Al Figure Alloying effect on (a) yielding and (b) maximum compressive strength at Figure Effect of temperature on (a) yielding and (b) maximum compressive strength for Figure Texture measurement for various alloys using X-ray diffraction system Figure Pole plot for the six alloys showing the similarity in their textures Figure Optical micrographs of crystals oriented for twinning Figure Optical micrographs of crystals oriented for basal slip Figure Optical micrographs of crystals oriented for <c+a> slip Figure Optical micrograph of (a) 5.0 wt% and (b) 0.2 wt% Al compressed along the Figure Evidence of DRX for 5.0 wt% Al at 25% strain Figure Stress-strain curves for interrupted compression tests at different strains Figure Optical micrographs of interrupted compression tests at varying strains Figure EBSD analysis showing volume fraction of twins for 0.2 wt% Al at different strains Figure EBSD analysis showing volume fraction of twins for 5.0 wt% Al at different strains Figure Effect of (a) compressive strain and (b) Al concentration, on volume fractions of Figure 4. 1 Effect of aluminium concentration on yield strength at -78 C Figure 4. 2 Effect of aluminium concentration on yield strength at room temperature Figure 4. 3 Effect of aluminium concentration on yield strength at 200 C
11 Figure 4. 4 (a) Comparison of CRSS versus C 1/2 for current data with Literature Figure 4. 5 Alloying effect on yielding defined by twinning estimated from experimental Figure 4. 6 Alloying effect on maximum compressive strength at different temperatures Figure 4. 7 Alloying effect on volume fractions of twins during compression Figure 4. 8 Comparison of CRSS versus C 1/2 for current data Figure 4. 9 Alloying effect on maximum strength and yield point at (a) -78 C, (b) RT and (c) 200 C Figure Comparison of basal CRSS values from the present data against those from literature for different Al concentrations Figure Estimated CRSS values of slip and twinning systems at (a) room temperature and Figure Effect of temperature on the ease of prismatic slip during tension in pure Mg Figure Variation of total elongation with temperature [147] Figure Variation of uniform elongation with temperature [147] Figure Effect of temperature on the ease of twinning during <a> axis compression Figure Effect of temperature on the ease of <c+a> slip during <c> axis compression Figure Effect of temperature on the ease of basal slip during compression Figure Estimated CRSS of slip and twinning systems in (a) 0.2 wt% Al and (b) 5.0 wt% Al Figure Comparison of τ twin / τ basal Figure Schematic representation of parameters governing Voce-type hardening law Figure Comparison of experimental flow curves and VPSC simulation results for alloys Figure Comparison of experimental flow curves and VPSC simulation results for alloys Figure Comparison of experimental yield strength values for prismatic slip with the Figure Predicted slip activities during tensile deformation at (a) room temp (b) 200 C Figure Comparison of experimental flow curves and VPSC simulation results for alloys Figure Comparison of experimental flow curves and VPSC simulation results for alloys Figure Comparison of experimental yield strength values for twinning with the Figure Predicted twinning and slip activities during <a> axis compression at (a) room Figure Comparison of experimental flow curves and VPSC simulation results for alloys Figure Comparison of experimental flow curves and VPSC simulation results for alloys Figure Comparison of experimental yield strength values for <c+a> slip with the Figure Predicted slip activities during tensile deformation at (a) room temp (b) 200 C Figure Initial τ 0 values of slip and twinning systems at (a) room temperature and Figure Comparison of simulated CRSS values with the experimental CRSS values for each Figure Comparison of simulated CRSS values with the experimental CRSS values for values Figure 5. 1 Alloying effect on (a) volume fraction of DRX grains and (b) DRX grain size Figure 5. 2 The relationship between DRX grain size and flow stress at higher temperature [155] Figure 5. 3 Assumed variation of solute diffusivity and free energy of segregation with the Figure 5. 4 Predicted solute drag pressure as a function of solute concentration for atomic Figure 5. 5 Comparison of solute drag pressure during equilibrium segregation with Figure 5. 6 DRX for 5.0 wt % Al at 25% strain
12 List of Tables Table 1. 1 Physical properties of light metals[2, 5, 6] Table 1. 2 CRSS values reported for AZ31 magnesium alloy [30, 100, ] Table 2. 1 Composition of Mg-Al alloy with Al (wt %) Table 3. 1 Values of DRX grain size, stress, uniform strain and volume fraction of DRX grains Table 5. 1 Values of parameters used in the calculations of solute drag pressure under
13 Chapter 1. Literature review 13 Chapter 1 Literature review
14 Chapter 1. Literature review Introduction The low density of magnesium makes it an attractive candidate for use in the automobile and aviation sectors[1-3]. The density of magnesium (1.74 g/cm 3 ) is one fifth as compared to Iron and two-third as compared to aluminium. It is thus the least dense of the structural metals (see Figure 1.1). Magnesium can therefore reduce weight, improve automotive fuel efficiency and help in Green House gas savings. Figure 1. 1 Ashby plot showing the density and strengths of common materials[4]. Magnesium is highlighted in red. Table 1.1 shows the physical properties of light metals. The density of magnesium is 1.74 g/cm 3 which is two thirds of that of aluminium. Moreover, the Young s modulus and the shear modulus of magnesium are two thirds of those of aluminium.
15 Chapter 1. Literature review 15 Metal Lattice Structure Table 1. 1 Physical properties of light metals[2, 5, 6] Magnesium has moderate strength (Figure 1.1) and is rarely used in its pure form. Its strength is found to improve with solid solution hardening (hardness improved as a result of alloying [7]), precipitation strengthening (strengthening mechanism as a result of particles blocking dislocation motion [8]) and work hardening (strengthening of a material as a result of plastic deformation [9]). A range of studies have been done in the past on the role of alloying additions in magnesium [10-19]. Al and Zn are the most commonly used alloying elements [11-13, 17]. Despite the popularity of Al as a strengthening alloying addition in magnesium, the effect of this element on the properties of wrought material is poorly understood. Therefore, the present work examines the effect of Al additions on wrought magnesium with the objective of measuring solid solution hardening of basal slip, prismatic slip, pyramidal slip and {101 2} twinning. The effect of deformation temperature will also be examined. 1.2 Crystallographic structure of magnesium Young s modulus (GPa) Shear Modulus (GPa) Density (g/cm 3 ) Mg HCP Al FCC Ti HCP The crystal structure of magnesium is hexagonal closed packed (hcp) shown schematically in Figure 1.2. Planes and directions of the hcp lattice are described using the Miller-Bravais indices which relates to a coordinate system of three basal vectors (ai) and a longitudinal axis called the c-axis [20].The hexagonal unit cell has axes a1=a2=a3 c, and angles α=β=90⁰, γ=120⁰. In magnesium the c/a ratio is This is close to the lattice parameters (c/a) for the ideal packing arrangement in hcp unit cell,
![Chapter 1. Literature review 16 Figure 1. 2 The hexagonal unit cell [21] 1.3](/docs-images/77/76606399/images/16-0.jpg "Deformation mechanisms in magnesium 1.3.")
16 Chapter 1. Literature review 16 Figure 1. 2 The hexagonal unit cell [21] 1.3 Deformation mechanisms in magnesium Deformation by slip Crystallographic slip occurs due to the sliding of a particular crystallographic plane over a neighbouring plane in a specific crystallographic direction. This typically occurs on the close packed planes and in the close packed directions [22]. The orientation of the atomic lattice remains the same after slip. Basal {0001}, prismatic {101 0}, first order pyramidal {101 1} and second order pyramidal {112 2} slip are different modes of slip (see Figure 1.3) [23]. Each has a number of systems (combinations of slip planes and directions) that can operate. It is generally agreed that basal slip is the softest mechanism with the activation of other slip systems depending on the temperature and stress level [23]. A schematic illustration of the slip modes is shown in Figure 1.3. Basal slip occurs on the (0001) basal plane in the <12 10> direction. Prismatic slip occurs on the {101 0} planes in the <12 10> direction. Pyramidal slip occurs on {11 01} the planes in the <112 0> direction and second order pyramidal slip occurs on the {12 12} planes in the <12 13 > direction [22]. According to Von Mises, five independent slip systems are required by a material to deform to an arbitrary shape [24]. The main slip mode for magnesium and its alloys is basal slip [25]. Since basal slip provides only three independent slip systems [26], it becomes necessary to activate non-basal slip modes to accommodate shape change [27, 28]. The non-basal modes are activated at higher stresses and at higher
17 Chapter 1. Literature review 17 temperatures [29]. These additional slip systems aid towards the ductility of magnesium. Ductility is a measure of the ability of the material to withstand strain. It is usually defined by the strain or elongation to failure, or the reduction in area at failure. Figure 1. 3 Common Slip modes seen in magnesium [6, 21, 30, 31]. Note that the dashed lines highlight the slip planes and arrows indicate the slip direction Slip occurs when the resolved shear stress reaches a critical value, the critical resolved shear stress (CRSS) [32]. The resolved shear stress for uniaxial loading can be given as [33-35]: ττ ss σσ nn = cccccc φφ. cccccc λλ [Equation-1] Where, τ s is the resolved shear stress acting on the slip plane in the slip direction, σ n is the applied stress, φ is the angle between the stress axis and the slip plane normal, and λ is the angle between the stress axis and the slip direction (see Figure 1.4).
18 Chapter 1. Literature review 18 Figure 1. 4 A figure for explaining the critical resolved shear stress equation [36] Since the orientation of different slip systems vary with respect to the stress axis, each slip system can have different resolved shear stress acting on it Deformation by twinning Mechanical twinning is an important mode of plastic deformation in magnesium and its alloys. Twinning results in the reorientation of the atomic lattice across the twin plane [37]. It occurs due to the atomic shuffle and shear of a block of atoms to a new position forming a mirror image of the parent lattice as shown in Figure 1.5.
19 Chapter 1. Literature review 19 Figure 1. 5 Deformation mechanisms for a single crystal subjected to shear stress τ (a) Slip and (b)twinning and also, (c) Schematic presentation of how twinning results from shear stress τ [38] The most important twinning mode in hcp metals takes place on the {101 2} twinning plane in the <101 1> shear direction [39-41] to accommodate the strain. {101 1}<101 2> twinning has also been frequently observed [42]. The common twin modes in hcp metals are shown in Figure 1.6.
![Chapter 1. Literature review 20 Figure 1. 6 Common twin planes seen in magnesium[31] Unlike slip, twinning is polar in nature; the shear can occur in one direction only.](/docs-images/77/76606399/images/20-0.jpg "Depending upon the c/a ratio, twinning modes may be either tensile or compressive as shown in Figure 1.7 [43]. A twin mode showing a positive slope in Figure 1.")
20 Chapter 1. Literature review 20 Figure 1. 6 Common twin planes seen in magnesium[31] Unlike slip, twinning is polar in nature; the shear can occur in one direction only. Depending upon the c/a ratio, twinning modes may be either tensile or compressive as shown in Figure 1.7 [43]. A twin mode showing a positive slope in Figure 1.7 results in contraction along the c-axis whereas a twin mode showing a negative slope results in extension along c-axis. In the case of magnesium extension along c favours {101 2} twinning whereas a compression along this axis favours {101 1}<101 2> twinning [44, 45]. So, the most common twinning mode in magnesium{101 2} twinning is known as a tension or extension twin because it provides extension along c-axis [46, 47]. The {101 1} twinning is thus known as a compression or contraction twin. Figure 1. 7 Variation of twinning shear with the c/a ratio for various twinning modes in HCP metals [43]
21 Chapter 1. Literature review 21 Nucleation and growth of twins is significantly influenced by strain rate, grain size and precipitates [48-51]. However, Meyers et al. [52] have shown that the twinning stress is insensitive to temperature, Figure 1.8. Not all research supports this notion, with the CRSS for twinning being reported to decrease with increasing temperature and decreasing strain rate in one case [53]. Also, Yoo [43] reported negative temperature dependence for the {101 1} twinning mode in HCP metals. It is therefore not totally clear what effect temperature will have on the twinning stress. Figure 1. 8 Twinning stress as function of temperature for single crystals and polycrystals [52] This twinning stress is grain size sensitive, increasing markedly with a decrease in grain size [54]. Lahaie et al. [55] confirmed this grain size effect in the magnesium alloy AZ91 subjected to tension and compression. They found an absence of twins in fine grained samples (1µm) and presence of twins in coarse grained samples (15 µm). Also, Meyers et al.[56] confirmed this to occur in copper subjected to shock compression. No twins were present in samples of fine grains (9 µm) and twins were found in samples of coarse grain sizes (117 and 315 µm). Thus, twins are more common in coarse grained specimens deformed at lower temperature irrespective of the crystal structure.
22 Chapter 1. Literature review Representation of texture in hcp materials To represent an orientation, the crystal coordinate system is specified with respect to the sample coordinate system. The crystal coordinate system for HCP unit cell is shown in Figure 1.9 along with the sample coordinate system for a rolled sheet. Euler angles (φ1, Ф, φ2) are usually used to describe a sample orientation with respect to the crystal coordinate system. The orientation of crystal can then be defined by the rotation g which changes the sample coordinate system (ee ss ii ) into the crystal coordinate system (ee cc ii ): ee ii ss = gg. ee ii cc [Equation -2] In Bunge s convention [57], φ1 is a rotation z3 about followed by a rotation Ф about x1 axis, then followed by a third rotation y2 axis. φ1 and φ2 vary from 0 to 2π and Ф from 0 to π. Figure 1. 9 (a) Euler angle rotations according to Bunge s convention and (b) crystal coordinate system for an HCP unit cell [58] In the present work, pole figures and inverse pole figures are used for texture analysis. Pole figures are two-dimensional stereographic projections of pole orientations for a set of crystal planes {hkil}in
23 Chapter 1. Literature review 23 the sample reference frame [59, 60]. Inverse pole show sample coordinate system in the crystal reference frame. Wang and Huang [59] simulated the ideal pole figures of some important texture components for magnesium, shown in Figure It is common to employ basal pole figures when representing the texture of magnesium and a typical ideal basal fibre texture is shown in Figure 1.10(a). Textures near to this ideal case are often seen in rolled sheet though the basal poles are often seen slightly rotated towards the RD (Figure 1.10(b)). Pole plots for the two main orientations {0001) < 101 0> and {0001} <112 0> are given in Figures 1.10 (b) and (c). Typical textures for rolled and extruded shown in Figure 1.10 (d) and (e) respectively. Figure Ideal pole figures for magnesium (c/a = 1.624) [59, 61, 62]
24 Chapter 1. Literature review Mechanical behaviour of single crystals The deformation of magnesium single crystals has been studied by a number of workers, starting with the early work of Schmid in the 1930s [63]. Pure, single crystals of magnesium exhibit plastic anisotropy due to the easily activated independent dislocation slip mechanisms and asymmetry associated with the polar nature of deformation twinning [64]. The following section reviews the literature on magnesium crystal deformation behaviour Deformation of single crystal oriented for basal <a> slip Basal slip is easily activated in magnesium and seen to activate in single crystals when the angle between the slip plane and the tensile axis is between 6 to 72. Stress-strain curves for magnesium single crystals oriented for basal slip are shown in Figure 1.11, which shows data by different authors. The CRSS of basal slip determined at a strain of 1% is found to be nearly constant at all temperatures [11, 65-67]. All four curves show low work hardening rates at low strains, and in the later stages of deformation the work hardening rates are observed to increase. This is mainly due to the interaction between the dislocations and may also be due to {101 2} twinning. The CRSS for basal <a> slip was calculated to be about 0.46 MPa by Hirsch and Lally but significantly higher by Chapius and Driver (Figure 1.11c). This difference is probably due to the different deformation geometries, Chapius and Driver used a plane strain compression apparatus that imposes friction on the sample. This may artificially inflate the stress required to initiate deformation.

25 Chapter 1. Literature review 25 (a) Hirsch and Lally (1965) (b) Akhtar and Teghtsoonian (1969) (c) Chapius and Driver (2011) (d) Kelly and Hosford (1968) Figure Stress-strain curve for Mg single crystals oriented for basal slip [11, 65-67] Deformation of single crystal oriented for prismatic <a> slip Prismatic slip, {101 0} <112 0> is the main deformation mechanism when the basal plane is parallel to the tensile axis [68, 69]. It is known that the CRSS for prismatic slip decreases with increasing temperature. This is explained by the notion that prismatic slip dislocations are thermally activated by cross slip of basal dislocations on to the prismatic plane. Quimby et.al [70] and Couret and Caillard [15] agreed that that prismatic slip is a thermally activated process, and found that the CRSS changes with temperature as shown in Figure 1.12.
26 Chapter 1. Literature review 26 Figure CRSS for glide on prismatic planes (P) and basal planes (B) for comparison Deformation of single crystal oriented for pyramidal <c+a> slip Burke and Hibbard [71] reported pyramidal slip as the dominant deformation mechanism for tension in the basal plane. There are two possible pyramidal systems: First order pyramidal {101 1} and second order pyramidal {112 2}. Agnew and Duygulu [30] studied these slip modes in detail by TEM and concluded that second order pyramidal <c+a> slip on {112 2} planes was the active system in magnesium alloys. In-situ TEM studies have shown that, like prismatic slip, the CRSS for <c+a> slip decreases with temperature. This is consistent with the work of Obara [72] who studied the deformation of magnesium single crystals. The crystals were compressed in c-axis at temperatures ranging from 25 C to 500 C and showed a significant decrease in deformation stress with increasing temperature, Figure 1.13.
27 Chapter 1. Literature review 27 Figure Stress-strain curves for magnesium single crystals oriented for {1122 2} < > slip [72] Deformation of single crystal oriented for twinning In magnesium crystals oriented for c-axis extension, {101 2} twinning is found to operate [31, 71, 73]. The CRSS for twinning in pure Mg is quite low, and has been reported to be ~2 MPa [73]. Figure 1.14 shows the stress-strain curves for crystals compressed along <101 0> and extended along [0001]. In both series of tests, {101 2} twins were produced which are responsible for c-axis expansion. Higher work hardening rates were exhibited for compression along [101 0] due to the orientation of the basal slip system in the {101 2} twins that formed in that orientation. The main reason for the abrupt change in strain hardening response at a strain of ~0.06 is the exhaustion of twinning. At this point nearly the entire crystal has been consumed by the twin orientations [42], and the basal plane is poorly oriented for slip, thus the stress required to continue deformation is high.

28 Chapter 1. Literature review 28 (a) Chapius and Driver (2011) (b) Kelly and Hosford (1968) Figure Stress-true strain curves for compression Mg crystals along [1011 0] [66, 67] Kelly and Hosford [67] also carried out channel die compression tests on pure magnesium and showed that stress-strain behaviour depends on the constraint directions as shown in Figure In these cases, the primary twinning mode {101 2} completed about 6% strain. Figure Stress-strain curves in pure magnesium single compressed along<1011 0> (a) expansion limited to <122 10> and along <122 10> (b) expansion limited to <1011 0> [67]
29 Chapter 1. Literature review Effect of temperature on CRSS in single crystals As discussed in previous section, the CRSS of slip is temperature dependent [11, 12, 30] but twinning is not. Most recently Chapuis and Driver [66] investigated the effect of temperature on deformation mechanisms (slip and twinning) in plane strain compressed magnesium single crystals. Channel die compression and EBSD orientation mapping were used to analyse the critical resolved shear stress of the slip and twinning systems. The CRSS of the slip and twinning systems are also evaluated from the experimental stress-strain curves and orientation maps using a rate-insensitive crystal plasticity code. The effect of temperature on the critical resolved shear stresses measured is summarised in Figure 1.16 to It was found that basal slip and twinning are athermal. Prismatic slip and Pyramidal slip are thermally activated. The c-axis compressive twinning systems were found to be dependent on temperature. In addition to this work, there have been a number of other experiments in Mg crystals. These have been summarised in Figures 1.16 to Figure 1.16 shows that basal slip is temperature independent for pure Mg single crystals [11, 66, 71, 74-76]. This is a consistently reported phenomena for magnesium single crystal investigations. A small drop in the CRSS is usually reported at higher temperatures, but this is usually quite small, as is the CRSS for basal slip at room temperature. Figure Reported CRSS data for basal slip in pure Mg single crystals [11, 66, 71, 74-76]
30 Chapter 1. Literature review 30 Figure 1.17 shows that prismatic slip is temperature dependent for pure Mg single crystals deformed in tension [12] and plane strain compression [66].The CRSS can be seen to drop markedly with increasing deformation temperature. Figure 1.18 shows a very similar effect for pyramidal slip, which also shows a strong temperature dependence in c-axis compression [72] and plane strain compression [66] Figure Reported CRSS data for prismatic slip in pure Mg single crystals [12, 66, 68, 69, 77, 78] Figure Reported CRSS data for pyramidal slip in pure Mg single crystals [66, 72]
31 Chapter 1. Literature review 31 A summary of literature data that investigates magnesium single crystals oriented for {101 2} twinning is shown in Figure It can be seen that, consistent with the work of Meyers [52] the twinning stress is found to be temperature independent [66]. Figure Reported CRSS data for tension twinning in pure Mg single crystals [64, 66, 79] The information summarised in the aforementioned paragraphs can be summarised as follows. Nonbasal activity is enhanced at high temperatures due to lower CRSS. This reduction in the CRSS at elevated temperatures is attributed to a reduction in the activation energy required for cross slip [27]. Thermal energy assists dislocations to overcome the energy barriers resisting cross slip. Since prismatic and pyramidal slip both require cross slip, they are highly sensitive to temperature. Basal dislocations however are already present on the slip plane, and do not require thermal activation, thus they are largely insensitive to temperature[66]. The mechanism of cross slip of basal dislocation onto prismatic planes is shown in Figure 1.20 [80-82]. At temperatures lower than 400K [15, 83], basal dislocations are restrained at two points and then bow onto prismatic plane shown in Figure 1.20 (a). At temperature higher than 400K, basal dislocations cross slips onto prismatic planes and prismatic dislocations re-detaches onto basal planes parallel to the original slip plane shown in Figure 1.20 (b). In this Friedel-Escaig or jog pair mechanism, prismatic dislocations exists as pair of jogs between two basal stacking faults. Therefore, the activation energy for cross slip depends on the nucleation of the jog pairs onto prismatic plane.
32 Chapter 1. Literature review 32 Figure Mechanisms for cross slip of basal dislocations onto prismatic planes (a) cross-slip process with basal dislocations restrained at P and Q and bow onto prismatic (b) plane to height h and, (b) cross-slip process with prismatic dislocations re-detaches onto (c) basal planes parallel to original slip plane [82] Cross-slip mechanisms also aids in the nucleation of pyramidal dislocations. The basal <a> dislocations cross slip onto prismatic planes and prismatic <a> dislocations interact with <c> dislocation forming <c+a> dislocations which cross slips onto pyramidal plane [84]. Since the pyramidal and prismatic systems are thermally activated, they are more sensitive to temperature change than the other deformation modes.
33 Chapter 1. Literature review Solute hardening effects in single crystals Addition of foreign atoms or alloying additions to the most metallic systems results in solute hardening [85]. One of the classical models to describe the effect of solute-dislocation interactions was given by Fleischer [86]. Fleischer explained hardening effects in terms of the distortion in the crystal lattice caused by solute atoms. Two types of interactions are proposed: Local strains in the lattice caused by size misfit of solute atoms, and differences in the shear modulus between solutes and the lattice [86, 87]. In Fleischer s approach a moving dislocation is assumed to encounter a series of discrete obstacles on the slip plane. The average spacing between solutes depends on the flexibility of the dislocation line. Variation in the concentration dependency of the flow stress will depend on the flexibility of the dislocation line. Based on the size and modulus effect, numerous theories have been proposed for the quantification of solid solution strengthening. The Friedel-Fleischer model finds CRSS proportional to C 1/2, where C is the concentration of solutes. Another model has been proposed by Labusch, also shows that CRSS should scale to C 2/3 [88] or C 1/ Solid solution strengthening of Basal Slip Akhtar and Teghtsoonian [11] studied solid solution strengthening in single crystals of magnesium containing Zn and Al, oriented for basal slip. This data, along with more recent literature is summarised in Figure The stress for basal slip was found to increase with the Zn concentration. Beyond this concentration of solute a C 1/2 dependence is observed. Tensile tests on crystals oriented for basal slip has shown hardening for all of the solute species that were tested including Al, Zn, and Li. TEM on Mg-Al [11] crystals revealed that the basal dislocation density increases linearly with the solute content, and this may affect the work hardening behaviour of magnesium alloys. However, this has not been studied systematically.
34 Chapter 1. Literature review 34 Figure The increase of CRSS for basal slip with solute concentration at room temperature[11, 89] Solute hardening of Prismatic Slip Akhtar and Teghtsoonian [12] studied solid solution strengthening in single crystals of magnesium containing Zn, oriented for prismatic slip. These tests show that Zn and Al solutes decrease the CRSS for prismatic slip as shown in Figure This is proposed to be due to the solutes decreasing the stress for cross slip. This was the first ever report of solute softening in an alloy system. Recent atomscale modelling work [90] has confirmed that the interaction of solutes with the prismatic screw dislocation core assists in the activation of cross slip in Mg alloys. This geometrical model efficiently predicted the cross slip softening and hardening for 29 Mg binary alloys. However, it is still an unusual phenomenon that adding solute can soften rather than harden an alloy.
35 Chapter 1. Literature review 35 Figure CRSS for prismatic slip with Zn concentration [12] 1.6 Mechanical behaviour of polycrystals Effect of texture Kelly and Hosford [67, 79] first studied the deformation characteristics of textured polycrystalline magnesium, during plane strain compression as well as uniaxial tension and compression. It was found that highly textured polycrystals behave in a similar manner to single crystals, as shown in Figure This is because of the dominant basal slip and {101 2} twinning. The degree of anisotropy in the polycrystalline pure magnesium was found to be lower than single crystal, and is strongly dependent on the intensity of the basal texture. Strong texture can be responsible for the asymmetry in the tension-compression of the wrought alloy as high as twice the tension-compression.
36 Chapter 1. Literature review 36 Figure Stress - Strain curves of (a) pure magnesium single crystal and (b) textured pure magnesium (First letter signifies loading direction and second letter signifies the extension direction [67, 79] Kelly and Hosford [79] studied yield locus points for a textured polycrystalline pure magnesium. The yield loci of the textured magnesium are neither elliptical nor centred on the origin, because of the directionality of {101 2} twinning [79]. An important feature at the yield loci in Figure 1.24 is the asymmetry in yield stresses for tension and compression. Yielding is easier in compression due to easy activation of twinning compared to non-basal slip. At low strain, high strength was achieved in tension than compression due to twinning. At 10% strain, the tensile and compressive flow stresses are almost comparable due to the exhaustion of twinning process and crystal lattice reorientation of the twinned volume.
37 Chapter 1. Literature review 37 Figure , 5, 10 % yield loci for biaxial stresses in textured pure magnesium [79] Safi-Naqvi et.al [91] investigated the mechanical anisotropy of magnesium alloys to create yield loci using tension, compression and plane strain deformation. They are presented in Figure The magnesium alloy shows greater strength in the extrusion direction as compared to the transverse direction that occurs in both tension and compression as alignment of the basal poles was unfavourable for slip. Hence, the flow stresses generated in the transverse direction is higher as alignment of the basal poles was favourable for slip. The solution treated Mg-3Y alloy shows higher strength in compression as compared to solution treated ZM61 alloy. The Mg-3Y alloy shows nearly isotropic behaviour, probably due to weaker texture. Indeed it has been shown that weak texture improves ductility, yield asymmetry and formability in magnesium alloys.
38 Chapter 1. Literature review 38 Figure Yield loci for magnesium alloys (a) ZM61 (solution treated), (b) ZM61 (aged), (c) Mg-3Y (solution treated) and (d) Mg-3Y (aged) [91] Many workers [30, 92] have studied the effects of temperature on plastic anisotropic behaviour in AZ31 magnesium alloy. It was found that the increase in ductility with texture is accompanied by a decrease in flow stress, an increase in strain rate sensitivity and a decrease in anisotropy [30]. The texture of a material played an important role in the plastic deformation at both quasi-static and high strain rates due to slip-twin interactions [92]. In summary, the most common and easiest slip mode in magnesium at room temperature is found to be basal slip. As temperature increases, the prismatic slip and pyramidal slip systems are easily activated contributing more towards the overall deformation. The dominant twin mode in magnesium is {101 2} along <101 1>, which results in c-axis extension.
39 Chapter 1. Literature review Solute hardening effects in polycrystals Most recently, Stanford et al. [17] investigated the effect of Zn concentration and grain size on prismatic slip system. Zn addition produced solute strengthening effect for grain sizes smaller than 50 µm and solute softening effect for grain sizes above 50 µm, Figure It was proposed that for grain sizes less than about 30 µm, the stress to activate prismatic slip is limited by Hall-Petch hardening. However, for larger grain sizes the limiting stress is the stress required for cross slip of basal dislocations onto the prismatic planes. Hence, it was proposed that solute softening effect is observed only for large grain sizes. This is therefore consistent with observations made on large single crystals by Akhtar and Teghtsoonian [12]. Figure Effect of Zn concentration on the stress to activate prismatic slip for different grain size [17] Caceres [13] reported the solid solution hardening of the flow stress in Mg-Al alloys. It was found that the hardness increases with the Al content. After correcting for grain size strengthening effects, the proof strength increases linearly with C n, where C is the atom concentration and n = 1/2~2/3 (Figure 1.27), consistent with the theory of Fleischer. The results found were close to observed in single crystals of dilute alloys oriented for basal slip, suggesting that the strengthening of the basal plane controls the solid solution hardening in polycrystals of concentrated Mg-Al solid solutions.
40 Chapter 1. Literature review 40 (a) (b) Figure (a) Effect of atom concentration on the hardness (The dashed lines and solid symbols represent the data after subtracting the grain size strengthening ) [13] (b) Effect of Zn concentration on the stress to activate basal slip [11] Stanford [16] reported the effect of Gd concentration on solute strengthening in magnesium-based alloys. For concentrations above 1wt% Gd, the strength was found to be unchanged which was explained by texture effects. Strengthening of prismatic system was found to be more significant for Gd than for Al and Zn Effect of temperature on polycrystal deformation Agnew and Duygulu [30] observed that there is a significant decrease in flow stress with increasing temperature. Concurrent with flow stress decreases, the strain rate sensitivity increases with deformation temperature. The polycrystal model also suggested that the only slip mechanism capable of explaining the observed decrease in R-value (plastic strain ratio defined as the ratio of width-tothickness strains in a tensile test [93]) with temperature is the increasing activation of non-basal dislocations with Burgers vectors such as 1 <112 3> (or <c+a>). This mechanism would enable 3 magnesium to satisfy Taylor s criterion. Also, by incorporating an increase in <c+a> activity in the
41 Chapter 1. Literature review 41 polycrystal simulations, the observed R-value decreased with temperature (see Figure 1.28). Hence increase in the <c+a> slip activity at higher temperatures was concluded to be responsible for the improved formability in that case. (a) (b) Figure (a) Effect of temperature on R-value, (b) Polycrystal simulation results showing the effect of the CRSS ratio between <c+a> and prismatic <a> slip on slip system activity [30] Polycrystal plasticity modelling Polycrystal plasticity models are used to quantify the plastic behaviour of alloys, and investigate their hardening behaviour. Most notably in the magnesium research field, the visco-plastic self-consistent VPSC model has become a standard test for such studies [94, 95]. Developed by Lebensohn and Tome [96], this technique works on the basis of initial conditions like texture and yield point. Modelling with VPSC has shown that single crystal and polycrystal values do not match [97]. This is probably due to the effect of incremental hardening due to change in solute concentration or texture[98]. VPSC has also shown the importance of relative slip activity (particularly non basal) on R-value and texture development. Agnew et.al [86] studied the mechanical behaviour of magnesium alloys using (VPSC) model. They found few differences in uniaxial compression textures of magnesium, Mg-Li and Mg-Y alloys. The VPSC showed an increased activity of non-basal <c + a> slip mode. They also reported magnesium alloys had improved ductility in compression than pure magnesium due to non-basal <c+a> slip activity. Jain and Agnew [99] studied the mechanical behaviour of AZ31B magnesium alloy sheet tested in uniaxial compression using VPSC.
42 Chapter 1. Literature review 42 Compression tests were done along rolling, transverse and normal direction in the temperature range 22 C 250 C. They found prolific{101 2} twinning giving a low R-value and contributing towards hardening of material due rapid texture evolution, as well as due to twin boundaries acting as barrier to dislocation motion. They also reported enhanced ductility at moderate temperatures (100 C 200 C) due to thermally activated prismatic <a> and pyramidal <c+a>slip. Hutchison and Barnett [100] investigated the CRSS values for slip in polycrystalline magnesium and other hcp metals. They found a big discrepancy between the values. The ratios of CRSS values between the hard and soft slip modes was seen to be less in polycrystal compared with singlecrystal data, for which the reason are still unclear. Raeisinia et.al [87, 100] used VPSC to account for the grain size and composition dependence of the CRSS of basal slip and tensile twinning in Mg-Zn alloy systems. Elastoplastic self-consistent (EPSC) polycrystal modelling predicted stronger grain size dependence for twinning as compared to basal slip. For a given grain size, twinning stress was not found to increasing above a of Zn concentration of 1.0 at%. Conditions PC, VPSC, XRD [101] CRSS basal (MPa) CRSS prism (MPa) CRSS twin (MPa) CCCCCCCCpppppppppp CCCCCCCCbbbbbbbbbb (MPa) PC, EPSC, ND [102] PC, TEM [103] 1.1 PC, Taylor, XRD [104] PC, ND, Schmid factor [105] PC, TEM [30] PC, EPSC, ND [106] PC, EPSC, ND [107] PC, Sachs, Schmid factor [108] Table 1. 2 CRSS values reported for AZ31 magnesium alloy [30, 101, ] CCCCCCCCtttttttt CCCCCCCCbbbbbbbbbb (MPa)
43 Chapter 1. Literature review 43 Al and Zn solutes increases the CRSS values for all deformation mechanisms as compared to pure magnesium, but reduces the relative differences. CRSS values for prismatic slip are found to be more scattered in the literature. CRSS values are obtained using polycrystal plasticity models and Neutron diffraction. Most recently, Kabirian [109] discussed that VPSC results for different mechanisms in plastic deformation varies significantly depending on the number of measurements used for calibration. As texture evolution during dynamic compression shows the twinning dependency on strain rate, it was suggested to use a different rate-sensitivity parameter for VPSC models. High temperature simulation results showed reduced twinning activity which is well supported by measured textures showing a reduction in crystal reorientation at high temperature deformation. Overall, VPSC has successfully explained the mechanical response of AZ31 magnesium alloy. Hence, implementation of VPSC for simulation requires mechanical and microscopic (i.e., twin fractions) data to calibrate model constants for a given material. 1.7 Dynamic recrystallization during hot deformation of magnesium In this thesis mechanical tests were carried out at temperatures up to 200 C. At these temperatures dynamic recrystallization (DRX) is seen. DRX is an important restoration mechanism which occurs during hot deformation of magnesium and proceeds by nucleation and growth. This is common in low to medium stacking-fault energy metals [58]. Stacking fault energy is an important parameter in DRX as it determines the rate of dislocation climb and cross slip. DRX process also depends on the temperature, strain, strain rate, texture and initial grain size. DRX tends to decrease the flow stress and also determines the final microstructure [58]. DRX occurs by high angle boundary migration resulting in nucleation and growth of new grains. This process is considered to be discontinuous because it has nucleation and growth stage[38]. This process occurs when a critical strain (ɛc) is exceeded (Figure 1.29-f). Conventionally, the initiation of DRX is prefaced by serrations and bulging of grain boundary prior to the formation of new grains[110]. The new strain free grains form a distinctive microstructure which consists of a necklace type structure and shows recrystallised grains located along the initial grain boundaries. Figure 1.29 shows the development of microstructure during DRX and a stress-strain curve depicting the stages of microstructural evolution. Initially, the microstructure will consist of parent grains prior to the critical strain, as seen in Figure 1.29-a. As the strain is increased, new grains start to form along the initial grain boundaries, thereby forming the first layer of the necklace structure (Figure 1.29-b). At higher strains, new layers of necklace and spread across the grain interior (Figure 1.29-c to e).
![Chapter 1. Literature review 44 Figure 1. 29 Stages of microstructural evolution during DRX [110] There are five mechanisms explaining the dynamic recrystallization process in magnesium.](/docs-images/77/76606399/images/44-0.jpg "Firstly, Strain Induced Boundary Migration (SIBM) is a common recrystallization mechanism involving a bulge in the existing grain boundary.")
44 Chapter 1. Literature review 44 Figure Stages of microstructural evolution during DRX [110] There are five mechanisms explaining the dynamic recrystallization process in magnesium. Firstly, Strain Induced Boundary Migration (SIBM) is a common recrystallization mechanism involving a bulge in the existing grain boundary. During deformation, the grain boundary interacts with the slip band causing accumulation of stress as a bulge in the existing grain boundary into neighbouring grains. This SIBM mechanism as seen in aluminium alloys is explained in Figure 1.30 (a) [111]. The bulge grows into grain 2 due to the accumulation of stress on the boundary as stored energy of the grain 2 exceeds the stored energy of the grain 1 (E2 > E1). During the bulging process, the region behind the bulge has higher dislocation density (Figure 1.30 (b)). The substructure inside the bulge forms low angle boundary binding with the recrystallized grain (Figure 1.30 (c)). SIBM may also form at large subgrains (Figure 1.30 (d))[112]. SIBM Recrystallization also leads to the formation of necklace type structure of the recrystallised grains on the pre-existing grain boundary shown in Figure 1.30 (b). SIBM occurs at temperatures > 573 K. Higher activity of non-basal slip and cross slip is
45 Chapter 1. Literature review 45 required to retrieve the dislocation substructure inside the bulge. SIBM mechanism is also seen in magnesium alloys (Figure 1.31) [113]. Figures 1.29 and 1.30 provide an explanation on SIBM mechanism using the example of Aluminium alloys. Figure SIBM mechanism in aluminium (a) SIBM of a boundary separating a grain of low stored energy (E1) from one of high energy (E2), (b) Stretching of the dislocation substructure behind the bulging boundary, (c) The bulging boundary is free from dislocation substructure and, (d) SIBM also occurs at large subgrains [112] Secondly, Rotational dynamic recrystallization (RDRX) is another mechanism seen in magnesium alloys which also leads to the formation of necklace type structure of the recrystallised grains on the pre-existing grain boundary shown in Figure 1.30 (b). Local shearing occurs at grain boundaries due to accumulation of stress followed by dynamic recovery forming subgrains structures as shown in Figure Continuous process of dynamic recovery forms the grains on the boundary. Due to a continuous the process of recovery, RDRX is also referred to as Continuous dynamic recrystallization (CDRX). On the other hand, SIBM has discrete nucleation process and is characterized as discontinuous recrystallization process. A TEM image showing the bulging and substructure
![Chapter 1. Literature review 46 development of grain boundary is shown in Figure 1.31 depicting characteristics of SIBM and RDRX [113]. Figure 1. 31 A TEM micrograph showing the bulging of grain boundary in Mg-3Al-1Zn Magnesium alloy under 40% strain.](/docs-images/77/76606399/images/46-0.jpg "White arrows indicate the serrated grain boundary, where the dense subgrains are formed.")
46 Chapter 1. Literature review 46 development of grain boundary is shown in Figure 1.31 depicting characteristics of SIBM and RDRX [113]. Figure A TEM micrograph showing the bulging of grain boundary in Mg-3Al-1Zn Magnesium alloy under 40% strain. White arrows indicate the serrated grain boundary, where the dense subgrains are formed. This process is observed in SIBM and CDRX [113] The first detailed study of DRX in magnesium was reported Ion, Humphrey and White [114]. They found that deformation twinning is followed by DRX at temperatures above 425 K. Then, Gailyev [58] reported CDRX during hot compression tests of ZK60 magnesium alloy at temperatures between 150 C and 450 C. Diagrams of grain boundary nucleation process depending on the deformation temperature is shown in Figure Figure Sketches of grain boundary nucleation processes at (a) 423 K, (b) K and (c) K [58]

47 Chapter 1. Literature review 47 Below 423 K, DRX was linked with basal slip, twinning and c + a dislocation guide. Basal dislocation accumulated near twin boundaries and the internal stresses due to distortion at grain boundaries exceeded CRSS of non-basal slip systems. In the temperature range of K, DRX was found to be continuous due to continuous dislocation rearrangement by cross slip resulting in the formation of high angle boundary. In the temperature range of K, DRX is assumed to be associated with the climb of dislocation. At higher strains, DRX occurs through nucleation at slip bands. Fast dislocation climb leads to the formation of low angle boundaries. Dislocations are trapped by low angle boundaries resulting, after continued strain, in the formation of high angle boundaries. Thirdly, nucleation of recrystallised grains may also occur due to deformation twins, mainly contraction and double twins. This process is referred to as Twin Induced Dynamic Recrystallization (TDRX). TDRX is mostly active at lower temperatures (473 K). TDRX nuclei is formed at intersection of twins forming the high density dislocation pile-ups. The mechanism of forming twin intersection is explained in Figure 1.33 [115]. In both situations, TDRX nuclei is formed at high angle boundaries forming the dislocation pile-ups. Figure Schematic diagram of TDRX mechanism due to twin intersection (a) secondary twin(2) passes through the primary twin(1) and, (b) secondary twin(2) forms within primary twin(1) [115] Recrystallization is quite common in contraction twins [116]. Recrystallization is less active in tension twins as it is not able to provide energy required for DRX [116, 117]. This is due to the
). Figure 1.")
![34 Figure showing (a) EBSD map of recrystallized twins and tensile twins, (b) High and low angle boundaries formed within a contraction twin and, (c) No TDRX observed in tension twins[116] Shear](/docs-images/77/76606399/images/48-1.jpg "bands are formed under severe deformed conditions mainly during the extrusion process, which provides favourable sites for recrystallization in magnesium [118-121].")
48 Chapter 1. Literature review 48 orientation of twins unfavourable for basal slip shown in Figure Also, tensile twins that showed no DRX indicated absence of low angle boundaries (see Figure 1.34(c)). Figure Figure showing (a) EBSD map of recrystallized twins and tensile twins, (b) High and low angle boundaries formed within a contraction twin and, (c) No TDRX observed in tension twins[116] Shear bands are formed under severe deformed conditions mainly during the extrusion process, which provides favourable sites for recrystallization in magnesium [ ]. This mechanism is referred to as Shear Band Nucleation (SBN). Particle concentrated deformation is also found to create site for recrystallization. This mechanism is referred to as Particle Stimulated Nucleation (PSN). In this mechanism, the deformation around the particle forms the subgrain structure of low angle boundaries and growing into high angle boundaries. PSN is observed in magnesium alloys as shown in Figure 1.35 [122, 123]. Figure Optical image showing PSN in rolled magnesium sheet [122, 123]
49 Chapter 1. Literature review Effect of solute on DREX Alloying additions arrest the progression of recrystallization by imposing solute drag on grain boundaries or by precipitation (Zener) pinning [111, 124]. Solute drag is the term given for the interaction between solute atoms and high angle grain boundaries during dynamic and static recrystallization [125]. Solute drag is caused by the segregation of solute atoms to the grain boundary, this segregation restricts the boundary motion. The effect of solutes on boundary mobility is relatively well described, and solute segregation is known to have a significant effect on boundary mobility [126]. Figure 1.36 shows the relationship between mobility and solute content depicting the low mobility and high mobility sections [127]. In low mobility regime, boundary migration decreases with increasing solute concentration, and the boundary velocity is found to be inversely proportional to the solute concentration. In the high mobility regime, solute atoms have no effect on boundary migration. The effect of solutes on boundary mobility is reduced at higher temperatures [128].
50 Chapter 1. Literature review 50 Figure (a) Effect of Cu and Mg solutes on the growth rate of new grains in deformed Al, (b) Effect of Mg on boundary mobility and (c) Effect of Ag on boundary mobility [127]
51 Chapter 1. Literature review 51 There are relatively few papers in the literature that aim specifically to study the effects of solute drag on dynamic recrystallization. Gall and Jonas [129] studied the effect of sulphur on DREX in a Ni alloy, and showed that solute drag models explained the drop in boundary mobility that accompanied an increase in S concentration. Cram, et al. [130] studied the effect of Sn additions to a Cu alloy. In this case too, the addition of solute increases the flow stress of the material, however, the most interesting result from this paper was the conclusion that solute retards the nucleation of DREX grains, rather than retarding grain growth. Although there exists other models explaining the effect of solute on DRX [ ], additional work is still required to determine if these models apply to the HCP structure. Extensive research is required to understand the solute drag effect in hcp materials. One of the few studies on magnesium has been published recently by Robson [135]. This paper explored the effect of solute addition on grain boundary segregation and mobility in magnesium. It was shown that solute drag predicted quite well the temperature and strain rate regimes in which DREX would be supressed as a result of solute drag.
52 Chapter 1. Literature review Summary and scope of thesis In order to understand the mechanical properties of Mg-Al alloys, it is necessary to understand the influence of the Al solute concentration on the four dominant deformation modes in magnesium: basal slip, prismatic slip, pyramidal slip and {101 2} twinning. Each of these is likely to be effected differently by the solute addition, and quantification of these effects may help us understand why changes in alloy content or deformation temperature are often accompanied by an improvement in ductility. The experimental approach in this thesis will be to produce highly textured materials, and test them in different orientations in order to activate the deformation modes in different proportions [11, 12, 66, 67, 79, 136]This gives a robust and reproducible way to examine the different modes. The experimental data will be combined with microstructural characterisation and VPSC modelling to quantify the effect of Al concentration. The following items will be examined: The effect of Al concentration on strength and ductility of highly textures polycrystal specimens Determine the magnitude of solute strengthening for the individual slip and twin modes Examine the effect of Al concentration on the nucleation, growth and critical stress for twinning Utilise the VPSC model to extract the CRSS values for each of the individual slip and twin modes, and examine how these are affected by Al concentration and deformation temperature In the present work high temperature deformation is also examined. During this process, dynamic recrystallization is observed, therefore, the following factors are also examined: Examine the effect of Al concentration on DREX Utilise the different flow stress values for the different test orientations to examine how applied stress effects DREX and validation of the solute drag model to describe the observed DREX Examine if the model proposed by Cram et al [137], which suggests solutes inhibit DREX nucleation more than growth, applies to the present magnesium binary alloys
53 Chapter 2. Experimental Methodology 53 Chapter 2 Experimental Methodology

54 Chapter 2. Experimental Methodology Alloy composition and preparation Six different alloys of magnesium were chosen for this study. The nominal compositions were 0.2, 0.5, 1.0, 2.0, 3.0 and 5.0 wt % Aluminium. The specific composition of alloys is given in Table 2.1. These compositions were chosen in a way that even at higher aluminium concentration, the alloys could be solution treated and quenched to retain a single phase structure. The deformation behaviour of pure Mg has been examined by a number of workers since 1930s. Hence, pure Mg data from literature is compared with the deformation of Mg-Al binary alloys. Element Mg Al Mn Fe Ni Zr Zn Cu Wt% Al 0.2 Bal < < < Bal < < < Bal < < < Bal < < < Bal < < < Bal < < < Table 2. 1 Composition of Mg-Al alloy with Al (wt %) Each alloy was prepared by melting magnesium and the corresponding wt % of Al under argon atmosphere in an induction furnace at a temperature of 700 C. The molten metal was poured into ingots of 135 mm x 65 mm x 25 mm as shown in Figure 2.1. The weight of the cast alloy obtained was about 400 grams. Figure 2. 1 As cast alloy of Mg-Al with 0.2 wt% Al
55 Chapter 2. Experimental Methodology 55 Figure 2. 2 Mg-Al Phase diagram [138] These alloys were given a two-step solution treatment in an argon atmosphere at 350 C for two hours and then 420 C for three hours and water quenched. The two step process was chosen to attain maximum equilibrium solid solubility of aluminium in magnesium at the eutectic temperature (see Figure 2.2). 2.2 Material preparation The alloys were sectioned into thin strips of length 120 mm width 100 mm and height 5 mm. These strips were subjected to hot rolling at 400 C in two passes. Before rolling, each sample was preheated heated to 400 C in tube furnace for 30 mins. After the first rolling pass samples were immediately placed back again in the tube furnace for another 30 mins before the second rolling pass. In each pass a rolling reduction of 50% was applied. After 2 passes total reduction of 75% was achieved, resulting in 1.25 mm thickness. These samples of 1.25 mm thickness were used to make specimens for tension
56 Chapter 2. Experimental Methodology 56 test. Same rolling schedule was implied for another set of alloys ending with 10 mm thickness. The samples with 10 mm thickness were used to make cylindrical specimens for the compression test. 2.3 Recrystallization and grain size studies In order to investigate the recrystallization behaviour and obtain a standard grain, small sections of dimensions 10 mm x 2 mm were cut from each rolled plate. These sections of cut samples were subjected to different annealing treatments at 200 C, 250 C, 300 C, 350 C and 400 C respectively for 1 hour and water quenched. The annealed sections of all the six alloys were cold mounted using epoxy resin and subjected to metallography. Samples for optical microscopy were ground with SiC grit papers of 240,600 and 1200 grades. The samples were then diamond polished through 9, 6 and 3 micron, and oxide polished (Struers OPS). After every stage of polishing, the samples were immersed in ethanol in an ultrasonic bath for 5 minutes. Samples were then etched with acetic picral (6 g picric, 100 ml ethanol, 5 ml acetic acid and 10 ml deionised water) for 5-8 seconds. Images were recorded at magnification 1000X using Olympus DP70 microscope. After etching with acetic picral optical images were taken. Etching highlights the grain boundaries. The method of linear intercept was used to determine an average grain size. (see Figure 2.3). Line segments are superimposed on the optical images and the number of times that grain boundaries are intercepted is recorded. The average grain size is calculated by finding the average intercept length. Fully recrystallized microstructure was determined optically as shown in Figure 2.3. After observing the recrystallized microstructure, an annealing treatment was chosen for each alloy in order to obtain a fully recrystallized microstructure with a grain size of (22 ± 3) µm microns as shown in Figure 2.4.

57 Chapter 2. Experimental Methodology µm Figure 2. 3 Optical micrograph of 0.2 wt% Al Figure 2. 4 Annealing temperature to achieve a standard grain size of (22 ± 3) μm

58 Chapter 2. Experimental Methodology X-ray diffraction (XRD) The initial texture for all the alloys was measured using XRD. Samples were polished prior to texture measurements.texture analysis was performed using Panalytical X Pert PRO MRD X-ray diffraction system shown in figure.the diffractometer used CuKα radiation of 30kV and 40mA. Texture data was collected over the range of 2θ with a step size of 5 degrees and a tilt of 75. The texture data was obtained for (0002) basal plane. The pole figures were corrected for defocusing using a magnesium random reference sample. Figure 2. 5 Experimental setup on an X-ray diffraction system to measure intial texture 2.5 Mechanical testing Tension Tensile specimens were machined from the thin sections of the rolled strips using the CNC machine as per ASTM E 8, with gauge length of 50 mm and width 1.25mm as shown in Figure 2.7.Tensile samples were cut along the RD (rolling direction) with gauge section 25 mm in length and 5mm in width. Samples were machined in the hot rolled conditions and then annealed at the appropriate temperature (see section 2.3).

59 Chapter 2. Experimental Methodology 59 Figure 2. 6 Geometry of Tensile specimens Tensile test were carried out on an Instron 30 kn screw driven tensile testing machine. Smaller load cell of 5 kn was used for these tests to reduce the error. Also, high resolution video extensometer is used to measure the tensile strain during the test. The rolling direction was parallel to the tensile direction in order to activate the most dominant (prismatic) slip system. Tensile tests were carried out at different temperatures -78 C, 25 C, 100 C, 150 C and 200 C. In order to achieve lower temperature of -78 C, dry ice setup was used as shown in Figure 2.8. Samples were kept in dry ice for 5 minutes prior to the start of each test. For testing at higher temperature (100 C, 150 C and 200 C), a different set up was used. The temperature gradient across the gauge length of the tensile specimen was measured and verified using three thermocouples attached to the sample before testing. It was found to be within 3 C of set point over the gauge length of the tensile specimen as shown in Figure 2.7. An infrared furnace was used to achieve the given range of temperature and data loggers were used to observe the required temperature during testing. Samples were inside the furnace and tests were performed once the desired temperature was reached, checked using the data loggers provided with furnace. In order to perform the test at required temperature, tensile samples were raised to the required temperature for 5 mins before start of each test, to ensure thermal stability. All tests were conducted at a constant strain rate of 0.001/s. To ensure a good statistical data, all tests were repeated three times..
.")
60 Chapter 2. Experimental Methodology 60 Figure 2. 7 Set up to measure the temperature gradient across a tensile specimen Compression testing Compression tests were done on screw driven Instron 30kN with a load cell of 5kN. Compression tests were carried out at three different temperatures (-78 C, 25 C and 200 C). Similar to tensile tests, the samples were higher temperature was achieved using an infrared furnace and cryogenic temperatures were achieved using dry ice. Prior to each testing all samples were raised to the required temperature for 5 minutes, before each test. Samples were wrapped with Teflon tape helping in compression, during the tests. Figure 2.8 below shows the compression rig used for lower temperature tests.
")
61 Chapter 2. Experimental Methodology 61 Figure 2. 8 Compression rig for low temperature (-78 C) testing
, ND (Normal Direction), and in the 45 in order the")
62 Chapter 2. Experimental Methodology 62 Figure 2. 9 Compression rig for high temperature testing Compression tests were done on the samples at three different orientations, RD (Rolling Direction), ND (Normal Direction), and in the 45 in order the study the deformation of different slip systems and twinning. Samples were hot rolled at 400 C in two successive passes. Each rolling pass achieved a reduction of 50% of the original. Rectangular pieces of dimensions 50 mm length, 15 mm height and 8 mm wide were sectioned from the rolled sheet. The rectangular samples were then shaped into cylinders of height 10 mm and radius 6 mm as shown in figure 1. In order to compare the volume fraction of twins with compressive strains bigger samples were wire cut. The dimensions of these samples were 15mm x 10 mm.


63 Chapter 2. Experimental Methodology 63 Figure Schematic representation of compression sample orientation and dimensions cut from the rolled sheets Determination of yield point The stress strain curves of various deformation modes are presented in chapter 3.Each test was repeated 3 times. The yield point was calculated using the 0.2% offset method. This method used a straight line parallel to the elastic limit at 0.2% strain. The point of intersection of the curve and line is taken as the yield point. As it was difficult to locate the yield point for 45 compression from stressstrain curves, an alternative method was used to calculate the yield point. During compression along 45, the yield strength was calculated by taking the derivative of the stress-strain data as shown below in Figure 2.11.
64 Chapter 2. Experimental Methodology 64 Figure Method for calculation yield point during compression along 45 to activate basal slip 2.6 Electron Backscattered Diffraction Electron back scattered diffraction (EBSD) was used to examine the microstructure and texture of selected specimens. Samples were polished in a similar manner as used for optical imaging. After polishing samples were subjected to acetic nital and silver coating was used on the stubs used to hold the samples before maps were taken for EBSD. All maps were taken on LEO 1530 field emission SEM. The LEO 1530 is a high resolution field emission scanning electron microscope (SEM), which was used for programmed EBSD analysis. HKL Technology CHANNEL 5 EBSD software was used for analysing acquired data by obtaining orientation maps and textures. EBSD involves the capture of diffraction patterns from the surface of polished metal sample by a sensitive charge-coupled device (CCD) camera in a SEM. Experimental setup for automated EBSD analysis is shown in Figure In the present work, the accelerating voltage used was 20kV and the EBSD maps were acquired at a working distance of 8-12 mm. The aperture size was 60 µm and the map step size was µm.
 [140].")
65 Chapter 2. Experimental Methodology 65 Figure Experimental setup of EBSD system [139] Generally, the measurement of each orientation acquired by EBSD is expressed using Euler angles (φ1, Ф, φ2) [140]. These set of rotations are used to represent the transformation from the macroscopic sample coordinate system to the orthonormal crystal coordinate system. This transformation can also be represented by a rotation matrix g as follows [38]: cos φφ 1 cos φφ 2 sin φφ 1 sin φφ 2 cos Ф cos φφ 1 sin φφ 2 sin φφ 1 cos φφ 2 cos Ф sin φφ 1 sin Ф gg = sin φφ 1 cos φφ 2 + cos φφ 1 sin φφ 2 cos Ф sin φφ 1 sin φφ 2 + cos φφ 1 cos φφ 2 cos Ф cos φφ 1 sin Ф sin φφ 2 sin Ф cos φφ 2 sin Ф cos Ф Also, g in terms of Miller indices g{(hkl)[uvw]} is defined as uu vvvv kkkk h gg = NN 1 vv NN 1 ww NN 1 NN 3 hww uuuu NN 3 uuuu vvh NN 3 NN 2 h NN 2 h NN 2
66 Chapter 2. Experimental Methodology 66 Where, N1 = (u 2 + v 2 + w 2 ) 1/2 N2 = (h 2 + k 2 + l 2 ) 1/2 N3 = N1 * N2 Figure 2.13 shows the Bunge s Euler angles (φ1, Ф, φ2) [36]. External reference system is represented by xx 1 xx 2 xx 3 with respect to the specimens. In case of a rolled sheet, xx 1 is the rolling direction and xx 2 is the sheet plane normal. The crystal reference system is represented by xx cc 1 xx cc 2 xx cc 3 with respect to the crystal lattice. For hcp metals, [211 0] could be chosen for xx 1 and [0001] for xx 3. Figure Bunge s Euler angles [36]
67 Chapter 3. Experimental results 67 Chapter 3 Experimental results
68 Chapter 3. Experimental results Introduction The five alloys were subjected to plastic deformation in tension and compression at temperatures of -78 C, 25 C (room temperature), and 200 C at a constant strain rate of 0.001s -1. Samples tested at 200 C were quenched immediately after testing to retain the actual microstructure and study the recrystallization behaviour. The flow stress for each curve was recorded as a function of strain. These tests were conducted to activate the following deformation modes. 1) Tension along rolling direction (Prismatic Slip) 2) Compression along rolling direction (Twinning) 3) Compression along normal direction (<c+a> slip) 4) Compression along 45 (Basal Slip) 3.2 Mechanical behaviour in tension Samples were subjected to uniaxial tension along the rolling direction in order to activate the prismatic slip system. All the stress strain curves for the tensile tests are shown below (Figure 3.1 to Figure 3.6). Tensile tests were carried out at six different temperatures from -78 C to 200 C for lower concentrations of aluminium up to 5.0 wt%. Not all concentrations were tested at six different temperatures, only lower concentration up to 1.0 wt%. In most cases, only data for three temperatures are shown. All samples were deformed till fracture. It can be seen that with increasing temperature, the flow stress decreases. Also, ductility increases with temperature.
69 Chapter 3. Experimental results 69 (a) -78 C (a) -78 C (b) RT (b) RT (c) 200 C (c) 200 C Figure 3. 1 Flow curves for the 0.2 wt% Al Figure 3. 2 Flow curves for the 0.5 wt% Al
70 Chapter 3. Experimental results 70 (a) -78 C (a) -78 C (b) RT (b) RT (c) 200 C (c) 200 C Figure 3. 3 Flow curves for the 1.0 wt% Al Figure 3. 4 Flow curves for the 2.0 wt% Al
71 Chapter 3. Experimental results 71 (a) -78 C (a) -78 C (b) RT (b) RT (c) 200 C (c) 200 C Figure 3. 5 Flow curves for the 3.0 wt% Al Figure 3. 6 Flow curves for the 5.0 wt% Al
72 Chapter 3. Experimental results Effect of temperature on tensile behaviour Figure 3.7 summarizes the flow stress data for the full experimental set. From this figure it can be seen that, in general, increasing temperature increases the ductility but decreases the flow stress for all of the tested alloys. Figure 3. 7 Effect of temperature on mechanical behaviour in tension
73 Chapter 3. Experimental results 73 The effect of temperature on the yield point of three selected alloys is shown in Figure 3.8. It can be seen that with increasing temperature the yield stress drops, and that the higher concentration alloys show higher yield stresses. The drop in yield stress with temperature is not linear, but plateaus towards the higher temperature ranges. Figure 3. 8 Temperature dependence of yielding in tension The effect of Al concentration on yield point is summarised for all alloys and temperatures in Figure 3.9. It can be seen that the yield point increases linearly with the square root of concentration. Figure 3. 9 Alloying effect on yielding in tension
74 Chapter 3. Experimental results 74 The effect of temperature on total elongation and uniform elongation are shown in Figure The total ductility is markedly increased with increasing deformation temp, and Al concentration does not have a significant effect on this parameter. The uniform elongation drops slightly with temperature, but this is not marked. Again, composition has very little effect on uniform elongation. This is also evident from Figure 3.11 where the elongation is plotted as a function of Al concentration for all alloys tested. (a) (b) Figure Effect of temperature on (a) ductility and (b) uniform elongation (a) (b) Figure Alloying effect on (a) total elongation and (b) uniform elongation at different temperatures
75 Chapter 3. Experimental results Mechanical behaviour of RD compression The flow stress as a function of strain for the RD compression samples is shown in Figure 3.12 to At 200 C, the stress-strain behaviour of Mg- Al alloys exhibit a lower flow stress than at -78 C and RT. (a) -78 C (a) -78 C (b) RT (b) RT (c) 200 C (c) 200 C Figure Flow curves for the 0.2 wt% Al Figure Flow curves for the 0.5 wt% Al
76 Chapter 3. Experimental results 76 (a) -78 C (a) -78 C (b) RT (b) RT (c) 200 C (c) 200 C Figure Flow curves for the 1.0 wt% Al Figure Flow curves for the 2.0 wt% Al
77 Chapter 3. Experimental results 77 (a) -78 C (a) -78 C (b) RT (b) RT (c) 200 C (c) 200 C Figure Flow curves for the 3.0 wt% Al Figure Flow curves for the 5.0 wt% Al
78 Chapter 3. Experimental results 78 The effect of aluminium concentration on yield point in compression along the rolling direction is summarised in Fig Compression of samples in the RD showed an increase in yield stresses with increasing Al concentration and decreasing temperature, Figure Some samples were repeated in the room temperature set, and these are shown Figure 3.18 with black points. Figure Alloying effect on yielding defined by twinning Figure Temperature dependence of yielding defined by twinning
79 Chapter 3. Experimental results Mechanical behaviour of ND compression Samples were subjected to uniaxial compression along the normal direction in order to activate <c+a> slip system. Compression tests were carried out at three different temperatures from -78 C, RT, and 200 C. Figure 3.20 to 3.25 below show the flow curves for the compression test. Similar to the other test orientations, increasing the deformation temperature decreased the flow stress, and increased the elongation to failure. (a) -78 C (a) -78 C (b) RT (b) RT (c) 200 C (c) 200 C Figure Flow curves for the 0.2 wt% Al Figure Flow curves for the 0.5 wt% Al
80 Chapter 3. Experimental results 80 (a) -78 C (a) -78 C (b) RT (b) RT (c) 200 C (c) 200 C Figure Flow curves for the 1.0 wt% Al Figure Flow curves for the 2.0 wt% Al
81 Chapter 3. Experimental results 81 (a) -78 C (a) -78 C (b) RT (b) RT (c) 200 C (c) 200 C Figure Flow curves for the 3.0 wt% Al Figure Flow curves for the 5.0 wt% Al The yield strength of all of the specimens in this data set have been plotted together as a function of Al concentration in Figure 3.26 (a). With increasing Al concentration, the yield stress increases for all deformation temperatures. Samples oriented for pyramidal slip activation showed highest strength. Hence, the maximum compressive strength was plotted and also increased with concentration, Figure 3.26 (b).
82 Chapter 3. Experimental results 82 (a) (b) Figure Alloying effect on (a) yielding defined by <c+a> slip and (b) maximum compressive strength at different temperatures The data is replotted in Figure 3.27 to show the effect of deformation temperature on three selected alloys. It can be seen that temperature has a significant effect on the yield stress for all three alloys. The maximum stress (UCS) showed quite different behaviour. At -78 C all alloys show a similar UCS, but at 200 C the 5 wt % alloy shows a significantly higher UCS than the other two alloys. (a) (b) Figure Effect of temperature on (a) yielding and maximum compressive strength for various Al concentration
83 Chapter 3. Experimental results Mechanical behaviour of 45 samples in compression Samples were cut from thick plate at an angle of 45 to the normal direction. Compression tests were carried out at three different temperatures from -78 C, RT, and 200 C. Figure 3.28 to 3.33 below show the flow curves for these compression tests. (a) -78 C (a) -78 C (b) RT (b) RT (c) 200 C (c) 200 C Figure Flow curves for the 0.2 wt% Al Figure Flow curves for the 0.5 wt% Al
84 Chapter 3. Experimental results 84 (a) -78 C (a) -78 C (b) RT (b) RT (c) 200 C (c) 200 C Figure Flow curves for the 1.0 wt% Al Figure Flow curves for the 2.0 wt% Al
85 Chapter 3. Experimental results 85 (a) -78 C (a) -78 C (b) RT (b) RT (c) 200 C (c) 200 C Figure Flow curves for the 3.0 wt% Al Figure Flow curves for the 5.0 wt% Al
86 Chapter 3. Experimental results 86 The yield strength of these specimens was determined from the point of inflection in the flow curve, as described in section 2.5.4, chapter 2. The yield strength data for the data set is summarised in Figure 3.34 (a). Although increasing the temperature decreased the yield stress, this effect was not as marked as in the other test orientations. There was a significantly more marked difference in the UCS after different deformation temperatures, Figure 3.34 (b). (a) (b) Figure Alloying effect on (a) yielding and (b) maximum compressive strength at different temperatures (a) (b) Figure Effect of temperature on (a) yielding and (b) maximum compressive strength for various Al Concentration
 decreases at higher temperature for all three alloys.")

 is the vertical direction (represented by an arrow) and the transverse direction (TD) is the horizontal direction in the pole plot.")
.")
87 Chapter 3. Experimental results 87 The effect of Al concentration on the yield stress and maximum stress (UCS) are shown in Figure It can be seen that yield stress and maximum stress (UCS) decreases at higher temperature for all three alloys. Also, at 200 C the 5 wt % shows significantly higher UCS than the other two alloys. 3.6 Microstructural Examination Texture measurement of starting materials The texture of the five alloys were measured using X-ray diffraction. The basal pole figure for each of the specimens are shown in Figure The rolling direction (RD) is the vertical direction (represented by an arrow) and the transverse direction (TD) is the horizontal direction in the pole plot. It is clear from Figure 3.36 that the alloy sheet has a strong {0002} texture which is typical for rolled magnesium alloys. The strong basal texture confirms that most of the grains have their basal planes parallel to the rolling plane with some spread in rolling direction (RD). As the Al content was increased, the texture was found to be evenly spread in rolling direction and transverse direction. Pole plots showing the texture intensity as a function of phi, the angle from the centre of the pole figure, is shown in Figure This confirms the texture is quite similar in all the specimens. (a) 0.2 wt% Al (b) 0.5 wt% Al (c) 1.0 wt% Al
 3.0 wt% Al (f) 5.")


88 Chapter 3. Experimental results 88 (d) 2.0 wt% Al (e) 3.0 wt% Al (f) 5.0 wt% Al Figure Texture measurement for various alloys using X-ray diffraction system Figure Pole plot for the six alloys showing the similarity in their textures.
89 Chapter 3. Experimental results Deformed microstructures Figures 3.38 to 3.40 show the deformed microstructures of samples 0.2 wt% Al and 5.0 wt% Al. The figure shows two deformation temperatures, room temperature and 200 C. It can be seen that at the lower deformation temperature, features typical of plastic deformation can be observed. The grain structure, which was initially equiaxed, becomes elongated as a result of deformation. In specimens compressed in the <a> axis, prolific twinning is confirmed. Dynamic recrystallization (DRX) was observed in all specimens deformed at 200 C. The duration of the test was approximately 400 seconds. Optical micrographs revealed that the Mg-Al alloy with 0.2 wt% Al was found to be fully recrystallized. For all other alloys, small DREX grains were observed along the grain boundaries. The volume fraction of recrystallized grains decreased with increasing aluminium content.
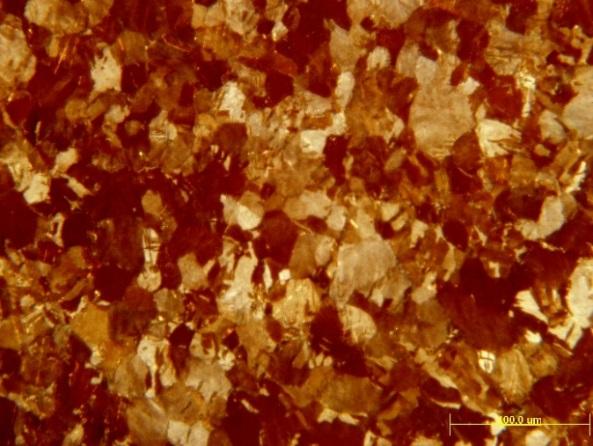
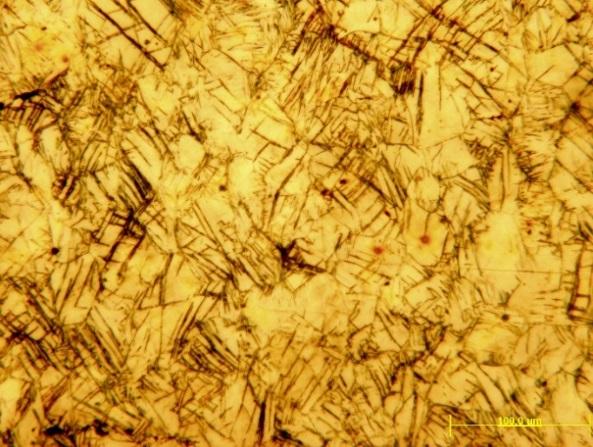


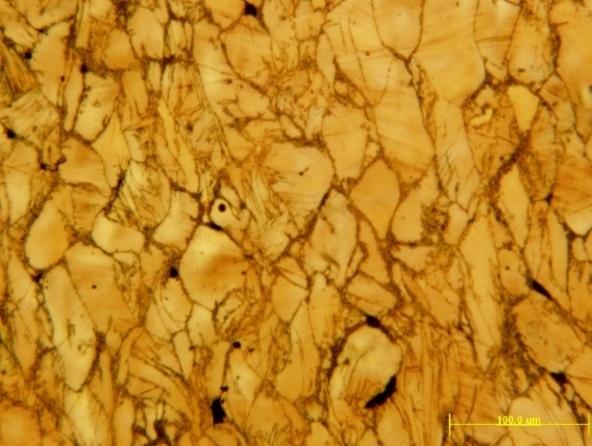
90 Chapter 3. Experimental results wt% Al 5.0 wt% Al -78 C RT 200 C RD Figure Optical micrographs of crystals oriented for twinning


91 Chapter 3. Experimental results wt% Al 5.0 wt% Al -78 C RT 200 C BASAL Figure Optical micrographs of crystals oriented for basal slip


92 Chapter 3. Experimental results wt% Al 5.0 wt% Al -78 C RT 200 C ND Figure Optical micrographs of crystals oriented for <c+a> slip Optical micrographs revealed that the Mg-Al alloy with 0.2 wt% Al was found to be fully recrystallized with 6-8µm grain size. For the Mg-Al alloy of 5.0 wt% Al, fewer recrystallized grains of 3-5 µm were observed along with grain boundaries. The volume fraction of recrystallized grains decreased with increasing aluminium content.
 RD (b)")
 0.")
93 Chapter 3. Experimental results 93 RD (a) RD (b) Figure Optical micrograph of (a) 5.0 wt% and (b) 0.2 wt% Al compressed along the rolling direction showing DRX grains

94 Chapter 3. Experimental results 94 Also, 5.0 wt% was not fully recrystallized, so it was chosen for EBSD mapping. EBSD was used to further examine selected samples deformed at 200 C. This confirmed the presence of very small DREX grains of approximately 3-4 microns in diameter in the highest concentration alloy. The EBSD analysis and optical micrographs were used to collate the size and volume fraction of DREX grains, and this is summarised in Table 3.3. Optical images were not clear enough to locate the DRX grain size for the prismatic deformation mode.. Figure Evidence of DRX for 5.0 wt% Al at 25% strain
95 Chapter 3. Experimental results 95 Sample/ Deformation Mode BASAL Maximum Stress Volume fraction of DREX DRX Grain Size (± 0.5 µm) Stress at fracture Maximum Strain Uniform Strain PRISMATIC <c+a> TWINNING Table 3. 1 Values of DRX grain size, stress, uniform strain and volume fraction of DRX grains.
96 Chapter 3. Experimental results Effect of aluminium concentration on twinning To study the effect of aluminium solute on twinning, additional samples were compressed along the rolling direction.compression tests were carried out to achieve different strains The stress-strain curves for the interrupted compression tests at approximately 2, 4, 6 and 8% strain. From the six different alloys examined in this thesis only three were chosen. The flow curves for 0.2 wt% Al concentration and 5.0 wt% Al concentration are shown in Figure 3.43 below. Figure Stress-strain curves for interrupted compression tests at different strains Samples from all compression tests were examined optically as shown in Figure It can be seen that the volume fraction of twins increased with increasing compressive strain. There was no significant effect of Al concentration on volume fraction of twins. Selected samples were also examined with EBSD, as shown in Figure 3.45 to The starting material had a strong texture, therefore, new orientations outside this texture were the result of the reorientation resulting from twinning. Hence, the volume fraction of twins was measured from the EBSD data using orientation of grains to determine if the region was a twin or a parent.
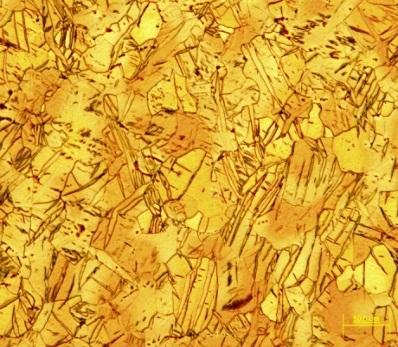


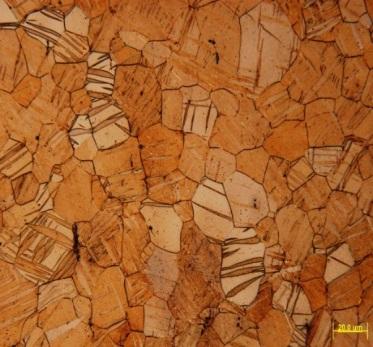
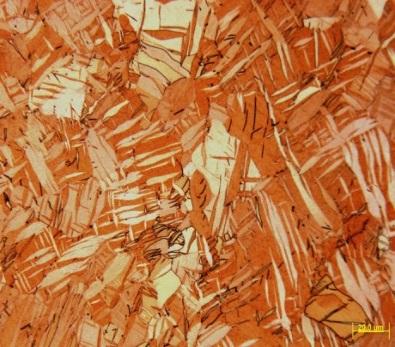

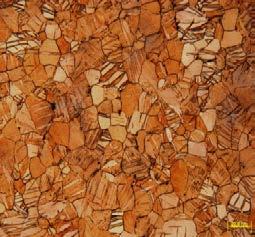
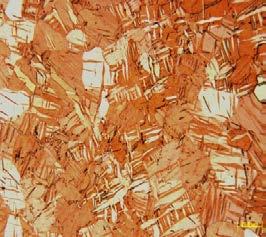

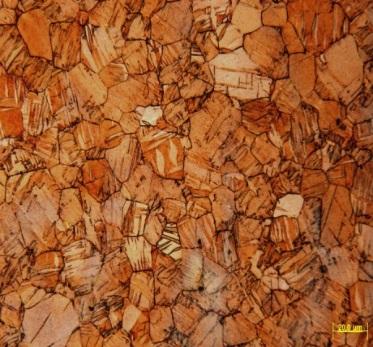

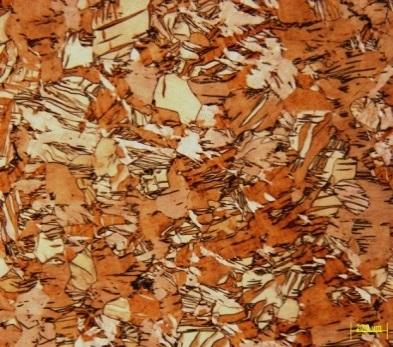
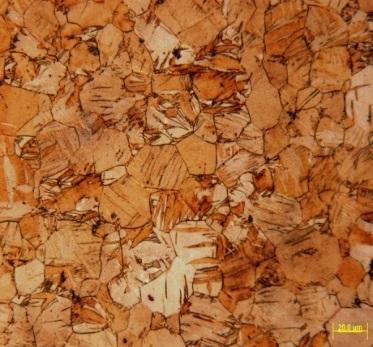

97 Chapter 3. Experimental results 97 Strain Concentration (wt% Al) % 50 µm 50 µm 50 µm 2% 50 µm 50 µm 50 µm 4% 50 µm 50 µm 50 µm 6% 50 µm 50 µm 50 µm 8% 50 µm 50 µm 50 µm Figure Optical micrographs of interrupted compression tests at varying strains

 4%")
 8%")


98 Chapter 3. Experimental results 98 (a) 2% strain (b) 4% strain (c) 6% strain (d) 8% strain Figure EBSD analysis showing volume fraction of twins for 0.2 wt% Al at different strains

 6% strain")


99 Chapter 3. Experimental results 99 (a) 2% strain (b) 4% strain (c) 6% strain (d) 8% strain Figure EBSD analysis showing volume fraction of twins for 5.0 wt% Al at different strains
100 Chapter 3. Experimental results 100 (a) (b) Figure Effect of (a) compressive strain and (b) Al concentration, on volume fractions of twins during compression
101 Chapter 4. Discussion on mechanical behaviour 101 Chapter 4 Discussion on mechanical behaviour
102 Chapter 4. Discussion on mechanical behaviour Review of mechanical test data A range of magnesium based alloys were prepared with different Al concentrations between 0.2 and 5.0 wt% Al. The alloys were subjected to tension to activate prismatic slip and compression to activate twinning, <c+a> slip and basal slip [141]. The yield point data for the different deformation strain paths is summarised in Figures 4.1 to 4.3. It can be seen that for all alloys the samples oriented for prismatic and pyramidal slip activation have the highest yield strengths. In general, increasing the temperature decreased the yield stress, and increasing the Al concentration increased the yield stress. There was only one exception to this observation. The specimens that were cut at 45 to the rolling plane, which were deforming principally by basal slip, showed a drop in yield stress with increasing Al concentration. However, the drop is not statistically significant. In the following sections, this yield strength data will be used to estimate the CRSS for the four deformation modes, for three temperatures, as a function of Al concentration. Figure 4. 1 Effect of aluminium concentration on yield strength at -78 C
103 Chapter 4. Discussion on mechanical behaviour 103 Figure 4. 2 Effect of aluminium concentration on yield strength at room temperature Figure 4. 3 Effect of aluminium concentration on yield strength at 200 C
104 Chapter 4. Discussion on mechanical behaviour Tensile deformation to activate prismatic slip Tensile deformation of strongly textured rolled Mg is dominated by prismatic slip [141]. The tensile test is therefore considered an indicator of prismatic slip behaviour. The effect of Al content on the yield strength of the tensile specimen is depicted in Figure 3.8 for deformation at -78 C, room temperature and 200 C. The plots indicate solute hardening of the prismatic slip system with increasing Al concentration. At -78 C, the increase in yield strength from 0.2 to 5.0 wt% Al was almost 52 MPa, whereas at 200 C this difference was reduced to approximately 28 MPa (Table 3.1). The CRSS for prismatic slip is estimated from the relationship, CRSS = m. σ. The value of m is taken from literature, and is the average Schmid factor for prismatic slip in these specimens for this test orientation [142]. The effect of Al content on the estimated CRSS is plotted in Figure 4.4. It can be seen that for the present samples, the CRSS increases with Al concentration at all temperatures. The current data is compared with CRSS values taken from Akhtar and Teghtsoonian [12] published data on Mg-Zn and Mg-Al alloys. It can be seen that single crystal and polycrystal data are quite different. Single crystal do not show hardening instead show softening for some concentrations. (a) (b) Figure 4. 4 (a) Comparison of CRSS versus C 1/2 for current data with Literature (b) Comparison of CRSS versus C 1/2 for current data with Literature [12]
105 Chapter 4. Discussion on mechanical behaviour 105 Akhtar and Teghtsoonian [12] observed solute softening of the prismatic slip system with Al additions. They proposed that solutes decreases the stress required for cross slip of screw dislocations onto prismatic plane. Recently, a similar solute softening effect of Al on the prismatic plane has been reported [143]. They found softening of prismatic slip due to ease of both cross slip of dislocations and ability of dislocations to form a jog-pair. Also, Stanford and Barnett [17] investigated the effect of Zn concentration and grain size on prismatic slip system. Zn addition produced solute strengthening effect for grain sizes smaller than 50 µm and solute softening effect for grain sizes above 50 µm. They explained solute softening effect in larger grain size due to the reduction of stress required for cross slip in the presence of solutes, and solute hardening effects in smaller grain size where yielding is determined by Hall-Petch type hardening. It seems likely that the same explanation is consistent here: single crystal show solute softening, but polycrystals show solute hardening for the grain size of 20 µm which was examined here. The effect of Al content on the uniform elongation is shown in Figure 3.11 for the three test temperatures. It can be seen that the uniform elongation remains constant with increasing Al concentration. Total elongation also remains constant with the addition of Al. The reason that the ductility remains largely the same for all Al concentrations is because ductility is determined mainly by grain size and texture [16, 144, 145]. Since all samples had effectively the same grain size and texture, no significant change in ductility could be detected amongst the sample. 4.3 RD compression to activate twinning Compression of the RD orientation activates prolific {101 2} twinning, and yielding of this test type is known to be dictated by the initiation of twinning [105]. Therefore, the yield stress here is converted to an estimated CRSS by the equation, CRSS = m. σ, assuming m = 0.38 which is the average Schmid factor for twinning of this orientation.this analysis (Figure 4.5) indicates the solute hardening of the twinning system with increasing Al concentrations. Recently, Mathis et.al [143] reported the solute strengthening effect on twin growth for Mg-Al binary system. Their results are in good agreement with the present work, Figure 4.5.
106 Chapter 4. Discussion on mechanical behaviour 106 Figure 4. 5 Alloying effect on yielding defined by twinning estimated from experimental [143] and theoretical [146] research The effect of Al content on the maximum strength is shown in Figure 4.6 for the three test temperatures. It can be seen that at lower temperature, the maximum strength remained constant with the addition of Al. At higher temperatures, the maximum strength increased with addition of Al. The increment in maximum strength from 0.2 wt% to 5.0 wt% Al is approximately 82 MPa. Figure 4. 6 Alloying effect on maximum compressive strength at different temperatures
107 Chapter 4. Discussion on mechanical behaviour 107 Figure 4.7 compares the theoretical maximum with Figure 3.47 and shows that the volume fraction of twins was found to increase with increasing compressive strain in the current studies as well. Also, Figure 4.7 indicates that no distinct change was seen in volume fraction of twins with increasing concentration of Al. Therefore, although the stress increased slightly with Al concentration, the amount of strain accomodated by twinning remained unchanged. This is similar result to that observed in AZ91 where precipitation did not effect the volume fraction of twins [147]. Figure 4. 7 Alloying effect on volume fractions of twins during compression 4.4 ND compression to activate pyramidal slip Compression of the c-axis is known to activate <c+a> slip and in the following discussion this is assumed to be the dominant deformation mode. The effect of Al content on the yield strength of the <c+a> slip system is depicted in Figure 3.26(a) at -78 C, room temperature and 200 C. The plots indicate the solute hardening of the <c+a> slip system with increasing Al concentrations. Solute hardening of <c+a> slip has been reported by Obara et.al, in magnesium single crystals and also by Agnew et.al, in Mg and solid solution alloys containing Li or Y [72, 94]. The effect of Al content on the CRSS values is shown in Figure 4.8. For computing a change in CRSS, the graph of CRSS versus C 1/2 was extrapolated backwards to locate the y-intercept. This value is subtracted from the CRSS values to evaluate CRSS. The current data shows that CRSS value increases up to 4 times in the given range of Al concentration.
108 Chapter 4. Discussion on mechanical behaviour 108 Figure 4. 8 Comparison of CRSS versus C 1/2 for current data The effect of Al content on the maximum strength is shown in Figure 4.9 at -78 C, room temperature and 200 C. It can be seen that at low temperatures, the maximum strength remained constant with addition of Al concentration. At higher temperature, maximum strength increased with addition of Al. The magnitude of maximum strength is quite low at higher temperature than at lower temperature with Al additions.
109 Chapter 4. Discussion on mechanical behaviour 109 Figure 4. 9 Alloying effect on maximum strength and yield point at (a) -78 C, (b) RT and (c) 200 C compression to activate basal slip The effect of Al content on the yield strength of the 45 samples, oriented for basal slip, is depicted in Figure 3.34(a) at -78 C, room temperature and 200 C. The plots indicate the yield strength of basal slip remains insensitive to Al concentration at all temperatures. The yield stress is converted to CRSS by the relationship CRSS= σ * m, where m is the average Schmid factor for basal slip, The effect of Al content on the CRSS values is shown in Figure The current data is compared with CRSS values taken from published data by Akhtar and
110 Chapter 4. Discussion on mechanical behaviour 110 Teghtsoonian [11] on Mg-Al and Mg-Zn alloys. Mg-Zn data is used to compare the effect of solutes on CRSS along with Mg-Al alloys as the Mg-Al data from literature is limited to 0.2 wt% Al. It can be seen that Akhtar and Teghtsoonian measure a small increase in CRSS with Al concentration, but the present results show a small drop in stress. This is likely to be due to experimental error, and indicates only a small solute strengthening effect on the basal slip system. Figure Comparison of basal CRSS values from the present data against those from literature for different Al concentrations. The effect of Al content on the maximum strength is shown in Figure 3.34(b) at -78 C, room temperature and 200 C. It can be seen that at lower temperature, the maximum strength remained constant with addition of Al concentration. At higher temperature, maximum strength increased with addition of Al concentration. The difference in maximum strength is approximately 63 MPa for higher Al concentration.
111 Chapter 4. Discussion on mechanical behaviour Comparison of different deformation modes with varying solute concentration (a) (b) Figure Estimated CRSS values of slip and twinning systems at (a) room temperature and (b) 200 C, as a function of Al concentration The CRSS values obtained in tensile and compression tests for various solute concentrations are summarized in Figure 4.11 for selected temperature of 25 C and 200 C. It was found that at all temperatures, the <c+a> slip system shows the highest CRSS values, followed by prismatic slip, twinning and basal slip (τ pyramidal > τ prismatic > τ twin > τ basal ). The effect of solutes on the CRSS values of prismatic and <c+a> slip is quite distinct as seen in Figure At room temperature the difference in the maximum hardening was almost 60 MPa (between <c+a> and basal). This difference was reduced to 45 MPa at higher temperature. 4.6 Effect of temperature on prismatic slip In the results section it was shown that the flow stress decreases with increasing deformation temperature. During tension in the RD, prismatic slip {1011 0} <1122 0> is the main deformation due to the strong basal texture of the present samples. It is seen that the estimated CRSS for prismatic slip decreases with increasing temperature, Figure Prismatic slip dislocations cross slip from basal to the prismatic plane. This process is thermally activated, hence becomes easier at higher temperatures. Akhtar and Teghtsoonian report that the CRSS for prismatic slip decreases with increasing temperature [12]. A summary of literature data on prismatic slip is also shown in Figure Good agreement between the literature data on pure magnesium and the present specimens with low Al concentrations is found.
112 Chapter 4. Discussion on mechanical behaviour 112 Figure Effect of temperature on the ease of prismatic slip during tension in pure Mg The effect of temperature on uniform elongation is shown in Figure 3.10 at -78 C, room temperature and 200 C. It can be seen that the uniform elongation drops slightly with temperature, but this is not marked. Also, composition has very little effect on uniform elongation. However, Figure 3.10 shows that the ductility increases significantly with increasing temperature. Agnew [30] suggested that the ease of <c+a> slip is a critical factor in determining the ductility of textured magnesium sheets. Also, dynamic recrystallization is known to enhance ductility at higher temperatures [58]. Recently, Atwell et.al [148], reported similar results on ductility with increasing temperature for AZ31 magnesium alloy and suggested the importance of grain boundary sliding at higher temperatures. The results are compared in Figure 4.13 and Figure It can be seen that the similar ductility results are seen in the present alloys at room temperature and 200 C.
113 Chapter 4. Discussion on mechanical behaviour 113 Figure Variation of total elongation with temperature [148] Figure Variation of uniform elongation with temperature [148]
114 Chapter 4. Discussion on mechanical behaviour Effect of temperature on twinning Compressive deformation of RD specimens activates twinning. Therefore, the yield point is used to estimate the effect of temperature on the CRSS for twinning. The effect of temperature on the ease of twinning (during <a> axis compression) is shown in Figure Deformation twinning is known to be athermal [52]. Hence, the CRSS is not considered to be affected by deformation temperature. However, the CRSS was found here to decrease slightly with temperature. Agnew [95] has shown that approximately half of the strain in this orientation is accommodated by twinning. Therefore, the remaining yielding must be accommodated by slip. This explains the change in flow stress at higher temperatures. Slip tends to be affected by temperature, therefore, the drop in CRSS for the slip modes results in a drop in the yield strength of the RD compression specimens. Also, Roberts and Partridge [149] reported accommodation of {101 2} <1 011> twins by basal slip in magnesium. The stresses around the twin are accommodated by the formation of kink bands within the twins itself and for the opposite twin boundary, stresses are accommodated by packets of slip which propagate through the twin itself. Therefore, the slip accommodation process around the twin may also affect the measured macroscopic yield stress. Figure 4.15 shows that the estimated CRSS from the present polycrystal data is much higher than the single crystal data from literature [64, 66, 67]. The large difference in the estimated CRSS, compared to the measured data on single crystals is probably due to a grain size effect. Twinning is extremely grain size sensitive [150, 151]. Also, grain boundaries play a significant role in twin nucleation.
115 Chapter 4. Discussion on mechanical behaviour 115 Figure Effect of temperature on the ease of twinning during <a> axis compression
116 Chapter 4. Discussion on mechanical behaviour The effect of temperature on <c+a> pyramidal slip The estimated CRSS for pyramidal slip is shown as a function of temperature in Figure 4.16, along with data from literature. A good agreement between the single crystal values and the polycrystal data is found for low concentration alloys. Figure Effect of temperature on the ease of <c+a> slip during <c> axis compression 4.9 Effect of temperature on basal slip The effect of temperature on the ease of basal slip (during compression) is estimated in Figure It can be seen that basal slip is athermal, which is consistent with published literature [66]. The current data is higher than that found on single crystals, and this may be due to a grain size effect, but is more likely an indicator that in addition to basal slip, this compression test type also deforms by other slip modes which have a much higher CRSS than basal slip. Therefore, the yield stress is increased accordingly.
117 Chapter 4. Discussion on mechanical behaviour 117 Figure Effect of temperature on the ease of basal slip during compression
118 Chapter 4. Discussion on mechanical behaviour Comparison of the different deformation modes at different temperatures The CRSS values obtained in tensile and compression tests at various temperatures are summarized in Figure 4.18 for selected Al concentrations. At all Al concentrations, the <c+a> slip system shows the highest CRSS values, followed by prismatic slip, twinning and basal slip. The effect of temperature on the CRSS values of prismatic and <c+a> slip is quite noticeable in Figure Both of these deformation modes require cross slip, which is thermally activated. The decrease in CRSS at higher temperatures is due to thermal energy which assists dislocations to overcome the energy barriers resisting cross slip. The energy barrier to dislocation motion in non-basal slip system is quite high as compared with basal slip. As a result basal slip with lower energy barriers is found to be insensitive to temperature [66]. Cross-slip mechanisms also aids in the nucleation of pyramidal dislocations. The basal <a> dislocations cross slip onto prismatic planes and prismatic <a> dislocations interact with <c> dislocation forming <c+a> dislocations which cross slips onto pyramidal plane [84]. Since the pyramidal and prismatic systems are thermally activated, they are more sensitive to temperature change. (a) (b) Figure Estimated CRSS of slip and twinning systems in (a) 0.2 wt% Al and (b) 5.0 wt% Al On the other hand, twinning and basal slip are athermal. Therefore, there is no significant effect of temperature on the CRSS values of basal slip and tensile twinning. The change in flow stress at 200 C is likely to be due to DRX, and a change in the other deformation modes.
119 Chapter 4. Discussion on mechanical behaviour 119 A comparison of CRSS values for twinning with basal is shown in Figure It can be seen that the ratio of CRSStwin to CRSSbasal is found to be in good agreement with work done by Stanford and Barnett [136], and Ghazisaeidi [152] on Mg-Zn alloy. For 0.2 wt% Al, the CRSS values for twin were almost similar to the CRSS values for basal slip. For 5.0 wt% Al, the CRSS values for twin were significantly higher than the CRSS values for basal slip (see Figure 4.18). Hence, the ratio of CRSStwin to CRSSbasal is found to be increasing with solute content. Although the change in the ratio is found to be quite small ~ 3. Figure Comparison of τ twin / τ basal 4.11 Visco Plastic Self Consistent modelling The deformation in HCP materials can also be better understood using mathematical modelling to extract the contribution of the different deformation modes to plastic deformation. Modelling can also help us to predict and understand the deformation behaviour and texture change during deformation. The need for modelling arises as it is convenient to fit a large amount of experimental data. The modelling technique used is VPSC (Visco-Plastic Self consistent) Model. This model uses the approach that each grain is an ellipsoidal shape within an infinite and homogeneous effective medium. The properties of each grain is assumed to be similar to that of the average property of polycrystal.
120 Chapter 4. Discussion on mechanical behaviour 120 In this section, the simulated results are compared with the experimental results such as stress-strain response and mode activity Starting point for the VPSC model In this study to model the deformation process in tension and compression, the VPSC model developed by Tome and Lebensohn [96] is employed. The initial step involves generating an input texture file obtained from EBSD. The measured initial texture of the material consisted of 5000 orientations. The single crystal file is setup with four deformation modes active per grain which includes prismatic, basal, pyramidal <c+a> and {101 2} tensile twinning. Hardening of slip and twinning systems is defined by Voce-type hardening law. The evolution of the threshold stress (τc) as a function of accumulated shear strain (Γc) in each grain is given by ττ cc = ττ 00 + (ττ 11 + ΡΡ 11 ΓΓ cc ) [11 eeeeee ΡΡ 00 ΓΓ cc ] ττ 11 The single crystal parameters τ 0 (initial CRSS), ΡΡ 0 (initial hardening rate), ΡΡ 1 (asymptotic hardening rate), (τ 0 + τ 1) (the back extrapolated CRSS, see Figure 4.20) were set. In the present study, a (4 x 4) matrix of adjustable parameters is set for each deformation mode which also accounts for latent hardening. Figure Schematic representation of parameters governing Voce-type hardening law The initial parameters used in this modelling work were those described in the paper by Wang [141], see Table 4.1. The only changes made in the present case were modifications in the CRSS, which were initially predicted using the method described above where CCCCCCCC σσ. mm. Table 4.1 and 4.2 shows the model parameters used for simulating deformation at 25 C and 200 C.
121 Chapter 4. Discussion on mechanical behaviour 121 τ 0 τ 1 ΡΡ 0 ΡΡ 1 Latent Basal Variable parameter Prismatic Variable parameter Pyramidal Variable parameter Tensile twin Variable parameter Table 4. 1 Hardening parameters used for VPSC simulation at room temperature [95, 141] τ 0 τ 1 ΡΡ 0 ΡΡ 1 Latent Basal Variable parameter Prismatic Variable parameter Pyramidal Variable parameter Tensile twin Variable parameter Table 4. 2 Hardening parameters used for VPSC simulation at 200 C [95] For simulating the mechanical response of the material, different starting textures were set. RD (rolling direction) was defined along z-axis for tension and compression along RD. ND (normal direction) was defined along z-axis for compression along ND. For different deformation paths, an appropriate tension and compression files were generated defining the boundary conditions using incremental straining steps of The input boundary conditions involved defining velocity gradient and stress components for tension and compression files separately. The interaction strength between grain to its neighbour is assigned as neff = 10. Hence, the final simulated stress-strain curves were obtained after trying various CRSS ratios Tensile deformation to activate prismatic slip VPSC simulation results including the stress strain curves for different aluminium concentrations and temperatures are shown in Figure 4.21 to The stress-strain curves are plotted only in the plastic region. A reasonable prediction of tensile deformation is obtained at room temperature and 200 C. Akhtar and Teghtsoonian [12] reported solute softening of prismatic plane at low solute concentration (see Figure 4.4). Current work shows solute hardening of prismatic plane at high solute concentration, similar to Hutchison and Barnett [100] as well as Raeisinia and Agnew [87]. Figure 4.23 shows the comparison of the experimental yield strength with the simulated ones. The VPSC model reasonably predicts the yielding in tension.
122 Chapter 4. Discussion on mechanical behaviour 122 (a) (b) (c) Figure Comparison of experimental flow curves and VPSC simulation results for alloys containing (a) 0.2 wt% (b) 2.0 wt% and (c) 5.0 wt% Al at 25 C respectively during tensile deformation
123 Chapter 4. Discussion on mechanical behaviour 123 (a) (b) (c) Figure Comparison of experimental flow curves and VPSC simulation results for alloys containing (a) 0.2 wt% (b) 2.0 wt% and (c) 5.0 wt% Al at 200 C respectively during tensile deformation.
124 Chapter 4. Discussion on mechanical behaviour 124 Figure Comparison of experimental yield strength values for prismatic slip with the simulated yield strengths For 5.0 wt% Al at 200 C, simulated results did not fit at higher strains. The model predicts that the deformation is mainly dominated by prismatic and basal slip for 5.0 wt% Al. The relative slip activity is shown in Figure Also, the model predicts additional pyramidal <c+a> slip for 0.2 wt% Al at higher strains along with prismatic and basal slip, which is not present for 5.0 wt% Al. The twinning activity is not seen in the plot due to negligible input.
125 Chapter 4. Discussion on mechanical behaviour 125 (a) (b) Figure Predicted slip activities during tensile deformation at (a) room temp (b) 200 C <a> axis compression to activate twinning The experimental and VPSC simulation results of stress strain response for samples undergoing <a> axis compression are shown in Figure 4.25 to Figure 4.27 shows the comparison of the experimental yield strength with the predicted results. The model predictions are in good agreement with the experimental yield strength. Jain and Agnew [95] assumed that twinning hardens with temperature for metals with twin dominated deformation. There was a slight decrease in twinning stresses with increasing temperature. It was observed that there was a slight increase in the twinning stresses with increasing Al concentration. Hence, a small degree of hardening was used in the VPSC model for predicting the effect of solute on the twinning stresses.
126 Chapter 4. Discussion on mechanical behaviour 126 (a) (b) (c) Figure Comparison of experimental flow curves and VPSC simulation results for alloys containing (a) 0.2 wt% (b) 2.0 wt% and (c) 5.0 wt% Al at 25 C respectively during <a> axis compression
127 Chapter 4. Discussion on mechanical behaviour 127 (a) (b) (c) Figure Comparison of experimental flow curves and VPSC simulation results for alloys containing (a) 0.2 wt% (b) 2.0 wt% and (c) 5.0 wt% Al at 200 C respectively during <a> axis compression
128 Chapter 4. Discussion on mechanical behaviour 128 Figure Comparison of experimental yield strength values for twinning with the simulated yield strengths The simulated results did not fit at higher strains for both temperatures. At room temperature, the relative twinning activity drops at higher strains (see Figure 4.28). Also, there was a significant drop in the twinning activity at 200 C.
129 Chapter 4. Discussion on mechanical behaviour 129 (a) Figure Predicted twinning and slip activities during <a> axis compression at (a) room Temperature and (b) 200 C (b)
130 Chapter 4. Discussion on mechanical behaviour c- axis compression to activate <c+a> slip The experimental and VPSC simulation results of stress strain response for samples undergoing c- axis compression are shown in Figure 4.29 to Figure 4.31 shows the comparison of the experimental yield strength with the predicted results. The model predictions are in good agreement with the experimental yield strength. (a) (b) (c) Figure Comparison of experimental flow curves and VPSC simulation results for alloys containing (a) 0.2 wt% (b) 2.0 wt% and (c) 5.0 wt% Al at 25 C respectively during c-axis compression
131 Chapter 4. Discussion on mechanical behaviour 131 (a) (b) (c) Figure Comparison of experimental flow curves and VPSC simulation results for alloys containing (a) 0.2 wt% (b) 2.0 wt% and (c) 5.0 wt% Al at 200 C respectively during c-axis compression
132 Chapter 4. Discussion on mechanical behaviour 132 Figure Comparison of experimental yield strength values for <c+a> slip with the simulated yield strengths The relative activity for each deformation mode room temperature and 200 C is shown in Figure There is negligible twin and prismatic activity at room temperature. The deformation along c- axis is mainly accommodated by pyramidal and basal slip systems. At higher temperature, the <c+a> activity drops significantly for 5.0 wt% Al. This can be explained by the fact that VPSC only accounts for intergranular deformation in polycrystals. It does not takes into consideration DREX and Grain boundary sliding mechanism. Hence, the percentage of basal activity almost remained unchanged for 0.2 wt % Al and 5.0 wt% Al irrespective of the temperature.
133 Chapter 4. Discussion on mechanical behaviour 133 (a) Figure Predicted slip activities during tensile deformation at (a) room temp (b) 200 C (b)
134 Chapter 4. Discussion on mechanical behaviour Comparison of the different deformation modes (a) (b) Figure Initial τ 0 values of slip and twinning systems at (a) room temperature and (b) 200 C, as a function of Al concentration For the present simulations, the hardening parameters including τ1, H0, H1 and latent hardening were kept constant for room temperature [141] and 200 C [95], therefore the only parameter varied was the τ0 values (the critical resolved shear stress CRSS). The τ0 values optimised for each of the slip and twinning systems are shown in Figure At all Al concentrations, the <c+a> slip system shows the highest CRSS values, followed by prismatic slip, twinning and basal slip. Twinning and basal slip are athermal modes, therefore these were kept constant for the two test temperatures. However a significant drop in CRSS can be seen for the prismatic and pyramidal slip systems with increasing deformation temperature. The effect of aluminium concentration was quite different for the three slip modes. Al did not harden the basal slip system, but did increase the CRSS for the two non-basal slip modes. A solute hardening of the twin system was also observed from the simulations.
135 Chapter 4. Discussion on mechanical behaviour Comparison of experimental and simulated CRSS values The initial estimation of the CRSS values were made by multiplying the Schmid factor by the yield point for the relevant test type. These estimates were used to guide the VPSC simulations. These experimental estimates are shown with the refined simulation values in Fig and The experimental estimates were in good agreement with those obtained from VPSC simulations. This suggests that solutes play a significant role on mechanical response of Mg-Al alloys for various deformation modes [100]. At all Al concentrations, the <c+a> slip system shows the highest CRSS values, followed by prismatic slip and twinning. The decrease in CRSS values at higher temperatures is quite noticeable for prismatic and <c+a> slip systems (see Figure 4.34 and 4.35), probably because these are thermally activated deformation modes that rely on cross-slip mechanisms for dislocation propagation. There is no significant effect of temperature on the CRSS values of twinning.
136 Chapter 4. Discussion on mechanical behaviour 136 Figure Comparison of simulated CRSS values with the experimental CRSS values for each deformation mode at room temperature Figure Comparison of simulated CRSS values with the experimental CRSS values for values for each deformation mode at 200 C
137 Chapter 5. Discussion on Dynamic Recrystallization 137 Chapter 5 Discussion on Dynamic Recrystallization
138 Chapter 5. Discussion on Dynamic Recrystallization 138 The process of recrystallization takes place during plastic deformation at elevated temperatures. In this course of study, recrystallization studies is carried out on Mg-Al system. This discussion chapter aims to investigate the effect of Al concentration, strain and applied stress on dynamic recrystallization (DRX). In chapter 3, it was shown that DRX takes place during hot deformation of magnesium alloy. Optical micrographs and EBSD was used to confirm the presence of very small DREX grains. Evidence of DRX is seen during tension and compression at 200 C (see chapter 3, Figures ). Small DREX grains was observed along the grain boundaries. Table 3.1 shows the results of quantitative analysis on DRX grain size, stress, uniform strain and volume fraction of DRX grains. The data from Table 3.1 is shown graphically in Figure 5.1. (a) (b) (c) (d) Figure 5. 1 Alloying effect on (a) volume fraction of DRX grains and (b) DRX grain size Effect of maximum stress on (c) volume fraction of DRX grains and (d) DRX grain size
139 Chapter 5. Discussion on Dynamic Recrystallization 139 It can be seen that Al has a significant effect on the volume fraction of DRX grains. The above graph shows that with increasing concentration of Aluminium, the volume fraction of DRX grains decreases. It is seen that at lower Al concentration more that 85% of the grains are DRX whereas at higher concentrations the volume fraction of DRX grains reduces to less than 10%. Figure 5.3(b) shows the effect of Al concentration on DRX grain size. It is evident from the plot that the size of DRX grains decreases with increasing Al concentration for all deformation modes. A power-law relationship between steady state stress (deformation stress) and steady-state grain size (mean recrystallized grain size) is typically observed in many materials (σs= K Ds -N ), where K is expressed as a function of grain boundary diffusivity and volume lattice diffusivity and N < 1 [153]. Therefore, the present observation of a smaller steady state grain size with increasing Al concentration is consistent with this relationship [130]. Figure 5.1(c) shows the effect of stress on volume fraction of DRX grains. It is clear from the above graph that increase in stress leads to decrease in the volume fraction of DRX grains. This effect is likely due to higher Al concentration since Al increases the flow stress of the materials tested here. The peak in the flow stress curve of a material undergoing DRX is generally broadened with increasing solute content [30, 130, 154]. Figure 5.1(d) shows the effect of stress on DRX grain size for different deformation modes. The size of the recrystallized grains decreased with the increase in maximum stress, this is again due to the increasing aluminium content. It is reported that solute additions raise the peak stress and peak strain [137, 155]. Solute additions effect the nucleation of DDRX and also retards the kinetics of recrystallization. The results of the current work is compared with the work done by Derby which explains the dependence of steady state grain size on flow stress during hot deformation (see Figure 5.2). Material used in the current study is Mg-Al and Derby worked on pure Mg. In Figure 5.2(b), the normalised grain size was calculated using the Burgers vector for basal activity [156]. The magnitude of the burgers vector used is 0.32 nm. VPSC model shows that basal slip is a dominant mode in all testing conditions in the present study, see Chapter 4. The calculated values for normalised grain size are in good agreement with the values obtained by Derby for different metals, when a single value for burgers vector is used. In the course of this study, it is also seen that the normalised stress decreases for all deformation modes with decreasing solute concentration. Furthermore it can also be seen that the normalised DRX grain size was found to be decreasing with increasing solute concentration.
140 Chapter 5. Discussion on Dynamic Recrystallization 140 (a) (b) Figure 5. 2 The relationship between DRX grain size and flow stress at higher temperature [157] 5.1 Effect of solute drag on dynamic recrystallization Solute drag is temperature, composition and boundary velocity dependant. If the grain boundary migration velocity is quite low, then mobility of solute atoms becomes easier. However, when the velocity is very high, the mobility of solute atoms produces a retarding solute drag. Various solute drag models determine the effect of solute segregation on retarding the grain boundary migration. A classical model by Lücke and Detert [158] explained the influence of impurities on grain boundary motion and recrystallization. Their quantitative formulation was examined in detail by Cahn [159]. Cahn explained the dependence of solute drag on the boundary velocity with respect to the diffusivity of the solute and its interaction with the grain boundary. Later known as CLS (Cahn-Lücke-Stüwe) model was extended by Lücke and Stüwe [160] for the evaluation of the rate at which grain boundaries migrate in the presence of solutes. Recently, Robson [135] used two classical models (Langmuir McClean and Cahn Lücke Stüwe) to explore the effect of rare-earth additions on grain boundary segregation in wrought magnesium alloys. This same approach is adopted here. For the present work CLS version will be used to evaluate the drag pressure in Mg-Al binary alloys. This will explain the solute drag effect on grain boundary migration through sparse solutes to dense solutes. CLS model proposed the following expression for drag pressure due to solute, PP dd = ανxx MM 1+ ββ 2 νν 2 [Equation-3]
141 Chapter 5. Discussion on Dynamic Recrystallization 141 Where X M is the bulk concentration explained by LM (Langmuir McClean) model [161] under equilibrium conditions, v is the boundary velocity and α and β are the diffusion and free energy profiles evaluated using the following expressions, aa = RRRR llllll DD δδgg ssssss DD GGGG [Equation-4] αα = 4RR2 TT 2 V mm GG2 ssssss DD 1 aa 3 aa [Equation-5] αα = 2GG ssssss DD GGGG 1 ββ 2 VV mm aa DD DD GGGG [Equation-6] Where D is the bulk diffusion coefficient of solute, D GB is the grain boundary diffusion coefficient, G seg is the free energy segregation, and R is the gas constant and V m the molar volume. During their interaction with a moving boundary, solute atoms maintain a concentration profile depending on the solute diffusivity and free energy profiles. Figure 5.3 shows the variation of solute diffusivity and free energy of segregation with the distance x, along the grain boundary plane. Figure 5. 3 Assumed variation of solute diffusivity and free energy of segregation with the distance along the grain boundary plane [135]
142 Chapter 5. Discussion on Dynamic Recrystallization 142 Also, Arrhenius equation [162] is used for calculating bulk diffusion, DD = DD 0 exp QQ kk BB TT [Equation-7] Where k B is the Boltzmann constant, the Arrhenius parameters are the activation energy, Q and the pre-exponential factor, D 0. For the present work Gas constant, R is used for calculations instead of Boltzmann constant, since the activation energy is in terms of joules per moles. For aluminium in Mg, D 0 and Q for bulk diffusion were given by Kulkarni and Luo [163]. For GB diffusion, approximation was made that QGB 0.5 Q [164]. Calculations of the solute drag pressure using the equation (3) is plotted as a function of solute concentration for boundary velocity of 10 nms -1 for Mg-Al binary alloys under equilibrium conditions (see Figure 5.4). The values of all the parameters used are summarized in Table 5.1. These values are used for calculating α (Equation 5) and β (Equation 6), the diffusion and free energy profiles. The values of α and β are required to calculate the solute drag pressure using the equation (3). Parameter R, gas constant Value J/mol.K Gseg, grain boundary segregation 1 kj/mol Vm,molar volume 10-5 m 3 /mol T, temperature 473 K ν, boundary velocity 10-8 m/s Table 5. 1 Values of parameters used in the calculations of solute drag pressure under equilibrium conditions
143 Chapter 5. Discussion on Dynamic Recrystallization 143 Figure 5. 4 Predicted solute drag pressure as a function of solute concentration for atomic percent addition of Al to Mg under equilibrium conditions The average velocity of the DREX grain in the present specimens was determined by measuring the grain size, and dividing this by the time duration of the test. This velocity was used to make the solute drag calculations for the four deformation orientations and six alloys. This data is summarised in Figure 5.5. The drag pressure is found to increase with an increase in solute concentration. This is likely to have significant consequences for the effect of Al solute on recrystallization process. The calculated drag pressure was quite consistent between the four different deformation modes.
144 Chapter 5. Discussion on Dynamic Recrystallization 144 Figure 5. 5 Comparison of solute drag pressure during equilibrium segregation with deformed conditions This analysis shows that the CLS model predicts Al to have a strong retarding effect on DRX during deformation. This is consistent with what is observed experimentally, that at 200 C the Al concentration has a strong effect on reducing both the DRX grain size and the volume fraction of DRX. The DREX process is discontinuous, it has a nucleation and a growth stage. Cram et al [130] have suggested that solute hinder nucleation more than growth in Cu-Sn alloys. However, in the present case, we find that nucleation at grain boundaries is prolific, see for example Figure 5.6. The addition of Al reduces the size of grains, Figure 5.1(b). Therefore in the present case it is more likely that the presence of solutes hinders the growth of DREX grains, but does not appear to hinder their nucleation at the grain boundaries.

145 Chapter 5. Discussion on Dynamic Recrystallization 145 Figure 5. 6 DRX for 5.0 wt % Al at 25% strain
Design of High Strength Wrought Magnesium Alloys!
 Design of High Strength Wrought Magnesium Alloys! Joseph Robson! School of Materials! University of Manchester UK! joseph.robson@manchester.ac.uk! ! Strengthening of Mg! Mg has low density (2/3 Al, 1/4
Fundamentals of Plastic Deformation of Metals
 We have finished chapters 1 5 of Callister s book. Now we will discuss chapter 10 of Callister s book Fundamentals of Plastic Deformation of Metals Chapter 10 of Callister s book 1 Elastic Deformation
STRENGTHENING MECHANISM IN METALS
 Background Knowledge Yield Strength STRENGTHENING MECHANISM IN METALS Metals yield when dislocations start to move (slip). Yield means permanently change shape. Slip Systems Slip plane: the plane on which
CHAPTER 4 1/1/2016. Mechanical Properties of Metals - I. Processing of Metals - Casting. Hot Rolling of Steel. Casting (Cont..)
") Processing of Metals - Casting CHAPTER 4 Mechanical Properties of Metals - I Most metals are first melted in a furnace. Alloying is done if required. Large ingots are then cast. Sheets and plates are then
Processing of Metals - Casting CHAPTER 4 Mechanical Properties of Metals - I Most metals are first melted in a furnace. Alloying is done if required. Large ingots are then cast. Sheets and plates are then
Module-6. Dislocations and Strengthening Mechanisms
 Module-6 Dislocations and Strengthening Mechanisms Contents 1) Dislocations & Plastic deformation and Mechanisms of plastic deformation in metals 2) Strengthening mechanisms in metals 3) Recovery, Recrystallization
Chapter Outline Dislocations and Strengthening Mechanisms. Introduction
 Chapter Outline Dislocations and Strengthening Mechanisms What is happening in material during plastic deformation? Dislocations and Plastic Deformation Motion of dislocations in response to stress Slip
Strengthening Mechanisms
 Strengthening Mechanisms The ability of a metal/ alloy to plastically deform depends on the ability of dislocations to move. Strengthening techniques rely on restricting dislocation motion to render a
Lecture # 11 References:
 Lecture # 11 - Line defects (1-D) / Dislocations - Planer defects (2D) - Volume Defects - Burgers vector - Slip - Slip Systems in FCC crystals - Slip systems in HCP - Slip systems in BCC Dr.Haydar Al-Ethari
Influence of Texture on the Plastic Anisotropy of Mg Alloy Determined by Experimental and Numerical Investigation
 International Journal of Innovations in Materials Science and Engineering (IMSE), VOL. 1, NO. 3 108 Influence of Texture on the Plastic Anisotropy of Mg Alloy Determined by Experimental and Numerical Investigation
Formability and Crystallographic Texture in Novel Magnesium Alloys
 Formability and Crystallographic Texture in Novel Magnesium Alloys Carlos Soto, Dr. Pnina Ari-Gur, Andreas, Quojo Quainoo, Dr. Betsy Aller, Dr. Andrew Kline Western Michigan University Abstract By looking
Texture Characteristics and Anisotropic Superplasticity of AZ61 Magnesium Alloy
 Materials Transactions, Vol. 44, No. 11 (2003) pp. 2276 to 2281 #2003 The Japan Institute of Metals Texture Characteristics and Anisotropic Superplasticity of AZ61 Magnesium Alloy Y. N. Wang 1;2 and J.
Materials and their structures
 Materials and their structures 2.1 Introduction: The ability of materials to undergo forming by different techniques is dependent on their structure and properties. Behavior of materials depends on their
Twins & Dislocations in HCP Textbook & Paper Reviews. Cindy Smith
 Twins & Dislocations in HCP Textbook & Paper Reviews Cindy Smith Motivation Review: Outline Crystal lattices (fcc, bcc, hcp) Fcc vs. hcp stacking sequences Cubic {hkl} naming Hcp {hkil} naming Twinning
Evolution of texture in an ultrafine and nano grained magnesium alloy
 Journal of Ultrafine Grained and Nanostructured Materials Vol.48, No.1, June 2015, pp.11-16 Evolution of texture in an ultrafine and nano grained magnesium alloy S.M. Fatemi 1* and Abbas Zarei-Hanzki 2
Materials Issues in Fatigue and Fracture. 5.1 Fundamental Concepts 5.2 Ensuring Infinite Life 5.3 Failure 5.4 Summary
 Materials Issues in Fatigue and Fracture 5.1 Fundamental Concepts 5.2 Ensuring Infinite Life 5.3 Failure 5.4 Summary 1 A simple view of fatigue 1. Will a crack nucleate? 2. Will it grow? 3. How fast will
Recrystallization Theoretical & Practical Aspects
 Theoretical & Practical Aspects 27-301, Microstructure & Properties I Fall 2006 Supplemental Lecture A.D. Rollett, M. De Graef Materials Science & Engineering Carnegie Mellon University 1 Objectives The
THE TEXTURE STRENGTHENING EFFECT IN A MAGNESIUM ALLOY PROCESSED BY SEVERE PLASTIC DEFORMATION
 The Rev. texture Adv. Mater. strengthening Sci. 31 (2012) effect 157-162 in a magnesium alloy processed by severe plastic deformation 157 THE TEXTURE STRENGTHENING EFFECT IN A MAGNESIUM ALLOY PROCESSED
Dislocations and Plastic Deformation
 Dislocations and Plastic Deformation Edge and screw are the two fundamental dislocation types. In an edge dislocation, localized lattice distortion exists along the end of an extra half-plane of atoms,
Mechanical behavior of crystalline materials - Stress Types and Tensile Behaviour
 Mechanical behavior of crystalline materials - Stress Types and Tensile Behaviour 3.1 Introduction Engineering materials are often found to posses good mechanical properties so then they are suitable for
The Effect of Crystallographic Texture on the Wrap Bendability in AA5754-O Temper Sheet Alloy
 Proceedings of the 12th International Conference on Aluminium Alloys, September 5-9, 2010, Yokohama, Japan 2010 The Japan Institute of Light Metals pp. 607-612 607 The Effect of Crystallographic Texture
The Deformation Behavior of Rare-earth Containing Mg Alloys
 The Deformation Behavior of Rare-earth Containing Mg Alloys Ajith Chakkedath 1, C.J. Boehlert 1,2, Z. Chen 1, M.T. Perez-Prado 2, J. Llorca 2, J. Bohlen 3, S. Yi 3, and D. Letzig 3. 1 Michigan State University,
Mechanical Properties
 Mechanical Properties Elastic deformation Plastic deformation Fracture II. Stable Plastic Deformation S s y For a typical ductile metal: I. Elastic deformation II. Stable plastic deformation III. Unstable
Texture development during cold and warm rolled samples of AZ31B magnesium alloy
 Texture development during cold and warm rolled samples of AZ31B magnesium alloy Litzy L. Choquechambi Catorceno1;Luis Flavio Gaspar Herculano1; Hamilton Ferreira Gomes de Abreu 1 1UFC (Federal University
Author s Accepted Manuscript
 Author s Accepted Manuscript The effect of size, orientation and alloying on the deformation of AZ31 nanopillars Zachary H. Aitken, Haidong Fan, Jaafar A. El- Awady, Julia R. Greer www.elsevier.com/locate/jmps
Microstructural evolution of Al Zn Mg Cu (Sc) alloy during hot extrusion and heat treatments
 alloy during hot extrusion and heat treatments") Journal of Materials Processing Technology 155 156 (2004) 1330 1336 Microstructural evolution of Al Zn Mg Cu (Sc) alloy during hot extrusion and heat treatments Dong-Woo Suh a,, Sang-Yong Lee a, Kyong-Hwan
Journal of Materials Processing Technology 155 156 (2004) 1330 1336 Microstructural evolution of Al Zn Mg Cu (Sc) alloy during hot extrusion and heat treatments Dong-Woo Suh a,, Sang-Yong Lee a, Kyong-Hwan
Strain Capacities Limits of Wrought Magnesium Alloys: Tension vs. Expansion
 Materials Sciences and Applications, 213, 4, 768-772 Published Online December 213 (http://www.scirp.org/journal/msa) http://dx.doi.org/1.4236/msa.213.41297 Strain Capacities Limits of Wrought Magnesium
a. 50% fine pearlite, 12.5% bainite, 37.5% martensite. 590 C for 5 seconds, 350 C for 50 seconds, cool to room temperature.
 Final Exam Wednesday, March 21, noon to 3:00 pm (160 points total) 1. TTT Diagrams A U.S. steel producer has four quench baths, used to quench plates of eutectoid steel to 700 C, 590 C, 350 C, and 22 C
A DISLOCATION MODEL FOR THE PLASTIC DEFORMATION OF FCC METALS AN ANALYSIS OF PURE COPPER AND AUSTENITIC STEEL
 A DISLOCATION MODEL FOR THE PLASTIC DEFORMATION OF FCC METALS AN ANALYSIS OF PURE COPPER AND AUSTENITIC STEEL Background In the bcc model for work hardening in single phase materials, see (6), it is assumed
Influence of Grain Size and Texture on the Yield Asymmetry of Mg-3Al-1Zn Alloy
 J. Mater. Sci. Technol., 2011, 27(1), 29-34. Influence of Grain Size and Texture on the Yield Asymmetry of Mg-3Al-1Zn Alloy S.M. Yin 1), C.H. Wang 1), Y.D. Diao 1), S.D. Wu 2) and S.X. Li 2) 1) Shenyang
Phase Transformations in Metals Tuesday, December 24, 2013 Dr. Mohammad Suliman Abuhaiba, PE 1
 Ferrite - BCC Martensite - BCT Fe 3 C (cementite)- orthorhombic Austenite - FCC Chapter 10 Phase Transformations in Metals Tuesday, December 24, 2013 Dr. Mohammad Suliman Abuhaiba, PE 1 Why do we study
- Slip by dislocation movement - Deformation produced by motion of dislocations (Orowan s Eq.)
") Lecture #12 - Critical resolved shear stress Dr. Haydar Al-Ethari - Slip y dislocation movement - Deformation produced y motion of dislocations (Orowan s Eq.) References: 1- Derek Hull, David Bacon, (2001),
Lecture #12 - Critical resolved shear stress Dr. Haydar Al-Ethari - Slip y dislocation movement - Deformation produced y motion of dislocations (Orowan s Eq.) References: 1- Derek Hull, David Bacon, (2001),
Texture Evolution of AZ31 Magnesium Alloy Sheet at High Strain Rates*
 Texture Evolution of AZ31 Magnesium Alloy Sheet at High Strain Rates* I. Ulacia 1, S. Yi 2, M.T. Pérez-Prado 3, N.V. Dudamell 3, F. Gálvez 4, D. Letzig 2 and I. Hurtado 1 1 Mondragon Goi Eskola Politeknikoa,
Creep and High Temperature Failure. Creep and High Temperature Failure. Creep Curve. Outline
 Creep and High Temperature Failure Outline Creep and high temperature failure Creep testing Factors affecting creep Stress rupture life time behaviour Creep mechanisms Example Materials for high creep
MICROSTRUCTURAL INVESTIGATION OF SPD PROCESSED MATERIALS CASE STUDY
 TEQIP Workshop on HRXRD, IIT Kanpur, 05 Feb 2016 MICROSTRUCTURAL INVESTIGATION OF SPD PROCESSED MATERIALS CASE STUDY K.S. Suresh Department of Metallurgical and Materials Engineering Indian Institute of
Online publication date: 12 May 2010
 This article was downloaded by: [Los Alamos National Laboratory] On: 15 June 2010 Access details: Access Details: [subscription number 918146894] Publisher Taylor & Francis Informa Ltd Registered in England
Impurities in Solids. Crystal Electro- Element R% Structure negativity Valence
 4-4 Impurities in Solids 4.4 In this problem we are asked to cite which of the elements listed form with Ni the three possible solid solution types. For complete substitutional solubility the following
The influence of aluminium alloy quench sensitivity on the magnitude of heat treatment induced residual stress
 Materials Science Forum Vols. 524-525 (26) pp. 35-31 online at http://www.scientific.net (26) Trans Tech Publications, Switzerland The influence of aluminium alloy quench sensitivity on the magnitude of
Engineering 45: Properties of Materials Final Exam May 9, 2012 Name: Student ID number:
 Engineering 45: Properties of Materials Final Exam May 9, 2012 Name: Student ID number: Instructions: Answer all questions and show your work. You will not receive partial credit unless you show your work.
Tensile Testing. Objectives
 Laboratory 3 Tensile Testing Objectives Students are required to understand the principle of a uniaxial tensile testing and gain their practices on operating the tensile testing machine to achieve the
TENSION/COMPRESSION ASYMMETRY IN CREEP BEHAVIOR OF A Ni-BASED SUPERALLOY
 Pergamon Scripta Materialia, Vol. 41, No. 5, pp. 461 465, 1999 Elsevier Science Ltd Copyright 1999 Acta Metallurgica Inc. Printed in the USA. All rights reserved. 1359-6462/99/$ see front matter PII S1359-6462(99)00191-8
Microstructural and Textural Evolution by Continuous Cyclic Bending and Annealing in a High Purity Titanium
 Materials Transactions, Vol. 45, No. 9 (24) pp. 2826 to 2831 #24 The Japan Institute of Metals Microstructural and Textural Evolution by Continuous Cyclic Bending and Annealing in a High Purity Titanium
ENGN2340 Final Project Computational rate independent Single Crystal Plasticity with finite deformations Abaqus Umat Implementation
 ENGN2340 Final Project Computational rate independent Single Crystal Plasticity with finite deformations Abaqus Umat Implementation Anastasia Tzoumaka Fall 2017 Intorduction: Single crystals, are monocrystalline
Mohammad Anwar Karim Id :
 Department of Mechanical and Industrial Engineering ME 8109 Casting and Solidification of Materials EFFECTS OF RAPID SOLIDIFICATION ON MICROSTRUCTURE AND PROPERTIES OF AL, MG & TI ALLOYS Winter 2012 Presented
MATERIALS SCIENCE-44 Which point on the stress-strain curve shown gives the ultimate stress?
 MATERIALS SCIENCE 43 Which of the following statements is FALSE? (A) The surface energy of a liquid tends toward a minimum. (B) The surface energy is the work required to create a unit area of additional
where n is known as strain hardening exponent.
 5.1 Flow stress: Flow stress is the stress required to sustain a certain plastic strain on the material. Flow stress can be determined form simple uniaxial tensile test, homogeneous compression test, plane
Mechanical behavior of crystalline materials- Comprehensive Behaviour
 Mechanical behavior of crystalline materials- Comprehensive Behaviour In the previous lecture we have considered the behavior of engineering materials under uniaxial tensile loading. In this lecture we
11.3 The analysis of electron diffraction patterns
 11.3 The analysis of electron diffraction patterns 277 diameter) Ewald reflecting sphere, the extension of the reciprocal lattice nodes and the slight buckling of the thin foil specimens all of which serve
Behaviour of Magnesium Alloy Under Load-Control Cyclic Testing
 Behaviour of Magnesium Alloy Under Load-Control Cyclic Testing by Bahareh Marzbanrad A thesis presented to the University of Waterloo in fulfillment of the thesis requirement for the degree of Master of
Limitation of current hardening models in predicting anisotropy by twinning in hcp metals: Application to a rod-textured AM30 magnesium alloy
 Magnesium Technology 211 Edited by: Wim H. Sillekens, Sean R. Agnew, Neale R. Neelameggham, and Suveen N. Mathaudhu TMS (The Minerals, Metals & Materials Society), 211 Limitation of current hardening models
Cyclic Fatigue Testing of Wrought Magnesium AZ80 Alloy for Automotive Wheels
 Cyclic Fatigue Testing of Wrought Magnesium AZ80 Alloy for Automotive Wheels MATLS 701 Oct 21, 2009 Geoff Rivers Supervisor Dr. Marek Niewczas Overview Introduction Background Previous work Research objectives
1) Fracture, ductile and brittle fracture 2) Fracture mechanics
 Fracture, ductile and brittle fracture 2) Fracture mechanics") Module-08 Failure 1) Fracture, ductile and brittle fracture 2) Fracture mechanics Contents 3) Impact fracture, ductile-to-brittle transition 4) Fatigue, crack initiation and propagation, crack propagation
Module-08 Failure 1) Fracture, ductile and brittle fracture 2) Fracture mechanics Contents 3) Impact fracture, ductile-to-brittle transition 4) Fatigue, crack initiation and propagation, crack propagation
Lectures on: Introduction to and fundamentals of discrete dislocations and dislocation dynamics. Theoretical concepts and computational methods
 Lectures on: Introduction to and fundamentals of discrete dislocations and dislocation dynamics. Theoretical concepts and computational methods Hussein M. Zbib School of Mechanical and Materials Engineering
TOPIC 2. STRUCTURE OF MATERIALS III
 Universidad Carlos III de Madrid www.uc3m.es MATERIALS SCIENCE AND ENGINEERING TOPIC 2. STRUCTURE OF MATERIALS III Topic 2.3: Crystalline defects. Solid solutions. 1 PERFECT AND IMPERFECT CRYSTALS Perfect
Chapter 15 Fundamentals of Metal Forming. Materials Processing. Deformation Processes. MET Manufacturing Processes
 MET 33800 Manufacturing Processes Chapter 15 Fundamentals of Metal Forming Before you begin: Turn on the sound on your computer. There is audio to accompany this presentation. Materials Processing Chapters
Materials Science & Engineering A
 Materials Science & Engineering A 682 (2017) 354 358 Contents lists available at ScienceDirect Materials Science & Engineering A journal homepage: www.elsevier.com/locate/msea Short communication Room
Point Defects. Vacancies are the most important form. Vacancies Self-interstitials
 Grain Boundaries 1 Point Defects 2 Point Defects A Point Defect is a crystalline defect associated with one or, at most, several atomic sites. These are defects at a single atom position. Vacancies Self-interstitials
In situ analysis of the influence of twinning on the strain hardening rate and fracture mechanism in AZ31B magnesium alloy
 J Mater Sci (2015) 50:2532 2543 DOI 10.1007/s10853-014-8812-0 In situ analysis of the influence of twinning on the strain hardening rate and fracture mechanism in AZ31B magnesium alloy Michal Gzyl Raphaël
Deformation behavior of electro-deposited pure Fe and its texture evolution during cold-rolling and subsequent annealing
 IOP Conference Series: Materials Science and Engineering PAPER OPEN ACCESS Deformation behavior of electro-deposited pure Fe and its texture evolution during cold-rolling and subsequent annealing To cite
Local buckling of slender aluminium sections exposed to fire. Residual stresses in welded square hollow sections of alloy 5083-H111
 Netherlands Institute for Metals Research Eindhoven University of Technology TNO Built Environment and Geosciences Report no. 8 Local buckling of slender aluminium sections exposed to fire Residual stresses
AN OVERVIEW OF THE HISTORY OF PLASTICITY THEORY
 1 AN OVERVIEW OF THE HISTORY OF PLASTICITY THEORY INTRODUCTION Plasticity theory deals with yielding of materials, often under complex states of stress. Plastic deformation, unlike elastic deformation,
Module 1. Principles of Physical Metallurgy: an introduction to the course content. Lecture 1
 Module 1 Principles of Physical Metallurgy: an introduction to the course content Lecture 1 Principles of Physical Metallurgy: an introduction to the course content 1 Keywords: Cost of metals & materials,
An Investigation of the Effect of Anisotropy on the Thermomechanical Behavior of Textured Nickel/Titanium Shape Memory Alloys
 An Investigation of the Effect of Anisotropy on the Thermomechanical Behavior of Textured Nickel/Titanium Shape Memory Alloys Anthony Wheeler Advisor: Dr. Atef Saleeb Honors research Project Abstract The
PROPERTIES OF CAST MAGNESIUM MATRIX COMPOSITES AT ELEVATED TEMPERATURES
 PROPERTIES OF CAST MAGNESIUM MATRIX COMPOSITES AT ELEVATED TEMPERATURES K.U. Kainer, F. Moll Institut für Werkstoffkunde und Werkstofftechnik, Technische Universität Clausthal, Agricolastrasse 6, D-38678
Texture and Mechanical Behavior of Magnesium During Free-End Torsion
 Benoît Beausir Laboratoire de Physique et Mécanique des Matériaux, Université de Metz, Ile du Saulcy, 57045 Metz, France Faculté de Génie, Université de Sherbrooke, Sherbrooke, QC, J1K 2R1, Canada László
Precipitate Effects on the Mechanical Behavior of Aluminum Copper Alloys: Part II. Modeling
 03-447A-4.qxd 22/1/05 1:21 PM Page 1 Precipitate Effects on the Mechanical Behavior of Aluminum Copper Alloys: Part II. Modeling H. SEHITOGLU, T. FOGLESONG, and H.J. MAIER This work focuses on a new hardening
Limitation of current hardening models in predicting anisotropy by twinning in hcp metals: Application to a rod-textured AM30 magnesium alloy
 Magnesium Technology 211 Edited by: Wim H. Sillekens, Sean R. Agnew, Neale R. Neelameggham, and Suveen N. Mathaudhu TMS (The Minerals, Metals & Materials Society), 211 Limitation of current hardening models
Learning Objectives. Chapter Outline. Solidification of Metals. Solidification of Metals
 Learning Objectives Study the principles of solidification as they apply to pure metals. Examine the mechanisms by which solidification occurs. - Chapter Outline Importance of Solidification Nucleation
Anisotropic Mechanical Properties of Pr(Co,In) 5 -type Compounds and Their Relation to Texture Formation in Die-upset Magnets
 5 -type Compounds and Their Relation to Texture Formation in Die-upset Magnets") Journal of Magnetics 16(3), 220-224 (2011) http://dx.doi.org/10.4283/jmag.2011.16.3.220 Anisotropic Mechanical Properties of Pr(Co,In) 5 -type Compounds and Their Relation to Texture Formation in Die-upset
Journal of Magnetics 16(3), 220-224 (2011) http://dx.doi.org/10.4283/jmag.2011.16.3.220 Anisotropic Mechanical Properties of Pr(Co,In) 5 -type Compounds and Their Relation to Texture Formation in Die-upset
Module #25. Martensitic Transformations and Strengthening
 Module #25 Martensitic Transformations and Strengthening READING LIST DIETER: Ch. 6, pp. 226-228. Chapter 11 in Meyers & Chawla. Chapter 13 in P. Haasen, Physical Metallurgy, 3 rd Edition, Cambridge University
Ph.D. Admission 20XX-XX Semester X
 Ph.D. Admission 20XX-XX Semester X Written Examination Materials Science & Engineering Department, IIT Kanpur Date of Examination: XX XXXX 20XX Timing: XX:XX XX:XX XX Application# Please read these instructions
Structure of silica glasses (Chapter 12)
") Questions and Problems 97 Glass Ceramics (Structure) heat-treated so as to become crystalline in nature. The following concept map notes this relationship: Structure of noncrystalline solids (Chapter 3)
Questions and Problems 97 Glass Ceramics (Structure) heat-treated so as to become crystalline in nature. The following concept map notes this relationship: Structure of noncrystalline solids (Chapter 3)
STRAIN-INDUCED TEXTURE DEVELOPMENT IN THE MAGNESIUM ALLOY AZ31
 71 72 STRAIN-INDUCED TEXTURE DEVELOPMENT IN THE MAGNESIUM ALLOY AZ31 Shiyao Huang, Dayong Li and Yinghong Peng Shanghai Jiaotong University, Shanghai, China. John Allison University of Michigan, Ann Arbor,
Types of Strain. Engineering Strain: e = l l o. Shear Strain: γ = a b
 Types of Strain l a g Engineering Strain: l o l o l b e = l l o l o (a) (b) (c) Shear Strain: FIGURE 2.1 Types of strain. (a) Tensile. (b) Compressive. (c) Shear. All deformation processes in manufacturing
Plastic deformation mechanisms in nanocrystalline columnar grain structures
 Plastic deformation mechanisms in nanocrystalline columnar grain structures Diana Farkas a and William A. Curtin b a Department of Materials Science and Engineering, Virginia Tech, Blacksburg, VA 24061,
Problem Set 2 Solutions
 M 4733: Deformation and Fracture of ngineering Materials Spring 00 Problem Set Solutions *) Prove that for the case of cubic crystals the modulus of elasticity in any given direction may be given by the
Evolution in microstructure and properties during non-isothermal annealing of a cold-rolled Al-Mn-Fe-Si alloy with different microchemistry states
 Evolution in microstructure and properties during non-isothermal annealing of a cold-rolled Al-Mn-Fe-Si alloy with different microchemistry states K. Huang a, O. Engler b, Y.J. Li a, K. Marthinsen a a
Introduction to Electron Backscattered Diffraction. TEQIP Workshop HREXRD Feb 1 st to Feb 5 th 2016
 Introduction to Electron Backscattered Diffraction 1 TEQIP Workshop HREXRD Feb 1 st to Feb 5 th 2016 SE vs BSE 2 Ranges and interaction volumes 3 (1-2 m) http://www4.nau.edu/microanalysis/microprobe/interact-effects.html
Two marks questions and answers. 1. what is a Crystal? (or) What are crystalline materials? Give examples
 What are crystalline materials? Give examples") UNIT V CRYSTAL PHYSICS PART-A Two marks questions and answers 1. what is a Crystal? (or) What are crystalline materials? Give examples Crystalline solids (or) Crystals are those in which the constituent
UNIT V CRYSTAL PHYSICS PART-A Two marks questions and answers 1. what is a Crystal? (or) What are crystalline materials? Give examples Crystalline solids (or) Crystals are those in which the constituent
Final Examination. Instructions. Guidelines. UNIVERSITY OF CALIFORNIA College of Engineering Department of Materials Science & Engineering
 UNIVERSITY OF CALIFORNIA College of Engineering Department of Materials Science & Engineering Spring Semester 2006 Professor R. Gronsky MSE 121 Name (Please Print) Final Examination Instructions Please
Fatigue life estimation of Aluminium Alloy reinforced with SiC particulates in annealed conditions
 18 TH INTERNATIONAL CONFERENCE ON COMPOSITE MATERIALS Abstract Fatigue life estimation of Aluminium Alloy reinforced with SiC particulates in annealed conditions D. P. Myriounis, S.T.Hasan Sheffield Hallam
Crystallographic Orientation Relationship between Discontinuous Precipitates and Matrix in Commercial AZ91 Mg Alloy
 Materials Transactions, Vol. 52, No. 3 (2011) pp. 340 to 344 Special Issue on New Trends for Micro- and Nano Analyses by Transmission Electron Microscopy #2011 The Japan Institute of Metals Crystallographic
Objective To study the time and temperature variations in the hardness of Al-4% Cu alloy on isothermal aging.
 EXPERIMENT 8 PRECIPITATION HARDENING IN 2024 ALUMINUM Objective To study the time and temperature variations in the hardness of Al-4% Cu alloy on isothermal aging. Introduction Materials can be hardened
 Defects in solids http://www.bath.ac.uk/podcast/powerpoint/inaugural_lecture_250407.pdf http://www.materials.ac.uk/elearning/matter/crystallography/indexingdirectionsandplanes/indexing-of-hexagonal-systems.html
Precipitation Hardening. Outline. Precipitation Hardening. Precipitation Hardening
 Outline Dispersion Strengthening Mechanical Properties of Steel Effect of Pearlite Particles impede dislocations. Things that slow down/hinder/impede dislocation movement will increase, y and TS And also
Strain path change effect on dislocation microstructure of multicrystalline copper sheets
 Materials Chemistry and Physics 98 (2006) 44 50 Strain path change effect on dislocation microstructure of multicrystalline copper sheets N.A. Sakharova, J.V. Fernandes Departamento de Engenharia Mecânica
Uniaxial Ratcheting Behaviors of Metals with Different Crystal Structures or Values of Fault Energy: Macroscopic Experiments
 J. Mater. Sci. Technol., 11, 7(5), 5-5. Uniaxial Ratcheting Behaviors of Metals with Different Crystal Structures or Values of Fault Energy: Macroscopic Experiments Guozheng Kang 1), Yujie Liu ), Yawei
Microstructural parameters from Multiple Whole Profile (MWP) or Convolutional Multiple Whole Profile (CMWP) computer programs
 or Convolutional Multiple Whole Profile (CMWP) computer programs") Microstructural parameters from Multiple Whole Profile (MWP) or Convolutional Multiple Whole Profile (CMWP) computer programs Iuliana Dragomir-Cernatescu School of Materials Science and Engineering, Georgia
Microstructural parameters from Multiple Whole Profile (MWP) or Convolutional Multiple Whole Profile (CMWP) computer programs Iuliana Dragomir-Cernatescu School of Materials Science and Engineering, Georgia
University of Pretoria Z Tang (2006) Chapter 8 Studies of acicular ferrite by thin foil TEM
 Chapter 8 Studies of acicular ferrite by thin foil TEM") 8.2 Two types of acicular ferrite 8.2.1 Structure with parallel laths There appeared to be two types of acicular ferrite laths that were observed in those alloys cooled with a rapid cooling rate of 47
8.2 Two types of acicular ferrite 8.2.1 Structure with parallel laths There appeared to be two types of acicular ferrite laths that were observed in those alloys cooled with a rapid cooling rate of 47
Microstructure and texture of asymmetrically rolled aluminium and titanium after deformation and recrystallization
 IOP Conference Series: Materials Science and Engineering PAPER OPEN ACCESS Microstructure and texture of asymmetrically rolled aluminium and titanium after deformation and recrystallization To cite this
Defects and Diffusion
 Defects and Diffusion Goals for the Unit Recognize various imperfections in crystals Point imperfections Impurities Line, surface and bulk imperfections Define various diffusion mechanisms Identify factors
Thesis for Doctor of Philosophy. Variant selection of Allotriomorphic Ferrite in Steels
 Thesis for Doctor of Philosophy Variant selection of Allotriomorphic Ferrite in Steels Kim, Dae Woo ( 金旲優 ) Computational Metallurgy Graduate Institute of Ferrous Technology Pohang University of Science
Superplasticity in a rolled Mg 3Al 1Zn alloy by two-stage deformation method
 Scripta Materialia 47 (2002) 101 106 www.actamat-journals.com Superplasticity in a rolled Mg 3Al 1Zn alloy by two-stage deformation method J.C. Tan, M.J. Tan * School of Mechanical and Production Engineering,
Materials Engineering 272-C Fall 2001, Lectures 9 & 10. Introduction to Mechanical Properties of Metals
 Materials Engineering 272-C Fall 2001, Lectures 9 & 10 Introduction to Mechanical Properties of Metals From an applications standpoint, one of the most important topics within Materials Science & Engineering
The Pennsylvania State University. The Graduate School THE EFFECT OF HYDROGEN ON THE DEFORMATION BEHAVIOR OF ZIRCALOY-4.
 The Pennsylvania State University The Graduate School Department of Mechanical and Nuclear Engineering THE EFFECT OF HYDROGEN ON THE DEFORMATION BEHAVIOR OF ZIRCALOY-4 A Thesis in Nuclear Engineering by
Accepted Manuscript Not Copyedited
 . Received May 30, 2015; Molecular dynamics simulations of orientation effects during tension, compression and bending deformations of magnesium nano-crystals Haidong Fan 1 Department of Mechanical Engineering,
Effect of Ti on Charpy Fracture Energy and Other Mechanical Properties of ASTM A 710 Grade B Cu-Precipitation-Strengthened Steel
 To be presented at Materials Science & Technology 2009 Conference (MS&T 09) October 25-29, 2009, Pittsburgh, PA Effect of Ti on Charpy Fracture Energy and Other Mechanical Properties of ASTM A 710 Grade
Supplementary Figure 1: Geometry of the in situ tensile substrate. The dotted rectangle indicates the location where the TEM sample was placed.
 Supplementary Figures Supplementary Figure 1: Geometry of the in situ tensile substrate. The dotted rectangle indicates the location where the TEM sample was placed. Supplementary Figure 2: The original
Mechanical Behavior of Plutonium and Its Alloys
 Mechanical Behavior of Plutonium and Its Alloys Siegfried S. Hecker and Michael F. Stevens 336 Los Alamos Science Number 26 2000 The current renaissance in plutonium research derives in large part from
Chapter Outline How do atoms arrange themselves to form solids?
 Chapter Outline How do atoms arrange themselves to form solids? Fundamental concepts and language Unit cells Crystal structures Face-centered cubic Body-centered cubic Hexagonal close-packed Close packed
Titanium and titanium alloys. Josef Stráský
 Titanium and titanium alloys Josef Stráský Lecture 2: Fundamentals of Ti alloys Polymorphism Alpha phase Beta phase Pure titanium Titanium alloys alloys alloys alloys Phase transformation β α phase Hardening