Genomic data visualisation
|
|
|
- Elijah Hudson
- 6 years ago
- Views:
Transcription


1 Genomic data visualisation Dr Jason Wong Prince of Wales Clinical School Introductory bioinformatics for human genomics workshop, UNSW Day 1 Thursday 29 th January 2016


2 Structure of human genome Consist of 23 pairs of chromosomes. Each chromosome is paired meaning that it is diploid. Each individual chromosome made up of double stranded DNA. Approximately ~3 billion bases in total. The size makes the genome difficult to visualise
3 Why visualise? Quality control (QC) To help interpret the data. Communicate results with others.
4 What to visualise? Two main types: (1) Visualisation of individual genomic elements. (For example using UCSC) (2) Visualisation of summary of genomic elements.
5 What we will cover Visualisation of elements genome-wide Circos plots Visualisation of summary of NGS data signals Profile plots and heatmaps Gene expression data Hierarchical clustering Principal component analysis (PCA) Differential expression (volcano plot) Gene set enrichment analysis (GSEA)

6 Circos plot Provides a visual snapshot of the whole genome. Allow visualisation of relationships between different chromosomes. Uses tracks just like UCSC genome browser
7 What making circos plots involve Command line tool. Instructions are written in a text-based configuration file. Some web-based versions such as J-Circos (
8 NGS profile data Many types of NGS data such as RNAseq and ChIP-seq provide quantitative information. How to look at signal across multiple loci?

9 Example PolII occupancy
10 Tools for making profiles deeptools ( Galaxy based tool Functions to draw profiles as well as tools for QC. seqminer ( Standalone Java-based tool Limited functions but easy to use. But sometimes a bit buggy
11 deeptools Ramirez et al. Nuc Acids Res. 42:W187-W191

12


13 Ye et al. Nuc Acids Res. 39:e35 seqminer

14 Example distribution of melanoma mutation across gene promoters
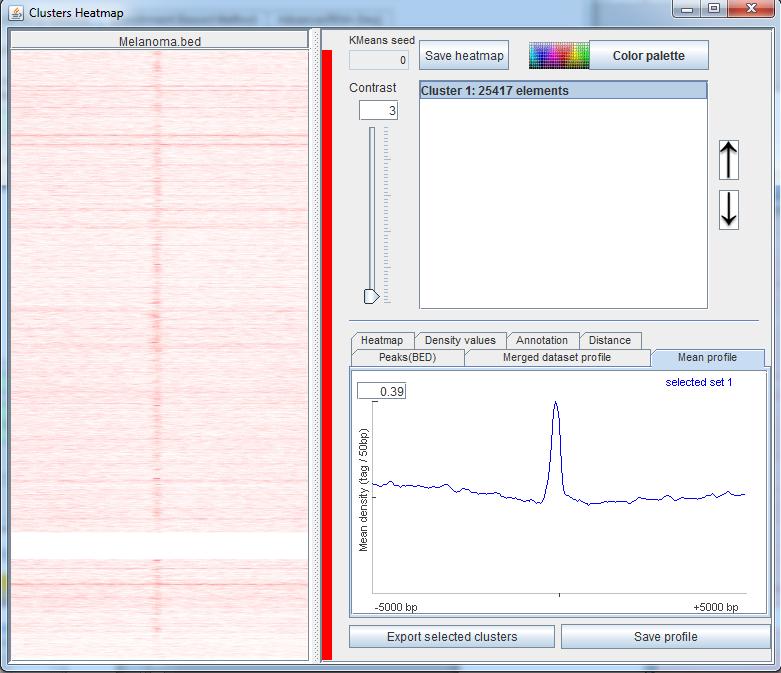
15

16

17 Cluster 1 are mainly highly expressed genes.
18 Visualisation of gene expression data Gene expression data is typically generated by microarray or RNA-seq. Both used to generate expression level of mrna in a sample
19 Things to consider for gene expression analysis Gene expression analysis is complex. The following usually needs to be considered in addition to visualisation: Data normalisation Batch effect removal Appropriate statistical model for differential gene expression analysis

20 Hierarchical clustering Grouping of samples and/or genes based on similarity. Only major parameter is how to measure similarity. Effective for seeing how samples are different and whether clusters genes have similar expression profiles.
21 Principal component analysis (PCA) Reduces dimension of the data. (i.e. 20,000 genes into 3D). These new dimensions are represented as principal components (PC). Each PC captures a certain % of variation between samples such that PC1 captures the most.
22 Variations of PCA for gene expression analysis exists, such as the GE-biplot. Data is transformed such that sample and genes are plot on the same axes and their directionality can be directly interpreted. Pittelkow and Wilson (2003) Stat App Genetics Mol Biol 2:6
23 Visualising differential gene expression Each gene is a fold change and a p-value. Plotting these gives a volcano plot.
24 How to make these plots R is possibly most commonly used among bioinformaticians. Commercial packages such as Partek Genome Studio can also be handy for gene expression data visualisation. BUT always a good idea to consult a bioinformatician/biostatisticians who is familiar with gene expression analysis.

25 Pathway analysis Often the end product of gene expression analysis is a list of significant genes. Its difficult to look at each gene individually. It is usually more meaningful to see if they below to particular biological pathways. Ingenuity IPA
26 Pathway analysis example My gene list Gene A Gene C Gene F Gene G Gene K Pathway A Gene A Gene B Gene H Gene K Gene P Gene X Pathway B Gene C Gene F Gene G Gene K Gene Z Pathway C Gene B Gene R Gene S Gene T Gene U Enrichment Pathway B 4/5 genes Pathway A 2/6 genes Pathway C 0/5 genes

27 Gene set enrichment analysis (GSEA) However, sometimes it is difficult to define a list of significant genes. Cutoff might be arbitrary Small sample size can make p-values difficult to interpret GSEA is an alterative to standard pathway analysis.


28 Interpreting GSEA plots

29 Running GSEA
30 Do you have any other data types that need to be visualised?
31 Circos Further reading deeptools seqminer Clustering gene expression data GSEA
Introduction to human genomics and genome informatics
 Introduction to human genomics and genome informatics Session 1 Prince of Wales Clinical School Dr Jason Wong ARC Future Fellow Head, Bioinformatics & Integrative Genomics Adult Cancer Program, Lowy Cancer
Next-Generation Sequencing Gene Expression Analysis Using Agilent GeneSpring GX
 Next-Generation Sequencing Gene Expression Analysis Using Agilent GeneSpring GX Technical Overview Introduction RNA Sequencing (RNA-Seq) is one of the most commonly used next-generation sequencing (NGS)
Bioinformatics Analysis of Nano-based Omics Data
 Bioinformatics Analysis of Nano-based Omics Data Penny Nymark, Pekka Kohonen, Vesa Hongisto and Roland Grafström Hands-on Workshop on Nano Safety Assessment, 29 th September, 2016, National Technical University
Introduction to BIOINFORMATICS
 COURSE OF BIOINFORMATICS a.a. 2016-2017 Introduction to BIOINFORMATICS What is Bioinformatics? (I) The sinergy between biology and informatics What is Bioinformatics? (II) From: http://www.bioteach.ubc.ca/bioinfo2010/
Result Tables The Result Table, which indicates chromosomal positions and annotated gene names, promoter regions and CpG islands, is the best way for
 Result Tables The Result Table, which indicates chromosomal positions and annotated gene names, promoter regions and CpG islands, is the best way for you to discover methylation changes at specific genomic
Galaxy Platform For NGS Data Analyses
 Galaxy Platform For NGS Data Analyses Weihong Yan wyan@chem.ucla.edu Collaboratory Web Site http://qcb.ucla.edu/collaboratory http://collaboratory.lifesci.ucla.edu Workshop Outline ü Day 1 UCLA galaxy
Agilent GeneSpring GX 10: Beyond. Pam Tangvoranuntakul Product Manager, GeneSpring October 1, 2008
 Agilent GeneSpring GX 10: Gene Expression and Beyond Pam Tangvoranuntakul Product Manager, GeneSpring October 1, 2008 GeneSpring GX 10 in the News Our Goals for GeneSpring GX 10 Goal 1: Bring back GeneSpring
Introduction to Next Generation Sequencing (NGS) Data Analysis and Pathway Analysis. Jenny Wu
 Data Analysis and Pathway Analysis. Jenny Wu") Introduction to Next Generation Sequencing (NGS) Data Analysis and Pathway Analysis Jenny Wu Outline Introduction to NGS data analysis in Cancer Genomics NGS applications in cancer research Typical NGS
Introduction to Next Generation Sequencing (NGS) Data Analysis and Pathway Analysis Jenny Wu Outline Introduction to NGS data analysis in Cancer Genomics NGS applications in cancer research Typical NGS
Whole Transcriptome Analysis of Illumina RNA- Seq Data. Ryan Peters Field Application Specialist
 Whole Transcriptome Analysis of Illumina RNA- Seq Data Ryan Peters Field Application Specialist Partek GS in your NGS Pipeline Your Start-to-Finish Solution for Analysis of Next Generation Sequencing Data
Pioneering Clinical Omics
 Pioneering Clinical Omics Clinical Genomics Strand NGS An analysis tool for data generated by cutting-edge Next Generation Sequencing(NGS) instruments. Strand NGS enables read alignment and analysis of
About Strand NGS. Strand Genomics, Inc All rights reserved.
 About Strand NGS Strand NGS-formerly known as Avadis NGS, is an integrated platform that provides analysis, management and visualization tools for next-generation sequencing data. It supports extensive
AGILENT S BIOINFORMATICS ANALYSIS SOFTWARE
 ACCELERATING PROGRESS IS IN OUR GENES AGILENT S BIOINFORMATICS ANALYSIS SOFTWARE GENESPRING GENE EXPRESSION (GX) MASS PROFILER PROFESSIONAL (MPP) PATHWAY ARCHITECT (PA) See Deeper. Reach Further. BIOINFORMATICS
Analysis of RNA-seq Data. Feb 8, 2017 Peikai CHEN (PHD)
") Analysis of RNA-seq Data Feb 8, 2017 Peikai CHEN (PHD) Outline What is RNA-seq? What can RNA-seq do? How is RNA-seq measured? How to process RNA-seq data: the basics How to visualize and diagnose your
Analysis of RNA-seq Data Feb 8, 2017 Peikai CHEN (PHD) Outline What is RNA-seq? What can RNA-seq do? How is RNA-seq measured? How to process RNA-seq data: the basics How to visualize and diagnose your
Deep Sequencing technologies
 Deep Sequencing technologies Gabriela Salinas 30 October 2017 Transcriptome and Genome Analysis Laboratory http://www.uni-bc.gwdg.de/index.php?id=709 Microarray and Deep-Sequencing Core Facility University
Introduction to RNA-Seq in GeneSpring NGS Software
 Introduction to RNA-Seq in GeneSpring NGS Software Dipa Roy Choudhury, Ph.D. Strand Scientific Intelligence and Agilent Technologies Learn more at www.genespring.com Introduction to RNA-Seq In a few years,
Sanger vs Next-Gen Sequencing
 Tools and Algorithms in Bioinformatics GCBA815/MCGB815/BMI815, Fall 2017 Week-8: Next-Gen Sequencing RNA-seq Data Analysis Babu Guda, Ph.D. Professor, Genetics, Cell Biology & Anatomy Director, Bioinformatics
Measuring and Understanding Gene Expression
 Measuring and Understanding Gene Expression Dr. Lars Eijssen Dept. Of Bioinformatics BiGCaT Sciences programme 2014 Why are genes interesting? TRANSCRIPTION Genome Genomics Transcriptome Transcriptomics
Gene expression analysis. Biosciences 741: Genomics Fall, 2013 Week 5. Gene expression analysis
 Gene expression analysis Biosciences 741: Genomics Fall, 2013 Week 5 Gene expression analysis From EST clusters to spotted cdna microarrays Long vs. short oligonucleotide microarrays vs. RT-PCR Methods
RNA-Seq analysis using R: Differential expression and transcriptome assembly
 RNA-Seq analysis using R: Differential expression and transcriptome assembly Beibei Chen Ph.D BICF 12/7/2016 Agenda Brief about RNA-seq and experiment design Gene oriented analysis Gene quantification
Analysis of Microarray Data
 Analysis of Microarray Data Lecture 3: Visualization and Functional Analysis George Bell, Ph.D. Senior Bioinformatics Scientist Bioinformatics and Research Computing Whitehead Institute Outline Review
Introduction to the UCSC genome browser
 Introduction to the UCSC genome browser Dominik Beck NHMRC Peter Doherty and CINSW ECR Fellow, Senior Lecturer Lowy Cancer Research Centre, UNSW and Centre for Health Technology, UTS SYDNEY NSW AUSTRALIA
RNAseq analysis -it s complicated. November 2017
 RNAseq analysis -it s complicated November 2017 RNA reads are not enough to identify functional RNAs Defining functional DNA elements in the human genome Kellis M et al. PNAS 2014;111:6131-6138 All the
DIAMANTINA INSTITUTE for Cancer, Immunology and Metabolic Medicine
 DIAMANTINA INSTITUTE for Cancer, Immunology and Metabolic Medicine Defining MYB Transcriptional Network by Genome-wide Chromatin Occupancy Profiling (ChIP-Seq) 2010 E.Glazov, L. Zhao Transcription Factors:
Introduction to NGS analyses
 Introduction to NGS analyses Giorgio L Papadopoulos Institute of Molecular Biology and Biotechnology Bioinformatics Support Group 04/12/2015 Papadopoulos GL (IMBB, FORTH) IMBB NGS Seminar 04/12/2015 1
Research Powered by Agilent s GeneSpring
 Research Powered by Agilent s GeneSpring Agilent Technologies, Inc. Carolina Livi, Bioinformatics Segment Manager Research Powered by GeneSpring Topics GeneSpring (GS) platform New features in GS 13 What
Gene expression microarrays and assays. Because your results can t wait
 Gene expression microarrays and assays Because your results can t wait A simple path from data to decision-making The power of expression microarrays Transcriptome-wide analysis can be complex. Matching
From Variants to Pathways: Agilent GeneSpring GX s Variant Analysis Workflow
 From Variants to Pathways: Agilent GeneSpring GX s Variant Analysis Workflow Technical Overview Import VCF Introduction Next-generation sequencing (NGS) studies have created unanticipated challenges with
Reads to Discovery. Visualize Annotate Discover. Small DNA-Seq ChIP-Seq Methyl-Seq. MeDIP-Seq. RNA-Seq. RNA-Seq.
 Reads to Discovery RNA-Seq Small DNA-Seq ChIP-Seq Methyl-Seq RNA-Seq MeDIP-Seq www.strand-ngs.com Analyze Visualize Annotate Discover Data Import Alignment Vendor Platforms: Illumina Ion Torrent Roche
Integrative Genomics 1a. Introduction
 2016 Course Outline Integrative Genomics 1a. Introduction ggibson.gt@gmail.com http://www.cig.gatech.edu 1a. Experimental Design and Hypothesis Testing (GG) 1b. Normalization (GG) 2a. RNASeq (MI) 2b. Clustering
NGS Approaches to Epigenomics
 I519 Introduction to Bioinformatics, 2013 NGS Approaches to Epigenomics Yuzhen Ye (yye@indiana.edu) School of Informatics & Computing, IUB Contents Background: chromatin structure & DNA methylation Epigenomic
Genomes: What we know and what we don t know
 Genomes: What we know and what we don t know Complete draft sequence 2001 October 15, 2007 Dr. Stefan Maas, BioS Lehigh U. What we know Raw genome data The range of genome sizes in the animal & plant kingdoms!
Introduction into single-cell RNA-seq. Kersti Jääger 19/02/2014
 Introduction into single-cell RNA-seq Kersti Jääger 19/02/2014 Cell is the smallest functional unit of life Nucleus.ATGC.UACG. A Cell KLTSH. The complexity of biology How many cell types? How many cells?
Multi-omics in biology: integration of omics techniques
 31/07/17 Летняя школа по биоинформатике 2017 Multi-omics in biology: integration of omics techniques Konstantin Okonechnikov Division of Pediatric Neurooncology German Cancer Research Center (DKFZ) 2 Short
Protein Synthesis: From Gene RNA Protein Trait
 Protein Synthesis: From Gene RNA Protein Trait Human Genome The human genome contains about genes. Each gene is a of DNA (sequence of nitrogen bases) contained within each chromosome. Each chromosome contains
The first thing you will see is the opening page. SeqMonk scans your copy and make sure everything is in order, indicated by the green check marks.
 Open Seqmonk Launch SeqMonk The first thing you will see is the opening page. SeqMonk scans your copy and make sure everything is in order, indicated by the green check marks. SeqMonk Analysis Page 1 Create
Measuring gene expression
 Measuring gene expression Grundlagen der Bioinformatik SS2018 https://www.youtube.com/watch?v=v8gh404a3gg Agenda Organization Gene expression Background Technologies FISH Nanostring Microarrays RNA-seq
Sequencing applications. Today's outline. Hands-on exercises. Applications of short-read sequencing: RNA-Seq and ChIP-Seq
 Sequencing applications Applications of short-read sequencing: RNA-Seq and ChIP-Seq BaRC Hot Topics March 2013 George Bell, Ph.D. http://jura.wi.mit.edu/bio/education/hot_topics/ RNA-Seq includes experiments
Mayday and beyond: New Approaches for the Visualisation of Genomics and Transcriptomics Data
 Mayday and beyond: New Approaches for the Visualisation of Genomics and Transcriptomics Data Kay Nieselt Center for Bioinformatics Tübingen University of Tübingen Genomics Genomics is the study of the
rnaseqcore.vet.cornell.edu
 Center for Reproductive Genomics Department of Biomedical Sciences College of Veterinary Medicine Cornell University Jen Grenier jgrenier@cornell.edu Compute power Software/parameters Reference genome
Complete draft sequence 2001
 Genomes: What we know and what we don t know Complete draft sequence 2001 November11, 2009 Dr. Stefan Maas, BioS Lehigh U. What we know Raw genome data The range of genome sizes in the animal & plant kingdoms
This practical aims to walk you through the process of text searching DNA and protein databases for sequence entries.
 PRACTICAL 1: BLAST and Sequence Alignment The EBI and NCBI websites, two of the most widely used life science web portals are introduced along with some of the principal databases: the NCBI Protein database,
Quantitative Genomics and Genetics BTRY 4830/6830; PBSB
 Quantitative Genomics and Genetics BTRY 4830/6830; PBSB.5201.01 Lecture20: Haplotype testing and Minimum GWAS analysis steps Jason Mezey jgm45@cornell.edu April 17, 2017 (T) 8:40-9:55 Announcements Project
Gene Regulation Solutions. Microarrays and Next-Generation Sequencing
 Gene Regulation Solutions Microarrays and Next-Generation Sequencing Gene Regulation Solutions The Microarrays Advantage Microarrays Lead the Industry in: Comprehensive Content SurePrint G3 Human Gene
Supplement to: The Genomic Sequence of the Chinese Hamster Ovary (CHO)-K1 cell line
-K1 cell line") Supplement to: The Genomic Sequence of the Chinese Hamster Ovary (CHO)-K1 cell line Table of Contents SUPPLEMENTARY TEXT:... 2 FILTERING OF RAW READS PRIOR TO ASSEMBLY:... 2 COMPARATIVE ANALYSIS... 2 IMMUNOGENIC
Supplement to: The Genomic Sequence of the Chinese Hamster Ovary (CHO)-K1 cell line Table of Contents SUPPLEMENTARY TEXT:... 2 FILTERING OF RAW READS PRIOR TO ASSEMBLY:... 2 COMPARATIVE ANALYSIS... 2 IMMUNOGENIC
Introduction to RNA-Sequencing Analysis for Differential Expression on Galaxy
 Introduction to RNA-Sequencing Analysis for Differential Expression on Galaxy Part 2: DNA/RNA Sequencing Course, Westmead Authors: Tracy Chew, Nicholas Ho, Rosemarie Sadsad Sydney Informatics Hub https://informatics.sydney.edu.au
Next Generation Sequencing
 Next Generation Sequencing Complete Report Catalogue # and Service: IR16001 rrna depletion (human, mouse, or rat) IR11081 Total RNA Sequencing (80 million reads, 2x75 bp PE) Xxxxxxx - xxxxxxxxxxxxxxxxxxxxxx
Basic aspects of Microarray Data Analysis
 Hospital Universitari Vall d Hebron Institut de Recerca - VHIR Institut d Investigació Sanitària de l Instituto de Salud Carlos III (ISCIII) Basic aspects of Microarray Data Analysis Expression Data Analysis
Introduction to RNA-Seq. David Wood Winter School in Mathematics and Computational Biology July 1, 2013
 Introduction to RNA-Seq David Wood Winter School in Mathematics and Computational Biology July 1, 2013 Abundance RNA is... Diverse Dynamic Central DNA rrna Epigenetics trna RNA mrna Time Protein Abundance
RNA-Seq Analysis. Simon Andrews, Laura v
 RNA-Seq Analysis Simon Andrews, Laura Biggins simon.andrews@babraham.ac.uk @simon_andrews v2018-10 RNA-Seq Libraries rrna depleted mrna Fragment u u u u NNNN Random prime + RT 2 nd strand synthesis (+
Knowledge-Guided Analysis with KnowEnG Lab
 Han Sinha Song Weinshilboum Knowledge-Guided Analysis with KnowEnG Lab KnowEnG Center Powerpoint by Charles Blatti Knowledge-Guided Analysis KnowEnG Center 2017 1 Exercise In this exercise we will be doing
Experimental Design. Dr. Matthew L. Settles. Genome Center University of California, Davis
 Experimental Design Dr. Matthew L. Settles Genome Center University of California, Davis settles@ucdavis.edu What is Differential Expression Differential expression analysis means taking normalized sequencing
Supporting Information
 Supporting Information Ho et al. 1.173/pnas.81288816 SI Methods Sequences of shrna hairpins: Brg shrna #1: ccggcggctcaagaaggaagttgaactcgagttcaacttccttcttgacgnttttg (TRCN71383; Open Biosystems). Brg shrna
Satellite Education Workshop (SW4): Epigenomics: Design, Implementation and Analysis for RNA-seq and Methyl-seq Experiments
: Epigenomics: Design, Implementation and Analysis for RNA-seq and Methyl-seq Experiments") Satellite Education Workshop (SW4): Epigenomics: Design, Implementation and Analysis for RNA-seq and Methyl-seq Experiments Saturday March 17, 2012 Orlando, Florida Workshop Description: This full day
Satellite Education Workshop (SW4): Epigenomics: Design, Implementation and Analysis for RNA-seq and Methyl-seq Experiments Saturday March 17, 2012 Orlando, Florida Workshop Description: This full day
How to deal with your RNA-seq data?
 How to deal with your RNA-seq data? Rachel Legendre, Thibault Dayris, Adrien Pain, Claire Toffano-Nioche, Hugo Varet École de bioinformatique AVIESAN-IFB 2017 1 Rachel Legendre Bioinformatics 27/11/2018
Microarray Informatics
 Microarray Informatics Donald Dunbar MSc Seminar 31 st January 2007 Aims To give a biologist s view of microarray experiments To explain the technologies involved To describe typical microarray experiments
Applications of short-read
 Applications of short-read sequencing: RNA-Seq and ChIP-Seq BaRC Hot Topics March 2013 George Bell, Ph.D. http://jura.wi.mit.edu/bio/education/hot_topics/ Sequencing applications RNA-Seq includes experiments
Standard Data Analysis Report Agilent Gene Expression Service
 Standard Data Analysis Report Agilent Gene Expression Service Experiment: S534662 Date: 2011-01-01 Prepared for: Dr. Researcher Genomic Sciences Lab Prepared by S534662 Standard Data Analysis Report 2011-01-01
Bioinformatics for Biologists
 Bioinformatics for Biologists Functional Genomics: Microarray Data Analysis Fran Lewitter, Ph.D. Head, Biocomputing Whitehead Institute Outline Introduction Working with microarray data Normalization Analysis
Philippe Hupé 1,2. The R User Conference 2009 Rennes
 A suite of R packages for the analysis of DNA copy number microarray experiments Application in cancerology Philippe Hupé 1,2 1 UMR144 Institut Curie, CNRS 2 U900 Institut Curie, INSERM, Mines Paris Tech
March Product Release Information. About IPA. IPA Spring Release (2016): Release Notes. Table of Contents
: Release Notes. Table of Contents") IPA Spring Release (2016): Release Notes Table of Contents IPA Spring Release (2016): Release Notes... 1 Product Release Information... 1 About IPA... 1 What s New in the IPA Spring Release (March 2016)...
IPA Spring Release (2016): Release Notes Table of Contents IPA Spring Release (2016): Release Notes... 1 Product Release Information... 1 About IPA... 1 What s New in the IPA Spring Release (March 2016)...
Genome variation - part 1
 Genome variation - part 1 Dr Jason Wong Prince of Wales Clinical School Introductory bioinformatics for human genomics workshop, UNSW Day 2 Friday 21 th January 2016 Aims of the session Introduce major
ChIP-seq and RNA-seq. Farhat Habib
 ChIP-seq and RNA-seq Farhat Habib fhabib@iiserpune.ac.in Biological Goals Learn how genomes encode the diverse patterns of gene expression that define each cell type and state. Protein-DNA interactions
user s guide Question 1
 Question 1 How does one find a gene of interest and determine that gene s structure? Once the gene has been located on the map, how does one easily examine other genes in that same region? doi:10.1038/ng966
SO YOU WANT TO DO A: RNA-SEQ EXPERIMENT MATT SETTLES, PHD UNIVERSITY OF CALIFORNIA, DAVIS
 SO YOU WANT TO DO A: RNA-SEQ EXPERIMENT MATT SETTLES, PHD UNIVERSITY OF CALIFORNIA, DAVIS SETTLES@UCDAVIS.EDU Bioinformatics Core Genome Center UC Davis BIOINFORMATICS.UCDAVIS.EDU DISCLAIMER This talk/workshop
Supplementary Data. Supplementary Materials and Methods Twenty-cell gene expression profiling. Stem cell transcriptome analysis
 Supplementary Data The Supplementary Data includes Supplementary Materials and Methods, and Figures (Supplementary Figs. S1 S10). Supplementary Materials and Methods Twenty-cell gene expression profiling
Bioinformatics. Microarrays: designing chips, clustering methods. Fran Lewitter, Ph.D. Head, Biocomputing Whitehead Institute
 Bioinformatics Microarrays: designing chips, clustering methods Fran Lewitter, Ph.D. Head, Biocomputing Whitehead Institute Course Syllabus Jan 7 Jan 14 Jan 21 Jan 28 Feb 4 Feb 11 Feb 18 Feb 25 Sequence
Homework : Data Mining. Due at the start of class Friday, 25 September 2009
 Homework 4 36-350: Data Mining Due at the start of class Friday, 25 September 2009 This homework set applies methods we have developed so far to a medical problem, gene expression in cancer. In some questions
Gene-Level Analysis of Exon Array Data using Partek Genomics Suite 6.6
 Gene-Level Analysis of Exon Array Data using Partek Genomics Suite 6.6 Overview This tutorial will demonstrate how to: Summarize core exon-level data to produce gene-level data Perform exploratory analysis
Next Generation Sequencing Data Analysis: From ChIP-Seq Read Islands to Epigenomics Information. WBS Sommer Seminar, July 4 th 2013 M.
 Next Generation Sequencing Data Analysis: From ChIP-Seq Read Islands to Epigenomics Information WBS Sommer Seminar, July 4 th 2013 M. Jaritz, IMP Outline Brief intro to experimental techniques Next generation
Release Notes. JMP Genomics. Version 3.1
 JMP Genomics Version 3.1 Release Notes Creativity involves breaking out of established patterns in order to look at things in a different way. Edward de Bono JMP. A Business Unit of SAS SAS Campus Drive
RNA-Seq data analysis course September 7-9, 2015
 RNA-Seq data analysis course September 7-9, 2015 Peter-Bram t Hoen (LUMC) Jan Oosting (LUMC) Celia van Gelder, Jacintha Valk (BioSB) Anita Remmelzwaal (LUMC) Expression profiling DNA mrna protein Comprehensive
EmbryoGENE Methylation Analysis Pipeline. A manual for the analysis of hybridization results for the EmbryoGENE bovine epigenetics platform
 EmbryoGENE Methylation Analysis Pipeline A manual for the analysis of hybridization results for the EmbryoGENE bovine epigenetics platform 1 Table of contents EmbryoGENE Methylation Analysis Pipeline...
Exercises: Analysing ChIP-Seq data
 Exercises: Analysing ChIP-Seq data Version 2018-03-2 Exercises: Analysing ChIP-Seq data 2 Licence This manual is 2018, Simon Andrews. This manual is distributed under the creative commons Attribution-Non-Commercial-Share
Identification of biological themes in microarray data from a mouse heart development time series using GeneSifter
 Identification of biological themes in microarray data from a mouse heart development time series using GeneSifter VizX Labs, LLC Seattle, WA 98119 Abstract Oligonucleotide microarrays were used to study
An introduction to RNA-seq. Nicole Cloonan - 4 th July 2018 #UQWinterSchool #Bioinformatics #GroupTherapy
 An introduction to RNA-seq Nicole Cloonan - 4 th July 2018 #UQWinterSchool #Bioinformatics #GroupTherapy The central dogma Genome = all DNA in an organism (genotype) Transcriptome = all RNA (molecular
What is Bioinformatics?
 What is Bioinformatics? Bioinformatics is the field of science in which biology, computer science, and information technology merge to form a single discipline. - NCBI The ultimate goal of the field is
Long and short/small RNA-seq data analysis
 Long and short/small RNA-seq data analysis GEF5, 4.9.2015 Sami Heikkinen, PhD, Dos. Topics 1. RNA-seq in a nutshell 2. Long vs short/small RNA-seq 3. Bioinformatic analysis work flows GEF5 / Heikkinen
RNA Sequencing Analyses & Mapping Uncertainty
 RNA Sequencing Analyses & Mapping Uncertainty Adam McDermaid 1/26 RNA-seq Pipelines Collection of tools for analyzing raw RNA-seq data Tier 1 Quality Check Data Trimming Tier 2 Read Alignment Assembly
Development of quantitative targeted RNA-seq methodology for use in differential gene expression
 Development of quantitative targeted RNA-seq methodology for use in differential gene expression Dr. Jens Winter, Market Development Group Biological Biological Research Content EMEA QIAGEN Universal Workflows
Biomedical Big Data and Precision Medicine
 Biomedical Big Data and Precision Medicine Jie Yang Department of Mathematics, Statistics, and Computer Science University of Illinois at Chicago October 8, 2015 1 Explosion of Biomedical Data 2 Types
Analysis of Microarray Data
 Analysis of Microarray Data Lecture 3: Visualization and Functional Analysis George Bell, Ph.D. Bioinformatics Scientist Bioinformatics and Research Computing Whitehead Institute Outline Review Visualizing
Genomes contain all of the information needed for an organism to grow and survive.
 Section 3: Genomes contain all of the information needed for an organism to grow and survive. K What I Know W What I Want to Find Out L What I Learned Essential Questions What are the components of the
Statistical Methods for Network Analysis of Biological Data
 The Protein Interaction Workshop, 8 12 June 2015, IMS Statistical Methods for Network Analysis of Biological Data Minghua Deng, dengmh@pku.edu.cn School of Mathematical Sciences Center for Quantitative
Methods for network visualization and gene enrichment analysis February 22, Jeremy Miller Postdoctoral Fellow - Computational Data Analysis
 Methods for network visualization and gene enrichment analysis February 22, 2012 Jeremy Miller Postdoctoral Fellow - Computational Data Analysis Outline Visualizing networks using R Visualizing networks
RNA-Seq Now What? BIS180L Professor Maloof May 24, 2018
 RNA-Seq Now What? BIS180L Professor Maloof May 24, 2018 We have differentially expressed genes, what do we want to know about them? We have differentially expressed genes, what do we want to know about
GENOMICS for DUMMIES
 ØGC seminar 31. oktober 2013 GENOMICS for DUMMIES Torben A. Kruse Klinisk Genetisk Afdeling, Odense Universitetshospital Klinisk Institut, Syddansk Universitet Human MicroArray Center, OUH / SDU Årsag:
A step-by-step guide to ChIP-seq data analysis
 A step-by-step guide to ChIP-seq data analysis December 03, 2014 Xi Chen, Ph.D. EMBL-European Bioinformatics Institute Wellcome Trust Sanger Institute Target audience Wet-lab biologists with no experience
Applied Biosystems SOLiD 3 Plus System. RNA Application Guide
 Applied Biosystems SOLiD 3 Plus System RNA Application Guide For Research Use Use Only. Not intended for any animal or human therapeutic or diagnostic use. TRADEMARKS: Trademarks of Life Technologies Corporation
Microarray Informatics
 Microarray Informatics Donald Dunbar MSc Seminar 4 th February 2009 Aims To give a biologistʼs view of microarray experiments To explain the technologies involved To describe typical microarray experiments
Analyzing Gene Set Enrichment
 Analyzing Gene Set Enrichment BaRC Hot Topics June 20, 2016 Yanmei Huang Bioinformatics and Research Computing Whitehead Institute http://barc.wi.mit.edu/hot_topics/ Purpose of Gene Set Enrichment Analysis
Using the Trio Workflow in Partek Genomics Suite v6.6
 Using the Trio Workflow in Partek Genomics Suite v6.6 This user guide will illustrate the use of the Trio/Duo workflow in Partek Genomics Suite (PGS) and discuss the basic functions available within the
Bioinformatics Monthly Workshop Series. Speaker: Fan Gao, Ph.D Bioinformatics Resource Office The Picower Institute for Learning and Memory
 Bioinformatics Monthly Workshop Series Speaker: Fan Gao, Ph.D Bioinformatics Resource Office The Picower Institute for Learning and Memory Schedule for Fall, 2015 PILM Bioinformatics Web Server (09/21/2015)
Bioinformatics for Biologists
 Bioinformatics for Biologists Microarray Data Analysis. Lecture 1. Fran Lewitter, Ph.D. Director Bioinformatics and Research Computing Whitehead Institute Outline Introduction Working with microarray data
6/256 1/256 0/256 1/256 2/256 7/256 10/256. At3g06290 (SAC3B)
") Chr.III M 5M 1M 15M 2M 23M BAC clones F22F7 F1A16 F24F17 F24P17 T8E24 F17A9 F21O3 F17A17 F18C1 F2O1 F28L1 F5E6 F3E22 T1B9 MLP3 Number of recombinants 6/256 1/256 /256 1/256 2/256 7/256 1/256 At3g629 (SAC3B)
Chr.III M 5M 1M 15M 2M 23M BAC clones F22F7 F1A16 F24F17 F24P17 T8E24 F17A9 F21O3 F17A17 F18C1 F2O1 F28L1 F5E6 F3E22 T1B9 MLP3 Number of recombinants 6/256 1/256 /256 1/256 2/256 7/256 1/256 At3g629 (SAC3B)
Chapter 1. from genomics to proteomics Ⅱ
 Proteomics Chapter 1. from genomics to proteomics Ⅱ 1 Functional genomics Functional genomics: study of relations of genomics to biological functions at systems level However, it cannot explain any more
Data Retrieval from GenBank
 Data Retrieval from GenBank Peter J. Myler Bioinformatics of Intracellular Pathogens JNU, Feb 7-0, 2009 http://www.ncbi.nlm.nih.gov (January, 2007) http://ncbi.nlm.nih.gov/sitemap/resourceguide.html Accessing
ChIP-seq and RNA-seq
 ChIP-seq and RNA-seq Biological Goals Learn how genomes encode the diverse patterns of gene expression that define each cell type and state. Protein-DNA interactions (ChIPchromatin immunoprecipitation)
Chapter 2: Access to Information
 Chapter 2: Access to Information Outline Introduction to biological databases Centralized databases store DNA sequences Contents of DNA, RNA, and protein databases Central bioinformatics resources: NCBI
Arraygen Technologies Pvt. Ltd.
 P r o j e c t s 50 M O N T H LY Arraygen Technologies Pvt. Ltd. Our Services ArrayGen offers an expanded selection of custom services and solutions in Genomics Bioinformatics. We assess and evaluate the
High Resolution GC-MS Application: Metabolomics Vladimir Tolstikov, PhD
 High Resolution GC-MS Application: Metabolomics Vladimir Tolstikov, PhD Eli Lilly and Company A Sample Harvest and Storage Biological Metadata Standard Operational Procedure Sample Extraction Sample Preparation