INTRODUCTION Purpose of the Road Map Study Process Industry Overview Statistical Snapshot... 4
|
|
|
- Roger Gaines
- 6 years ago
- Views:
Transcription
1


2
3 TABLE OF CONTENTS INTRODUCTION... 1 Purpose of the Road Map... 1 Study Process... 1 Industry Overview... 4 Statistical Snapshot... 4 Discussion Of Industry Trends... 4 Economic Multiplier Effects Future Growth Projections The Market Opportunity Oregon s Competitiveness in the Marketplace STRATEGIC INITIATVES Situational Analysis Strategic Issues PROGRAM EVALUATION METRICS Outcome Metrics Process Metrics APPENDIX A: Industry Survey APPENDIX B: Project Clients and Persons Consulted Applied Development Economics, Inc.
4 INTRODUCTION PURPOSE OF THE ROAD MAP The Food and Beverage Industry Road Map is a strategic plan identifying key action steps and investments to drive expansion of the food and beverage industry in Oregon over the next 10 years. The report identifies key issue areas and recommends a framework of initiatives to address critical barriers and constraints to industry expansion, as well as to help accelerate growth where significant market opportunities exist. The report includes both private sector and public sector initiatives and especially focuses on critical areas of collaboration between the industry and state and local governmental and educational agencies. The intent of the plan is to help move the entire food and beverage industry forward, but particular emphasis is laid on subsectors where substantial growth potential exists. These components of the food and beverage industry in Oregon with especially high growth potential include: Fruit and Vegetable Products Baked Goods and Grains Dairy Products Beverages Snacks, Flavorings, and Other Food Ingredients While several of these subsectors focus on direct-to-consumer products, a substantial portion of the Oregon food and beverage industry produces intermediate products and ingredients used in making retail food products. Despite differences in market orientation among the companies within the industry, there are many commonalities in the issues they face. This Road Map is organized around a number of common issues that cut across most if not all of the food and beverage subsectors: Leadership and Coordination Research and Development / Technical Assistance Workforce Development Distribution Infrastructure Market Development Government Regulation STUDY PROCESS The Food and Beverage Road Map is part of a larger effort by Business Oregon to organize its work under a common strategy called Grow Our Own, based on the belief that quality and sustainable job growth starts by supporting existing Oregon companies to stay and grow right here at home. Central to the Grow Our Own approach is working in partnership with key industry stakeholders that drive Oregon s economy both today and into the future. In addition to Business Oregon, stakeholders involved in this project are leaders of the Oregon Food and Beverage Leadership Council (OFBLC) in partnership with the Oregon Business Council (OBC), the Oregon Business Association (OBA), the Northwest Food Processors Association (NWFPA) and the Oregon Department of Agriculture (ODA). Applied Development Economics P age 1


5 Oregon Food and Beverage Leadership Council The OFBLC, comprised of executives from Oregon s leading value-added food and beverage companies, was formed in The purpose of OFBLC is to help Oregon realize the state s full potential in the food and beverage industry by identifying high-impact opportunities to drive economic growth by working closely with the governor and state legislature, along with existing agencies and associations, to secure funding and support work and initiatives of these existing entities. The OFBLC, which is made up entirely of volunteers, is staffed jointly by OBA, OBC, and the NWFPA. Development of the Road Map included extensive outreach to companies in the industry as well as business association experts and local and regional economic development officials throughout the state. The outreach included personal interviews, an online survey, and regional and industry-specific focus groups. In addition, the Oregon Employment Department provided data, Business Oregon provided analysis, and the consulting team conducted additional data analysis to define key industry growth trends and indicators. The consultant team conducted about 30 interviews with firms and industry experts attending the Northwest Food Processors Expo in January, At the same time, the consultant reviewed the survey questionnaire with members of the OFBLC. Applied Development Economics P age 2
6 The survey was launched in February, 2016 with invitations sent to more than 500 separate firms, as well as notices published in the newsletters of the Oregon Wine Board and the Oregon Brewery Guild. Moore Information obtained 102 completed surveys: 87 online and 15 through telephone contact. All of the major food and beverage industry subsectors were represented in the survey responses (see Appendix A for survey details). With the assistance of Business Oregon, the Oregon Department of Agriculture (ODA), Northwest Food processors and other industry representatives, the consultant team conducted 13 meetings of regional economic development entities around the state. The team also conducted focus group discussions with representatives of the major subsectors within the food and beverage industry, including fruit and vegetable processors, snacks/ingredients, baked goods/grains, wineries, breweries, distillers, dairy companies, and a mixed group of NWFPA member companies. Applied Development Economics P age 3
7 INDUSTRY OVERVIEW STATISTICAL SNAPSHOT The Oregon food and beverage manufacturing industry is estimated to comprise 964 business establishments and 31,920 jobs as of 2014, the most recent year for which annual employment statistics are available. In addition to the food processors and beverage manufacturers counted in these figures, there are also 164 establishments with more than 4,200 jobs in related sectors including food products distribution, food machinery manufacturing and glass container manufacturing. The largest industry subsector in terms of employment is fruit and vegetable preserving, with 9,938 jobs. This subsector is 4.5 times more concentrated in Oregon than it is nationwide. Other subsectors that are at least two times more concentrated in Oregon than the national average include seafood, food machinery, and beverages. The fruit and vegetable subsector grew by 9.5 percent between 2004 and 2014, compared to 28.3 percent for the industry as a whole. The subsector other food manufacturing, which includes flavorings, extract ingredients, snacks, coffee, and tea, grew by 93.2 percent, while beverages, including beer, wine, and spirits, grew by 91.2 percent. The Oregon food and beverage manufacturing industry is estimated to have had export sales of $717 million in 2014, representing growth of 155 percent since Export sales volume is about 4.4 percent of total industry sales. The fruit and vegetable processing subsector led all others with $330.7 million in exports, nearly a 200 percent increase over Dairy products and beverages had even higher growth rates, at 745 percent and 651 percent, respectively. Other food manufacturing ranked second in export volume with $96.4 million in overseas sales, for a growth rate of 142 percent. Total sales for the industry in 2014 are estimated at $16.4 billion, an increase of 58.2 percent since 2003 in real dollar terms. It also creates significant economic multiplier effects for the Oregon economy, supporting 6.1 percent of state industry output based on Oregon State University estimates. With the multiplier effects, the 36,000 direct jobs in food manufacturing and distribution increase to support more than 80,000 jobs statewide. Overall, agriculture, food and fiber manufacturing and distribution support more than 13 percent of the state economy. DISCUSSION OF INDUSTRY TRENDS Table 1 shows the number of food and beverage businesses, estimated employment, and wages by industry subsector. Fruit and vegetable processing is the largest employment sector with more than a quarter of all jobs in the industry (9,938 jobs). Commercial baking is the next largest subsector with about 5,400 jobs, followed by the wine, beer, and spirits subsector with 4,900 jobs. The importance of food and beverage industries to the Oregon economy is reflected by measures of concentration (Location Quotients) shown in Figure 1. Industries with a location quotient of more than 1.0 are more highly concentrated in Oregon than in the U.S. as a whole. These high-concentration industries typically provide much of the wealth flowing into the Oregon economy from outside its borders, via U.S. intrastate commerce and foreign trade. Applied Development Economics P age 4
8 NAICS TABLE 1 EMPLOYMENT AND WAGE TRENDS, FOOD AND BEVERAGE INDUSTRY, INDUSTRY MENTS ESTABLISH- EMPLOY- MENT WAGES AVERAGE WAGE EMPLOYMENT GROWTH AVG WAGE GROWTH (NOMINAL) Food & Beverages 1,239 36,148¹ $1,350,362,431¹ $37,357¹ 28.3%¹ 22.3%¹ Food ,099¹ $1,177,768,854¹ $37,872¹ 21.8%¹ 24.5%¹ 311 Food Manufacturing ,020 $995,708,956 $36, % 22.4% 3111 Animal Food Manufacturing $11,559,826 $46, % 11.4% 3112 Grain & Oilseed Milling $47,249,611 $56, % 52.2% 3113 Sugar & Confectionery Product Manufacturing $18,857,905 $26, % 10.5% 3114 Fruit & Vegetable Preserving & Specialty 108 9,938 $344,193,224 $34, % 27.4% 3115 Dairy product Manufacturing 38 2,618 $130,585,398 $49, % 27.8% 3116 Animal Slaughtering & Processing 64 1,659 $58,782,390 $35, % 21.4% 3117 Seafood Product Preparation & Packaging 23 1,185 $34,826,178 $29, % 35.9% 3118 Bakeries & Tortilla Manufacturing 239 5,399 $192,001,864 $35, % 14.6% 3119 Other Food Manufacturing 132 4,423 $157,652,560 $35, % 2.4% Food Product Machinery Manufacturing ¹ $25,142,864¹ $51,000¹ 14.7%¹ 26.1%¹ Dairy Product Merchant Wholesalers ¹ $16,868,918¹ $43,365¹ 17.5%¹ 36.0%¹ Fish & Seafood Merchant Wholesalers $27,296,782 $55, % 89.1% Meat & Meat Product Merchant Wholesalers $20,509,386 $43, % 7.2% Fruit & Vegetable Merchant Wholesalers 62 2,236 $92,241,948 $41, % 42.2% Beverages 381 5,049¹ $172,593,578¹ $34,185¹ 92.3%¹ 7.7%¹ 3121 Beverage Manufacturing 379 4,900¹ $164,222,074¹ $33,515¹ 91.2%¹ 7.2%¹ Glass Container Manufacturing 2 149¹ $8,371,504¹ $56,260¹ 137.6%¹ 11.1%¹ 1 Employment or wage statistic not available from 2014 BLS QCEW. Actual statistic is confidential. Figures represent estimates by Business Oregon based on one or a combination of the following: 1) percent of nondisclosable employment and wages at that NAICS level, based on distribution of establishments with nondisclosable employment and wages, 2) published employment and wage statistics in Oregon Employment Department's QCEW, 3) past employment and wage data from BLS and/or OED, 4) employment and/or wage information from published articles. 2 NAICS 5511 employment and wages are separated into two groups: 1) employment and wages of 10 firms recognized by Business Oregon as part of the Apparel & Outdoor Gear industry group are included in Apparel & Footwear within Apparel & Outdoor Gear, and 2) remainder of employment and wages in NAICS 5511 are included in Company Management within Business Services. Applied Development Economics P age 5
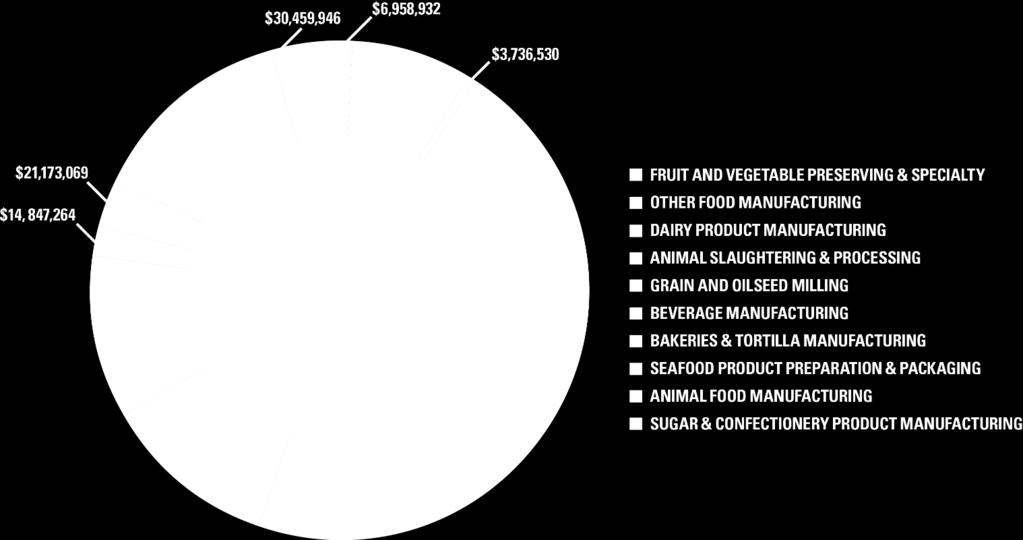
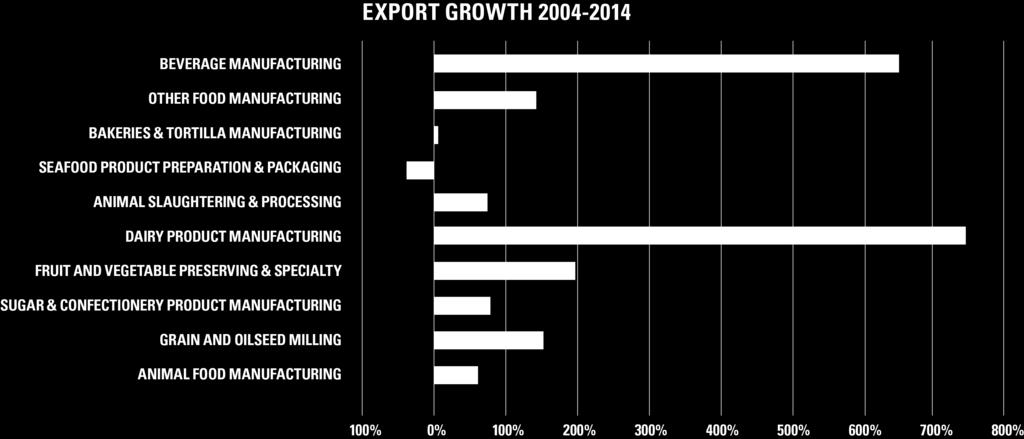
9 Fruit and vegetable processing is 4.5 times more concentrated in Oregon than in the U.S. at large. Other highly concentrated industry subsectors in Oregon include seafood, bakeries, other food manufacturing, food product machinery, and beverages. Some of these industries are particularly important for the rural economy in Oregon, including meat processing, seafood (Rural LQ of 92.4 not shown in the chart), food product machinery, and beverages. Seafood is especially concentrated in rural areas with an LQ of 92.4, which would dwarf the other industries if shown in the chart. Figure 2 summarizes data from Table 1 showing employment growth between 2004 and The food and beverage industry as a whole grew in employment by 28.3 percent during this period. Among the individual subsectors, glass manufacturing has grown rapidly but remains a small industry, with only two establishments and 149 jobs. Its growth is tied to growth in the beverage industry, which has the third highest overall growth rate of 91.2 percent. Other food processing is actually Oregon s fastest-growing food manufacturing sector. This sector includes coffee and tea, flavoring syrups and concentrates, sauces, spices, and other ingredients and snacks not included in bakeries and dairy. Bakeries increased employment by 35 percent during this period, and grain and oilseed milling jobs increased by 30 percent. Dairy products have had a sound employment growth of 22.3 percent, while seafood, a relatively small employment sector, grew by 19.1 percent during this period. The largest employment sector, fruit and vegetable processing, grew by 9.5 percent. Sugar and confectionary products showed a very minimal employment growth of 1.8 percent, while meat products declined in employment by 14.1 percent. This may be a reflection of declining consumer demand for certain types of meat products. As shown in Table 2, the food and beverage industry is estimated to have had export sales of $717 million in 2014, reflecting an increase of 155 percent since Based on industry output estimates discussed further below, this export sales volume represents about 4.4 percent of total industry sales. Fruit and vegetable processing led all other subsectors with $330.7 million in exports, nearly a 200 percent increase since 2004 (Figure 3). Dairy products and beverages had even higher growth rates, at 745 percent and 651 percent, respectively (Figure 4). Other food manufacturing ranked second in export volume with $96.4 million in overseas sales, for a growth rate of 142 percent. The industry has had even higher growth in sales than in employment over the past decade. As shown in Table 2, industry output in real dollar terms grew 58.2 percent between 2003 and Beverages, grain and oilseed milling, and other food manufacturing all exceeded the industry average growth rate in output. Table 2 also shows output and labor productivity estimated for the more detailed industry subsectors. The 2003 estimates are from the IMPLAN dataset that was used in ADE s earlier cluster analysis completed for the North West Food Processors Association in 2006, escalated to 2014 dollars. 1 Industry subsectors with exceptionally high output growth rates include frozen specialty food manufacturing, commercial bakeries, flavoring syrup and concentrates, and breweries. 1 Applied Development Economics and Advanced Research Technologies, Northwest Food Processing Cluster Assessment and Road Map, The NWFPA study estimated the industry input based on a combination of IMPLAN worker productivity data and employment data. The figures cited in this report come directly from the IMPLAN industry output totals. IMPLAN is the name of the input-output model published by the Minnesota Implan Group. Applied Development Economics P age 6


10 Note: The rural LQ for seafood is 92.4 and is not shown in Figure A-1 above. Applied Development Economics P age 7
11 Applied Development Economics P age 8
12 NAICS DESCRIPTION TABLE 2 INDUSTRY OUTPUT TRENDS, INDUSTRY OUTPUT ($2014) 2003 PRODUCT- IVITY ($2014) 2014 INDUSTRY OUTPUT 2014 AVERAGE PRODUCT- IVITY 2003 TO 2014 OUTPUT CHANGE 2003 TO 2014 PERCENT Dog & Cat Food Manufacturing $7,758,114 $862,013 $58,642,160 $1,153,966 $50,884, % Other Animal Food Manufacturing $266,456,875 $797,775 $368,997,984 $1,360,270 $149,609, % 3111 Animal Food Manufacturing $274,214,989 $427,640,144 $200,493, % Flour Milling $202,952,452 $692,670 $742,991,872 $1,536,730 $540,039, % Malt Manufacturing $0 $0 $0 n/a $0 n/a Wet Corn Milling $6,714,661 $1,119,110 $0 n/a -$6,714, % Fats & Oils Refining & Blending $214,748,807 $1,760,236 $266,701,264 $1,943,282 $51,952, % Breakfast Cereal Manufacturing $199,250,858 $1,077,032 $189,694,944 $747,972 -$9,555, % 3112 Grain & Oilseed Manufacturing $623,666,778 $1,199,388,080 $575,721, % Beet Sugar Manufacturing $153,727,346 $674,243 $0 -$153,727, % Confectionery Manufacturing From Cacao Beans $24,208,119 $637,056 $21,651,174 $563,563 -$2,556, % Confectionery Manufacturing From Purchased Chocolate $57,874,344 $198,200 $115,318,208 $278,194 $57,443, % Non-Chocolate Confectionery Manufacturing $16,191,046 $241,657 $164,793,936 $335,571 $148,602, % 3113 Sugar and Confectionary Products $252,000,856 $301,763,318 $49,762, % Frozen Fruit & Vegetable Manufacturing $1,969,458,162 $307,104 $2,241,340,928 $418,173 $271,882, % Frozen Specialty Food Manufacturing $95,901,831 $307,104 $673,120,000 $330,260 $577,218, % Fruit & Vegetable Canning $835,015,008 $307,104 $953,373,632 $485,494 $118,358, % Specialty Canning $12,935,596 $307,104 $24,566,624 $779,730 $11,631, % Dried & Dehydrated Food Manufacturing $380,484,937 $307,104 $413,630,432 $404,464 $33,145, % 3114 Fruit & Vegetable Preserving & Specialty $3,293,795,533 $4,306,031,616 $1,012,236, % Fluid Milk Manufacturing $726,488,830 $636,155 $1,073,497,408 $761,245 $347,008, % Creamery Butter Manufacturing $86,769,626 $1,156,928 $28,470,916 $1,519,684 -$58,298, % Cheese Manufacturing $447,844,115 $862,898 $821,644,352 $958,868 $373,800, % Dry, Condensed, & Evaporated Dairy Products $23,099,164 $824,970 $100,679,520 $1,579,007 $77,580, % Ice cream & Frozen Dessert Manufacturing $146,188,586 $512,942 $142,354,416 $370,761 -$3,834, % 3115 Dairy $1,430,390,322 $2,166,646,612 $736,256, % Animal, except Poultry, Slaughtering $211,754,020 $540,189 $334,086,624 $583,504 $122,332, % CHANGE Applied Development Economics P age 9
13 NAICS DESCRIPTION TABLE 2 INDUSTRY OUTPUT TRENDS, INDUSTRY OUTPUT ($2014) 2003 PRODUCT- IVITY ($2014) 2014 INDUSTRY OUTPUT 2014 IVITY 2003 TO 2014 OUTPUT CHANGE 2003 TO 2014 PERCENT Meat Processed From Carcasses $445,499,772 $336,480 $546,754,240 $471,005 $101,254, % Rendering & Meat Byproduct Processing $52,644,891 $408,100 $1,518,820 $572,537 -$51,126, % Poultry Processing $77,463,849 $239,826 $21,697,064 $287,696 -$55,766, % 3116 Meat Product Processing $787,362,532 $416,350 $904,056,748 $116,694, % 3117 Seafood Processing $299,170,517 $293,304 $381,725,408 $82,554, % Commercial Bakeries $17,411,201 $170,390 $767,013,248 $116,092 $749,602, % Frozen cakes & Other Pastries Manufacturing $616,469,234 $644,859 $94,517,872 $148,147 -$521,951, % AVERAGE PRODUCT Cookie & Cracker Manufacturing $373,442,078 $500,593 $256,369,168 $347,556 -$117,072, % Dry Pasta, Mixes & Dough Made From Purchased 3 Flour $68,884,682 $369,241 $94,409,696 $467,301 $25,525, % Tortilla Manufacturing $25,557,754 $146,884 $85,514,600 $183,670 $59,956, % 3118 Bakeries & Tortilla Manufacturing $1,101,764,949 $1,297,824,584 $196,059, % Coffee & Tea Manufacturing $391,253,904 $916,285 $625,181,120 $542,822 $233,927, % Flavoring Syrup & Concentrate Manufacturing $24,887,507 $731,985 $257,778,528 $2,181,300 $232,891, % Mayonnaise, Dressing, & Sauce Manufacturing $80,000,127 $620,156 $214,271,872 $563,151 $134,271, % Spice & Extract Manufacturing $34,720,341 $588,480 $85,297,152 $475,994 $50,576, % 3119x All Other Miscellaneous Food Manufacturing $966,572,991 $443,881 $1,273,444,624 $403,385 $306,871, % 3119 Other $1,497,434,870 $2,455,973,296 $958,538, % Soft Drink Manufacturing $200,080,871 $393,086 $306,880,000 $758,799 $106,799, % Breweries $191,201,295 $496,627 $1,549,216,128 $807,210 $1,358,014, % Wineries $396,928,658 $373,756 $860,804,864 $252,602 $463,876, % Distilleries n/a n/a $210,610,880 $982,235 $210,610,880 n/a 3121 Beverages $788,210,824 $2,927,511,872 $2,139,301, % TOTAL $10,348,012,170 $16,368,561,678 $6,020,549, % Source: IMPLAN Group, LLC. Notes: The figures cited in this report come directly from the IMPLAN industry output totals. The 2003 data was previously used in a study done on behalf of the NWFPA, and reported based on a combination of IMPLAN worker productivity data and employment data. CHANGE Applied Development Economics P age 10
14 ECONOMIC MULTIPLIER EFFECTS The highly developed industry linkages between food and beverage manufacturing, Oregon agriculture and the food distribution system leads to significant positive multiplier effects for the Oregon economy. Researchers at Oregon State University have measured these effects and concluded that the agriculture, food and fiber industry overall contributes 13.2 percent of total industry output in the state and 13.8 percent of all jobs. These figures include not only the direct sales and employment from firms in the industry, but also business-to-business transactions related to industry production as well as employee expenditures for retail goods and services. As shown in Table 3, the 32,000 jobs in food and beverage manufacturing expand to more than 80,000 jobs when these economic multiplier effects are considered. On this basis, the food and beverage manufacturing industry represents 6.1 percent of statewide economic output and 3.4 percent of all state jobs. TABLE 3 OREGON AGRICULTURE, FOOD AND FIBER INDUSTRY ECONOMIC LINKAGES IN 2015 DOLLARS INDUSTRY OUTPUT - SALES $ EMPLOYMENT FULL & PART-TIME JOBS (#) Production $8,191,288,907 77,490 Processing food $23,073,136,049 80,155 Processing fiber $338,666,309 2,294 Ag. support services $1,048,517,549 16,821 Wholesale trade $8,984,154,703 54,336 Transportation & warehousing $3,313,911,344 22,488 Retail Trade - food and beverage stores $888,685,750 10,662 Food services and dining places Oregon portion $4,391,585,329 62,371 Total agriculture food and fiber $50,229,945, ,617 Total all Oregon sectors $379,892,513,834 2,363,234 Agriculture, food, fiber percentage of Oregon economy 13.2% 13.8% Source: Bruce Sortie, et al., Oregon Agriculture, Food and Fiber: An Economic Analysis. Oregon State University Extension Service, Rural Studies Program. December Applied Development Economics P age 11
15 FUTURE GROWTH PROJECTIONS The Oregon Employment Department (OED) has prepared projections of employment growth for the period (Table 4). Food manufacturing jobs are projected to grow 21percent during this time, compared to 14 percent for total jobs in the state. Fruit and vegetable processing is projected to grow at an even faster rate of 24 percent, leading all manufacturing industries for which projections were prepared and double the overall projected growth rate for manufacturing as a whole, at 12 percent. TABLE 4 OREGON INDUSTRY EMPLOYMENT FORECAST, , SELECTED INDUSTRIES Employment Sector Change Percent Change Total employment 1,868,700 2,128, ,200 14% Total payroll employment 1,766,200 2,010, ,700 14% Total private 1,478,500 1,711, ,300 16% Natural resources and mining 55,300 61,400 6,100 11% Construction 79,400 97,000 17,600 22% Manufacturing 179, ,200 21,100 12% Durable goods 125, ,400 13,500 11% Other wood product manufacturing 7,300 8,800 1,500 21% Machinery manufacturing 12,200 13,900 1,700 14% Computer and electronic product manufacturing 36,400 38,900 2,500 7% Semiconductor and electronic component mfg. 27,900 30,900 3,000 11% Electronic instrument manufacturing 5,200 5, % Transportation equipment manufacturing 11,500 13,700 2,200 19% Nondurable goods 53,200 58,800 5,600 11% Food manufacturing 27,000 32,600 5,600 21% Fruit and vegetable preserving and specialty 9,900 12,300 2,400 24% Paper manufacturing 4,500 3, % Trade, transportation, and utilities 324, ,400 36,200 11% Information 30,800 32,800 2,000 6% Financial activities 93, ,200 9,100 10% Professional and business services 218, ,500 45,700 21% Private educational and health services 247, ,600 50,900 21% Leisure and hospitality 182, ,400 35,800 20% Other services 67,500 76,300 8,800 13% Government 287, ,100 11,400 4% Source: Oregon Employment Department, Published June 13, Applied Development Economics P age 12
16 THE MARKET OPPORTUNITY As described above, the Oregon food and beverage industry achieved a remarkable level of growth during the recession when overall employment declined in Oregon and manufacturing jobs were hit especially hard. Food and beverage companies responding to the survey for this project were overwhelmingly bullish on growth prospects for the industry, with 80 percent planning to expand existing product lines, and 77 percent also planning to add new products. About half of this expansion is anticipated for domestic markets, while half would be distributed both domestically and for export. In discussing specific market opportunities and constraints with focus groups for each industry subsector, a number of highlights emerged. These issues do not reflect the total volume of market potential, but rather reflect strategic areas where public/private sector actions can stimulate specific market growth opportunities. FRUIT/VEGETABLES This is the largest and best-established subsector in the Oregon food and beverage industry, poised for great expansion in overseas markets, particularly in the Pacific Rim. The major growth objectives for this group are expanding market development and receiving trade assistance from federal and state programs. This sector is heavily affected by the common issues discussed in the action plan, namely workforce development, research and development, and regulatory compliance. DAIRIES The dairy products sector is also well-established in Oregon, although not as large as fruit and vegetables. This sector is pursuing expanded export opportunities, as well as co-packing and other forms of partnership with other food sectors, such as fruit and vegetables, candy makers, and coffee. Oregon produces cheese, yogurt, and other dairy products in a wide variety of ready-to-eat products. However, within the industry there is a need for greater regional cooperation and sharing of limited resources to optimize potential. SNACKS/FOOD INGREDIENTS This subsector handles a wide variety of commodity types and has a high proportion of business-tobusiness sales. Oregon co-packing firms are finding that, despite the high cost of doing business in Oregon, there is high demand for their services from producers across the country. The co-packing niche expertise to meet specifications for products designed or formulated by other firms, using either local commodities or those supplied by the customer, is an exceptional Oregon capability that should be marketed and expanded. Promotion of the co-packing subsector would also assist Oregon startup firms that are dependent on co-packing services during their initial stages, and that are currently finding it difficult to find partners during periods of high demand. WINERIES Oregon wine production represents 1 percent of U.S. production, yet Oregon wines constitute 20 percent of the highest-rated wines in the country. The Oregon consumer wine market is saturated, however, while only 3 to 5 percent of wines produced in the state are exported. Distribution needs to expand out of country in order to grow this sector, but most producers have limited knowledge of international markets. Oregon vintners face formidable competition from California, Italy, France, Australia and other countries. The wine industry has a natural affiliation with the tourism industry. There are abundant opportunities for marketing collaboration and development of facilities and attractions in wine country that would also boost tourism. But there are also countervailing concerns about local land use, transportation planning, and preserving the rural character of wine-growing areas that complicate economic collaboration. Applied Development Economics P age 13
17 BREWERIES As with wines, Oregon beers are considered a premium product and are well-regarded both nationally and internationally. However, the brewing industry is characterized by an even higher proportion of small firms with limited marketing expertise. Significant potential exists for export and wider domestic distribution, but this sector could benefit from much higher levels of market development assistance from state agencies such as ODA. Along with expansion of the distribution channel comes the need to expand production. Breweries face an increasing number of issues at the local level concerning fire safety codes, as well as concerns about impacts on local wastewater treatment facilities. State assistance in standardizing technical solutions to some of these issues would help facilitate increased production. DISTILLERIES Although distilled spirits is a smaller sector in Oregon than wine or beer, Oregon distillers are finding markets for their products both at home and abroad, including markets in Asia and South Africa. The product is high quality, in part due to Oregon-grown two-row barley as a prime ingredient. There are several high cost factors impeding sector expansion. Distillers face a higher level of taxes at the state level than do other beverage manufacturers, and the state controls the retail distribution of spirits within the state. In addition, distillers have significant carrying costs for inventory and have not been as successful as the wine industry, for example, in getting bank financing for inventory. State policies to increase tax exemptions for personal property, and to reduce manual regulatory reporting, would be of help. Cooperative sharing of market data, and augmented instruction and research in the distilling program at OSU, could help this sector grow to meet its market potential. BAKED GOODS/GRAIN PRODUCTS Wheat is a commodity product grown throughout the northwest in similar quality and therefore not conducive to an Oregon brand. However, the quality of the grain is quite high, with a high prevalence of certified seed with low contamination. Wheat prices were exceptionally high between 2011 and 2014 due to global supply conditions but now are beginning to drop as supply increases again. The higher prices affected demand for baked goods, yet in Oregon employment in this sector grew 35 percent between 2004 and 2014 as noted in the discussion above. Industry observers note that while mature markets in North America and Europe are saturated with traditional baked goods products, there is increasing demand in Asia, where consumers are increasingly incorporating sweet goods into their diets and moving toward greater interest in western style cuisine. In addition, among developed markets there is increasing demand for a greater variety of premium and more healthful baked goods. 2 While there is substantial consumer demand for organic and non-gmo products, organic wheat is still not a significant percentage of the total wheat crop, so transportation modes are not as well established. The lack of dedicated storage and transportation facilities for organic wheat products is a constraint even at current production levels. Organic crop production requires at least a three-year process of leaving the soil fallow to avoid contamination from non-organic pesticide or fertilizer used in prior farm operations on the land. This is an expensive prospect for many farmers and slows the transition to organic production. However, in Oregon, many acres of former wheat production land were entered into the Federal Crop Reduction Program (CRP), which paid farmers to remove land from production under 10-year contracts. In the current cycle, federal policy and land owner interest is reducing the renewal of these contracts substantially, leaving many acres available for renewed production. Because the land has been fallow for at least 10 years, these acres could be brought into organic production much more quickly. Increasing organic wheat production would not only meet 2 IBISWorld, Global Bakery Goods Manufacturing, December Applied Development Economics P age 14
18 consumer demand, but would help to make additional storage and distribution facilities dedicated to organic products more cost effective. OREGON S COMPETITIVENESS IN THE MARKETPLACE With the explosive growth of our digital age of more readily available information, consumers around the world are demanding greater protections on food safety, production sustainability, and environmental quality. Moreover, combined with the perspective of an individual enterprise or a broader economic sector, such as Oregon s food and beverage industry, maintaining competitiveness is a never ending concern. To assess competitiveness, we often measure changes in market share and profitability, the level of exports, and/or the burdens of regulation and taxation. However, the competitiveness of Oregon s food and beverage sector is based not in any single outward measure, but in the quantity and quality of the state s productive resources and ability to maintain those resources into the future. Therefore, it is also important to note Oregon s relative standing among several key economic factors as compared to other states across the country. For purposes of a comparative competitiveness analysis, we examined various economic measures from several Midwestern states (Illinois, Michigan, Minnesota, and Wisconsin) as well as several Southeastern states (Florida, Georgia, North Carolina, and South Carolina) as compared to the State of Oregon. These regions were identified as they also have many food and beverage manufacturing/ processing establishments and companies. In addition, many of these states maintain active and aggressive business attraction and retention incentives and programs. These economic measures include data with changes from , as follows: Growth in Employment (especially as it relates to food and beverage sector-related measures such as middle-wage and manufacturing industries); Growth in Active Establishments (especially as it relates to food and beverage sectorrelated measures such as middle-wage and manufacturing industries); The most telling economic measures in our competitiveness analysis were the comparative growth in employment and active establishments within middle-wage industries and manufacturing industries. 4 As indicated from the indexed comparative graphs on growth in employment within middle-wage industries and manufacturing industries, Oregon compares favorably with Midwestern states like Illinois, Michigan, Minnesota, and Wisconsin. In recent years, Oregon has exceeded most of these Midwestern states in the growth of middle-wage (food and beverage processing) industry jobs, but only slightly better than the U.S. average. 3 Compare50.org, downloaded on July 18, Compare50.org is a Next 10 project. Next 10 is an independent, nonpartisan organization that educates, engages, and empowers Californians to improve the state's future. Next 10 commissions research from leading experts on complex issues and creates a portfolio of nonpartisan educational materials, including Compare 50, that foster a deeper understanding of the critical issues we face. Compare50.org was created to display how California's economy performs when compared to other states. Compare 50 data was compiled for Next 10 by Beacon Economics. Compare50.org features the most up-to-date data from authoritative sources including the U.S. Census Bureau, the Bureau of Labor Statistics, the National Center for Education Statistics, PriceWaterHouseCoopers, the Federal Communications Commission, and the U.S. Patent and Trademark Office. 4 Based upon definitions and categories utilized in Compare50.org data and further defined in downloaded July 19, Food and Beverage manufacturing fell under the category of Middle-Wage Industries. Applied Development Economics P age 15
19 Oregon has also remained competitive with these states in the growth in manufacturing jobs, surpassed only by Minnesota and Wisconsin during the fifteen year period of Another competitive measure we examined was the growth in active establishments (businesses) of both middle-wage and manufacturing industries as shown in the graphs below. When compared to Midwestern states, Oregon has held its own in the growth of new middle-wage industries, surpassed only by Illinois. Nevertheless, in recent years, Oregon s growth has mirrored that of the national average. Applied Development Economics P age 16
20 Oregon s growth in manufacturing firms has also ebbed and flowed over the years, with less volatility than other Midwestern states, which were hit hardest by the recession and negative impacts upon the auto industry and related businesses. Another relevant competitive comparison occurs with an analysis of Oregon s performance versus that of several Southeastern states, including Florida, Georgia, North Carolina, and South Carolina. By most measures, these states have enjoyed an environment of lower costs (e.g., labor, energy, real estate, taxation, etc.), plus have been known for aggressive business incentives and active business recruitment programs. As indicated from the following graphs, Oregon s competitive position is mixed when compared to these Southeastern states. While Oregon s growth in middle wage industry jobs remains consistent with the national average, Florida has far surpassed Oregon s growth, with Georgia only slightly ahead. Applied Development Economics P age 17
21 Although all states have experienced a decline in overall manufacturing jobs, it appears that Oregon s decline has been less precipitous than those of these Southeastern states, with North Carolina taking the biggest hit with losses in the textile and furniture manufacturing industries. However, the lower cost of doing business in several Southeastern states becomes most evident when growth in active establishments of middle-wage industries is compared. Florida, Georgia, and North Carolina have surpassed and continue to surpass Oregon. Oregon s growth is comparable to the U.S. average and only slightly above that of South Carolina. Applied Development Economics P age 18
22 The lower cost of doing business and aggressive state recruitment is further reflected when comparing the growth in active establishments in Manufacturing. Florida and South Carolina surpass Oregon in this measure, with Georgia and North Carolina following behind. Applied Development Economics P age 19
23 STRATEGIC INITIATVES SITUATIONAL ANALYSIS Demand for Oregon food and beverage products is at an all-time high and steadily growing. The industry led all Oregon manufacturing sectors though the Great Recession in 2008, reflecting wideranging consumer demand for its products. Between 2007 and 2012, total employment in Oregon declined 5.3 percent, and the Oregon manufacturing sector lost 15.8 percent of its jobs, yet Oregon food manufacturing gained 7.8 percent in jobs during this same period. 5 Supporting nearly 32,000 jobs directly at its manufacturing plants, the industry also has a significant economic multiplier effect for the state economy. Researchers at Oregon State University estimate that the full economic impact of the industry represents 6.1 percent of statewide output and 3.4 percent of statewide jobs. Combined with farm production and related wholesale and retail distribution channels, the agriculture food and fiber industry is estimated to comprise 13.2 percent of Oregon s total economic output and supports 13.8 percent of full- and part-time jobs in the state. 6 The Oregon food and beverage industry s main avenue for expansion is developing even stronger external markets, particularly in the Pacific Rim countries. However, the connection to local markets is vital on many levels and in order to expand, the industry must develop a stronger foundation at home. The Oregon brand in food and beverage denotes exceptional quality and craftsmanship, and commands a premium in many markets. However, as Oregon products are distributed more widely, Oregon producers are encountering price competition with producers in lower-cost regions. The industry is committed to maintaining and enhancing food safety and quality. Significant investments are needed in new facilities and worker training to meet ever-rising food safety standards, particularly in response to increasing consumer demand for fresh and fresh-frozen, readyto-eat products. The state can encourage businesses to make investments by creating incentives to invest in plant modernization and workforce development, and by making strategic investments in research and development on the industry s behalf. In addition, maintaining access to low-cost energy sources is a critical element of competitiveness for the food and beverage industry. These investments will yield untold returns in a safe, secure, Oregon-produced food system. Expanding production to meet food and beverage market opportunities will require an increased supply of skilled workers, including experienced agricultural workers, technical workers trained to operate and maintain increasingly complex machinery and control systems, and entrepreneurs and senior level managers to invent the next wave of food innovations for the global market. Some employers believe labor costs are out of proportion to the skills and production efficiency workers have to offer. This perception is leading businesses to accelerate automation of processing lines. As new, higher minimum wage requirements come into effect, companies are willing to invest as much as $125,000 per worker to replace human labor with machinery. These projected labor needs will require new approaches and expanded efforts throughout the Oregon educational system, from K-12 through the community colleges and technical schools to the four-year universities. The industry and the state must partner together to promote jobs in the food and beverage industry as exciting, creative career opportunities for young people and experienced workers alike. With its emphases on locally produced commodities and investment in energy efficiencies, the Oregon food and beverage industry has long been engaged in sustainable business practices. Food and 5 Pat O Conner, Oregon s Food Manufacturing Sector: A Staple of Oregon s Economy. November 22, Bruce Sortie, et al., Oregon Agriculture, Food and Fiber: An Economic Analysis. Oregon State University Extension Service, Rural Studies Program. December Applied Development Economics P age 20
24 beverage businesses can join rural and urban Oregon on a course of sustainable growth by expanding the supply of living-wage manufacturing jobs resistant to future recessions. An economic engine built on renewable food resources can fulfill local needs while meeting the demands of an expanding global market. To build this foundation for growth in Oregon, investments are needed not only in workforce development, product and process research, and expansion of the manufacturing and distribution infrastructure, but also in educating the public about the value and benefits of an industry so vital to everyone s health and safety. STRATEGIC ISSUES The extensive outreach conducted by the consulting team has identified a number of central issues that affect the competitiveness and expansion capability of food and beverage companies in Oregon. These are discussed below along with recommendations for strategic initiatives to address the most important concerns. These proposals have been compiled from input from individuals in the industry and consultant research during the study process. The discussions with industry representatives have identified a wide range of issues, many relating to detailed operational impediments and costs. However, the focus of the Road Map is on higher-level strategies that have the greatest potential to move the industry forward as a whole, recognizing that specific subsectors or groups of companies will have additional recommendations related to their areas of operation. Similarly, the food and beverage industry features many small businesses in Oregon which have needs relative to access to capital, shared facilities, marketing resources, and workforce. The state offers a wide range of services and program to assist small and medium businesses. These services are not addressed in detail this report but more information is available from Business Oregon and the Oregon Department of Agriculture. 7 LEADERSHIP AND COORDINATION The process of creating this Road Map has involved effective partnership between government agencies, including Business Oregon and ODA, and industry representatives, including the Oregon Food and Beverage Industry Leadership Council (OFBLC), the Oregon Business Council, the Oregon Business Association, and the Northwest Food Processors Association. Implementation of the Road Map s business strategy will require a long-term commitment to continued collaboration and coordination among these entities and others in the industry and in state and local government. In addition to the food processing and business advocacy groups named above, various other industry boards, guilds, and commissions engage in advocacy, marketing, research and other activities on behalf of their industries (examples include the Oregon Wine Board, Oregon Brewers Guild, and Oregon Distillers Guild). The OFBLC and the state agencies should ensure that these entities are represented directly or by proxy, and are actively engaged through regular contact, meetings, and participation on appropriate task forces and steering committees. Business Oregon and the Governor s Office have an established regionally-based network comprised of Business Development Officers and the Regional Solutions Teams, and federally funded Economic Development Districts (EDA). Strategic investment in regional economic development projects and services can yield big benefits for food and beverage companies, particularly in rural areas, where private-public partnerships can create shared regional resources such as co-packing plants, food storage and distribution facilities, and food hubs. RESEARCH AND DEVELOPMENT/TECHNICAL ASSISTANCE STATEMENT OF THE ISSUE For the Oregon food and beverage industry to remain competitive in the domestic and global marketplaces and to stay on top of technological and production advancements, the state s food and 7 See Applied Development Economics P age 21

25 beverage companies need access to adequate research and development opportunities, facilities, and programs. Oregon food and beverage processors are faced with increasing food safety and environmental requirements and heightened consumer expectations. They need more extensive services, training, and education to comply with the changing food safety mandates from both the federal and state governments. In addition, more research and development assistance in navigating environmental regulations is essential to managing and maintaining sustainability and protecting the state s natural resources of land, water, and air. The state s primary public provider of food and beverage-related research and development is Oregon State University. Within the University, the College of Agricultural Sciences is Oregon s principal source of knowledge relating to agricultural and food systems, and a leader in the study of natural resources, life sciences, environmental quality, and rural economies. As a fundamental part of the University s land-grant mission, the college creates knowledge to solve problems and discover new opportunities for the future. Within the College of Agricultural Sciences is the Department of Food Science and Technology ( FST ), which has principal responsibility to interact with Oregon s food and beverage processing industry. The Department has active research programs and faculty with specializations in: Food Chemistry and Biochemistry Food Microbiology and Biotechnology Flavor Chemistry and Sensory Evaluation Food Processing and Engineering Enology (Winemaking) Brewing Science Dairy Processing Seafood Science and Surimi Value-Added Foods By-product Utilization Oregon State University is currently in the process of enhancing its role as a global leader in food and beverage innovation. To support Oregon s status as a producer of quality foods and beverages through sustainable methods and processes that further support the environment and economy, OSU has proposed a major infrastructure and renovation project focusing on a Soil to Shelf process. This effort proposes to invest $18 million in renovations and new facilities for the brewing, wine, and dairy processing programs, to be funded through equal shares of public and private contributions. This proposal is now making its way through the legislative budget process. The University is also committed to enhancing and improving the services and facilities provided at its Food Innovation Center (FIC) in Portland. POTENTIAL STRATEGIC INITIATIVES Support facilities improvements at the university level. Many OSU facilities for instruction in food processing are outdated. Current OSU infrastructure enhancement proposals totaling $18 million are being directed to improving facilities in the brewing, Applied Development Economics P age 22
26 wine, distilling, and dairy processing programs. These efforts should be given high priority at the state and from the industry. Expand innovation related services to medium and large sized companies. The Food Innovation Center (FIC) has reached capacity and should be expanded. The FIC focus is primarily on helping startups, but there is a need to expand innovation related services to also help medium and larger size firms to enhance their growth needs. The industry should work with OSU to development a specific plan for this expansion. The plan should also establish a framework for a financially sustainable operational model for the facility, perhaps addressing the ability of the FIC to share in royalties generated from new product development. Develop a public/private business model whereby OSU can work directly with companies on proprietary research and development, and expand its overall level of industry driven applied research. Wastewater reclamation and transportation efficiency innovations are two areas for applied research with great potential benefit (see discussion in Distribution Infrastructure section below). Expanded research capacity to assist firms with food safety issues would be helped by additional OSU microbiologists working with industry on food safety issues. Invest in Cooperative Extension s capacity to provide food processors with informational support on topics in nutrition, public education, and product development assistance. Identify ways for the state to match federal funds in the area of food safety and technology development. Food safety is a persuasive rationale for helping aging production facilities upgrade equipment and systems. WORKFORCE DEVELOPMENT STATEMENT OF THE ISSUE Food and beverage companies have difficulty finding qualified workers with necessary skills. The rising cost of labor is accelerating efforts to automate production lines and systems, replacing jobs with machines. In the past, the threshold for employing an employee versus investing in machinery was about $50,000. Now that threshold has increased to as much as $125,000. This reduces the quantity of jobs but also further increases the level of technical skills needed in the remaining workforce. Despite this trend, and in some ways because of it, there are well-paying jobs and viable career ladders in the food and beverage industry for qualified workers. However, there is a critical need to reestablish technical training in public schools, especially in the community colleges. A mechatronics program that combines instruction in electrical, mechanical, and hydraulic systems with training on high-speed machines is a vital need. The food and beverage industry also needs management, marketing, and entrepreneurial talent to support long-term future expansion. Many companies recruit this talent from outside the state. The industry needs to work with the major universities in the state, particularly the business schools, to promote high-level career opportunities in the food and beverage industry among students and business school faculty. Oregon s existing educational infrastructure can potentially address these needs, but strong industry involvement is needed to help direct the available resources. In 2015, the Oregon Legislature more than doubled the state s investment in Career and Technical Education (CTE) and Science, Technology, Engineering and Math Education (STEM). While ongoing state-level efforts will help pull these resources together into a more cohesive program, the food and beverage industry should engage with local, regional, and statewide educational entities to design and implement the educational curriculum Applied Development Economics P age 23

27 and training programs the industry needs. This will require not only organizational efforts but also financial investment from the industry. Fortunately, other industries in Oregon have also been working on this issue and have helped to develop some successful approaches, as explained below. The traditional educational system of K-12 schools, community colleges, and four-year universities (as well as private educational institutions and organizations) is supplemented by several federal and state programs focused on technical workforce training. Career Technical Education (CTE): Developed out of the National Career Cluster Initiative and currently funded by the federal Perkins Career and Technical Education Act of 2006, CTE is an approach to applied skills education that has, in collaboration with industry, developed employability standards for a wide range of career paths relevant to Oregon industries. These standards have been applied to courses of instruction available to students in high schools and community colleges. Oregon currently receives $11 million per year from the program, which is administered by the state s department of education. These funds are split evenly between high school and community colleges, with about 17 community colleges and more than 200 high schools currently participating around the state. Additional schools and community colleges could participate in the program; however, the level of federal funding is fixed regardless of the number of local schools in the program. 8 The state also offers competitive grants through its CTE Revitalization program to supplement federal funds. State officials have indicated that a grant application for a food and beverage program would be well received, as it would constitute an innovative model in Oregon. The state has identified a skills cluster for food science and processing in its CTE program, but there are no local school districts currently offering programs based on this skills cluster. Typically, CTE programs are initiated when local school districts approach industry representatives (or vice versa) to collaborate in designing a program using a state-adopted skills cluster profile as a guide. The basic program needs to be funded at the local level, which may require industry financial participation with the local school district. However, with application to participate in the state CTE program, the local program would become eligible to receive funding for additional equipment or facilities beyond the basic level defined in the program guidelines. The application would be even more competitive if it was submitted by a regional consortium of several school districts that could share high-level equipment or facilities. In addition, the state assists with licensure for teachers qualified to teach the program, and 8 Reynold Gardner, Secondary/Post-Secondary Transitions Ed. Specialist, Agriculture and Natural Resources Systems, Oregon Department of Education, personal communication, June 9, Applied Development Economics P age 24
28 provides other technical assistance. Finding and/or training qualified instructors is a critical element for success of such CTE programs. Ideally, a program would be designed to begin at the high school level, and then proceed with options for students at the community college and possibly on to a fouryear college, depending on the career path. Community colleges also offer CTE programs that may not necessarily be connected to local high school programs. Workforce Investment Boards (WIBs). Originally authorized by the federal Workforce Investment Act of 1998, WIBs are now funded by the Workforce Innovation and Opportunity Act (WIOA) passed in WIBs exist at the county level in most areas and are overseen by a statewide WIB. The WIBs have majority private sector membership and are responsible for establishing coordinated workforce development plans that meet identified skills needs for workers, job seekers, and employers. Support from the WIBs, with WIOA funding, encourages local areas to adopt or expand best practices in career pathways (CTE), industry sector partnerships, and attainment of industry-recognized certificates and credentials linked to in-demand occupations. Among other services, WIBs frequently fund on-the-job training programs directly with employers. Currently WIBs are working with local employers to develop sector strategies to address specific workforce needs in targeted industry sectors. For example in Eastern Oregon the WIB is developing a sector strategy around advanced manufacturing, an effort that includes many food processors from Boardman to Ontario. Opportunities exist to further partner with the WIBs on sector strategies that support food and beverage manufacturing. Science, Technology, Engineering, Math (STEM) Investment Council. This is the primary program Oregon has established to prepare elementary, secondary, and college students for a variety of high-wage and high-demand occupations. The Oregon Legislature established the STEM Investment Council to 1) double the number of 4 th and 8 th grade students proficient in math and science by 2025 and 2) double the number of CTE-STEM degrees and certificates by The food and beverage industry could use the STEM Investment Council s STEM Hubs program as a vehicle for training youth and young adults for employment opportunities in food processing. The STEM Hubs are multisector partnerships that link local educators, higher education, workforce and economic development partners, community-based organizations, and business and industry representatives to develop a shared vision for increasing student access to STEM and other experiential learning opportunities. STEM Hubs offer educators professional development training in best practices for STEM instruction, promote opportunities for hands-on learning experiences for students, both in and out of school, and connect students to STEM employment opportunities in the region and state. 9 In addition to working with WIBs and the CTE program, the food and beverage industry could also coordinate with STEM Hubs to prepare its future workforce, beginning as early as high school. Although the food and beverage industry has not traditionally participated in STEM-based curricular development, the need is becoming more apparent. Oregon s 2016 draft STEM Strategic Plan 10 notes that the demand for workers with STEM backgrounds is also coming from established sectors such as food processing, manufacturing, agriculture, and forest products, not just the traditional STEMfocused industries such as electronics, software, clean energy, and cutting-edge cancer research. The STEM draft also observes that Oregon s recent economic resurgence is based on the infusion of emerging technologies into every sector of the business landscape. 11 and that the STEM Strategic Plan is helping people understand the changing nature of work, with the realization that many emerging industries such as artisanal food manufacturing are highly technical and scientific. 12 STEM Hubs can be found throughout the state of Oregon. Food and beverage companies should participate in local STEM programs to ensure that food science is part of the curriculum taught in their Transforming STEM Education in Oregon: A Strategic Plan (Discussion Draft 1.0, V20) (March 2016) 12 Kyle Ritchey-Noll, executive director, Oregon Learns, personal communication, June 22, Applied Development Economics P age 25
29 local schools. The Southern Oregon STEM Hub, a typical example of a STEM Hub, includes among its participants, an area workforce investment board, community colleges, and career technical institutes. 13 Food and beverage industry associations should act to establish STEM Hubs in regions that lack but could benefit from them, and at the state policy level, should participate in the CTE-STEM Employer Coalition. The Coalition is a vehicle for all industries and private labor groups who value CTE and STEM programs as vital investments preparing students for the cognitive demands of technical occupations and life. 14 The Oregon Talent Council (OTC). Established in 2015 by the state legislature, the OTC is administered by the Oregon Employment Department and is intended to provide an additional voice for industry in designing technical education programs, particularly at the university level. The OTC published a Biennial Talent Plan in November 2015 which defines a number of target industries and 10 professional/technical occupational clusters. The food and beverage industry is included in the plan as part of the Advanced Manufacturing industry, and the need for additional workers skilled in mechatronics is specifically identified in the plan. Several of the occupational clusters identified in the plan are highly relevant to the food and beverage industry, such as: technologically skilled mechanics and maintenance technicians, industrial machinists, millwrights and operators, and data and business intelligence analysts, among others. The OTC has a small pool of funds totaling $5.5 million over two years to fund development of training models that meet the industry and occupational cluster criteria. In addition, OTC has $1.2 million to fund directed projects, which might be more intensive model development programs. The Council is heavily focused on retraining and upgrading skills for the incumbent workforce, which is highly relevant for the food and beverage industry. Existing food and beverage workers need extensive retraining to keep current with ever-evolving food safety requirements and technologies. In early July of 2016, OTC will begin reviewing options to apply its directed funds pool to the development of new training models in food science and manufacturing. Other models exist at both the local and industry-wide levels for technical workforce training. The Pipeline-to-Jobs program in Albany was started with the help of local food processing and other manufacturing companies, and is operated by the Albany Chamber of Commerce. The program is designed to stimulate interest in manufacturing among students at the high school and community college level, offering technical skills classes, career opportunity events and counseling, and employability instruction to teach work habits and soft skills. This program is entirely funded by local industry, with instruction provided by the community college. The college reports significant student interest in response to the outreach program. 15 The Sage Center, developed by the Port of Morrow in Boardman, is an example of food and beverage industry collaboration to promote agriculture and food processing to a wider audience, particularly school children. The center hosts numerous school groups as well as adult visitors throughout the year to educate them about the food processing industry and potential career opportunities. On the private sector spectrum, the bioscience industry has established a finishing school, entirely industry operated, that provides career advancement training for incumbent workers (Bio-Pro program) and a separate program to attract and train workers new to the industry (Bio-Catalyst program). POTENTIAL STRATEGIC INITIATIVES Work with state and local educational agencies to develop education and training programs specific to the food and beverage industry. This can occur on a number of 13 Southern Oregon STEM ( and ) 14 Oregon CTE-STEM Employer Coalition ( 15 Josefine Fleetwood, Workforce Development Director, Albany Area Chamber of Commerce, personal communication, June 2, Applied Development Economics P age 26
30 levels to dovetail with existing state and federally-funded programs for education and workforce development: o o o o o o Identify a local school district where the Oregon Career Technical Education Skill Cluster for Food Science and Processing can be initially deployed and tested. This would best be implemented in an area where a local education program already aligns well with food and beverage industry needs. Explore opportunities to develop technical education models through the Oregon Talent Council (OTC). The Council focuses on re-training and upgrading skills for incumbent workers as well as new workers. The food and beverage industry must continually train its workforce to keep pace with revisions in food safety regulations. Work with regional Workforce Investment Boards (WIBs) and their sector strategies initiative to ensure adequate coverage of food and beverage processing needs. Connect with existing STEM Hubs and identify additional regions with concentrations of food and beverage companies where additional STEM Hubs could be established. Organize discussions with university business schools to better integrate reference to food and beverage careers in the curriculum. Promote course sharing among multiple university departments to create food specific degree paths that cover a wide range of relevant disciplines including agriculture, engineering, food science and business. When established, promote this focus on concentrated food career degrees to out of state students. Explore the potential to establish a finishing school for food and beverage manufacturing, based on model examples implemented in other industrial sectors, such as bio-sciences. Promulgate models developed by some food and beverage companies that provide employees with education benefits leading to job certifications and advancement within the company. Compile information and guidance on labor laws, union work rules, and liability issues to assist companies that wish to offer summer jobs or internships to high school students. Explore alternate payment plans that would offer a training wage level or stipend to interns rather than minimum wage, as an inducement to companies to expand their internship programs to Oregon residents. Sponsor high school student leadership programs such as Future Farmers of America (FFA), Skills USA, and ProStart to generate student interest in food processing as a career. For example, an FFA club could focus on value-added food and beverage processing rather than agricultural production if proper sponsorship were provided. Collaboration between the Oregon Employment Department (OED) and private workforce referral agencies to better coordinate part-time worker availability, or shared workers, would be of particular benefit to startup firms. DISTRIBUTION INFRASTRUCTURE The state of Oregon s transportation infrastructure impacts the food and beverage industry. Loss of container shipping capacity in Portland has affected processors access to raw products as much as it has the distribution channels for finished goods. As shipping and rail options have decreased, greater Applied Development Economics P age 27
31 burdens have been placed on the state highway system, with adverse effects for all Oregon citizens, as well as the distribution industry. Moving goods is a highly decentralized activity, and every processor works out their own individual ways to obtain raw materials and to ship product to market. Shipping costs directly correlate to volume, distance, and the number of destinations. Rail only becomes cost effective for multiple containers or railcars and at shipping distances over 1,000 km (~ miles). Reliable inbound shipments of raw materials are as important as outbound shipments of finished goods. In general: The smallest shippers with less-than-truckloads (LTTL) and less-than-container loads (LTCL) typically ship by truck from suppliers and to markets at relatively high cost, but are usually able to offset that cost by charging a premium price for their product. They often sell direct to the customer, and ship a high percentage of their finished goods via FEDEX and UPS, even some by air freight. Examples include organic processors, specialty products, wineries, breweries, distillers, and farm stores. Since the 2008 recession the number of freight consolidators has diminished, putting further upward pressure on distribution costs. Small and mid-sized processors (SMEs) transitioning into wholesaling may have the greatest distribution challenges, especially those in rural Oregon. Even though they may now receive and ship full truckloads or a few containers per year, they often cannot meet volume minimums. Negotiating the entire distribution chain is time consuming. Rail at these low volumes is costly and unreliable, and there are too few intermodal facilities to be convenient. The vast majority of product is shipped intrastate and interstate by truck. A big export challenge for all processors has been the loss of international container shipping capacity at Portland Terminal 6 in early This terminal handled almost half of all Oregon container traffic. Over 1,000 shippers had to scramble and ship by truck at costs of $ more per container. 16 Most containers now ship in or out of Seattle/Tacoma at higher rates per container and additional mileage to port. The Governor s International Trade and Logistics Initiative is discussing several alternatives to address the Portland terminal closure. 17 Inland port development will help relieve congestion at coastal ports and also provide land for regional industrial development. More truck-rail connectivity will add flexibility to the transportation system, especially in Eastern Oregon and the Willamette Valley. The Port of Morrow at Boardman has recently added a container intermodal facility, which can connect to Vancouver, Washington for transfer to ocean ports. The Port of Umatilla has new container capacity as well. As is true everywhere, truck transportation is plagued by a truck driver shortage and tightening regulatory requirements, including the new national 8-hour limit on drivers, increased security screening, and minimum age requirement. There is also a trailer and heavy chassis shortage, but the industry has begun investing in equipment. Rail is constrained by limited rolling stock. Roads and bridges carry more traffic than ever, are congested and deteriorating, and need significant investment to keep Oregon competitive page Oregon s International Trade and Logistics Initiative. Full.pdf 18 According to a report released by ODOT in September 2015 ( Bridges: More than half of Oregon s bridges were built before 1970 and will need major repairs by While state highway bridges have a 100-year life cycle, ODOT explains that the agency is only able to replace an average of three per year, well shy of the 27 bridge replacements per year necessary to keep up with the aging infrastructure. The analysis estimates that $240 million per year over the next two decades is necessary to maintain the deteriorating bridges, with an additional $180 million for state highway bridges. Applied Development Economics P age 28
32 Small rural producers seeking to add production capacity do complain about the limited availability of co-packing, warehousing, cold storage, meat processing, food hubs, and other services, and must look to urban areas or across state lines where these services are more readily available. For example, organic grain producers that need to keep their product separate from nonorganic products, struggle to find adequate storage capacity. Water availability and quality affect agriculture, food processing, and the other users of surface and groundwater in the Columbia, Snake, and Klamath basins. Finite water supplies limit crop production, which in turn limit raw material availability for processing. Specifically, there are opportunities to improve the efficiency of using reclaimed industrial and municipal wastewater for irrigation and/or groundwater recharge. Strengthening research and investment in these areas will help mitigate the ongoing water constraints (see strategic initiatives under R&D/Technical Assistance above and Government regulation below). Updating regulations to keep up with technology advancements will help speed the approval process. Oregon has a cooperative organizational framework in place to address the above issues, including the International Trade and Logistics Initiative already mentioned, and the Regional Solutions Teams that direct funds to important regional projects. POTENTIAL STRATEGIC INITIATIVES Continue to invest adequately in highways, roads, and bridges to sustain reliable truck transport of food and beverage raw materials and finished product. Pass a statewide transportation improvements package. Improve the effectiveness of the resources available to solve regional infrastructure and economic development issues. Identify ways to expand business-to-business distribution channels and marketing to assist the many Oregon food and beverage companies that produce intermediate products, or who can provide co-packing services. Provide retention and expansion assistance for LTTL and LTCL shippers and consolidators that operate in rural areas. At the very least, avoid enacting any Oregononly regulations that make it more expensive for them to do business. MARKET DEVELOPMENT Many of the food and beverage firms participating in this study identify substantial market opportunities overseas as well as in domestic markets beyond the west coast. With the rapidly increasing middle class populations in Asia, the Pacific Rim countries are a prime market, but many companies also report significant opportunities in Latin America, Europe, and Africa. While some Oregon firms have enjoyed good success in penetrating export markets, many small- to medium-sized firms lack the knowledge and expertise to properly promote their products overseas. Business Oregon and the Oregon Department of Agriculture (ODA) provide technical assistance and grant funding to firms seeking to export food and beverage products, These efforts can be better linked to an overall state market development strategy that reflects the unique characteristics of Oregon food and beverage products. Such a strategy could help coordinate a variety of resources and take advantage of overlapping promotion efforts by several subsectors within the industry. Roads: A January 2016 Oregon update by TRIP found that 16 percent of the state s major roads are in poor condition, contributing to $967 million per year in vehicle repairs and other operating costs borne by motorists. Additionally, 42 percent of Oregon s major urban highways are congested. Applied Development Economics P age 29
33 Oregon food and beverage companies have an opportunity to develop an Oregon food brand for some food products, but not all. Grains, fruits, potatoes, onions, beef, and other commodities are typically grown throughout the Tri-State area of Oregon, Washington and Idaho, and are often aggregated and processed in Idaho or Washington and then promoted as a Tri-State product. On the other hand, products grown and processed in Oregon whose provenance can be confirmed and whose labels can identify them as Oregon products are good candidates for an Oregon brand. Examples of products found in California supermarkets that area easily identified with Oregon include Oregon cherries, Oregon hazelnuts, Tillamook cheese and ice cream, Bob s Red Mill grains, Deschutes Brewery beers, and Beaver Brand mustards. Brand promotion is best handled by the industry directly or through the various commodity commissions, local associations, and guilds. Firms in different subsectors of the industry make vastly different products, distribute them through different channels, market them to different customers (e.g. wholesale versus direct-to-consumer), and key on different product qualities (e.g. organic, taste, sugar content, etc.). However, the state could help by investing in information resources that would benefit wide segments of the industry and are difficult to collect by individual companies due to the cost and technical expertise required. A marketing data clearinghouse available to all firms in the industry could include data about key characteristics of Oregon food and beverage products (i.e., high quality, sustainable, etc.) and also detailed, high-level consumer analytics to help target marketing efforts to specific, appropriate demographics. Certain segments of the industry are natural partners with the tourism industry. Particularly good examples are beverage products and specialty foods offered through restaurants and other direct-toconsumer outlets at tourism destinations around the state. Collaboration with Travel Oregon on its domestic and foreign marketing efforts is an essential ongoing step for the industry, but could be improved through the use of more refined consumer analytics as identified above. In addition to marketing Oregon food and beverage products to consumers, marketing the state to additional food and beverage companies will be essential to building a critical mass of industry operations, making the food and beverage industry an effective industry cluster for Oregon s economy. The state has a business attraction program coordinated through Business Oregon, which also coordinates with ODA as it relates to food and beverage industry attraction. In focus group conversations throughout this study process, respondents said that targeted marketing to copackaging, distribution, transportation, and food machinery businesses would help fill vital niches in the industry cluster in Oregon. A general media component geared to increasing awareness of the food processing industry was also recommended to help attract new employers, employees, and entrepreneurs. POTENTIAL STRATEGIC INITIATIVES Through ODA and Business Oregon, define and develop an explicit value-added food and beverage market development strategy. Allocate state resources to assist food and beverage companies with foreign and domestic export, as well as access to other market development opportunities. Compile data about the characteristics of Oregon food and beverage products (i.e., high quality, sustainable, etc.) and supporting high-level consumer analytics that can be accessed and used by companies to support their marketing programs. Where appropriate, coordinate with existing state marketing programs such as those conducted by Travel Oregon. Increase existing efforts through the Team Oregon partnership with Business Oregon, ODA, and local economic development entities to attract more food and beverage companies and entrepreneurs to Oregon. Explore opportunities to attract more copackaging, distribution, transportation, and food machinery businesses. Applied Development Economics P age 30
34 Develop a comprehensive public education campaign in Oregon to convey the benefits of the industry, increase external markets, and attract new companies and specialized talent to the state. Specific elements of this campaign would include: o o o o Promotion of food and beverage occupations as exciting career choices for junior high and high school students to consider. Promotion of food and beverage businesses to millennials and urban voters as a means to achieve ideals of sustainability, local sourcing, and high-quality food choices. In rural areas, promote the message that food and beverage occupations can provide a viable alternative to declining jobs in the forestry and raw materials extraction industries. Convey to voters and legislators that the food and beverage sector is recession resistant and a substantial part of the Oregon economy, but that the industry has an aging workforce and aging plants that need to be replenished by substantial public and private investment in order to maintain food safety and cutting-edge product manufacturing. GOVERNMENT REGULATION STATEMENT OF THE ISSUE Food and beverage companies are subject to a range of federal, state, and local regulations, particularly concerning food safety regulations. Complying with these complex regulations and the associated costs, 3 rd party audits, labeling requirements, and inspection routines, is proportionally a heavier burden for smaller processors than it is for larger, better-established firms. Although there are many agencies and organizations (such as ODA, Business Oregon, the Oregon Food Innovation Center, NWFPA, and private legal firms) that offer small businesses information and advice, it is very difficult to maintain current information about all the available help resources. Many companies are unaware of services available to them, and would benefit from a more coordinated information referral system. A designated clearinghouse operated by the food and beverage industry could provide a more comprehensive and cohesive referral resource that all entities could use to refer businesses to proper subject experts best able to assist them. Already tasked with the demanding compliance obligations associated with food safety regulations, food and beverage firms have a hard time dealing with all the other more general Oregon business regulations. Local development regulations sometimes inhibit food plant expansion and could be more standardized throughout the state. In several regions, the Road Map consultants heard stories of companies considering or actually establishing locations across state lines to avoid Oregon s stricter regulations. Disparities between Oregon state and federal policies on regulatory topics such as equipment depreciation, agricultural land inheritance, and reporting requirements, create unnecessary confusion that adds to the cost and difficulty of compliance. These problems could be substantially reduced by bringing state and federal regulations into closer congruence. Examples of problematic Oregon-specific regulations include: State equipment/machinery depreciation schedules often differ from federal. Bringing these two rates into alignment would greatly simplify tax filing. Also, in terms of direct taxes on equipment, food and beverage industries need time to make a return on investment before taxes come due. (We note the existence of the Oregon Construction-in-Progress tax exemption, which probably needs wider promotion). Oregon s estate tax policies do not match federal standards, and should. Oregon estate taxes kick in at $1 million instead of the $5.45 million federal trigger. All assets located in Oregon Applied Development Economics P age 31
35 are also taxed, regardless of where the owner resides. These inconsistencies discourage passing on agricultural land to heirs, encouraging land sales instead, and strain the ability to keep large tracts of land productive. Oregon recent changes to its minimum wage laws will impact business costs for the industry. Incremental increases and the regional wage differences built into the law help mitigate some of these cost impacts on business. However, due to the increased cost of labor, the food and beverage industry expects to invest more heavily in technology and productivity than in labor. An interpretative difference among local jurisdictions has surfaced, concerning occupancy codes for grain storage at breweries and distilleries. The state can establish standardized local building and fire safety regulations in such cases. The state should fund research to formulate best practices for fire codes, wastewater treatment, and other local development requirements. Electrician accreditation requirements in Oregon restrict hiring opportunities in eastern Oregon and other places, 19 and have added tens of thousands of dollars to the cost of at least one food processing project. Some regulatory improvements can be relatively simple, involving adjustments to implementation and reporting procedures rather than amendments to the regulations themselves. For instance, The Oregon Liquor Control Commission (OLCC) has fillable online forms for reporting. This is first step toward additional improvements that OLCC could make by adding more online reporting capabilities, streamlining the reporting requirements that OLCC shares with other agencies, and making aggregate data that OLCC collects available to the beverage industry for marketing purposes. Simplification and better data would save hundreds of small beverage businesses time fulfilling their reporting requirements. POTENTIAL STRATEGIC INITIATIVES Bring State regulations into conformity with federal regulations. Burdening Oregon s food and beverage industry with Oregon-specific rules that unnecessarily complicate doing business. Examples include depreciation schedules, tax policies and rates, minimum wage laws, energy rates, labor laws, and electrician accreditations. Improve the efficiency of reporting requirements and the availability of data for both governmental and private sector purposes through public investment in modern regulatory compliance systems. One example where improvements have begun but need to continue is the Privilege Tax filings with the Oregon Liquor Control Commission. Develop an information clearinghouse system for regulatory, financial, technical, and other informational assistance to the Oregon Food and Beverage Industry through public/private collaboration. Services would be primarily by referral, rather than duplications of established programs. This clearinghouse could be jointly supported by a number of entities, for example, Business Oregon, ODA, EDA, SBA, and others. Promulgate building development standards and use of reclaimed processing water that meet performance criteria but recognize unique food and beverage characteristics. 19 Umatilla County Skilled Workforce Study, May 2016, Page 21. Applied Development Economics P age 32
36 PROGRAM EVALUATION METRICS It is important to monitor and evaluate progress in implementing the Food and Beverage Industry Road Map. Tracking sales, jobs, wages, the number of establishments and location quotients are typical economic indicators used to measure industry performance. This chapter discusses recommended outcome metrics and methodologies that can be used to collect and evaluate data to understand changes in the industry, and process metrics that can be used to monitor accomplishments related to implementing strategic programs. OUTCOME METRICS INDUSTRY OUTPUT/SALES Food and Beverage Industry output represents the sum value of all the economic activity within the sector. The components of the industry output include commodity inputs (including goods and services), labor income, property income, profit, and taxes. Tracking the industry output over time will identify how a particular industry performs over time. The comparison can look at absolute growth, comparing how much food processing activity has grown within a given time period, with growth in industry output across the entire economy. Industry output can also be used to look at relative growth by comparing how the growth trends in food processing within a given region compare to other states and regions, or to the country as a whole. Industry output data is generally found in input-output modeling datasets. Sources for this data include the Bureau of Economic Analysis (national data), the IMPLAN Pro model, the REMI inputoutput model, the REDYN model, and the Economic Modeling Specialists Int l (EMSI) application. In addition, the Annual Survey of Manufactures (ASM) and the Economic Census (taken once every five years) track data on value of sales. All of these measures can also be combined with employment data to track industry productivity. Most of these sources will track the data at the county level at a minimum, while the IMPLAN, REMI, and EMSI data can also identify industry output at the ZIP code level. The ASM and Economic Census data can report findings at the city/place level, albeit with many sectors suppressed due to confidentiality restrictions. EMPLOYMENT Employment data represents the job effects that the food processing sector creates. Employment data represents the most direct effect on a local or regional labor force. The absolute growth and relative growth serve as indicators for how the sector is doing as a standalone measure, or in comparison to other industries and other economic regions. Employment data is generally provided by state employment departments and the federal Bureau of Labor Statistics (BLS). In Oregon, the agencies responsible for collecting and reporting employment data are the Oregon Employment Department and Business Oregon. This data is generally available at the state and county level. Other sources of employment data include the ASM and Economic Census, which can also provide employment data at the city/place level. It should be noted that with all of these sources, the data reporting might not include all sectors due to confidential nondisclosure restrictions. In order to track employment at a more detailed level (down to the six-digit NAICS codes), it might be necessary to use data from private vendors. These vendors, such as IMPLAN and EMSI, begin with the same baseline data and use proprietary modeling techniques to estimate the employment for the nondisclosed sectors. The EMSI employment data is also estimated down to the ZIP code level. Applied Development Economics P age 33
37 AVERAGE INDUSTRY WAGES The wage data represents a measure by which a particular industry might benefit workers through increased labor income and compensation. As with the other measures, the absolute growth and relative growth indicate how well the sector performs by itself, and in comparison to other sectors and economic regions. The wage data is generally reported as either an aggregate total within a particular industry, or as an average annual wage. Hourly wage data is more generally available for occupations. Wage data generally comes from the Oregon Employment Department, and the federal Bureau of Labor Statistics. This data is available at the state and county level. In addition, the ASM and Economic Census report wage data, and have the data available at the city/place level. As with the employment data, the wage data might not be available at a detailed level due to confidential nondisclosure restrictions. Private data vendors, such as EMSI and IMPLAN, can provide wage data that uses proprietary models to estimate wages for nondisclosed sectors. The EMSI wage data is available down to the ZIP code level. NUMBER OF ESTABLISHMENTS The establishment data provides an indicator for new business formation and/or business attraction for a particular area. Growth in the number of establishments provides one additional indicator of change in economic activity by highlighting entrepreneurship. Tracking the establishment data over time and combining it with the employment data can also indicate the extent to which activity is distributed across multiple new establishments or is being increasingly concentrated into larger establishments. Establishment counts come from the Oregon Employment Department and the federal BLS, and are available at the state and county level. The ASM and Economic Census report establishment counts as well, and make the data available down to the city/place level. Private data vendors, such as EMSI and IMPLAN, can also report establishment data along with employment and wage data at a more detailed level. LOCATION QUOTIENTS: STATEWIDE AND RURAL The location quotient represents a measure of employment concentration for a given industry, relative to a comparison economic region. This measure is calculated by taking a particular industry s percentage of total employment, and dividing it by the industry s percentage of total employment for a comparison region. Generally, this is used to compare how a smaller region, such as a county or state, performs relative to a larger region, such as a state, MSA, or the nation. A high location quotient (above 1.0) indicates that a specific industry in a given area has a high concentration of employment compared to the same industry within a larger region (or other comparison area). High employment concentration means that an area is more specialized in a particular type of economic activity. When combined with positive employment growth, those economic sectors with high location quotients should be regarded as the leading industries within a region. A low location quotient (below 1.0) indicates that a specific industry has a low concentration of employment compared to the comparison region. While an area with lower employment concentration might not be as specialized in a particular economic activity, the location quotient should be interpreted in combination with other indicators, such as employment growth. An economic sector with low existing employment concentration and positive employment growth might be an emerging industry that can eventually become a leading industry. The data sources for tracking the location quotients are the same ones that provide employment data. PROCESS METRICS To track overall progress in the industry, the Road Map proposes a number of traditional outcome metrics such as sales, jobs, wages, and location quotients and provides resources for this data. Applied Development Economics P age 34
38 However, it is also important to track successes or failures in implementing program developments. The data sources for this may need be developed from original research, as published information sources will likely not exist. Examples of process metrics include the following: Dollars invested in upgrading/expanding university Food and Beverage research and education facilities and programs Number of Food and Beverage instructional programs at high school and community college level Number of students enrolled in Food and Beverage educational programs Regulatory/tax policy changes effected for the benefit of the Food and Beverage industry Federal grants received for R&D/Food safety Number of food and beverage related projects completed by Regional Solutions Teams Applied Development Economics P age 35
39 APPENDIX A: Industry Survey During February and March 2016, Moore Information conducted a survey of food and beverage firms in Oregon. The steering committee and the project team compiled a list of 1,960 individuals in the industry, representing more than 1,200 firms. On this list, 587 of the firms had at least one address for a company executive, typical the owner or CEO. Moore information sent our 497 invitations for the online survey (68 of the mail addresses bounced and 22 of the firms opted out of the survey). The invitations were signed by Patrick Criteser of Tillamook County Creamery Association and Sam Tannahill of A to Z Wineworks as co-chairs of the Food and Beverage Industry Leadership Council, and by Vince Porter, Interim Director of Business Oregon. Moore Information sent several reminders during the course of the survey, and also promoted the survey in the newsletters of the Oregon Wine Board and the Breweries Guild. Of the group receiving invitations, 87 completed the online survey, for a response rate of 17.5 percent. Moore Information also conducted 15 surveys via telephone, which resulted in a total of 102 completed surveys. In addition, 6 surveys came in from a second person (other than the business owner or CEO) at the responding companies. These surveys have not been counted in the results discussed below but will be used to help flesh out our understanding of key issues. A number of the companies reported offering multiple types of products, resulting in 133 responses for the various industry subsectors, as shown in Table A-1. Most of this overlap occurs for firms that produce meals and snacks and therefore show up in the Other category, in addition their listing in the category of their primary product line. Compared to industry averages (where each establishment is assigned to only one category), the Other/ Sugar and Confectionary group appears overrepresented in the survey; but in fact many of these firms are also represented in more than one category. Fruit and vegetable processors are also overrepresented in the sample, while meat products, seafood, and beverages are underrepresented. TABLE A-1 SURVEY RESPONSES BY PRODUCT TYPE COMPARED TO OREGON INDUSTRY TOTALS INDUSTRY SUB-SECTOR [A] OREGON ESTABLISH- MENTS PERCENT SURVEY RESPON- DENTS [B] PERCENT Animal food manufacturing % 1 0.8% Grains and baking % % Fruit and vegetable preserving % % Dairy products % 8 6.0% Meat products % 3 2.3% Seafood products % 3 2.3% Beverages % % Other/Sugar and confectionary % % Other NA NA % Total 1, % % [a] Merchant wholesalers have been included along with food processors in the relevant industry subsector groups. Statewide figures do not include food machinery products or glass manufacturing. [b] The total survey sample is 102 firms. Some firms produce multiple kinds of products. Of the responding firms, 53 percent identified as food processors and 20 percent as beverage manufacturers. Supplier companies comprised 16 percent of respondents, and ingredients Applied Development Economics P age 36
40 manufacturers were 12 percent. Growers and fresh food packers were a combined 13 percent, and 8 percent identified as distributors. The salient survey results are discussed in the Survey Summary section below, followed by more detailed discussion for each of the major industry subsectors. OVERALL SURVEY SUMMARY RESPONDENT SAMPLE CHARACTERISTICS Forty-three percent of the firms produce packaged products, while 35 percent offer fresh food and 24 percent provide frozen products. (Firms may produce multiple product types). Twelve percent of the firms provide dried products, and 10 percent canned. Nearly half of the firms offer organic products. Eighty-five percent of the firms are headquartered in Oregon, and 57 percent sell only to domestic markets. Of those that export internationally, 31 percent sell to Canada, 21 percent to Asia, 16 percent of Mexico and Latin America, and 14 percent sell in Europe. Seventy-five percent of all the firms have just one facility in Oregon, while 7 percent operate 5 or more facilities. Sixty-four percent have 49 or fewer full-time employees. GROWTH PROSPECTS Eighty percent of the firms have experienced growth over the past three years, and 95 percent expect further growth over the next five years [Q s ]. Eighty percent of the firms expect to expand existing product lines [Q.30], while 77 percent expect to develop new products [Q.31]. About half of this expansion would be for domestic markets, and half for both export and domestic. The factor most affecting expansion potential is the development of better distribution channels [Q.s 32-38]. All of the other factors tested received more neutral or mixed responses, including: access to greater agricultural supplies; more research and development; better transportation systems; improved utility infrastructure; and more land availability and international market competition. However, larger firms tended to place more emphasis on these factors than did smaller firms, although smaller firms see research and development capacity as a greater industry strength than do larger firms. MARKETING [Q S ] Forty-three percent of the firms participate in cooperative marketing efforts, but 57 percent do not. Of those who do, 82 percent find the co-op marketing arrangements satisfactory. About 55 percent of the firms feel that the Oregon brand is strong in the national market, while 39 percent feel it is strong overseas. Seventy-nine percent agree that a strong brand would benefit their products. Forty-five percent of the firms agree that increased tourism marketing would improve their sales. WORKFORCE [Q. 39] Fifty-two percent of the respondents consider the cost of labor as their most pressing workforce issue. A shortage of workers with technical skills was second at 45 percent, followed by a lack of soft skills (32 percent), and the lack of senior management personnel (14 percent). INDUSTRY STRENGTHS AND WEAKNESSES [Q S ] Oregon food processors are generally happy with the quality, cost, and availability of agricultural commodities to support their production. As noted above, improvements in these factors were not identified as critical to future expansion. Consistent with the workforce input above, the cost of labor was considered the most disadvantageous factor. Other factors received more neutral responses, including adequacy of transportation infrastructure; access to capital; and energy rates and costs. Research and development capacity was valued more highly by smaller firms than by the large ones, which likely have more in-house research capacity. INDUSTRY BARRIERS AND THREATS [Q S ] About half of the responding firms felt that food safety regulations represent a threat, while half did not. However, other state and federal regulations were seen as a bigger threat by a majority of the respondents, although the lack of regulatory coordination was not considered a problem by the Applied Development Economics P age 37
41 majority of respondents. The prospect of increased taxes was cited as the biggest threat among all the factors. Other factors, including local regulations, changes in consumer demand, lower-cost competitors, gaps in supply chains, and consolidation of national distribution networks, all received neutral overall responses. GOVERNMENT AND INDUSTRY COLLABORATION [Q S ] This portion of the survey included many open-ended questions, and the reader is encouraged to review the responses to Questions to see the variety of government programs referenced. Despite the neutral response to lack of regulatory coordination under Industry Threats above, 65 percent agreed that there would be value in creating a one-stop service to coordinate multiple regulatory agencies at the state level [Q.48]. Sixty-three percent of the respondents reported participating in industry-wide collaborative efforts [Q. 49]. Of those who do not, 16 percent cited a lack of time, and 14 percent a lack of awareness about these efforts. Fifty-nine percent agree that there is a need for better coordination among the various industry associations [Q. 50]. Again, the reader is encouraged to review the open-ended responses to this question to see the types of program initiatives that were suggested. The following sections focus on the survey responses by the separate industry subsectors. GRAINS AND BAKING (NAICS 3112 & 3118) INDUSTRY GROUP CHARACTERISTICS This group includes the following detailed food product categories: Flour and grain milling Oils and fats Breads, cookies, and tortillas Frozen pies and pastries This industry group is estimated to include 20 percent of Oregon food and beverage establishments (252 firms) and 17 percent of total industry employment. Employment growth was 30 to 35 percent between 2004 and 2014, and is expected to grow 11 percent more by Combined output was $2.6 million in 2014, third largest of the Oregon food and beverage subsectors, and close behind the beverage industry. This sector represented 15 percent of the firms responding to the survey. Among this set of producers, 38 percent sell their products fresh, 24 percent frozen, 19 percent packaged, and 14 percent dried. About half offer organic products. Most respondents are processors themselves, with 20 percent also supplying others. Most respondents send product outside of Oregon, with only 8 percent limited to Oregon. Few serve international markets (1 percent). Over 90 percent are headquartered in Oregon. Sixty percent are small firms (under 50 employees), and about 75 percent operate out of single facilities. GROWTH OPPORTUNITIES Consistent with all trend data, 73 percent of the firms experience an upward growth trend over the past three years, and 100 percent expect growth over the next five years. For all of the firms, the future expansion will involve both expanding existing product lines and developing new ones. Respondents see expansion export opportunities in domestic and international markets, even though currently most are only operating in the U.S. The factors that will most affect growth opportunities for this industry are accessibility to more agricultural products, better distribution channels; and better transportation systems. Over half the firms also consider increased research and development as important to their expansion. Applied Development Economics P age 38
42 MARKETING Only a third of the firms participate in cooperative marketing efforts; and of those, two-thirds find the efforts to be satisfactory. Forty-seven percent believe the Oregon brand is strong domestically, but 53 percent of those in international markets do not believe the brand is strong there. More than 70 percent agree overall that a stronger brand would benefit their industry. Two-thirds said they benefit from tourism marketing for Oregon. WORKFORCE More than half of this industry group considers the labor cost as the number-one workforce issue, while shortage of technical skills and workers with adequate soft skills were cited by 33 and 27 percent each. Thirteen percent were concerned about the lack of senior management staff and the remaining 7 percent cited lack of entry level labor or the minimum wage. Respondents in this industry tracked very closely with all food industry respondents. INDUSTRY STRENGTHS, WEAKNESSES, AND THREATS The quality of agricultural commodities was cited as a major advantage by this industry group. The cost and availability of commodities are also seen as advantages overall by half of the respondents. Seventy-three percent of those who expressed an opinion about research and development capacity considered this as an industry advantage in Oregon. This group cited transportation infrastructure as the main disadvantage hampering their industry. The biggest threats identified by this industry group are increased taxes, food safety regulations, and changing consumer demand. Supply chain and distribution issues were low on the threat scale for this industry. INDUSTRY DEFINITIONS NAICS 3112: This industry group comprises establishments primarily engaged in milling of flour or meal from grains or vegetables, manufacturing of malt, wet milling of corn and other vegetables, crushing of oilseeds and tree nuts, and manufacturing breakfast cereals. This industry group also includes preparing flour mixes or doughs from flour milled in the same establishment; milling, cleaning, and polishing rice; refining and/or blending vegetable oils; manufacturing shortening and margarine; and blending purchased animal fats with vegetable fats. NAICS 3118: This industry group comprises establishments primarily engaged in (1) baking bread and other bakery products on the premises, not for immediate consumption, fresh or frozen; (2) manufacturing cookies, crackers, and dry pasta; and (3) manufacturing of tortillas. Also included here are manufacturers that produce frozen cakes, pies, donuts, and other pastries; and flour and mixed dough. FRUITS AND VEGETABLES (NAICS 3114) INDUSTRY GROUP CHARACTERISTICS Because the survey divided this industry group into two categories, the following analysis will reflect responses for the following when separated: Vegetable processors Fruit processors This industry group is estimated to include almost 9 percent of food and beverage industry establishments in Oregon, and 27.5 percent of total industry employment. However, this sector represented 27 percent of firms responding to the survey. The survey sample in this group by commodity included 93 percent in food processing (vegetables) and 85 in food processing (fruits and nuts). 36 percent of vegetable processors provided their product as fresh, 50 percent as frozen, 29 percent as dried, and 21 percent as canned. 46 percent of fruit processors provided their product as Applied Development Economics P age 39
43 fresh, 54 percent as frozen, 31 percent as dried, and 31 percent as canned. Seventy-one percent of vegetable processors offered organic products; 62 percent of fruit processors offered organic products. Vegetable processors serve a wide range of markets, with 64 percent in international markets, 64 percent in Western U.S., and 64 percent in Other U.S. Similarly, 69 percent of fruit processors serve international markets, 69 percent Other U.S., and 62 percent Western U.S. Seventy-nine percent of vegetable processors and 85 percent of fruit processors are based in Oregon. GROWTH OPPORTUNITIES Over the last three years, 71 percent of vegetable processors and 85 percent of fruit processors have experienced steady growth. Ninety-three percent of vegetable processors and 100 percent of fruit processors expect continued sales growth over the next five years. Fifty-seven percent of vegetable processors and 77 percent of fruit processors expect to expand their existing product lines, with 54 percent of vegetable processors and 73 percent of fruit processors expecting to expand in both domestic and export markets. The factors that will most affect growth opportunities are access to a greater supply of agricultural commodities, better distribution channels, and better transportation systems. Thirty-six percent of vegetable processors and 62 percent of fruit processors see increased research and development as important to their expansion, and 43 percent of vegetable processors and 62 percent of fruit processors expect international competition to affect their ability to expand. MARKETING Thirty-six percent of vegetable processors and 38 percent of fruit processors participate in some form of cooperative marketing within their industry, with 80 percent finding the efforts to be satisfactory. Seventy-one percent of vegetable processors and 69 percent of fruit processors believe the Oregon brand is strong nationally, and more than two-thirds believe the Oregon brand is also strong internationally. Nearly 70 percent believe that they would benefit from an even stronger Oregon brand. Only 30 percent derive benefit from tourism marketing. WORKFORCE Seventy-nine percent of vegetable processors and 62 percent of fruit processors regard labor cost as the leading workforce issue, followed by shortage of qualified technical workers (57 percent vegetable, 46 percent fruit), and availability of workers with soft skills (36 percent vegetable, 31 percent fruit). Twenty-three percent of fruit processors also mentioned a shortage of qualified senior staff. INDUSTRY STRENGTHS, WEAKNESSES, AND THREATS The quality and availability of agricultural commodities were both cited as major advantages. The cost of commodities is generally seen as an advantage by 50 percent of vegetable processors and 38 percent of fruit processors; however, it is considered a disadvantage by 21 percent of vegetable processors and 38 percent of fruit processors. Reviews were mixed for research and development, with 57 percent of vegetable processors considering it a disadvantage, and 38 percent of fruit processors considering it an advantage. Factors regarded as disadvantages in this industry included t labor cost and transportation infrastructure. Interestingly, access to capital was considered an advantage by 29 percent of vegetable processors and 46 percent of fruit processors, with only 14 percent of vegetable processors and 15 percent of fruit processors considering it a disadvantage. Opinion was split on whether energy costs and rates were an advantage or disadvantage. The biggest threats identified by this industry group are increased taxes, food safety regulations, and federal and state regulations. Sixty-four percent of vegetable processors and 68 percent of fruit processors believe that food safety regulations are a major threat. Lack of regulatory coordination and changes in consumer demand are not perceived to be major threats. However, 47 percent of vegetable processors and 69 percent of fruit processors believe that lower cost competitors are a major threat. Applied Development Economics P age 40
44 DAIRY PRODUCTS (NAICS 3115) INDUSTRY GROUP CHARACTERISTICS This industry group is estimated to include almost 3 percent of food and beverage industry establishments and 7.2 percent of total industry employment. However, this sector represented 8 percent of firms responding to the survey. The survey sample in this group by commodity included 88 percent in food processing. Dairy processors provided 50 percent of their product as fresh, 38 percent frozen, and 50 percent packaged. Thirty-eight percent offered organic products. Dairy processors principally serve the Western U.S. (100 percent), and 75 percent serve domestic markets only. All dairy processors are based in Oregon. Seventy-five percent of dairy processors operate only one plant in Oregon, with 25 percent operating from 2 to 4 plants. Sixty-three percent of dairy processors employ 1 to 49 employees, and 25 percent have more than 50 employees. GROWTH OPPORTUNITIES Over the last three years, 88 percent of dairy processors have experienced steady growth. Onehundred percent of dairy processors expect continued sales growth over the next five years. Eightyfive percent of dairy processors expect to expand their existing product lines, with 75 percent of dairy processors expecting to expand in domestic markets and 25 percent expecting to expand in both domestic and export markets. Seventy-five percent of dairy processors are also likely to develop new products. Dairy processors seem generally optimistic and did not, as a group, single out any one factor as a limit on growth. Among the factors they think might affect growth opportunities are access to a greater supply of agricultural commodities, increased research and development, better distribution channels, and better transportation systems. However, none of these factors were cited by more than 38 percent of survey respondents. MARKETING Sixty-three percent of dairy processors participate in some form of cooperative marketing within their industry, with 80 percent finding these efforts to be satisfactory. Feelings are mixed on the Oregon brand; fifty percent of dairy processors believe the Oregon brand is strong nationally, but 50 percent do not. The same holds true for the Oregon brand s strength internationally, with 50 percent feeling that it is strong, and 50 percent feeling it is not. Eighty-six percent believe that they would benefit from an even stronger Oregon brand. Only 38 percent believe they benefit from tourism marketing. WORKFORCE Dairy producers were evenly divided on the question of prime workforce issue, with 50 percent citing a shortage of qualified technical workers, and 50 percent saying the availability of workers with soft skills. Cost of labor followed with a 38 percent consensus. INDUSTRY STRENGTHS, WEAKNESSES, AND THREATS The quality and availability of agricultural commodities were both cited as major advantages. The cost of commodities is generally seen as an advantage by 38 percent of dairy processors; however, 25 percent consider commodity costs a disadvantage. Reviews were mixed for research and development, which 38 percent of dairy processors consider an advantage, but 38 percent consider a disadvantage. Other factors viewed as disadvantageous included the cost of labor, transportation infrastructure, and cost of capital. Opinion was evenly split on whether energy costs and rates were an advantage or disadvantage. The biggest threats identified by this industry group are increased taxes, federal and state regulations, and consolidation of national distribution networks. Only 38 percent of dairy processors believe that food safety regulations are a major threat. The lack of regulatory coordination, lower cost competitors, and changes in consumer demand are not perceived to be major threats. Applied Development Economics P age 41
45 MEAT PRODUCTS (NAICS 3116) INDUSTRY GROUP CHARACTERISTICS This industry group is estimated to include over 5 percent of food and beverage industry establishments and 4.6 percent of total industry employment. However, this sector represented only 3 percent of firms responding to the survey. This group of respondents included 67 percent in food processing and 33 percent identifying as grower/producers. Meat processors reported providing 33 percent of their product as fresh, 33 percent frozen, and 67 percent dried. Sixty-seven percent offer organic products. Meat processors principally serve the Western U.S. (100 percent), Other U.S. (67 percent), and 67 percent serve domestic markets only. All meat processors are based in Oregon. Thirty-three percent of meat processors operate only one plant in Oregon, with 67 percent operating from 2 to 4 plants. Thirty-three percent of meat processors employ 1 to 49 employees, and 67 percent have more than 50 employees. GROWTH OPPORTUNITIES Over the last three years, 100 percent of meat processors have experienced steady growth. Sixtyseven percent of meat processors expect continued sales growth over the next five years. One hundred percent of meat processors expect to expand their existing product lines, with 67 percent of meat processors expecting to expand in both domestic and export markets. One hundred percent of meat processors are also likely to develop new products. Meat processors seem generally optimistic and do not cite any one factor for limiting potential growth. The factors that could affect growth opportunities are access to a greater supply of agricultural commodities, increased R&D, better distribution channels, and better transportation systems. However, none of these factors were cited by more than 33% of survey respondents. MARKETING Sixty-seven percent of meat processors participate in some form of cooperative marketing within their industry, with 100 percent finding the efforts to be satisfactory. Sixty-seven percent of meat processors believe the Oregon brand is strong nationally, as well as internationally. One hundred percent believe that they would benefit from an even stronger Oregon brand. WORKFORCE Sixty-seven percent of meat processors see availability of workers with soft skills as the number one workforce issue, followed by cost of labor (38 percent), lack of technical skills (33 percent), and shortage of senior staff (33 percent). INDUSTRY STRENGTHS, WEAKNESSES, AND THREATS The quality and availability of agricultural commodities were both cited as major advantages. Reviews were mixed for research and development as 33 percent of meat processors saw it as an advantage, but 33 percent of meat processors considered it a disadvantage. Industry disadvantages included the cost of labor, transportation infrastructure, and access to capital. The biggest threats identified by this industry group are increased taxes, Federal and State Regulations, and Local Regulations. Only 33 percent of meat processors believe that food safety regulations are a major threat. The lack of regulatory coordination, lower cost competitors, and the changes in consumer demand are not perceived to be major threats. SEAFOOD (NAICS 3117) This industry group comprises establishments primarily engaged in one or more of the following: (1) canning seafood (including soup); (2) smoking, salting, and drying seafood; (3) eviscerating fresh fish by removing heads, fins, scales, bones, and entrails; (4) shucking and packing fresh shellfish; (5) processing marine fats and oils; and (6) freezing seafood. Establishments known as "floating factory Applied Development Economics P age 42
46 ships" that are engaged in the gathering and processing of seafood into canned seafood products are included in this industry. INDUSTRY GROUP CHARACTERISTICS This small industry comprises 1.8 percent of Oregon s food and beverage industry establishments and about 3 percent of total industry employment. Because of Oregon s coastal location, seafood processing is a natural. Industry output grew 155 percent over the last decade in Oregon, a subsector growth rate second only to the state s beverage industry. Three firms responded to the survey, or about 13 percent of the state s 23 seafood firms. This small sample size makes it difficult to confidently infer industry-wide opinions. Two of the three respondents have over 50 employees. Two are headquartered in Oregon. All three serve markets in the Western U.S., U.S., and/or international markets with a wide variety of seafood, including fresh, dried, frozen, canned, and packaged. Only one respondent has a single facility in the state; the other two have multiple plants. GROWTH OPPORTUNITIES Seafood joins the vast majority of food processing industries with an upward growth trend over the past three years, and expected growth over the next five years. Seafood employment has grown 20 percent between 2004 and One respondent expected stable sales in the past to extend to the future; while the other two respondents expect to expand existing product lines and develop new ones. The factors that most affect growth opportunities for this industry are transportation infrastructure and international competition. MARKETING The two firms participating in joint marketing efforts find them satisfactory. The seafood companies have strong international brand strength, but could be even stronger with an Oregon brand. Tourism promotion is unlikely to benefit the industry. WORKFORCE The industry would like improvements in workers technical and soft skills. Keeping cost down is also relevant. INDUSTRY STRENGTHS, WEAKNESSES AND THREATS The small sample size limits confidence in conclusions. However: Advantages appear to be product quality and the availability of the raw product. The major disadvantage appears to be the aforementioned transportation infrastructure. The main threat appears to be the threat of increased taxes. BEVERAGES 3121 INDUSTRY GROUP CHARACTERISTICS This group includes the following detailed food product categories: Beer Wine Other alcoholic beverages Water and ice Juice and cider The beverage group is estimated to include 30.5 percent of all food and beverage industry establishments and 14 percent of total industry employment. These characteristics indicate a capitalintensive industry. Employment growth was 91 percent between 2004 and 2014, with the strongest Applied Development Economics P age 43
47 growth in the entire food and beverage sector (651 percent). With $2.7 billion in output, the beverage subsector placed second only to fruit and vegetable processing. Much of the expansion has been international. Future growth is expected to be 11 percent by percent of firms responding to the survey are in this beverage sector (25). Significant differences between beverage types will be noted. Beverage products come in many forms, but packaged product dominates (76 percent), followed by 28 percent fresh. Thirty-two percent of these firms offer organic products. 56 percent of the firms serve only domestic markets, and 44 percent serve international markets. Eighty-four percent sell outside of Oregon. All but one of the respondent are headquartered in Oregon. Only two of the beer companies have more than 50 employees. GROWTH OPPORTUNITIES With but one exception, all of the firms in this group grew over the past three years and also expect growth over the next five years. For nearly all of the firms, the future expansion will involve expanding existing product lines and developing new ones. Forty percent expect to expand into international markets. The primary factor that will most affect growth opportunities for this industry is better distribution channels for product, although the beer and juice respondents also noted the importance of access to product and transportation systems. Consistent with the fruit and vegetable sector, the two juice firms also regard increased research and development as important to their expansion and expect that international market competition will affect their ability to expand. MARKETING Seventy percent of the firms participate in cooperative marketing efforts; of those, over half find the efforts to be satisfactory. Sixty percent believe their brand is strong domestically but only half believe it is strong internationally. All but one respondent agree that a stronger Oregon brand would benefit the industry. About 74 percent agree that tourism marketing for Oregon would benefit them. WORKFORCE Mirroring views of the food and beverage sector as a whole, 57 percent of the beverage subsector considers the cost of labor to be the number-one workforce issue, while shortage of technically skilled workers (48 percent) and workers with adequate soft skills (30 percent) are also citied. Thirteen percent mentioned concern about a lack of senior management staff. INDUSTRY STRENGTHS, WEAKNESSES AND THREATS Consistent with other industries, the quality and availability of agricultural commodities were both cited as major advantages by this industry group (83 percent and 74 percent respectively). The cost of commodities is also considered an advantage by 61 percent of respondents. Transportation infrastructure also seems advantageous for 43 percent. Juice and water respondents cited access to capital and energy as advantages. The biggest threat identified by this industry group is increased taxes. No other strong threats emerged except among four beer firms that ranked supply chain gaps highly. Lack of regulatory coordination was not identified as an important threat. INDUSTRY DEFINITION This industry group comprises establishments primarily engaged in: manufacturing of soft drinks and ice, and purifying and bottling water; manufacturing brewery products; winery products; and distillery products. Also included is (1) artificially carbonated water; (2) the brewing of beer, ale, malt liquors, and nonalcoholic beer; (3) growing grapes, and the manufacturing of wine and brandy, or making of wine or brandy from purchased materials, and the blending of wines and brandies; and (4) the distilling of potable liquors (except brandies) and the blending of liquors and other ingredients. Applied Development Economics P age 44
48 MISCELLANEOUS FOODS (NAICS 3119) INDUSTRY GROUP CHARACTERISTICS This group includes the following detailed food product categories: Roasted nuts and peanut butter Other snack food Coffee and tea manufacturing Flavoring syrups and concentrates Mayonnaise, salad dressings, and sauces Spices and extracts Perishable prepared foods All other miscellaneous This industry group is estimated to include 10 percent of Oregon s food and beverage industry establishments and 12 percent of total industry employment. However, this sector represented 40 percent of firms responding to the survey. The survey sample in this group included more than half food processors, and about ten percent each of suppliers, ingredients manufacturers, growers, and distributors. Thirty-five percent of their products are packaged, 20 percent each are fresh or frozen, 14 percent are dried, and 11 percent are canned. More than 70 percent offer organic products. About half of the firms serve only domestic markets, but two-thirds of those operate outside of Oregon. More than 80 percent are headquartered in Oregon. GROWTH OPPORTUNITIES Consistent with the trend data for the entire food and beverage group, 80 percent of the firms in this subsector experienced an upward growth trend over the past three years, and 100 percent expect growth over the next five years. For nearly all of the firms, the future expansion will involve both expanding existing product lines and developing new ones. Interestingly, several of the firms see expansion opportunities in export markets, even though they are currently only operating in the U.S. The factors that will most affect growth opportunities for this industry are access to more agricultural products, better distribution channels, and better transportation systems. About half the firms regard increased research and development as important to their expansion, and about half also expect that international market competition will affect their ability to expand. MARKETING Forty percent of the firms participate in cooperative marketing efforts, and of those, two-thirds find the efforts to be satisfactory. Sixty percent believe the Oregon brand is strong domestically, but nearly 80 percent of those in international markets do not believe the brand is strong there. More than 80 percent overall agree that a stronger brand would benefit the industry. About 40 percent benefit from tourism marketing for Oregon. WORKFORCE In terms of workforce issues, 31 percent of this industry group sees the cost of labor as the numberone workforce issue, while shortage of technical skills and workers with adequate soft skills are citied by 26 percent each. 12 percent were concerned about the lack of senior management staff and the remaining 4 percent cited lack of entry level labor or the minimum wage. INDUSTRY STRENGTHS, WEAKNESSES AND THREATS The quality and availability of agricultural commodities were both cited as major advantages by this industry group. The cost of commodities is also seen as an advantage overall, but 38 percent of those Applied Development Economics P age 45
49 who responded to this question see it as a disadvantage. Seventy-three percent of those who expressed an opinion about research and development capacity saw it as an industry advantage in Oregon. Perceived industry disadvantages include the cost of labor and access to capital, although fewer than half of the firms expressed an opinion on capital availability and 40 percent of those saw it as an advantage. Opinion was split on whether transportation infrastructure or energy costs are benefits or liabilities for this industry. The biggest threats identified by this industry group are increased taxes, local regulations, and state and federal regulations other than those for food safety. About 40 percent of the respondents see food safety regulations as a threat, while 60 percent do not. The lack of regulatory coordination is not identified as an important threat. Also, changes in consumer demand do not constitute a threat. It appears the businesses are confident they can meet changing consumer interests. The responses are divided fairly evenly concerning perceived threat from low cost competitors, supply chain gaps, and national distribution channel consolidations. These finding are consistent with the factors that were identified to promote growth and expansion, which included improved distribution systems and better transportation. Applied Development Economics P age 46
 in partnership with the Northwest Food Processors Association, Oregon")
50 Oregon Food and Beverage Industry Survey (N=102) FEBRUARY 29-MARCH 7, 2016 Hello, this is (FIRST AND LAST NAME). As you may have heard, we are conducting a survey is sponsored by the Oregon Food and Beverage Leadership Council ( OFBLC ) in partnership with the Northwest Food Processors Association, Oregon Business Council, Oregon Business Association and Business Oregon, the state s economic development department. The purpose of the survey is to hear from industry leaders like yourself about how best to accelerate growth in Oregon s food and beverage manufacturing industry. Your input is critical to ensure that an industry roadmap analysis targets the right growth opportunities and issues over the next 5-10 years. IF NA/REFUSED: Your feedback is very important is there another time we could schedule this week to give you a call back to complete the survey? Or, you also have the option to complete the survey online we can just you a link to the survey online. Is that something you d be able to do? IF YES RECORD ADDRESS, NAME AND COMPANY; SEND LINK VIA Company Overview 1. First, which of the following best describes your company? (READ 1-9, ACCEPT MULTIPLE RESPONSES) Food processor 48% Beverage manufacturer 20% Ingredients manufacturer 10% Supplier to food & beverage companies 8% Distributor 8% Grower 8% Fresh food packer 4% Testing and measurement service 1% Other? (Specify) Food manufacturer 3% Retailer/restaurant 2% Service provider to food and beverage companies 1% Recruiter 1% Pallet manufacturer 1% Education 1% Dietary supplement manufacturer 1% Contract packaging 1% Chocolate manufacturer 1% Trade association 1% Label manufacturer 1% Supplier of 190 and 200-proof alcohol 1% Applied Development Economics P age 47
Kansas. Estimated Economic Impact of Agriculture, Food, and Food Processing Sectors 08/01/2017
 Estimated Economic of Agriculture, Food, and Food Processing Sectors 08/01/2017 Using the most recent IMPLAN data available (2015) adjusted for 2017, 65 agriculture, food, and food processing sectors were
Estimated Economic Impact of Agriculture, Food, and Food Processing Sectors 9/8/2016
 Estimated Economic Impact of Agriculture, Food, and Food Processing Sectors 9/8/2016 This study was commissioned by the Agricultural Business Council of Kansas City and the American Royal and performed
Nebraska PROFIT OPPORTUNITIES FOR FOOD MANUFACTURING
 Nebraska PROFIT OPPORTUNITIES FOR FOOD MANUFACTURING Table of Contents EXECUTIVE SUMMARY...1 PART A THE FOOD MANUFACTURING INDUSTRY I. Industry Characteristics and Trends... 3 II. Industry Structure...
PRODUCT CENTER For Agriculture and Natural Resources Room 80 Agriculture Hall, Michigan State University, East Lansing, MI (517)
") THE STRATEGIC MARKETING INSTITUTE WORKING PAPER The Economic Impact and Potential of Michigan s Agri-Food System H. Christopher Peterson William A. Knudson Getachew Abate 1-1606 January 2006 PRODUCT CENTER
THE STRATEGIC MARKETING INSTITUTE WORKING PAPER The Economic Impact and Potential of Michigan s Agri-Food System H. Christopher Peterson William A. Knudson Getachew Abate 1-1606 January 2006 PRODUCT CENTER
Town of Alabama Agricultural and Farmland Protection Plan
 SECTION I INTRODUCTION The Town of Alabama has a rich agricultural heritage, and farming is the Town s primary economic activity. The Town s Comprehensive Plan, prepared jointly with the Town and Village
Food Price Outlook,
 Provided By: Food Price Outlook, 2017-18 This page provides the following information for August 2017: Consumer Price Index (CPI) for Food (not seasonally adjusted) Producer Price Index (PPI) for Food
Abstract of the Madison Region s Agriculture, Food and Beverage Industry Cluster
 Abstract of the Madison Region s Agriculture, Food and Beverage Industry Cluster October 2014 i-1 Introduction This page is intentionally blank Abstract of the Madison Region s Agriculture, Food and Beverage
Regional Competitive Industry Analysis
 Regional Competitive Industry Analysis Marion, Polk, and Yamhill Counties June 2017 Yamhill Polk Marion Michael Meyers, Economist (503) 229-6179 michael.meyers@oregon.gov Jill Cuyler, Research Analyst
Regional Competitive Industry Analysis
 Regional Competitive Industry Analysis Clackamas, Multnomah, and Washington Counties July 2017 Washington Multnomah Clackamas Michael Meyers, Economist (503) 229-6179 michael.meyers@oregon.gov Jill Cuyler,
Agriculture and Food Processing in Washington State Economic Impacts and Importance of Water
 Agriculture and Food Processing in Washington State Economic Impacts and Importance of Water 2015 PNWER Conference July 14, 2015 Spencer Cohen Senior Economist spencer@communityattributes.com Contents
MANUFACTURING IN IOWA
 MANUFACTURING IN IOWA NOVEMBER 2011 INSIDE: SECTOR SIZE 2 KEY INDUSTRIES EARNINGS 4 EXPORTS 5 JOB TRENDS 6 GDP TRENDS 7 COUNTY DEPENDENCE 3 8 OVERVIEW Iowa s competitive strengths in manufacturing emerged
Economic Contributions of Agriculture, Natural Resources and Food Industries in Florida in 2014
 Economic Contributions of Agriculture, Natural Resources and Food Industries in Florida in 2014 Alan Hodges and Mohammad Rahmani, UF/IFAS Report available at http://www.edis.ifas.ufl.edu August 2016 Contents
Economic Composition of the South Central Region of Minnesota: Industries and Performance
 Economic Composition of the South Central Region of Minnesota: Industries and Performance Brigid Tuck (With Assistance from Adeel Ahmed, Neil Linscheid, Bruce Schwartau, and Elizabeth Templin) December
The Food Manufacturing Industry in the Midwest
 The Food Manufacturing Industry in the Midwest Mike Singer and Chris Barfels Federal Reserve Bank of Chicago March 8, 1996... This paper is one of a series associated with the March 8, 1996, workshop "The
Capitol Region Industry Clusters of Opportunity
 This report was prepared by the Labor Market Information Division (LMID) of the California Development Department to provide the Golden Sierra, North Central Counties Consortium, Sacramento and Training
Measuring the Effect of Louisiana Agriculture on the State Economy Through Multiplier and Impact Analysis
 October 1995 Number 849 Measuring the Effect of Louisiana Agriculture on the State Economy Through Multiplier and Impact Analysis By David W. Hughes 1 Table of Contents Introduction... 3 Input-Output Model
Regional Competitive Industry Analysis
 Regional Competitive Industry Analysis Baker, Union, and Wallowa Counties October 2017 Union Wallowa Baker Michael Meyers, Economist (503) 229-6179 michael.meyers@oregon.gov Jill Cuyler, Research Analyst
Adding Imports to Producer Price Measures for Food By Alberto Jerardo
 Adding Imports to Producer Price Measures for Food By Alberto Jerardo Paper presented at the International Agricultural Trade Research Consortium Analytic Symposium Confronting Food Price Inflation: Implications
NYS Department of Agriculture and Markets Division of Food Safety and Inspection Field Operations Manual
 NYS Department of Agriculture and Markets Division of Food Safety and Inspection Field Operations Manual OVERVIEW A separate Report of Sampling and Analysis (FL-1) must be completed for each commodity
Economic Composition of the South Central Region of Minnesota: Industries and Performance
 EXTENSION CENTER FOR COMMUNITY VITALITY Economic Composition of the South Central Region of Minnesota: Industries and Performance Authored by Brigid Tuck with assistance from Adeel Ahmed, Neil Linscheid,
Economic Contributions of Alabama Agriculture and Forestry
 Economic Contributions of Alabama Agriculture and Forestry Prepared for: Prepared by: September 2016 Alabamaagimpact.com Contents List of Figures... 3 List of Tables... 3 Executive Summary... 5 Key Findings...
Market Overview Vietnam
 MARKET ACCESS SECRETARIAT Global Analysis Report Market Overview Vietnam August 2016 MARKET SNAPSHOT Vietnam had a gross domestic product (GDP) of US$193.4 billion in 2015, which is expected to grow by
Economic Composition of the Mid-Minnesota Region of Minnesota: Industries and Performance
 Economic Composition of the Mid-Minnesota Region of Minnesota: Industries and Performance Brigid Tuck (With Assistance from Adeel Ahmed, and Neil Linscheid) January 2015-1- About The EDA Center The EDA
Food Industry of the Republic of Kazakhstan
 JSC Rating Agency of the Regional Financial Center of Almaty 136 Dostyk ave., 9 th floor, office 904, 050051 Almaty, The Republic of Kazakhstan Food Industry of the Republic of Kazakhstan Analytical service
Economic Composition of Northwest Minnesota: Industries and Performance
 EXTENSION CENTER FOR COMMUNITY VITALITY Economic Composition of Northwest Minnesota: Industries and Performance Authored by Brigid Tuck and Owusua Yamoah with assistance of Rani Bhattacharyya Economic
Economic Contributions of Agriculture, Natural Resources, and Food Industries in Florida in 2015
 Economic Contributions of Agriculture, Natural Resources, Food Industries in Florida in 2015 Alan W. Hodges, PhD, Mohammad Rahmani, PhD, Christa D. Court, PhD University of Florida-IFAS, Food & Resource
Economic Composition of the West Central Region of Minnesota: Industries and Performance
 EXTENSION CENTER FOR COMMUNITY VITALITY Economic Composition of the West Central Region of Minnesota: Industries and Performance Authored by Brigid Tuck with assistance from Ryan Pesch Presented in partnership
Minnesota Agricultural Exports
 Minnesota Agricultural Exports Minnesota ranked No. 4 in agricultural exports among all states 2018 Update 10 pages Prepared by Su Ye, Chief Economist Minnesota Department of Agriculture, Agricultural
The Economic Contributions of Agriculture in New York State (2014)
") August 2016 EB 2016-09 The Economic Contributions of Agriculture in New York State (2014) Todd M. Schmit Dyson School of Applied Economics and Management College of Agriculture and Life Sciences Cornell
August 2016 EB 2016-09 The Economic Contributions of Agriculture in New York State (2014) Todd M. Schmit Dyson School of Applied Economics and Management College of Agriculture and Life Sciences Cornell
Session 2. Competitiveness in the marketing and retail sectors
 :RUNVKRSRQ(QKDQFLQJ&RPSHWLWLYHQHVVLQWKH$JURIRRG6HFWRU0DNLQJ3ROLFLHV:RUN -XQH9LOQLXV/LWKXDQLD Session 2. Competitiveness in the marketing and retail sectors *52&(5
AMBER WAVES VOLUME 6 ISSUE 1
 VOLUME 6 ISSUE 1 10 Jupiterimages Corporation (gas pump and corn field); PhotoDisc (grocery bags) ECONOMIC RESEARCH SERVICE/USDA Corn Prices Near Record High, But What About Food Costs? FEBRUARY 2008 Ephraim
SOME ASPECTS OF AGRICULTURAL POLICY IN AUSTRALIA
 SOME ASPECTS OF AGRICULTURAL POLICY IN AUSTRALIA R. A. Sherwin, Agricultural Attache Australian Embassy, Washington, D. C. Before discussing government programs relating to agriculture in Australia I propose
Economic Opportunities and Job Creation AGRO-FOOD Sector
 Economic Opportunities and Job Creation AGRO-FOOD Sector DRAFT FOR DISCUSSION Prepared by Dr. Ghinwa Chlouk In collaboration with the UNIDO and the UN FAO November 2016 Contents 1. Sector overview... 2
Economic Contribution of Maine s Food Industry
 Maine Policy Review Volume 20 Issue 1 Maine's Food System 2011 Economic Contribution of Maine s Food Industry Todd M. Gabe University of Maine, TODD.GABE@UMIT.MAINE.EDU James C. McConnon Jr. University
Agriculture in China - Successes, Challenges, and Prospects. Prof. Zhihao Zheng College of Economics & Management China Agricultural University
 Agriculture in China - Successes, Challenges, and Prospects Prof. Zhihao Zheng College of Economics & Management China Agricultural University I. Success 1. For the past three decades (1978-2010), China
2013 Annual Quantification Report Media Feedback Report - Energy Drinks in South Africa
 2013 Annual Quantification Report Media Feedback Report - Energy Drinks in South Africa April 2013 Product Definitions Product Energy Drinks Definition Energy drinks contain a high level of caffeine and
GREENMARKET GROWNYC 100 GOLD STREET, SUITE 3300, NY, NY FAX
 GREENMARKET GROWNYC 100 GOLD STREET, SUITE 3300, NY, NY 10038 INFO@GREENMARKET.GROWNYC.ORG FAX 212-788-7913 Thank you for your interest in Greenmarket. Our mission is to promote regional agriculture and
ECONOMIC FUTURES SUMMARY Marshall County Minnesota
 ECONOMIC FUTURES SUMMARY Marshall County Minnesota The Marshall County Economic Development Authority requested University of Minnesota Extension prepare a summary of their economy under the Economic Futures
Opportunities and Challenges for Dutch Processed Food Companies in India
 Opportunities and Challenges for Dutch Processed Food Companies in India Zeist, 12 May 2015 Management Consulting Firm Strategy Operations Research Quick Introduction Founder & Chief Executive, Third Eyesight
3.2 billion USD ALLOCATED FOR AGROINDUSTRY DEVELOPMENT IN 2017
 RUSSIAN FOOD PROCESSING INDUSTRY RUSSIAN AGROINDUSTRY EMBARKS ON DEVELOPMENT GROWING INTEREST IN HIGH-TECH EQUIPMENT 3.2 billion USD ALLOCATED FOR AGROINDUSTRY DEVELOPMENT IN 2017 Government s focus Upgrade
Local Foods: Potential to Build Wealth & Health in Alabama STUDY HIGHLIGHTS. Introduction by Kathryn Strickland, Food Bank of North Alabama
 Local Foods: Potential to Build Wealth & Health in Alabama Introduction by Kathryn Strickland, Food Bank of North Alabama Every year Alabamians spend billions of dollars on food. We all know that what
Economic Impact of Florida's Fruit and Vegetable Industries 1
 Economic Impact of Florida's Fruit and Vegetable Industries 1 Alan Hodges, David Mulkey, and Effie Philippakos 2 Introduction Florida agriculture is perhaps best known for its fruit and vegetable products.
Processing, What We Already Do Here and Where Michigan Production Sells
 Accelerating innovation for our industries, businesses and entrepreneurs Processing, What We Already Do Here and Where Michigan Production Sells Bill Knudson and Tom Kalchik Overview Impact on Output and
There is much debate on the size and importance of
 Cooperative Extension Service Economic Issues Feb. 2 EI-2 Agriculture s Contribution to Hawaii s Economy PingSun Leung 1, Khem R. Sharma 1, and Stuart T. Nakamoto 2 There is much debate on the size and
Rod Arenas Food Innovation Australia Ltd
 Rod Arenas Food Innovation Australia Ltd FOOD INNOVATION AUSTRALIA LTD About us National initiative set up by the Australian government through department of industry innovation and science Not-for-profit
Wholesale Distribution Economic Trends: Headwinds Slow Revenue Growth. in partnership with:
 2016 Wholesale Distribution Economic Trends: Headwinds Slow Revenue Growth from: in partnership with: Total revenues of wholesale distributors in 2015 fell by 4.3 percent to $5.3 trillion, reflecting a
Agri-value Sector Strategy
 Agri-value Sector Strategy 2017-2020 Table of Contents EDR s Agri-value Vision...2 Introduction....3 Regina Region s Key Sectors Identification Overview....3 EDR S 2020 Strategy....4 The Agri-value Sector
Value of Food & Drink Industry to Northern Ireland
 Value of Food & Drink Industry to Northern Ireland October 2010 An economic analysis prepared by Goldblatt McGuigan for Northern Ireland Food & Drink Association An estimated 20% of all Northern Ireland
Economic Impacts. Refineries in Skagit County
 Economic Impacts of the Refineries in Skagit County February 13, 2015 Center for Economic and Business Research Prepared for the Economic Development Association of Skagit County Table of Contents Executive
Farmland Bubbles and Risks to the Rural Economy
 Farmland Bubbles and Risks to the Rural Economy Federal Reserve Bank of Chicago Agriculture Conference: Farm Income s Impact on the Midwest Chicago, IL November 17, 2014 Presented by: Mark Partridge Partridge.27@osu.edu
Estonia FooD and FooD safety
 Estonia FOOD AND FOOD SAFETY Cuisine is an important part of national culture. Every country has its own distinct cuisine, national dishes and food items. Throughout history, traditional Estonian food
Eastern Africa s Largest Food, Beverage and Milling Industry Conference & Exhibition
 2017 BROCHURE APRIL 25-27, 2018 NAIROBI CONVENTION & CONFERENCE CENTRE OPPOSITE HILTON GARDEN INN NEAR JOMO KENYATTA INT. AIRPORT MOMBASA ROAD, NAIROBI, KENYA Eastern Africa s Largest Food, Beverage and
Cultivating Trade: The Economic Impact of Indiana s Agricultural Exports
 Cultivating Trade: The Economic Impact of Indiana s Agricultural Exports April 2012 Research conducted by Indiana Business Research Center, Kelley School of Business, Indiana University Cultivating Trade:
Required Report - public distribution Date: 2/24/2005 GAIN Report Number: KE5005
 GAIN Report Global Agriculture Information Network Template Version 2.08 Required Report - public distribution Date: 2/24/2005 GAIN Report Number: KE5005 KE5005 Kenya Food Processing Ingredients Sector
The Economic Impact of Privately-Owned Forests in the United States
 The Economic Impact of Privately-Owned Forests in the United States The Economic Impact of Privately-Owned Forests in the United States Prepared for: National Alliance of Forest Owners Contact: Gretchen
Jason Henderson Vice President and Branch Executive Federal Reserve Bank of Kansas City Omaha Branch April 25, 2012
 Jason Henderson Vice President and Branch Executive April 25, 2012 The views expressed are those of the author and do not necessarily reflect the opinions of the Federal Reserve Bank of Kansas City or
A European Food Prices Monitoring Tool
 EUROPEAN COMMISSION EUROSTAT Directorate G: Business Statistics Unit G-6: Price statistics Luxembourg, October 2009 A European Food Prices Monitoring Tool A first design A European Food Prices Monitoring
Driving Long- Term Trust and Loyalty Through Transparency. The 2016 Label Insight Transparency ROI Study
 Driving Long- Term Trust and Loyalty Through Transparency The 2016 Label Insight Transparency ROI Study Executive Summary The Label Insight Food Revolution Study, released in June of 2016, found that consumers
Hog:Corn Ratio What can we learn from the old school?
 October 16, 2006 Ames, Iowa Econ. Info. 1944 Hog:Corn Ratio What can we learn from the old school? Economists have studied the hog to corn ratio for over 100 years. This ratio is simply the live hog price
Botetourt County Agriculture Strategic Plan. November 24, 2015
 Botetourt County Agriculture Strategic Plan November 24, 2015 Botetourt Agricultural Planning Botetourt Farming Characteristics and Trends Focus Groups and Survey Strategic Priority Identification Questions
Prepared by: Agricultural Marketing Services Division Minnesota Department of Agriculture 90 West Plato Boulevard St.
 KANDIYOHI COUNTY LIVESTOCK INDUSTRY ECONOMIC IMPACTS Prepared by: Agricultural Marketing Services Division Minnesota Department of Agriculture 90 West Plato Boulevard St. Paul, MN 55107 www.mda.state.mn.us
ECONOMIC BULLETIN Q2 2017
 November 2017 ECONOMIC BULLETIN Q2 2017 Steady growth in production, sales and exports Food and drink industry Growth in production and sales In Q2 2017, EU food and drink industry production increased
CONTRIBUTION OF THE ETHANOL INDUSTRY TO THE ECONOMY OF THE UNITED STATES
 CONTRIBUTION OF THE ETHANOL INDUSTRY TO THE ECONOMY OF THE UNITED STATES Prepared for the Renewable Fuels Association by John M. Urbanchuk Managing Partner February 17, 2014 The environment facing the
China at a Glance. A Statistical Overview of China s Food and Agriculture. Fred Gale
 China at a Glance A Statistical Overview of China s Food and Agriculture Fred Gale The United States and China are at very different stages of development and have quite different resource endowments that
Price developments in the EU
 Price developments in the EU Content 1. Development of world agricultural prices over time... 3 2. Price gap between EU and world prices... 7 3. Price volatility... 8 This document does not necessarily
Table 1. U.S. Agricultural Exports as a Share of Production, 1992
 Export markets are important to U.S. agriculture, absorbing a substantial portion of total production of many important commodities. During the last two decades there have been periods of expansion and
A global meat industry outlook
 A global meat industry outlook Capturing business opportunities in a fast changing world Copenhagen Nan-Dirk Mulder, 18 February 2017 Rabobank international introduction and global network of branches
Agriculture: expansions highlighted developments
 Agriculture: expansions highlighted developments A broad-based expansion in livestock production and another bumper grain harvest highlighted agricultural developments in 1976. Meat production rose 9 percent
2015 AGRICULTURAL WORKFORCE. Agriculture economy Employment and earnings Agriculture labor market H-2A and prevailing wages Common practices
 2015 AGRICULTURAL WORKFORCE Agriculture economy Employment and earnings Agriculture labor market H-2A and prevailing wages Common practices Labor Market and Performance Analysis September 2016 2015 Agricultural
August 4, The Honorable Donald J. Trump President 1600 Pennsylvania Avenue, NW Washington, DC Dear Mr. President:
 August 4, 2017 The Honorable Donald J. Trump President 1600 Pennsylvania Avenue, NW Washington, DC 20500 Dear Mr. President: On behalf of the more than 200 organizations representing rural communities,
Economic Composition of North Central Minnesota: Industries and Performance
 EXTENSION CENTER FOR COMMUNITY VITALITY Economic Composition of North Central Minnesota: Industries and Performance Authored by Brigid Tuck with assistance from Merritt Bussiere Economic Composition of
HARVEST NEW YORK PROGRAM HIGHLIGHTS
 Harvest New York Cornell University Cooperative Extension HARVEST NEW YORK PROGRAM HIGHLIGHTS July 2012-December 2012 Growing New York s Agriculture and Food Economy www.harvestny.cce.cornell.edu Cornell
The Contributions of Agriculture to Idaho s Economy: 2006
 [In 26, Idaho] agriculture was responsible for generating $21 billion in total sales, 156,599 jobs, $4.2 billion in wages, and $8.4 billion in gross state product (GSP)... Based on this analysis, agriculture
ECONOMIC EMERGENCY PROGRAM Economic Impact of Lost Poultry Processing Jobs in Faribault, Minnesota
 ECONOMIC EMERGENCY PROGRAM Economic Impact of Lost Poultry Processing Jobs in Faribault, Minnesota In late winter 2015, avian influenza was discovered in a flock of commercial turkeys in Minnesota. After
Stronger Economies. Session 2: More Data Exploration & Strategy Identification. Revised Data Snapshot
 Stronger Economies Together Session 2: More Data Exploration & Strategy Identification Revised Data Snapshot 1 Income and poverty Questions: Total in Poverty Minors (Age 0-17) in Poverty Real Median Household
Railroads and Grain. Association of American Railroads June Summary
 s and Grain Association of American s June 2017 Summary s are critical to grain transportation. In 2016, U.S. Class I railroads originated 1.54 million carloads of grain (5.6 percent of total carloads)
FOOD MARKET IN POLAND (current state and trends)
") 2009 Creativity, Innovation and Management Proceedings of the 10th International Conference Sousse, Tunisia, 25 28 November FOOD MARKET IN POLAND (current state and trends) Prof. Szwacka-Mokrzycka Joanna
2009 Creativity, Innovation and Management Proceedings of the 10th International Conference Sousse, Tunisia, 25 28 November FOOD MARKET IN POLAND (current state and trends) Prof. Szwacka-Mokrzycka Joanna
Identifying Important Regional Industries: A Quantitative Approach
 Identifying Important Regional Industries: A Quantitative Approach Introduction The Need for a Quantitative Approach Every region must periodically assess its most important industries in order to ensure
Knowledge Exchange Report. Economic Impact of Mandatory Overtime on New York State Agriculture
 Farm Credit East Knowledge Exchange Report September, 2014 Economic Impact of Mandatory Overtime on New York State Agriculture The New York State Legislature and Governor Andrew Cuomo are considering legislation
Energy Trust of Oregon Strategic Plan
 Energy Trust of Oregon 2015-2019 Strategic Plan October 1, 2014 Introduction Who We Are Energy Trust of Oregon is an independent nonprofit organization dedicated to helping 1.5 million customers of four
MONTHLY OVERSEAS CONTAINER TRADE UPDATE: SEPTEMBER 2017
 MONTHLY CONTAINER TRADE REPORT - Overseas Containers MONTHLY OVERSEAS CONTAINER TRADE UPDATE: SEPTEMBER 217 Overseas container trade September 217 Full overseas container imports Full overseas container
POLICY FOR FOOD PROCESSING INDUSTRY
 POLICY FOR FOOD PROCESSING INDUSTRY BACKGROUND AND VISION Uttar Pradesh is one of the largest producers of farm commodities in the country and the largest producer of vegetables, wheat, maize, sugarcane,
USING IMPLAN TO ASSESS LOCAL ECONOMIC IMPACTS. David Mulkey and Alan W. Hodges. Introduction 1
 USING IMPLAN TO ASSESS LOCAL ECONOMIC IMPACTS David Mulkey and Alan W. Hodges Introduction 1 Policymakers, industry officials, and others often need information on the total economic impacts of specific
Facts About Texas and U.S. Agriculture
 Facts About Texas and U.S. Agriculture Caroline Gleaton Office Associate John Robinson Professor and Extension Economist-Cotton Marketing Texas A&M Agriife Extension Service Department of Agricultural
BENEFITS OF USING A CLIENT CHOICE SYSTEM OF DISTRIBUTION IN YOUR FOOD PANTRY
 BENEFITS OF USING A CLIENT CHOICE SYSTEM OF DISTRIBUTION IN YOUR FOOD PANTRY For your pantry: Less food waste, as clients do not throw away foods they don t like or can t use Your pantry can monitor what
Table 1 shows the general form of China 2010 I-O Table:
 China Liu Yu 1 and Jie Chen The original 2010 Input-Output Table doesn t have multi-product sector. After some adjustments, the data tables are reclassified and re-balanced to provide the matrices required
2016 Montana Manufacturers Survey
 216 Montana Manufacturers Survey March 217 Prepared by: Paul E. Polzin, Director Emeritus Bureau of Business and Economic Research University of Montana Missoula, Montana 59812 BUREAU OF BUSINESS AND ECONOMIC
China is the world s largest consumer market for food & beverages. (meatx4 in 30 years)
") World s largest food market China is the world s largest consumer market for food & beverages. (meatx4 in 30 years) Confidence in domestically produced food has declined (for 61%). 28% intend to buy imported
World s largest food market China is the world s largest consumer market for food & beverages. (meatx4 in 30 years) Confidence in domestically produced food has declined (for 61%). 28% intend to buy imported
OUR COMPANY, OUR ROLE: Understanding ADM and FOOD For more than 100 years,
 OUR COMPANY, OUR ROLE: Understanding ADM and FOOD For more than 100 years, Archer Daniels Midland Company has transformed farmers crops into vital food ingredients. Today, we are an international agribusiness
Scotland s National Food and Drink Policy is underpinned by five work streams:
 SECTORAL STRATEGY: FOOD AND DRINK Overview This strategy outlines HIE s ambitions, growth targets and key areas of focus for the Food and Drink sector in the Highlands and Islands of Scotland. Food and
agriculture, forestry & fisheries Department: Agriculture, Forestry and Fisheries REPUBLIC OF SOUTH AFRICA
 2014 agriculture, forestry & fisheries Department: Agriculture, Forestry and Fisheries REPUBLIC OF SOUTH AFRICA Economic Review of the South African Agriculture 2014 DEPARTMENT OF AGRICULTURE, FORESTRY
The Importance of the Petroleum Industry to the Economy of the Western States
 The Importance of the Petroleum Industry to the Economy of the Western States The Importance of the Petroleum Industry to the Economy of the Western States José Alberro, Ph.D. Director, LECG April 2007
Seventh Multi-year Expert Meeting on Commodities and Development April 2015 Geneva
 Seventh Multi-year Expert Meeting on Commodities and Development 15-16 April 2015 Geneva Recent Developments in Global Commodity Markets By Georges Rapsomanikis Senior Economist in the Trade and Markets
Economic Contributions of Agriculture, Natural Resources and Food Industries in Polk County, Florida
 Economic Contributions of Agriculture, Natural Resources and Food Industries in Polk County, Florida Sponsored Project Report to Polk County, Florida Farm Bureau Alan W. Hodges, Ph.D., Extension Scientist
Prepared by the office of the Minister Counsellor for Food and Agriculture, Embassy of Denmark in New Delhi, India
 SECTOR ANALYSIS India: Food, Agriculture and Agro Business Date January 2014 Our ref. AKA Prepared by the office of the Minister Counsellor for Food and Agriculture, Embassy of Denmark in New Delhi, India
City of Hamilton. The current and future state of Hamilton s advanced manufacturing sector
 City of Hamilton The current and future state of Hamilton s advanced manufacturing sector October 2013 Advanced manufacturing is best viewed as a cluster of economic activities encompassing much more than
STATISTICAL PROFILE OF COLCHESTER COUNTY. Prepared By: Nova Scotia Federation of Agriculture
 STATISTICAL PROFILE OF COLCHESTER COUNTY Prepared By: Nova Scotia Federation of Agriculture 1.0 Introduction Agriculture in the Local Economy Agriculture in County is characterized by a diversity of farm
Industrial Energy Efficiency as a Resource by Region
 Industrial Energy Efficiency as a Resource by Region Garrett Shields and Robert D. Naranjo, BCS Incorporated Sandy Glatt, U.S. Department of Energy ABSTRACT The energy intensity of specific manufacturing
Agribusiness Industry to Idaho s Economy
 BUL 836 The Contribution of the Agribusiness Industry to Idaho s Economy R. G. Taylor Department of Agricultural Economics University of Idaho 2 The Contribution of the Agribusiness Industry to Idaho s