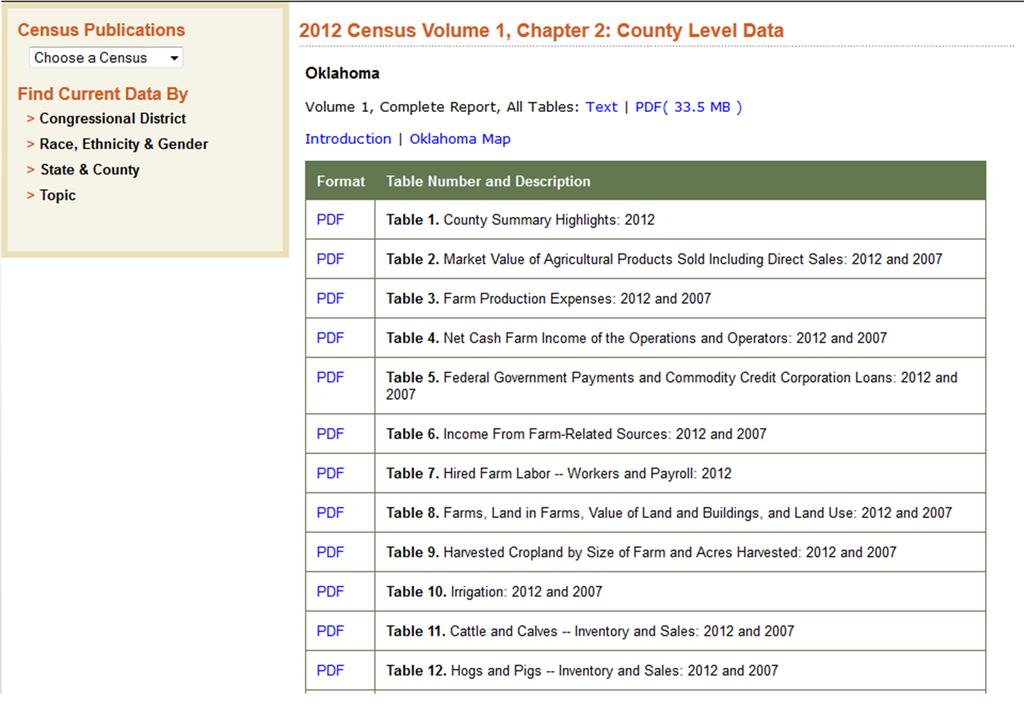
Introduction to 2012 Census of Agriculture Data for Oklahoma
|
|
|
- Janice Carson
- 5 years ago
- Views:
Transcription

1 Introduction to 2012 Census of Agriculture Data for Oklahoma Damona Doye Rainbolt Chair of Agricultural Finance Extension Economist and Regents Professor OSU Agricultural Economics Department
2 Number of Oklahoma Farmers Operators % change Principal 86,565 80, % Second 38,312 36, % Third 4,725 4, % All 129, , %
3 New OK Farmers (number of principal operators) % change On operation less than 10 years 25,686 19, % On operation less than 5 years 9,968 7, %
4 Distribution of Oklahoma Farms by County, 2012 N/A 366 to to to 1,247 1,248 to 1,541 1,542 to 1,835 1,836 to 2,121
5 Change in Number of Farms, 2007 to 2012 Extreme Increase (10% to 25%) Significant Increase (5% to 10%) Increase (0 to 5%) No change Decrease (0 to 5%) Significant Decrease ( 5% to 10%) Extreme Decrease ( 10% to 25%)
6 80,000 70,000 Oklahoma Farms by Legal Status, ,364 60,000 50,000 40,000 30,000 20,000 10,000 Family or Individual 3,605 1,931 1,345 Partnership Corporation Other
7 Average Age of Farm Operators (years) Operator % change Principal % Second % Third % All %
8 Average Age of Principal Operator in OK,
9 Average Age of Principal Farm Operator, 2012 Under and over
10 OK Farm Operator Age Distribution 21% 13% 1% 6% 11% 21% Under 25 years 25 to 34 years 35 to 44 years 45 to 54 years 55 to 64 years 65 to 74 years 75 years and over 25%
11 Oklahoma Farm Operator Distribution by Primary Occupation 0%2% 3% 14% 6% Farmer under 25 16% 15% 8% 0% 4% 10% 21% Farmer 25 to 34 Farmer 35 to 44 Farmer 45 to 54 Farmer 55 to 64 Farmer 65 and over Other under 25 Other 25 to 34 Other 35 to 44 Other 45 to 54 Other 55 to 64 Other 65 and over
12 Gender, Primary Occupation, and Years on Farm, 2012 Farm Operators Gender Primary Occupation Years on Farm (number) Male Female Farm Other < Principal 71,169 9,076 33,790 46,455 15,854 64,391 Second 8,190 27,916 11,229 24,877 10,095 26,011 Third 2,416 1,681 1,372 2,725 1,910 2,187 All 81,775 38,673 46,391 74,057 27,859 92,589 (percent) Principal 88.7% 11.3% 42.1% 57.9% 19.8% 80.2% Second 22.7% 77.3% 31.1% 68.9% 28.0% 72.0% Third 59.0% 41.0% 33.5% 66.5% 46.6% 53.4% All 67.9% 32.1% 38.5% 61.5% 23.1% 76.9% Years on farm are from "years operating any farm" Gender numbers do not include spouses
13 Farms with Principal Operators whose Primary Occupation is Not Farming, by County, 2012 NA 40 to 49% 50 to 54% 55 to 59% 60 to 64% 65 to 69%
14 Principal Operators by Age and Primary Occupation 65 and over 11,467 11,635 16,780 17, to 64 8,099 8,872 12,570 13, to 54 4,771 5,729 12,124 14, to 44 2,438 2,671 6,571 7, to 34 1,532 1,509 3,457 3,463 Under ,000 4,000 6,000 8,000 10,000 12,000 14,000 16,000 18, Other Occupation 2012 Farming 2007 Other Occupation 2007 Farming
15 Female and Male Farmers Female Operators % change Principal 10,849 9, % All 42,062 38, % Male Operators Principal 75,716 71, % All 87,540 81, %
16 Farms with Female Principal Operator, by County, 2012 NA <5% 5 9% 10 14% 15 19% 20 25%
17 Race of Principal Operators in Oklahoma More than 1 race 2,083 1,814 White Pacific Islander Black Asian American Indian or Alaska Native ,111 1, ,054 7,489 Number of Farms 76,058 69,
18 Minority Principal Operators, 2007 and 2012 Asian Black American Indian 1,111 1,337 7,054 7, Hispanic 784 1,173 number of principal operators
19 Value of Oklahoma Crop and Livestock Sales, ,000,000 5,000,000 4,000,000 $1,000 3,000,000 2,000,000 1,000,000 Crop Livesotck
20 100% Oklahoma Farms by Economic Class 90% 80% 70% 60% 50% 40% 30% $1 million or more $250,000 $999,999 $50,000 $249,000 Less than $50,000 20% 10% 0%
21 Distribution of Farms by Value of Sales
22 Sales Class Share of Farms and Farm Sales, by Sales Class, 2012 $1,000,000 or more $500,000 to $999,999 $250,000 to $499,999 $100,000 to $249,999 $50,000 to $99,999 $25,000 to $49,999 $10,000 to $24,999 $5,000 to $9,999 $2,500 to $4,999 $1,000 to $2,499 Less than $1,000 1% 1% 12% 2% 10% 5% 9% 5% 6% 4% 9% 3% 15% 1% 12% 0% 10% 0% 9% 0% Farms Sales 29% 55%
23 Top 10 Counties in Agricultural Sales Sales ($1,000) % of OK Total Texas 1,013, % Cimarron 376, % LeFlore 287, % Delaware 254, % Beaver 186, % Alfalfa 168, % Adair 164, % McCurtain 163, % Kingfisher 161, % Garfield 151, %
24 Ag Sales by County, ,000 to 25,000 26,000 to 50,000 51,000 to 75,000 76,000 to 100, ,000 to 125, ,000 to 150, ,000 and up
25 Top Livestock Commodities by Sales Value, 2007 and 2012 ($1,000) Milk from cows Hogs and pigs Poultry and eggs Cattle and calves $191,775 $164,341 $555,521 $656,407 $748,776 $961, $3,062,020 $3,402,919
26 Top Crop Commodities by Sales Value, 2007 and 2012 ($1,000) Cotton and cottonseed $68,169 $51,851 Nursery, greenhouse, floriculture, and sod Other crops and hay $204,020 $208,109 $173,699 $270, Grains, oiilseeds, dry beans, and dry peas $698,093 $1,283,997
27 Crop Sales as a Percent of Ag Sales, by County 0 10% 11 20% 21 30% 31 40% 41 55% 56 70% 71% and up
28 Value of Grains and Oilseeds as Percent of Total Value Sold, 2012 NA Less than 10% 10 19% 20 34% 35 49% 50 69% 70% or more
29 30000 Distribution of Oklahoma Farms by Acres Operated to 9 acres 10 to 49 acres 50 to 179 acres 180 to 499 acres 500 to 999 acres 1,000 to 1,999 acres 2,000 acres or more
30 Percent of Farms Share of Oklahoma Farms by Acreage Classification to 9 10 to to to to to to 219 Acreage Category 220 to to to 999 1,000 to 1,999 2,000+
31 Distribution of Oklahoma Farms by Acreage and Production Specialty 16,000 14,000 12,000 10,000 8,000 6,000 4,000 2,000 Crop Horticulture Beef Other livestock
32 Oklahoma Farm Income and Expenses ($1,000) % change Agricultural sales 5,806,061 7,129, Government payments 209, , Farm related income 236, , Production expenses 5,223,365 6,682, Net cash farm income 1,028, ,
33 Income and Expenses, OK per farm average ($) % change Agricultural Sales 67,072 88, Govt. payments 7,754 8, Farm related income 13,705 11, Production expenses 60,340 83, Net cash farm income 11,885 11,
34 Agricultural Production Expenses ($1,000) % change Total 5,223,365 6,682, Feed 1,307,568 2,017, Livestock and poultry purchases 1,463,556 1,696, Fertilizer 286, , Hired labor 255, , Cash rent 167, , Seeds 78, , Supplies and repairs 350, , Gas, fuel, and oils 316, , Chemicals 90, , Other 258, ,
35 Principal Operators by Age Group, 2007 and years and over 10,698 10, to 74 years 17,988 17, to 64 years 22,333 20, to 54 years 35 to 44 years 10,173 9,009 19,759 16, to 34 years Under 25 years ,972 4,989 number of principal operators
36 Share of Farms by Sales Class for Race of Principal Operator, 2012 Annual All American Native More than sales Farms Indian Black Asian Hawaiian White one race Less than $1, % 25.4% 31.1% 20.4% 40.6% 22.2% 21.3% $1,000 to $2, % 11.2% 10.4% 6.7% 6.3% 9.9% 11.2% $2,500 to $4, % 12.7% 16.5% 14.0% 12.5% 11.2% 11.7% $5,000 to $9, % 14.5% 15.3% 10.2% 6.3% 12.9% 13.0% $10,000 to $24, % 17.9% 16.2% 4.2% 6.3% 16.1% 17.9% $25,000 to $49, % 8.4% 5.2% 5.6% 3.1% 9.2% 9.6% $50,000 or more 17.4% 9.9% 5.3% 38.9% 25.0% 18.4% 15.4% Total 100.0% 100.0% 100.0% 100.0% 100.0% 100.0% 100.0%
37 Internet Access, by Principal Operator, 2007 and 2012 Asian 35% 65% Black 38% 59% American Indian 57% 68% 2007 Hispanic 45% 61% 2012 Female 47% 64% All 0 53% 67% percent of group
38 Type of Internet of Access on Farms, 2012 Other Broadband Over Power Lines Fiber Optic Service 3.4% 2.4% 3.1% Dial Up Service Cable Modem Plan 10.1% 11.1% Mobile Broadband Plan 20.3% Satellite Service 25.5% DSL Service 35.8%
39 Selected Characteristics of Principal Operators 2012 % of Principal (Number) Operators % change since 2007 Agricultural sales under $50,000 67, % 10.5% Agricultural sales under $10,000 47, % 12.8% Lived on their farms 61, % 6.1% Less than 25% of household income from farming 61, % 7.5% Had internet access 53, % 16.7% Worked some days off the farm 52, % 7.8% Had a primary occupation other than farming 46, % 8.0% Had a positive net cash income for the operation 30, % 9.7%
40 Farmland as a Percent of Land Area, 2012 NA 20 49% 50 59% 60 69% 70 79% 80 89% 90% or more
41 Acres of Irrigated Land as Percent of Land in Farms, 2012 NA 0 0.5% % 1.5 3% 3% or more
42 Change in Land in Farms, 2007 to 2012 Larger Increase (10% to 25%) Significant Increase (5% to 10%) Increase (0 to 5%) No change Decrease (0 to 5%) Significant Decrease ( 5% to 10%) Larger Decrease ( 10% to 25%)
43 $74,212: Average value of machinery and equipment on an Oklahoma farm in 2012
44 Resources and Contact Info USDA Census of Agriculture / damona.doye@okstate.edu,

45

46
47
48
2017 Census of Agriculture Data Release. Oklahoma. EMBARGOED until April 11, at noon ET
 2017 Census of Agriculture Data Release Oklahoma EMBARGOED until April 11, at noon ET Agenda Census Data Collection Farms and Ranches Economics Demographics Future Census Products History of the Census
How Will Farmers Respond to High Fuel and Fertilizer Prices?
 How Will Farmers Respond to High Fuel and Fertilizer Prices? Damona Doye Regents Professor and Extension Economist Oklahoma State University Value of production by commodity Cattle and calves Poultry &
A Decade of Change in Texas Agriculture Highlights and Trends from the Census of Agriculture
 E-590 10/09 A Decade of Change in Texas Agriculture Highlights and Trends from the Census of Agriculture A Decade of Change in Texas Agriculture Highlights and Trends from the Census of Agriculture Authors
Northeast Farms to Food
 Northeast Farms to Food Understanding Our Region s Food System UPDATE OCTOBER 2004 Includes new data from the USDA 2002 Census of Agriculture Northeast Sustainable Agriculture Working Group University
2O16 MISSISSIPPI. agriculture, forestry and natural resources
 2O16 MISSISSIPPI agriculture, forestry and natural resources THAD COCHRAN CHAMPION FOR MISSISSIPPI AGRICULTURE U.S. Senator Thad Cochran has dedicated 45 years of service to the state of Mississippi. He
The Importance of Agriculture and its Transportation Issues
 The Importance of Agriculture and its Transportation Issues Presented By: Dr. Steve Amosson Regents Fellow Professor and Extension Economist Texas Freight Advisory Committee Meeting Amarillo, Texas October
USDA Farm Data for the HICAHS Region
 USDA Farm Data for the HICAHS Region The six-state HICAHS region includes Colorado, Montana, North Dakota, South Dakota, Utah, and Wyoming. Through an agreement with the Southwest Center for Agricultural
Ag Land Market Perspectives
 Ag Land Market Perspectives Damona Doye Regents Professor and Rainbolt Chair in Agricultural Finance Roger Sahs Assistant Extension Specialist Agricultural Land Value Topics Small parcel premium Changes
Washington County Agriculture Profile
 Washington County Agriculture Profile Economic Importance Past Trends Futur e Patterns Growth Management Implications Pr epared by: Jack Trzebi at owski W ashington County Farm Management Educator Family
Economics 330 Fall 2005 Exam 1. Strategic Planning and Budgeting
 Economics 330 Fall 2005 Exam 1 K E Y Strategic Planning and Budgeting Circle the letter of the best answer. You may put a square around the letter of your second choice. If your second choice is right,
Oklahoma Department of Career and Technology Education
 Oklahoma Department of Career and Technology Education Information Commons September 2016 Oklahoma Farming, Fishing, and Forestry Occupations Parameters Occupations Code Description 45-0000 Farming, Fishing,
Funding for Small Acreage Horticultural Producers. Luis A. Ribera Assistant Professor and Extension Economist June 7, 2011
 2008 Farm Bill Programs for Specialty Crops Funding for Small Acreage Horticultural Producers Luis A. Ribera Assistant Professor and Extension Economist June 7, 2011 Presentation Outline The 2008 Farm
Welcome to Annie's Project
 Welcome to Annie's Project Please help us to better prepare and continue to improve course by completing brief Pre-course Survey. Use the navigator buttons at the bottom of the page to move between pages.
The Economic Importance of Food and Fiber
 The Economic Importance of Food and Fiber A Spotlight on Tattnall County, Georgia Prepared for: Tattnall County Cooperative Extension October, 26 by: The Center for Agribusiness and Economic Development
Crossroads Resource Center
 Crossroads Resource Center Tools for Community Self-determination 7415 Humboldt Ave. S. / Minneapolis, Minnesota 55423 / 612.869.8664 kmeter@crcworks.org www.crcworks.org Sarasota County, Florida Local
WHAT WE KNOW ABOUT THE DEMOGRAPHICS OF U.S. FARM OPERATORS
 Agricultural Outlook Forum 2005 Presented: Friday, February 25, 2005 WHAT WE KNOW ABOUT THE DEMOGRAPHICS OF U.S. FARM OPERATORS Prepared by Rich Allen and Ginger Harris National Agricultural Statistics
2006 Iowa Farm Costs. and Returns File C1-10. Ag Decision Maker. Definition of Terms Used
 2006 Iowa Farm Costs Ag Decision Maker and Returns File C1-10 The farm record data utilized in this report were obtained from the Iowa Farm Business Associations. The average of all farms in each table
The Economic Importance of Food and Fiber
 The Economic Importance of Food and Fiber A Spotlight on Taylor County, Georgia Prepared for: Taylor County Cooperative Extension October, 26 by: The Center for Agribusiness and Economic Development College
THE STRUCTURE OF SOUTH DAKOTA AGRICULTURE:
 THE STRUCTURE OF SOUTH DAKOTA AGRICULTURE: 1935-2012 by Henry Brown, Larry Janssen, Matthew A. Diersen, and Evert Van der Sluis Economics Research Report 2015-1 September 14, 2015 Henry Brown is a Graduate
The Contribution of Energy Extraction Activities to Farm Household Wellbeing: Oil, Gas, and Wind Lease and Royalty Income
 The Contribution of Energy Extraction Activities to Farm Household Wellbeing: Oil, Gas, and Wind Lease and Royalty Income James M. Williamson and Damona Doye Selected Paper prepared for presentation at
Table 1 Declining number of farms with chickens, increasing cash receipts, Year Farms Cash receipts for with chickens* chickens and
 Table 1 Declining number of farms with chickens, increasing cash receipts, 1910-92 Year Farms Cash receipts for with chickens* chickens and broilers** Percent $Million 1910 87.7 127 1920 90.5 317 1925
Ranch Calculator (RanchCalc)
") Oklahoma Cooperative Extension Service Current Report CR-3252 0609 Oklahoma Cooperative Extension Fact Sheets are also available on our website at: facts.okstate.edu Ranch Calculator (RanchCalc) Damona
Oklahoma Cooperative Extension Service Current Report CR-3252 0609 Oklahoma Cooperative Extension Fact Sheets are also available on our website at: facts.okstate.edu Ranch Calculator (RanchCalc) Damona
American Indian Reservations Montana, North Dakota, and South Dakota Pilot Project
 Indian Reservations Montana, North Dakota, and South Dakota Pilot Project Specialty Products Part AC0SP Issued October 00 U.S. Department of Agriculture Ann M. Veneman, Secretary Dr. Joseph J. Jen, Under
Current Report. Oklahoma Cropland Rental Rates: CR
 Oklahoma Cooperative Extension Service Current Report CR-23 39 Oklahoma Cropland Rental Rates: 28-9 Damona Doye Regents Professor and Extension Economist Oklahoma Cooperative Extension Fact Sheets are
MINNESOTA AGRICULTURAL ECONOMIST
 MINNESOTA AGRICULTURAL ECONOMIST No. 662 September 1990 The Changing Structure of Minnesota Agriculture C. T. Papadas and D. C. Dahl Minnesota agriculture changed significantly between 1950 and 1987. By
RETUR COSTS A 8 R R. and 96 LI6R R
 U.S. DEPARTMENT OF AGRICULTURE ECONOMIC RESEARCH SERVICE SEPTEMBER 1968 FCR -62 koope roting with KENTUCKY AND TENNESSEE AGRICULTURAL EXPERIMENT STATIONS COSTS A 8 R R. LI6R R and 96 RETUR FARM COSTS AND
STATISTICAL PROFILE OF HALIFAX AND HANTS COUNTIES. Prepared By: Nova Scotia Federation of Agriculture
 STATISTICAL PROFILE OF HALIFAX AND HANTS COUNTIES Prepared By: Nova Scotia Federation of Agriculture 1.0 Introduction Agriculture in the Local Economy Agriculture in Halifax and Counties are characterized
Costs to Produce Milk in Illinois 2003
 Costs to Produce Milk in Illinois 2003 University of Illinois Farm Business Management Resources FBM-0160 Costs to Produce Milk in Illinois 2003 Dale H. Lattz Extension Specialist, Farm Management Department
Jason Henderson Vice President and Branch Executive Federal Reserve Bank of Kansas City Omaha Branch April 25, 2012
 Jason Henderson Vice President and Branch Executive April 25, 2012 The views expressed are those of the author and do not necessarily reflect the opinions of the Federal Reserve Bank of Kansas City or
New Brunswick Census of Agriculture Graphs October 2017
 New Brunswick Census of Agriculture Graphs 216 October 217 New Brunswick Census of Agriculture Report 216 Province of New Brunswick P.O. Box 6, Fredericton NB E3B 5H1 CANADA www.gnb.ca Printed English
The Economic Importance of Food and Fiber
 The Economic Importance of Food and Fiber A Spotlight on Brantley County, Georgia Prepared for: Brantley County Cooperative Extension July, 26 by: The Center for Agribusiness and Economic Development College
ITEM PRICE YIELD TOTAL GROSS RETURNS OAT HAY TONS (IN FIELD) TOTAL PURCHASED PURCHASED INPUTS PRICE QUANTITY INPUTS TOTAL
 TOTAL PURCHASED PURCHASED INPUTS PRICE QUANTITY INPUTS TOTAL") TABLE 4. Alfalfa establishment, flood-irrigated, budgeted per acre costs and returns for a 20 acre part-time farm, San Juan County. Projected 2015 Planting dates: April 15 - June 1 Harvest dates: June
TABLE 4. Alfalfa establishment, flood-irrigated, budgeted per acre costs and returns for a 20 acre part-time farm, San Juan County. Projected 2015 Planting dates: April 15 - June 1 Harvest dates: June
Current Report. Oklahoma Cropland Rental Rates: CR
 Oklahoma Cooperative Extension Service Current Report CR-2 1 Oklahoma Cropland Rental Rates: 212-1 Damona Doye Regents Professor and Extension Economist Oklahoma Cooperative Extension Fact Sheets are also
FAPRI-UMC Report December 8, 2005
 FAPRI-UMC Report 17-05 December 8, 2005 FAPRI 2006 Outlook for Missouri Agriculture Food and Agricultural Policy Research Institute (FAPRI) College of Agriculture, Food and Natural Resources University
Economic Contributions of Agriculture, Natural Resources and Food Industries in Polk County, Florida
 Economic Contributions of Agriculture, Natural Resources and Food Industries in Polk County, Florida Sponsored Project Report to Polk County, Florida Farm Bureau Alan W. Hodges, Ph.D., Extension Scientist
THE IMPORTANCE OF AGRIBUSINESS TO THE BI-STATE ECONOMY. Prepared by the St. Louis Agribusiness Club January 2010
 THE IMPORTANCE OF AGRIBUSINESS TO THE BI-STATE ECONOMY Prepared by the St. Louis Agribusiness Club January 2010 OVERVIEW OF AGRICULTURE Planet Earth is home to 6.8 billion people 7 billion are expected
United States Department of Agriculture (USDA) Highlights of various programs. Wetlands Reserve program (WRP)
 Highlights of various programs. Wetlands Reserve program (WRP)") Funding Sources: (USDA) United States Department of Agriculture The following is a listing of the various funding sources offered to farmers by the USDA. Each source shows the eligibility, what it will
Funding Sources: (USDA) United States Department of Agriculture The following is a listing of the various funding sources offered to farmers by the USDA. Each source shows the eligibility, what it will
Contribution of Agribusiness to the Magic Valley Economy, 2013
 BUL 916 Contribution of Agribusiness to the Magic Valley Economy, 2013 Steven Hines University of Idaho Extension, Jerome County Joel Packham UI Extension, Cassia County Carmen Wilmore UI Extension, Lincoln
W I S C O N SI N. American Farmland Trust National Conference Lexington, KY October 21, 2014
 COUNTY of 1839 DANE W I S C O N SI N American Farmland Trust 2014 National Conference Lexington, KY October 21, 2014 Dane County, Wisconsin Land Evaluation Rural Land Use Market Value of Agricultural
Ohio Agricultural Production and Rural Infrastructure
 Ohio Trends in Agricultural Production and Infrastructure Highlights - In many states the percentage of the state population designated by the U.S. Census Bureau as living in rural areas has declined,
A brief focus on Georgia s agricultural industry
 A brief focus on Georgia s agricultural industry 2010 Total Farm Gate Value $200,000,000 - $475,048,630 $80,000,000 - $200,000,000 $45,000,000 - $80,000,000 $20,000,000 - $45,000,000 $313,000 - $20,000,000
Producer price index 1998/99 to 2002/03 (July to June) / / / / /03 Year
 / / / / /03 Year") Economic review for the 12 months that ended on 30 June 2003 Volume of agricultural production During 2002/03, the estimated total volume of agricultural production was 3 % lower than during 2001/02. As
Economic review for the 12 months that ended on 30 June 2003 Volume of agricultural production During 2002/03, the estimated total volume of agricultural production was 3 % lower than during 2001/02. As
The Distribution of Farm Program Payments in the U.S.
 The Distribution of Farm Program Payments in the U.S. Ron L. Durst Economic Research Service U.S. Dept. of Agriculture JOINT SEMINAR BETWEEN THE WORKING PARTY ON AGRICULTURAL POLICIES AND MARKETS (APM)
2014 Farm Bill. FACT SHEET March Noninsured Crop Disaster Assistance Program for 2015 and Subsequent Years
 UNITED STATES DEPARTMENT OF AGRICULTURE FARM SERVICE AGENCY 2014 Farm Bill Noninsured Crop Disaster Assistance Program for 2015 and Subsequent Years FACT SHEET March 2016 OVERVIEW The Noninsured Crop Disaster
North Carolina Agriculture: Situation and Outlook
 North Carolina Agriculture: Situation and Outlook Blake Brown, PhD Extension Economist & Hugh C. Kiger Professor Department of Agricultural and Resource Economics North Carolina State University NC Agriculture
STATISTICAL PROFILE OF COLCHESTER COUNTY. Prepared By: Nova Scotia Federation of Agriculture
 STATISTICAL PROFILE OF COLCHESTER COUNTY Prepared By: Nova Scotia Federation of Agriculture 1.0 Introduction Agriculture in the Local Economy Agriculture in County is characterized by a diversity of farm
Table 1. County Summary Highlights: 2017 [For meaning of abbreviations and symbols, see introductory text.]
![Table 1. County Summary Highlights: 2017 [For meaning of abbreviations and symbols, see introductory text.]](/thumbs/96/127349767.jpg "Table 1. County Summary Highlights: 2017 [For meaning of abbreviations and symbols, see introductory text.]") Table. County Summary Highlights: Item Maryland Allegany Anne Arundel Baltimore Calvert Caroline Median size of farm...,,0, 0 0, 0,00 0, 0, 0,0 Average per acre... dollars,,, 0,,, 0,,,00,, 0,,,, equipment...$,000,,0,,,,,,
Table. County Summary Highlights: Item Maryland Allegany Anne Arundel Baltimore Calvert Caroline Median size of farm...,,0, 0 0, 0,00 0, 0, 0,0 Average per acre... dollars,,, 0,,, 0,,,00,, 0,,,, equipment...$,000,,0,,,,,,
Visit Our Website To Learn More!
 Visit Our Website To Learn More! www.ers.usda.gov You can find additional information about ERS publications, databases, and other products at our website. National Agricultural Library Cataloging Record:
MULTI-CULTURAL OUTREACH TO ETHNIC FARMERS FOR THE 2007 CENSUS OF AGRICULTURE
 MULTI-CULTURAL OUTREACH TO ETHNIC FARMERS FOR THE 2007 CENSUS OF AGRICULTURE William Iwig, Carol House, Steve Manheimer, Michelle Radice, Daniel Beckler National Agricultural Statistics Service, U. S.
Bath County Agricultural Development Council
 Bath County Agricultural Development Council December, 2007 Comprehensive Plan Chris Howard Chair Mike Downs Vice Chair Mary Bach Secretary Tony Smather Joe Karrick Billy Stewart Thomas Oldfield Jr. Nelson
2014 Farm Bill FACT SHEET. The Noninsured Crop Disaster Assistance Program for 2015 and Subsequent Years
 UNITED STATES DEPARTMENT OF AGRICULTURE FARM SERVICE AGENCY OVERVIEW 2014 Farm Bill The Noninsured Crop Disaster Assistance Program for 2015 and Subsequent Years The Noninsured Crop Disaster Assistance
The Economic Importance of Food and Fiber
 The Economic Importance of Food and Fiber A Spotlight on Hall County, Georgia Prepared for: Hall County Extension Service Prepared and Presented by: Dr. John C. McKissick, Coordinator The Center for Agribusiness
Facts About Texas and U.S. Agriculture
 Facts About Texas and U.S. Agriculture Caroline Gleaton Office Associate John Robinson Professor and Extension Economist-Cotton Marketing Texas A&M Agriife Extension Service Department of Agricultural
ECONOMIC. Impact of Arkansas Agriculture
 ECONOMIC Impact of Arkansas Agriculture 2010 Contents Total Impact... 4 Arkansas Counts on Agriculture... 8 The Natural State... 10 Crops Sector... 14 Strength in Diversity... 16 Animal Agriculture Sector...
Table 70. Summary by Tenure of Operators: 1998
 Summary by Tenure of Operators: 1998 FARMS AND LAND IN FARMS Farms number 19 951 15 620 2 207 2 124 Land in farms cuerdas 865 478 457 786 246 494 161 198 Average size of farm cuerdas 43.4 29.3 111.7 75.9
Updates on Distribution of support and New farm level analyses
 Updates on Distribution of support and New farm level analyses February 26, 2009 Martin S. Beaulieu, Statistics Canada Updates on Distribution of support and new farm level analyses Distribution of support
Costs to Produce Milk in Illinois 2016
 Costs to Produce Milk in Illinois 2016 Costs to Produce Milk in Illinois 2016 University of Illinois Farm Business Management Resources FBM-0160 Brandy M. Krapf, Dwight D. Raab, and Bradley L. Zwilling
Alameda County Eligibility Requirements for Williamson Act Contracts for Agricultural Uses GUIDELINES FOR COMMERCIAL AGRICULTURE
 Alameda County Eligibility Requirements for Williamson Act Contracts for Agricultural Uses GUIDELINES FOR COMMERCIAL AGRICULTURE Introduction These Guidelines are intended to summarize the requirements
Section 2 - Agricultural Production
 Section 2 - Agricultural Production In addition to food and beverage manufacturing, agricultural production is the other core industry within the AFB cluster. In 2012, just over 24,000 farms in the fourteen
Objective Students will read about agriculture in their own community and across the state.
 Ag in My Community Objective Students will read about agriculture in their own community and across the state. Materials samples of agricultural products from your county (See charts.) or the products
Henry County Comprehensive Plan. Master Settlement Agreement Phase I Proposals
 Henry County Comprehensive Plan Master Settlement Agreement Phase I Proposals Prepared by: Henry County Agricultural Development Council Philip Sewell Chairman David Douglas Vice Chairman Carla Gerding
Facts About Texas and U.S. Agriculture
 Facts About Texas and U.S. Agriculture Caroline S. Gleaton Office Associate Carl G. Anderson Professor and Extension Specialist-Emeritus Texas Cooperative Extension Department of Agricultural Economics
The Economic Importance of Food and Fiber
 The Economic Importance of Food and Fiber A Spotlight on Harris County, Georgia Prepared for: Harris County Cooperative Extension Service February, 25 by: The Center for Agribusiness and Economic Development
Ohio Farm Financial Conditions and Outlook: Farm Income and Assets, Land Values and Rent, and Farm Financial Stress
 Ohio Farm Financial Conditions and Outlook: Farm Income and Assets, Land Values and Rent, and Farm Financial Stress Ani Katchova Associate Professor Farm Income Enhancement Chair Department of Agricultural,
Contribution of Agriculture to Oklahoma s Economy: 2015
 Contribution of Agriculture to Oklahoma s Economy: 2015 E-1046 Department of Agricultural Economics Division of Agricultural Sciences and Natural Resources Oklahoma State University Dave Shideler, Ph.D.
Counts and Density of All Jobs in Work Selection Area in All Workers
 OnTheMap Work Area Profile Report All Jobs for All Workers in. Created by the U.S. Census Bureau s OnTheMap http://onthemap.ces.census.gov on 02/18/2014 s and Density of All Jobs in Work Selection Area
CC Nebraska's Agriculture
 University of Nebraska - Lincoln DigitalCommons@University of Nebraska - Lincoln Historical Materials from University of Nebraska- Lincoln Extension Extension May 2014 CC Nebraska's Agriculture Duane A.
Minimum Core Data Set
 Global Strategy IMPROVING AGRICULTURAL AND RURAL STATISTICS IN ASIA PACIFIC Minimum Core Data Set Regional Office for the Asia-Pacific Regional Action Plan to Improve Agricultural and Rural Statistics
Reshaping Agricultural Production: Geography, Farm Structure, and Finances
 Reshaping Agricultural Production: Geography, Farm Structure, and Finances James M. MacDonald USDA Economic Research Service Kansas City Federal Reserve Bank Farming, Finance, and the Global Marketplace
Farm Operators - A Century of Demographic Data. Ginger Harris Agricultural Outlook Forum February 20, 2008
 Farm Operators - A Century of Demographic Data Ginger Harris Agricultural Outlook Forum February 20, 2008 NASS: National Agricultural Statistics Service NASS is an agency of the US Department of Agriculture
The Status of Alabama Agriculture
 SPECIAL LEAFLET DECEMBER 1940 The Status of Alabama Agriculture A By M. J. FUNCHESS, Director Alabama Experiment Station LABAMA is largely a rural state with approximately onehalf the population living
APPENDIX A. General Explanation
 APPENDIX A. General Explanation DATA COLLECTION Method of Enumeration As in the previous censuses of Guam, a direct enumeration procedure was used in the 2007 Census of Agriculture, and as in the 2002
Honey Final Estimates
 United States Department of Agriculture National Agricultural Statistics Service Honey Final Estimates 200-2012 September 201 Statistical Bulletin Number 3 Contents Honey Price by Color Class United States:
Oklahoma Department of Career and Technology Education
 Oklahoma Department of Career and Technology Education Information Commons September 2016 Oklahoma Business and Financial Operations Occupations Parameters Occupations Code Description 13-0000 Business
3. Dairy Production Data: 3.1. Year-end milk check showing total pounds of milk sold for the year DHIA Herdcode
 Dairy Cash Flow Plan extension.psu.edu Annual Cash Flow Checklist: 1. Historical Financial Data: 1.1. 2015 Income & Expenses Bring print out from computer or paper record book if possible 1.2. 2015 Schedule
Oklahoma Department of Career and Technology Education
 Oklahoma Department of Career and Technology Education Information Commons September 2016 Oklahoma Legal Occupations Parameters Occupations Code Description 23-0000 Legal Occupations Regions Code Description
Botetourt County Agriculture Strategic Plan. November 24, 2015
 Botetourt County Agriculture Strategic Plan November 24, 2015 Botetourt Agricultural Planning Botetourt Farming Characteristics and Trends Focus Groups and Survey Strategic Priority Identification Questions
2014 Iowa Ag Economic Contribution Study
 2014 Iowa Ag Economic Contribution Study Prepared for: Prepared by: September 2014 2014 Iowa Ag Economic Contribution Study September 2014 Contents List of Figures... 4 List of Tables... 6 Executive Summary...
2007 Michigan Dairy Farm Business Analysis Summary. Eric Wittenberg And Christopher Wolf. Staff Paper December, 2008
 2007 Michigan Dairy Farm Business Analysis Summary Eric Wittenberg And Christopher Wolf Staff Paper 2008-04 December, 2008 Department of Agricultural, Food, and Resource Economics MICHIGAN STATE UNIVERSITY
Overview of livestock farm operating expenses
 Catalogue no. 96 32 X No. 008 ISSN 0-662-369-4 Canadian Agriculture at a Glance Overview of livestock farm operating expenses by Jean-Mathieu Lachapelle Release date: October 28, 2014 How to obtain more
Geography, Farm Structure, and Finances
 Reshaping Agricultural Production: Geography, Farm Structure, and Finances James M. MacDonald USDA Economic Research Service Kansas City Federal Reserve Bank Farming, Finance, and the Global Marketplace
Sustainable Agriculture Research and Education. North Central Region SARE. Sustainable Agriculture Research and Education
 Sustainable Agriculture Research and Education North Central Region SARE Sustainable Agriculture Research and Education Research and Education Program Survey of Farmers and Ranchers North Central Region
Baseline Update for U.S. Farm Income and Government Outlays
 Baseline Update for U.S. Farm Income and Government Outlays October 2016 FAPRI MU Report #06 16 Prepared by the Food and Agricultural Policy Research Institute University of Missouri www.fapri.missouri.edu
Enterprise Diversification to Improve Efficiency and Profitability
 Enterprise Diversification to Improve Efficiency and Profitability Objectives Provide an overview of production diversification Explore the opportunities and challenges in improving diversification Outline
Characteristics and Production Costs of U.S. Cow-Calf Operations
 United States Department of Agriculture Electronic Report from the Economic Research Service www.ers.usda.gov Statistical Bulletin Number 974-3 November 2001 Characteristics and Production Costs of U.S.
Contribution of Agribusiness to the Magic Valley Economy, 2010
 CIS 1193 Contribution of Agribusiness to the Magic Valley Economy, 2010 by S. Hines, J. Packham, and G. Taylor Introduction Irrigation has transformed the Magic Valley desert (Cassia, Lincoln, Minidoka,
Laurel County Comprehensive Plan
 Laurel County Comprehensive Plan Developed by the Laurel County Agricultural Development Council December 21, 2000 Revised: August 28, 2008 Cooperating Partners: Laurel County Cooperative Extension Council
Demographics. Health Statistics
 Kent County, MD Food Systems Profile These county profiles present the data compiled by the Maryland Food System Map Project, at the Johns Hopkins Center for a Livable Future. They are intended to be used
Frederick County, MD. Demographics. Health Statistics
 Frederick County, MD Food Systems Profile These county profiles present the data compiled by the Maryland Food System Map Project, at the Johns Hopkins Center for a Livable Future. They are intended to
Demographics. Health Statistics
 Cecil County, MD Food Systems Profile These county profiles present the data compiled by the Maryland Food System Map Project, at the Johns Hopkins Center for a Livable Future. They are intended to be
Demographics. Health Statistics
 Allegany County, MD Food Systems Profile These county profiles present the data compiled by the Maryland Food System Map Project, at the Johns Hopkins Center for a Livable Future. They are intended to
Wicomico County, MD. Demographics. Health Statistics
 Wicomico County, MD Food Systems Profile These county profiles present the data compiled by the Maryland Food System Map Project, at the Johns Hopkins Center for a Livable Future. They are intended to
Contribution of Agriculture to the Maricopa County and Gila River Indian Community
 Contribution of Agriculture to the Maricopa County and Gila River Indian Community Economies Dari Duval Ashley Kerna Bickel George Frisvold Xinye Wu Chenyang Hu Contribution of Agriculture to the Maricopa
Riley County Community Food System Assessment System Assessment September 2017
 Riley System County Assessment Community Food System Assessment September 2017 This report was prepared by Barbara LaClair, of LaClair Consulting Services, under contractual agreement with the Flint Hills
Farm Financial Record Keeping Using Quicken for Windows Category List
 Farm Financial Record Keeping Using Quicken for Windows Category List and Expense Categories A list of income and expense categories that can be imported into Quicken financial recordkeeping have been
Lesson 42. Agriculture in Texas TEXAS ALMANAC TEACHERS GUIDE. Principal Crops Vegetable Crops Fruits & Nuts. A mature wheat field in Texas.
 Lesson 42 TEXAS ALMANAC TEACHERS GUIDE Agriculture in Texas Principal Crops Vegetable Crops Fruits & Nuts Social Studies TEKS 4-6, 8, 11, 12, 21, 22, 23 7-7, 8, 9, 12, 21, 22, 23 8-14, 29, 30 STAAR 4,
Economic Research Service The USDA Commodity Costs and Returns (CAR) Estimation Project
 Estimation Project") Economic Research Service The USDA Commodity Costs and Returns (CAR) Estimation Project William D. McBride USDA, ERS Presented at FAO Expert Group Meeting November 28, 2011; Addis Ababa, Ethiopia Outline
Economic Research Service The USDA Commodity Costs and Returns (CAR) Estimation Project William D. McBride USDA, ERS Presented at FAO Expert Group Meeting November 28, 2011; Addis Ababa, Ethiopia Outline
The Economic Importance of Food and Fiber
 The Economic Importance of Food and Fiber A Spotlight on Hart County, Georgia Prepared for Hart County Cooperative Extension June 2015 by: The Center for Agribusiness and Economic Development College of
2007 Michigan Cash Grain Farm Business Analysis Summary. Eric Wittenberg And Stephen Harsh. Staff Paper December, 2008
 2007 Michigan Cash Grain Farm Business Analysis Summary Eric Wittenberg And Stephen Harsh Staff Paper 2008-07 December, 2008 Department of Agricultural, Food, and Resource Economics MICHIGAN STATE UNIVERSITY
APPENDIX A. General Explanation
 APPENDIX A. General Explanation DATA COLLECTION Method of Enumeration As in the previous censuses of the U.S. Virgin Islands, a direct enumeration procedure was used in the 2007 Census of Agriculture.