Indexes Pages Annexes Maps
|
|
|
- Alfred Williamson
- 5 years ago
- Views:
Transcription

1
2 Indexes Pages Agriculture Profile and Data.. 3 Crop production by Chart... 4 Grain Production. 5 Fruit Production.. 6 Vegetable Production.. 7 Fodder and Industrial Crops 8 Household Livestock.. 9 Annexes Annex 1: Crop Surveyed by Hectares, Production and Value 10 Annex 2: Ranking of Production by Tons Surveyed Annually Annex 3: Harvest Season of Agriculture Crops Surveyed...12 Annex 4: District Profile Summary..13 Annex 5: Number of Household Animals and Poultry.14 Annex 6: Land Use Status...15 Annex 7: Crop Calendar 16 Maps Kapisa Province Standard Map 17 Kapisa Province Agriculture Map.. 18 Kapisa Province Wheat Production Map. 19 Kapisa Province Alfalfa Production Map 20 Kapisa Province Onion Planting Date Map. 21 Kapisa Province Onion Harvesting Date Map. 22 Kapisa Province Livestock Map.. 23 Kapisa Province Livestock (Goats) Map. 24 Kapisa Province Poultry Map
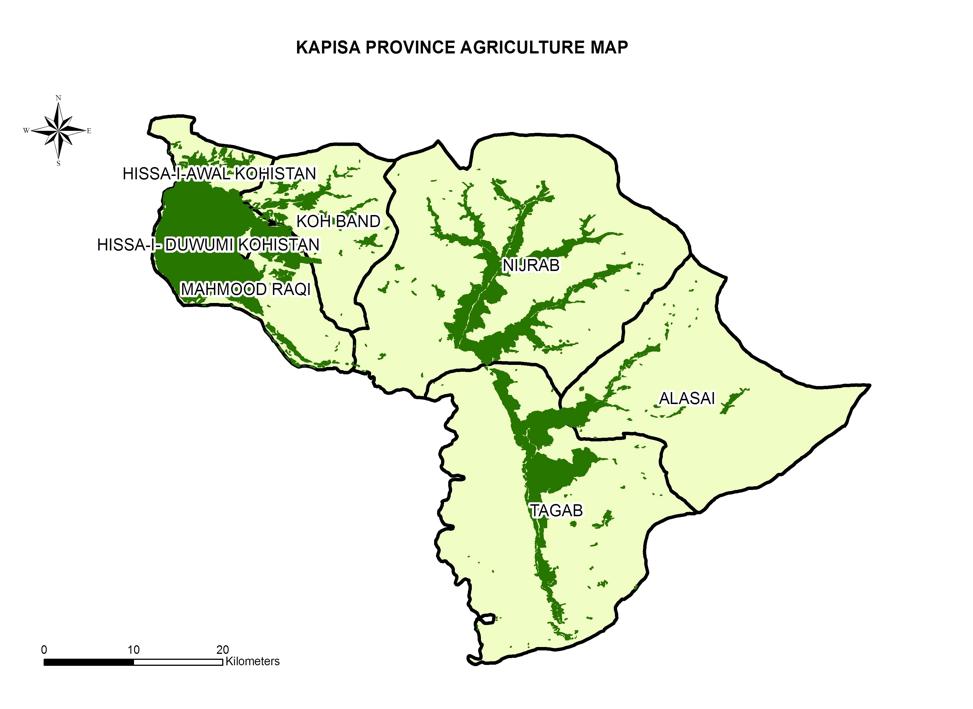
3 Agriculture Profile and Data Kapisa province Kapisa Brief Introduction: Kapisa province is located in eastern Afghanistan between degrees latitude and degrees longitude. Kapisa borders Panjshir province located to the north, Kabul province to the south, Parwan province to the west and Laghman province to the east. Kapisa is divided into 7 districts that cover an area of 1, square kilometers, which includes which 27,455 hectares of cultivated land. There are 906 villages in the province with an estimated population in 2008 of 413,341 (as of 2008). Kapisa is famous for producing mulberries and pomegranates and some districts grow large amounts of nuts. Herders raise sheep and goats in mountainous areas of the province. As of 2008, Kapisa farmers grew 25 different crops on 40,816 hectares of land (22 percent of total area). The cultivated area is more concentrated in the northwestern districts of the province due to the low elevation of the land and the vicinity to the Panjshir River. Eighty percent of cultivated land is concentrated in 4 of the 7 districts of Kapisa. The remaining 3 districts are more suitable for raising livestock because of the hilly and mountainous terrain in the area. The districts of Kapisa are: - Nijrab - Alasai - Mahmood Raqi - Kohband - Hesa Awal - Tagab - Hesa Dowam 3
4 The total 2008 crop production 6% 1% surveyed in Kapisa province was 131,522 metric tons MT with most 42% of the production focused on grains (79.3 percent) followed by fruits (17.5 percent). Vegetables, industrial crops and animal fodder made up the remaining 0.5 percent of production. 51% The total market value of the 2008 harvest was estimated at $58,807,500, without any relevant value added processing. Grain 67,229 tons (51.05%) Fruit 55,464 tons (42.11%) Vegetable 8,346 tons (6.34%) Fodder and Industrial crops 662 tons (0.50%) Nijrab district led the province in terms of total production (25 percent) in Mahmood Raqi held the second position (21 percent) and Hesa Dowam Kohistan placed third by generating 17 percent of all Kapisa crops in Research Methodology This report was prepared based on information provided by AgNet/NAIS system. In 2007 and 2008 AgNet Conducted two separate surveys (1) district profile survey and (2) agricultural statistic survey in 19 provinces of Afghanistan with the support of ASAP and MAIL at district level. During a period of 4 months each, more than 50 surveyors collected information related to the number of hectares land cultivated, types of products produced, number of livestock, crop calendar, sources of water and much more agricultural information. The information presented in this report is based exclusively in the area surveyed, not in the total farm land of the provinces. The AgNet/NAIS data base for Kapisa is the most accurate database available in the country in spite there is not estimation rewarding the level of exactitude of the information. All data related to harvest amounts was checked in July 2008 by ASAP personnel (Prof. A. Ghani Taj Agricultural Information Specialist and former professor of Kabul University and Ahmad Jawid Abid Survey and Data Assistant) by comparing the national average productivity level of each products. Crop value information was determined on wholesale price in Kapisa and collected by Kapisa AgNet officer Mr. Abdul Jabar and approved by deputy director of Kapisa Provincial Agriculture department Mr. Mohammad Azim Safi in September
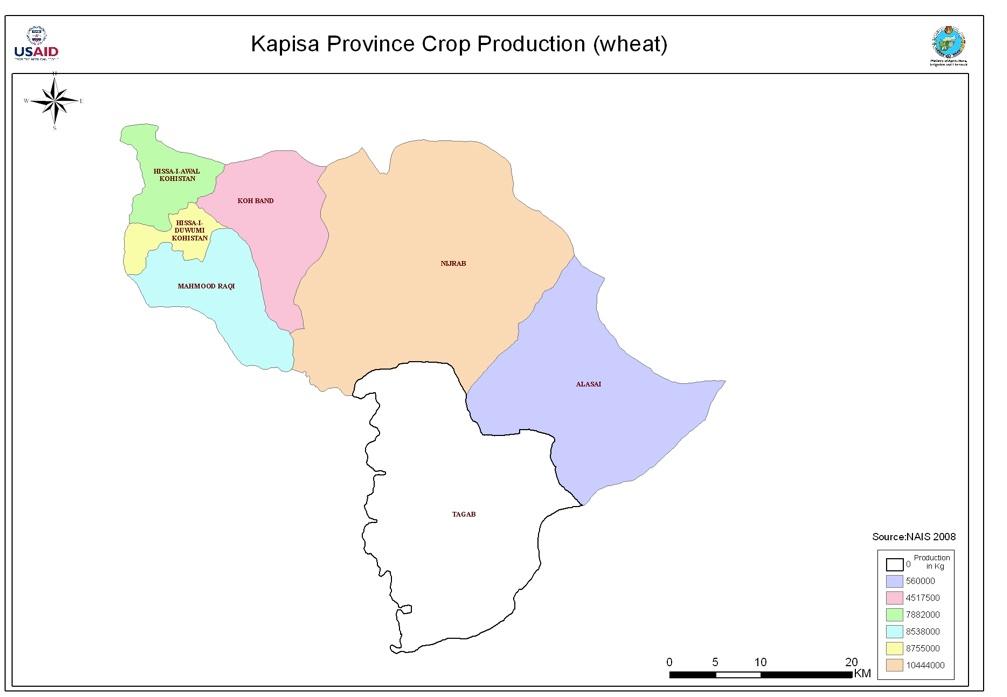
5 Grains Annual grain production surveyed is approximately 67 MT (market value of $39 million). Of this total almost all (93 percent) consisted of major food staples wheat and corn (worth $35 million) and the remaining 7 percent comprised other grain crops with an approximate value of $4 million. Grain Tons Value USD $ Wheat 40,697 $ 24,429,900 Barely 396 $ 166,110 Maize 21,700 $ 10,850,000 Mung bean 98 $ 45,080 Pea 837 $ 669,200 Millets 1,628 $ 423,150 Rice 1,873 $ 2,531,150 Grand Total 67,229 $ 39,114,590 Most of the province s wheat was grown in 4 districts (Nijrab, Mahmood-e-Raqi, Hesa-e-Dowam and Hesa-e-Awal) and amounted to 87.5 percent of all grain produced in Kapisa. Nijrab district took the lead in terms of wheat production (10,500 MT) in The figures presented in the table below are in kg. Wheat Barely Maize Mung bean Pea Millets Rice Hesa-e- Awal 7,882, ,000 4,375,000 9, , ,500 21,000 Hesa-e- Dowam 8,755,000 35,000 4,375,000 9, , ,500 52,500 Tagab ,000-52,500-21,000 Mahmood-e- Raqi 8,538,000 70,000 4,375,000 49, , ,000 21,000 Nijrab 10,444,000 52,500 4,725,000 9, ,000 42,000 Kohband 4,517, ,000 19, Alasai 560,000 28,000 2,100, ,500 1,625,000 Total: 40,696, ,500 21,700,000 98, ,500 1,627,500 1,782,500 5
6 Fruits Kapisa s total fruit production surveyed in 2008 was estimated at 55,353 MT and was valued at over $17 million. Mulberries represented 78 percent of all fruit production and amount to half of the revenue earned from all fruit sold in the province. Although 5,569 MT of grapes are grown in Kapisa, the crop ranks fourth in terms of value on the market. Fruits Tons Value USD $ Apple 420 $ 294,000 Grape 5,569 $ 1,893,528 Apricot 694 $ 388,864 Mulberries 43,400 $ 8,680,000 Walnut 966 $ 1,642,200 Almond 1,904 $ 2,170,560 Pomegranate 2,378 $ 2,140,425 Melon 50 $ 17,136 Water Melon 61 $ 1,416 Other Fruit 22 $ 11,648 Total 55,353 $ 17,221,225 As was the case with grains grown in the province, fruit production is also geographically limited to a few districts. The following table presents the top fruit producing districts (figures are in kg). Tagab district produced almost all pomegranates (99 percent) in Kapisa while mulberries were grown in all districts except Tagab district. Farmers in Nijrab district grew the highest volumes of mulberries (32 percent) and Mahmood Raqi produced nearly all (99 percent) of the provinces grapes. Hesa-e- Awal Hesa-e- Dowam Tagab Mahmoo d-e- Raqi Apple Grape Apricot Mulberries Walnut Almond Pomegranate Mellon W.Melon Other Fruit 105,000 50, ,000 14,700-42,000 52,500 5,355,000 Nijrab 52,500 44,100 Kohband ,000 7,000, ,000 7,000,000 22, ,000 7,000, , , ,200 4,200 6,300-2, ,362, , , ,000 14,000, , ,000-4,200,000 73, ,000-42,000 52,
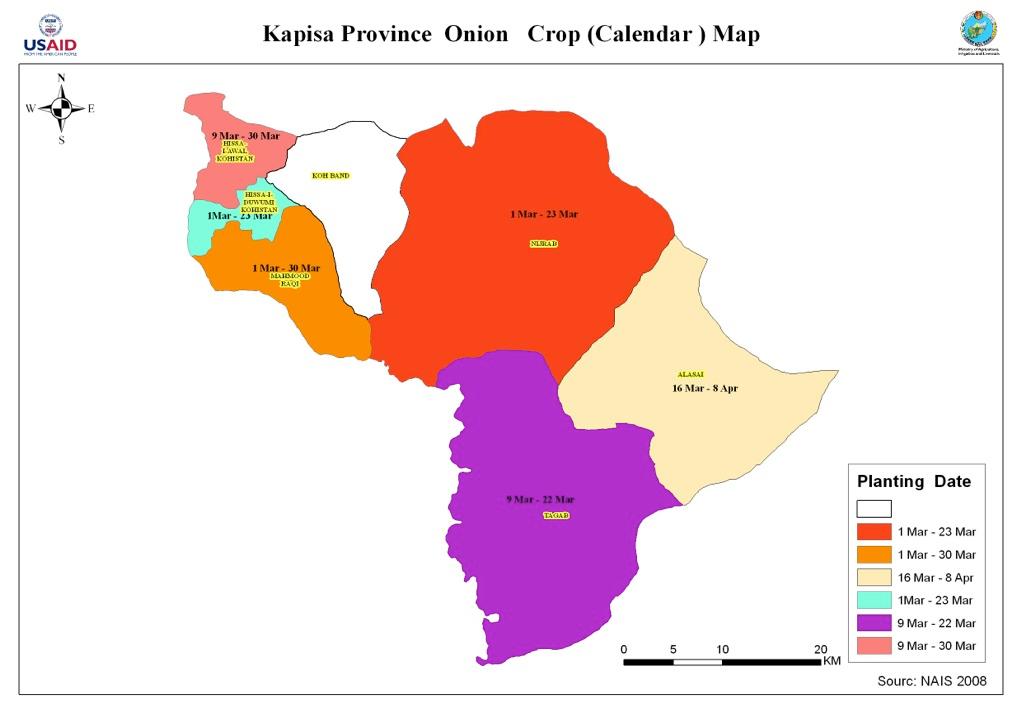
7 Alasai - 63,000-4,200, , ,000 15, ,000 5,569, ,400 43,400, ,000 1,904,000 2,378,250 50,400 60,900 22,400 Vegetables Vegetables Tons Value USD $ Vegetable production surveyed in Kapisa province during 2008 was estimated at 8,346 Potato Onion Tomato Eggplant 1,330 3,160 2, Other Vegetable 1,031 $ 319,920 $ 379,200 $ 335,520 $ 9,758 $ 432,936 MT, which is reported to have generated almost $1.5 million on the market. Kapisa farmers produced more than 7 different types of vegetables but only 3 reached over 1,000 MT in annual volumes. Onions and tomatoes represented 71 percent of the province s total vegetable harvest. Total 8,346 $ 1,477,334 Approximately 87 percent of vegetables grown in Kapisa are found in 3 districts, as shown in the following table. Tagab district produced one third of all onions in the province; 30 percent of tomatoes was produced by Nijrab district farmers; and just over one third (31 percent) of all potatoes were harvested in Hesa Dowam Kohistan. Figures presented in the table below are in kg. Potato Onion Tomato Eggplant Other Vegetable Hesa-e- Awal 7,000 48, , ,700 Hesa-e- Dowam Tagab Mahmood-e- Raqi Nijrab Kohband Alasai 420, , ,000 8, ,200 21,000 1,200, , , , , , , , ,000 20, , , , , , ,000 60,000-8,000 7
8 1,330,000 3,160,000 2,796,000 28,700 1,030,800 Fodder and industrial Cotton is an important industrial crop grown in Kapisa and is exclusively used for local benefit. Kapisa farmers earned $933,660 from this cash crop in Fodder & Industrials Clover Tons Value USD $ 62 $ 12,480 Cotton 599 $ 933,660 Other Industrial 1 $ 493 Total 662 $ 946,633 Cotton is grown in those districts where water from the Panjshir River can be easily accessed. Clover and other industrial crops are grown in very small amounts for household use only. Figures presented in the table below are in kg Clover Cotton Other Industrial Hesa-e- Awal 1, , Hesa-e- Dowam 1,200 63, Tagab - 10,500 - Mahmood-e- Raqi - 210,000 - Nijrab Kohband Alasai 60,
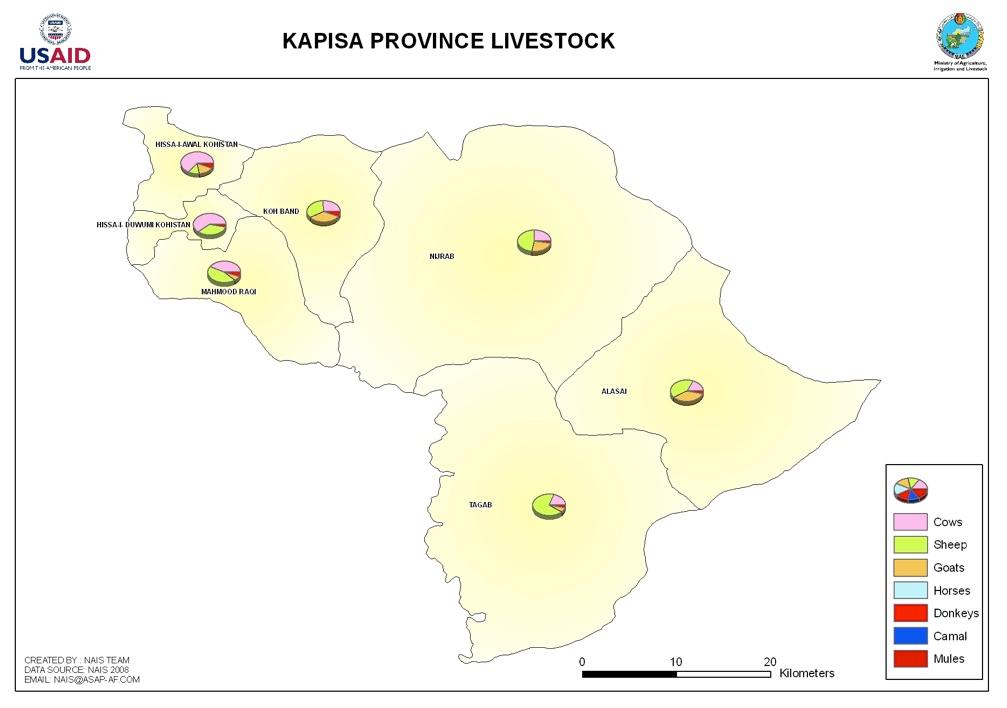
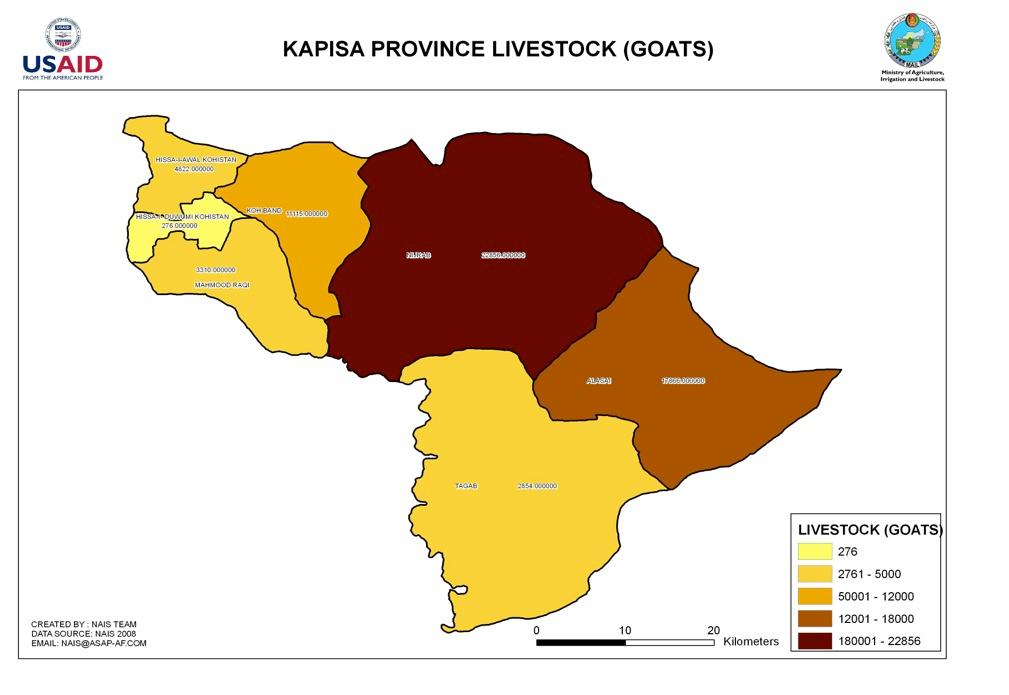
9 62, ,500 1,050 Livestock Farmers in Kapisa are also involved in animal husbandry. Based on the 2008 statistic survey, percent of sheep and goats are kept by farmers in the mountains and foothills of Nijrab, M. Raqi and Alasai districts (See annex 5). Province District Total livestock Total Poultry Alasai 45,980 7,010 Kapisa H.Awal 29,209 32,308 H.Dowam 28,053 28,730 Kohband 30,594 19,110 M.Raqi 48,682 49,260 Nijrab 89, ,340 Tagab 52,052 11,150 Total 324, ,908 There are 324,128 household livestock present in Kapisa of which sheep number the highest. In addition, residents of Kapisa maintained an estimated 337,908 chickens, ducks and turkeys in Nijrab district is home to over one fourth (27.6 percent) of Kapisa s livestock and M. Raqi and Tagab districts jointly hold another 31 percent. Animals Cow Sheep Goat Donkey camel Horse Total Ducks Turkey Chicken Total Heads 104, ,519 63,099 12, ,128 1, , ,908 Percentage
10 Annex 1 Kapisa Province crop surveyed by Hec, ton and USD Crops Hectares Metric Tons Value USD $ 1 Wheat 14,710 40,697 $ 24,429,900 2 Barely $ 166,110 3 Maize 12,400 21,700 $ 10,850,000 4 Mung bean $ 45,080 5 Pea $ 669,200 6 Millets 3,100 1,628 $ 423,150 7 Rice 1,375 1,873 $ 2,531,150 8 Potato 320 1,330 $ 319,920 9 Onion 262 3,160 $ 379, Tomato 233 2,796 $ 335, Eggplant 8 29 $ 9, Other Vegetable 108 1,031 $ 432, Apple $ 294, Grape 902 5,569 $ 1,893, Apricot $ 388, Mulberries 3,100 43,400 $ 8,680, Walnut 1, $ 1,642, Almond 290 1,904 $ 2,170, Pomegranate 755 2,378 $ 2,140, Other Fruit $ 11, Cotton $ 933, Other Ind. Crops 3 1 $ Melon $ 17, Water melon $ 14, Clover $ 12,480 Grand Total 40, ,700 $ 58,791,534 10
11 ANNEX 2 Ranking of Kapisa Province districts by tons surveyed annually District Tons Hectares Value USD $ % of production 1 Nijrab 33,055 10,217 $ 13,775, % 2 Mahmood -e- Raqi 28,310 8,192 $ 12,176, % 3 Hesa -e- Dowam 23,465 7,286 $ 10,235, % 4 Hesa -e- Awal 21,318 7,109 $ 9,566, % 5 Kohband 10,653 2,721 $ 4,574, Alasai 9,732 3,741 $ 5,492, Tagab 4,989 1,550 $ 2,888, Grand Total 131, $ 58,708, % 11
12 12
13 Annex 3 Harvest seasons for Kapisa Agricultural crops surveyed Crops Jan Feb Mar Apr May Jun Jul Aug Sep Oct Tons Almond 1,904 Apple 420 Apricot 694 Barley 396 Clover 62 Cotton 599 Eggplant 29 Grape 5,569 Wheat 40,697 Maize 21,700 Melon 50 Millets 1,628 Mint 4 Mulberries 43,200 Mung bean 98 Okra 144 Onion 3,160 Pea 837 Pepper 601 Plum 22 Pomegranate 2,378 Potato 1,330 Rice 1,783 Sasame 1 Spinach 3 Squash 10 Tomato 2,976 Turnip 89 Walnut 966 Water melon 61 White radish 175 Nov Dec 13
14 Annex 4 District Profile Summary for (Mahmood Raqi) Kapisa 2008 DISTRICT PROFILE: Mahmood Raqi 1 DEMOGRAPHICS 7 Water Region: Central Rain fed 5% Province: Kapisa Kariz 20% District: Mahmudraqi Canals 50% Villages: 70 Springs 10% Households: 10,254 Bored wells, # 15 Estimated population: 61,525 Access/irrigated water 50% 2 Land 8 Infrastructure Sharecroppers, % 2% Access/drinking water 15% Arable land, jeribs 24,750 Schools 10 Arable land, hectares (/5) 4950 Electricity costs, Afs/KWH 25 Grazing land, jeribs 0 Cell phone access yes Geographic area, Km2 0 Health clinic, # 1 Landowner, % 92 VFUs, # 1 Irrigated land area, hectares Livelihood Rainfed land in use,hectars 250 Agro-horticulture sector, % 90 3 Primary Crops Livestock sub-sector, % 5 Spring wheat, hectares 170 Bussiness and Trade % 0 Fall wheat, hectares 2900 Government and NGO % 3 Maize, hectares 2500 Daily Labor % 2 Mung bean, hectares Enterprises Pea, hectares 130 General shops, # Millets, hectares 600 Food service,# Cotton, hectares 100 Flour mills,# Graps, hectares 850 Shoe repair,# Other vegatables, hectares 132 Blacksmith,# Other fruits, hectars 615 Oil extraction,# 4 Livestock Butcher shops, # Livestock owners, % 1 Carpet weaving, # Draught oxen, # 0 11 Agricultural Initiatives Dairy cow, # Artificial Insimination Sheep & Goats, # Rentable Ag Machinary Donkey, # 2375 Improved wheat seed Horses, # 98 Fruit Nurseries, # 1 Checkens & Turkey, # Credit facility yes, Camel, # 0 Poultry farm, # 1 Kuchi, (seasonal families),# 350 Pest control Camels, # 500 Cool storage, # Kuchi sheep, # 3,700 Green houses, # Kuchi goats, # 2, Household (HH) Indices Kuchi other, # 2,700 Arable land/hh, jeribs Transportation Grazing land/hh, jeribs 0 Distance to center, km Irrigated land/hh, jeribs Time to center, minutes 20 Rainfed land/hh, jeribs Cost to center, Afs 100 Total livestock/hh, # Truck cost to center, Afs 1,500 Sheep&goats/HH, # (kochi) District roads Unpaved Poultry/HH, # Provincial roads unpaved 13 Check Accessibility All year Households/village: Markets Population/household: 6 Provincial All year Schools/village: District, General, day 2days Number of bored wells/village: District, livestock, day Number of enterprise/village: 0 Traders/assemblers yes, 14
15 Annex 5 Province: KAPISA LiveStock and Poultry Survey 2008 NAIS/ASAP/Chemonics Domestic Animals Statistic Birds Statistic No. Province District Sheep Goats Cows Horses Donkeys Camal Mules Total Chicken Turkeys Ducks Total 1 Alasai 2 Hisa Awal Kapisa 3 Hisa Dowam 4 Kohband 5 Mahmood Raqi 6 Nijrab 7 Tagab 18,390 17,866 8, , ,980 6, ,010 3,858 4,822 18, , ,209 31, ,308 10, , ,053 28, ,730 9,597 11,115 8, , ,594 19, ,110 21,776 3,310 21, , ,682 49, ,260 41,733 22,856 22, , , , ,340 36,925 2,854 10, , ,052 11, ,150
16 Annex 6 Province: KAPISA Agriculture Land use in Hectars 2008 NAIS/ASAP/Chemonics No Province District Village Irrigated Rainfed Total Fruit orch Farrows & vegetable land Cereal Crops Forage Crop land Forest Land Pasture Land Barelan d Mountai n Total land 1 Alasai 2 Hisa Awal Kapisa 3 Hisa Dowam 4 Kohband 5 Mahmood Raqqi 6 Nijrab 7 Tagab Total 60 2,100-2, , , , ,300 2, ,500 6, ,770-3, ,500 1, , , , , , ,950 1, , , , ,000-1, , ,300-4, , , ,420 1,035 27,455 2,570 1,360 10,300 3,000 1,900 1, ,500 32,655 16
17 Annex No. 7: Crop Calendar NAIS/ASAP Activities District Hese Awal Province_ Kapisa Date GPS HQ Elev.HQ No Planting=P;Harvest=H;Treat=T seasons Fruit and Nut Crops 1 Apple 2 Grape 3 Pomegranate 4 Pear 5 apricot 6 Peach 7 Feg 8 Plum 9 Almond 10 Walnut 11 Pistachio 12 Mulberri Vegetables 13 Tomato 14 Potato 15 Water melon 16 Melon 17 Carrot 18 Okra 19 Eggplanate 20 Cucumber Cabbage 21 Garlic 22 onion Califlower 23 Spinach Cash crop 24 Cotton 25 Rice 26 Wheat 27 Corn 28 Mung bean 29 Sasame 30 Flax 31 Sugar beat 32 Sugar cane 33 Millte 34 Cumin 35 Sunflower 36 Canola 37 Zafaran 38 Pea spring fall Jan Feb Mar Apr May Jun Jul Aug Sep Planting Harvesting 17 Oct Nov Dec
18 18
19 19
20 20
21 21
22 22
23 23
24 24
25 25
26 26
Indexes Pages Annexes Maps
 Indexes Pages Ø Agriculture Profile and Data.. 3 Ø Crop Production by Chart... 4 Ø Grain Production. 5 Ø Fruit Production.. 6 Ø Vegetable Production.. 7 Ø Fodder and Industrial Crops 8 Ø Household Livestock...
Indexes Pages Annexes Maps
 Indexes Pages Ø Agriculture Profile and Data.... 3 Ø Crop Production by Chart.... 4 Ø Grain Production.. 5 Ø Fruit Production... 6 Ø Vegetable Production... 7 Ø Fodder and Industrial Crops. 8 Ø Household
Provincial profile for
 Provincial profile for - Kapisa Province - Executive Summary Kapisa Province is located in 75 km north of Kabul Province. This province is partially surrounded by mountains. The major natural resources
National Census of Agriculture September 9 November
 Vice Presidency For Strategic Planning and Supervision Statistical Center of Iran National Census of Agriculture-2014 27 September 9 vember Listing Forms (Electronic) Specifications of Work Unit/District
SOUTH AFRICA - Agricultural Survey Main Results
 SOUTH AFRICA - Agricultural Survey 2000 - Main Results Number and area of holdings ( farming operations) Number of holdings Area (ha) Total 1 093 000 315 128 000 Former RSA (Rep. of South Africa) 150 000
Mississippi Fresh Produce Availability Calendar
 Mississippi Fresh Produce Availability Calendar Product Jan Feb Mar Apr May Jun Jul Aug Sep Oct Nov Dec FRUITS Apples 15th ------- 15th Blueberries 25th ------- 25th Muscadines 5th 15th Peaches 15th -------
Provincial profile for. - Laghman -
 Provincial profile for - Laghman - 1. Natural resources Laghman is a province with lot of natural resources. There are some minerals in the province (http://www.palagems.com/afghanistan_bariand.htm). There
Agricultural CROP REPORT. Yolo County
 Agricultural CROP REPORT Yolo County 1956 County of Yolo P.O. BOX 175 WOODLAND, CALIFORNIA 95695 (916) 666-8261 CHAS. H. HARDY COUNTY AGRICULTURAL COMMISSIONER SEALER OF WEIGHTS AND MEASURES TO: THE HONORABLE
Chapel Hill Farmers' Market
 Returning Chapel Hill Farmers Market member: To adequately plan for the upcoming market year and to better meet the needs of all our members we need to know what your plans and expectations are for the
A brief focus on Georgia s agricultural industry
 A brief focus on Georgia s agricultural industry 2010 Total Farm Gate Value $200,000,000 - $475,048,630 $80,000,000 - $200,000,000 $45,000,000 - $80,000,000 $20,000,000 - $45,000,000 $313,000 - $20,000,000
Agriculture in Bulgaria
 Agriculture in Bulgaria Situation and development of the national economy Economy of Bulgaria in 2007 the first year as a Member State of the European Union is economically stable and there is an increase
This presentation is sponsored by the Beginning Farmer and Rancher Development Program INTEGRATED FARMS
 This presentation is sponsored by the Beginning Farmer and Rancher Development Program INTEGRATED FARMS Integrated Farms In the 20 th century, farming saw a gradual separation and specialization of production
COLUSA COUNTY DEPARTMENT OF AGRICULTURE 2011 CROP REPORT JOSEPH J. DAMIANO AGRICULTURAL COMMISSIONER
 COLUSA COUNTY DEPARTMENT OF AGRICULTURE 2011 CROP REPORT JOSEPH J. DAMIANO AGRICULTURAL COMMISSIONER COLUSACOUNTY DEPARTMENT OF AGRICULTURE JOSEPH J. DAMIANO AGRICULTURAL COMMISSIONER/SEALER OF WEIGHTS
D. Abate 1, B. Tassew 1, A. Zeleke 1, A. Kedu 1 and J. Wamatu 2. International Center for Research in Dry Areas
 Characterization of the farming and livestock production systems and the potential to enhance livestock productivity through improved feeding in Alloshe, Goba District, Bale Highlands, Ethiopia D. Abate
6. Agriculture and Environment. Agriculture Environment Energy and Water
 6. Agriculture and Environment Agriculture Environment Energy and Water 245 6. Agriculture and Environment This section presents detailed statistics about agriculture and the environment providing major
Integrated farming system for Helmand province, Afghanistan
 ISSN: 2455-5746 Impact Factor: RJIF 5.34 www.alleducationjournal.com Volume 2; Issue 5; September 2017; Page 62-67 Integrated farming system for Helmand province, Afghanistan Ali Ahmad, Dinesh Kumar, Naqibullah
REGIONAL WHEAT MARKET FUNDAMENTALS Central Asia. November 2016 WHEAT CONSUMPTION AND PRODUCTION IN CENTRAL ASIA
 kg/capita/year kg/capita/year REGIONAL WHEAT MARKET FUNDAMENTALS Central Asia November 2016 WHEAT CONSUMPTION AND PRODUCTION IN CENTRAL ASIA Wheat is by far the dominant staple in the Central Asia region
Missouri Commodity, Labor, and Land Values. Historical Summary and. Seasonal Trends
 Missouri Commodity, Labor, and Land Values Historical Summary and Seasonal Trends Winter 2000 Agricultural Commodity & Land Prices Reference Information This information has been put together as a reference
Chapel Hill Farmers' Market NEW MEMBERSHIP APPLICATION PACKET ( )
") INSTRUCTIONS FOR APPLICATION PROCESS Thank you for your interest in becoming a Member of the Chapel Hill Farmers' Market. We are now accepting vendor applications for the 2018-2019 season for the Saturday
INSTRUCTIONS FOR APPLICATION PROCESS Thank you for your interest in becoming a Member of the Chapel Hill Farmers' Market. We are now accepting vendor applications for the 2018-2019 season for the Saturday
Sreedhar Patil 5/30/2013
 Farming in India Sreedhar Patil 5/30/2013 Location of India in World Map States in India Bangalore, Karnataka, INDIA 28 states and seven union territories Annual Rainfall in India Rivers in India River
Agricultural CROP REPORT. Yolo County
 Agricultural CROP REPORT Yolo County 1957 County of Yolo P.O. BOX 175 WOODLAND, CALIFORNIA 95695 (916) 666-8261 CHAS. H. HARDY COUNTY AGRICULTURAL COMMISSIONER SEALER OF WEIGHTS AND MEASURES The Honorable
F. Agricultural Marketing
 F. Agricultural Marketing Proceeds from the sale of agricultural produce continue to be the major source of income for farmers across the country. Oranges, apples, potato, cardamom, and vegetables are
Agricultural Producers. Price Index. Hotel Price Index
 Agricultural Producers Price Index Hotel Price Index 1 April 2018 Release date: June 2018 Briefing This publication provides an analysis of the results of the Agriculture Producer Price Index (APPI) for
AGRICULTURAL OVERVIEW
 Regional District of Central Okanagan CONTENTS Corporate Name Date of Incorporation August 24, 1967 Postal Address 1450 KLO Road, Kelowna, BC, V1W 3Z4 Phone (250) 763-4918 Fax (250) 763-0606 E-mail Internet
Crossroads Resource Center
 Crossroads Resource Center Tools for Community Self-determination 7415 Humboldt Ave. S. / Minneapolis, Minnesota 55423 / 612.869.8664 kmeter@crcworks.org www.crcworks.org Sarasota County, Florida Local
Reducing Post-Harvest Losses in TURKEY 13 OCTOBER 2016 ANKARA
 Reducing Post-Harvest Losses in TURKEY 13 OCTOBER 2016 ANKARA 1 Context 1. Introduction 2. Post Harvest Losses 3. Assessment of Food Loss and Waste for Turkey 4. Policies and Precuations to Reduce Post-
New Brunswick Census of Agriculture Graphs October 2017
 New Brunswick Census of Agriculture Graphs 216 October 217 New Brunswick Census of Agriculture Report 216 Province of New Brunswick P.O. Box 6, Fredericton NB E3B 5H1 CANADA www.gnb.ca Printed English
Understanding competitiveness concept to increase export June 2017, IAMO, Hale
 Export driven competitiveness in Europa and Central Asia Understanding competitiveness concept to increase export Goran Zivkov June 217, IAMO, Hale Jan Jun Nov Apr Sep Feb Jul Dec May Oct Mar Aug Jan Jun
Oregon County and S ate Agricultural Estimates
 I 5 5 01984 ("t) 01 CtkP.er ke)0 P I `49.s 14 g6 a IP) Oregon County and S ate Agricultural Estimates Special Report 726 January 1985 Oregon State University Extension Service AGRICULTURAL COMMODITY SALES
Prepared by Mark Bell, Amanda Crump, Nick Madden and Maria Paz Santibanez 2012 For more information visit: International Programs ip.ucdavis.
 Cropping 101 Prepared by Mark Bell, Amanda Crump, Nick Madden and Maria Paz Santibanez 2012 For more information visit: International Programs ip.ucdavis.edu This overview provides summaries of 1. Key
ECOROST ТЕL.: +7 (4912) LIQUID HUMIC FERTILIZER
 LIQUID HUMIC FERTILIZER") RECOMMENDATIONS ON THE USE OF IN CROP GROWING ТЕL.: +7 (4912) 51-18-59 LIQUID HUMIC FERTILIZER EKOROST.RU.RZN@YANDEX.RU CETRUE AND PULSE CROPS Wheat, rye, barley, oats +10 L of 400 ml of per of 1. The
RECOMMENDATIONS ON THE USE OF IN CROP GROWING ТЕL.: +7 (4912) 51-18-59 LIQUID HUMIC FERTILIZER EKOROST.RU.RZN@YANDEX.RU CETRUE AND PULSE CROPS Wheat, rye, barley, oats +10 L of 400 ml of per of 1. The
D. Abate 1, B. Tasswe 1, A. Zeleke 1, A. Kedu 1 and J. Wamatu 2. International Center for Research in Dry Areas
 Characterization of the farming and livestock production systems and the potential to enhance livestock productivity through improved feeding in Nake, Gasera District, Bale Highlands, Ethiopia D. Abate
1. LEGAL STATUS OF THE FARM (to confirm, write ``x``)
") 69 1 LEGAL STATUS OF THE FARM (to confirm write ``x``) 1 LEGAL PERSON 3 FAMILY FARM (OPG) 2 FARM INFORMATION (to confirm write ``x``) 4 Farm is no longer engaged in agricultural production 8 Other (out
69 1 LEGAL STATUS OF THE FARM (to confirm write ``x``) 1 LEGAL PERSON 3 FAMILY FARM (OPG) 2 FARM INFORMATION (to confirm write ``x``) 4 Farm is no longer engaged in agricultural production 8 Other (out
Irrigation Scheduling
 Irrigation Scheduling Order No. 577.100-11 October 2011 AGRICULTURE IRRIGATION SCHEDULING CALCULATOR The Agriculture Irrigation Scheduling Calculator (AISC) is a water management tool to assist producers
Adding Value with Horticulture Farming
 Adding Value with Horticulture Farming Patrick Byers Regional Horticulture Specialist University of Missouri Extension 417-881-8909 byerspl@missouri.edu Outline Introduction Inventory your resources Determine
IRAN AGRI TRADE PROSPECRIVE DEC. 7, 2014
 IRAN AGRI TRADE PROSPECRIVE DEC. 7, 2014 Iran in 2050 GDP: ~$ 987.1 trillion (2013 est.) GDP per Capita: $9,207 GDP per Capita (PPP): $12,986 GDP Growth: -1.5% (2013 est.) Inflation(CPI): 42.3% (February
MONITORING PRODUCTIVITY OF WATER IN AGRICULTURE AND INTERACTING SYSTEMS: THE CASE OF TEKEZE/ATBARA RIVER BASIN IN ETHIOPIA
 MONTORNG PRODUCTVTY OF WATER N AGRCULTURE AND NTERACTNG SYSTEMS: THE CASE OF TEKEZE/ATBARA RVER BASN N ETHOPA By: M. Behailu &Nata T. Mekelle University. P.D.Box 231, Mekelle, Ethiopia Tafesse24603@yahoo.com
5.2.1 Forage Production and Feeding Situation Types of forages used
 31 5.2.1 Forage Production and Feeding Situation The following tables summarise the use of different types of feedstuff, their source (on farm production or purchase), preferences of use and sufficiency
PRICE INDICES IN AGRICULTURE, THIRD QUARTER OF
 PRICE INDICES IN AGRICULTURE, THIRD QUARTER OF 2017 1 Producer price indices in agriculture The producer price index in agriculture in the third quarter of 2017 increased by 3.6% in comparison with the
2017 COLUSA COUNTY CROP REPORT
 2017 COLUSA COUNTY CROP REPORT Table of Contents 2 Agricultural Commissioner's Letter 3 Staff 4 Apiary Products / Organic Production 5 Fruit & Nut Crops / Vegetable Crops 6 Field Crops 7 Rice Totals Graph
Bulletin No October 18, Broadway, Suite 900 Oakland, CA Fax
 WCIRB Bulletin Bulletin 2017-21 October 18, 2017 1221 Broadway, Suite 900 Oakland, CA 94612 415.777.0777 Fax 415.778.7007 www.wcirb.com wcirb@wcirb.com Revised Standard Endorsement Form Farm Schedule Endorsement
Production, Purchase, Sale, and
 'Coto CIRCULAR 81 NOVEMBER 1939 Production, Purchase, Sale, and Use of Specified Foods on Alabama Farms By BUIS T. INMAN AGRICULTURAL EXPERIMENT STATION OF THE ALABAMA POLYTECHNIC INSTITUTE M. J. FUNCHESS,
Farm Eligibility Table. Fire & Allied. Classification. FL/GL Auto
 Animal - General Farms, Primarily Livestock and Animal Specialties - general animal specialty and livestock farms; general livestock and animal specialty farms. See also - (Animal Specialty)/(Livestock)/
Payment details: 2018 Midweek Market Vendor Application
 PLEASE NOTE NEW ADDRESS: Tower Grove Farmers Market P.O. BOX 6117, St Louis, MO 63139 Tel. (314) 319-9696 erin@tgfarmersmarket.com www.tgfarmersmarket.com Payment details: ( ) Record & Calendar ( ) Confirmation
Lesson 42. Agriculture in Texas TEXAS ALMANAC TEACHERS GUIDE. Principal Crops Vegetable Crops Fruits & Nuts. A mature wheat field in Texas.
 Lesson 42 TEXAS ALMANAC TEACHERS GUIDE Agriculture in Texas Principal Crops Vegetable Crops Fruits & Nuts Social Studies TEKS 4-6, 8, 11, 12, 21, 22, 23 7-7, 8, 9, 12, 21, 22, 23 8-14, 29, 30 STAAR 4,
RUCHI. Submitted to. Gender Analysis. for. PF1/290 Baddi Township Integrated Water Project. in Himachal Pradesh, India
 Gender Analysis for PF1/290 Baddi Township Integrated Water Project in Himachal Pradesh, India Submitted to RUCHI Study Conducted and Submitted by Table of Contents Introduction 3 The Activity 3 Profile
National Drought Management Authority (Nyeri) COUNTY DROUGHT EARLY WARNING BULLETIN FOR DECEMBER 2018
 COUNTY DROUGHT EARLY WARNING BULLETIN FOR DECEMBER 2018") National Drought Management Authority (Nyeri) COUNTY DROUGHT EARLY WARNING BULLETIN FOR DECEMBER 2018 DECEMBER 2018 EWS PHASE Drought Situation & EW Phase Classification Biophysical Indicators The month
National Drought Management Authority (Nyeri) COUNTY DROUGHT EARLY WARNING BULLETIN FOR DECEMBER 2018 DECEMBER 2018 EWS PHASE Drought Situation & EW Phase Classification Biophysical Indicators The month
Feed Assessment Tool (FEAST) individual farmer interview questionnaire
 individual farmer interview questionnaire") ILRI Contact Information Feed Assessment Tool (FEAST) individual farmer interview questionnaire Location / Community: Date of Interview: Interview Respondent: FEAST Facilitator: Version: 15 Dec 2015 2015
ILRI Contact Information Feed Assessment Tool (FEAST) individual farmer interview questionnaire Location / Community: Date of Interview: Interview Respondent: FEAST Facilitator: Version: 15 Dec 2015 2015
2012 Farm Outlook. Highlights
 2012 Farm Outlook Office of the Chief Economist USDA Highlights A promising spring planting was followed by historic drought. Record high commodity prices followed. Farm incomes are expected to be near
regon Agricultural Commodities
 I regon Agricultural Commodities Farm Values and Processed Values H Extension Service and Agricultural Experiment Station, Oregon State University Our cover: For this edition, we feature Oregon green snap
Payment details: 2018 Saturday Market Vendor Application
 PLEASE NOTE NEW ADDRESS: Tower Grove Farmers Market P.O. BOX 6117, St Louis, MO 63139 Tel. (314) 319-9696 erin@tgfarmersmarket.com www.tgfarmersmarket.com Payment details: ( ) Record & Calendar ( ) Confirmation
Turkey s Agricultural Sector
 Turkey s Agricultural Sector Agritech Mee5ng, London November 17, 2016 Gokhan Ozertan Bogazici University, Turkey 1 OECD Report (2011) World s 7th largest agricultural producer Has 24 million hectares
Colusa County Department of Agriculture Crop Report. Harry A. Krug Agricultural Commissioner
 Colusa County Department of Agriculture 2001 Crop Report Harry A. Krug Agricultural Commissioner The 2001 Colusa County Crop Report is dedicated to Robert E. Herkert in memory of his untimely passing on
Oregon State University Extension Service. 71 refl.), ITO :OP. UnbountliqP nr1 not circulate
, ITO :OP. UnbountliqP nr1 not circulate") 05 UnbountliqP nr1 not circulate 71 refl.), ITO :OP. Analytics 1988 Oregon County and State Agricultural Estimates Special Report 790 / Revised January 1989 Oregon State University Extension Service AGRICULTURAL
05 UnbountliqP nr1 not circulate 71 refl.), ITO :OP. Analytics 1988 Oregon County and State Agricultural Estimates Special Report 790 / Revised January 1989 Oregon State University Extension Service AGRICULTURAL
Rural NYS II. Agriculture. Farmland in NYS. Top AgCounties (receipts) Grape Regions. Pumpkins. New York is an Agricultural State
 Grape Regions. Pumpkins. New York is an Agricultural State") Farmland in NYS Rural NYS II Agriculture Prof. Anthony Grande AFG 2012 New York is an Agricultural State Top AgCounties (receipts) NATIONAL RANK COMMODITY 26 Tot. Value, Agric Products 2 Pumpkins 2 Apples
Farmland in NYS Rural NYS II Agriculture Prof. Anthony Grande AFG 2012 New York is an Agricultural State Top AgCounties (receipts) NATIONAL RANK COMMODITY 26 Tot. Value, Agric Products 2 Pumpkins 2 Apples
Agricultural Regions
 Agricultural Regions Derwent Wittlesey s 11 Agricultural Regions Images: https://commons.wikimedia.org/wiki/file:agricultural_map_by_whittlesey,_d.s.png Agriculture in the Developing World 5 types Poorer
Background Data and Related Information on the Outlook for California Agriculture. April 2005
 Background Data and Related Information on the Outlook for California Agriculture April 25 Daniel A. Sumner and Henrich Brunke University of California Agricultural Issues Center California Cash Receipts
2/11/2015. Noninsured Crop Disaster Assistance Program for 2015 and Subsequent Crop years
 Noninsured Crop Disaster Assistance Program for 2015 and Subsequent Crop years 1 NAP Overview Reauthorized by the 2014 Farm Bill Provides financial assistance to producers of noninsurable crops to protect
Table 70. Summary by Tenure of Operators: 1998
 Summary by Tenure of Operators: 1998 FARMS AND LAND IN FARMS Farms number 19 951 15 620 2 207 2 124 Land in farms cuerdas 865 478 457 786 246 494 161 198 Average size of farm cuerdas 43.4 29.3 111.7 75.9
California s International Agricultural Exports in 2004
 University of California Number 30 November 2005 Agricultural Issues Center AIC Issues Brief California s International Agricultural Exports in 2004 In 2004 California s agricultural exports surpassed
Lecture 7: Anaerobic digestion of energy crops: European case studies - Italy -
 Lecture 7: Anaerobic digestion of energy crops: European case studies - Italy - David Bolzonella Jyvaskyla Summer School 2013 1 Source Biogas Barometer Eurobserv er Dec 2012 Jyvaskyla Summer School 2013
SNNPR Livelihood Profile
 SNNPR Livelihood Profile May 2005 1 Zone Description The is a cash crop area where household cash incomes are high and food production is relatively low. It is a food secure area of SNNPR that attracts
Vulnerability and Adaptation of Rainfed-Rice Farmers to Impact of Climate Variability in Songkhone District, Savanakhet Province, Lao PDR
 Vulnerability and Adaptation of Rainfed-Rice Farmers to Impact of Climate Variability in Songkhone District, Savanakhet Province, Lao PDR By Somkhit BOULIDAM Main Advisor: Prof. Sansanee Choowaew, Ph.D
Interim Update on the Economic Impact of Michigan s Agri-Food and Agri-Energy System
 Interim Update on the Economic Impact of Michigan s Agri-Food and Agri-Energy System H. Christopher Peterson, Director William Knudson, Product Market Economist MSU Product Center for Agriculture and Natural
Provincial profile for. - Wardak -
 Provincial profile for - Wardak - 1. Natural resources Wardak province has less mineral and forests but enough water resources. Minerals such as gems and marble are found the mountains of provincial centre
Crop Statistics in Germany
 Crop Statistics in Germany Follow up regional workshop on crop statistics Zagreb, 17 18 April 2008 Ute Walsemann Head of Subdivision Land use and Crop statistics Federal Statistical Office of Germany Federal
ANNEXES. to the Proposal for a REGULATION OF THE EUROPEAN PARLIAMENT AND OF THE COUNCIL
 EUROPEAN COMMISSION Brussels, 9.12.2016 COM(2016) 786 final ANNEXES 1 to 5 ANNEXES to the Proposal for a REGULATION OF THE EUROPEAN PARLIAMENT AND OF THE COUNCIL on integrated farm statistics and repealing
Pasture Monitoring. Charles Fletcher Edgewood Dairy Purdy, Missouri
 Pasture Monitoring Charles Fletcher Edgewood Dairy Purdy, Missouri Why do we use grass? Dairy feed--- 15 cents/lbs/dm Alfalfa hay--- 9 cents/lbs/dm Corn silage--- 7 cents/lbs/dm Pasture--- 3 cents/lbs/dm
Netherlands Training Placements 2017
 Dairy farming Dairy (milk cows) breeding and propagation of ornamental flowers ; modern company Arable and Field vegetables production Biological arable farming and field vegetable prod Dairy Biological
CHAPTER 6: Irrigation scheduling
 Pressurized Irrigation Techniques 6.1 CHAPTER 6: Irrigation scheduling Irrigation scheduling is one of the factors that influence the agronomic and economic viability of small farms. It is important for
2018 Farmers Markets Price Reports
 8 Farmers Markets Price Reports Plymouth Farmers Market Orlando Rodriguez and Ariana Torres This publication provides the results of a project conducted by the Horticulture Business Extension Program at
PRICES OF COMMODITY PRODUCTS
 PRICES OF COMMODITY PRODUCTS The gross farm value of the commodities reported in the parish tables was computed based upon estimated annual per-unit prices. The state average prices listed below were used
Central Asian Seed Association
 Central Asian Seed Association Established in 2007 by Seed Association of Kyrgyzstan ( SAK)- 153 members and Seed Association of Tajikistan ( SAT)- 40 members. Kazakh Seed Association ( 25 members) has
Insights from USDA on Improving the ESA-Pesticide Consultation Process
 Insights from USDA on Improving the ESA-Pesticide Consultation Process Sheryl H. Kunickis, Ph.D. Harold Coble, Ph. D. David Epstein, Ph. D. USDA Office of Pest Management Policy (OPMP) American Chemical
The Status of Alabama Agriculture
 SPECIAL LEAFLET DECEMBER 1940 The Status of Alabama Agriculture A By M. J. FUNCHESS, Director Alabama Experiment Station LABAMA is largely a rural state with approximately onehalf the population living
National Drought Management Authority
 National Drought Management Authority KAJIADO COUNTY DROUGHT MONITORING AND EARLY WARNING SEPTEMBER 2018 SEPTEMBER EW PHASE Drought Situation & EW Phase Classification Biophysical Indicators Vegetation
In 2003 California s agricultural exports increased 14
 University of California Number 28 December 2 0 0 4 Agricultural Issues Center AIC Issues Brief California s International Agricultural Exports in 2003 José E. Bervejillo and Daniel A. Sumner In 2003 California
Step 1: Get Started - Farmer Self-Assessment
 Step 1: Get Started - Farmer Self-Assessment The following questions are designed to help you determine your interest and ability to market your food products to local schools. This information is not
Step 1: Get Started - Farmer Self-Assessment
 Step 1: Get Started - Farmer Self-Assessment The following questions are designed to help you determine your interest and ability to market your food products to local schools. This information is not
Market opportunities for Queensland agribusiness from FTAs with China, Japan and South Korea. Queensland Production
 Market opportunities for Queensland agribusiness from FTAs with China, Japan and South Korea Queensland Production Scope Australia recently signed Free Trade Agreements (FTAs) with China (June 2015), Japan
Afghanistan Pre-Harvest Assessment 2015 Preliminary Findings
 Afghanistan Pre-Harvest Assessment 2015 Preliminary Findings Ministry of Agriculture, Irrigation and Livestock (MAIL) Famine Early Warning System Network (FEWS NET) United Nations World Food Program (WFP)
Table 10: U.S. AGRICULTURAL IMPORTS FROM CANADA, 1995 AND 1996
 Table 10: U.S. AGRICULTURAL IMPORTS FROM CANADA, 1995 AND 1996 Canada Canada Commodity / Calendar year Jan.- Jan. Jan.- Jan. Jan.- Jan. Jan.- Jan. Change from Change from Share of total Share of total
Syrian Arab Republic Crop and Food Security Assessment Mission
 Wo r k i n g t o g e t h e r t o s a v e l i v e s a n d l i v e l i h o o d s Syrian Arab Republic Crop and Food Security Assessment Mission May 2017 Methodology Meetings in Damascus Ministries Agriculture
ANALYSIS OF THE SEED MARKET IN AFGHANISTAN
 Strengthening National Seed Production Capacity in Afghanistan GCP/AFG/018/EC ANALYSIS OF THE SEED MARKET IN AFGHANISTAN Sam Kugbei Senior Technical Adviser, GCP/AFG/018/EC and Shahabuddin Shahab FAO Consultant
Table 8: U.S. AGRICULTURAL IMPORTS FROM MEXICO, 1995 AND 1996
 Table 8: U.S. AGRICULTURAL IMPORTS FROM MEXICO, 1995 AND 1996 Mexican Mexican Commodity / Calendar year Jan.- Jan. Jan.- Jan. Jan.- Jan. Jan.- Jan. Change from Change from Share of total Share of total
Identifying Investment Priorities for Malawian Agriculture
 Identifying Investment Priorities for Malawian Agriculture Rui Benfica (IFAD) and James Thurlow (IFPRI) Presentation to the Ministry of Agriculture, Irrigation and Water Development Lilongwe, 8 February
By: Jane Kugonza, Ronald Wabwire, Pius Lutakome, Ben Lukuyu and Josephine Kirui
 Characterisation of the livestock production system and potential for enhancing productivity through improved feeding in Kiryandongo Dairy Farmers Business Association in Kiryandango district of Uganda.
AgriStability GUIDE FOR REPORTING PRODUCTIVE UNITS FOR 2013
 This guide contains all the information you need to report productive units for the 2013 participation year. Guide for Reporting Productive Units... p. 3 List of Productive Units... p. 10 AgriStability
California s International Agricultural Exports in 2002
 University of California Number 3 November 0 0 3 Agricultural Issues Center AIC Issues Brief California s International Agricultural Exports in 00 José E. Bervejillo and Daniel A. Sumner The value of California
Country Report. Nepal. The 1 st Annual Meeting on the Asian Pacific Network for Testing of Agricultural Machinery (ANTAM)
") Country Report Nepal The 1 st Annual Meeting on the Asian Pacific Network for Testing of Agricultural Machinery (ANTAM) 16-19 September 2014 Beijing, China Shreemat Shrestha, Chief, Agricultural Engineering
Country Report Nepal The 1 st Annual Meeting on the Asian Pacific Network for Testing of Agricultural Machinery (ANTAM) 16-19 September 2014 Beijing, China Shreemat Shrestha, Chief, Agricultural Engineering
FARMING PRACTICES SURVEY (FPS): MCC-ARMENIA. USER S GUIDE FOR PUBLIC DATASET January 2010
: MCC-ARMENIA. USER S GUIDE FOR PUBLIC DATASET January 2010") FARMING PRACTICES SURVEY (FPS): 2007-2008 MCC-ARMENIA USER S GUIDE FOR PUBLIC DATASET January 2010 CONTENTS SURVEY OVERVIEW 3 BASIC INFORMATION 4 SECTION A. LAND AND LIVESTOCK 5 SECTION B. CROPS GROWN
FARMING PRACTICES SURVEY (FPS): 2007-2008 MCC-ARMENIA USER S GUIDE FOR PUBLIC DATASET January 2010 CONTENTS SURVEY OVERVIEW 3 BASIC INFORMATION 4 SECTION A. LAND AND LIVESTOCK 5 SECTION B. CROPS GROWN
Unit F: Harvesting Fruits and Nuts. Lesson 3: Market Fruits and Nuts
 Unit F: Harvesting Fruits and Nuts Lesson 3: Market Fruits and Nuts 1 Terms marketing mix marketing channel vertical integration 2 I. Marketing fruit products is a very strategic action that will result
LIVELIHOODS ZONING PLUS ACTIVITY IN EL SALVADOR
 LIVELIHOODS ZONING PLUS ACTIVITY IN EL SALVADOR A SPECIAL REPORT BY THE FAMINE EARLY WARNING SYSTEM NETWORK (FEWS NET) March 2010 The authors views expressed in this publication do not necessarily reflect
DETAILED PROJECT REPORT OF IWMP-II (NICHAR-WATERSHED) DEVELOPMENT BLOCK NICHAR DISTRICT KINNAUR (Himachal Pradesh) VOLUME-I
 DEVELOPMENT BLOCK NICHAR DISTRICT KINNAUR (Himachal Pradesh) VOLUME-I") DETAILED PROJECT REPORT OF IWMPII (NICHARWATERSHED) DEVELOPMENT BLOCK NICHAR DISTRICT KINNAUR (Himachal Pradesh) VOLUMEI DEPARTMENT OF RURAL DEVELOPMENT Shimla171009, Himachal Pradesh 200910 DETAILED PROJECT
DETAILED PROJECT REPORT OF IWMPII (NICHARWATERSHED) DEVELOPMENT BLOCK NICHAR DISTRICT KINNAUR (Himachal Pradesh) VOLUMEI DEPARTMENT OF RURAL DEVELOPMENT Shimla171009, Himachal Pradesh 200910 DETAILED PROJECT
National Drought Management Authority LAMU COUNTY DROUGHT EARLY WARNING BULLETIN FOR JANUARY 2016
 National Drought Management Authority LAMU COUNTY DROUGHT EARLY WARNING BULLETIN FOR JANUARY 2016 January EW PHASE Early Warning Phase Classification Drought Situation & EW Phase Classification Biophysical
Decadal Shift in Cropping Pattern in Karnataka Research Report July 2016
 Karnataka Agriculture Price Commission Decadal Shift in Cropping Pattern in Karnataka Research Report July 2016 This is a comprehensive analysis of the shift in the area of agriculture & horticulture crops
SUSTAINABLE AND REGENERATIVE AGRICULTURE IN BABATI - TANZANIA
 SUSTAINABLE AND REGENERATIVE AGRICULTURE IN BABATI - TANZANIA Presentation at International Conference on Soils and the Food we Eat BERAS International, Södertälje, Sweden By C.B. KAVISHE Agriculture in
PLANT ENTERPRISES PRODUCTION
 s COTTON Lint - Non-irrigated 11,539.0 910.00 10,500,490 lbs. $5,460,255 Seed - Non-irrigated 11,539.0 1,456.00 16,800,784 lbs. $924,043 Cotton () 9 11,539.0 $6,384,298 FORESTRY Pulpwood Hardwood 44,476
PROJECTED COSTS FOR SELECTED LOUISIANA VEGETABLE CROPS SEASON
 2007 Projected Commodity Costs And Returns Louisiana Vegetable Crops Roger A. Hinson and James E. Boudreaux Farm Management Research & Extension Department of Agricultural Economics & Agribusiness A.E.A.
VENDOR APPLICATION (Please complete all 3 pages) Taxes: Please circle the options that applies to you:
 Taxes: Please circle the options that applies to you:") VENDOR APPLICATION (Please complete all 3 pages) Please Clearly Print the following information: Contact Person Name: Farm/ Business Name (if applicable): Address: City, State, Zip: Phone (Home): Phone
VENDOR APPLICATION (Please complete all 3 pages) Please Clearly Print the following information: Contact Person Name: Farm/ Business Name (if applicable): Address: City, State, Zip: Phone (Home): Phone