|
|
|
- Paula Young
- 6 years ago
- Views:
Transcription
1
2 Epistasis in Association Studies David Evans
3

4 Law of Independent Assortment
5 Biological Epistasis Bateson (99) a masking effect whereby a variant or allele at one locus prevents the variant at another locus from manifesting its effect Phenotypic differences among individuals with various genotypes at one locus depend on their genotypes at other loci Does NOT depend on allele frequency


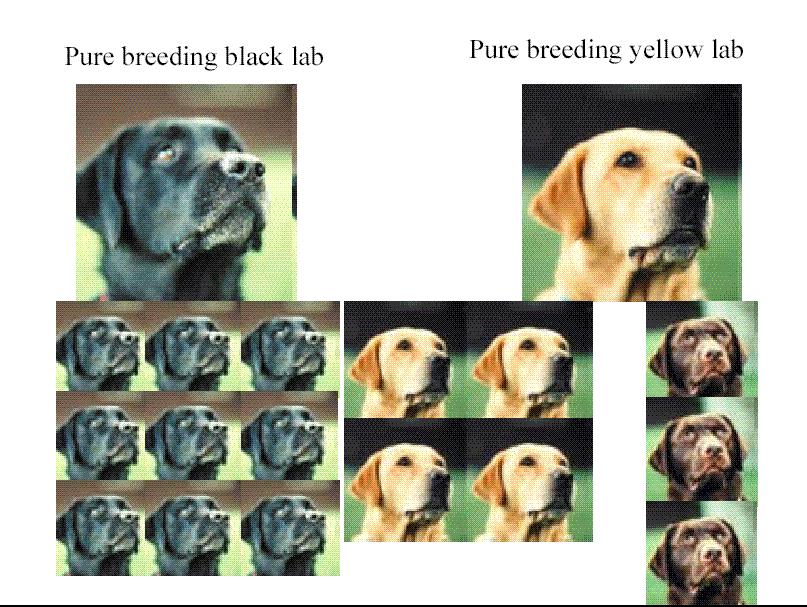
6 Epistasis in the labrador retriever dog
7

8 Recessive Epistasis B = Black b = brown E/e = gold locus
9 Statistical Epistasis Deviation of multilocus genotypic values from the additive combination of the single locus components Close to statistical concept of interaction Depends on allele frequencies Population specific May be scale dependent Different ways the epistatic values/variance components can be calculated: Hierarchical ANOVA (Sham, 998) Method of Contrasts (Cockerham, 954) Using partial derivatives of the population mean (Kojima, 959; Tiwari & Elston, 997)
10 No Epistasis Effect at locus B independent of effect at Trait Value AA Aa aa BB Bb bb
11 Epistasis Two Loci modifies the effect at locus B Trait Value AA Aa aa BB Bb bb
12 Genetic Variance One Locus AA Aa aa Genotypic Mean Y AA Y Aa Y aa Frequency f AA f Aa f aa f i Y i i AA, Aa, aa 2 A D f i i AA, Aa, aa ( Y ) i 2 2 A 2 D 2 f A fa[ f A( YAA YAa ) fa ( YAa Yaa )] f 2 A f 2 a ( YAA 2YAa Yaa ) 2 2
13 Partitioning the Variance One Locus aa Aa AA aa Aa AA 2 2 Additive Model Dominant Model Additive Genetic Variance is variance explained by regression Dominance variance is residual variance not explained by regression
14 Least Squares Regression One Locus Represent genotypes of each individual by indicator variables: Additive Coefficient Additive and Dom Coefficient Genotype X X Z aa - - -½ Aa ½ AA -½ Can provide tests of significance Y = µ + a X + d Z + ε Fit by least squares (or maximum likelihood) Partitions data into variance components
15 Genetic Variance Two Loci BB Bb bb AA Aa aa Y AABB f AABB Y AABb f AABb Y AAbb Y AaBB f AaBB Y AaBb f AaBb Y Aabb Y aabb f aabb Y aabb f aabb Y aabb A { AA, Aa, aa} B { BB, Bb, bb} 2 G i A i A j B j B f ij Y f ij ij ( Y ) ij 2 f AAbb f Aabb f aabb 2 I 2 G 2 A D
16 Components of Variance for a Two Locus Model Additive genetic variance Locus Additive genetic variance Locus 2 Dominance genetic variance Locus Dominance genetic variance Locus 2 Additive x Additive genetic variance Additive x Dominance genetic variance Dominance x Additive genetic variance Dominance x Dominance genetic variance Epistatic Variance
17 Additive Variance A Dominance Variance A Additive Var iance at locus A Dominance Var iance at locus A Var iance p(b) Varian ce p( B ) BB Bb bb p(a) p( A ) AA Additive Variance B Dominance Variance B Additive Var iance at locus B.2 Dominance Var iance at locus B.2 Aa Varian ce p( B ) Varian ce p( B ) aa p( A ) p( A ) Additive x Additive Additive x Dominant Dominant x Additive Dominant x Dominant Additive x Additive Var iance Additive x Dominance Var iance Additive x Dominance Var iance Domi nance x Domi nance V ar i ance E E E E E- Varian ce Varian ce Varian ce Varian ce. E E E p( B ) p( B ) p( B ) 4.E-2 2.E-2.E+.6 p( B ) p( A ) p( A ) p( A ) p( A )
18 Least Squares Regression Two Loci Y = µ + a X + a 2 X 2 + d Z + d 2 Z 2 + i aa w aa + i ad w ad + i da w da + i dd w dd + ε if AA if BB x = if Aa x 2 = if Bb - if aa - if bb z = ½if Aa -½ otherwise z 2 = ½if Bb -½ otherwise w aa = x x 2 w ad = x z 2 w da = z x 2 w dd = z z 2 Can also formulate using logistic regression for dichotomous traits
19 Why model Epistasis in GWAS? Epistasis is important in model organisms c.f. Studies in Guinea fowl, yeast, drosophila Single locus tests will not always detect epistasis!!! Modeling epistasis may improve power to detect loci (?) Epistasis is ignored in human studies -Main effects hard enough to find! -Multiple testing problem: e.g., markers gives a cutoff of p = x -!!! -Computational problems -Storage problems
20
21 Epistasis in GWAS? What are the consequences of fitting two locus models when epistasis is absent? - If it isn t there, what happens if we go looking for it? What are the consequences of fitting two locus models when epistasis is present? - If it IS there, what happens if we go looking for it? What are the consequences of fitting single locus models when epistasis is present? - If it s there, what happens when we ignore it?
22 Simulate quantitative variable METHOD -BOTH loci combined are responsible for %, 5%, 2% or % of total variance -5, or 2 individuals -Assume, markers across the genome -Perfect LD between marker and trait locus -Comprehensive range of allele frequencies at both loci -5 different models incorporating varying degrees of epistasis
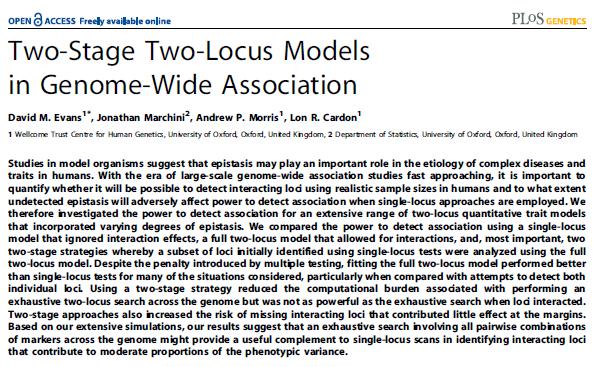
23 MA ¾ ½ ¾½¼ ½¼ M M2 M3 M5 M7 M M M2 M3 M4 M5 M6 M7 M8 M9 M2 M23 M26 M27 M28 M29 M3 M4 M4 M42 M43 M45 M56 M57 M58 M59 M6 M68 M69 M7 Evans et al. (26) PLOS Genet M78 M84 M85 M86 M94 M97 M98 M99 M M6 M8 M3 M4 M7 M86
24 CONTROL LESS FREAKY WAY FREAKY Additive Trait Mean.5 Complimentary Gene Action Trait Mean.5 Modifying Effects Trait Mean.5 AA Aa aa bb Bb Locus B BB AA Aa aa bb Bb Locus B BB AA Aa aa bb Bb Locus B BB Additive Trait Mean.5 AA Aa aa bb Bb Locus B BB Dominant x Dominant Complimentary Gene Action Trait Mean.5 AA Aa aa bb Bb Locus B BB D x D Epistasis Trait Mean.5 AA Aa aa bb Bb Locus B BB Dominant Trait Mean.5 AA Aa aa bb Bb Locus B BB Dominant x Recessive Complimentary Gene Action Trait Mean.5 AA Aa aa bb Bb Locus B BB XOR Trait Mean.5 AA Aa aa bb Bb Locus B BB Heterozygote Advantage Trait Mean.5 AA Aa aa bb Bb Locus B BB Threshold Model Trait Mean.5 AA Aa aa bb Bb Locus B BB Chequer Board Trait Mean.5 AA Aa aa bb Bb Locus B BB
25 Genetic Model Simulating Genetic Data Allele frequencies -Allele frequencies at each locus will determine frequency of genotypes p AA =.64 p A =.8 p Aa =.32 p a =.2 p aa =.4 -Need to specify trait means for each genotype combination Complimentary Gene Action Trait Mean.5 -A random normal deviate can then be placed on these means to simulate the action of the environment Each combination of parameters will result in a unique variance profile AA Aa aa bb Bb BB Locus B
26 Simulating Genetic Data Complimentary Gene Action.9 Trait Mean.5 AA Aa aa bb Bb BB Locus B Additive Variance Locus Additive Variance Locus Dominance Variance Locus Dominance Variance Locus Epistatic Variance Components (Variance components shown for complimentary gene action model)
27 METHOD Quantify power to detect association -, simulations for each combination of parameters Single locus test of association -Power to detect BOTH loci -Power to detect EITHER locus Two locus test of association -Power to detect BOTH loci -Different from power to detect the epistatic variance component explicitly All models fit via maximum likelihood -Significance assessed by minus two log-likelihood chi-square
28 Epistasis Isn t There Two Locus Test Power to Detect EITHER Locus Single Locus Test Power to Detect BOTH Loci Single Locus Test Power Allele Frequency.4.7 Allele Frequency Locus B (Simulations represent 5 individuals, % genetic variance, Additive Model) The power to detect EITHER locus is greater using the single locus test when epistasis is NOT present The power to detect BOTH loci is actually less using single locus tests even when epistasis is NOT present
29 Epistasis IS There The power to detect BOTH loci is always better using the two locus test when epistasis is present Two Locus Test Power to Detect BOTH Loci SINGLE Locus Tests Power Power Allele Frequency.4 Allele Frequency Locus B Allele Frequency.4 Allele Frequency Locus B (Simulations represent 5 individuals, % genetic variance, Dominant x Dominant Complimentary Gene Action Model)
30 Power To Detect EITHER Locus When the model is EXTREME, the power of the two locus test is often better than the power to detect EITHER locus using single locus tests Model Two Locus Test Power to detect EITHER locus SINGLE Locus Tests Dominant x Dominant Epistasis Trait Mean.5 Power Power AA Aa aa BB bb Bb Locus B AF Locus B Allele Frequency (5 individuals, % genetic variance)
31 Power to Detect EITHER Locus When the model is less extreme, the power to detect EITHER locus using the single locus tests is often better than the two locus test Model Two Locus Test Power to detect EITHER locus SINGLE Locus Tests Dominant x Dominant Complimentary Gene Action Model Trait Mean.5 Power Power AA Aa aa bb Bb BB Locus B AF Locus B Allele Frequency (5 individuals, % genetic variance)
32 The power to detect BOTH loci is always better fitting the two locus model regardless of the underlying model There are situations where fitting the full two-locus model will reveal effects which are not identified using single-locus methodology Multiple testing doesn t kill you as much as you think!!!
33 Exhaustive or Two Stage Strategy? Idea: Two Stage Strategies -Test a subset of, C 2 comparisons -Which comparisons are chosen depends on their performance in the single locus tests PLUS: Reduce cost due to multiple testing MINUS: Throw away some comparisons which would be significant in the two locus test, yet are not significant in the single locus tests
34 Two-stage Models Strategy One -Only markers which pass first stage threshold in the single locus analysis are tested -All pair-wise combinations of these markers are tested pval.5 Marker Marker 2 Marker 3 Marker 4 Marker 5 Marker 6 Marker 7 Marker 8 Marker 9 Marker -Three comparisons: -Marker 2 vs Marker 6 -Marker 2 vs Marker 9 -Marker 6 vs Marker 9
35 Two Stage Procedure: Strategy One p < Power p <. Power p <. Power p <. Power Allele Frequency Locus.4 Allele Frequency Locus Allele Frequency Locus.4 Allele Frequency Locus 2 (Dominant x Dominant Complimentary Gene Action Model, 5 individuals, % genetic variance) As the first stage threshold becomes more stringent, the power to detect both loci DECREASES for the majority of the parameter space
36 Why Does Strategy One Perform Poorly? For BOTH loci to be included in the second stage, Strategy One requires BOTH single locus tests to meet some threshold This threshold will not be met when the single locus variance is close to zero Therefore Strategy One will tend to fail whenever EITHER single locus component is close to zero Variance Locus One Variance Locus Two Epistatic Variance Proportion of Variance AF Locus AF Locus AF Locus AF Locus (Dominant x Dominant Complimentary Gene Action Model)
37 Two-stage Models Strategy Two -Markers which pass first stage threshold are tested with ALL other markers pval.5 Marker Marker 2 Marker 3 Marker 4 Marker 5 Marker 6 Marker 7 Marker 8 Marker 9 Marker -24 comparisons: -Marker 2 vs Markers, 3, 4, 5, 6, 7, 8, 9, -Marker 6 vs Marker, 3, 4, 5, 6, 7, 8, 9, -Marker 9 vs Marker, 3, 4, 5, 7, 8,
38 Two-Stage Procedure: Strategy Two p < Power p <. Power p <. Power p <. Power (Dominant x Dominant Complimentary Gene Action Model, 5 individuals, % genetic variance) As the first stage threshold becomes more stringent, there is no increase in power There is a decrease in power at more stringent levels
39 Because of the need to condition on the first stage results being significant, there is no increased power in the second stage Since loci are included in the second stage if the variance is in EITHER single locus component, the strategy fails when the majority of variance is in the epistatic variance component or the first stage threshold is too severe Less Extreme Models Extreme Models CGA DxD CGA XOR Chequer DxR CGA Threshold ME DxD
40 Many simple looking models contain regions of their parameter space where loci would not be able to be identified using single locus analyses or two stage analyses An exhaustive search involving all pair-wise combinations of markers across the genome is superior to performing a two stage strategy
41 Conclusions An exhaustive search involving all pair-wise combinations of markers across the genome is superior to performing a two stage strategy Many simple looking models contain sizeable regions of their parameter space where loci would not be able to be identified using single locus analyses Despite the increased penalty due to multiple testing, it is possible to detect interacting loci which contribute to moderate proportions of the phenotypic variance with realistic sample sizes Is it worth incorporating epistasis in GWA?
42 Using PLINK to test for Epistasis Two tests of epistasis are implimented in PLINK Testing for additive x additive epistasis: Y = µ + a X + a 2 X 2 + i aa w aa + ε plink --file mydata --epistasis plink.epi.cc plink.epi.cc.summary Fast epistasis : plink --file mydata --fast-epistasis Possible to control output using the flags: --epi. --epi2.
43 Practical Copy the files epistasis.ped and epistasis.map from H:/davide/LEUVEN28 Run single locus tests of association in this dataset plink --file epistasis --assoc Run a scan for epistasis using the --fast-epistasis option plink --file epistasis --fast-epistasis What are the two top interactions from this analysis? Are these loci flagged in the single locus analysis?
44 Practical Two locus results: CHR SNP CHR2 SNP2 STAT P 22 rs rs e-5 22 rs rs e-5 Single locus results: CHR SNP CHISQ P OR 22 rs rs rs rs
QTL mapping in mice. Karl W Broman. Department of Biostatistics Johns Hopkins University Baltimore, Maryland, USA.
 QTL mapping in mice Karl W Broman Department of Biostatistics Johns Hopkins University Baltimore, Maryland, USA www.biostat.jhsph.edu/ kbroman Outline Experiments, data, and goals Models ANOVA at marker
Genetics of dairy production
 Genetics of dairy production E-learning course from ESA Charlotte DEZETTER ZBO101R11550 Table of contents I - Genetics of dairy production 3 1. Learning objectives... 3 2. Review of Mendelian genetics...
Lecture 23: Causes and Consequences of Linkage Disequilibrium. November 16, 2012
 Lecture 23: Causes and Consequences of Linkage Disequilibrium November 16, 2012 Last Time Signatures of selection based on synonymous and nonsynonymous substitutions Multiple loci and independent segregation
QTL mapping in mice. Karl W Broman. Department of Biostatistics Johns Hopkins University Baltimore, Maryland, USA.
 QTL mapping in mice Karl W Broman Department of Biostatistics Johns Hopkins University Baltimore, Maryland, USA www.biostat.jhsph.edu/ kbroman Outline Experiments, data, and goals Models ANOVA at marker
POPULATION GENETICS Winter 2005 Lecture 18 Quantitative genetics and QTL mapping
 POPULATION GENETICS Winter 2005 Lecture 18 Quantitative genetics and QTL mapping - from Darwin's time onward, it has been widely recognized that natural populations harbor a considerably degree of genetic
Detecting gene-gene interactions in high-throughput genotype data through a Bayesian clustering procedure
 Detecting gene-gene interactions in high-throughput genotype data through a Bayesian clustering procedure Sui-Pi Chen and Guan-Hua Huang Institute of Statistics National Chiao Tung University Hsinchu,
Introduction to Quantitative Genomics / Genetics
 Introduction to Quantitative Genomics / Genetics BTRY 7210: Topics in Quantitative Genomics and Genetics September 10, 2008 Jason G. Mezey Outline History and Intuition. Statistical Framework. Current
By the end of this lecture you should be able to explain: Some of the principles underlying the statistical analysis of QTLs
 (3) QTL and GWAS methods By the end of this lecture you should be able to explain: Some of the principles underlying the statistical analysis of QTLs Under what conditions particular methods are suitable
PLINK gplink Haploview
 PLINK gplink Haploview Whole genome association software tutorial Shaun Purcell Center for Human Genetic Research, Massachusetts General Hospital, Boston, MA Broad Institute of Harvard & MIT, Cambridge,
Why do we need statistics to study genetics and evolution?
 Why do we need statistics to study genetics and evolution? 1. Mapping traits to the genome [Linkage maps (incl. QTLs), LOD] 2. Quantifying genetic basis of complex traits [Concordance, heritability] 3.
BTRY 7210: Topics in Quantitative Genomics and Genetics
 BTRY 7210: Topics in Quantitative Genomics and Genetics Jason Mezey Biological Statistics and Computational Biology (BSCB) Department of Genetic Medicine jgm45@cornell.edu Spring 2015, Thurs.,12:20-1:10
Summary for BIOSTAT/STAT551 Statistical Genetics II: Quantitative Traits
 Summary for BIOSTAT/STAT551 Statistical Genetics II: Quantitative Traits Gained an understanding of the relationship between a TRAIT, GENETICS (single locus and multilocus) and ENVIRONMENT Theoretical
Understanding genetic association studies. Peter Kamerman
 Understanding genetic association studies Peter Kamerman Outline CONCEPTS UNDERLYING GENETIC ASSOCIATION STUDIES Genetic concepts: - Underlying principals - Genetic variants - Linkage disequilibrium -
1b. How do people differ genetically?
 1b. How do people differ genetically? Define: a. Gene b. Locus c. Allele Where would a locus be if it was named "9q34.2" Terminology Gene - Sequence of DNA that code for a particular product Locus - Site
Statistical Methods for Quantitative Trait Loci (QTL) Mapping
 Mapping") Statistical Methods for Quantitative Trait Loci (QTL) Mapping Lectures 4 Oct 10, 011 CSE 57 Computational Biology, Fall 011 Instructor: Su-In Lee TA: Christopher Miles Monday & Wednesday 1:00-1:0 Johnson
Statistical Methods for Quantitative Trait Loci (QTL) Mapping Lectures 4 Oct 10, 011 CSE 57 Computational Biology, Fall 011 Instructor: Su-In Lee TA: Christopher Miles Monday & Wednesday 1:00-1:0 Johnson
Exam 1 Answers Biology 210 Sept. 20, 2006
 Exam Answers Biology 20 Sept. 20, 2006 Name: Section:. (5 points) Circle the answer that gives the maximum number of different alleles that might exist for any one locus in a normal mammalian cell. A.
Chapter 4.!Extensions to Mendelian Genetics.! Gene Interactions
 Chapter 4!Extensions to Mendelian Genetics! Gene Interactions 1 Gene Interactions Extensions to Mendelian Genetics Just as different alleles of 1 gene can interact in complex ways, 2 different genes can
AN EVALUATION OF POWER TO DETECT LOW-FREQUENCY VARIANT ASSOCIATIONS USING ALLELE-MATCHING TESTS THAT ACCOUNT FOR UNCERTAINTY
 AN EVALUATION OF POWER TO DETECT LOW-FREQUENCY VARIANT ASSOCIATIONS USING ALLELE-MATCHING TESTS THAT ACCOUNT FOR UNCERTAINTY E. ZEGGINI and J.L. ASIMIT Wellcome Trust Sanger Institute, Hinxton, CB10 1HH,
GENETICS - CLUTCH CH.20 QUANTITATIVE GENETICS.
 !! www.clutchprep.com CONCEPT: MATHMATICAL MEASRUMENTS Common statistical measurements are used in genetics to phenotypes The mean is an average of values - A population is all individuals within the group
D) Gene Interaction Takes Place When Genes at Multiple Loci Determine a Single Phenotype.
 Gene Interaction Takes Place When Genes at Multiple Loci Determine a Single Phenotype.") D) Gene Interaction Takes Place When Genes at Multiple Loci Determine a Single Phenotype. In the dihybrid crosses, each locus had an independent effect on the phenotype. When Mendel crossed a homozygous
D) Gene Interaction Takes Place When Genes at Multiple Loci Determine a Single Phenotype. In the dihybrid crosses, each locus had an independent effect on the phenotype. When Mendel crossed a homozygous
BTRY 7210: Topics in Quantitative Genomics and Genetics
 BTRY 7210: Topics in Quantitative Genomics and Genetics Jason Mezey Biological Statistics and Computational Biology (BSCB) Department of Genetic Medicine jgm45@cornell.edu January 29, 2015 Why you re here
Linkage Disequilibrium. Adele Crane & Angela Taravella
 Linkage Disequilibrium Adele Crane & Angela Taravella Overview Introduction to linkage disequilibrium (LD) Measuring LD Genetic & demographic factors shaping LD Model predictions and expected LD decay
Goal: To use GCTA to estimate h 2 SNP from whole genome sequence data & understand how MAF/LD patterns influence biases
 GCTA Practical 2 Goal: To use GCTA to estimate h 2 SNP from whole genome sequence data & understand how MAF/LD patterns influence biases GCTA practical: Real genotypes, simulated phenotypes Genotype Data
Linkage & Genetic Mapping in Eukaryotes. Ch. 6
 Linkage & Genetic Mapping in Eukaryotes Ch. 6 1 LINKAGE AND CROSSING OVER! In eukaryotic species, each linear chromosome contains a long piece of DNA A typical chromosome contains many hundred or even
QTL Mapping, MAS, and Genomic Selection
 QTL Mapping, MAS, and Genomic Selection Dr. Ben Hayes Department of Primary Industries Victoria, Australia A short-course organized by Animal Breeding & Genetics Department of Animal Science Iowa State
Introduction to Add Health GWAS Data Part I. Christy Avery Department of Epidemiology University of North Carolina at Chapel Hill
 Introduction to Add Health GWAS Data Part I Christy Avery Department of Epidemiology University of North Carolina at Chapel Hill Outline Introduction to genome-wide association studies (GWAS) Research
Conifer Translational Genomics Network Coordinated Agricultural Project
 Conifer Translational Genomics Network Coordinated Agricultural Project Genomics in Tree Breeding and Forest Ecosystem Management ----- Module 4 Quantitative Genetics Nicholas Wheeler & David Harry Oregon
Statistical Methods for Network Analysis of Biological Data
 The Protein Interaction Workshop, 8 12 June 2015, IMS Statistical Methods for Network Analysis of Biological Data Minghua Deng, dengmh@pku.edu.cn School of Mathematical Sciences Center for Quantitative
Lecture 2: Height in Plants, Animals, and Humans. Michael Gore lecture notes Tucson Winter Institute version 18 Jan 2013
 Lecture 2: Height in Plants, Animals, and Humans Michael Gore lecture notes Tucson Winter Institute version 18 Jan 2013 Is height a polygenic trait? http://en.wikipedia.org/wiki/gregor_mendel Case Study
High-density SNP Genotyping Analysis of Broiler Breeding Lines
 Animal Industry Report AS 653 ASL R2219 2007 High-density SNP Genotyping Analysis of Broiler Breeding Lines Abebe T. Hassen Jack C.M. Dekkers Susan J. Lamont Rohan L. Fernando Santiago Avendano Aviagen
Simultaneous analysis of all SNPs in genome-wide and re-sequencing association studies
 Simultaneous analysis of all SNPs in genome-wide and re-sequencing association studies p. 1/20 Simultaneous analysis of all SNPs in genome-wide and re-sequencing association studies David J. Balding Centre
Supplementary Note: Detecting population structure in rare variant data
 Supplementary Note: Detecting population structure in rare variant data Inferring ancestry from genetic data is a common problem in both population and medical genetic studies, and many methods exist to
Computational Genomics
 Computational Genomics 10-810/02 810/02-710, Spring 2009 Quantitative Trait Locus (QTL) Mapping Eric Xing Lecture 23, April 13, 2009 Reading: DTW book, Chap 13 Eric Xing @ CMU, 2005-2009 1 Phenotypical
Beyond single genes or proteins
 Beyond single genes or proteins Marylyn D Ritchie, PhD Professor, Biochemistry and Molecular Biology Director, Center for Systems Genomics The Pennsylvania State University Traditional Approach Genome-wide
ch03 Student: If a phenotype is controlled by the genotypes at two different loci the interaction of these genes is called
 ch03 Student: 1. Which of the following is not a phenotypic description of allele interactions affecting the expression of traits? incomplete dominance codominance polymorphic multifactorial E. pleiotrophic
Danika Bannasch DVM PhD. School of Veterinary Medicine University of California Davis
 Genetics 101 Danika Bannasch DVM PhD Maxine Adler Endowed Chair in Genetics School of Veterinary Medicine University of California Davis Outline Basic genetics: The Rules Not so basic genetics: The exceptions
Using Mapmaker/QTL for QTL mapping
 Using Mapmaker/QTL for QTL mapping M. Maheswaran Tamil Nadu Agriculture University, Coimbatore Mapmaker/QTL overview A number of methods have been developed to map genes controlling quantitatively measured
Bioinformatics opportunities in Genomics and Genetics
 Bioinformatics opportunities in Genomics and Genetics Case Study: Prediction of novel gene functions of NSF1/YPL230W in Saccharomyces Cerevisiae via search for maximally interconnected sub-graph Kyrylo
LINKAGE AND CHROMOSOME MAPPING IN EUKARYOTES
 LINKAGE AND CHROMOSOME MAPPING IN EUKARYOTES Objectives: Upon completion of this lab, the students should be able to: Understand the different stages of meiosis. Describe the events during each phase of
b. (3 points) The expected frequencies of each blood type in the deme if mating is random with respect to variation at this locus.
 The expected frequencies of each blood type in the deme if mating is random with respect to variation at this locus.") NAME EXAM# 1 1. (15 points) Next to each unnumbered item in the left column place the number from the right column/bottom that best corresponds: 10 additive genetic variance 1) a hermaphroditic adult develops
NAME EXAM# 1 1. (15 points) Next to each unnumbered item in the left column place the number from the right column/bottom that best corresponds: 10 additive genetic variance 1) a hermaphroditic adult develops
Papers for 11 September
 Papers for 11 September v Kreitman M (1983) Nucleotide polymorphism at the alcohol-dehydrogenase locus of Drosophila melanogaster. Nature 304, 412-417. v Hishimoto et al. (2010) Alcohol and aldehyde dehydrogenase
Haplotype Based Association Tests. Biostatistics 666 Lecture 10
 Haplotype Based Association Tests Biostatistics 666 Lecture 10 Last Lecture Statistical Haplotyping Methods Clark s greedy algorithm The E-M algorithm Stephens et al. coalescent-based algorithm Hypothesis
1. why study multiple traits together?
 Multiple Traits & Microarrays 1. why study multiple traits together? 2-10 diabetes case study 2. design issues 11-13 selective phenotyping 3. why are traits correlated? 14-17 close linkage or pleiotropy?
SAMPLE MIDTERM QUESTIONS (Prof. Schoen s lectures) Use the information below to answer the next two questions:
 Use the information below to answer the next two questions:") SAMPLE MIDTERM QUESTIONS (Prof. Schoen s lectures) Use the information below to answer the next two questions: Assume that high blood pressure is inherited as an autosomal dominant trait. You genotype
SAMPLE MIDTERM QUESTIONS (Prof. Schoen s lectures) Use the information below to answer the next two questions: Assume that high blood pressure is inherited as an autosomal dominant trait. You genotype
Chapter 14: Mendel and the Gene Idea
 Chapter 4: Mendel and the Gene Idea. The Experiments of Gregor Mendel 2. Beyond Mendelian Genetics 3. Human Genetics . The Experiments of Gregor Mendel Chapter Reading pp. 268-276 TECHNIQUE Parental generation
Human Genetics and Gene Mapping of Complex Traits
 Human Genetics and Gene Mapping of Complex Traits Advanced Genetics, Spring 2018 Human Genetics Series Thursday 4/5/18 Nancy L. Saccone, Ph.D. Dept of Genetics nlims@genetics.wustl.edu / 314-747-3263 What
Lecture 3: Introduction to the PLINK Software. Summer Institute in Statistical Genetics 2015
 Lecture 3: Introduction to the PLINK Software Timothy Thornton and Michael Wu Summer Institute in Statistical Genetics 2015 1 / 1 PLINK Overview PLINK is a free, open-source whole genome association analysis
Lecture 3: Introduction to the PLINK Software. Summer Institute in Statistical Genetics 2017
 Lecture 3: Introduction to the PLINK Software Instructors: Timothy Thornton and Michael Wu Summer Institute in Statistical Genetics 2017 1 / 20 PLINK Overview PLINK is a free, open-source whole genome
Course Announcements
 Statistical Methods for Quantitative Trait Loci (QTL) Mapping II Lectures 5 Oct 2, 2 SE 527 omputational Biology, Fall 2 Instructor Su-In Lee T hristopher Miles Monday & Wednesday 2-2 Johnson Hall (JHN)
DNA Collection. Data Quality Control. Whole Genome Amplification. Whole Genome Amplification. Measure DNA concentrations. Pros
 DNA Collection Data Quality Control Suzanne M. Leal Baylor College of Medicine sleal@bcm.edu Copyrighted S.M. Leal 2016 Blood samples For unlimited supply of DNA Transformed cell lines Buccal Swabs Small
General aspects of genome-wide association studies
 General aspects of genome-wide association studies Abstract number 20201 Session 04 Correctly reporting statistical genetics results in the genomic era Pekka Uimari University of Helsinki Dept. of Agricultural
Multiple Choice (3.35 each) Total = 100pts. Choice the choice that best answers the question! Good luck!
 Total = 100pts. Choice the choice that best answers the question! Good luck!") NAME DATE Multiple Choice (3.35 each) Total = 100pts. Choice the choice that best answers the question! Good luck! 1. Could the characteristic followed in the pedigree be caused by an autosomal dominant
NAME DATE Multiple Choice (3.35 each) Total = 100pts. Choice the choice that best answers the question! Good luck! 1. Could the characteristic followed in the pedigree be caused by an autosomal dominant
Observing Patterns in Inherited Traits. Chapter 11
 Observing Patterns in Inherited Traits Chapter 11 Impacts, Issues: The Color of Skin Like most human traits, skin color has a genetic basis; more than 100 gene products affect the synthesis and deposition
Utilising Deep Learning and Genome Wide Association Studies for Epistatic-Driven Preterm Birth Classification in African-American Women
 Utilising Deep Learning and Genome Wide Association Studies for Epistatic-Driven Preterm Birth Classification in African-American Women Paul Fergus, Casimiro Curbelo Montañez, Basma Abdulaimma, Paulo Lisboa,
Chapter 9. Gene Interactions. As we learned in Chapter 3, Mendel reported that the pairs of loci he observed segregated independently
 Chapter 9 Gene Interactions Figure 9-1 The coat colour on this juvenile horse is called Bay Roan Tobiano. Bay is the brown base coat colour; Roan is the mixture of white hairs with the base coat, making
Advanced Introduction to Machine Learning
 Advanced Introduction to Machine Learning 10715, Fall 2014 Structured Sparsity, with application in Computational Genomics Eric Xing Lecture 3, September 15, 2014 Reading: Eric Xing @ CMU, 2014 1 Structured
Linkage Disequilibrium
 Linkage Disequilibrium Why do we care about linkage disequilibrium? Determines the extent to which association mapping can be used in a species o Long distance LD Mapping at the tens of kilobase level
5/18/2017. Genotypic, phenotypic or allelic frequencies each sum to 1. Changes in allele frequencies determine gene pool composition over generations
 Topics How to track evolution allele frequencies Hardy Weinberg principle applications Requirements for genetic equilibrium Types of natural selection Population genetic polymorphism in populations, pp.
Complex inheritance of traits does not follow inheritance patterns described by Mendel.
 Section 2: Complex inheritance of traits does not follow inheritance patterns described by Mendel. K What I Know W What I Want to Find Out L What I Learned Essential Questions What are the differences
Lab 1: A review of linear models
 Lab 1: A review of linear models The purpose of this lab is to help you review basic statistical methods in linear models and understanding the implementation of these methods in R. In general, we need
(A) Type AB only. (B) Type A or Type B only. (C) Type A, AB, and B only. (D) All four types are possible: type A, AB, B or O.
 Type AB only. (B) Type A or Type B only. (C) Type A, AB, and B only. (D) All four types are possible: type A, AB, B or O.") Genetics - Problem Drill 02:Mendelian Genetics and its Extensions No. 1 of 10 1. In the case of a couple, where the husband has type A blood and the wife has type B, the blood types of their children should
Genetics - Problem Drill 02:Mendelian Genetics and its Extensions No. 1 of 10 1. In the case of a couple, where the husband has type A blood and the wife has type B, the blood types of their children should
Polygenic Influences on Boys & Girls Pubertal Timing & Tempo. Gregor Horvath, Valerie Knopik, Kristine Marceau Purdue University
 Polygenic Influences on Boys & Girls Pubertal Timing & Tempo Gregor Horvath, Valerie Knopik, Kristine Marceau Purdue University Timing & Tempo of Puberty Varies by individual (Marceau et al., 2011) Risk
POLYMORPHISM AND VARIANT ANALYSIS. Matt Hudson Crop Sciences NCSA HPCBio IGB University of Illinois
 POLYMORPHISM AND VARIANT ANALYSIS Matt Hudson Crop Sciences NCSA HPCBio IGB University of Illinois Outline How do we predict molecular or genetic functions using variants?! Predicting when a coding SNP
QTL Mapping, MAS, and Genomic Selection
 QTL Mapping, MAS, and Genomic Selection Dr. Ben Hayes Department of Primary Industries Victoria, Australia A short-course organized by Animal Breeding & Genetics Department of Animal Science Iowa State
A Primer of Ecological Genetics
 A Primer of Ecological Genetics Jeffrey K. Conner Michigan State University Daniel L. Hartl Harvard University Sinauer Associates, Inc. Publishers Sunderland, Massachusetts U.S.A. Contents Preface xi Acronyms,
Multiple Traits & Microarrays
 Multiple Traits & Microarrays 1. why study multiple traits together? 2-10 diabetes case study 2. design issues 11-13 selective phenotyping 3. why are traits correlated? 14-17 close linkage or pleiotropy?
Chapter 5: Overview. Overview. Introduction. Genetic linkage and. Genes located on the same chromosome. linkage. recombinant progeny with genotypes
 Chapter 5: Genetic linkage and chromosome mapping. Overview Introduction Linkage and recombination of genes in a chromosome Principles of genetic mapping Building linkage maps Chromosome and chromatid
Genome-wide association studies (GWAS) Part 1
 Part 1") Genome-wide association studies (GWAS) Part 1 Matti Pirinen FIMM, University of Helsinki 03.12.2013, Kumpula Campus FIMM - Institiute for Molecular Medicine Finland www.fimm.fi Published Genome-Wide Associations
Genome-wide association studies (GWAS) Part 1 Matti Pirinen FIMM, University of Helsinki 03.12.2013, Kumpula Campus FIMM - Institiute for Molecular Medicine Finland www.fimm.fi Published Genome-Wide Associations
Crash-course in genomics
 Crash-course in genomics Molecular biology : How does the genome code for function? Genetics: How is the genome passed on from parent to child? Genetic variation: How does the genome change when it is
Department of Psychology, Ben Gurion University of the Negev, Beer Sheva, Israel;
 Polygenic Selection, Polygenic Scores, Spatial Autocorrelation and Correlated Allele Frequencies. Can We Model Polygenic Selection on Intellectual Abilities? Davide Piffer Department of Psychology, Ben
BST227 Introduction to Statistical Genetics. Lecture 3: Introduction to population genetics
 BST227 Introduction to Statistical Genetics Lecture 3: Introduction to population genetics!1 Housekeeping HW1 will be posted on course website tonight 1st lab will be on Wednesday TA office hours have
BST227 Introduction to Statistical Genetics. Lecture 3: Introduction to population genetics
 BST227 Introduction to Statistical Genetics Lecture 3: Introduction to population genetics 1 Housekeeping HW1 due on Wednesday TA office hours today at 5:20 - FXB G11 What have we studied Background Structure
BIOLOGY - CLUTCH CH.14 - MENDELIAN GENETICS.
 !! www.clutchprep.com CONCEPT: MENDEL S EXPERIMENT Gregor Mendel designed an experiment to study inheritance in pea plants. Character a feature that can be inherited, and shows variation between individuals
Using the Association Workflow in Partek Genomics Suite
 Using the Association Workflow in Partek Genomics Suite This user guide will illustrate the use of the Association workflow in Partek Genomics Suite (PGS) and discuss the basic functions available within
Outline of lectures 9-11
 GENOME 453 J. Felsenstein Evolutionary Genetics Autumn, 2011 Genetics of quantitative characters Outline of lectures 9-11 1. When we have a measurable (quantitative) character, we may not be able to discern
KNN-MDR: a learning approach for improving interactions mapping performances in genome wide association studies
 Abo Alchamlat and Farnir BMC Bioinformatics (2017) 18:184 DOI 10.1186/s12859-017-1599-7 METHODOLOGY ARTICLE Open Access KNN-MDR: a learning approach for improving interactions mapping performances in genome
CS273B: Deep Learning in Genomics and Biomedicine. Recitation 1 30/9/2016
 CS273B: Deep Learning in Genomics and Biomedicine. Recitation 1 30/9/2016 Topics Genetic variation Population structure Linkage disequilibrium Natural disease variants Genome Wide Association Studies Gene
Topics in Statistical Genetics
 Topics in Statistical Genetics INSIGHT Bioinformatics Webinar 2 August 22 nd 2018 Presented by Cavan Reilly, Ph.D. & Brad Sherman, M.S. 1 Recap of webinar 1 concepts DNA is used to make proteins and proteins
Chapter 5. Gene Interactions
 Chapter 5 Gene Interactions Figure 5-1 Coat color in mammals is an example of a phenotypic trait that is controlled by more than one locus and the alleles at these loci can interact to alter the expected
Take Home Message. Molecular Imaging Genomics. How to do Genetics. Questions for the Study of. Two Common Methods for Gene Localization
 Take Home Message Molecular Imaging Genomics David C. Glahn, PhD Olin Neuropsychiatry Research Center & Department of Psychiatry, Yale University This may be the most important thing I say in this lecture.
Observing Patterns in Inherited Traits. Chapter 11 Updated Reading Not
 Observing Patterns in Inherited Traits Chapter 11 Updated Reading 11.1-11.3 Not 11.5-11.7 What you absolutely need to know Punnett Square with monohybrid and dihybrid cross Heterozygous, homozygous, alleles,
Illuminating Genetic Networks with Random Forest
 ? Illuminating Genetic Networks with Random Forest ANDREAS BEYER University of Cologne Outline Random Forest Applications QTL mapping Epistasis (analyzing model structure) 2 Random Forest HOW DOES IT WORK?
MAPPING GENES TO TRAITS IN DOGS USING SNPs
 MAPPING GENES TO TRAITS IN DOGS USING SNPs OVERVIEW This instructor guide provides support for a genetic mapping activity, based on the dog genome project data. The activity complements a 29-minute lecture
B.6.F predict possible outcomes of various genetic combinations such as monohybrid crosses, dihybrid crosses and non Mendelian inheritance
 B.6.F predict possible outcomes of various genetic combinations such as monohybrid crosses, dihybrid crosses and non Mendelian inheritance Gregor Mendel Austrian monk * Studied science and mathematics
A/A;b/b x a/a;b/b. The doubly heterozygous F1 progeny generally show a single phenotype, determined by the dominant alleles of the two genes.
 Name: Date: Title: Gene Interactions in Corn. Introduction. The phenotype of an organism is determined, at least in part, by its genotype. Thus, given the genotype of an organism, and an understanding
FFGWAS. Fast Functional Genome Wide Association AnalysiS of Surface-based Imaging Genetic Data
 FFGWAS Fast Functional Genome Wide Association AnalysiS of Surface-based Imaging Genetic Data Chao Huang Department of Biostatistics Biomedical Research Imaging Center The University of North Carolina
H3A - Genome-Wide Association testing SOP
 H3A - Genome-Wide Association testing SOP Introduction File format Strand errors Sample quality control Marker quality control Batch effects Population stratification Association testing Replication Meta
7-1. Read this exercise before you come to the laboratory. Review the lecture notes from October 15 (Hardy-Weinberg Equilibrium)
") 7-1 Biology 1001 Lab 7: POPULATION GENETICS PREPARTION Read this exercise before you come to the laboratory. Review the lecture notes from October 15 (Hardy-Weinberg Equilibrium) OBECTIVES At the end of
7-1 Biology 1001 Lab 7: POPULATION GENETICS PREPARTION Read this exercise before you come to the laboratory. Review the lecture notes from October 15 (Hardy-Weinberg Equilibrium) OBECTIVES At the end of
Genetic data concepts and tests
 Genetic data concepts and tests Cavan Reilly September 21, 2018 Table of contents Overview Linkage disequilibrium Quantifying LD Heatmap for LD Hardy-Weinberg equilibrium Genotyping errors Population substructure
Introduction to Quantitative Genetics
 Introduction to Quantitative Genetics Fourth Edition D. S. Falconer Trudy F. C. Mackay PREFACE TO THE THIRD EDITION PREFACE TO THE FOURTH EDITION ACKNOWLEDGEMENTS INTRODUCTION ix x xi xiii f GENETIC CONSTITUTION
GCTA/GREML. Rebecca Johnson. March 30th, 2017
 GCTA/GREML Rebecca Johnson March 30th, 2017 1 / 12 Motivation for method We know from twin studies and other methods that genetic variation contributes to complex traits like height, BMI, educational attainment,
Appendix 5: Details of statistical methods in the CRP CHD Genetics Collaboration (CCGC) [posted as supplied by
 [posted as supplied by") Appendix 5: Details of statistical methods in the CRP CHD Genetics Collaboration (CCGC) [posted as supplied by author] Statistical methods: All hypothesis tests were conducted using two-sided P-values
Appendix 5: Details of statistical methods in the CRP CHD Genetics Collaboration (CCGC) [posted as supplied by author] Statistical methods: All hypothesis tests were conducted using two-sided P-values
Video Tutorial 9.1: Determining the map distance between genes
 Video Tutorial 9.1: Determining the map distance between genes Three-factor linkage questions may seem daunting at first, but there is a straight-forward approach to solving these problems. We have described
Genetic load. For the organism as a whole (its genome, and the species), what is the fitness cost of deleterious mutations?
, what is the fitness cost of deleterious mutations?") Genetic load For the organism as a whole (its genome, and the species), what is the fitness cost of deleterious mutations? Anth/Biol 5221, 25 October 2017 We saw that the expected frequency of deleterious
Genetic load For the organism as a whole (its genome, and the species), what is the fitness cost of deleterious mutations? Anth/Biol 5221, 25 October 2017 We saw that the expected frequency of deleterious
Genome Wide Association Study for Binomially Distributed Traits: A Case Study for Stalk Lodging in Maize
 Genome Wide Association Study for Binomially Distributed Traits: A Case Study for Stalk Lodging in Maize Esperanza Shenstone and Alexander E. Lipka Department of Crop Sciences University of Illinois at
EVOLUTION/HERDEDITY UNIT Unit 1 Part 8A Chapter 23 Activity Lab #11 A POPULATION GENETICS AND EVOLUTION
 AP BIOLOGY EVOLUTION/HERDEDITY UNIT Unit Part 8A Chapter Activity Lab # A NAME DATE PERIOD POPULATION GENETICS AND EVOLUTION In 908 G. H. Hardy and W. Weinberg independently suggest a scheme whereby evolution
Midterm#1 comments#2. Overview- chapter 6. Crossing-over
 Midterm#1 comments#2 So far, ~ 50 % of exams graded, wide range of results: 5 perfect scores (200 pts) Lowest score so far, 25 pts Partial credit is given if you get part of the answer right Tests will
COMPUTER SIMULATIONS AND PROBLEMS
 Exercise 1: Exploring Evolutionary Mechanisms with Theoretical Computer Simulations, and Calculation of Allele and Genotype Frequencies & Hardy-Weinberg Equilibrium Theory INTRODUCTION Evolution is defined
Imputation. Genetics of Human Complex Traits
 Genetics of Human Complex Traits GWAS results Manhattan plot x-axis: chromosomal position y-axis: -log 10 (p-value), so p = 1 x 10⁻⁸ is plotted at y = 8 p = 5 x 10⁻⁸ is plotted at y = 7.3 Advanced Genetics,