FIRE AND FUEL MAPPING SHOALWATER BAY TRAINING AREA. Brian Tunstall, Neil Powell and Alan Marks
|
|
|
- Myrtle Ward
- 6 years ago
- Views:
Transcription

1 FIRE AND FUEL MAPPING SHOALWATER BAY TRAINING AREA Brian Tunstall, Neil Powell and Alan Marks Technical Report 10/98 March 1998
2 FIRE AND FUEL MAPPING SHOALWATER BAY TRAINING AREA Brian Tunstall 1, Neil Powell 1, and Alan Marks 1 Environmental Research & Information Consortium Pty Ltd PO Box 179, Deakin West, ACT 2600 INTRODUCTION 2 METHODS 3 FIRE CHARACTERISTICS 3 FIRE MAPPING 3 FUEL CHARACTERISTICS 4 FUEL MEASUREMENT 5 FUEL MAPPING 6 RESULTS 6 FIRE MAPPING 6 FUEL LOADS 7 DISCUSSION 9 FIRE MAPPING 9 FUEL ACCUMULATION RATES 9 CONCLUSIONS 10 REFERENCES 11 CSIRO Land and Water Technical Report 10/98 March 1998 Acknowledgments This study was funded by the Department of Defence 1
3 INTRODUCTION Fire has always been part of the Shoalwater Bay Training Area (SWBTA). Two recently retired land managers had a combined experience of more than 100 years in managing fire in the area. The general characteristics of fire, and the practical limitations to its management, are therefore well known, and have been incorporated into current practices. Fire presents particular management difficulties because of its potentially damaging effects and unpredictability, thus fire has been the subject of research by CSIRO since The background and detail of fire management in SWBTA are given in the Fire Management Plan (Tunstall and Edwards, 1998), which also identifies developments required to improve fire management. The key requirements identified related to the ability to map fuel loads, and hence fire hazard, and to demonstrate the implementation of a fire regime that meets safety and conservation requirements. Assuming uniform rates of fuel production, these requirements can be met through mapping burn patterns. The time since burn indicates the fuel load, while the occurrence of fires, and fire frequencies, are evidence that safety and conservation requirements have been met. The assumption of uniform fuel accumulation is usually inadequate, and is particularly so for an area as diverse as SWBTA. Fuel production and litter decomposition differ greatly among the vegetation types, as do the fuel characteristics. The mapping of fuel loads therefore depends upon knowledge of the rates of production and decomposition of litter for mapped vegetation types, as well as annual maps of burns. Burn patterns have been mapped using visual observation since 1993, but this has proven difficult because of the size of the area, and poor access. The observations have value, but considerable uncertainty exists as to their accuracy. Cost is also significant, in both commitments of personnel, and aircraft charter. The alternative of mapping burn patterns through analysis of satellite imagery was therefore investigated because of likely improvements in accuracy and cost. Mapping patterns of fuel accumulation is made difficult by the many factors to be considered. Accumulation of litter depends on the relative rates of production and decay, which vary with the type of vegetation and seasonal conditions. Fuel type is also of consequence, and this varies with vegetation type, time since burn, and the seasonal conditions. Additionally, the material consumed by fire varies considerably, ranging from only grassy litter to all litter and plant foliage. The uncertainties in mapping potential rates of fuel accumulation in an area as large and diverse as SWBTA are considerable, with errors deriving from the base vegetation map, the limited observations of fuel loads, and the limited ability to track effects of seasonal conditions and past fires. Accepting these limitations, the objectives of this study were to: Map patterns of burns using satellite imagery. To provide information on fuel accumulation rates for mapped vegetation patterns. 2
4 METHODS Fire Characteristics The characteristics of fires determine the likely success in mapping burns using satellite imagery. Analysis is simple where fire destroys all vegetation because of the gross change in land cover, and because such fires usually occur under dry conditions when image acquisition is reliable and evidence of burns persists. However, most fires in SWBTA are lit when the soil is moist, resulting in patchy burns that only slightly modify the vegetation. Tree canopies often remain intact, limiting spectral change to the removal of ground layer vegetation As fires in SWBTA generally occur at the beginning of the growing season, the changes due to fire usually rapidly diminish through regrowth, particularly when the impact of fire is limited to ground vegetation. Favourable temperatures and soil moisture promote growth, thereby limiting the persistence of any change, and this is of particular consequence because of the difficulties in obtaining cloud free imagery. Burn patterns can always be detected if suitable imagery is available immediately following a fire, but they may remain undetected given delays in imagery acquisition. The significance of the length of delay in obtaining satellite imagery depends on the severity of the fire and vegetation type. Fire scars can be mapped several years after occurrence with some vegetation types, but may be difficult to determine after several months in others. The fire season in SWBTA starts in late July or early August when fuel becomes dry due to increasing temperatures and lack of rain. Early season fires generally burn at a low intensity because the fuel remains moist, but high fire intensities can occur in August on the occasional days with moderate to strong westerly winds. The fire season continues until around the end of the calendar year, with the likelihood of fire during this period varying depending on rainfall. August and September are traditionally the driest months, and therefore generally pose the highest fire risk. However, with low rainfall, the fire risk increases with increasing ambient temperatures into January. Fires during summer generally burn at high intensities over extensive areas, and cause considerable change to vegetation, but can still be difficult to map due to the un-availability of cloud free imagery following the fires. Few cloud free images exist for SWBTA, and these mainly cover the winter period of June and July. Fire Mapping The methods used for mapping burns from satellite imagery are based on those developed for the Mt Bundey Training Area (MBTA) in the Northern Territory (Tunstall, 1995). This used multispectral Landsat TM imagery acquired at four times during the fire season, with the first image being free of fire scars. The analysis focused on detecting changes between acquisition dates because of the uncertainties in identifying burnt areas through spectral characteristics alone. Differences in vegetation type, and the extent of change due to fire, result in burnt areas having a wide range of reflectance characteristics. Satellite imagery is highly sensitive in detecting change but need not identify the cause as change can occur for a number of reasons. The results for Mt Bundey indicated that change due to regrowth following burning enhanced the discrimination of change due to fire. Band 4 was found to contain most information on burns, and this band responds mainly to changes in green biomass. Fire scars were best mapped by observing changes in Band 4 between image acquisitions, with observations from more than one interval being required to 3
5 determine the cause of change. Because of these results, and the cost benefits associated with the acquisition and processing of a single band, this analysis was restricted to Band 4 of Landsat TM. The dates of acquisition are given in Table 1. The TNTMIPS GIS was used for all processing unless otherwise specified. The images were registered to a multi-band Landsat TM image georeferenced to an RMS accuracy better than 10 m using ground points obtained with differential GPS. The georeferencing was therefore more accurate than would be obtained using a map, and the registration to a common image minimised changes arising due to errors in the registration between images. Given the position of SWBTA relative to the path of the satellite, an image for SWBTA is obtained by mosaicking data from two adjacent passes, where the passes are a minimum of 8 days apart. In mosaicking the images, spectral differences between acquisitions were reduced using histogram matching following masking of water and cloud. The Band 4 images were decorrelated within years to remove common information, and then differenced between successive times to highlight changes. Boundaries of burns were digitised from the screen to produce vector files by reference to the processed and raw images. The Environment Officer and Land Managers for SWBTA also produced maps of burn patterns using ground and aerial observations. At least one flight was scheduled during each fire season to record fire scars, and opportunistic observations were also made during flights conducted for other purposes. This information was compiled in the ArcView GIS. Table 1 Acquisition dates for the LANDSAT TM imagery. These were the only image pairs regarded as having sufficiently low levels of cloud cover. Band 4 only was acquired, except for the May 94 images, which contained all bands and was cloud free. Path 92 Path June 21 June 30 July 8 August May 7 May 6 November 17 December July 13 July 6 September 30 August May May 96 Fuel characteristics Most of SWBTA is subject to fire, but spatial differences exist in the timing and frequency of burns that relate to differences in fuel type, and rates of accumulation. Fires propagated by grassy fuels will burn early in the season, fires propagated by tree and shrub litter tend to burn mid season, while those dependant on the desiccation of live shrub material usually occur late in the season. Grassy fuels are replaced most rapidly, hence grasslands have the highest fire frequency. Accumulation of fuels is slowest in heath vegetation because of the low fertility. Accumulation of shrub and leaf litter in woodlands and forests is generally intermediate between woodlands and heath, but varies depending on the relative rates of production and decay. 4
6 Differences in decay rates for different litter types result in grassy fuel loads peaking first, reaching a maximum in around four years. Grassy fuel loads may then decline because of declining production by the grasses. Data are not available for SWBTA on the time required to achieve peak fuel loads for leaf from trees and shrubs, but 8 years would be a reasonable estimate, bearing in mind that this would vary with the vegetation type and seasonal conditions. The breakdown rates for logs and branches are unknown as these are almost invariably burnt, but this is of little consequence in fire management as this material does not affect the propagation of fires. Fuel accumulation is sporadic throughout the year through being linked with the growth patterns of plants. The development of grassy fuel depends on the production and senescence of leaves, and hence exhibits an annual cycle related to the phenology of the species, where this can be modified by frosts and droughts. The occurrence of frosts is of particular consequence in determining the condition of grassy fuel at the end of winter, and strongly determines the timing for the commencement, and the severity, of the fire season. Woody species, such as shrubs and trees, mostly shed old leaves in association with new growth. Native woody species generally hold leaves from 2 to 4 years, and synchronise leaf fall and growth to conserve nutrients. Tree and shrub litter therefore mainly accumulates under moist conditions when fire is unlikely, however, the conditions that promote grass growth also promote accession of tree and shrub litter, creating a strong, but temporally offset association between the quality of the growing season and fire risk. Accumulation of grass, tree and shrub litter also occurs due to drought as well as growth, as few species sustain a full canopy when conditions become extremely adverse. This accumulation of fuel is associated with conditions of high fire risk, when fires usually consume all leafy material because of the low moisture contents and the resulting high fire intensities. The fuel available to support fire therefore depends upon the prevailing environmental conditions, as well as vegetative growth and senescence. Fuel Measurement The land cover map derived from Landsat TM imagery by CSIRO (Tunstall et al, 1998) was used as basis for sampling fuel accumulation. The map was derived by classifying multispectral Landsat TM imagery georeferenced to an RMS error of 10 m through use of differential GPS, with mosaicking of data from adjacent passes being conducted as described above. Ideally, fuel loads should be measured over many years in the different vegetation types throughout SWBTA, and be related to time since burning. This was impractical for this study because of the uncertainties as to the time since burning, and the level of resources needed to take the necessary measurements. Sampling therefore focused on sites having one years fuel accumulation. Some sites with several years accumulation were also sampled, as were sites where the fuel load was considered to be at a maximum. The 136 sample sites were located close to roads or tracks for access, and because such areas are most frequently burnt. Measurements were obtained just prior to the fire season, with the sampling being conducted in two successive years. The location, general vegetation type, and estimated period of fuel accumulation were recorded for each site, with an inferred maximum fuel being assigned an accumulation period of 10 years. 5
7 Ground fuel loads were determined by harvesting all organic matter within 1 m 2 quadrats, with the material being stratified into grass leaf, tree and shrub leaf, and twigs. Green and dry grass material was not separated, and locations with large branches or logs were avoided. The material was oven dried, and weighed. Fuel Mapping Two separate land cover maps were derived from Landsat TM imagery for SWBTA, the first by CSIRO, the second by Environmental Information Resources Consortium Pty Ltd (ERIC), but by the same person using the same techniques. The scenes used were all cloud-free but all contained fire scars, making the results unreliable for burnt areas. The second image processed provided higher discrimination than the first because of the higher sun angle and intensity of illumination, but it contained considerable areas of fire scars. Vector polygons were produced delineating the fire scars in both classified images, allowing burnt areas to be masked in the second image, and hence replaced with information from unburnt areas from the first. The degree of spatial coincidence between classes was established numerically, restricting the comparison to areas that were unburnt in both images. For sand dunes, this evaluation was further restricted to areas of sand dune. The number of land cover classes in the final image was 47, which included water. Relationships between vegetation types and land cover classes were determined through field sampling for 156 sites. The sampling was stratified according to land cover classes and patterns of parent material determined through analysis of airborne gamma radiation data. The vegetation map was derived by assigning labels according to land cover class and parent material. The limited number of fuel samples, differences in the fuel accumulation period, and the large number of vegetation types prevented statistical analysis of relationships between measured fuel loads and the mapped vegetation classes. Indeed, not all vegetation types were sampled. The fuel loads ascribed to classes in the vegetation map therefore reflect a best judgement of the results. This judgement was simple for several major mapped classes where the vegetation types and fuel characteristics were consistent, but was uncertain for classes containing high variation in the amount and composition of fuel. A map of fuel accumulation rates was obtained by applying these estimates to the vegetation map. RESULTS Fire Mapping Maps produced from the satellite imagery identifying the annual patterns of burns are given in Figures 1, 2, 3 for 1993, 1994, and 1995 respectively. Equivalent maps produced from ground observation are given in Figs 4, 5, 6. The percentage of the 2700 km 2 land area of SWBTA recorded as being burnt in these maps is given in Table 2. It is apparent that major discrepancies exist between the different forms of observation. The burn patterns can be mapped at higher spatial resolution and accuracy using satellite imagery than visual observation, but both methods miss major burns. To obtain a best estimate of the area burnt each year the results from the two methods were combined. The combined maps 6
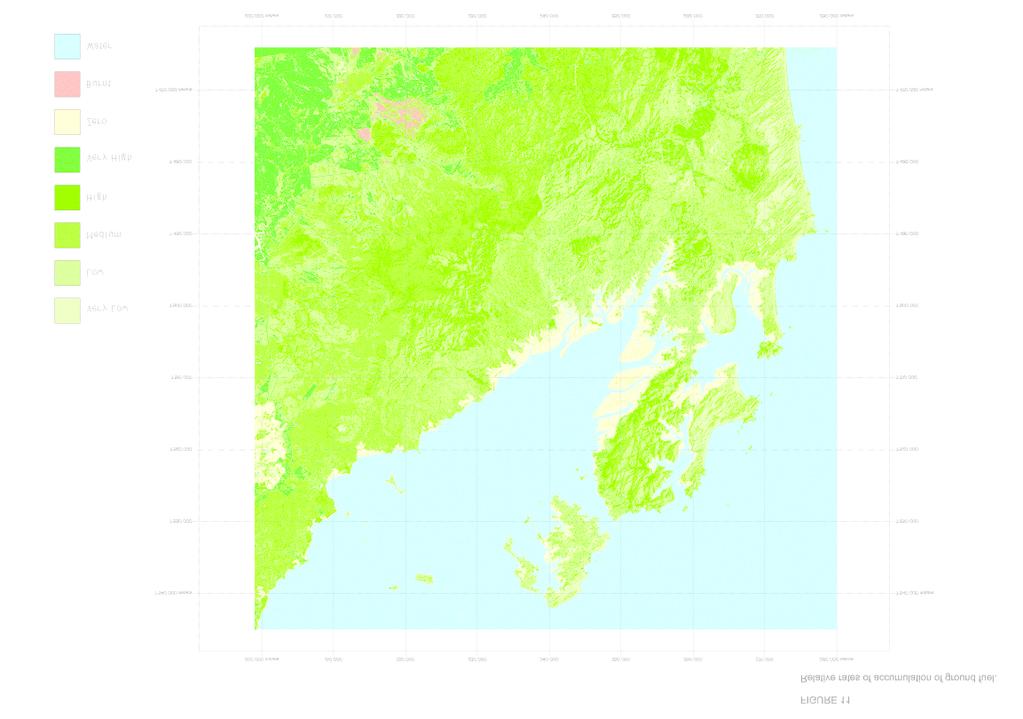
8 are given in Figs 7, 8, 9, and the percentage of SWBTA estimated as being burnt each year in Table 2. Some of the reasons for the discrepancies between mapping techniques can be identified by reference to the maps of burns. Range staff did not record some fires, and their estimates of the extent of burns were usually approximate. However, regrowth prevented the discrimination of some burns in the satellite imagery, and reduced the accuracy of determination of extents, while some were missed because of the inability to obtain cloud free imagery after the fires. Table 2 The percentage of the SWBTA ground area burnt each year as estimated using satellite imagery and ground observations. Satellite Ground Combined Fuel Loads Relationships between fuel loads and vegetation with environmental regions of SWBTA are given by Tunstall and Edwards (1998). The characteristics of fuel load for the mapped vegetation classes are given in Table 3. The areal expression of these characteristics is given in Figures. 10 and 11, where Figure 10 indicates relative levels of accumulation of grassy fuels, and Figure 11 the relative levels of accumulation of all ground fuel. Rates of grassy fuel accumulation are highest for grasslands, then woodlands, and these predominantly occur in the western areas of SWBTA. Rates of accumulation for total ground fuel are most strongly related to fertility, hence rates are slowest for the sand dunes. Table 2 Areas for the different categories of fuel accumulation rates. Grass Total
9 Table 3 Mapped vegetation categories, and relative fuel accumulation rates for grass and total ground litter. 1= low to 5 = high; 6 = 0, 7 = burnt, 8 = water. Class Description Fuel Grass Total 1 Grassland Open Paperbark Woodland Paperbark Woodland Eucalypt / Paperbark Woodland Eucalypt / Paperbark Forest Open Eucalypt / Paperbark Forest Sparse Eucalypt Paperbark Woodland Sparse Eucalypt Woodland Open Eucalypt Woodland Eucalypt Woodland Dense Eucalypt Woodland Creekline Eucalypt Woodland Sparse Eucalypt Forest Open Eucalypt Forest Eucalypt Forest Dense Eucalypt Forest Very Dense Eucalypt Forest Broadleaf Forest Araucaria Forest Pine Plantation Dense Eucalypt Heath Heath Open Heath Low / Sparse Heath Acacia Shrubland Swamp Heath Sedge Swamp Paperbark Swamp Paperbark Forest Dense Mangrove Open Mangrove Samphire Marine Couch Mudflat Sand Bare Disturbed Burnt Water 8 8 8
10 DISCUSSION Fire Mapping The area of SWBTA burnt each year is significant, but is always less than 50%. However, the fire frequency varies greatly. Areas around roads and boundaries are burnt frequently, while many areas are rarely burnt. Low fire frequencies generally occur in hills and sand dunes. The pattern of burning across years accords with prior unpublished observations that a biennial pattern of burning occurs in SWBTA. The proportion of the area burnt alternates between 20% and 50% due to the pattern of accumulation of grassy fuel. The production of grass in one year is usually sufficient to support fire, but the green material must cure to be effective in promoting fire. That is, a second winter period following burning is generally required to achieve sufficient grassy fuel for the conduct of burns. The observations on burn patterns given here are useful in identifying the areas usually burnt and the proportion of SWBTA burnt each year. They also provide an indication of areas likely to have long periods of fuel accumulation. However, neither procedure alone provided the reliability in detecting and mapping burns needed for accurate prediction of fuel loads across the entire area. Only the combined information would be regarded as providing a reliable indication of the patterns of burns. The land cover classifications produced using all Landsat TM bands appeared to provide the highest discrimination of burn patterns, which contrasts with the results for the MBTA. The extent of burns still had to be manually digitised because only small patches within burnt areas uniquely identified burns, but the ability to highlight these burnt patches through classification facilitated this operation. The above suggests that for SWBTA fire scars would best be mapped through classification of multi-band Landsat TM imagery. However, this observation requires qualification, as the classification was facilitated by the cloud free imagery. The greatest difficulty in resolving fire scars using Landsat TM imagery relates to the ability to obtain suitable imagery when required, and this is primarily determined by the occurrence of cloud. The ground observations are inaccurate in identifying the extent of burns, but have particular value when made in association with burning conducted to develop fire breaks. Firebreaks generally only have to be around 100 m wide to be effective, and so knowledge of the occurrence of fire provides useful information. However, supplementary observations are needed to support decisions on conservation and the conduct of hazard reduction burns. Fuel accumulation rates The information on fuel accumulation rates is more deficient than for the patterns of burns, but the maps of fuel accumulation rates provide more detail than previously available (Tunstall and Edwards, 1998). While this represents an improvement in the information available, determination of the level of benefit provided by these improvements is difficult. Fine spatial detail is hard to apply to management because local differences in fuel load seldom block the passage of burns, and fires tend to be widespread. Detailed spatial information could be used in modeling using GIS, but not with the current approach to fire management. The current approach divides SWBTA into environmentally homogeneous areas of a size appropriate to fire management, and detailed patterns are only addressed where they can block the passage of fire. 9
11 Conclusions More work is required to determine the most cost-effective means of mapping patterns of burns in SWBTA. Fires represent the most widespread and regular environmental impact on the training area, and are a significant threat to safety. There is therefore a need to implement appropriate management practices, and show the achievement of desired outcomes. Continuation of ground observations will be required until reliable results can be obtained using alternative procedures, but the procedures must be cost effective. Use of remote sensing is therefore essential, but questions remain as to the best form of imagery and processing. Satellite imagery provides the most cost-effective mapping, and can reliably map fire scars provided images are available when required; however, cloud makes image acquisition unreliable for SWBTA, particularly for coastal areas. Use of airborne imagery can circumvent this limitation, but costs would currently be prohibitive for the routine observations required for monitoring. The main alternative is to examine the application of image sources other than Landsat TM to increase the potential acquisition times. However, the most effective bands and processing procedures will have to be determined, as it appears that the characteristics of the vegetation in SWBTA are sufficiently different from elsewhere to produce what appears to be a unique response to fire. One possibility yet to be explored is the use of Synthetic Aperture Radar (SAR) interferometry. Current applications have been directed towards detecting small changes in elevation, the reliability of this measurement depending on maintaining the reflective characteristics of the observed surface. As changes in vegetation affect the reflective characteristics, SAR could potentially be used to identify changes in vegetation where the elevation has remained constant. Use of radar has the advantage of largely being unaffected by cloud. While many deficiencies can be identified in the information on fuel accumulation rates, the available information is useful and could be used in managing the area. Further observations could be readily obtained if management called for them. 10
12 REFERENCES Tunstall, B. R. (1995). Land condition monitoring, Mt Bundey Training Area. CSIRO Aust., Division of Water Resources, Consultancy Report 95/20. Tunstall, B. R., and Edwards, J. M. (1998). Fire Management Plan: Shoalwater Bay Training Area. CSIRO Aust. Land and Water. Technical Report 5/98. 11
13
14
15
16
17
18
19
20
21

22
23
Mapping the Cheatgrass-Caused Departure From Historical Natural Fire Regimes in the Great Basin, USA
 Mapping the Cheatgrass-Caused Departure From Historical Natural Fire Regimes in the Great Basin, USA James P. Menakis 1, Dianne Osborne 2, and Melanie Miller 3 Abstract Cheatgrass (Bromus tectorum) is
$ / maximum area Imagery $10-20 No limit $<1-3. $ / minimum area
 Technical Note Forest Industry Applications of UAVs 20 July 2017 Authors: Dr Grant Pearse *, Dr Michael Watt. * Corresponding author: grant.pearse@scionresearch.com Summary A recent project at Scion explored
FOREST COVER MAPPING AND GROWING STOCK ESTIMATION OF INDIA S FORESTS
 FOREST COVER MAPPING AND GROWING STOCK ESTIMATION OF INDIA S FORESTS GOFC-GOLD Workshop On Reducing Emissions from Deforestations 17-19 April 2007 in Santa Cruz, Bolivia Devendra PANDEY Forest Survey of
Pea Ridge Battlefield Prescribed Burning. Introduction. Prescribed burns involve the burning of controlled areas as a means of improving ecology and
 Jocee Norton Bethany Hollis Macey Brooks Rebecca Krein Empacts Project Cecil 4/15/14 Pea Ridge Battlefield Prescribed Burning Introduction Prescribed burns involve the burning of controlled areas as a
Bush Encroachment and Control
 1 Module # 2 Component # 4 Bush Encroachment and Control Objectives To understand the threat that bush encroachment represents and to be able to recommend and implement effective control measures Expected
Landsat 5 & 7 Band Combinations
 Landsat 5 & 7 Band Combinations By James W. Quinn Landsat 5 (TM sensor) Wavelength (micrometers) Resolution (meters) Band 1 0.45-0.52 30 Band 2 0.52-0.60
Estimation of Grass Plant Biomass
 1 Module # 12 - Component # 3 Estimation of Grass Plant Biomass Objectives To achieve an understanding of the purpose and methods for estimating Grass plant biomass. Expected Outcomes To be able to understand
Factors Affecting Gas Species Released in BB. Factors Affecting Gas Species Released in BB. Factors Affecting Gas Species Released in BB
 Factors Affecting Gas Species Trace from Biomass Burning. The Main Variables* The Amount and Type of gas species released from fire are conditioned by: Chemical and Physical features of the Ecosystem *(Alicia
Improving Forest Inventory: Integrating Single Tree Sampling With Remote Sensing Technology
 Improving Forest Inventory: Integrating Single Tree Sampling With Remote Sensing Technology C.J. Goulding 1, M. Fritzsche 1, D.S. Culvenor 2 1 Scion, New Zealand Forest Research Institute Limited, Private
Remote sensing as a tool to detect and quantify vegetation properties in tropical forest-savanna transitions Edward Mitchard (University of Edinburgh)
") Remote sensing as a tool to detect and quantify vegetation properties in tropical forest-savanna transitions Edward Mitchard (University of Edinburgh) Presentation to Geography EUBAP 10 th Oct 2008 Supervisor:
Remote sensing as a tool to detect and quantify vegetation properties in tropical forest-savanna transitions Edward Mitchard (University of Edinburgh) Presentation to Geography EUBAP 10 th Oct 2008 Supervisor:
AIRBORNE MAPPING OF VEGETATION CHANGES IN RECLAIMED AREAS AT HIGHLAND VALLEY BETWEEN 2001 AND Gary Borstad, Leslie Brown, Mar Martinez
 AIRBORNE MAPPING OF VEGETATION CHANGES IN RECLAIMED AREAS AT HIGHLAND VALLEY BETWEEN 21 AND 28 1 Gary Borstad, Leslie Brown, Mar Martinez ASL Borstad Remote Sensing Inc, Sidney BC Bob Hamaguchi, Jaimie
Nantahala Pisgah NF Plan Process - Natural Range of Variation. Gary Kauffman National Forests in NC Ecologist
 Nantahala Pisgah NF Plan Process - Natural Range of Variation Gary Kauffman National Forests in NC Ecologist 1 NRV Plan Directives indicate must contain plan components, including standards or guidelines,
30 Years of Tree Canopy Cover Change in Unincorporated and Incorporated Areas of Orange County,
 30 Years of Tree Canopy Cover Change in Unincorporated and Incorporated Areas of Orange County, 1986-2016 Final Report to Orange County July 2017 Authors Dr. Shawn Landry, USF Water Institute, University
EVALUATING THE ACCURACY OF 2005 MULTITEMPORAL TM AND AWiFS IMAGERY FOR CROPLAND CLASSIFICATION OF NEBRASKA INTRODUCTION
 EVALUATING THE ACCURACY OF 2005 MULTITEMPORAL TM AND AWiFS IMAGERY FOR CROPLAND CLASSIFICATION OF NEBRASKA Robert Seffrin, Statistician US Department of Agriculture National Agricultural Statistics Service
Wildfires Mitigation Strategy and Incentives in Northern and Central Australia: Dr. Jeremy Russell-Smith
 30 August 13 th May 2015 Wildfires Mitigation Strategy and Incentives in Northern and Central Australia: Dr. Jeremy Russell-Smith Christopher Johns Research Analyst Northern Australia Research Programme
SUMMER DROUGHT: CAUSE OF DIEBACK IN PERENNIAL RYEGRASS SEED FIELDS?
 SUMMER DROUGHT: CAUSE OF DIEBACK IN PERENNIAL RYEGRASS SEED FIELDS? T.G. Chastain, T.M. Velloza, W.C. Young III, C.J. Garbacik and M.E. Mellbye Introduction. The cause of dieback, a form of premature stand
A Remote Sensing Based Urban Tree Inventory for the Mississippi State University Campus
 A Remote Sensing Based Urban Tree Inventory for the Mississippi State University Campus W. H. Cooke III a and S.G. Lambert b a Geosciences Department, GeoResources Institute, Mississippi State University,
2014REDD302_41_JCM_PM_ver01
 Joint Crediting Mechanism Proposed Methodology Form Cover sheet of the Proposed Methodology Form Form for submitting the proposed methodology Host Country Indonesia Name of the methodology proponents Mitsubishi
INTRODUCTION cont. INTRODUCTION. What is Impervious Surface? Implication of Impervious Surface
 Mapping Impervious Surface Changes In Watersheds In Part Of South Eastern Region Of Nigeria Using Landsat Data By F. I. Okeke Department of Geoinformatics and Surveying, University of Nigeria, Enugu Campus
Classification of Forest Dominate Types Using an Integrated Landsat and Ecological Model
 Classification of Forest Dominate Types Using an Integrated Landsat and Ecological Model Southern Region Existing Vegetation Mapping Pilot Project Test Supported By Region 8 Engineering/GeoSpatial 3 Year
Chapter 19. Nutrient Cycling and Retention. Chapter Focus. The hydrological cycle. Global biogeochemical cycles. Nutrient cycling
 Chapter Focus Chapter 19 Nutrient Cycling and Retention Nutrient cycling Phosphorus Nitrogen Carbon Water, Sulfur Decomposition Biotic effect on nutrient distribution and cycling Disturbance Global biogeochemical
Chapter 13 Private Native Forestry: River Red Gum
 Chapter 13 Private Native Forestry: River Red Gum Mike Thompson State Forests NSW, Deniliquin Introduction Private native forestry in the Riverina mainly relates to River Red Gum (floodplain forests) box
Fire History in the Colorado Rockies
 Fire History in the Colorado Rockies Brief overview of fire regimes in different forest ecosystem types Relationship of wildfire activity to climate variability Effects of fire exclusion and fire suppression
UNIT V--FUEL MOISTURE
 UNIT V--FUEL MOISTURE The fuel, moisture content in natural fuels is such an important factor to fuels availability for fire ignition and combustion that we have devoted an entire unit to the subject.
LIVING PLANT BIOMASS
 Proposed VCS Module/Tool LIVING PLANT BIOMASS Document Prepared by: The Earth Partners LLC. Title Living Plant Biomass Version 1.0 Date of Issue 19-9-2011 Type Module Sectoral Scope AFOLU Prepared By Contact
Keywords : Forest Fire Hazard, Fuel type, GIS, Soil Erosion Hazard, Land and Forest degradation
 Forest Fire Hazard Model Using Remote Sensing and Geographic Information Systems: Toward understanding of Land and Forest Degradation in Lowland areas of East Kalimantan, Indonesia Mulyanto Darmawan Graduate
Implementation of Forest Canopy Density Model to Monitor Forest Fragmentation in Mt. Simpang and Mt. Tilu Nature Reserves, West Java, Indonesia
 Implementation of Forest Canopy Density Model to Monitor Forest Fragmentation in Mt. Simpang and Mt. Tilu Nature Reserves, West Java, Indonesia Firman HADI, Ketut WIKANTIKA and Irawan SUMARTO, Indonesia
Forest Resources of the Black Hills National Forest
 United States Department of Agriculture Forest Service Rocky Mountain Research Station August 22 Forest Resources of the Black Hills National Forest Larry T. DeBlander About the author Larry T. DeBlander
Fire & Fuels Management
 Overview Fire & Fuels Management Southern California Adaptation Implementation Plan During a two- day workshop in January 2016, southern California resource managers and regional stakeholders discussed
VCS MODULE VMD0022 ESTIMATION OF CARBON STOCKS IN LIVING PLANT BIOMASS
 VMD0022: Version 1.0 VCS MODULE VMD0022 ESTIMATION OF CARBON STOCKS IN LIVING PLANT BIOMASS Version 1.0 16 November 2012 Document Prepared by: The Earth Partners LLC. Table of Contents 1 SOURCES... 2 2
Low-intensity fire burning on the forest floor. High-intensity crown fire
 Forest Fires: Answers to 12 Common Questions 1. Is wildfire bad for forests? No. Some forests need fire to be healthy, but it has to be the type of fire that the forest evolved with. Low-intensity fire
Enclosed farmland: Arable and Horticultural, Improved and Neutral Grasslands
 executive summary Executive summary 1 Countryside Survey 2000 (CS2000) and the Northern Ireland Countryside Survey 2000 (NICS2000) have been designed to provide detailed information about the habitats
deer. However, these treatments are more expensive and difficult to plan and accomplish. Deer rarely travel across broad expanses
 brush provides excellent cover for escape and for protection against weather extremes. An important aspect of this cover is its structure (height, density and canopy). Brush species with a moderate to
Adapting to Climate Change in the Northeast: Experiences from the Field. Climate Projections for Forests: A Quick Summary
 Adapting to Climate Change in the Northeast: Experiences from the Field NE SAF Annual Meeting, Nashua, NH 26 March 2014 Small Urban Mid coast Maine Large industrial Irving Woodlands Small woodlot Allen
Adapting to Climate Change in the Northeast: Experiences from the Field
 Adapting to Climate Change in the Northeast: Experiences from the Field NE SAF Annual Meeting, Nashua, NH 26 March 2014 Small Urban Mid-coast Maine Large industrial Irving Woodlands Small woodlot Allen
Forest Changes and Biomass Estimation
 Forest Changes and Biomass Estimation Project Title: Comparative Studies on Carbon Dynamics in Disturbed Forest Ecosystems: Eastern Russia and Northeastern China Supported by NASA Carbon Cycle Science
3/1/18 USING RADAR FOR WETLAND MAPPING IMPORTANCE OF SOIL MOISTURE TRADITIONAL METHODS TO MEASURE SOIL MOISTURE. Feel method Electrical resistance
 3/1/18 USING RADAR FOR WETLAND MAPPING SOIL MOISTURE AND WETLAND CLASSIFICATION Slides modified from a presentation by Charlotte Gabrielsen for this class. Southeast Arizona: Winter wet period From C.
Map accuracy assessment methodology and results for establishing Uganda s FRL
 Map accuracy assessment methodology and results for establishing Uganda s FRL 1 Table of Contents Acronyms... 4 1 Introduction... 5 2 Process and institutions involved... 5 3 Objectives of the map AA...
Climate and Biodiversity
 LIVING IN THE ENVIRONMENT, 18e G. TYLER MILLER SCOTT E. SPOOLMAN 7 Climate and Biodiversity Core Case Study: A Temperate Deciduous Forest Why do forests grow in some areas and not others? Climate Tropical
VISualize2012: Climate Change and Environmental Monitoring
 VISualize2012: Climate Change and Environmental Monitoring ESTIMATION OF ABOVE GROUND BIOMASS IN RESTORED JUVENILE MANGROVE STANDS: EVALUATION OF SPECTRAL AND IMAGE DOMAIN OPERATORS UTILIZING AIRBORNE
Predicting productivity using combinations of LiDAR, satellite imagery and environmental data
 Date: June Reference: GCFF TN - 007 Predicting productivity using combinations of LiDAR, satellite imagery and environmental data Author/s: Michael S. Watt, Jonathan P. Dash, Pete Watt, Santosh Bhandari
A North-American Forest Disturbance Record from Landsat Imagery
 GSFC Carbon Theme A North-American Forest Disturbance Record from Landsat Imagery Jeffrey Masek, NASA GSFC Forrest G. Hall, GSFC & UMBC Robert Wolfe, GSFC & Raytheon Warren Cohen, USFS Corvallis Eric Vermote,
Mapping burn severity in heterogeneous landscapes with a relativized version of the delta Normalized Burn Ratio (dnbr)
") Mapping burn severity in heterogeneous landscapes with a relativized version of the delta Normalized Burn Ratio (dnbr) Jay D. Miller USDA Forest Service 3237 Peacekeeper Way McClellan, CA 95652 Email:
Mapping burn severity in heterogeneous landscapes with a relativized version of the delta Normalized Burn Ratio (dnbr) Jay D. Miller USDA Forest Service 3237 Peacekeeper Way McClellan, CA 95652 Email:
Monitoring Crop Leaf Area Index (LAI) and Biomass Using Synthetic Aperture Radar (SAR)
 and Biomass Using Synthetic Aperture Radar (SAR)") Monitoring Crop Leaf Area Index (LAI) and Biomass Using Synthetic Aperture Radar (SAR) Mehdi Hosseini, Heather McNairn, Andrew Davidson, Laura Dingle-Robertson *Agriculture and Agri-Food Canada JECAM SAR
Monitoring Crop Leaf Area Index (LAI) and Biomass Using Synthetic Aperture Radar (SAR) Mehdi Hosseini, Heather McNairn, Andrew Davidson, Laura Dingle-Robertson *Agriculture and Agri-Food Canada JECAM SAR
SAR forest canopy penetration depth as an indicator for forest health monitoring based on leaf area index (LAI)
") SAR forest canopy penetration depth as an indicator for forest health monitoring based on leaf area index (LAI) Svein Solberg 1, Dan Johan Weydahl 2, Erik Næsset 3 1 Norwegian Forest and Landscape Institute,
SAR forest canopy penetration depth as an indicator for forest health monitoring based on leaf area index (LAI) Svein Solberg 1, Dan Johan Weydahl 2, Erik Næsset 3 1 Norwegian Forest and Landscape Institute,
Fire History and Stand Structure of a central Nevada. Pinyon-Juniper Woodland
 Fire History and Stand Structure of a central Nevada Pinyon-Juniper Woodland EXECUTIVE SUMMARY AND FINAL REPORT A Report to the Bureau of Land Management, Nevada State Office September, 2006 Peter J. Weisberg
Climate change and the Ecohydrology of Australia: Future Research Needs
 Climate change and the Ecohydrology of Australia: Future Research Needs Derek Eamus (and 16 others) Institute for Water and Environmental Resource Management (IWERM), UTS The question Modified wording:
K&C Phase 3 Brief project essentials. Climate-Relevant Modernization of the National Forest Policy and Piloting of REDD+ Measures in the Philippines
 K&C Phase 3 Brief project essentials Climate-Relevant Modernization of the National Forest Policy and Piloting of REDD+ Measures in the Philippines Francisco B. Tavora, Jr. 1, Jose Don T. De Alban 2, Enrico
Earth Observation for Sustainable Development of Forests (EOSD) - A National Project
 - A National Project") Earth Observation for Sustainable Development of Forests (EOSD) - A National Project D. G. Goodenough 1,5, A. S. Bhogal 1, A. Dyk 1, R. Fournier 2, R. J. Hall 3, J. Iisaka 1, D. Leckie 1, J. E. Luther
Earth Observation for Sustainable Development of Forests (EOSD) - A National Project D. G. Goodenough 1,5, A. S. Bhogal 1, A. Dyk 1, R. Fournier 2, R. J. Hall 3, J. Iisaka 1, D. Leckie 1, J. E. Luther
ANALYSIS OF CHANGES IN VEGETATION BIOMASS USING MULTITEMPORAL AND MULTISENSOR SATELLITE DATA
 ANALYSIS OF CHANGES IN VEGETATION BIOMASS USING MULTITEMPORAL AND MULTISENSOR SATELLITE DATA A. Akkartal a*, O. Türüdü a, and F.S. Erbek b a stanbul Technical University, Faculty of Civil Engineering,
Forest degradation has become a
 39 NDVI as indicator of degradation C.L. Meneses-Tovar A method to interpret remote sensing images is applied to over time. Carmen Lourdes Meneses-Tovar is Submanager for Remote Sensing, National Forestry
CANADA. INFORMAL SUBMISSION TO THE AWG-KP Information and Data on Land Use, Land-Use Change and Forestry (LULUCF) September 2009
 September 2009") CANADA INFORMAL SUBMISSION TO THE AWG-KP Information and Data on Land Use, Land-Use Change and Forestry (LULUCF) September 2009 1. INTRODUCTION Canada believes that improvements to LULUCF rules should
CANADA INFORMAL SUBMISSION TO THE AWG-KP Information and Data on Land Use, Land-Use Change and Forestry (LULUCF) September 2009 1. INTRODUCTION Canada believes that improvements to LULUCF rules should
3.3.3 Landscape-Directed Soil Sampling
 12 3 Soil Sampling and Analysis 3.1 Principles of Soil Sampling Soil sampling and analysis is the only way to determine the available nutrient status of a field and to receive field-specific fertilizer
Precision Horticulture Horticulture some perspectives
 Precision Horticulture some perspectives What is Precision Horticulture (or agriculture) an integrated information and production based farming system designed to increase long term, site-specific and
HIGH RESOLUTION AIRBORNE SOIL MOISTURE MAPPING
 HIGH RESOLUTION AIRBORNE SOIL MOISTURE MAPPING Jeffrey Walker 1, Rocco Panciera 1 and Ed Kim 2 1. Department of Civil and Environmental Engineering, University of Melbourne 2. Hydrospheric and Biospheric
Using Airborne Imagery, GIS & Remote Sensing for Ecological Monitoring and Mapping
 Using Airborne Imagery, GIS & Remote Sensing for Ecological Monitoring and Mapping Multi-spectral Aerial Photography Geo-referenced Oblique Aerial Photography Tools and Mapping Products AES Imaging Plane
Biophysical Indicators of Longleaf Pine Sandhill Change. Ryan R. Jensen Department of Geography, Geology, and Anthropology
 Biophysical Indicators of Longleaf Pine Sandhill Change Ryan R. Jensen Department of Geography, Geology, and Anthropology Sandhills Species Long-leaf pine Turkey oak Wiregrass Extremely rich herbaceous
Monitoring Natural Sal Forest Cover in Modhupur, Bangladesh using Temporal Landsat Imagery during
 Monitoring Natural Sal Forest Cover in Modhupur, Bangladesh using Temporal Landsat Imagery during 1972 2015 Hasan Muhammad Abdullah *, M. Golam Mahboob, Md.Mezanur Rahman, Tofayel Ahmed * Assistant Professor,
Extensive Ecoforest Map of Northern Continuous Boreal Forest, Québec, Canada
 Extensive Ecoforest Map of Northern Continuous Boreal Forest, Québec, Canada A. Robitaille¹, A. Leboeuf¹, J.-P. Létourneau¹, J.-P. Saucier¹ and É. Vaillancourt¹ 1. Ministère des Ressources naturelles et
Rabbits: A threat to conservation & natural resource management. How to rapidly assess a rabbit problem and take action
 Rabbits: A threat to conservation & natural resource management How to rapidly assess a rabbit problem and take action 1 The problem It takes less than one rabbit per hectare to prevent the successful
Change Monitoring Inventory
 Change Monitoring Inventory Ground Sampling Quality Assurance Standards Prepared by Ministry of Forests Resources Inventory Branch for the Terrestrial Ecosystem Task Force Resources Inventory Committee
CHANGES IN LAND COVER IN FRENCH GUYANA BETWEEN 1990 AND 2012
 D E L I N V E N TA I R E FORESTIER JULY 2015 = 35 CHANGES IN LAND COVER IN FRENCH GUYANA BETWEEN 1990 AND 2012 The Kyoto Protocol signatory countries are committed, depending on each individual case, to
Introducing the Moors for the Future Pilot, Peak District National Park
 Introducing the Moors for the Future Pilot, Peak District National Park Winner of The Copernicus Masters Sustainable Living Challenge 2016 Gail Millin-Chalabi Ioanna Tantanasi Adam Johnston Team based
Forest change detection and monitoring using passive and active remote sensing data (RS4FOR project)
") Forest change detection and monitoring using passive and active remote sensing data (RS4FOR project) Katarzyna Staszyńska, Ewa Grabska, Anna Zielonka, Katarzyna Ostapowicz Institute of Geography and Spatial
Forest change detection and monitoring using passive and active remote sensing data (RS4FOR project) Katarzyna Staszyńska, Ewa Grabska, Anna Zielonka, Katarzyna Ostapowicz Institute of Geography and Spatial
Sydney fires caused by people and nature
 University of Wollongong Research Online Faculty of Science, Medicine and Health - Papers Faculty of Science, Medicine and Health 2013 Sydney fires caused by people and nature Ross Bradstock University
Appendix A Silvicultural Prescription Matrix Spruce Beetle Epidemic and Aspen Decline Management Response
 Appendix A Silvicultural Prescription Matrix Spruce Beetle Epidemic and Aspen Decline Management Response Treatment objectives within the matrix are a combination of objectives for silvicultural, fuels,
Rice crop monitoring using EO data in the Mekong Delta, Vietnam
 The 10th GEOSS Asia-Pacific Symposium WG5: Agriculture and Food Security Hanoi, 18-20 th, Sep. 2017 Rice crop monitoring using EO data in the Mekong Delta, Vietnam Lam Dao Nguyen, Hoang Phi Phung, Dang
An Assessment of the Pull between Landuse and Landcover in Southwestern Nigeria and the Ensuing Environmental Consequences
 An Assessment of the Pull between Landuse and Landcover in Southwestern Nigeria and the Ensuing Environmental Consequences R.O. OYINLOYE and J. OLOUKOI INTRODUCTION HYDRO SPHERE ATMO SPHERE BIO SPHERE
Fire & Characteristics of Wildfire
 Fire & Characteristics of Wildfire Curriculum Links: Grade 7 Physical Science--Heat and Temperature (HT) Objectives In this lesson students will develop an operational definition of wildfires. They will
ASSESSING BIOMASS YIELD OF KALE (BRASSICA OLERACEA VAR. ACEPHALA L.) FIELDS USING MULTI-SPECTRAL AERIAL PHOTOGRAPHY
 FIELDS USING MULTI-SPECTRAL AERIAL PHOTOGRAPHY") ASSESSING BIOMASS YIELD OF KALE (BRASSICA OLERACEA VAR. ACEPHALA L.) FIELDS USING MULTI-SPECTRAL AERIAL PHOTOGRAPHY Jaco Fourie, Armin Werner and Nicolas Dagorn Lincoln Agritech Ltd, Canterbury, New Zealand
ASSESSING BIOMASS YIELD OF KALE (BRASSICA OLERACEA VAR. ACEPHALA L.) FIELDS USING MULTI-SPECTRAL AERIAL PHOTOGRAPHY Jaco Fourie, Armin Werner and Nicolas Dagorn Lincoln Agritech Ltd, Canterbury, New Zealand
ISPRS Archives XXXVIII-8/W3 Workshop Proceedings: Impact of Climate Change on Agriculture
 IMPACT ANALYSIS OF CLIMATE CHANGE ON DIFFERENT CROPS IN GUJARAT, INDIA Vyas Pandey, H.R. Patel and B.I. Karande Department of Agricultural Meteorology, Anand Agricultural University, Anand-388 110, India
Standard Methods for Estimating Greenhouse Gas Emissions from Forests and Peatlands in Indonesia
 Standard Methods for Estimating Greenhouse Gas Emissions from Forests and Peatlands in Indonesia (Version 2) Chapter 4: Standard Method Forest Management Events and Regimes MINISTRY OF ENVIRONMENT AND
Site Preparation: The First Step to Regeneration
 Site Preparation: The First Step to Regeneration People have been clearing land for agricultural purposes for centuries. They recognized early that weeds, brush, and stones had to be removed if crops were
Greenhouse Gas (GHG) Status on Land Use Change and Forestry Sector in Myanmar
 Status on Land Use Change and Forestry Sector in Myanmar") Greenhouse Gas (GHG) Status on Land Use Change and Forestry Sector in Myanmar CHO CHO WIN ASSISTANT RESEARCH OFFICER FOREST RESEARCH INSTITUTE YEZIN, MYANMAR International Workshop on Air Quality in Asia-Impacts
Greenhouse Gas (GHG) Status on Land Use Change and Forestry Sector in Myanmar CHO CHO WIN ASSISTANT RESEARCH OFFICER FOREST RESEARCH INSTITUTE YEZIN, MYANMAR International Workshop on Air Quality in Asia-Impacts
Indonesia Burning The Impact of Fire on Tropical Peatlands : Focus on Central Kalimantan
 Indonesia Burning The Impact of Fire on Tropical Peatlands : Focus on Central Kalimantan A collaborative research programme: *Sue Page, Univ. of Leicester, UK *Jack Rieley, Univ. of Nottingham, UK *Florian
THE INTRODUCTION THE GREENHOUSE EFFECT
 THE INTRODUCTION The earth is surrounded by atmosphere composed of many gases. The sun s rays penetrate through the atmosphere to the earth s surface. Gases in the atmosphere trap heat that would otherwise
ROLE OF REMOTE SENSING AND GIS IN FORESTRY
 ROLE OF REMOTE SENSING AND GIS IN FORESTRY MEGHA GUPTA 1, ANKITA KHARE 2 & SRASHTI PATHAK 3 1,2,3 Student(cs),IITM Gwalior, Gwalior Email:meghagupta492@yahoo.com, ankita.khare27@gmail.com, srashti.cseengg@gmail.com
Joint use of habitat by red kangaroos and shorthorn cattle in arid central Australia
 Australian Journal of Ecology (98) 7, 69-74 Joint use of habitat by red kangaroos and shorthorn cattle in arid central Australia M. L, DUDZINSKI* Division of Mathematics and Statistics, CSIRO, PO Box 965,
A Forest Cover Change Study Gone Bad
 A Forest Cover Change Study Gone Bad Lessons Learned(?) Measuring Changes in Forest Cover in Madagascar Ned Horning Center for Biodiversity and Conservation American Museum of Natural History (horning@amnh.com)
Program. Understanding Risk. Northern Fire Mapping: Developing robust fire extent and severity mapping products for the tropical savannas
 Program Project Title Project Leaders Lead End User Researcher Understanding Risk Northern Fire Mapping: Developing robust fire extent and severity mapping products for the tropical savannas Prof. Jeremy
By Gerald Urquhart, Walter Chomentowski, David Skole, and Chris Barber
 By Gerald Urquhart, Walter Chomentowski, David Skole, and Chris Barber The clearing of tropical forests across the Earth has been occurring on a large scale basis for many centuries. This process, known
Using Aerial Imagery for Irrigation Management Jake LaRue Valmont Irrigation, Valley, NE
 Using Aerial Imagery for Irrigation Management Jake LaRue Valmont Irrigation, Valley, NE jlarue@valmont.com Abstract Water, energy and labor resources are often limited and the need for improvements in
Wood Storage Best Practices in Fairbanks, Alaska
 Wood Storage Best Practices in Fairbanks, Alaska June 27, 2011 A project report prepared by CCHRC for: Sierra Research CCHRC Web Site: http:// P.O. Box 82489, Fairbanks, AK 99708 Phone: (907)457-3454 Fax:
Summary of the socio-economic impact of Copernicus in the EU
 Summary of the socio-economic impact of Copernicus in the EU ESA Since the entry into service of Copernicus first satellite, Sentinel-1A, in 2014, the impacts of the programme are witnessed beyond the
Future vulnerability assessment of forest fire sector to climate change impacts in Cyprus
 Future vulnerability assessment of forest fire sector to climate change impacts in Cyprus G. Lemesios, A. Karali, C. Papadaskalopoulou, S. Pitsari, D. Malamis, K. Ioannou, M. Zachariou-Dodou, C. Giannakopoulos,
Presentation of Suriname. 10 may 2011 Quito. R. Matai, M, Playfair, C. Sanches
 Presentation of Suriname 10 may 2011 Quito R. Matai, M, Playfair, C. Sanches Location: Northeastern coast of South America, 2-6 Northern latitude and 54-58 Western longitude. Inhabitants: 480,000 Land
An Analysis of Forest Fire History on the Little Firehole River Watershed, Yellowstone National Park
 University of Wyoming National Park Service Research Center Annual Report Volume 1 1st Annual Report, 1977 Article 16 1-1-1977 An Analysis of Forest Fire History on the Little Firehole River Watershed,
Energy Efficiency Impact Study
 Energy Efficiency Impact Study for the Preferred Resources Pilot February, 2016 For further information, contact PreferredResources@sce.com 2 1. Executive Summary Southern California Edison (SCE) is interested
The use of satellite pictures and data provided by drones for the purposes of identification of crops and assessment of plant production
 The use of satellite pictures and data provided by drones for the purposes of identification of crops and assessment of plant production Tomasz Milewski Białobrzeska 11/64, 02-379 Warsaw Central Statistical
Forestry Department Food and Agriculture Organization of the United Nations FRA 2000 GLOBAL FOREST COVER MAP. Rome, November 1999
 Forestry Department Food and Agriculture Organization of the United Nations FRA 2000 GLOBAL FOREST COVER MAP Rome, November 1999 Forest Resources Assessment Programme Working Paper 19 Rome 1999 The Forest
AUSTRALIA. The system of practices that identify forest lands subject to Forest Management;
 AUSTRALIA Submission to the SBI and SBSTA February 2011 Forest Management Reference Level Submission I. Overview This submission contains estimates of Forest Management reference levels for Australia as
Country fact sheet. Land cover Poland. September Photo: Toni García, My City/EEA
 Country fact sheet Land cover 2012 Poland September 2017 Photo: Toni García, My City/EEA Land cover 2012 Overview of land cover & change The comparison of annual change rates for the last three observing
User Awareness & Training: LAND. Tallinn, Estonia 9 th / 10 th April 2014 GAF AG
 User Awareness & Training: LAND Tallinn, Estonia 9 th / 10 th April 2014 GAF AG Day 2 - Contents LAND (1) General Introduction to EO and the COPERNICUS Sentinel Programme Overview of COPERNICUS/GMES LAND
Integrating field and lidar data to monitor Alaska s boreal forests. T.M. Barrett 1, H.E. Andersen 1, and K.C. Winterberger 1.
 Integrating field and lidar data to monitor Alaska s boreal forests T.M. Barrett 1, H.E. Andersen 1, and K.C. Winterberger 1 Introduction Inventory and monitoring of forests is needed to supply reliable
Using precision agriculture technologies for phosphorus, potassium, and lime management with lower grain prices and to improve water quality
 214 Integrated Crop Management Conference - Iowa State niversity 137 sing precision agriculture technologies for phosphorus, potassium, and lime management with lower grain prices and to improve water
Intensively Managed Pine Plantations
 Intensively Managed Pine Plantations QDMA Articles By: Scott Edwards, Steve Demarais, and Andy Ezell If you are like many deer hunters in the Southeast, your primary hunting area is leased from forest
SandYare the strata-weighted mean, and standard
 A LANDSAT STAND BASAL AREA CLASSIFICATION SUITABLE FOR AUTOMATING STRATIFICATION OF FOREST INTO STATISTICALLY EFFICIENT STRATA Emily B. Schultz a, Thomas G. Matney a, David L. Evans a, and Ikuko Fujisaki
How climate effects who lives where. The World s Terrestrial Biomes
 How climate effects who lives where. The World s Terrestrial Biomes Widely separated regions share similarities Biome = major regional complex of similar communities recognized by Plant type Vegetation
Silas Little Experimental Forest Network
 United States Department of Agriculture Service Silas Little Experimental Northern Research Station Experimental Network NRS-INF-19-12 Silas Little Experimental The Silas Little Experimental (SLEF) is
Improving flood inundation monitoring and modelling using remotely sensed data
 Improving flood inundation monitoring and modelling using remotely sensed data Article Accepted Version Mason, D., Garcia Pintado, J. and Dance, S. (2014) Improving flood inundation monitoring and modelling