User s Manual for the BMPTRAINS Model
|
|
|
- Mavis Carpenter
- 6 years ago
- Views:
Transcription


1 User s Manual for the BMPTRAINS Model Marty Wanielista, Harvey Harper, Eric Livingston, Mike Hardin, Przemyslaw Kuzlo. and Ikiensinma Gogo-Abite RETENTION BASIN WET DETENTION / MAP EXFILTRATION TRENCH RAIN GARDEN SWALE USER DEFINED BMP PERVIOUS PAVEMENT GREENROOF VEGETATED NATURAL BUFFER STORMWATER HARVESTING RAINWATER HARVESTING VEGETATED FILTER STRIP FILTRATION LINED REUSE POND & UNDERDRAIN INPUT TREE WELL View Media Mixes GO TO COST ANALYSIS NOTE!!!: All individual system must be sized prior to being analyzed in conjunction with other systems. Please read instructions in the CATCHMENT AND TREATMENT SUMMARY RESULTS tab for more information. CATCHMENT AND TREATMENT SUMMARY RESULTS FDOT Project number: BDV 24 # July 2017 Updates to the Model are frequent and thus the Manual may not always be in agreement with the screen captures for each example problem. The authors appreciate the input from the many users of the Model and Manual.
2 Table of Contents List of Tables...v List of Figures... vi Introduction...1 Literature Review...2 Jordan/Falls Lake Stormwater Nutrient Load Accounting Model... 2 BMP SELECT Model... 3 Clinton River Site Evaluation Tool (SET)... 5 Virginia Runoff Reduction Method Worksheet... 7 Department of Environmental Services (DES) Pollutant Loading Spreadsheet Model... 9 Stormwater Best Management Practice Design Workbook Stormwater Management and Design Aid (SMADA) Other Publications and Comparisons Best Management Practices Treatment Aid (BMPTRAINS) Introduction Watershed Characteristics Stormwater Treatment Methods Retention Basin Exfiltration Trench Bio-sorption Activated Media (BAM) Mixes Pervious Pavement Wet Detention Stormwater and Rainwater Harvesting Floating Islands (wetlands) Filtration Greenroof Vegetated Natural Buffer and Vegetated Filter Strip ii
3 Swale Rain Garden Tree Well Lined Reuse Pond with Underdrain Input User Defined BMPs Catchment and Treatment Summary Results Example Problems Introduction Example problem # 1 - swale - specified removal efficiency of 80% Example problem # 2 - retention basin - pre vs. post-development loading Example problem # 3 - retention basin - specified removal efficiency of 75% Example problem # 4 - wet detention - pre vs. post-development loading with harvesting Example problem # 5 - wet detention after and in series with retention system (retention basin, exfiltration trench, swales, retention tree wells, pervious pavement, etc.) Example problem # 6 - retention systems in series - pre vs. post-development loading Example problem # 7 - wet detention systems in series - pre vs. post-development loading Example problem # 8 limited area for treatment and benefits of co-mingling treatment Example problem # 9 - vegetated natural buffer in series with wet detention Example problem # 10 Use of Rain Gardens Example problem # 11 Three Catchments Example problem # 12 Four Catchments Example problem # 13 BMP Analysis Example problem # 14 BMP Analysis for Offsite Drainage into an Onsite BMP Example problem # 15 Different N and P removal efficiencies specified Example problem # 16 More than 4 catchments Example problem # 17 Cost Analysis Appendix A EMCs and Land Use Appendix B Cost Considerations and Data Appendix C BMP Terminology and Descriptions List of References iii
4 iv
5 List of Tables Table 1 - Comparison table of BMP options available within different models Table 2 Examples of Pollution Control Media Mixes Table 3 Costs for pervious pavement in 2016 dollars Table 4 Scenario Table 5 Retention basin costs Table 6 Scenario Table 7 Scenario Table 8 Scenario Table 9 Scenario Table B-1 United States CPI-U (U.S. Department of Labor Statistics, 2016) Table B-2 Real Interest Rates for the United States (The World Bank) Table B-3 Typical Base Capital Construction Costs for BMPs (Strassler, Pritts, & Strellec, 1999) Table B-4 Annual Maintenance Costs of BMPs (Strassler, Pritts, & Strellec, 1999) Table B-5 BMP expected life span (Taylor, et al., 2014) Table B-6 Capital and Maintenance Cost Data, with Normalization per Hectare of Impervious Cover Treated (Houle, Roseen, Ballestero, Puls, & Sherrard Jr., 2013) Table B-7 Summary of Removal Performance and Comparison per kg Removed of TSS and per g Removed of TP and TN as Dissolved Inorganic Nitrogen (DIN) (Houle, Roseen, Ballestero, Puls, & Sherrard Jr., 2013) Table B-8 US Street Sweeping Cost Information (Taylor & Wong, 2002) v
6 List of Figures Figure 1 - Watershed Characteristics input tab for the Jordan/Falls Lake Stormwater Nutrient Load Accounting Model Figure 2 -Structure of the Jordan/Falls Lake Stormwater Nutrient Load Accounting Model Figure 3 - Starting page of the BMP SELECT Model Figure 4 - Structure of the BMP SELECT Model Figure 5 - Site Data input worksheet for the Clinton River Site Evaluation Tool Figure 6 - Schematic of the Clinton River Site Evaluation Tool... 7 Figure 7 - Site Data input worksheet for the Virginia Runoff Reduction Method Worksheet Figure 8 - Schematic of the Virginia Runoff Reduction Method Worksheet Figure 9 - Input worksheet for the DES Simple Method Pollutant Loading Spreadsheet Model... 9 Figure 10 - Schematic of the DES Simple Method Pollutant Loading Spreadsheet Model Figure 11 - Starting page of the Stormwater Best Management Practice Design Workbook Figure 12 - Introduction Page worksheet Figure 13 - General Site Information worksheet Figure 14 - Watershed Characteristics worksheet Figure 15 - Stormwater Treatment Analysis worksheet Figure 16 - Retention Basin worksheet Figure 17 - Exfiltration Trench worksheet Figure 18 - Pervious Pavement worksheet Figure 19 - Wet Detention worksheet Figure 20 - Stormwater Harvesting worksheet Figure 21 Filtration worksheet Figure 22 - Greenroof worksheet Figure 23 - Vegetated Natural Buffer worksheet Figure 24 - Swale worksheet Figure 25 - Rain Garden worksheet Figure 26 Tree Well worksheet Figure 27 Lined Reuse Pond with Underdrain Input worksheet Figure 28 - User Defined BMP worksheet for Street Sweeping Figure 29 - User Defined BMP for Misc. Retention Figure 30 - User Defined BMP for Misc. Detention Figure 31 - Multiple Catchments and Treatment Systems Analysis worksheet Figure 32 - Introduction Page worksheet Figure 33 - Introduction Page worksheet Figure 34 - Introduction Page worksheet Figure 35 - General Site Information worksheet Figure 36 - Name of Project Input Figure 37 - General Site Information worksheet Figure 38 - Meteorological Zone Map Description vi
7 Figure 39 - Mean Annual Rainfall Map worksheet Figure 40 - General Site Information worksheet Figure 41 - Watershed Characteristics - Catchment Configuration selection Figure 42 - Watershed Characteristics worksheet Figure 43 - Swale worksheet Figure 44 Catchment and Treatment Summary Results Figure 45 - General Site Information worksheet Figure 46 - Watershed Characteristics worksheet Figure 47 - Retention Basin worksheet Figure 48 Catchment and Treatment Summary Results Figure 49 - General Site Information worksheet Figure 50 - Watershed Characteristics worksheet Figure 51 - Retention Basin worksheet Figure 52 - Summary Input & Output worksheet Figure 53 - General Site Information worksheet Figure 54 - Watershed Characteristics worksheet Figure 55 - Wet Detention worksheet Figure 56 - Summary Input & Output worksheet Figure 57 - Reuse or Harvesting Pond Calculation Worksheet Figure 58 - Summary Input and Output Worksheet for Two BMPs in Series Figure 59 - General Site Information worksheet Figure 60 - Watershed Characteristics worksheet Figure 61 - Wet Detention worksheet Figure 62 - Retention Basin worksheet Figure 63 Catchment and Treatment Summary Results worksheet Figure 64 - General Site Information worksheet Figure 65 - Watershed Characteristics worksheet Figure 66 Vegetated Areas (Example Tree Well) worksheet Figure 67 Required remaining treatment from the Vegetated Areas (Example Tree Well) worksheet.. 79 Figure 68 - Exfiltration Trench worksheet Figure 69 - Retention Basin worksheet Figure 70 - Multiple Watersheds and Treatment Systems Analysis worksheet Figure 71 - Retention Basin worksheet illustrating retention in series Figure 72 - General Site Information worksheet Figure 73 - Watershed Characteristics worksheet Figure 74 - Floating Island with Wet Detention worksheet Figure 75 Catchment and Treatment Summary Results for Example Problem Figure 76 - General Site Information worksheet Figure 77 - Watershed Characteristics worksheet Figure 78 - Retention Basin worksheet for required treatment of additional catchment area Figure 79 - Watershed Characteristics worksheet Figure 80 - Retention Basin worksheet vii
8 Figure 81 Catchment and Treatment Summary Results worksheet Figure 82 - General Site Information worksheet Figure 83 - Watershed Characteristics worksheet Figure 84 - Wet Detention worksheet Figure 85 - Vegetated Natural Buffer worksheet Figure 86 Catchment and Treatment Summary Results worksheet Figure 87 - General Site Information worksheet Figure 88 - Watershed Characteristics worksheet Figure 89 Rain Garden worksheet Figure 90 - Catchment and Treatment Summary Results Figure 91 Rain Garden Figure 92 Rain Garden Selecting a Media Mix Figure 93 - Catchment and Treatment Summary Results Figure 94 - General Site Information worksheet Figure 95 - Catchment Configuration Options worksheet Figure 96 - Watershed Characteristics worksheet Figure 97 Swale worksheet Figure 98 - Retention Basin worksheet Figure 99 - Wet Detention worksheet Figure Catchment and Treatment Summary Results Figure Catchment Configuration Options worksheet Figure Watershed Characteristics worksheet Figure Catchment and Treatment Summary Results Figure General Site Information worksheet Figure Catchment Configuration for part 1 of this problem Figure Watershed Characteristics worksheet Figure 107 Swale worksheet Figure Retention Basin worksheet Figure Wet Detention worksheet Figure Catchment and Treatment Summary Results Figure Catchment Configuration K Figure Watershed Characteristics worksheet Figure Catchment and Treatment Summary Results Figure General Site Information worksheet Figure Catchment Configuration for this problem Figure Watershed Characteristics worksheet Figure Retention Basin worksheet Figure Catchment and Treatment Summary Results Figure General Site Information worksheet Figure Catchment Configuration for part 1 of this problem Figure Watershed Characteristics worksheet Figure Retention Basin worksheet viii
9 Figure Catchment and Treatment Summary Results Figure Catchment Configuration C Figure Watershed Characteristics worksheet Figure Catchment and Treatment Summary Results Figure General Site Information worksheet Figure Catchment Configuration for this problem Figure Watershed Characteristics worksheet Figure Wet Detention worksheet Figure Catchment and Treatment Summary Results Figure 132 More than Four Catchments with Possible BMPs at Each One Figure 133 Composite Catchment Configurations Figure 134 General Site Information Input Data Figure 135 Catchment Data for Composite BMP Train # Figure 136 Net Improvement for Composite Catchment # Figure 137 Retention BMP for catchment one of Composite Catchment #1 Example Problem Figure 138 Wet Detention BMPs for Composite Catchment # Figure Effectiveness for Composite Catchment # Figure Catchment Characteristics for Composite Catchment # Figure Retention Worksheet for Composite Catchment #2 Example Problem Figure Effectiveness for Composite Catchment # Figure Catchment Data for Composite Catchment # Figure User Defined Effectiveness from Composites # 1 and #2 as input to Composite # Figure Retention Worksheet for Composite Catchment # Figure Effectiveness Summary worksheet Figure General Site Information worksheet Figure 148 Watershed Characteristics Worksheet Figure 149 Stormwater Treatment Analysis worksheet Figure 150 Pervious Pavement BMP tab Figure 151 Catchments and Treatment Summary Results Figure Life Cycle Cost Comparison Worksheet Figure 153 Life Cycle Cost Analysis Summary Figure Pervious Pavement BMP worksheet Figure Retention Basin BMP worksheet Figure Catchments and Treatment Summary Results Figure Updated Life Cycle Cost Comparison Worksheet Figure 158 -Life Cycle Cost Analysis Summary Figure Pervious Pavement BMP worksheet Figure Retention Basin BMP worksheet Figure Catchments and Treatment Summary Results Figure Life Cycle Cost Comparison Worksheet Figure Life Cycle Cost Analysis Summary Figure Pervious Pavement BMP worksheet ix
10 Figure Retention Basin BMP worksheet Figure Life Cycle Cost Comparison Worksheet Figure Life Cycle Cost Analysis Summary Figure Pervious Pavement BMP worksheet Figure Retention Basin BMP worksheet Figure B-1 US Department of Labor Statistics Inflation Calculator (US Department of Labor Statistics, 2016) Figure B-2 Annualized maintenance costs per system per hectare of impervious cover treated per maintenance activity classification (Houle, Roseen, Ballestero, Puls, & Sherrard Jr., 2013) [Based on publication date, assume that all operating costs are on a 2012 basis unless otherwise stated.] Note in Florida a detention pond is the same as the category Retention Pond listed in Figure B x
11 Introduction Pollution in stormwater, also known as nonpoint source pollution, contains an array of contaminates which contribute to the degradation of water quality (both surface and ground water). According to the Environmental Protection Agency (EPA), stormwater pollution is the leading remaining cause of water quality problems reported by the states (EPA, 2010). Stormwater discharges to surface and ground water can be high in pollutant mass derived from both natural and manmade sources. Stormwater can be polluted with nutrients, sediments, oils, greases, toxic chemicals, wastes, and bacteria. An increase in stormwater pollution can be caused by many factors, and can be most often associated with land use activities. The magnitude of the mass load of pollution transported by urban runoff to receiving water bodies is in most cases greater than that of treated sewage in many cases (Viessman and Hammer, 2005). The control of stormwater pollution at its source can be achieved through the implementation of low impact development (LID) best management practices (BMPs). A best management practice is a stormwater control system that is economically and technically feasible as a means to meet water quality goals (Wanielista et al., 1997). There are many types of structural and nonstructural stormwater BMPs which are currently used to minimize pollution. There are also many BMPs, which because of limited operational results have not been as popular in application. However, there has been research conducted in recent years in an effort to assess and predict the effectiveness of stormwater BMPs (Denver Urban Drainage and Flood Control District, 2010; Chopra et al., 2011; FDEP, 2010; Hardin, 2006; Harper and Baker, 2007; Low Impact Development Center, 2011; North Carolina Division of Water Quality, 2012; Ryan et al., 2010; USEPA, 2007; USEPA, 2005; Urban Drainage and Flood Control District, 2011; Wanielista et al., 2011; Wanielista et al., 1991; Wanielista et al., 2011). The main objective of this manual is to report on the use of an EXCEL spreadsheet model to evaluate stormwater nutrient loads as well as treatment efficiencies of BMPs based on the findings of studies conducted in recent years within the State of Florida. The model is to serve as a comprehensive assessment and evaluation tool, which can be used by private entities and governmental agencies to aid in the choice of stormwater BMPs. Another benefit of this model is to educate individuals about the availability and benefits of different BMP options. 1

12 Literature Review Jordan/Falls Lake Stormwater Nutrient Load Accounting Model The Jordan/Falls Lake Stormwater Nutrient Load Accounting Model is an Excel spreadsheet model developed by North Carolina State University in coordination with the North Carolina Department of Environment and Natural Resources. While the original application of this tool is the Jordan Lake Nutrient Strategy, it may also be applied to any location within the State of North Carolina (Jordan/Falls Lake Stormwater Nutrient Load Accounting Tool (Version 1.0) User s Manual, 2011). Input data for the model is shown in Figure 1. Figure 1 - Watershed Characteristics input tab for the Jordan/Falls Lake Stormwater Nutrient Load Accounting Model. The Jordan Lake model is used to calculate the annual Total Phosphorus and Total Nitrogen mass loading produced by runoff from the existing condition and new, developed condition. Additionally, it is used to calculate nutrient removal by the stormwater BMPs chosen for a watershed. Calculations performed within the model are governed by two basic principles: Simple Method (for runoff volume and pollutant loading calculations) and the median effluent concentration BMP efficiency metric (for BMP reduction calculations) (Jordan/Falls Lake Stormwater Nutrient Load Accounting Tool (Version 1.0) User s Manual, 2011). 2

13 The structure and set up of the Jordan Lake loading tool is relatively simple and easy to follow. The first tab, entitled Instructions, contains a description and user information for the users of the spreadsheet tool. It also contains physiographic region and annual precipitation location maps for the State of North Carolina to aid with appropriate input selection in the model. The next two worksheets are Watershed Characteristics and BMP Characteristics input tabs (Figure 2). On the Watershed Characteristics worksheet, users enter all information pertaining to the site of interest, including both pre- and post-development conditions (Jordan/Falls Lake Stormwater Nutrient Load Accounting Tool (Version 1.0) User s Manual, 2011). The information relevant to the type and properties of the BMPs is specified in the BMP Characteristics tab. Figure 2 -Structure of the Jordan/Falls Lake Stormwater Nutrient Load Accounting Model. The setup of the model allows the user to divide the developed watershed into as many as six catchments. Each catchment can be treated by up to three BMPs. The available BMP choices comprise of Bioretention with IWS (Internal Water Storage Zone), Bioretention without IWS, Dry Detention Pond, Grassed Swale, Green Roof, Level Spreader/Filter Strip, Permeable Pavement, Sand Filter, Water Harvesting, Wet Detention Pond, and Wetland (Jordan/Falls Lake Stormwater Nutrient Load Accounting Tool (Version 1.0) User s Manual, 2011). The summary of the analysis output is displayed in the final worksheet entitled Development Summary (Figure 2). BMP SELECT Model The BMP SELECT Model (Figure 3) is a Microsoft Excel based model developed on behalf of Water Environment Research Foundation (WERF) by a work group consisting of ACR, LLC, Colorado State University and the University of Utah. This software was developed by WERF in response to WERF Subscribers who desired a simple tool that could be readily applied 3

14 to evaluate the relative performance and cost implications of various BMP control options (Pomeroy and Rowney, 2009). The BMP SELECT Model is a tool that has the capability of evaluating water quality parameters such as Total Suspended Solids, Total Nitrogen, Total Phosphorus and Total Zinc. It also evaluates the effectiveness of stormwater BMPs and the cost implications associated with the application of these systems. The stormwater BMPs that can be analyzed with this software include extended detention, bioretention, wetlands, swales, permeable pavement and filters. Figure 3 - Starting page of the BMP SELECT Model. The BMP SELECT Model is a planning-level tool with a focus on limiting the extent and/or complexity of input data necessary to generate results (Pomeroy and Rowney, 2009). The design of the model allows the user to run the calculations with limited information about the watershed characteristics, BMP types, and BMP sizes. The calculations performed by the model are focused in four major areas; watershed runoff calculations, BMP quantity calculations, pollutant load calculations, and cost calculations. 4

15 The BMP SELECT Model is relatively easy to use. The calculation workflow is shown in Figure 4. Prior to beginning to work with the model, the user may change default Watershed Parameters, BMP Parameters and Meteorological Data in the Set Default Values window. The model has the capability of adding, saving, and retrieving multiple scenario data in the Save or Retrieve Scenario tab. All the information pertaining to the watershed and the BMPs is indicated in the Edit Catchments and BMPs tab. Once all the required input is indicated, the water quantity and quality calculations are performed in the Do QQ Calculations (quantity and quality) tab. The cost calculations are performed in the Do Cost Calculations section. Figure 4 - Structure of the BMP SELECT Model. Clinton River Site Evaluation Tool (SET) The Clinton River Site Evaluation Tool (SET) is a Microsoft Excel spreadsheet, which is designed to aid in the assessment of development plans and available Best Management Practices (BMPs) to achieve water quality objectives (Tetra Tech, 2008). Another model was developed by the U.S. EPA (2007) and Tetra Tech that is a Geographic based model called SUSTAIN for cost analysis and BMP efficiencies. The SET model is presented here. The SET model evaluates the annual pollutant loads for the Total Suspended Solids, Total Nitrogen, Total Phosphorus, E. Coli Bacteria and Copper based on the pre- and postdevelopment watershed characteristics. The BMP selection in the model is based on achieving the annual sediment load reduction percentage or a specified runoff volume reduction target. The 5
. Here, the user indicates the general site information and the type of analysis that they want to perform.")
16 BMP selection in the model is not determined however by matching the pre- and postdevelopment annual nutrient loads. The SET spreadsheet model is very easy to use, even for first time users. The model opens with only one visible worksheet entitled Site Data (Figure 5). Here, the user indicates the general site information and the type of analysis that they want to perform. The next input tab, entitled Land Use, has input fields for the overall site land uses for both proposed and existing conditions (Tetra Tech, 2008). In Figure 6, input data for all drainage areas (DAs) are assigned to include proposed pervious, impervious, and stormwater management areas to their appropriate DA. Each of the respective drainage areas are then assigned to the BMPs which serve these areas in the BMPs worksheet. In Figure 6 is also shown the BMP analysis workflow Figure 5 - Site Data input worksheet for the Clinton River Site Evaluation Tool. The BMPs available for analysis include extended wet detention, extended dry detention, infiltration basin, bioretention, sand filter, infiltration trench, vegetated swale, vegetated filter strip, dry well, rain barrel, cistern, green roof, porous pavement, hydrodynamic device, catch 6

17 basin with sump, street sweeping and user-defined BMP. If the user cannot find an appropriate BMP from a wide selection built into the model, a custom treatment system can be specified in the User BMP sheet. However, the pollutant removal efficiencies and other properties of the user specified BMP must be included with this selection. Figure 6 - Schematic of the Clinton River Site Evaluation Tool Virginia Runoff Reduction Method Worksheet The Virginia Runoff Reduction Method Worksheet is a model developed on behalf of the Virginia Department of Conservation and Recreation by the Center for Watershed Protection, Inc. and the Chesapeake Stormwater Network. The spreadsheet is designed to help users plan combinations of stormwater BMPs for a particular site in order to meet the standards in the proposed regulations within the State of Virginia (Virginia Department of Conservation and Recreation, 2011). There are two versions of the model, one for new development and one for redevelopment. The Virginia Runoff Reduction Method Worksheet calculates the annual postdevelopment Total Phosphorus and Total Nitrogen loadings and the required post-development treatment volume. The methodology used in this model is based on the calculation of the postdevelopment pollutant loads associated with the site-specific conditions and selection of BMPs to meet the pre-determined target pollutant loads. The input data worksheet for post-development conditions is shown in Figure 7. The target pollutant load, which is only established for Total Phosphorus, is achieved by the appropriate combination of the Environmental Site Design, Runoff Reduction, and Pollutant Removal Practices. 7


18 Figure 7 - Site Data input worksheet for the Virginia Runoff Reduction Method Worksheet. The Virginia Runoff Reduction Method Worksheet is a very straightforward modeling tool. In the first worksheet entitled Site Data, the user indicates the site information such as annual rainfall and post-development land cover. The following five worksheets (Figure 8) allow the user to split the project area into five separate drainage areas. In each of the worksheets, the user may choose from a large menu of Runoff Reduction and Pollution Reduction practices and apply them to the respective drainage basins. The Runoff Reduction practices include bioretention, infiltration, green roofs, dry swales, wet swales, grass channels, extended detention ponds, permeable pavement and impervious surface disconnection. Finally, the results of the analysis are diplayed in the Water Quality Compliance worksheet. Figure 8 - Schematic of the Virginia Runoff Reduction Method Worksheet. 8
 Watershed Management Bureau.")
19 Department of Environmental Services (DES) Pollutant Loading Spreadsheet Model The Simple Method Pollutant Loading Model (Figure 9) has been developed by the New Hampshire Department of Environmental Services (NHDES) Watershed Management Bureau. This Microsoft Excel spreadsheet is based on the Simple Method that estimates pollutant loading of stormwater runoff for urban and developing areas (New Hampshire Department of Environmental Services, 2011). Figure 9 - Input worksheet for the DES Simple Method Pollutant Loading Spreadsheet Model The methodology used in this model estimates the annual pre- and post-development Total Suspended Solids, Total Phosphorus, and Total Nitrogen loads. This technique is recommended by NHDES because of the modest amount of information it requires, which includes subwatershed drainage area and impervious cover, annual precipitation, and stormwater runoff pollutant concentrations (New Hampshire Department of Environmental Services, 2011). 9

20 The Simple Method Pollutant Loading Spreadsheet Model requires the user to input the BMP removal efficiencies for all pollutants included in the analysis. This information can be obtained from the NHDES Stormwater Manual that contains BMP removal effectiveness values of different stormwater systems. The NHDES Simple Method Pollutant Loading Spreadsheet Model is simple in operation. The sequence of the analysis is shown in Figure 10. The first tab contains general information about the model and instructions for the user. In the following two worksheets, the user indicates the pre- and post-development watershed information. These input worksheets require information about land use, types of pervious areas, and types of impervious areas. The next sheet requires input information about the average annual precipitation. In the last input sheet, analyzed BMPs are specified along with their pollutant removal efficiencies. It also allows the user to provide pollutant load reductions associated with the use of low nutrient fertilizers under post-development conditions (Comstock, 2010). The model does not contain any specific BMPs or the data on their associated effectiveness. Therefore, the user is required to provide this information. All results of the analysis are provided in the last worksheets. Figure 10 - Schematic of the DES Simple Method Pollutant Loading Spreadsheet Model. 10
21 Stormwater Best Management Practice Design Workbook The Stormwater Best Management Practice Design Workbook is an Excel spreadsheet model published by the Urban Drainage and Flood Control District (UDFCD) in Denver, Colorado. This tool has been developed by the UDFCD in an effort to the help users of their stormwater management manual to select BMPs that are best suited for their project. This tool helps to screen BMPs at the planning stages of development (Urban Storm Drainage Criteria Manual Volume 2). The UD-BMP tool provides a list of BMPs for consideration based on site-specific conditions (Urban Storm Drainage Criteria Manual Volume 2). The BMP evaluation in the Stormwater Best Management Practice Design Workbook is based on a few steps. First, the model factors in Excess Urban Runoff Volume (EURV) reduction. Quantification of runoff volume reduction takes into account such practices as Minimizing Directly Connected Impervious Area (MDCIA), implementation of Low Impact Development (LID) practices, and other BMPs. Factoring these runoff reduction practices into the model yield total imperviousness and effective imperviousness values. These values can then be used in the assessment and sizing of the BMPs. The functions provided by BMPs may include volume reduction, treatment and slow release of the water quality capture volume (WQCV), and combined water quality/flood detention (Urban Storm Drainage Criteria Manual Volume 3, 2010). The BMP selection in the model is based on achieving the annual runoff mass reduction target. The BMP selection in the BMPTRAINS model can also be based also on a pre-determined % annual nutrient removal. The UDFCD Stormwater Best Management Practice Design Workbook is user friendly and simple in operation. The introduction page (Figure 11) contains general information about the function and content of the model. The model contains a helpful tab entitled BMP Selection. In this tab, the model identifies potential volume reduction and WQCV BMPs for the user based on general site information such as development characteristics and existing soil conditions. Volume reduction practices, such as MDCIA, can be evaluated in the following Impervious Reduction Factor (IRF) worksheet that will allow the user to obtain the effective imperviousness value. This value can be used in calculating the required WQCV for the individual BMP options. Individual BMP selections in the model include grass buffer, grass swale, rain garden, extended detention basin, sand filter, retention pond, constructed wetland pond, constructed wetland channel, and permeable pavement system. 11
 Stormwater Management and Design Aid (SMADA) is a set of computer models that provide a complete hydrology package.")
22 Figure 11 - Starting page of the Stormwater Best Management Practice Design Workbook. Stormwater Management and Design Aid (SMADA) Stormwater Management and Design Aid (SMADA) is a set of computer models that provide a complete hydrology package. SMADA is one of the very first models that were able to estimate pollution removal as well as hydrograph shapes. These programs work together to allow hydrograph generation, pond routing, storm sewer design, statistical distribution and regression analysis, pollutant loading modeling, and other functions. One of the calculation routines in SMADA s provides pollution loading calculation capabilities and is called PLOAD. It is a program that estimates pollutant loading on a time basis using typical watershed land uses and total rainfall (Wanielista et al., 1991). The PLOAD model can calculate pollutant loadings for a watershed with user specified land use information. In addition to the land use information, the user indicates analysis period, a rainfall amount for analysis period, watershed area, and the runoff coefficients. For a given watershed, calculated results include the load for TSS, BOD5, TN and TP, Lead, Copper, and Zinc. 12
23 Other Publications and Comparisons Supplement design standards were published by the District of Columbia for their area listing criteria for pervious pavements and landscape BMPs (DC Green, 2014). Other publications may be of some benefit to those interested in what other parts of the County and doing. A listing of the BMPs used in some models is shown in Table 1. Some BMPs have regional names, thus before the use of a BMP, the user should check the physical design before deciding on use of a BMP term. Dry-detention is a user defined BMP in the BMPTRAINS model. In addition, the BMPTRAINS model has options for floating wetlands and tree wells. Stormwater Model / BMPs Retention Bi i Dry Detention Swale Green Roof Filter Strip & Buffer Permeable Pavement Sand Filter Water Harvesting Wet Detention Built Wetland Rain Garden Exfiltration Jordan/Falls Lake Model BMP SELECT Model Clinton River SET Virginia Runoff Reduction Method Worksheet DES Simple Method Pollutant Loading Spreadsheel 1 Colorado D.C. Green SMADA x x x x x x x x x x x x x x x x x x x x x x x x x x x x x x x x x x x x x x x x x x x x x x x x x x x x x x x x x x BMPTRAINS x x x x x x x x x x x 1 Efficiency data need to be provided by user. Table 1 - Comparison table of BMP options available within different models 13
 can be evaluated.")
24 Best Management Practices Treatment Aid (BMPTRAINS) Introduction The model is used to evaluate Best Management Practice Treatment options for Removal on an Annual basis by those Interested in Nutrients in Stormwater. Thus the name, BMPTRAINS and the implied function that BMPs in a train (series) can be evaluated. The model is based on the findings from studies conducted in recent years primarily within the State of Florida. It is in response to a need to address concerns for the over-enrichment of Florida s surface waters, ground waters, and springs by nutrients (FDEP, 2010). The Introduction Page of the model is shown in Figure 12. Stormwater BMP Treatment Trains [BMPTRAINS ] CLICK HERE TO START INTRODUCTION PAGE Model requires the use of Excel 2007 or newer 1) There is a users manual to help navigate this program and it is available at This program is compiled from stormwater management publications and deliberations during a two year review of the stormwater rule in the State of Florida. Input from the members of the Florida Department of Environmental Protection Stormwater Review Technical Advisory Committee and the staff and consultants from the State Water Management Districts is appreciated. The State Department of Transportation provided guidance and resources to compile this program. The Stormwater Management Academy is responsible for the content of this program. 2) This spreadsheet is best viewed at 1280 BY 1080 PIXELS screen resolution. If the maximum resolution of your computer screen is lower than 1280 BY 1080 PIXELS you can adjust the view in the Excel VIEW menu by zooming out to value smaller than 100 PERCENT. 3) This spreadsheet has incorporated ERROR MESSAGE WINDOWS. Your analysis is not valid unless ALL ERROR MESSAGE WINDOWS are clear. 4) PRINTING INSTRUCTIONS: Many options. One is to print the page to MICROSOFT OFFICE DOCUMENT IMAGE WRITER (typically the default) or ADOBE PDF, save the page as an image document, then print the document you saved. 5) Click on the button located on the top of this window titled CLICK HERE TO START to begin the analysis. Disclaimer: These workbooks were created to assist in the analysis of Best Management Practice calculations. All users are responsible for validating the accuracy of the internal calculations. If improvements are noted within this model, please Marty Wanielista, Ph.D., P.E. at martin.wanielista@ucf.edu with specific information so that revisions can be made. The authors of this program were Marty Wanielista, Mike Hardin, Harvey Harper, Eric Livingston, Christopher Kuzlo, Colin Miller, and Ikiensinma Gogo-Abite. The version 8.0 updates of this program were done by Marty Wanielista (UCF) and Mike Hardin (Geosyntec Consultants). This is version 8.0 of the program, updated on August 1, Comments are appreciated. Figure 12 - Introduction Page worksheet. The calculations in the BMPTRAINS model consist of three major parts. The first part includes an estimate of annual removal efficiency for nitrogen and phosphorus using a combination of BMPs. Some of the methodologies for calculation of the nitrogen and 14
. The required removal efficiency that the BMP(s) must achieve is specified in the model.")
25 phosphorus removal efficiency used in this model come from the Evaluation of Current Stormwater Design Criteria within the State of Florida report published by the State of Florida Department of Environmental Protection, in June, 2007 (Harper and Baker, 2007). The required removal efficiency that the BMP(s) must achieve is specified in the model. The annual nitrogen and phosphorus loadings are calculated based on the annual runoff volumes and Event Mean Concentrations (EMC) for the pre- and post-development conditions. The annual runoff volumes in the BMPTRAINS model are computed based on the project meteorological zone location, watershed area, mean annual rainfall depth, non-dcia Curve Number, and DCIA percentage input. These parameters are specified in the General Site Information (Figure 13) and Watershed Characteristics worksheets (Figure 14). GENERAL SITE INFORMATION: V6.0 STEP Selection 1: the appropriate of Meteorological Zone, input the appropriate Mean Annual Rainfall amount and select the type of analysis meteorological zone, mean annual rainfall depth and the type of analysis. Maps are Meteorological Zone (Please use zone map): provided to help with selections. Mean Annual Rainfall (Please use rainfall map): GO TO INTRODUCTION PAGE CLICK ON CELL BELOW TO SELECT Zone Inches CLICK ON CELL BELOW TO SELECT Then input Type watershed of analysis: Specified removal efficiency Treatment characteristics efficiency (N, P) (leave for empty each if net improvement or BMP analysis is used): % catchment of interest. STEP 2: Select the STORMWATER TREATMENT ANALYSIS to begin analyzing Best Management Practices. NAME OF PROJECT Blue Numbers = Red Numbers = VIEW ZONE MAP Model documentation and example problems. Input data Calculated or Carryover VIEW MEAN ANNUAL RAINFALL MAP GO TO WATERSHED CHARACTERISTICS STORMWATER TREATMENT ANALYSIS Systems available for analysis: Retention Basin with option for calculating effluent concentration Wet Detention Exfiltration Trench Pervious Pavement Stormwater Harvesting Underdrain Biofiltration Greenroof Rainwater Harvesting Floating Island with Wet Detention Vegetated Natural Buffer Vegetated Filter Strip Swale Rain Garden User Defined BMP RESET INPUT FOR STORMWATER TREATMENT ANALYSIS Selection to begin the analysis of various Best Management Practices options. There is a user's manual for the BMPTRAINS model. It can be downloaded from The results from the example problems shown in the manual however may not reflect current model results due to ongoing updates of the model. METHODOLOGY FOR CALCULATING REQUIRED TREATMENT Selection clears EFFICIENCY out entire input that may have been previously saved. It is recommended to always reset the input prior to starting new analysis. METHODOLOGY FOR RETENTION SYSTEMS METHODOLOGY FOR GREENROOF SYSTEMS METHODOLOGY FOR WET DETENTION SYSTEMS METHODOLOGY FOR WATER HARVESTING SYSTEMS Figure 13 - General Site Information worksheet. 15
26 The BMPTRAINS model also has the capability of analyzing for user specified removal efficiency. This option can be utilized by using the Specified Removal Efficiency selection from the Type of Analysis dropdown menu on the General Site Information worksheet. In this case, the BMP is analyzed to see if the specified reduction target is met rather than the removal efficiency found from the difference between the pre-and post- development nutrient loadings. As such, the pre-development condition characteristics do not make any difference in this type of analysis. However, the user still has an option of specifying this information as the predevelopment loading values can be useful in certain analysis (i.e. compensatory treatment analysis). Finally, the BMPTRAINS model is capable of analyzing individual or multiple BMPs to evaluate their effectiveness. For this type of analysis, the watershed characteristics are not important and do not need to be entered into the model. This type of analysis is useful for evaluating the efficiency of individual or some combination of BMPs. Watershed Characteristics The existing and proposed watershed characteristics are indicated in the Watershed Characteristics worksheet (Figure 14). The model provides the capability of subdividing the analyzed watershed into four (4) separate catchment areas. This option can be utilized if the existing or proposed conditions for the project area can be characterized by more than one land use selection. Each catchment area must have a BMP associated with it, otherwise combine areas and use only one catchment. In the Watershed Characteristics worksheet, the user indicates information specific to the watershed area such as non-dcia Curve Number and DCIA percentage. This is also where the user indicates EMCs by selecting the land use most appropriately representing the existing and proposed conditions. However, if the built-in selection does not contain a representative land use, or if more appropriate site-specific information is available, the model has the capability to utilize user specified EMCs. Each land use Characteristics and EMC values are listed in Appendix A. 16

27 Blue Numbers = Input data WATERSHED CHARACTERISTICS V6.0 GO TO STORMWATER TREATMENT ANALYSIS Red Numbers = Calculated SELECT CATCHMENT CONFIGURATION CLICK ON CELL BELOW TO SELECT CONFIGURATION A - Single Catchment VIEW CATCHMENT CONFIGURATION CATCHMENT NO.1 CHARACTERISTICS: \ If mixed land uses (side calculation) OVERWRITE DEFAULT CONCENTRATIONS USING: CLICK ON CELL BELOW TO SELECT Land use Area Acres non DCIA CN %DCIA PRE: POST: Pre-development land use: developed - Wet Flatwoods: TN=1.175 TP=0. EMC(N): mg/l mg/l with default EMCs CLICK ON CELL BELOW TO SELECT EMC(P): mg/l mg/l Post-development land use: Highway: TN=1.640 TP=0.220 with default EMCs Total CLICK ON CELL BELOW TO SELECT: Total pre-development catchment area: 8.00 AC Total post-development catchment or BMP analysis area: 8.00 AC USE DEFAULT CONCENTRATIONS Pre-development Non DCIA CN: Pre-development DCIA percentage: 0.00 % Pre-development Annual Mass Loading - Nitrogen: kg/year Post-development Non DCIA CN: Pre-development Annual Mass Loading - Phosphorus: kg/year Post-development DCIA percentage: % Post-development Annual Mass Loading - Nitrogen: kg/year Estimated Area of BMP (used for rainfall excess not loadings) 0.50 AC Post-development Overwriting Annual Mass Loading default - Phosphorus: Event Mean kg/year CATCHMENT NO.2 CHARACTERISTICS: \ If mixed land uses (side calcula OVERWRITE DEFAULT CONCENTRATIONS: CLICK ON CELL BELOW TO SELECT Land use Area Acres non DCIA CN Concentrations %DCIA PRE: associated with POST: pre- Pre-development land use: EMC(N): mg/l mg/l CLICK ON CELL BELOW TO SELECT EMC(P): mg/l mg/l Post-development Selection land use: of pre- and post- and post-development land uses. Total CLICK ON CELL BELOW TO SELECT: Total pre-development catchment land area: use, watershed AC USE DEFAULT CONCENTRATIONS Total post-development catchment or BMP analysis area: AC Pre-development Non DCIA CN: Pre-development area, Curve DCIA percentage: Number and DCIA. The % Pre-development Annual Mass Loading - Nitrogen: kg/year Post-development Non DCIA CN: Pre-development Annual Mass Loading - Phosphorus: kg/year Post-development watershed DCIA percentage: can be divided into four % Post-development Annual Mass Loading - Nitrogen: kg/year Estimated Area of BMP (used for rainfall excess not loadings) AC Post-development Annual Mass Loading - Phosphorus: kg/year CATCHMENT separate NO.3 CHARACTERISTICS: catchments based on the \ If mixed land uses (side calcul OVERWRITE DEFAULT CONCENTRATIONS: CLICK ON CELL BELOW TO SELECT Land use Area Acres non DCIA CN %DCIA PRE: POST: Pre-development existing land or use: proposed land uses. EMC(N): mg/l mg/l CLICK ON CELL BELOW TO SELECT EMC(P): mg/l mg/l Post-development land use: Total CLICK ON CELL BELOW TO SELECT: Total pre-development catchment area: AC USE DEFAULT CONCENTRATIONS Total post-development catchment or BMP analysis area: AC Pre-development Non DCIA CN: Selection of catchment configuration Pre-development DCIA percentage: % Pre-development Annual Mass Loading - Nitrogen: kg/year Post-development Non DCIA CN: Pre-development Annual Mass Loading - Phosphorus: kg/year Post-development DCIA percentage: is done % here. Post-development Annual Mass Loading - Nitrogen: kg/year Estimated Area of BMP (used for rainfall excess not loadings) AC Post-development Annual Mass Loading - Phosphorus: kg/year CATCHMENT NO.4 CHARACTERISTICS: \ If mixed land uses (side calcul OVERWRITE DEFAULT CONCENTRATIONS: CLICK ON CELL BELOW TO SELECT Land use Area Acres non DCIA CN %DCIA PRE: POST: Pre-development land use: EMC(N): mg/l mg/l CLICK ON CELL BELOW TO SELECT EMC(P): mg/l mg/l Post-development land use: Total CLICK ON CELL BELOW TO SELECT: Total pre-development catchment area: AC Total post-development catchment or BMP analysis area: AC USE DEFAULT CONCENTRATIONS Pre-development Non DCIA CN: Pre-development DCIA percentage: % Pre-development Annual Mass Loading - Nitrogen: kg/year Post-development Non DCIA CN: Pre-development Annual Mass Loading - Phosphorus: kg/year Post-development DCIA percentage: % Post-development Annual Mass Loading - Nitrogen: kg/year Estimated Area of BMP (used for rainfall excess not loadings) AC Post-development Annual Mass Loading - Phosphorus: kg/year Figure 14 - Watershed Characteristics worksheet. The model also allows for the specification of a configuration of the catchments within a watershed. For example, if there are three catchments in a watershed and two of the catchments are in series and one is in parallel, the model will allow for this selection. Since this model allows for up to four catchments per watershed each possible combination is presented as a selection. The user is prompted to input the number of catchments at which time all possible configurations will be presented from which the user can choose. It should be noted that if multiple BMPs are used in a watershed they are assumed to be in series, or one after another. Additionally, if detention and retention BMPs are used within a single catchment, the detention 17
28 BMP is assumed downstream of the retention BMP. Multiple BMPs in parallel are to be treated as different catchments. Stormwater Treatment Methods Once the required information is input into the General Site Information and Watershed Characteristics worksheets, the calculated (or user specified) required removal efficiency for both nitrogen and phosphorus could be viewed in the Stormwater Treatment Analysis page (Figure 15). The catchment configuration selected is also displayed on this worksheet. STORMWATER TREATMENT ANALYSIS: V 8.0 If not done, specify pre- and post-development watershed characteristics. GO TO WATERSHED CHARACTERISTICS Selection of a single Blue catchment Numbers = that Input data GO TO GENERAL SITE INFORMATION PAGE Red Numbers = Calculated 7/23/2016 can have in series 3 BMPs as long as there is no input between them. Total Required Treatment Efficiency: Required Input of Treatment pre- Eff and (Nitrogen): post-development % Required Treatment Eff (Phosphorus): % watershed characteristics. This has to be completed prior to proceeding to Best Management Practices. 1 Select one of the BMPs below to analyze efficiency or review the summary data. RETENTION BASIN WET DETENTION / MAP EXFILTRATION TRENCH RAIN GARDEN SWALE USER DEFINED BMP PERVIOUS PAVEMENT GREENROOF VEGETATED NATURAL BUFFER STORMWATER HARVESTING RAINWATER HARVESTING VEGETATED FILTER STRIP FILTRATION TREE WELL View Media Mixes GO TO COST ANALYSIS NOTE!!!: All individual system must be sized prior to being analyzed in conjunction with other systems. Please read instructions in the CATCHMENT AND TREATMENT SUMMARY RESULTS tab for more information. CATCHMENT AND TREATMENT SUMMARY RESULTS Figure 15 - Stormwater Treatment Analysis worksheet. After viewing the required treatment efficiencies and catchment configuration, the user may proceed to the second part (STEP 2) of the analysis in the Stormwater Treatment Analysis worksheet (Figure 15). The second part of the analysis includes the selection and adequate sizing of the BMP (or combination of BMPs) to meet the required treatment efficiencies. The BMP selections include retention basin, wet detention, exfiltration trench, pervious pavement, stormwater and rainwater harvesting, filtration including biofiltration, greenroof, floating islands with wet detention, vegetated natural buffer, vegetated filter strip, tree well, rain garden, swale, 18
29 and a user defined BMP. The third part (STEP 3) of the analysis is to select the Catchment and Treatment Summary Results button and see a summary of the results. Retention Basin A retention system is one of the more popular BMPs used for stormwater treatment. A retention system is a recessed area within the landscape that is designed to store and retain a defined quantity of runoff, allowing it to percolate through permeable soils into the shallow ground water aquifer. The BMPTRAINS model has the capability of evaluating the treatment efficiency of retention systems. The effectiveness of the retention system in terms of yearly capture is assessed with the retention efficiency tables published by Harvey Harper in These tables contain a performance efficiency of dry retention as a function of DCIA and NON-DCIA Curve Number (Harper and Baker, 2007). In the BMPTRAINS model, the retention efficiency tables are also applied to other systems like exfiltration trench, pervious pavement, filtration including biofiltration, swale, vegetated natural buffer, vegetated filter strip, rain garden, and tree well. In the BMPTRAINS model, any retention system can be analyzed in the Retention Basin worksheet (Figure 16). The user can size the system to provide the entire retention volume required to meet the treatment efficiency goal. Or the user has an option of specifying a fraction of the required retention volume (under sizing treatment) or additional retention volume (over sizing treatment). This option can be utilized in situations where the retention system is a part of a treatment train or if compensatory treatment is required due to site constraints. The effectiveness data used for retention does not extend past 3.99 inches. Thus when specifying input retention depths, no depth beyond 3.99 inches should be used. As in many of the BMP options found in the BMPTRAINS model and in other models, some calculations are assumed to be done outside of or before a system is evaluated in the model. As an example, the land when the retention system is placed has to be available to meet the area requirements and the invert elevation specifications. Thus, the model provides for partial treatment because of area or other physical constraints. 19
: 80.000 80.000 80.000 80.000 % Input and output Required retention depth over the watershed to meet required efficiency: 1.235 1.")
30 RETENTION BASIN SERVING: Catchment 1 Catchment 2 Catchment 3 Catchment 4 Watershed area: ac Required Treatment Eff (Nitrogen): % Required Treatment Eff (Phosphorus): % Input and output Required retention depth over the watershed to meet required efficiency: in Required water quality retention volume: for Retention Basin ac-ft RETENTION BASIN FOR MULTIPLE TREATMENT SYSTEMS (if there is a need for additional removal efficiencies in a series of BMPs): Retention volume based on retention depth ac-ft Provided retention depth (inches over the watershed area): in Provided treatment efficiency (Nitrogen): % Provided treatment efficiency (Phosphorus): % Remaining treatment efficiency (Nitrogen): % Remaining treatment efficiency (Phosphorus): % Remaining retention depth needed: in Efficiency Curve: System Efficiency (N $ P) CAT 1: System Efficiency (N $ P) CAT 2: System Efficiency (N $ P) CAT 3: System Efficiency (N $ P) CAT 4: NOTE FOR TREATMENT EFFICIENCY GRAPH: The purpose of this graph is to help illustrate the treatment efficiency 70 of the retention system as the function of retention depth for a 60 single BMP and in a single catchment. The graph illustrates that 50 there is a diminished the return as curve. the retention depth is increased. Thus 40 evaluations of other alternatives in "treatment trains" and compensatory treatment should be considered Treatment efficiency(%): worksheet. Figure 16 - Retention Basin worksheet. RETENTION BASIN: V6.0 Blue Numbers = Red Numbers = Input data Calculated or Carryover GO TO STORMWATER TREATMENT ANALYSIS ERROR MESSAGE WINDOW FOR SINGLE RETENTION BASIN: Error message window for worksheet. Results are valid only if the window is blank. Treatment efficiency chart; this chart illustrates the treatment efficiency as a function of the retention depth for the analyzed watershed. It also shows the sized system efficiency in relation to In this example, the size of the retention system was 0.50 inches Retention depth (inch): View Media Mixes Source of Graphic: draft STORMWATER QUALITY APPLICANT S HANDBOOK dated March Catchment 1 Catchment 2 Catchment 3 Catchment , by the Department of Environmental Protection, available at: If using media mix as a filter before water enters the ground, specify type March Average Nitrogen concentration in the filter effluent entering groundwater in mg/l Average Phosphorus concentration in the filter effluent entering groundwater in mg/l Another useful feature of the Retention Basin worksheet, or any other retention based BMP worksheet, is the retention efficiency chart. The retention efficiency chart illustrates the treatment efficiency of the retention-based system as a function of the retention depth. The properties of the retention efficiency curve are dependent on the post-development watershed characteristics such as non-dcia Curve Number and DCIA percentage and the rainfall patterns in a rainfall zone. The efficiency of the retention basin sized by the user is shown on the chart as a mark (example would be a red triangle for catchment one). Another purpose of this chart is to illustrate to the user that there is a point of diminishing return as the retention depth is increased. This may enable the user to pursue other treatment options such as treatment trains or compensatory treatment. The calculation of effluent or groundwater TN and TP concentrations under a retention basin is available in the Retention Basin worksheet. If no pollution control media mixes are used, the groundwater concentration is assumed equal to the basin concentration. If a pollution control 20
31 media mix is used, then the groundwater concentration beneath the mix is calculated. There are at least six pollution control media choices commonly acceptable in Florida. Additional ones will be listed in the future. Their effectiveness is shown in the media mix tab. The fraction of particulate assumed in the model for nitrogen is 60% and phosphorus is 50% (Harper, 1990). Harper showed that the fraction is about the same for residential and highway sites. However, for the commercial sites measured, the particulate concentrations were higher. Exfiltration Trench Another commonly used form of retention BMP is an exfiltration trench. An exfiltration trench is a subsurface retention system consisting of a conduit such as a perforated pipe surrounded by aggregate which temporarily stores and infiltrates the runoff water (Wanielista and Yousef, 1993). This pipe can also be used with a pollution control media mix (Table 2). Bio-sorption Activated Media (BAM) Mixes There are many useful mixes. The choice of the mix depends on the availability, local preferences, effectiveness, and cost. Once a pollution control mix is judged capable of sorption and can support bacteria for conversion of chemicals, it is called Bio-sorption Activated Media (BAM). An example of a BAM media is a sorption media in an anoxic environment to support bacteria for the removal of nitrates. That process is commonly referenced as de-nitrification. Commonly used media in filters are certain clays, specific organics, re-cycled tire, blended sands, oxidized materials, and other carbon compounds. Frequently these materials are mixed together with sand to control the infiltration process and residence time within the media mixes. BMPTRAINS has mixes classified as BAM that have been acceptable to the profession. Nevertheless, recognized are other media mixes that can be used and there is a provision for a user defined mix. Table 2 shown commonly (October, 2016) used media mixes. Some media mixes can only be used as a first BMP and others are used after wet detention or retention basins. Notation in Table 2 for media used upstream in a treatment train are indicated by and by the following image for downstream or for those following a BMP. The user must be careful to pick the correct blend depending on the location. 21
32 Table 2 Examples of Pollution Control Media Mixes DESCRIPTION OF MEDIA Media and Typical Location in BMP Treatment Train MATERIAL PROJECTED TREATMENT PERFORMANCE * TSS REMOVAL EFFICIENCY TN REMOVAL EFFICIENCY TP REMOVAL** EFFICIENCY TYPICAL OPERATING LIMITING FILTRATION RATE (in/hr) B&G ECT (ref A) Expanded Clay 2 A first BMP, ex. Up-Flow Filter in Baffle box and Tire Chips 1 a constructed w etland # (USER DEFINED BMP) 70% 55% 65% 96 in/hr B&G OTE (ref A,B) Organics 8 Up-flow Filter at Wet Pond or Dry Basin Outflow Tire Chips 1 (FILTRATION) Expanded Clay 4 60% 45% 45% 96 in/hr B&G ECT3 (ref C) Expanded Clay 4 After Wet Detention using Up-flow Filter Tire Chip 1 60% 45% 45% 96 in/hr SAT (ref D) Sand 3 A first BMP, as a Dow n-flow Filter (FILTRATION) 85% 30% 45% 2 in/hr B&G CTS (ref E,F) Clay 6 Dow n-flow Filters 12" depth*** at w et pond or dry basin Tire Crumb 5 pervious pave, tree w ell, rain garden, sw ale, and strips Sand 7 & Topsoil 9 90% 60% 90% 1.0 in/hr B&G CTS (ref E,F) Clay 6 Dow n-flow Filters 24" depth*** at w et pond or dry basin Tire Crumb 5 pervious pave, tree w ell, rain garden, sw ale, and strips Sand 7 & Topsoil 9 95% 75% 95% 1.0 in/hr # NOTES No generally accepted BMP at this time. Also can be used as a donwstream BMP but the removal must be lowered. *All Effectiveness Estimates to nearest 5%: **Phosphorus removal has limited life expectancy: ***24" depth has TN and TP removals of 75 & 95% acronyms B&G - BOLD & GOLD; SAT - Sand Austin Tx; ECT- Expanded Clay and Tire; ECT3 Expanded Clay and Tire in Treatment Train 1 Tire Chip 3/8" and no measurable metal content (approximate dry density = 730 lbs/cy) 2 Expanded Clay 5/8 and 3/8 blend (approximate dry density = 950 lbs/cy) 3 Sand ASTM C-33 with no more than 3% passing # 200 sieve (approximate dry density = 2200 lbs/cy) 4 Expanded Clay 3/8 in blend (approximate density = 950 lbs/cy) 5 Tire Crumb 1-5 mm and no measurable metal content (approximate density = 730 lbs/cy) 6 Medium Plasticity typically light colored Clay (approximate density = 2500 lbs/cy) 7 Sand with less than 5% passing #200 sieve (approximate density = 2200 lbs/cy) 8 Organics: Either compost (approximate density of 700 lbs/cy) Class 1A Compost or wood chips (sawdust) without pesticides 9 Local top soil is used over CTS media in dry basins, gardens, swales and strips, is free of roots & debris but is not used in other BMPs. A - Demonstration Bio Media for Ultra-urban Stormwater Treatment, Wanielista, et.al. FDOT Project BDK , 2014 B - Nutrient Reduction in a Stormwater Pond Discharge in Florida, Ryan, et al, Water Air Soil Pollution, 2010 C - Up-Flow Filtration for Wet Detention Ponds, Wanielista and Flint, Florida Stormwater Association, June 12, D - City of Austin Environmental Criteria Manual, Section 1.6.5, Texas, 2012 E - Nitrogen Transport and Transformation in Retention Basins, Marion Co, Fl, Wanielista, et al, State DEP, 2011 F - Improving Nitrogen Efficiencies in Dry Ponds, Williams and Wanielista, Florida Stormwater Association, June Note: There is provision for a User Defined Media Mix (UDM) with removals entered by the user. 22
33 Just as with the retention basin, the nutrient removal performance of the exfiltration system is estimated from Harper s retention efficiency charts (Harper and Baker, 2007). The user also has an option of sizing the system to the required removal efficiency or design to another size. The Exfiltration Trench worksheet (Figure 17) also contains a retention efficiency chart with the designed system displayed on on the curve. An additional feature included with the worksheet is a simple exfiltration trench volume calculator which allows the user to calculate a retention volume provided by the system based on the specified dimensions. EXFILTRATION TRENCH SERVING: Catchment 1 Catchment 2 Catchment 3 Catchment 4 Contributing catchment area: ac Required treatment efficiency (Nitrogen): % Required treatment efficiency (Phosphorus): % Required retention Input for and the entire output catchment for to meet required efficiency: in Required water quality retention volume: ac-ft EXFILTRATION TRENCH FOR MULTIPLE TREATMENT SYSTEMS (use only if other BMP method is oversized or undersized) : Provided retention depth: in Provided treatment efficiency (Nitrogen): % Provided treatment efficiency (Phosphorus): % Remaining treatment efficiency needed (Nitrogen): % Remaining treatment efficiency needed (Phosphorus): % Remaining retention depth needed if retention: in Treatment efficiency(%): Exfiltration Trench worksheet. Figure 17 - Exfiltration Trench worksheet. EXFILTRATION TRENCH: V6.0 Efficiency Curve System Efficiency (N $ P) CAT 1 System Efficiency (N $ P) CAT 2 System Efficiency (N $ P) CAT 3 System Efficiency (N $ P) CAT Retention depth (inch): NOTE FOR TREATMENT EFFICIENCY GRAPH: Treatment efficiency chart; this chart illustrates the treatment efficiency as a function of the retention depth for the analyzed watershed. It also shows the sized system efficiency in relation to the curve. The purpose of this graph is to help illustrate the treatment efficiency of the retention system as the function of retention depth. The graph illustrates that there is a point of diminished return as the retention depth is substantially increased. Therefore, to provide the most economical BMP treatment system, other alternatives such as "treatment trains" and compensatory treatment should be considered. 23
34 Pervious Pavement Pervious pavement is another form of a retention system that is available for analysis in the BMPTRAINS model. Pervious pavement systems include the sub-base and pervious pavement. They can include several types of materials or designed systems such as pervious concrete, pervious aggregate/binder products, pervious paver systems, and modular paver systems (Draft Statewide Stormwater Treatment Rule Development, FDEP 2010). Similarly, to the other retention systems, the nutrient load reduction of the pervious pavement system is calculated based on the retention efficiency tables. However, unlike the retention basin or exfiltration trench, the pervious pavement system retention volume is not automatically sized for the user. Instead, the user must indicate appropriate parameters of the pervious pavement system based on which the treatment efficiency is calculated. The user is alerted by a message whether or not the system is adequate to meet the required treatment efficiency. If the system is not adequate, the pervious pavement system can be used in series with other BMP(s). The input parameters include the dimension of the individual layers, operational void space of the individual layers and area of the pavement system. The Pervious Pavement worksheet (Figure 18) has a selection of pervious pavement sections and sub-base materials with their appropriate operational void space values built in. These values were obtained from the Porosity and Curve Numbers for Pervious Pavement Systems technical memorandum published by the University of Central Florida (UCF) Stormwater Management Academy (SMA). The user may also use other products that are not available in the model s selection. In order to do so, the user must provide operational void space information of the products used in the analysis. 24
35 PERVIOUS PAVEMENT: V6.0 CONTRIBUTING WATERSHED AND PERVIOUS PAVEMENT CHARACTERISTICS: Pervious Pavement Section Storage Calculator (S') Layer Concrete Pervious Pavement Other Perv. Pvmt. (see note below) #57 rock #89 pea rock #4 rock Recycled (crushed) concrete Bold and Gold TM Other Sub Base (see note below) Layer Other Perv. Pvmt. (see note below) #57 rock #89 pea rock #4 rock Recycled (crushed) concrete Bold and Gold TM Other Sub Base (see note below) Layer Other Perv. Pvmt. (see note below) #57 rock #89 pea rock #4 rock Recycled (crushed) concrete Bold and Gold TM Other Sub Base (see note below) Layer Other Perv. Pvmt. (see note below) #57 rock #89 pea rock #4 rock Recycled (crushed) concrete Bold and Gold TM Other Sub Base (see note below) Figure 18 - Pervious Pavement worksheet. Thickness Void Space Storage Catchment 1 Catchment 2 Catchment3 Catchment 4 (in): (%): (in): Contributing catchment area: ac Required treatment efficiency (Nitrogen): % Required treatment efficiency (Phosphorus): % Storage provided in specified pervious pavement system: in Area of the pervious pavement system: ac Provided retention over the contributing catchment area: in Provided treatment efficiency (Nitrogen): % Provided treatment efficiency (Phosphorus): % Thickness Void Space Storage (in): (%): (in): Remaining treatment efficiency needed (Nitrogen): % Remaining treatment efficiency needed (Phosphorus): % Remaining retention depth needed if retention: in % Treatment Efficiency Curve System Efficiency (N $ P) CAT 1 Thickness (in): Thickness (in): Void Space Storage (%): (in): Void Space Storage (%): (in): Note: For other pervious pavement sections and / or other sub-base sections, the user must have the appropriate certified "operational void space percentages" from a licensed geotechnical laboratory. Treatment efficiency(%): Blue Numbers = Input data 0 Red Numbers = Calculated or Carryover GO TO STORMWATER TREATMENT ANALYSIS VIEW TYPICAL PERVIOUS PAVEMENT SYSTEM SCHEMATIC Retention depth (inch): efficiency using the System Efficiency (N $ P) CAT 2 System Efficiency (N $ P) CAT 3 System Efficiency (N $ P) CAT 4 Pervious Pavement Section Storage Calculator. Input and output for pervious pavement section properties. Up to four catchments. Wet Detention Wet detention is defined by a permanent wet pool. The pond is designed to release a portion of the collected stormwater runoff through an outlet structure (Draft Statewide Stormwater Treatment Rule Development, FDEP 2010). Wet detention ponds are a popular BMP option in areas where groundwater conditions do not allow for infiltration-based systems. Wet detention systems are available for analysis in the BMPTRAINS model. The effectiveness assessment of wet detention systems in the model is based on the residence time efficiency equations published by Harvey Harper in In the study, a linear regression analysis was conducted to evaluate relationships between removal of nitrogen and phosphorus as a function of residence time within wet ponds (Harper and Baker, 2007). In the BMPTRAINS model the user can analyze wet detention system by indicating the average annual residence time that the system will provide. By indicating the residence time, the model will compute the required minimum permanent pool volume that the wet detention system 25
36 will have to provide. The size of the minimum permanent pool volume is dictated by the average annual residence time as well as the volume of annual runoff to the pond. In the BMPTRAINS model, wet detention ponds can be analyzed in the Wet Detention/MAP (Figure 19), worksheet and with the option of having a littoral zone or a floating wetland. In addition to the residence time, the user has an option of specifying an efficiency credit associated with the littoral zone. The littoral zone is that portion of a wet detention pond that is designed to contain rooted aquatic plants (Draft Statewide Stormwater Treatment Rule Development, FDEP 2010). With the Floating Wetlands option in the Wet Detention worksheet the user may take credit for the use of Managed Aquatic Plant Systems (MAPS) in the design. MAPS are aquatic plant-based BMPs which remove nutrients through a variety of processes related to nutrient uptake, transformation, and microbial activities. It is recommended to assign a 10% removal of the remaining concentration when using floating wetland mats. WET DETENTION/ MANAGED AQUATIC PLANTS: 7/23/2016 V 8.0 Also called: FLOATING ISLANDS and includes a wet detention pond: Catchment 1Catchment 2Catchment 3 Catchment 4 Total pre-development catchment Input area: and ac Total post-development catchment area: ac Average annual residence time output (between for 1 and 500 days) days Littoral Zone or other improvements used?* Littoral Zone or other improvement efficiency credit: Wet Floating Wetland or Mats used in the design: YES % Floating Wetland or Mats credit: % Total Nitrogen removal required: Detention % Total Phosphorus removal required: % Total Nitrogen removal efficiency: % worksheet. Total Phosphorous removal efficiency: % Is the wet detention sufficient: NO Average annual runoff volume: ac-ft/yr * pond coverage must follow Regulatory Requirements Wet Detention Pond Characteristic: Minimum Pond Permanent Pool Volume: ac-ft 100 Efficiency Curve NOTE FOR TREATMENT 90 (P) Treatment efficiency EFFICIENCY GRAPH: Sys Eff (P) CAT 1 80 Sys Eff (P) CAT 2 chart; showing the 70 The purpose of the treatment efficiency Sys Eff (P) CAT 3 graphs is to help illustrate the 60 Sys Eff (P) treatment CAT 4 treatment efficiency of of the wet detention system as the function of 50 Efficiency Curve average annual residence time (and (N) Wet Detention 40 permanent pool as the volume). The graph Sys Eff (N) CAT illustrates that there is a point of 1 30 diminished return as the permanent Sys Eff (N) function CAT pool of volume the is average 2 substantially increased. 20 Sys Eff (N) CAT Therefore, to provide the most 3 economical BMP treatment system, 10 Sys Eff (N) annual CAT residence time other alternatives such as "treatment 4 0 trains" and compensatory treatment and the use should of a MAP be considered. Average Annual Residence Time (days) Treatment Efficiency (%) Figure 19 - Wet Detention worksheet. Just as with the retention BMP worksheets, the Wet Detention and Floating Island with Wet Detention worksheets contain treatment efficiency charts. These charts illustrate the 26
37 treatment efficiency of the wet detention systems as a function of the average annual residence time. The efficiency curves for nitrogen and phosphorus removal are adjusted based on the littoral zone and MAPS credit entries. Typical credits for both littoral and floating wetlands is 10% (removal) of the remaining concentration. It should be noted that the initial treatment efficiency achieved is due to settling of particles and therefore will not be achieved if the wet detention system receives water from another BMP, i.e. is downstream of another BMP that removes some of the particulate matter. For cases where this is true, the achieved treatment efficiency is reduced by 30% for nitrogen and 55% for phosphorus. The purpose of the removal efficiency chart as a function of permanent pool (residence time) is to illustrate to the user that there is a point of diminishing return as the residence time (and permanent pool volume) is substantially increased. This may enable the user to pursue other treatment options such as additional treatment train BMPs or compensatory treatment. Stormwater and Rainwater Harvesting Stormwater harvesting collects runoff from ground level, while rainwater harvesting is used for roof runoff. They are considered cost-effective methods for pollution control, because the water in many cases can be sold to offset the cost of maintenance and operation. Stormwater harvesting uses treated stormwater before it is discharged to surface waters, thus reducing the stormwater volume and mass of pollutants discharged (Wanielista et al., 1991). Stormwater harvesting is an option to improve mass removal from a wet detention pond. Floating islands (wetlands) is another option. In the BMPTRAINS model, water harvesting can be analyzed in the Stormwater Harvesting and Rainwater Harvesting worksheets. The pollution removal of the water harvesting systems is assessed with the Rate-Efficiency-Volume (REV) curves. The REV curves were developed by long-term mass balance simulations of harvesting ponds. Curves reflecting several efficiencies track the appropriate combinations of reuse rates and reuse storage volumes (Wanielista et al., 1991). The user may use Stormwater (Figure 20) and Rainwater Harvesting worksheets to size the system for the desired harvest efficiency or harvest rate. The Stormwater Harvesting 27
38 worksheet is more appropriate for watersheds that consist of pervious and impervious areas. As such, the user must indicate the representative Runoff Coefficient of the analyzed watershed. The Rainwater Harvesting worksheet is appropriate for watersheds that consist entirely of impervious areas (roof, pavement, etc.). This worksheet has built in selections of different types of impervious areas based on which the appropriate Runoff Coefficient is utilized in the calculations. The Runoff Coefficient values for the impervious surface selections were obtained from the study conducted by Wanielista et al. entitled Evaluating Runoff and Abstraction from Impervious Surfaces as Components Affecting Recharge, Additional required inputs include indication of the watershed area contributing to the harvesting system and area available for irrigation. The user has two calculation options available. In the first option, analysis is performed to solve for the harvest rate. This option involves indication of the available harvest volume and the desired harvest efficiency. The second option allows solving for harvest efficiency. With this selection, the user must indicate the provided harvest volume and harvest rate. 28
39 STORMWATER HARVESTING V6.0 General Site Information: Meteorological Zone: Zone 2 Catchment 1 Catchment 2 Catchment3 Catchment 4 Total Area Contributing to the Harvesting System: AC Total Green Area Available for Irrigation: AC Weighted Rational Runoff Coefficient (0.00 to 1.00): Blue Numbers = Input data Red Numbers = Calculated or Carryover Error message window for the GO TO STORMWATER TREATMENT ANALYSIS Stormwater Harvesting worksheet. GO TO METEOROLOGICAL ZONE MAP GO TO TYPICAL STORMWATER HARVESTING SYS. SCHEMATIC ERROR MESSAGE WINDOW FOR STORMWATER HARVESTING SYSTEM Solving for: CLICK ON CELL BELOW TO SELECT SOLVE FOR HARVEST RATE Available Harvest Volume: AC-FT Harvest Efficiency (20 to 90%): Note: harvest efficiency is the average annual capture of runoff water not discharged. Equivalent Impervious Area (EIA) AC Harvest Volume (IN over EIA): IN Input and output for the Stormwater Determination of Harvest Efficiency: Harvest Rate: CF/DAY Harvest Harvesting Rate (IN/DAY over EIA): IN/DAY Harvest Efficiency (20 to 90% efficiency): % worksheet. Determination of Harvest Rate: Harvest Rate (IN/DAY over EIA): ERROR ERROR ERROR IN/DAY Required Harvest Rate: 1953 ERROR ERROR ERROR CF/DAY Required Harvest Rate: IN/WEEK Supplemental Water: Average yearly demand for harvested water: MGY Average supply of harvested water: MGY The average supplemental water needed per year: MGY Figure 20 - Stormwater Harvesting worksheet. Rate-Efficiency-Volume Curves for the used for the sizing of the stormwater or rainwater harvesting systems. Zone Rate-Efficiency-Volume curves show the relationship between the use rate, average use efficiency and storage volume provided by the pond. Red rectangle displayed on the chart represents system sized by the specified input. Use Rate (inches/day over EIA) Runoff Volume of Water (inches over EIA) Stormwater and Rainwater Harvesting display appropriate REV charts based on the meteorological zone selection specified by the user. As with the other BMP options, these charts show the designed system efficiency based on the user specified input. The worksheet also contains an error message window alerting the user of possible errors with their analysis. Floating Islands (wetlands) Floating islands are a combination of plants floating in a wet detention pond. The island plants, roots and associated organisms reduce nitrogen and phosphorus concentrations (Wanielista, et al., 2012) and thus the mass of nitrogen and phosphorus are reduced in the 29
40 discharge. The wet detention pond has to be designed according to the specifications listed above. Usually a credit of 10% removal of the remaining concentration is given for mass reduction when the floating wetland is designed to occupy about 10% of the surface area and the plants are maintained. Credit up to 12% may be granted in rare situations. Maintenance is at least once per year and usually consists of replacing plants and removing unwanted plants. The usual design calls for a floating mat with plants distributed around the pond in the direction of primary water movement (Chang, et al., 2012). There is a separate entry on the worksheet for input data related to design of the floating wetland as well as input data for a littoral zone. The littoral zone area and slopes of the pond banks have to be consistent with regulatory requirement. Filtration Filtration is done to enhance the removal of nitrogen and phosphorus after retention or after wet detention. The removal is enhanced with the use of Biosorption Activated Media (BAM) used at the bottom of a retention basin or in an up-flow filter after wet detention. It is an option in basins where soil conditions do not allow for a successful drainage or an infiltration rate. Filtration systems can be used to both control the water table elevation over the entire area of the treatment basin, and provide for the drawdown of the treatment volume. Filtration is also used for on-site retention BMPs such as tree wells, exfiltration pipes and rain gardens. Filtration systems in the BMPTRAINS model are sized with the help of the retention efficiency tables. However, the retention efficiency tables are only utilized to assess the hydraulic annual average capture efficiency of the filter. The hydraulic capture efficiency is directed through a filter and is calculated based on the retention depth stored in the basin or pond below a weir crest. The calculated hydraulic capture efficiency is then adjusted based on the type of pollution control media mix used in the design. This adjustment quantifies the nutrient removal efficiency of the filter. The input parameters for the Filtration worksheet (Figure 21) include the maximum hydraulic capture (retention depth) and the selection of media used for pollution control. The specification of retention depth is used to calculate the hydraulic capture efficiency and the selection of the media yields annual phosphorus and nitrogen removal efficiencies of the filter. In this case an up-flow filter is used after a wet detention pond as noted in Figure

: 1.00 in Treatment volume provided for treatment depth: 0.667 0.000 0.000 0.000 ac-ft Filtration worksheet. Provided water capture efficiency: 88.800 0.000 0.000 0.000 % REQUIRED REMAINING TREATMENT EFFICIENCIES.")
41 Blue Numbers = Input data FILTRATION (Underdrained Dry Basin or Upflow Filter after Wet Detention) 10/25/2016 V 8.2 Red Numbers = Calculated or Carryover FILTRATION SERVING EITHER WET POND OR DRY POND: GO TO STORMWATER TREATMENT ANALYSIS Notes: No loadings from this BMP area and media must match location. Catchment 1 Catchment 2 Catchment 3 Catchment 4 Contributing catchment area: ac FOR UNDERDRAINS GO TO LATTERAL SPACING CALCULATOR Input and output for the Treatment depth ( inches): 1.00 in Treatment volume provided for treatment depth: ac-ft Filtration worksheet. Provided water capture efficiency: % REQUIRED REMAINING TREATMENT EFFICIENCIES. Required treatment efficiency (Nitrogen): % Required treatment efficiency (Phosphorus): % Type of media mixes: View Media Mixes UDM1* Catchment 1 Catchment 2 Catchment 3 Catchment 4 Provided treatment efficiency (Nitrogen): % Remaining treatment efficiency needed (Nitrogen): % Provided treatment efficiency (Phosphorus): % Remaining treatment efficiency needed (Phosphorus): % Is this effluent filtration for a wet detention pond? Yes ERROR MESSAGE WINDOW FOR FILTRATION INCLUDING BIOFILTRATION: Treatment efficiency(%) Retention depth (inch) Capture Eff. Curve NOTE FOR TREATMENT EFFICIENCY Pond Capture Eff CAT 1 GRAPH: Pond Capture Eff CAT 2 Pond Capture Eff CAT 3 Pond Capture Eff CAT 4 The purpose of this graph is to help illustrate Eff. Curve(N) the treatment efficiency of the system as the Eff. Curve(P) function of retention depth. The graph Sys. Eff. (N) CAT 1 illustrates that there is a point of diminished return as the retention depth is substantially Sys. Eff. (N) CAT 2 increased. Therefore, to provide the most Sys. Eff. (N) CAT 3 economical BMP treatment system, other Sys. Eff. (N) CAT 4 alternatives such as "treatment trains" and Sys. Eff. (P) CAT 1 compensatory treatment should be Sys. Eff. (P) CAT 2 considered. Sys. Eff. (P) CAT 3 Sys. Eff. (P) CAT 4 OPTIONAL UP FLOW FILTER MEDIA Treatment efficiency chart; this chart illustrates the treatment efficiency of filtration as the function of captured runoff depth. Curves are adjusted per media mix type. Chart also shows The use of a the Biosorption sized Activated Media system may be required. efficiency in relation to the curves. Source of Graphic: Stormwater Management Academy, University of Central Florida Figure 21 Filtration worksheet. The Filtration worksheet contains a treatment efficiency chart of the system (Figure 21). Similar to the other BMP worksheets, this chart illustrates the treatment efficiency of the filtration including biofiltration systems as a function of the retention depth. The chart contains curves for hydraulic capture efficiency, nitrogen removal efficiency and phosphorus removal efficiency. Nutrient removal efficiency curves are adjusted based on the media selection. The performance efficiency of the sized system is also shown on each curve. The worksheet also contains a window displaying additional required treatment efficiencies if the system is not adequate. These values can be used as guidance in sizing of the preceding treatment system. The worksheet also contains an error message window alerting the user about issues with the analysis. Greenroof A Greenroof is a LID BMP option which can be utilized in areas where there is a lack of space for typical retention/detention ponds. A greenroof/cistern stormwater treatment system is a 31

42 vegetated roof followed by storage in a cistern for the filtrate which is reused. A greenroof/cistern system functions similar to a retention BMP in that captured rainwater is available for evapotranspiration and effectiveness is directly related to the annual volume of roof runoff that is captured (Hardin, 2006). The greenroof/cistern stormwater treatment system is an option available for analysis in the BMPTRAINS model. Users can analyze the runoff volume and pollution reduction benefits of the greenroof systems in the Greenroof worksheet (Figure 22). The effectiveness of the greenroof/cistern system in the model is assessed with the greenroof harvesting efficiency charts presented by Hardin in This research showed that a specifically designed greenroof stormwater treatment system with a cistern is an effective way to reduce both the volume of and mass of pollutants in stormwater runoff (Hardin, 2006). The design graphs have been developed for several locations in the State of Florida. GREENROOF V6.0 Select Greenroof Rainfall Station: CLICK ON CELL BELOW TO SELECT Boca Raton # 845 Catchment 1 Catchment 2 Catchment3 Catchment 4 Required treatment efficiency (Nitrogen): % Required treatment efficiency (Phosphorus): % Greenroof Area: 30, SF Blue Numbers = Red Numbers = Input data Calculated or Carryover GO TO STORMWATER TREATMENT ANALYSIS REQUIRED REMAINING TREATMENT EFFICIENCIES OF TREATMENT SYSTEM IN SERIES WITH GREENROOF. USE FOR SIZING OF TREATMENT SYSTEM IN SERIES WITH VNB. Retention Provided (over the greenroof area): 1.75 IN Catchment 1 Catchment 2 Catchment3 Catchment 4 Retention Volume Required for Cistern: 4, NO CISTERN NO CISTERN NO CISTERN CF Remaining treatment efficiency needed (Nitrogen): % Total Nitrogen removal efficiency provided: % Remaining treatment efficiency needed (Phosphorus): % Total Phosphorous removal efficiency provided: % Irrigation demand 45 IN/YR Rainfall excess (filtrate under drain flow) 30 IN/YR Average yearly demand for harvested water per year: MGY Average supply of harvested water per year: MGY The average supplemental water needed per year: MGY Retention efficiency (%): Input and output for Greenroof worksheet. Efficiency Curve (N $ P) Sys Eff (N $ P) CAT 1 Sys Eff (N $ P) CAT 2 Sys Eff (N $ P) CAT 3 Sys Eff (N $ P) CAT Retention depth (inch): NOTE FOR TREATMENT EFFICIENCY GRAPH: Greenroof harvesting Greenroof cistern/harvesting design curves show the relationship between the greenroof cistern storage and the average design runoff reduction efficiency. Red triangle displayed on the chart represents system sized by the specified input. curves. Sized system is shown on the chart. Remaining treatment efficiencies. These values can be used as guidance in sizing of a downstream treatment system. Source of Graphic: Draft stormwater quality applicant's handbook, Design Requirements For Stormwater Quality Treatment Systems In Florida dated March 2010 by Florida Department of Environmental Protection, available at: March 2010 Figure 22 - Greenroof worksheet. 32
43 To analyze a greenroof/cistern stormwater treatment system in the BMPTRAINS model, the user must select the closest rainfall station to the project site. In addition, the user must indicate the area of the greenroof and retention depth over the greenroof area provided by the associated cistern. If the design does not include a cistern, the area and retention depth inputs do not need to be specified. The result of the calculations is the runoff volume reduction efficiency of the system and required cistern volume (if retention depth is indicated). Additional features of the Greenroof worksheet include typical greenroof cross-sections and the greenroof/cistern volume reduction efficiency chart. The analyzed greenroof system efficiency is displayed on the chart. The worksheet also contains a window with remaining treatment efficiency values for undersized greenroof systems. Vegetated Natural Buffer and Vegetated Filter Strip Vegetated natural buffers (VNBs) are defined as areas with vegetation suitable for nutrient uptake and soil stabilization that are set aside between developed areas and a receiving water or wetland for stormwater treatment purposes (Draft Statewide Stormwater Treatment Rule Development, FDEP 2010). VNBs as stormwater BMPs can be valuable in areas where construction of ponds, swales, exfiltration trenches or other systems can be difficult or impossible due to site constraints. VNBs could also be a valuable part of a BMP treatment train for road projects and other development. In the BMPTRAINS model, VNBs can be analyzed in the Vegetated Natural Buffer (Figure 23) and Vegetated Filter Strips (VFS) worksheets. VNBs and VFSs can be analyzed as retention or detention systems. The difference between VNBs and VFSs is that the VNB design contains natural soil while VFSs contain augmented soil (pollution control media). 33
44 VEGETATED NATURAL BUFFER (VNB): Used for Type A or A-3 soils > 1' deep V6.0 VEGETATED NATURAL BUFFER SERVING : Blue Numbers = Input data Red Numbers = Calculated or Carryover Remaining GO TO STORMWATER treatment TREATMENT efficiencies. ANALYSIS Catchment 1 Catchment 2 Catchment3 Catchment 4 Contributing catchment area: ac Required treatment efficiency (Nitrogen): % Required Input treatment efficiency and (Phosphorus): % output for REQUIRED REMAINING TREATMENT EFFICIENCIES OF TREATMENT SYSTEM IN SERIES WITH VNB. USE FOR SIZING OF TREATMENT SYSTEM IN SERIES WITH VNB. Vegetated Natural Buffer width (10 to 350 feet): ft Catchment 1 Catchment 2 Catchment3 Catchment 4 Vegetated Natural Buffer length (length should be same as buffer): ft Remaining treatment efficiency needed (Nitrogen): % Vegetated Vegetated Natural Buffer storage depth not greater than 1 foot: 1.00 ft Remaining treatment efficiency needed (Phosphorus): % Width of the area feeding the buffer: ft Water storage Natural capacity of the soil: Buffer 0.16 in/in ERROR MESSAGE WINDOW FOR VEGETATED NATURAL BUFFER: What is the slope of Buffer Width with no collector trench or swale (2-6%)? 6.00 % Provided worksheet. treatment efficiency (Nitrogen): % Provided treatment efficiency (Phosphorus): % 0 Which efficiency graph do you want to view? Nitrogen Removal efficiency of the VNB. Displayed curves are based on the ratio of the VNB width to contributing area width (for example 0.2 curve indicates contributing area width 5 times greater than the VNB width. Removal Efficiency (%): Buffer Width (ft): System CAT 1 System CAT 2 System CAT 3 System CAT 4 Figure 23 - Vegetated Natural Buffer worksheet. NOTE FOR TREATMENT EFFICIENCY GRAPH: The purpose of the treatment efficiency graphs is to help illustrate the treatment efficiency of the Vegetated Natural Buffer as the function of the Vegetated Natural Buffer width and contributing watershed width. The graph illustrates that there is a point of diminished return as the width of the Vegetated Natural Buffer is substantially increased. buffer Therefore, to provide the most economical BMP treatment system, other alternatives such as "treatment trains" and compensatory treatment should be considered. Vegetated natural efficiency curves. Error message window for the Vegetated Natural Buffer worksheet. Image Courtesy of Watermark Engineering Group, Inc. VNBs and VFSs are analyzed differently in the BMPTRAINS model for the nutrient load removal efficiency. Therefore, it is important for the user to recognize which option most accurately reflects the designed system. In the retention option, the nutrient load reduction performance is evaluated based on the retention efficiency tables. This is appropriate for a system in which runoff percolates in to the groundwater table. In the detention option, the efficiency of the VNB or VFS is analyzed based on the seepage flow removal efficiency. This option is appropriate for VNB or VFS systems where runoff is drained by underdrain collector systems (or other equivalent system). In addition, in all cases efficiency is adjusted for the overland flow effects. The input parameters for the VNB and VFS BMP worksheets include the buffer (filter strip) width, length, and storage depth, storage capacity of the soil/media within the system and 34
45 width of the area feeding the system. The user must also indicate whether the analyzed BMP is a retention or detention system. In addition, the VFS worksheet requires a type of media mix if the detention system option is selected. The VNB and VFS worksheets are also equipped with treatment efficiency chart. This chart contains curves which show the treatment efficiency of the VNB (VFS) as the function of system width. In addition, since the width of the contributing area affects the performance of the system, each chart contains five separate curves which are plotted based on the different width ratios of the system to the contributing area. The chart displays system efficiency based on the specified input. Swale Swales transport and infiltrate stormwater while encouraging accumulation within an area during storm events. The water is held for a few hours or days with infiltration into the soil. Swales are online retention systems and their treatment effectiveness is directly related to the amount of the annual stormwater volume that is infiltrated (Draft Statewide Stormwater Treatment Rule Development, FDEP 2010). The BMPTRAINS model contains a worksheet (Figure 24) which can analyze the runoff volume reduction efficiency of swales. The calculation of runoff volume reduction efficiency, and associated nutrient load, is based on the annual runoff volume of stormwater that is retained in the swale and not discharged downstream. Unlike with other retention based worksheets, the annual runoff volume of stormwater that is not discharged downstream includes the runoff volume infiltrated due to flow in the swale and runoff volume retained due to a ditch or swale block. The calculated infiltration in swale is based on the equations presented by Wanielista and Yousef (1993) in the Stormwater Management publication. The combined retained and infiltrated runoff depth is used to calculate the efficiency of the swale with the application of retention efficiency tables (Harper and Baker, 2007). 35
46 SWALE SERVING CONTRIBUTING CATCHMENT: Catchment 1 Catchment 2 Catchment3 Catchment 4 Catchment 1 Catchment 2 Catchment3 Catchment 4 Contributing catchment area: ac Concentration reduction? Required treatment efficiency (Nitrogen): % Provided treatment efficiencies are: Required treatment efficiency (Phosphorus): % Nitrogen efficiency Swale top width calculated for flood conditions [W]: ft Phosphorus efficiency Swale bottom width (0 for triangular section) [B]: 0.00 ft Required remaining treatment efficiency of a non retention BMP, such as wet detention in series with swale. Swale length [L]: ft Use for sizing of non retention system in series with swale. Average impervious length: ft Remaining treatment efficiency needed (Nitrogen): % Average impervious width (including shoulder): ft Required pre-treatment efficiency (Phosphorus): % Average width Input of the pervious (blue) area to include swale & width: ft Contributing impervious catchment area: Swale slope output (ft drop/ft length) [S]: (red) ft 2 Manning's N: Soil infiltration rate (in/hr): Side slope of swale (horizontal ft/vertical ft) [Z]: Infiltrated storage depth (in): in Height of the swale block (Max = 2ft) [H]: 1.50 ft Length of the berm upstream of the crest [Lb]: ft Volume of water profile upstream of swale block: in Total volume: in Provided treatment efficiency (Nitrogen): % Provided treatment efficiency (Phosphorus): % Treatment efficiency(%): Retention depth (inch): Figure 24 - Swale worksheet. Blue Numbers = SWALE V6.1 Red Numbers = Efficiency Curve: NOTE FOR TREATMENT EFFICIENCY GRAPH: Sys. Eff. (N $ P) CAT 1 The purpose of this graph is to help Sys. Eff. (N $ P) CAT 2 illustrate the treatment efficiency of the swale as the Swale function of retention Sys. Eff. (N $ P) CAT 3 depth. The graph illustrates that there Sys. Eff. (N $ P) CAT 4 is diminishing effectiveness as the retention depth is increased. efficiency curve. Input data Calculated or Carryover Remaining GO TO STORMWATER treatment TREATMENT efficiencies. ANALYSIS Error message window for the Swale worksheet. The required input information in the Swale worksheet includes the width of the swale, width of the watershed contributing to the swale, length of the swale, length of the watershed contributing to the swale, swale dimensions and soil properties. The combined area of the swale and area contributing to the swale must be equivalent to the post-development watershed area from the Watershed Characteristics tab. The worksheet output includes infiltration depth, retention depth, and associated runoff reduction efficiency. The additional features of the Swale worksheet include swale diagram and runoff volume reduction efficiency chart. Just like in other BMP worksheets, the efficiency of the sized swale is shown on the chart. In addition, the worksheet contains an error message window communicating possible errors with the analysis to the user. The worksheet also contains a 36
47 window with calculated remaining treatment efficiency values for swales which are not sufficient to provide entire required treatment. Rain Garden Rain gardens provide a combination of landscape esthetics and water quality treatment functionality. A rain garden can be a retention or infiltration area. Also if under-drained, a rain garden can function as a detention area. They are usually found in depression areas and are usually have natural plants. Typically, it is a small garden which is designed to withstand the extremes of moisture and concentrations of nutrients, particularly Nitrogen and Phosphorus, which are found in stormwater runoff (Low Impact Development Center, 2007). In the BMPTRAINS model rain gardens can be analyzed as retention or detention systems. Retention rain gardens are systems where the entire retention depth is infiltrated into the groundwater table. In the model, these types of systems are analyzed just like other types of retention systems. The nutrient reduction efficiency of the system depends on the provided retention depth which determines the annual capture volume. The detention rain garden systems effectiveness is dependent on the capture effectiveness and the media used to remove the pollutants. First, the hydraulic capture efficiency of the rain garden is calculated based on the retention depth stored. The calculated hydraulic capture efficiency is then adjusted based on the type of media mix used in the design. This adjustment quantifies the nutrient removal efficiency of the detention rain garden system. The input parameters for the Rain Garden worksheet (Figure 25) include the retention depth provided by the system and selection of whether the analyzed garden is a retention or detention system. The indicated retention depth is used to calculate the hydraulic capture efficiency. If the detention option is selected, in addition to the retention depth, the user must select the media used. Based on the media mix selection, the model will calculate the annual phosphorus and nitrogen removal efficiencies of the system. 37
48 RAIN GARDEN 7/23/2016 V 8.0 These are depressed areas in a landscape for the storage of runoff water. Loadings from BMP area are contained by the BMP, thus no BMP area load. Catchment 1 Catchment 2 Catchment 3 Catchment 4 Contributing catchment area: ac Required treatment efficiency (Nitrogen): % Required treatment efficiency (Phosphorus): % Provided retention depth for Input hydraulic and capture efficiency (see below): in Provided retention volume for hydraulic capture efficiency: ac-ft Is this a retention or detention output system? for Retention Select media mix View Media Mixes Provided treatment efficiency Rain (Nitrogen): Provided treatment efficiency (Phosphorus): Volume Storage Input data Sustainable void space fraction 0.20 Media volume CF = Water above media in CF = 9000 Thus volume storage CF= Used for retention depth above in row 10 & volume storage (inches) = Treatment efficiency(%) Garden kh Retention depth (inch) Rain Garden worksheet treatment efficiency curves Capture Eff. Curve Rain Garden Capture Eff CAT 1 NOTE FOR TREATMENT EFFICIENCY GRAPH: Rain Garden Capture Eff CAT 2 Rain Garden Capture Eff CAT 3 Rain Garden Capture Eff CAT 4 Eff. Curve(N) The purpose of this graph is to help illustrate Sys. Eff. (N) CAT 1 the treatment efficiency of the retention system as the function of retention depth. Sys. Eff. (N) CAT 2 The graph illustrates that there is a point of Sys. Eff. (N) CAT 3 diminished return as the retention depth is Sys. Eff. (N) CAT 4 substantially increased. Therefore, to provide the most economical BMP treatment Eff. Curve(P) system, other alternatives such as "treatment Sys. Eff. (P) CAT 1 trains" and compensatory treatment should Sys. Eff. (P) CAT 2 be considered. Sys. Eff. (P) CAT 3 Sys. Eff. (P) CAT 4 Figure 25 - Rain Garden worksheet. In addition to the calculated nutrient removal efficiencies, the Rain Garden worksheet includes a treatment efficiency chart with an error message window and calculated remaining treatment efficiencies. Tree Well Tree Wells provide a combination of landscape esthetics and water quality treatment functionality. Tree wells are depression areas with media mixes that support vegetation. The typical vegetation used is a tree. During a rain event, runoff water is directed to and across the top of the tree well area and resulting in storage of runoff water in a depth below the tree well area. The soil is a media mix that supports vegetation growth and provides storage of the runoff water (determined based on the media s porosity). The storage volume is, in general, relatively 38
49 small for each tree well, but when many tree wells are used for one catchment, the storage can be significant. In many cases, the addition of trees adds to the beauty of the landscape as well as provide for runoff storage. In dense urban areas, a grate is frequently used to eliminate trip hazards (equal the elevation of the surface path ways) or a "filler" mix of rock/mulch/or rubber chips may be used. In the BMPTRAINS model tree wells can be analyzed as retention or detention systems. Retention tree wells are systems where the entire retention depth is infiltrated into the groundwater table. In the model, these types of systems are analyzed just like other types of retention systems. The nutrient reduction efficiency of the system depends on the provided retention depth. The detention tree well systems is analyzed in the model similar to the analysis performed for a rain garden. First, the hydraulic capture efficiency of the tree well is calculated based on the retention depth stored. The detained water discharge elevation is usually above an elevation where back water will not affect the rate of discharge. If the rate of discharge is affected by the downstream surface water (like flood water in a sewer adjacent to a tree well), then the storage within the tree well will have to be reduced. The calculated hydraulic capture efficiency is then adjusted based on the type of media mix used in the design. This adjustment quantifies the nutrient removal efficiency of the detention tree well system. The input parameters required to estimate the storage for tree wells is the volume of the media mix, the volume of the "filler" mix with sustainable porosity and the clear volume above the mixes (Figure 26). The porosity of the media mix is usually around 0.16 to For most designs, there is a volume of clear storage above the media and "filler" mix and an elevation equal to a paved surface (or other discharge device) elevation when no more water will enter into the tree well. When this clear storage is filled, runoff water will be diverted to a downstream area. That downstream area is frequently referred to as a flood control structure. The indicated retention depth is used to calculate the hydraulic capture efficiency. If the detention option is selected, in addition to the retention depth, the user must select the adsorption media used for a media mix. Based on the media mix selection, the model will calculate the annual phosphorus and nitrogen removal efficiencies of the system. 39
50 Vegetated Areas (tree wells or similar) for: VEGETATED AREAS (Example Tree Wells): V6.0 Catchment 1 Catchment 2 Catchment3 Catchment 4 Contributing catchment area: ac Required treatment efficiency (Nitrogen): % Required treatment efficiency (Phosphorus): % Vegetated Area (Tree Well) depth 5.00 ft Vegetated Area (Tree Well) water depth above soil column: 1.00 ft Catchment 1 Catchment 2 Catchment3 Catchment 4 Vegetated output Area (Tree Well) for length: 4.00 ft Remaining treatment efficiency needed (Nitrogen): % Vegetated Area (Tree Well) width: 4.00 ft Remaining treatment efficiency needed (Phosphorus): % Sustainable Rain water Garden storage capacity of the soil: 0.20 Number of similar Areas within watershed: Retention worksheet. depth for provided hydraulic capture efficiency: in Is this a retention or detention system? Detention Type of soil augmentation: View Media Mixes CTS Provided treatment efficiency (Nitrogen): % Provided treatment efficiency (Phosphorus): % Is/are the vegetated areas sufficient? NO Remaining retention depth needed if retention: Treatment efficiency(%) Input and Retention depth (inch) Figure 26 Tree Well worksheet. Capture Eff. Curve Tree Well Capture Eff CAT 1 Tree Well Capture Eff CAT 2 Tree Well Capture Eff CAT 3 Tree Well Capture Eff CAT 4 Eff. Curve(N) Sys. Eff. (N) CAT 1 Sys. Eff. (N) CAT 2 Sys. Eff. (N) CAT 3 Sys. Eff. (N) CAT 4 Eff. Curve(P) Sys. Eff. (P) CAT 1 Sys. Eff. (P) CAT 2 Sys. Eff. (P) CAT 3 Sys. Eff. (P) CAT 4 NOTE FOR TREATMENT EFFICIENCY GRAPH: The purpose of this graph is to help illustrate the treatment efficiency of the retention system as the function of retention depth. The graph illustrates that there is a point of diminished return as the retention depth is substantially increased. Therefore, to provide the most economical BMP treatment system, other alternatives such as "treatment trains" and Blue Numbers = Red Numbers = Rain Garden worksheet treatment efficiency curves. Input data Calculated or Carryover GO TO STORMWATER TREATMENT ANALYSIS REQUIRED REMAINING TREATMENT EFFICIENCIES OF TREATMENT SYSTEM IN SERIES WITH VEGETATED AREAS. USE FOR SIZING OF TREATMENT SYSTEM IN SERIES WITH VEGETATED AREAS. Remaining treatment efficiencies. These values can be used as guidance in sizing of a downstream treatment system. Image Courtesy of Watermark Engineering Group, Inc. In addition to the calculated nutrient removal efficiencies, the Tree Well worksheet includes a treatment efficiency chart and calculated remaining treatment efficiencies. Lined Reuse Pond with Underdrain Input Lined reuse pond with underdrain input is a reuse BMP for the special condition of an irrigated area with an underdrain which drains to a lined pond. The intention is for the grass or other vegetation as well as microbes in the soil matrix to remove pollutants and get rid of water via evapotranspiration. During a rain event, runoff water is directed to the lined pond where it is stored to meet future irrigation needs, excess water is discharged as overflow. The irrigated area can be any number of vegetated areas that have underdrains such as sports fields. This BMP is particularly useful for vegetated areas that are fertilized as nutrient rich runoff waters are 40
51 collected are reused for irrigation. This has the additional benefit of potentially reducing fertilization demands which can result in a cost savings. In the BMPTRAINS model the lined reuse pond with underdrain input BMP is analyzed as a reuse system. Lined reuse ponds with underdrain inputs are systems where runoff water is stored for irrigation with excess water being discharged as overflow. In the model, these types of systems are analyzed just like the green roof BMP. The nutrient reduction efficiency of the system depends on the size of the lined reuse pond and the size of the irrigation area it serves. The input parameters required to estimate the efficiency for lined reuse ponds with underdrain inputs is the drainage and irrigation area, the retention provided, the irrigation demand, and the rainfall excess (Figure 27). Lined Reuse Pond with Underdrain Input V6.0 Select location Rainfall Station: CLICK ON CELL BELOW TO SELECT Fort Meyers # 3186 Catchment 1 Catchment 2 Catchment3 Catchment 4 Required treatment efficiency (Nitrogen): % Required treatment efficiency (Phosphorus): % Input and Drainage and Irrigation Area (must be equal): 5,837, SF output for Retention Provided (over the drainage area): 2.50 IN Catchment 1 Catchment 2 Catchment3 Catchment 4 Retention Volume Required for Capture: 1,216, NO Reuse NO Reuse NO Reuse CF Remaining treatment efficiency needed (Nitrogen): % Total Nitrogen removal efficiency provided: % Remaining treatment efficiency needed (Phosphorus): Rain Garden % Total Phosphorous removal efficiency provided: % worksheet. Retention volume in Ac-Ft Retention volume in Gal 9,096,060 Irrigation demand (in/y) 16.1 Rainfall excess (sum of runoff and under drain flow) (in/y) 20 Remaining treatment Average yearly demand for harvested water per year: MGY Note the storage area is lined to prevent groundwater exchange. The liner can be clay, HDPE liner, or other types of fabric. Average supply of harvested water per year: MGY The average supplemental water needed per year: MGY Retention efficiency (%): Efficiency Curve (N $ P) Sys Eff (N $ P) CAT 1 Sys Eff (N $ P) CAT 2 Sys Eff (N $ P) CAT 3 Sys Eff (N $ P) CAT Retention depth (inch): NOTE FOR TREATMENT EFFICIENCY GRAPH: Drainage Area Retention/Harvesting design curves show the relationship between the storage and the average runoff reduction or capture efficiency. Red triangle displayed on the chart represents system sized by the specified input. Blue Numbers = Red Numbers = Lined Reuse Pond with Figure 27 Lined Reuse Pond with Underdrain Input worksheet. Input data Calculated or Carryover GO TO STORMWATER TREATMENT ANALYSIS REQUIRED REMAINING TREATMENT EFFICIENCIES OF TREATMENT SYSTEM IN SERIES WITH GREENROOF. USE FOR SIZING OF TREATMENT SYSTEM IN SERIES WITH VNB. Underdrain Input worksheet treatment efficiency curves. efficiencies. These values can be used as guidance in sizing of a downstream treatment system. Source of Graphic: Draft stormwater quality applicant's handbook, Design Requirements For Stormwater Quality Treatment Systems In Florida dated March 2010 by Florida Department of Environmental Protection, available at: March
52 In addition to the calculated nutrient removal efficiencies, the Lined Reuse Pond with Underdrain Input worksheet includes a treatment efficiency chart and calculated remaining treatment efficiencies. User Defined BMPs There are additional BMPs that are only partly documented in terms of average yearly effectiveness and/or standards for operation and maintenance are not complete or well defined. At the time of this publication, it is recognized that for application in certain watersheds, such BMPs are not in general permitted for use. Nevertheless, the model input allows for inclusion of these. Examples are chemical treatment using polymers, alum or other salts; pre-treatment using baffle box designs, street sweeping, and specialty designs using propriety equipment. It could be possible that some agencies granting permits will encourage the use these nontraditional BMPs and for that reason, this option within the BMPTRAINS model allows for inclusion. Some of the input parameters and the output expected are shown below in Figure 28, Figure 29, and Figure 30. USER DEFINED BMP SERVING: User Defined BMP V6.0 Remaining treatment needed and error message. Blue Numbers = Input data Red Numbers = Calculated or Carryover GO TO STORMWATER TREATMENT ANALYSIS Name of BMP Street Sweeping REQUIRED REMAINING TREATMENT EFFICIENCIES OF TREATMENT SYSTEM IN SERIES Contributing catchment area: ac WITH USER DEFINED BMP. USE FOR SIZING OF TREATMENT SYSTEM IN SERIES WITH Required treatment efficiency (Nitrogen): % USER DEFINED BMP. Required Input treatment and efficiency (Phosphorus): % Is this street sweeping, a retention, or a detention system? Street Sweeping Catch 1 Catch 2 Catch 3 Catch 4 output for Provided storage depth for hydraulic capture efficiency*: in Remaining treatment efficiency needed (Nitrogen): % Provided storage volume for hydraulic capture efficiency*: ac-ft Required pre-treatment efficiency (Phosphorus): % User Defined worksheet. Provided treatment efficiency (Nitrogen): % Provided treatment efficiency (Phosphorus): % Enter a short description of BMP below (no more than 200 characters) ERROR MESSAGE WINDOW FOR SINGLE USER DEFINED BMP: Weekly vacuum sweeping will occur, disposing of collected sediments. Attach a detailed explanation with supporting data to support removal efficiencies. Monitoring shall be required when the applicant proposes design criteria not found in this model and does not have specific test data or other data to support the removal claims BMP description and supporting data. Figure 28 - User Defined BMP worksheet for Street Sweeping 42
53 USER DEFINED BMP SERVING: User Defined BMP V6.0 Blue Numbers = Input data Red Numbers = Calculated or Carryover Remaining treatment needed and error message. GO TO STORMWATER TREATMENT ANALYSIS Name of BMP Misc. Retention REQUIRED REMAINING TREATMENT EFFICIENCIES OF TREATMENT SYSTEM IN SERIES Contributing catchment area: ac WITH USER DEFINED BMP. USE FOR SIZING OF TREATMENT SYSTEM IN SERIES WITH Required treatment efficiency (Nitrogen): % USER DEFINED BMP. Required Input treatment efficiency and (Phosphorus): % Is this street sweeping, a retention, or a detention system? Retention Catch 1 Catch 2 Catch 3 Catch 4 Provided output storage depth for for hydraulic capture efficiency*: in Remaining treatment efficiency needed (Nitrogen): % Provided storage volume for hydraulic capture efficiency*: ac-ft Required pre-treatment efficiency (Phosphorus): % Treatment User efficiency Defined (Nitrogen): % ERROR MESSAGE WINDOW FOR SINGLE USER DEFINED BMP: Treatment efficiency (Phosphorus): % worksheet. Enter a short description of BMP below (no more than 200 characters) Miscellaneous retention system to be used providing 1 inch of storage. Attach a detailed explanation with supporting data to support removal efficiencies. Monitoring shall be required when the applicant proposes design criteria not found in this model and does not have specific test data or other data to support the removal claims BMP description and supporting data. Figure 29 - User Defined BMP for Misc. Retention USER DEFINED BMP SERVING: User Defined BMP V6.0 Blue Numbers = Input data Red Numbers = Calculated or Carryover Remaining treatment needed and error message. GO TO STORMWATER TREATMENT ANALYSIS Name of BMP Misc. Detention REQUIRED REMAINING TREATMENT EFFICIENCIES OF TREATMENT SYSTEM IN SERIES Contributing catchment area: ac WITH USER DEFINED BMP. USE FOR SIZING OF TREATMENT SYSTEM IN SERIES WITH Required treatment efficiency (Nitrogen): % USER DEFINED BMP. Required treatment efficiency (Phosphorus): % Input and Is this street sweeping, a retention, or a detention system? Detention Catch 1 Catch 2 Catch 3 Catch 4 Provided output storage depth for for hydraulic capture efficiency*: in Remaining treatment efficiency needed (Nitrogen): % Provided storage volume for hydraulic capture efficiency*: ac-ft Required pre-treatment efficiency (Phosphorus): % User Defined worksheet. Provided treatment efficiency (Nitrogen): % Provided treatment efficiency (Phosphorus): % Enter a short description of BMP below (no more than 200 characters) ERROR MESSAGE WINDOW FOR SINGLE USER DEFINED BMP: Miscellaneous detention system to be used. Attach a detailed explanation with supporting data to support removal efficiencies. Monitoring shall be required when the applicant proposes design criteria not found in this model and does not have specific test data or other data to support the removal claims BMP description and supporting data. Figure 30 - User Defined BMP for Misc. Detention It should be noted that any BMP used in the User Defined BMP worksheet MUST have an adequate description and all relevant test data to support performance. 43
54 Catchment and Treatment Summary Results Once all the general site conditions, watershed characteristics, and BMP details have been entered, the user can view a summary of the results by selecting the Catchment and Treatment Summary Results button on the Stormwater Treatment Analysis worksheet (Figure 15). The Catchment and Treatment Summary Results worksheet (Figure 31) shows the BMPs used in each catchment, the selected catchment configuration, the N and P mass loadings for the pre and post development conditions, the target N and P efficiencies, the target N and P mass loading, the provided N and P efficiencies, and the achieved N and P mass loads. All of the information presented on this worksheet is carried over from other worksheets within the model. This worksheet is intended to allow the user to see the effect of the overall treatment specified by the user. CATCHMENTS AND TREATMENT SUMMARY RESULTS V 8.0 CALCULATION METHODS: 1. The effectiveness of each BMP in a single catchment is converted to an equivalent capture volume. 2. Certain BMP treatment train combinations have not been evaluated and in practice they are at this time not used, an example is a greenroof following a tree well. 3. Wet detention is last when used in a single catchment with other BMPs, except when followed by filtration PROJECT TITLE co-mingling Optional Identification upstream regional Catchment 3 Catchment 4 BMP Name Retention Basin BMP Name BMP Name Catchment B - 2 Catchment-Series Configuration Nitrogen Pre Load (kg/yr) 0.00 Phosphorus Pre Load (kg/yr) 0.00 Nitrogen Post Load (kg/yr) Phosphorus Post Load (kg/yr) 4.45 Target Load Reduction (N) % 60 Target Load Reduction (P) % Target Discharge Load, N (kg/yr) 8.21 Target Discharge Load, P (kg/yr) 1.78 Provided Overall Efficiency, N (%): Provided Overall Efficiency, P (%): Discharged Load, N (kg/yr & lb/yr): Discharged Load, P (kg/yr & lb/yr): Load Removed, N (kg/yr & Ib/yr): Load Removed, P (kg/yr & Ib/yr): Summary Performance of Entire Watershed Treatment Objectives or Target 60 MET Figure 31 - Multiple Catchments and Treatment Systems Analysis worksheet 44 7/13/2016 BMPTRAINS MODEL 1 2
.")

55 Example Problems The example problems are developed to offer the user a step by step entry procedure using actual screen captures. Introduction Upon opening the BMPTRAINS model some users may encounter the security warning in the upper left corner of the Microsoft Excel window (Figure 32). This message indicates that some content of the model has been disabled. This is a typical warning message for users whose Excel security settings are disabling all macros within the spreadsheet. In order to navigate through the model, as well as to perform certain calculations, the user must enable all macros upon opening of the document. This process will have to be repeated every time the model is opened until the user s security settings are changed permanently. Security message warning indicating that all macros have been disabled. Select the Options button to enable the content of the model. Select the Enable this content option and then select OK to enable all macros in the model. Figure 32 - Introduction Page worksheet. 45

56 The model is ready for use when all macro content is enabled. However, prior to the use of the model, the user is strongly encouraged to familiarize themselves with some basic model features, capabilities and limitations. Key instructions for navigation, viewing and printing the model results are displayed in the Introduction Page worksheet under the help buttons (Figure 33). Key tips and instructions on the navigation, viewing and printing model results. Figure 33 - Introduction Page worksheet. It should be noted that the navigation between different worksheets is only available via the use of gray macro buttons. The user should become comfortable using these buttons as this is the only way one can navigate through the model since the individual worksheet tabs are not displayed. However, this should not be difficult since the buttons are clearly labeled with the worksheet destinations. Another important message displayed in the Introduction Page worksheet is related to the printing of the input and output. All worksheets which require an input of information or provide calculated results are formatted to print only the necessary information. However, due to differences in printer resolutions, the user may still need to adjust the print settings for optimum printing results. Another way to get around the printing issue is to use Microsoft Office Image 46
 by selecting the Click Here to Start")

57 Writer, Microsoft XPS Office Document Writer, Adobe PDF, or another default software to print the information to document (Figure 34). Figure 34 - Introduction Page worksheet. Once the user becomes familiar with all of the important information on the Introduction Page, please proceed to the General Site Information page (Figure 35) by selecting the Click Here to Start button. This is the first worksheet which requires the user to specify information if they desire to begin the BMP nutrient removal efficiency analysis. Therefore, it is important to recognize which cells represent the information input and which cells represent the calculated output. All input cells are characterized by a grey background and blue font. All output cells are characterized by a white background and red font. This arrangement is shown in the upper right corner of each worksheet that requires input (Figure 35). All input cells have grey background and blue font. All output cells have a white background with red font. This is shown on all sheets with input in the top right corner. Figure 35 - General Site Information worksheet. 47

58 Another feature permits the user to enter the name of the project on the general site information sheet. This name will carry on to a print out on the multiple watersheds and treatment analysis sheet. There is also an opportunity on the multiple watershed and treatment systems sheet to enter a description for an optional treatment system analyzed. The input area on the general site information sheet to enter the project name is shown in Figure 36. NAME OF PROJECT Figure 36 - Name of Project Input The General Site Information worksheet also contains two maps which are provided to aid the user with the appropriate input selection in this worksheet (Figure 37). View rainfall and meteorological zone maps for help to select the appropriate input in this worksheet. Figure 37 - General Site Information worksheet. The first map is the meteorological zone map (Figure 38). This map can help the user to select the appropriate meteorological zone applicable of the location to the project site. Appropriate selection of the meteorological zone is necessary to ensure that the model is using the correct coefficients in the calculations. 48

59 ZONE MAP DESIGNATED METEOROLOGICAL REGIONS (ZONES) IN FLORIDA Figure 38 - Meteorological Zone Map Description 49

60 The second map is the mean annual rainfall map (Figure 39). This map allows the user to find the annual rainfall amount applicable to the project site location. Appropriate selection of the mean annual rainfall amount is necessary to ensure that calculated annual runoff volumes most accurately represent the existing and proposed conditions. Figure 39 - Mean Annual Rainfall Map worksheet. 50
61 Example problem # 1 - swale - specified removal efficiency of 80% A 0.1-acre retention swale is serving a 1.1-acre highway project. The site is located in Liberty County, Southwest of Tallahassee, FL area on Hydrologic Soil Group D. The existing land use condition is assumed to be agricultural-pasture with a non-dcia Curve Number of 80 and 0.0% DCIA. The post-development land use condition is highway with a non-dcia Curve Number of 85 and 50% DCIA. Does the swale provide treatment sufficient enough to reduce the annual nutrient loading by 80.0%? The swale dimensions are shown in Figure 43. Assume that additional concentration reduction is achieved because of the very low longitudinal slope. 1. From the introduction page click on the Click Here to Start button to proceed to the General Site Information worksheet. a. Select the Reset Input for Stormwater Treatment Analysis button to erase any existing data. b. Enter the project name and select the meteorological zone in the General Site Information worksheet (Figure 40). c. Indicate the mean annual rainfall amount in the General Site Information worksheet. d. Select the Specified Removal Efficiency option from the type of analysis drop down menu in the General Site Information worksheet. e. Specify the desired removal efficiency. 51

62 GENERAL SITE INFORMATION: V6.0 Select the STEP 1: Select the appropriate Meteorological Zone, input the appropriate Mean Annual Rainfall amount and select the type of analysis appropriate data in the General Site Information Page worksheet. Meteorological Zone (Please use zone map): Mean Annual Rainfall (Please use rainfall map): GO TO INTRODUCTION PAGE CLICK ON CELL BELOW TO SELECT Zone Inches NAME OF PROJECT Example Problem 1 CLICK ON CELL BELOW TO SELECT Type of analysis: Specified removal efficiency Treatment efficiency (N, P) (leave empty if net improvement or BMP analysis is used): % Blue Numbers = Red Numbers = VIEW ZONE MAP Input data Calculated or Carryover VIEW MEAN ANNUAL RAINFALL MAP GO TO WATERSHED CHARACTERISTICS STEP 2: Select the STORMWATER TREATMENT ANALYSIS to begin analyzing Best Management Practices. Model documentation and example problems. STORMWATER TREATMENT ANALYSIS Select the Reset Input for Stormwater Treatment Analysis button. Systems available for analysis: Retention Basin with option for calculating effluent concentration Wet Detention Exfiltration Trench Pervious Pavement Stormwater Harvesting Underdrain Biofiltration Greenroof Rainwater Harvesting Floating Island with Wet Detention Vegetated Natural Buffer Vegetated Filter Strip Swale Rain Garden User Defined BMP RESET INPUT FOR STORMWATER TREATMENT ANALYSIS Figure 40 - General Site Information worksheet. There is a user's manual for the BMPTRAINS model. It can be downloaded from The results from the example problems shown in the manual however may not reflect current model results due to ongoing updates of map the model. and annual METHODOLOGY FOR CALCULATING REQUIRED TREATMENT EFFICIENCY METHODOLOGY FOR RETENTION SYSTEMS METHODOLOGY FOR GREENROOF SYSTEMS Note that the zone rainfall map can be viewed by selecting the appropriate button. METHODOLOGY FOR WET DETENTION SYSTEMS METHODOLOGY FOR WATER HARVESTING SYSTEMS 2. Select the Go To Watershed Characteristics button to proceed to the Watershed Characteristics worksheet (Figure 41). a. Select a catchment configuration from the drop down menu; for diagrams of the different catchment configurations available, click the View Catchment Configuration button to proceed to the Catchment Configuration worksheet. Go back to the Watershed Characteristics worksheet by selecting the Go to Watershed Characteristics button (Figure 41). WATERSHED CHARACTERISTICS V 8.0 GO TO STORMWATER TREATMENT ANALYSIS SELECT CATCHMENT CONFIGURATION 7/13/2016 CLICK ON CELL BELOW TO SELECT CONFIGURATION B - 2 Catchment-Series VIEW CATCHMENT CONFIGURATION For comingling, the off-site catchment must be upstream. The delay is only for retention BMPs and must be used in hours as measured by the time of concentration at a one inch/hour rain GO TO GENERAL SITE INFORMATION PAGE VIEW AVERAGE ANNUAL RUNOFF Delay [hrs] CATCHMENT NO.1 NAME: upstream Select the View Catchment "C" Factor OVERWRITE DEFAULT CONCENTRATIONS USING: CLICK ON CELL BELOW TO SELECT PRE: POST: Pre-development land use: EMC(N): mg/l mg/l with Configuration default EMCs button. CLICK ON CELL BELOW TO SELECT VIEW EMC & FLUCCS EMC(P): mg/l mg/l Post-development land use: Light Industrial: TN=1.200 TP=0.260 with default EMCs Total pre-development catchment area: AC GO TO GIS LANDUSE DATA USE DEFAULT CONCENTRATIONS Figure 41 - Watershed Characteristics - Catchment Configuration selection 3. From the Watershed Characteristics worksheet: 52 Blue Numbers = Red Numbers = Input data Calculated
63 a. Select the single catchment option from the drop down menu. b. Indicate the pre- and post-development land use, catchment areas, non-dcia Curve Number and DCIA percentage. WATERSHED CHARACTERISTICS V 8.0 GO TO STORMWATER TREATMENT ANALYSIS SELECT CATCHMENT CONFIGURATION 7/13/2016 CLICK ON CELL BELOW TO SELECT CONFIGURATION A - Single Catchment For comingling, the off-site catchment must be upstream. The delay is only for retention BMPs and must be used in hours as measured by the time of concentration at a one inch/hour rain VIEW Delay [hrs] CATCHMENT NO.1 NAME: Example 1 catchment Indicate AVERAGE land ANNUAL use in this RUNOFF "C" Factor CLICK ON CELL BELOW TO SELECT worksheet. Note each Pre-development land use: Agricultural - Pasture: TN=3.510TP=0.686 with default EMCs CLICK ON CELL BELOW TO SELECT land VIEW use has EMC EMCs & FLUCCS Post-development land use: Highway: TN=1.520 TP=0.200 with default EMCs assigned GO TO GIS as LANDUSE defaults DATA Total pre-development catchment area: 1.10 AC values. These values Total post-development catchment or BMP analysis area: 1.10 AC Average annual pre runo Pre-development Non DCIA CN: can be over-written Average annual if post run Pre-development DCIA percentage: 0.00 % Pre-development Annua Post-development Non DCIA CN: appropriate. Pre-development Annua Post-development DCIA percentage: % Post-development Annu Estimated BMPArea (No loading from this area) 0.10 AC Post-development Annu Figure 42 - Watershed Characteristics worksheet. 4. Select the Stormwater Treatment Analysis button to proceed to the Stormwater Treatment Analysis worksheet. a. Select the Swale button to proceed to the Swale worksheet (Figure 43). 5. Specify the required input in the Swale worksheet as shown in Figure The example problem specifies additional concentration reduction, so select yes in the cell P6. 53
64 SWALE SERVING CONTRIBUTING CATCHMENT: SWALE 9/17/2016 Loadings from BMP area are contained by the BMP, thus no BMP area load.example 1 catchmcatchment 2 Catchment 3 Catchment 4 Example 1 catchmcatchment 2 Catchment 3 Catchment 4 Contributing catchment area: ac Concentration reduction? (If S<= 1% or H>= 6 in) Yes Required treatment efficiency (Nitrogen): % Required treatment efficiency (Phosphorus): % Provided percent mass reductions in surface discharges are: Swale top width calculated for flood conditions [W]: ft Nitrogen efficiency Swale bottom width (0 for triangular section) [B]: 0.00 ft Phosphorus efficiency Swale length [L]: ft Average impervious length: ft If you are you interested in the mass of pollutants removed before percolating into the Average impervious width (including shoulder): ft groundwater? View Media Mixes Average width of the pervious area to include swale width: ft Specify soil media Contributing catchment area: ft 2 Nitrogen mass reduction in groundwater discharge % Swale slope (ft drop/ft length) [S]: Phosphorus mass reduction in groundwarer discharge % Manning's N: Soil infiltration rate: in/hr Side slope of swale (horizontal ft/vertical ft) [Z]: Infiltrated storage depth: in Average height of the swale blocks [H]: ft Length of the berm upstream of the crest [Lb]: ft Number of swale blocks*: Volume of water in swales upstream of swale blocks: in Total volume: in Provided treatment efficiency (Nitrogen): % Provided treatment efficiency (Phosphorus): % * Assumes that swale blocks are equadistant spacing along length of swale, swale slope is consistent, and swale length is total length of swale Treatment efficiency(%): Retention depth (inch): Efficiency Curve: example problem 1 Sys. Eff. (N $ P) CAT 1 Sys. Eff. (N $ P) CAT 2 Sys. Eff. (N $ P) CAT 3 Sys. Eff. (N $ P) CAT 4 NOTE FOR TREATMENT EFFICIENCY GRAPH: The purpose of this graph is to help illustrate the treatment efficiency of the swale as the function of retention depth. The graph illustrates that there is diminishing effectiveness as the retention depth is increased. Blue Numbers = V 8.1 Red Numbers = Input data Calculated or Carryover GO TO STORMWATER TREATMENT ANALYSIS Figure 43 - Swale worksheet. 54
65 7. Select the Go to Stormwater Treatment Analysis Button to go to the Stormwater Treatment Analysis worksheet and proceed to the Catchment and Treatment Summary Results worksheet by clicking the Catchment and Treatment Summary Results button (see Figure 44 for details). CATCHMENTS AND TREATMENT SURFACE DISCHARE SUMMARY V 8.1 CALCULATION METHODS: 1. The effectiveness of each BMP in a single catchment is converted to an equivalent capture volume. 2. Certain BMP treatment train combinations have not been evaluated and in practice they are at this time not used, an example is a greenroof following a tree well. 3. Wet detention is last when used in a single catchment with other BMPs, except when followed by filtration PROJECT TITLE example problem 1 Optional Identification Example 1 catchment Catchment 2 Catchment 3 Catchment 4 BMP Name BMP Name BMP Name Swale Surface Water Discharge Summary Performance of Entire Watershed Catchment Configuration A - Single Catchment Nitrogen Pre Load (kg/yr) Phosphorus Pre Load (kg/yr) Nitrogen Post Load (kg/yr) Phosphorus Post Load (kg/yr) Target Load Reduction (N) % Target Load Reduction (P) % Target Discharge Load, N (kg/yr) Target Discharge Load, P (kg/yr) 0.13 Provided Overall Efficiency, N (%): 73 Provided Overall Efficiency, P (%): 73 Discharged Load, N (kg/yr & lb/yr): Discharged Load, P (kg/yr & lb/yr): Load Removed, N (kg/yr & Ib/yr): Load Removed, P (kg/yr & Ib/yr): Treatment Objectives or Target 1.00 NOT MET Figure 44 Catchment and Treatment Summary Results Note 80% removal 1is not achieved. Thus modification to the swale or additional BMPs must be used 9/17/2016 BMPTRAINS MODEL 8. To increase the removal efficiency, try modifying the swale, for example change the shape from triangular to trapezoidal. 55
66 Example problem # 2 - retention basin - pre vs. post-development loading A 1-acre retention basin is serving an 11.0-acre residential subdivision. The site is located in Tampa, FL on Hydrologic Soil Group A. The existing land use condition is assumed to be agricultural-pasture with a non-dcia Curve Number (CN) of 50 and 0.0% DCIA. The postdevelopment land use condition is a residential subdivision with a non-dcia Curve Number of 65 and 25% DCIA. The retention basin is to provide treatment sufficient enough to match the pre-development annual nutrient loads with the existing condition. 1. From the introduction page click on the Click Here to Start button to proceed to the General Site Information worksheet. a. Select the Reset Input for Stormwater Treatment Analysis button to erase any existing data. b. Enter the project name and select the meteorological zone in the General Site Information worksheet (Figure 45). c. Indicate the mean annual rainfall amount in the General Site Information worksheet. d. Select the Net Improvement option from the type of analysis drop down menu in the General Site Information worksheet. 56
67 GENERAL SITE INFORMATION: V6.0 Select the appropriate data in the General Site Information Page worksheet. STEP 1: Select the appropriate Meteorological Zone, input the appropriate Mean Annual Rainfall amount and select the type of analysis Meteorological Zone (Please use zone map): Mean Annual Rainfall (Please use rainfall map): GO TO INTRODUCTION PAGE CLICK ON CELL BELOW TO SELECT Zone Inches NAME OF PROJECT Example Problem 2 CLICK ON CELL BELOW TO SELECT Type of analysis: Net improvement Treatment efficiency (N, P) (leave empty if net improvement or BMP analysis is used): % Blue Numbers = Red Numbers = VIEW ZONE MAP Input data Calculated or Carryover VIEW MEAN ANNUAL RAINFALL MAP GO TO WATERSHED CHARACTERISTICS STEP 2: Select the STORMWATER TREATMENT ANALYSIS to begin analyzing Best Management Practices. Model documentation and example problems. STORMWATER TREATMENT ANALYSIS Select the Reset Input for Stormwater Treatment Analysis button. Systems available for analysis: Retention Basin with option for calculating effluent concentration Wet Detention Exfiltration Trench Pervious Pavement Stormwater Harvesting Underdrain Biofiltration Greenroof Rainwater Harvesting Floating Island with Wet Detention Vegetated Natural Buffer Vegetated Filter Strip Swale Rain Garden User Defined BMP RESET INPUT FOR STORMWATER TREATMENT ANALYSIS Figure 45 - General Site Information worksheet. There is a user's manual for the BMPTRAINS model. It can be downloaded from The results from the example problems shown in the manual however may not reflect current model results due to ongoing updates of the model. METHODOLOGY FOR CALCULATING REQUIRED TREATMENT EFFICIENCY METHODOLOGY FOR RETENTION SYSTEMS METHODOLOGY FOR GREENROOF SYSTEMS Note that the zone map and annual rainfall map can be viewed by selecting the appropriate button. METHODOLOGY FOR WET DETENTION SYSTEMS METHODOLOGY FOR WATER HARVESTING SYSTEMS 2. Click on the Go To Watershed Characteristics button to proceed to the Watershed Characteristics worksheet (Figure 46). a. Select single catchment from the drop down menu and indicate the pre- and postdevelopment conditions. WATERSHED CHARACTERISTICS Note the program V6.0 SELECT CATCHMENT CONFIGURATION checks to see if a catchment configuration has CATCHMENT NO.1 CHARACTERISTICS: \ If mixed land uses (side calculation) CLICK ON CELL BELOW TO SELECT Pre-development land use: Agricultural - Pasture: TN=3.470 TP=0.616 been entered. with default EMCs CLICK ON CELL BELOW TO SELECT Post-development land use: Single-Family: TN=2.070 TP=0.327 with default EMCs Total pre-development catchment area: AC Total post-development catchment or BMP analysis area: AC Figure 46 - Watershed Characteristics worksheet. GO TO STORMWATER TREATMENT ANALYSIS CLICK ON CELL BELOW TO SELECT CONFIGURATION A - Single Catchment Land use Area Acres non DCIA CN %DCIA Pre-development Non DCIA CN: worksheet. Pre-development DCIA percentage: 0.00 % Pre-development Annua Post-development Non DCIA CN: Pre-development Annua Post-development DCIA percentage: % Post-development Annu Estimated Area of BMP (used for rainfall excess not loadings) 1.00 AC Post-development Annu Total Select the pre and post development Watershed Characteristics 57
68 3. Select the Stormwater Treatment Analysis button to proceed to the Stormwater Treatment Analysis worksheet. 4. Select the Retention Basin button to proceed to the Retention Basin worksheet (Figure 47). a. The Retention Basin worksheet shows the retention depth required to meet the required efficiency or the user can enter a different depth in the cell Provided Retention Depth Catchment 1 Catchment 2 Catchment 3 Catchment 4 Watershed area: ac Required Treatment Eff (Nitrogen): % Required Treatment Eff (Phosphorus): % Required retention depth over the watershed to meet required efficiency: in Required water quality retention volume: ac-ft Retention volume based on retention depth ac-ft Provided retention depth (inches over the watershed area): in Provided treatment efficiency (Nitrogen): % Provided treatment efficiency (Phosphorus): % Remaining treatment efficiency (Nitrogen): % Remaining treatment efficiency (Phosphorus): % Remaining Retention retention depth efficiency needed: curve for the indicated watershed characteristics in Efficiency Curve: System Efficiency (N $ P) CAT 1: Note the System Retention Efficiency (N $ P) CAT Basin 2: efficiency System Efficiency is (N shown $ P) CAT 3: on the curve. NOTE FOR TREATMENT EFFICIENCY GRAPH: System Efficiency (N $ P) CAT 4: The purpose of this graph is to help illustrate the treatment efficiency 70 of the retention system as the function of retention depth for a single BMP and in a single catchment. The graph illustrates that there is a diminished return as the retention depth is increased. Thus evaluations of other alternatives in "treatment trains" and 40 compensatory treatment should be considered Retention depth (inch): View Media Mixes Catchment 1 Catchment 2 Catchment 3 Catchment 4 If using media mix as a filter before water enters the ground, specify type Average Nitrogen concentration in the filter effluent entering groundwater in mg/l Average Phosphorus concentration in the filter effluent entering groundwater in mg/l Figure 47 - Retention Basin worksheet. RETENTION BASIN: V6.0 RETENTION BASIN SERVING: Example Problem 2 RETENTION BASIN FOR MULTIPLE TREATMENT SYSTEMS (if there is a need for additional removal efficiencies in a series of BMPs): Treatment efficiency(%): Required retention depth and retention volume output for a Retention Basin. Provided retention depth for a Retention Basin. 5. The user can now view a summary of the treatment achieved for the specified site conditions and BMP used by selecting the Stormwater Treatment Analysis button to proceed to the Stormwater Treatment Analysis worksheet, and then selecting the Catchment and 58
69 Treatment Summary Results button to go to the Catchment and Treatment Summary Results worksheet (Figure 48). CATCHMENTS AND TREATMENT SUMMARY RESULTS V6.0 CALCULATION METHODS: 1. The effectiveness of each BMP in a single catchment is converted to an equivalent capture volume. 2. Certain BMP treatment train combinations have not been evaluated and in practice they are at this time not used, an example is a greenroof following a tree well. 3. If multiple BMPs are used in a single catchment and one of them is detention, then it is assumed to be last in series. PROJECT TITLE Example Problem 2 Optional Identification Catchment 1: Catchment 2: Catchment 3: Catchment 4: BMP1 Retention Basin BMP2 BMP3 Catchment A - Single Catchment Configuration Catchment Nitrogen Pre Load Catchment Phosphorus Pre Load Catchment Nitrogen Post Load Catchment Phosphorus Post Load Target Load Reduction (N) % Target Load Reduction (P) % Target Discharge Load, N (kg/yr) Target Discharge Load, P (kg/yr) Provided Overall Efficiency, N (%): Provided Overall Efficiency, P (%): Discharged Load, N (kg/yr & lb/yr): Discharged Load, P (kg/yr & lb/yr): Load Removed, N (kg/yr & Ib/yr): Load Removed, P (kg/yr & Ib/yr): Summary Performance /24/2014 BMPTRAINS MODEL 1 The overall removal efficiency and mass removal is shown Figure 48 Catchment and Treatment Summary Results 59
70 Example problem # 3 - retention basin - specified removal efficiency of 75% A 1-acre retention basin is serving an 11.0-acre residential subdivision. The site is located in Tampa, FL on Hydrologic Group Soil A. The existing land use condition is assumed to be agricultural-pasture with a non-dcia Curve Number of 50 and 0.0% DCIA. The postdevelopment land use condition is a residential subdivision with a non-dcia Curve Number of 65 and 25% DCIA. The retention basin is to provide treatment sufficient enough to provide 75% reduction of the post-development annual nutrient loads. 1. From the introduction page click on the Click Here to Start button to proceed to the General Site Information worksheet. a. Select the Reset Input for Stormwater Treatment Analysis button to erase any existing data. b. Enter the project name and select the meteorological zone in the General Site Information worksheet (Figure 49). c. Indicate the mean annual rainfall amount in the General Site Information worksheet d. Select the Specified Removal Efficiency option from the type of analysis drop down menu in the General Site Information worksheet. e. Specify the desired removal efficiency. 60
71 GENERAL SITE INFORMATION: V6.0 Select the appropriate data in STEP 1: Select the appropriate Meteorological Zone, input the appropriate Mean Annual Rainfall amount and select the type of analysis the General Site Information Page worksheet. Meteorological Zone (Please use zone map): Mean Annual Rainfall (Please use rainfall map): GO TO INTRODUCTION PAGE CLICK ON CELL BELOW TO SELECT Zone Inches NAME OF PROJECT Example Problem 3 CLICK ON CELL BELOW TO SELECT Type of analysis: Specified removal efficiency Treatment efficiency (N, P) (leave empty if net improvement or BMP analysis is used): % Blue Numbers = Red Numbers = VIEW ZONE MAP Input data Calculated or Carryover VIEW MEAN ANNUAL RAINFALL MAP GO TO WATERSHED CHARACTERISTICS STEP 2: Select the STORMWATER TREATMENT ANALYSIS to begin analyzing Best Management Practices. Model documentation and example problems. STORMWATER TREATMENT ANALYSIS Select the Reset Input for Stormwater Treatment Analysis button. Systems available for analysis: Retention Basin with option for calculating effluent concentration Wet Detention Exfiltration Trench Pervious Pavement Stormwater Harvesting Underdrain Biofiltration Greenroof Rainwater Harvesting Floating Island with Wet Detention Vegetated Natural Buffer Vegetated Filter Strip Swale Rain Garden User Defined BMP RESET INPUT FOR STORMWATER TREATMENT ANALYSIS Figure 49 - General Site Information worksheet. There is a user's manual for the BMPTRAINS model. It can be downloaded from The results Note from the that example the problems zone shown in the manual however may not reflect current model results due to ongoing updates of the model. METHODOLOGY FOR CALCULATING REQUIRED TREATMENT EFFICIENCY METHODOLOGY FOR RETENTION SYSTEMS METHODOLOGY FOR GREENROOF SYSTEMS map and annual rainfall map can be viewed by selecting the appropriate button. METHODOLOGY FOR WET DETENTION SYSTEMS METHODOLOGY FOR WATER HARVESTING SYSTEMS 2. Select the Watershed Characteristics button to proceed to the Watershed Characteristics worksheet (Figure 50). a. Indicate the catchment configuration, pre- and post-development land use, catchment areas, non-dcia Curve Number and DCIA percentage. 3. Select the Stormwater Treatment Analysis button to proceed to the Stormwater Treatment Analysis worksheet. 61
72 WATERSHED CHARACTERISTICS V6.0 GO TO STORMWATER TREATMENT ANALYSIS CLICK ON CELL BELOW TO SELECT CONFIGURATION SELECT CATCHMENT CONFIGURATION A - Single Catchment CATCHMENT NO.1 CHARACTERISTICS: \ If mixed land uses (side calculation) CLICK ON CELL BELOW TO SELECT Pre-development land use: Agricultural - Pasture: TN=3.470 TP=0.616 with default EMCs CLICK ON CELL BELOW TO SELECT Post-development land use: Single-Family: TN=2.070 TP=0.327 with default EMCs Total pre-development catchment area: AC Total post-development catchment or BMP analysis area: Pre-development Non DCIA CN: Characteristics Pre-development DCIA percentage: 0.00 % Pre-development Annua worksheet. Post-development Non DCIA CN: Pre-development Annua Post-development DCIA percentage: % Post-development Annu Estimated Area of BMP (used for rainfall excess not loadings) 1.00 AC Post-development Annu Figure 50 - Watershed Characteristics worksheet. 4. Select the Retention Basin button to proceed to the Retention Basin worksheet (Figure 51). a. The Retention Basin worksheet shows the retention depth required to meet the required efficiency or the user can enter in a different depth in the cell labeled Provided Retention Depth AC Land use Area Acres non DCIA CN %DCIA Total Select the pre and post development Watershed 62
73 Catchment 1 Catchment 2 Catchment 3 Catchment 4 Watershed area: ac Required Treatment Eff (Nitrogen): % Required Treatment Eff (Phosphorus): % Required retention depth over the watershed to meet required efficiency: in Required water quality retention volume: ac-ft RETENTION Required retention BASIN FOR depth MULTIPLE and retention TREATMENT volume SYSTEMS output (if for there the is Retention a need for additional Basin. removal efficiencies in a series of BMPs): Provided retention depth Retention volume based on retention depth ac-ft Provided retention depth (inches over the watershed area): in Provided treatment efficiency (Nitrogen): % Provided treatment efficiency (Phosphorus): % Remaining treatment (Nitrogen): % Retention efficiency curve for the indicated watershed Remaining treatment efficiency (Phosphorus): characteristics % Remaining retention depth needed: in Note the the curve. Retention Basin Efficiency Curve: efficiency is shown on System Efficiency (N $ P) CAT 1: System Efficiency (N $ P) CAT 2: System Efficiency (N $ P) CAT 3: System Efficiency (N $ P) CAT 4: NOTE FOR TREATMENT EFFICIENCY GRAPH: 100 Treatment efficiency(%): Catchment 1 Catchment 2 Catchment 3 Catchment 4 If using media mix as a filter before water enters the ground, specify type Average Nitrogen concentration in the filter effluent entering groundwater in mg/l Average Phosphorus concentration in the filter effluent entering groundwater in mg/l Figure 51 - Retention Basin worksheet. RETENTION BASIN: V6.0 RETENTION BASIN SERVING: Example Problem Retention depth (inch): The purpose of this graph is to help illustrate the treatment efficiency of the retention system as the function of retention depth for a single BMP and in a single catchment. The graph illustrates that there is a diminished return as the retention depth is increased. Thus evaluations of other alternatives in "treatment trains" and compensatory treatment should be considered. View Media Mixes 5. The user can now view a summary of the treatment achieved for the specified site conditions and BMP used by selecting the Stormwater Treatment Analysis button to proceed to the Stormwater Treatment Analysis worksheet, and then selecting the Catchment and Treatment Summary Results button to go to the Catchment and Treatment Summary Results worksheet (Figure 52). 63
74 CATCHMENTS AND TREATMENT SUMMARY RESULTS V6.0 CALCULATION METHODS: 1. The effectiveness of each BMP in a single catchment is converted to an equivalent capture volume. 2. Certain BMP treatment train combinations have not been evaluated and in practice they are at this time not used, an example is a greenroof following a tree well. 3. If multiple BMPs are used in a single catchment and one of them is detention, then it is assumed to be last in series. PROJECT TITLE BMP1 BMP2 BMP3 Example Problem 3 Optional Identification Catchment 1: Catchment 2: Catchment 3: Catchment 4: Retention Basin Catchment Configuration Catchment Nitrogen Pre Load Catchment Phosphorus Pre Load Catchment Nitrogen Post Load Catchment Phosphorus Post Load Target Load Reduction (N) % Target Load Reduction (P) % Target Discharge Load, N (kg/yr) Target Discharge Load, P (kg/yr) Provided Overall Efficiency, N (%): Provided Overall Efficiency, P (%): Discharged Load, N (kg/yr & lb/yr): Discharged Load, P (kg/yr & lb/yr): Load Removed, N (kg/yr & Ib/yr): Load Removed, P (kg/yr & Ib/yr): A - Single Catchment Summary Performance /24/2014 BMPTRAINS MODEL The overall removal efficiency and mass removal is shown 1 Figure 52 - Summary Input & Output worksheet 64
75 Example problem # 4 - wet detention - pre vs. post-development loading with harvesting A half-acre wet detention pond is serving a 5.5-acre highway expansion from one lane in each direction to two lanes in each direction. The existing portion of highway is not served by any treatment system. The existing and proposed portion of the highway will be treated in the post-development condition. The site is located in West Palm Beach, FL on Hydrologic Soil Group D. The existing land use condition is assumed to be a highway with a non-dcia Curve Number of 80 and 40% DCIA. The post-development land use condition is assumed to be a highway with a non-dcia Curve Number of 80 and 85% DCIA. This will be a net improvement problem using a wet detention pond which will utilize a littoral zone (assumed 10% removal efficiency credit) in the design. An average annual residence time of 50 days was calculated for the pond. After net improvement is assessed, if needed add a stormwater harvesting operation to obtain an 80% removal of both nitrogen and phosphorus. 1. From the introduction page click on the Click Here to Start button to proceed to the General Site Information worksheet. a. Select the Reset Input for Stormwater Treatment Analysis button to erase any existing data. b. Enter the project name and select the meteorological zone in the General Site Information worksheet (Figure 53). c. Indicate the mean annual rainfall amount in the General Site Information worksheet d. Select the Net Improvement option from the type of analysis drop down menu in the General Site Information worksheet. 65
76 GENERAL SITE INFORMATION: V7.1 Select the appropriate data in the General Site Information Page worksheet. STEP 1: Select the appropriate Meteorological Zone, input the appropriate Mean Annual Rainfall amount and select the type of analysis Meteorological Zone (Please use zone map): Mean Annual Rainfall (Please use rainfall map): GO TO INTRODUCTION PAGE Inches NAME OF PROJECT Example Problem 4 CLICK ON CELL BELOW TO SELECT Zone CLICK ON CELL BELOW TO SELECT Type of analysis: Net improvement Treatment efficiency (N, P) (leave empty if net improvement or BMP analysis is used): % Blue Numbers = Red Numbers = VIEW ZONE MAP Input data Calculated or Carryover VIEW MEAN ANNUAL RAINFALL MAP GO TO WATERSHED CHARACTERISTICS STEP 2: Select the STORMWATER TREATMENT ANALYSIS to begin analyzing Best Management Practices. Model documentation and example problems. STORMWATER TREATMENT ANALYSIS Select the Reset Input for Stormwater Treatment Analysis button. Systems available for analysis: Retention Basin with option for calculating effluent concentration Wet Detention Exfiltration Trench Pervious Pavement Stormwater Harvesting Underdrain Biofiltration Greenroof Rainwater Harvesting Floating Island with Wet Detention Vegetated Natural Buffer Vegetated Filter Strip Swale Rain Garden Lined reuse pond User Defined BMP RESET INPUT FOR STORMWATER TREATMENT ANALYSIS There is a user's manual for the BMPTRAINS model. It can be downloaded from The results from the example problems shown in the manual however may not reflect current model results due to ongoing map and annual updates of the model. METHODOLOGY FOR CALCULATING REQUIRED TREATMENT EFFICIENCY METHODOLOGY FOR RETENTION SYSTEMS METHODOLOGY FOR GREENROOF SYSTEMS Note that the zone rainfall map can be viewed by selecting the appropriate button. METHODOLOGY FOR WET DETENTION SYSTEMS METHODOLOGY FOR WATER HARVESTING SYSTEMS Figure 53 - General Site Information worksheet. 2. Select the Watershed Characteristics button to proceed to the Watershed Characteristics worksheet (Figure 54). a. Indicate the catchment configuration, pre- and post-development land use, catchment areas, non-dcia Curve Number and DCIA percentage. WATERSHED CHARACTERISTICS V7.1 GO TO STORMWATER TREATMENT ANALYSIS SELECT CATCHMENT CONFIGURATION CATCHMENT NO.1 CHARACTERISTICS: \ If mixed land uses (side calculation) CLICK ON CELL BELOW TO SELECT Pre-development land use: Highway: TN=1.640 TP=0.220 with default EMCs CLICK ON CELL BELOW TO SELECT Post-development land use: Highway: TN=1.640 TP=0.220 with default EMCs Total pre-development catchment area: 5.50 AC Total post-development catchment or BMP analysis area: 5.50 AC Figure 54 - Watershed Characteristics worksheet. 66 CLICK ON CELL BELOW TO SELECT CONFIGURATION A - Single Catchment Select the pre and post development Watershed Characteristics noting that the EMCs for the Land use Area Acres non DCIA CN %DCIA Pre-development Non DCIA CN: Average annual runoff v Pre-development DCIA percentage: % or greater than Pre-development average. Annua Post-development Non DCIA CN: Pre-development Annua Post-development DCIA percentage: % Post-development Annu Estimated Area of BMP (used for rainfall excess not loadings) 0.50 AC Post-development Annu Total highway are site specific
77 3. Select the Stormwater Treatment Analysis button to proceed to the Stormwater Treatment Analysis worksheet. 4. Select the Wet Detention button to proceed to the Wet Detention worksheet (Figure 55). a. Specify the average annual residence time. Also specify whether the littoral zone is used in the design and indicate the efficiency credit associated with it. WET DETENTION POND SERVING: Catchment 1 Catchment 2 Catchment 3 Catchment 4 Total pre-development catchment area: output for ac Total post-development catchment area: ac Average annual residence time (between 1 and 500 the days): Wet days Littoral Zone used in the design: YES Littoral Zone efficiency credit: Detention % Total Nitrogen removal required: % Total Phosphorus removal required: worksheet % Total Nitrogen removal efficiency provided: % Total Phosphorous removal efficiency provided: % Is the wet detention sufficient: YES Average annual runoff volume: ac-ft/yr To Achieve the Treatment Efficiency Shown in the Graph Below, the Following Must Hold Minimum Pond Permanent Pool Volume: ac-ft 100 Efficiency Curve (P) Wet NOTE detention FOR TREATMENT 90 EFFICIENCY GRAPH: System Efficiency efficiency curves. (P) CAT 1 80 System Efficiency (P) CAT 2 Note that the sized 70 System Efficiency The purpose of the treatment (P) CAT 3 wet efficiency detention 60 graphs is to help illustrate System Efficiency the treatment efficiency of the wet (P) CAT 4 50 efficiency detention system is shown as the function on Efficiency Curve (N) of average annual residence time (and 40 System Efficiency the permanent curves. pool volume). The graph (N) CAT 1 illustrates that there is a point of 30 System Efficiency diminished return as the permanent (N) CAT 2 20 pool volume is substantially increased. System Efficiency The lines are produced from the (N) CAT 3 10 conditions of catchment one, thus System Efficiency (N) CAT 4 other catchments are shown with the 0 data points Average Annual Residence Time (days): Treatment Efficiency (%): Figure 55 - Wet Detention worksheet. WET DETENTION: V7.1 Input and Example Problem 4 5. The user can now view a summary of the treatment achieved for the specified site conditions and BMP used by selecting the Stormwater Treatment Analysis button to proceed to the Stormwater Treatment Analysis worksheet, and then selecting the Catchment and Treatment Summary Results button to go to the Catchment and Treatment Summary Results worksheet (Figure 56). 67
78 CATCHMENTS AND TREATMENT SUMMARY RESULTS V7.1 CALCULATION METHODS: 1. The effectiveness of each BMP in a single catchment is converted to an equivalent capture volume. 2. Certain BMP treatment train combinations have not been evaluated and in practice they are at this time not used, an example is a greenroof following a tree well. 3. If multiple BMPs are used in a single catchment and one of them is detention, then it is assumed to be last in series. PROJECT TITLE Example Problem 4 Optional Identification Catchment 1: Catchment 2: Catchment 3: Catchment 4: BMP Name Wet Detention BMP Name BMP Name Catchment A - Single Catchment Configuration Nitrogen Pre Load (kg/yr) Phosphorus Pre Load (kg/yr) 3.16 Nitrogen Post Load (kg/yr) Phosphorus Post Load (kg/yr) 4.90 Target Load Reduction (N) % 35 Target Load Reduction (P) % 35 Target Discharge Load, N (kg/yr) Target Discharge Load, P (kg/yr) 3.16 Provided Overall Efficiency, N (%): Provided Overall Efficiency, P (%): Discharged Load, N (kg/yr & lb/yr): Discharged Load, P (kg/yr & lb/yr): Load Removed, N (kg/yr & Ib/yr): Load Removed, P (kg/yr & Ib/yr): Summary Performance of Entire Watershed /14/2014 BMPTRAINS MODEL 1 The overall removal efficiency Figure 56 - Summary Input & Output worksheet To achieve an 80% efficiency, the wet detention pond can be operated as a stormwater reuse pond. This is possible because there is a need for irrigation water adjacent to the highway. The irrigation water will follow the guidelines of the Water Management Districts and use on the average 0.86 inches per week of water over an eight and a half (8.5) acre area. Using the stormwater harvesting BMP option, the capture effectiveness can be calculated. The only change in the meteorological and catchment input data shown in Figure 53 and Figure 54 is that the BMP effectiveness is the type of analysis and not net improvement. If there is any increase in effectiveness by using stormwater harvesting, the increase can be used to satisfy compensatory treatment needs on the other parts of the highway. The water quality or reuse volume in the wet detention pond is Ac-Ft. Using a weighted runoff coefficient of 0.80, the available harvest volume over the EIA is 2 inches [(12 in/foot)(0.733 ac-ft)/(5.5 ac)(0.80)]. Selecting the stormwater harvesting BMP, the data are 68
79 entered with the option of solving for the harvesting efficiency as shown in Figure 57. The annual capture efficiency is 80.14% of the yearly runoff into the reuse pond. To provide for a continuous source of irrigation water, other supplemental water is needed (4.481 MG/Y). The pond reduces the need for irrigation water from other sources by supplying MG/Y of the total MG/Y [(0.86 in/week)(8.5 ac)(1 foot/12 inches)(52 weeks/year)(0.3258)]. Also in Figure 57 is the REV curve for the watershed conditions of this problem in Zone 5 showing how changes in the water quality or runoff volume (X axis) and reuse rate (Y axis) can affect the average annual capture effectiveness for the reuse pond. STORMWATER HARVESTING V7.1 General Site Information: Example Problem 4 Meteorological Zone: Zone 5 Catchment 1 Catchment 2 Catchment3 Catchment 4 Total Area Contributing to the Harvesting System: AC Total Green Area Available for Irrigation: AC Weighted Rational Runoff Coefficient (0.00 to 1.00): Blue Numbers = Input data Red Numbers = Calculated or Carryover GO TO STORMWATER TREATMENT ANALYSIS GO TO METEOROLOGICAL ZONE MAP GO TO TYPICAL STORMWATER HARVESTING SYS. SCHEMATIC ERROR MESSAGE WINDOW FOR STORMWATER HARVESTING SYSTEM Solving for: CLICK ON CELL BELOW TO SELECT SOLVE FOR HARVEST EFFICIENCY Available Harvest Volume: AC-FT Harvest Rate (0.1 to 4.0 IN/WEEK over Irrigation Area): 0.86 Rate-Efficiency-Volume curves show the relationship between the use rate, average use efficiency and storage volume provided by the pond. Red rectangle displayed on the chart represents system sized by the specified input. Equivalent Impervious Area (EIA) AC Harvest Volume (IN over EIA): IN Determination of Harvest Efficiency: Zone 5 Harvest Rate: CF/DAY 0.40 Harvest Rate (IN/DAY over EIA): IN/DAY 0.35 Harvest Efficiency (20 to 90% efficiency): % 0.30 Determination of Harvest Rate: 0.25 Harvest Rate (IN/DAY over EIA): IN/DAY 0.20 Required Harvest Rate: 0 0 Average 0 0 CF/DAY yearly demand, Required Harvest Rate: IN/WEEK 0.15 Supplemental Water: supply, and supplemental 0.10 Average yearly demand for harvested water: MGY Average supply of harvested water: MGY The average supplemental water needed per year: MGY Use Rate (inches/day over EIA) 0.05 water needed Runoff Volume of Water (inches over EIA) 90% 80% 70% 60% 50% 40% 30% 20% Zone 5 Figure 57 - Reuse or Harvesting Pond Calculation Worksheet To calculate the pollutant removal effectiveness, the detention pond mass removal effectiveness is added as if the reuse and wet pond were in series (actually they are one in the same). The average residence time in the pond is at 50 days, which is higher than usual. With reuse, the residence time will increase as water is removed for irrigation rather than being discharged from the wet detention pond. Note however that the efficiency does not increase significantly beyond 50 days of residence time, and thus the residence time is not changed when adding the wet pond efficiency to the capture efficiency of the reuse pond. What has to be changed is the configuration from a single BMP to two in series. There are now 2 BMPS 69
80 (namely reuse and wet detention) in series. Figure 58 shows in the summary worksheet the performance statistics given the input data. CATCHMENTS AND TREATMENT SUMMARY RESULTS V7.1 CALCULATION METHODS: 1. The effectiveness of each BMP in a single catchment is converted to an equivalent capture volume. 2. Certain BMP treatment train combinations have not been evaluated and in practice they are at this time not used, an example is a greenroof following a tree well. 3. If multiple BMPs are used in a single catchment and one of them is detention, then it is assumed to be last in series. PROJECT TITLE Example Problem 4 Optional Identification Catchment 1: Catchment 2: Catchment 3: Catchment 4: BMP Name BMP Name Wet Detention Stormwater Harvesting BMP Name Summary Performance of Entire Watershed Catchment Configuration A - Single Catchment Nitrogen Pre Load (kg/yr) Phosphorus Pre Load (kg/yr) Nitrogen Post Load (kg/yr) Phosphorus Post Load (kg/yr) Target Load Reduction (N) % Target Load Reduction (P) % Target Discharge Load, N (kg/yr) Target Discharge Load, P (kg/yr) Provided Overall Efficiency, N (%): Provided Overall Efficiency, P (%): Discharged Load, N (kg/yr & lb/yr): Discharged Load, P (kg/yr & lb/yr): Load Removed, N (kg/yr & Ib/yr): Load Removed, P (kg/yr & Ib/yr): The overall removal efficiency 1 4/14/2014 BMPTRAINS MODEL Figure 58 - Summary Input and Output Worksheet for Two BMPs in Series Note the overall average nitrogen annual efficiency in series using stormwater reuse with a wet detention pond increased from 46 to 89%. The average annual phosphorus efficiency increased from 71 to 94%. By example, the calculations show that a reuse pond designed consistently with wet detention pond pollution control criteria can usually meet an 80% efficiency target or provide compensatory value, or net improvement type of analysis. 70
81 Example problem # 5 - wet detention after and in series with retention system (retention basin, exfiltration trench, swales, retention tree wells, pervious pavement, etc.) A half-acre wet detention pond preceded by a half-acre of retention pre-treatment is serving a new highway. The 6-acre watershed is located in West Palm Beach, FL on Hydrologic Soil Group D. The existing land use condition is assumed to be Wet Flatwoods with a non-dcia Curve Number of 80 and 0% DCIA. The post-development land use condition is assumed to be highway where the non-dcia Curve Number is 80 and DCIA is 60%. The target removal efficiency for both nitrogen and phosphorus is 80%. The wet detention pond is used for flood control with a 100-day annual average residence time. The wet detention pond also will utilize a littoral zone (assumed 10% removal efficiency credit) in the design. 1. From the introduction page click on the Click Here to Start button to proceed to the General Site Information worksheet. a. Select the Reset Input for Stormwater Treatment Analysis button to erase any existing data. b. Enter the project name and select the meteorological zone in the General Site Information worksheet (Figure 59). c. Indicate the mean annual rainfall amount in the General Site Information worksheet d. Select the Specified Removal Efficiency option from the type of analysis drop down menu in the General Site Information worksheet. e. Specify the desired removal efficiency. 71
82 GENERAL SITE INFORMATION: V6.0 Select the appropriate data in the General Site Information Page worksheet. STEP 1: Select the appropriate Meteorological Zone, input the appropriate Mean Annual Rainfall amount and select the type of analysis Meteorological Zone (Please use zone map): Mean Annual Rainfall (Please use rainfall map): GO TO INTRODUCTION PAGE CLICK ON CELL BELOW TO SELECT Zone Inches NAME OF PROJECT Example Problem 5 CLICK ON CELL BELOW TO SELECT Type of analysis: Specified removal efficiency Treatment efficiency (N, P) (leave empty if net improvement or BMP analysis is used): % Blue Numbers = Red Numbers = VIEW ZONE MAP Input data Calculated or Carryover VIEW MEAN ANNUAL RAINFALL MAP GO TO WATERSHED CHARACTERISTICS STEP 2: Select the STORMWATER TREATMENT ANALYSIS to begin analyzing Best Management Practices. Model documentation and example problems. STORMWATER TREATMENT ANALYSIS Select the Reset Input for Stormwater Treatment Analysis button. Systems available for analysis: Retention Basin with option for calculating effluent concentration Wet Detention Exfiltration Trench Pervious Pavement Stormwater Harvesting Underdrain Biofiltration Greenroof Rainwater Harvesting Floating Island with Wet Detention Vegetated Natural Buffer Vegetated Filter Strip Swale Rain Garden User Defined BMP RESET INPUT FOR STORMWATER TREATMENT ANALYSIS Figure 59 - General Site Information worksheet. There is a user's manual for the BMPTRAINS model. It can be downloaded from The results from the example problems shown in the manual however may not reflect current model results due to ongoing updates of map the model. and annual METHODOLOGY FOR CALCULATING REQUIRED TREATMENT EFFICIENCY METHODOLOGY FOR RETENTION SYSTEMS METHODOLOGY FOR GREENROOF SYSTEMS Note that the zone rainfall map can be viewed by selecting the appropriate button. METHODOLOGY FOR WET DETENTION SYSTEMS METHODOLOGY FOR WATER HARVESTING SYSTEMS 2. Select the Watershed Characteristics button to proceed to the Watershed Characteristics worksheet (Figure 60). a. Indicate the catchment configuration, pre- and post-development land use, catchment areas, non-dcia Curve Number and DCIA percentage. WATERSHED CHARACTERISTICS V6.0 GO TO STORMWATER TREATMENT ANALYSIS SELECT CATCHMENT CONFIGURATION CATCHMENT NO.1 CHARACTERISTICS: \ If mixed land uses (side calculation) CLICK ON CELL BELOW TO SELECT Pre-development land use: developed - Wet Flatwoods: TN=1.175 TP=0. with default EMCs CLICK ON CELL BELOW TO SELECT Post-development land use: Highway: TN=1.640 TP=0.220 with default EMCs Total pre-development catchment area: 6.00 AC Total post-development catchment or BMP analysis area: 6.00 AC Figure 60 - Watershed Characteristics worksheet. CLICK ON CELL BELOW TO SELECT CONFIGURATION A - Single Catchment Land use Area Acres non DCIA CN %DCIA Pre-development Non DCIA CN: Pre-development DCIA percentage: 0.00 % Pre-development Annua Post-development Non DCIA CN: Pre-development Annua Post-development DCIA percentage: % Post-development Annu Estimated Area of BMP (used for rainfall excess not loadings) 1.00 AC Post-development Annu Total Select the Pre and Post Development Watershed Characteristics. 72
83 3. Select the Stormwater Treatment Analysis button to proceed to the Stormwater Treatment Analysis worksheet. 4. Select the Wet Detention button to proceed to the Wet Detention worksheet (Figure 61). a. Specify the average annual residence time. Also specify whether the littoral zone is used in the design and indicate the efficiency credit associated with it. b. Make note of the remaining treatment efficiency needed as this value will be needed to determine the required retention storage (Figure 61). In this case 61.74% for Nitrogen and 14.56% for Phosphorus. Since Nitrogen requires more additional treatment, this value will set the retention storage. 73
: 10.00 % Total Nitrogen removal required: 80.")
84 WET DETENTION POND SERVING: Catchment 1 Catchment 2 Catchment 3 Catchment 4 Total pre-development catchment area: ac Total post-development catchment area: ac Average annual residence time (between 1 and 500 days): days Littoral Zone used in the design: YES Littoral Zone efficiency credit (user specifies 10, 15, or 20%): % Total Nitrogen removal required: % Catchment 1 Catchment 2 Catchment 3 Catchment 4 Total Phosphorus removal required: % Remaining treatment efficiency needed (Nitrogen): % Total Nitrogen removal efficiency provided: % Remaining treatment efficiency needed (Phosphorus): % Total Phosphorous removal efficiency provided: % Is the wet detention sufficient: NO Average annual runoff volume: ac-ft/yr Wet Detention Pond Characteristics: To Achieve the Treatment Efficiency Shown in the Graph Below, the Following Must Hold Maximum Permanent Pool Depth: ft Minimum Permanent Pool Volume: ac-ft Treatment Efficiency (%): Average Annual Residence Time (days): Figure 61 - Wet Detention worksheet. Blue Numbers = Input data WET DETENTION: V6.1 Red Numbers = Calculated or Carryover Efficiency Curve (P) Example Problem 5 NOTE FOR TREATMENT EFFICIENCY GRAPH: System Efficiency (P) CAT 1 System Efficiency (P) CAT 2 System Efficiency The purpose of the treatment (P) CAT 3 efficiency graphs is to help illustrate System Efficiency the treatment efficiency of the wet (P) CAT 4 Efficiency Curve (N) detention system as the function of average annual residence time (and System Efficiency permanent pool volume). The graph (N) CAT 1 illustrates that there is a point of System Efficiency diminished return as the permanent (N) CAT 2 pool volume is substantially increased. System Efficiency The lines are produced from the (N) CAT 3 conditions of catchment one, thus System Efficiency (N) CAT 4 other catchments are shown with the data points. These are Input and output data using the Wet Detention worksheet. Note that the required efficiency is 80% and the provided is not sufficient. GO TO STORMWATER TREATMENT ANALYSIS REQUIRED REMAINING TREATMENT EFFICIENCIES OF TREATMENT SYSTEM IN SERIES WITH WET DETENTION. USE FOR SIZING OF TREATMENT SYSTEM IN SERIES WITH WET DETENTION. Output for the wet detention system indicates how much additional treatment efficiency is needed for each parameter. Use as guidance in sizing of another BMP system. Source of Graphic: draft STORMWATER QUALITY APPLICANT S HANDBOOK dated March 2010, by the Department of Environmental Protection, available at: March
85 5. Select the Stormwater Treatment Analysis button to proceed to the Stormwater Treatment Analysis worksheet. 6. Select the Retention Basin button to proceed to the Retention Basin worksheet (Figure 62). a. Indicate the retention depth to be provided upstream of the wet detention system in the second part of the Retention Basin worksheet. This is iterative process and the retention depth needs to be adjusted until the provided treatment efficiency of the retention basin matches the remaining treatment efficiency value from the wet detention pond. Catchment 1 Catchment 2 Catchment 3 Catchment 4 Watershed area: ac Required Provide Treatment retention Eff (Nitrogen): depth so that the resulting treatment efficiency is equal to % Required Treatment Eff (Phosphorus): % Required the retention additional depth over the treatment watershed to meet efficiency required efficiency: needed from the wet detention worksheet in Required water quality retention volume: ac-ft Retention volume based on retention depth ac-ft Provided retention depth (inches over the watershed area): in Provided treatment efficiency (Nitrogen): % Provided treatment efficiency (Phosphorus): % Remaining treatment efficiency (Nitrogen): % Remaining treatment efficiency (Phosphorus): % Remaining retention depth needed: in Efficiency Curve: System Efficiency (N $ P) CAT 1: System Efficiency (N $ P) CAT 2: System Efficiency (N $ P) CAT 3: System Efficiency (N $ P) CAT 4: NOTE FOR TREATMENT EFFICIENCY GRAPH: 100 Catchment 1 Catchment 2 Catchment 3 Catchment 4 If using media mix as a filter before water enters the ground, specify type Average Nitrogen concentration in the filter effluent entering groundwater in mg/l Average Phosphorus concentration in the filter effluent entering groundwater in mg/l Figure 62 - Retention Basin worksheet. 7. Select the Stormwater Treatment Analysis button to proceed to the Stormwater Treatment Analysis worksheet. 8. Select the Catchment and Treatment Summary Results button to proceed to the Catchment and Treatment Summary Results worksheet (Figure 63). RETENTION BASIN: V6.0 RETENTION BASIN SERVING: Example Problem 5 RETENTION BASIN FOR MULTIPLE TREATMENT SYSTEMS (if there is a need for additional removal efficiencies in a series of BMPs): Treatment efficiency(%): Input for the retention basin which is part of a multiple treatment system Retention depth (inch): Retention efficiency curve for The purpose of this graph is to help illustrate the treatment efficiency of the retention system as the function of retention depth for a single BMP and a single catchment. The graph illustrates that the indicated watershed there is a diminished return as the retention depth is increased. Thus evaluations of other alternatives in "treatment trains" and characteristics. compensatory treatment Note should be the considered. retention basin efficiency shown on the curve. View Media Mixes 75
86 CATCHMENTS AND TREATMENT SUMMARY RESULTS V7.3 CALCULATION METHODS: 1. The effectiveness of each BMP in a single catchment is converted to an equivalent capture volume. 2. Certain BMP treatment train combinations have not been evaluated and in practice they are at this time not used, an example is a greenroof following a tree well. 3. If multiple BMPs are used in a single catchment and one of them is detention, then it is assumed to be last in series. PROJECT TITLE Example Problem 5 Optional Identification Catchment 1: Catchment 2: Catchment 3: Catchment 4: BMP Name Retention Basin BMP Name Wet Detention BMP Name Catchment Configuration Summary Performance of Entire Watershed A - Single Catchment Achieved annual loads should be less than the target annual loads. Nitrogen Pre Load (kg/yr) Phosphorus Pre Load (kg/yr) Nitrogen Post Load (kg/yr) Phosphorus Post Load (kg/yr) Target Load Reduction (N) % Target Load Reduction (P) % Target Discharge Load, N (kg/yr) Target Discharge Load, P (kg/yr) /23/2014 BMPTRAINS MODEL Provided Overall Efficiency, N (%): Note: effectiveness of 80% Provided Overall Efficiency, P (%): and higher not achieved for N Discharged Load, N (kg/yr & lb/yr): Discharged Load, P (kg/yr & lb/yr): Load Removed, N (kg/yr & Ib/yr): Load Removed, P (kg/yr & Ib/yr): Figure 63 Catchment and Treatment Summary Results worksheet. Note: Achieved effectiveness did not meet treatment goal. This is due to the fact that most of the treatment provided by wet detention is from settling. Since this model treats all detention systems as downstream from retention systems, settling has already occurred by the time the water reaches the detention system. Therefore, for this case, the achieved treatment by the detention BMP is less for nitrogen and phosphorus when detention is used with retention. 76
87 Example problem # 6 - retention systems in series - pre vs. post-development loading A half-acre exfiltration trench in series with a half-acre retention basin is serving a 6.0- acre low-intensity commercial site. In addition, the plan calls for 10 tree wells along the road. The tree wells are to be 3 feet deep with a 6-inch depth above soil column. The length and width of the tree wells are to be 4 feet for each. A 0.2 sustainable water storage capacity of the soil is assumed. The tree wells are retention systems. All 6-acres drain to the three BMPS that are in series with each other (note if there were a catchment area between each BMP, a more accurate estimated of effectiveness is possible with multiple catchments, instead of one catchment). The site is located in Orlando, FL on Hydrologic Soil Group C. The existing land use condition is assumed undeveloped-dry prairie with a non-dcia Curve Number of 79 and 0.0% DCIA. The post-development land use condition is a low intensity commercial area with a non-dcia Curve Number of 85 and 65% DCIA. The combination of treatment systems is to provide treatment sufficient to match the post-development annual nutrient loads with the pre-development annual nutrient loads. 1. From the introduction page click on the Click Here to Start button to proceed to the General Site Information worksheet. a. Select the Reset Input for Stormwater Treatment Analysis button to erase any existing data. b. Enter the project name and select the meteorological zone in the General Site Information worksheet (Figure 64). c. Indicate the mean annual rainfall amount in the General Site Information worksheet d. Select the Net Improvement option from the type of analysis drop down menu in the General Site Information worksheet. 77
88 GENERAL SITE INFORMATION: Select the appropriate data in the General Site Information Page worksheet. STEP 1: Select the appropriate Meteorological Zone, input the appropriate Mean Annual Rainfall amount and select the type of analysis Meteorological Zone (Please use zone map): Mean Annual Rainfall (Please use rainfall map): Type of analysis: Treatment efficiency (N, P) (leave empty if net improvement or BMP analysis is used): GO TO INTRODUCTION PAGE CLICK ON CELL BELOW TO SELECT Zone Inches NAME OF PROJECT Example Problem 6 CLICK ON CELL BELOW TO SELECT Net improvement % Blue Numbers = Red Numbers = VIEW ZONE MAP Input data Calculated or Carryover VIEW MEAN ANNUAL RAINFALL MAP GO TO WATERSHED CHARACTERISTICS STEP 2: Select the STORMWATER TREATMENT ANALYSIS to begin analyzing Best Management Practices. Model documentation and example problems. STORMWATER TREATMENT ANALYSIS Select the Reset Input for Stormwater Treatment Analysis button. Systems available for analysis: Retention Basin with option for calculating effluent concentration Wet Detention Exfiltration Trench Pervious Pavement Stormwater Harvesting Underdrain Biofiltration Greenroof Rainwater Harvesting Floating Island with Wet Detention Vegetated Natural Buffer Vegetated Filter Strip Swale Rain Garden User Defined BMP RESET INPUT FOR STORMWATER TREATMENT ANALYSIS There is a user's manual for the BMPTRAINS model. It can be downloaded from Note that the The zone results from the example problems shown in the manual however map may not and reflect annual current model results due to ongoing updates of the model. METHODOLOGY FOR CALCULATING REQUIRED TREATMENT EFFICIENCY METHODOLOGY FOR RETENTION SYSTEMS METHODOLOGY FOR GREENROOF SYSTEMS rainfall map can be viewed by selecting the appropriate button. METHODOLOGY FOR WET DETENTION SYSTEMS METHODOLOGY FOR WATER HARVESTING SYSTEMS Figure 64 - General Site Information worksheet. 2. Select the Watershed Characteristics button to proceed to the Watershed Characteristics worksheet (Figure 65). a. Indicate the catchment configuration, pre- and post-development land use, catchment areas, non-dcia Curve Number and DCIA percentage. WATERSHED CHARACTERISTICS V 8.3 GO TO STORMWATER TREATMENT ANALYSIS SELECT CATCHMENT CONFIGURATION 1/11/2017 For comingling, the off-site catchment must be upstream. The delay is only for retention BMPs and must be used in hours as measured by the time of concentration at a one inch/hour rain Delay [hrs] CATCHMENT NO.1 NAME: max delay = 15 hrs, CLICK ON CELL BELOW TO SELECT Pre-development land use: Undeveloped - Dry Prairie: TN=2.025 TP=0.184 with default EMCs CLICK ON CELL BELOW TO SELECT Post-development land use: Low-Intensity Commercial: TN=1.13 TP=0.188 with default EMCs Total pre-development catchment area: 6.00 AC Total post-development catchment or BMP analysis area: 6.00 AC Average annual pre runo Pre-development Non DCIA CN: Watershed Average annual post run Pre-development DCIA percentage: 0.00 % Pre-development Annua Post-development Non DCIA CN: Characteristics. Pre-development Annua Post-development DCIA percentage: % Post-development Annu Estimated BMPArea (No loading from this area) 1.00 AC Post-development Annu Figure 65 - Watershed Characteristics worksheet. 78 CLICK ON CELL BELOW TO SELECT CONFIGURATION A - Single Catchment VIEW AVERAGE ANNUAL RUNOFF "C" Factor Select the Pre and Post Development VIEW EMC & FLUCCS GO TO GIS LANDUSE DATA
89 3. Select the Stormwater Treatment Analysis button to proceed to the Stormwater Treatment Analysis worksheet. 4. Select the Vegetated Area Example Tree Well button to proceed to the Vegetated Area Example Tree Well worksheet (Figure 66). a. Fill out the input in the worksheet associated with the dimensions of the tree well and soil properties. b. Make note of the remaining treatment efficiency required for nitrogen and phosphorus (Figure 67 Required remaining treatment from the Vegetated Areas (Example Tree Well) worksheet c. If in series, the remaining treatment efficiencies required are 60.83% TN and 78.61% TP. Tree Well 1/11/2017 V 8.3 Tree wells that can include interceptor storage: Example Problem 6 Loadings from BMP area are contained, thus no BMP area load. Catchment 1 Catchment 2 Catchment 3 Catchment 4 Contributing catchment area: Input and ac Required treatment efficiency (Nitrogen): % output for Required treatment efficiency (Phosphorus): % Vegetated Area (Tree Well) depth 3.00 Tree Wells ft Tree Well Storage (intentional + canopy capture) 0.50 ft Vegetated Area (Tree Well) length: 4.00 which will ft Vegetated Area (Tree Well) width: 4.00 ft Sustainable water storage capacity of the soil: 0.20 be a part of Number of similar Areas within watershed: Retention depth for provided hydraulic capture efficiency: a multiple in Is this a retention or detention system? Retention Type of soil augmentation: View Media Mixes# BMPs in Provided treatment efficiency (Nitrogen): % series. Provided treatment efficiency (Phosphorus): % Is/are the vegetated areas sufficient? NO # see media mixes for recommended TP and TN removals Figure 66 Vegetated Areas (Example Tree Well) worksheet. REQUIRED REMAINING TREATMENT EFFICIENCIES OF TREATMENT SYSTEM IN SERIES WITH VEGETATED AREAS. USE FOR SIZING OF TREATMENT SYSTEM IN SERIES WITH VEGETATED AREAS. Catchment 1 Catchment 2 Catchment 3 Catchment 4 Remaining treatment efficiency needed (Nitrogen): % Remaining treatment efficiency needed (Phosphorus): % Figure 67 Required remaining treatment from the Vegetated Areas (Example Tree Well) worksheet 5. Select the Stormwater Treatment Analysis button to proceed to the Stormwater Treatment Analysis worksheet. 6. Select the Exfiltration Trench button to proceed to the Exfiltration Trench worksheet (Figure 68). 79
90 a. Indicate the retention depth provided by the exfiltration trench in worksheet (Note: this is can be an iterative process if searching an exfiltration size to meet removal or is a fixed number based on a design. In this case, it was a fixed design of ½-inch retention). EXFILTRATION TRENCH: 1/11/2017 V 8.3 EXFILTRATION TRENCH SERVING: Example Problem 6 Note: There are loadings from this BMP area above the trench. Catchment 1 Catchment 2 Catchment 3 Catchment 4 Contributing catchment area: ac Required treatment efficiency (Nitrogen): % Required treatment efficiency (Phosphorus): % Required Input retention for the for the exfiltration entire catchment trench to meet that required is efficiency: part of a multiple 1.125treatment 0.000system Indicate in Required water quality retention volume: ac-ft the retention depth provided by the exfiltration trench. This is an underground system, thus there is no surface area loading reduction for the area of exfiltration Provided retention depth( inches): in Provided treatment efficiency (Nitrogen): % Provided treatment efficiency (Phosphorus): % Remaining treatment efficiency needed (Nitrogen): % Remaining treatment efficiency needed (Phosphorus): % Remaining retention depth needed if retention: in Figure 68 - Exfiltration Trench worksheet. 7. Select the Stormwater Treatment Analysis button to proceed to the Stormwater Treatment Analysis worksheet. 8. Select the Retention Basin button to proceed to the Retention Basin worksheet (Figure 69). a. Indicate the treatment depth provided by the retention basin downstream of exfiltration trench. Note this can also be an iterative approach to match post to pre loadings. RETENTION BASIN: 1/11/2017 V 8.3 RETENTION BASIN SERVING: Example Problem 6 Loadings from BMP area are contained by the BMP, thus no BMP area load. Catchment 1 Catchment 2 Catchment 3 Catchment 4 Watershed area cotributing to basin: ac Required Treatment Eff (Nitrogen): % Required Treatment Eff (Phosphorus): % Required Input retention for the depth retention over the watershed basin to meet that required is part efficiency: of a multiple treatment system in Required water quality retention volume: ac-ft Indicate the treatment depth provided by the retention basin. RETENTION BASIN FOR MULTIPLE TREATMENT SYSTEMS (if there is a need for additional removal efficiencies in a series of BMPs): Retention volume based on retention depth and Total area - BMP area ac-ft Provided retention depth ( inches over the watershed) in Provided treatment efficiency (Nitrogen): % Provided treatment efficiency (Phosphorus): % Remaining treatment efficiency (Nitrogen): % Remaining treatment efficiency (Phosphorus): % Remaining retention depth needed: in Figure 69 - Retention Basin worksheet. 9. Select the Stormwater Treatment Analysis button to proceed to the Stormwater Treatment Analysis worksheet. 80
91 10. Select the Catchment and Treatment Summary Results button to proceed to the Catchment and Treatment Summary Results worksheet (Figure 70). CATCHMENTS AND TREATMENT SURFACE DISCHARGE SUMMARY V 8.3 CALCULATION METHODS: 1. The effectiveness of each BMP in a single catchment is converted to an equivalent capture volume. 2. Certain BMP treatment train combinations have not been evaluated and in practice they are at this time not used, an example is a greenroof following a tree well. 3. Wet detention is last when used in a single catchment with other BMPs, except when followed by filtration PROJECT TITLE Example Problem 6 Optional Identification Catchment 1 Catchment 2 Catchment 3 Catchment 4 BMP Name Retention Basin BMP Name BMP Name Exfiltration Trench Tree Well Surface Water Discharge Summary Performance of Entire Watershed Catchment A - Single Catchment Configuration Nitrogen Pre Load (kg/yr) 6.66 Phosphorus Pre Load (kg/yr) 0.61 Nitrogen Post Load (kg/yr) Phosphorus Post Load (kg/yr) 2.87 Target Load Reduction (N) % 61 Target Load Reduction (P) % Target Discharge Load, N (kg/yr) 6.72 Treatment Objectives or Target for 79 TN MET Target Discharge Load, P (kg/yr) 0.60 TP MET 1 Provided Overall Efficiency, N (%): 86 Provided Overall Efficiency, P (%): 86 Achieved annual effectiveness Discharged Load, N (kg/yr & lb/yr): 2.37 should 5.23 be greater than the Discharged Load, P (kg/yr & lb/yr): target annual load reduction. Load Removed, N (kg/yr & Ib/yr): Load Removed, P (kg/yr & Ib/yr): Figure 70 - Multiple Watersheds and Treatment Systems Analysis worksheet. 18. If needed, the BMP sizes can be reduced on their worksheet pages until the overall provided efficiency matches the required target efficiency. 1/11/2017 BMPTRAINS MODEL Note: For a single catchment for which cascading (in series) retention systems are used, the total treatment efficiency is calculated based on the sum of individual retention depths rather than the sum of the individual removal efficiencies (see Figure 71). This is for the situation of no area input between each of the retention systems. 81
92 Treatment efficiency(%): Efficiency Curve: System Efficiency (N $ P) CAT 1: System Efficiency (N $ P) CAT 2: System Efficiency (N $ P) CAT 3: System Efficiency (N $ P) CAT 4: Retention depth (inch): Figure 71 - Retention Basin worksheet illustrating retention in series. The combined retention depth between Tree Well, Exfiltration Trench and Retention Basin is in in in = 1.58 in. The total treatment efficiency is calculated based on the sum of individual systems retention depths. 82
93 Example problem # 7 - wet detention systems in series - pre vs. post-development loading Two half-acre wet detention ponds in series are serving a 6.0-acre highway expansion from one lane in each direction to two lanes in each direction. The existing portion of highway is not served by any treatment system. The existing and proposed portions of the highway will be treated in the post-development condition. The site is located in Boca Raton, FL on Hydrologic Soil Group D. The existing land use condition is assumed as a 3.0-acre highway with a non- DCIA Curve Number of 80 and 40% DCIA and 3.0-acre Wet Flatwoods with a non-dcia Curve Number of 80 and 0% DCIA. The post-development land use condition is assumed as a highway with a non-dcia Curve Number of 80 and 80% DCIA. Both wet detention ponds will utilize a littoral zone (assumed 10% removal efficiency credit) and floating wetland islands (assumed 20% removal efficiency credit) in the design. The combined average annual residence time provided between the two wet detention ponds in series is to be 90 days. 1. From the introduction page click on the Click Here to Start button to proceed to the General Site Information worksheet. a. Select the Reset Input for Stormwater Treatment Analysis button to erase any existing data. b. Enter the project name and select the meteorological zone in the General Site Information worksheet (Figure 72). c. Indicate the mean annual rainfall amount in the General Site Information worksheet. d. Select the Net Improvement option from the type of analysis drop down menu in the General Site Information worksheet. 83
94 GENERAL SITE INFORMATION: V6.0 Select the appropriate data in the General Site Information Page STEP 1: Select the appropriate Meteorological Zone, input the appropriate Mean Annual Rainfall amount and select the type of analysis Meteorological Zone (Please use zone map): Mean Annual Rainfall (Please use rainfall map): GO TO INTRODUCTION PAGE CLICK ON CELL BELOW TO SELECT Zone Inches NAME OF PROJECT Example Problem 7 CLICK ON CELL BELOW TO SELECT worksheet. Type of analysis: Net improvement Treatment efficiency (N, P) (leave empty if net improvement or BMP analysis is used): % Blue Numbers = Red Numbers = VIEW ZONE MAP Input data Calculated or Carryover VIEW MEAN ANNUAL RAINFALL MAP GO TO WATERSHED CHARACTERISTICS STEP 2: Select the STORMWATER TREATMENT ANALYSIS to begin analyzing Best Management Practices. Model documentation and example problems. STORMWATER TREATMENT ANALYSIS Select the Reset Input for Stormwater Treatment Analysis button. Systems available for analysis: Retention Basin with option for calculating effluent concentration Wet Detention Exfiltration Trench Pervious Pavement Stormwater Harvesting Underdrain Biofiltration Greenroof Rainwater Harvesting Floating Island with Wet Detention Vegetated Natural Buffer Vegetated Filter Strip Swale Rain Garden User Defined BMP RESET INPUT FOR STORMWATER TREATMENT ANALYSIS Figure 72 - General Site Information worksheet. There is a user's manual for the BMPTRAINS model. It can be downloaded from The results from the example problems shown Note that the zone in the manual however may not reflect current model results due to ongoing updates of the model. METHODOLOGY FOR CALCULATING REQUIRED TREATMENT EFFICIENCY METHODOLOGY FOR RETENTION SYSTEMS METHODOLOGY FOR GREENROOF SYSTEMS map and annual rainfall map can be viewed by selecting the METHODOLOGY appropriate FOR WET DETENTION SYSTEMS button. METHODOLOGY FOR WATER HARVESTING SYSTEMS 2. Select the Watershed Characteristics button to proceed to the Watershed Characteristics worksheet a. Select the catchment configuration, two catchments in series for this problem. b. Enter the data for the first and second catchments in the Watershed Characteristics worksheet (Figure 73). c. Indicate the pre- and post-development land use, catchment areas, non-dcia Curve Number and DCIA percentage. 84
95 WATERSHED CHARACTERISTICS V6.0 GO TO STORMWATER TREATMENT ANALYSIS CLICK ON CELL BELOW TO SELECT CONFIGURATION SELECT CATCHMENT CONFIGURATION B - 2 Catchment-Series CATCHMENT NO.1 CHARACTERISTICS: \ If mixed land uses (side calculation) CLICK ON CELL BELOW TO SELECT Pre-development land use: Highway: TN=1.640 TP=0.220 with default EMCs CLICK ON CELL BELOW TO SELECT Post-development land use: Highway: TN=1.640 TP=0.220 with default EMCs Total pre-development catchment area: 3.00 AC Total post-development catchment or BMP analysis area: 3.00 AC Pre-development Non DCIA CN: Figure 73 - Watershed Characteristics worksheet. 3. Select the Stormwater Treatment Analysis button to proceed to the Stormwater Treatment Analysis worksheet. 4. Select the Floating Islands with Wet Detention button to proceed to the Floating Islands with Wet Detention worksheet (Figure 74). Land use Area Acres non DCIA CN %DCIA Pre-development DCIA percentage: % Pre-development Annua worksheet. Note Post-development Non DCIA CN: Pre-development Annua Post-development DCIA percentage: % that Post-development input Annu Estimated Area of BMP (used for rainfall excess not loadings) 0.50 AC Post-development Annu accounts for two CATCHMENT NO.2 CHARACTERISTICS: \ If mixed land uses (side calcula CLICK ON CELL BELOW TO SELECT Land use Area Acres different non DCIA land CN uses %DCIA Pre-development land use: developed - Wet Flatwoods: TN=1.175 TP=0 in the predevelopment CLICK ON CELL BELOW TO SELECT Post-development land use: Highway: TN=1.640 TP=0.220 Total Total pre-development catchment area: 3.00 AC condition. Total post-development catchment or BMP analysis area: 3.00 AC Pre-development Non DCIA CN: Pre-development DCIA percentage: 0.00 % Pre-development Annua Post-development Non DCIA CN: Pre-development Annua Post-development DCIA percentage: % Post-development Annu Estimated Area of BMP (used for rainfall excess not loadings) 0.50 AC Post-development Annu a. Specify average annual residence time provided between the two wet detention ponds in series. Note that the permanent pool volume provided between two wet detention ponds in series should be equivalent to the minimum pond permanent pool value provided by results. b. Specify that the littoral zone be used in the design and indicate the efficiency credit associated with it using the drop down menus (assumed 10% removal efficiency credit). c. Specify that the floating islands be used in the design and indicate the efficiency credit associated with it using the drop down menus (assumed 20% removal efficiency credit). Total Select the pre and post development conditions in the Watershed Characteristics 85
96 FLOATING ISLAND WITH WET DETENTION: V6.1 FLOATING ISLAND WITH WET DETENTION SERVING: Example Problem 7 Catchment 1 Catchment 2 Catchment3 Catchment 4 Total pre-development catchment area: ac Total post-development catchment area: ac Average annual residence time (between 1 and 500 days): days Littoral Zone used in the design: YES YES Littoral Zone efficiency credit (user specifies 10, 15, or 20%): % Floating Wetland or Mats used in the design: YES YES Floating Wetland or Mats credit (default credit at 10%): % Total Nitrogen removal required: % Total Phosphorus removal required: % Total Nitrogen removal efficiency: % Total Phosphorous removal efficiency: % Is the wet detention sufficient: YES NO Average annual runoff volume: Wet Detention Pond Characteristics: ac-ft/yr Maximum Permanent Pool Depth: ft Minimum Pond Permanent Pool: ac-ft Treatment Efficiency (%) Average Annual Residence Time (days) Efficiency Curve (P) Sys Eff (P) CAT 1 Sys Eff (P) CAT 2 Efficiency graphs adjusted for littoral zone and floating islands credit. NOTE FOR TREATMENT EFFICIENCY GRAPH: Input for littoral The purpose of the treatment Sys Eff (P) CAT 3 efficiency graphs zone is to help and illustrate Sys Eff (P) CAT 4 the treatment efficiency of the wet floating detention system as the function of Efficiency Curve average annual island residence time (and (N) permanent pool volume). The graph Sys Eff (N) CAT illustrates that there is a point of 1 diminished return as the permanent Sys Eff (N) CAT 2 pool volume is substantially Sys Eff (N) CAT increased. Therefore, to provide the 3 most economical BMP treatment Sys Eff (N) CAT system, other alternatives such as 4 "treatment trains" and compensatory treatment should be considered. Figure 74 - Floating Island with Wet Detention worksheet. 5. Select the Stormwater Treatment Analysis button to proceed to the Stormwater Treatment Analysis worksheet. 6. Select the Catchment and Treatment Summary Results button to proceed to the Catchment and Treatment Summary Results worksheet (Figure 75). 86
97 CATCHMENTS AND TREATMENT SUMMARY RESULTS V6.0 CALCULATION METHODS: 1. The effectiveness of each BMP in a single catchment is converted to an equivalent capture volume. 2. Certain BMP treatment train combinations have not been evaluated and in practice they are at this time not used, an example is a greenroof following a tree well. 3. If multiple BMPs are used in a single catchment and one of them is detention, then it is assumed to be last in series. PROJECT TITLE Example Problem 7 Optional Identification Catchment 1: Catchment 2: Catchment 3: Catchment 4: BMP1 Floating Island Floating Island BMP2 BMP3 Catchment B - 2 Catchment-Series Configuration Catchment Nitrogen Pre Load Catchment Phosphorus Pre Load Catchment Nitrogen Post Load Catchment Phosphorus Post Load Target Load Reduction (N) % Target Load Reduction (P) % Target Discharge Load, N (kg/yr) Target Discharge Load, P (kg/yr) Provided Overall Efficiency, N (%): Provided Overall Efficiency, P (%): Discharged Load, N (kg/yr & lb/yr): Discharged Load, P (kg/yr & lb/yr): Load Removed, N (kg/yr & Ib/yr): Load Removed, P (kg/yr & Ib/yr): Summary Performance /27/2014 BMPTRAINS MODEL The overall removal 1 2 efficiency and mass leaving is shown Figure 75 Catchment and Treatment Summary Results for Example Problem 7 87
98 Example problem # 8 limited area for treatment and benefits of co-mingling treatment This illustrates the option for treating runoff from an upstream catchment in a downstream BMP. The greater the lag time or the time of concentration to reach the downstream retention BMP, the greater the removal of pollutants from the two catchments. This is because there is capacity in the downstream BMP caused by the infiltration during the lag time. A retention basin for a 2.5-acre addition to an existing highway is planned. The offsite and upstream is a 2-acre rural highway (30% DCIA) that does not have any treatment system. The runoff from the offsite area may be combined with the new roadway runoff. The pervious area has a Curve Number of 50 and 0% DCIA. The location is Lakeland, FL with 50.5 inches of rain per year on average. The pre-development (pre-highway) land use condition is agriculturalcitrus. The post-development land use condition is highway with a non-dcia Curve Number of 50 and DCIA of 60%. The right-of-way area after the addition of the new highway watershed is large enough to accommodate a inches runoff volume. Also assume that the highway is in an area where net improvement is required. The problem solution is divided into parts for training purposes. The first part demonstrates an assessment of removal for the new highway when the flow from the old highway is bypassing the new highway stormwater treatment BMP. Part 1. For the new or additional watershed area, compute the retention volume assuming no flow from the existing highway is routed to the new basin and the new highway watershed has to be treated in one retention basin: 1. From the introduction page click on the Click Here to Start button to proceed to the General Site Information worksheet. a. Select the Reset Input for Stormwater Treatment Analysis button to erase any existing data. b. Enter the project name and select the meteorological zone in the General Site Information worksheet (Figure 76). c. Indicate the mean annual rainfall amount in the General Site Information worksheet. d. Select the Net Improvement option from the type of analysis drop down menu in the General Site Information worksheet. 88
99 GENERAL SITE INFORMATION: V6.0 Select the appropriate data in the General Site Information Page worksheet. STEP 1: Select the appropriate Meteorological Zone, input the appropriate Mean Annual Rainfall amount and select the type of analysis Meteorological Zone (Please use zone map): Mean Annual Rainfall (Please use rainfall map): GO TO INTRODUCTION PAGE CLICK ON CELL BELOW TO SELECT Zone Inches NAME OF PROJECT Example Problem 8 CLICK ON CELL BELOW TO SELECT Type of analysis: Net improvement Treatment efficiency (N, P) (leave empty if net improvement or BMP analysis is used): % Blue Numbers = Red Numbers = VIEW ZONE MAP Input data Calculated or Carryover VIEW MEAN ANNUAL RAINFALL MAP GO TO WATERSHED CHARACTERISTICS STEP 2: Select the STORMWATER TREATMENT ANALYSIS to begin analyzing Best Management Practices. Model documentation and example problems. STORMWATER TREATMENT ANALYSIS Select the Reset Input for Stormwater Treatment Analysis button. Systems available for analysis: Retention Basin with option for calculating effluent concentration Wet Detention Exfiltration Trench Pervious Pavement Stormwater Harvesting Underdrain Biofiltration Greenroof Rainwater Harvesting Floating Island with Wet Detention Vegetated Natural Buffer Vegetated Filter Strip Swale Rain Garden User Defined BMP RESET INPUT FOR STORMWATER TREATMENT ANALYSIS There is a user's manual for the BMPTRAINS model. It can be downloaded from The results Note from the that example the problems zone shown in the manual however may not reflect current model results due to ongoing updates of the model. METHODOLOGY FOR CALCULATING REQUIRED TREATMENT EFFICIENCY METHODOLOGY FOR RETENTION SYSTEMS METHODOLOGY FOR GREENROOF SYSTEMS map and annual rainfall map can be viewed by selecting the appropriate METHODOLOGY FOR WET button. DETENTION SYSTEMS METHODOLOGY FOR WATER HARVESTING SYSTEMS Figure 76 - General Site Information worksheet. 2. Select the Watershed Characteristics button to proceed to the Watershed Characteristics worksheet (Figure 77). a. Indicate the catchment configuration, pre- and post-development land use, catchment areas, non-dcia Curve Number and DCIA percentage. WATERSHED CHARACTERISTICS V 8.0 GO TO STORMWATER TREATMENT ANALYSIS SELECT CATCHMENT CONFIGURATION 7/17/2016 CLICK ON CELL BELOW TO SELECT CONFIGURATION A - Single Catchment For comingling, the off-site catchment must be upstream. The delay is only for retention BMPs and must be used in hours as measured by the time of concentration at a one inch/hour Catchment rain characteristics input for VIEW AVERAGE ANNUAL RUNOFF Delay [hrs] 0.00 CATCHMENT NO.1 NAME: upstream the new additional catchment "C" Factor area. CLICK ON CELL BELOW TO SELECT Pre-development land use: Agricultural - Citrus: TN=2.240 TP=0.183 with default EMCs CLICK ON CELL BELOW TO SELECT VIEW EMC & FLUCCS Post-development land use: Highway: TN=1.520 TP=0.200 with default EMCs GO TO GIS LANDUSE DATA Total pre-development catchment area: 2.50 AC Total post-development catchment or BMP analysis area: 2.50 AC Average annual pre runo Pre-development Non DCIA CN: Average annual post run Pre-development DCIA percentage: 0.00 % Pre-development Annua Post-development Non DCIA CN: Pre-development Annua Post-development DCIA percentage: % Post-development Annu Estimated BMPArea (No loading from this area) 0.50 AC Post-development Annu Figure 77 - Watershed Characteristics worksheet. 89
100 3. Select the Stormwater Treatment Analysis button to proceed to the Stormwater Treatment Analysis worksheet. 4. Select the Retention Basin button to proceed to the Retention Basin worksheet (Figure 78). Notes: 1. Required storage to achieve target (required) removal efficiency is inches over the 2.5-acre watershed (assuming that 0.5 acres are used for water quality and water quantity control structures results in a 2-acre catchment). 2. There is space to treat inches of runoff but there is no treatment for the offsite rural roadway. The total pounds discharged for total nitrogen (TN) and total phosphorus (TP) after treatment from the new roadway are 0.27 and 0.04 kg/year respectively. Add to this the discharge loading from the existing highway for TN and TP at and kg/year and the total discharge from the existing and the new highway together are ( ) kg/year and ( ) kg/year respectively. 3. At inches, only a marginal increase in efficiency can be obtained with increased volume of retention basin. At first, the option to treat the runoff from the existing offsite watershed does not appear reasonable. However, note that the marginal decrease in effectiveness caused by adding the untreated existing offsite highway runoff may result in a greater overall loading reduction when the existing roadway runoff is co-mingled with the runoff from the new roadway. The example problem can end at this evaluation point. However, consider the situation were the runoff from the existing highway can be routed (co-mingled) to the downstream basin and then treated in the volume provided for the downstream basin. Various assumptions have to be made that may not be eligible for permit and the user is cautioned to obtain all permit requirements and structure the solution to be consistent with them. Note also that there may be a delay in the offsite runoff reaching the onsite retention and the delay may provide for unused retention volume to capture the offsite runoff for additional removal (see part 2 of this example problem). 90
101 RETENTION BASIN: 7/17/2016 V 8.0 RETENTION BASIN SERVING: Loadings from BMP area are contained by the BMP, thus no BMP area load. upstream regional Catchment 3 Catchment 4 Watershed area cotributing to basin: ac Required Treatment Eff (Nitrogen): % Required Treatment Eff (Phosphorus): % Required retention depth over the watershed to meet required efficiency: in Required water quality retention volume: ac-ft Retention volume based on retention depth and Total area - BMP area ac-ft Provided retention depth ( inches over the watershed) in Provided treatment efficiency (Nitrogen): % Provided treatment efficiency (Phosphorus): % Remaining treatment Note efficiency that (Nitrogen): the required retention volume if there is sufficient % Remaining treatment efficiency (Phosphorus): % space for retention within the right-of-way. Remaining retention depth needed: in Efficiency Curve: System Efficiency (N $ P) CAT 1: System Efficiency (N $ P) CAT 2: System Efficiency (N $ P) CAT 3: System Efficiency (N $ P) CAT 4: NOTE FOR TREATMENT EFFICIENCY GRAPH: 100 Treatment efficiency(%): Use only down flow media mix before water enters the ground, specify type Nitrogen mass reduction in groundwater discharge (%) Phosphorus mass reduction in groundwater discharge (%) co-mingling RETENTION BASIN FOR MULTIPLE TREATMENT SYSTEMS (if there is a need for additional removal efficiencies in a series of BMPs): Retention depth (inch): The purpose of this graph is to help illustrate the treatment efficiency of the retention system as the function of retention depth for a single BMP and in a single catchment. The graph illustrates that there is a diminished return as the retention depth is increased. Thus evaluations of other alternatives in "treatment trains" and compensatory treatment should be considered. NOTE: the retention volume can not exceed 3.99 inches to be within the range of data used to determine effectiveness. Note also that the retention system is approaching a size where only a marginal efficiency is gained with size increase. View Media Mixes Catchment 1 Catchment 2 Catchment 3 Catchment 4 Figure 78 - Retention Basin worksheet for required treatment of additional catchment area. 91
102 Part 2. Co-mingle the runoff from the existing highway with the runoff from the new highway and into the same size of retention basin that is planned for the new highway. 1. Select the Watershed Characteristics button to proceed to the Watershed Characteristics worksheet (Figure 79). There is a 2-hour delay in offsite runoff reaching onsite retention area. a. Input the catchment configuration as offsite and onsite land use, catchment areas, non- DCIA Curve Number and DCIA percentage of the new and existing highways. Note catchment 2 must have a BMP associated with it. CLICK ON CELL BELOW TO SELECT CONFIGURATION SELECT CATCHMENT CONFIGURATION 7/17/2016 B - 2 Catchment-Series For comingling, the off-site catchment must be upstream. The delay is only for retention BMPs and must be used in hours as measured by the time of concentration at a one inch/hour rain VIEW AVERAGE ANNUAL RUNOFF Delay [hrs] 2.00 CATCHMENT NO.1 NAME: off site upstream "C" Factor CLICK ON CELL BELOW TO SELECT Watershed Pre-development land use: Agricultural - Citrus: TN=2.240 TP=0.183 with default EMCs CLICK ON CELL BELOW TO SELECT characteristics of the VIEW EMC & FLUCCS Post-development land use: Highway: TN=1.520 TP=0.200 with default EMCs GO existing TO GIS highway LANDUSE that DATA Total pre-development catchment area: 2.00 AC may be treated to Total post-development catchment or BMP analysis area: 2.00 AC Average annual pre runo Pre-development Non DCIA CN: obtain additional Average annual post run Pre-development DCIA percentage: 0.00 % Pre-development Annua removal. Post-development Non DCIA CN: Pre-development Annua Post-development DCIA percentage: % Post-development Annu Estimated BMPArea (No loading from this area) AC Post-development Annu CATCHMENT NO.2 NAME: CLICK ON CELL BELOW TO SELECT Pre-development land use: Agricultural - Citrus: TN=2.240 TP=0.183 with default EMCs Post-development land use: CLICK ON CELL BELOW TO SELECT Highway: TN=1.520 TP=0.200 with default EMCs Total pre-development catchment area: 2.50 AC Total post-development catchment or BMP analysis area: 2.50 AC the new Average highway. annual pre runo Pre-development Non DCIA CN: Average annual post run Pre-development DCIA percentage: 0.00 % Pre-development Annua Post-development Non DCIA CN: Pre-development Annua Post-development DCIA percentage: % Post-development Annu Estimated BMPArea (No loading from this area) 0.50 AC Post-development Annu Figure 79 - Watershed Characteristics worksheet. 2. Select the Stormwater Treatment Analysis button for Stormwater Treatment Analysis. 3. Select the Retention Basin button to proceed to the Retention Basin worksheet (Figure 80). a. Indicate the retention depth for the existing highway in catchment 1 of the Retention Basin worksheet. (Note: The user should select a retention depth value that will fit into the site area and geology. onsite regional Watershed characteristics of 92
103 b. The user does not have to specify a retention volume in catchment 2 because it is assumed that the runoff water from the existing catchment is co-mingled with that of the basin for the new highway catchment. c. If a retention volume were to be specified for the existing highway, the output of the retention worksheet would be shown in Figure 80. RETENTION BASIN: 7/17/2016 V 8.0 RETENTION BASIN SERVING: co-mingling Loadings from BMP area are contained by the BMP, thus no BMP area load. off site onsite Catchment 3 Catchment 4 Watershed area cotributing to basin: ac Required Treatment Eff (Nitrogen): % Required Treatment Eff The (Phosphorus): retention system for the new highway remains % Required retention depth over the watershed to meet required efficiency: in Required water quality retention volume: ac-ft RETENTION BASIN FOR MULTIPLE TREATMENT SYSTEMS (if there is a need for additional removal efficiencies in a series of BMPs): Retention volume based on retention depth and Total area - BMP area ac-ft Provided retention depth ( inches over the watershed) in Provided treatment efficiency (Nitrogen): % Provided treatment efficiency (Phosphorus): % Remaining treatment efficiency (Nitrogen): % Remaining treatment efficiency (Phosphorus): % Remaining retention depth needed: in Efficiency Curve: System Efficiency (N $ P) CAT 1: System Efficiency (N $ P) CAT 2: System Efficiency (N $ P) CAT 3: System Efficiency (N $ P) CAT 4: NOTE FOR TREATMENT EFFICIENCY GRAPH: 100 Treatment efficiency(%): at same volume to require for its catchment Retention depth (inch): Use only down flow media mix before water enters the ground, specify type Nitrogen mass reduction in groundwater discharge (%) Phosphorus mass reduction in groundwater discharge (%) Figure 80 - Retention Basin worksheet. The purpose of this graph is to help illustrate the treatment efficiency of the retention system as the function of retention depth for a single BMP and in a single catchment. The graph illustrates that there is a diminished return as the retention depth is increased. Thus evaluations of other alternatives in "treatment trains" and compensatory treatment should be considered. NOTE: the retention volume can not exceed 3.99 inches to be within the range of data used to determine effectiveness. View Media Mixes Catchment 1 Catchment 2 Catchment 3 Catchment 4 4. The user must now check to see what the level of treatment is and the mass removal when there is co-mingling of the two catchments. This is done from the Catchment and Treatment Summary Results worksheet. Note that there is no treatment for the existing offsite catchment. 5. Select the Stormwater Treatment Analysis button to proceed to the Stormwater Treatment Analysis worksheet. 93
104 6. Select the Catchment and Treatment Summary Results button to proceed to the Catchment and Treatment Summary Results worksheet (Figure 81). 7. The pollution load discharged for TN and TP when co-mingling is 0.32 kg/year and 0.04 kg/year respectively (Figure 81). Without co-mingling the total load discharged from the existing and the new highway together are kg/year and kg/year respectively (see calculations of part 1 of this example problem 8). Thus a substantial decrease in the load reduction with co-mingling in this case. The removal when using co-mingling is substantially higher primarily because of the very large volume of onsite retention. CATCHMENTS AND TREATMENT SUMMARY RESULTS V 8.0 CALCULATION METHODS: 1. The effectiveness of each BMP in a single catchment is converted to an equivalent capture volume. 2. Certain BMP treatment train combinations have not been evaluated and in practice they are at this time not used, an example is a greenroof following a tree well. 3. Wet detention is last when used in a single catchment with other BMPs, except when followed by filtration PROJECT TITLE co-mingling Optional Identification Example Problem 8 off site onsite Catchment 3 Catchment 4 BMP Name Retention Basin BMP Name BMP Name ERROR, ONE OR MORE CATCHMENT HAS BEEN SPECIFIED WITHOUT A BMP Summary Performance of Entire Watershed Catchment B - 2 Catchment-Series Configuration Nitrogen Pre Load (kg/yr) 0.78 Phosphorus Pre Load (kg/yr) 0.06 Nitrogen Post Load (kg/yr) Phosphorus Post Load (kg/yr) 1.55 Target Load Reduction (N) % 93 Target Load Reduction (P) % Target Discharge Load, N (kg/yr) Target Discharge Load, P (kg/yr) Provided Overall Efficiency, N (%): Provided Overall Efficiency, P (%): Discharged Load, N (kg/yr & lb/yr): Discharged Load, P (kg/yr & lb/yr): Load Removed, N (kg/yr & Ib/yr): Load Removed, P (kg/yr & Ib/yr): Treatment Objectives or Target 96 MET /17/2016 BMPTRAINS MODEL 1 2 Note: With co-mingling, overall removal has increased compared to no treatment of the existing roadway. Figure 81 Catchment and Treatment Summary Results worksheet This completes the example problem. One purpose was to demonstrate that co-mingling of offsite or adjacent catchment discharge may increase the load reduction from both sites without increasing the size of the treatment facility. It is recognized that there are many different permit and site conditions that can modify the calculations of this problem. 94
105 Example problem # 9 - vegetated natural buffer in series with wet detention A half-acre wet detention pond and a vegetated natural buffer (12-foot-wide with a 1-foot storage depth along a 2355-foot-long new highway) are used for stormwater treatment of a highway. The slope across the width of the vegetated natural buffer is 6% with the width of the area feeding the buffer equal to 25 feet. The area to be treated is 3.15 acres. The site is located in West Palm Beach, FL on Hydrologic Soil Group D and has a storage capacity of 0.20 inch/inch depth. The existing land use condition is assumed as Wet Flatwoods with a non-dcia Curve Number of 80 and 0% DCIA. The post-development land use condition is highway with a non- DCIA Curve Number of 80 and DCIA of 80%. The target removal efficiency for both Total Nitrogen and Total Phosphorus is 80%. The wet detention pond has 100 days average annual residence time and a littoral zone (assumed 10% removal efficiency credit). 1. From the introduction page click on the Click Here to Start button to proceed to the General Site Information worksheet. a. Select the Reset Input for Stormwater Treatment Analysis button to erase any existing data. b. Enter the project name and select the meteorological zone in the General Site Information worksheet (Figure 82). c. Indicate the mean annual rainfall amount in the General Site Information worksheet. d. Select the Specified Removal Efficiency option from the type of analysis drop down menu in the General Site Information worksheet. e. Specify the desired removal efficiency. 95
106 GENERAL SITE INFORMATION: V6.0 Select the appropriate data in the General Site Information Page worksheet. STEP 1: Select the appropriate Meteorological Zone, input the appropriate Mean Annual Rainfall amount and select the type of analysis Meteorological Zone (Please use zone map): Mean Annual Rainfall (Please use rainfall map): GO TO INTRODUCTION PAGE CLICK ON CELL BELOW TO SELECT Zone Inches NAME OF PROJECT Example Problem 9 CLICK ON CELL BELOW TO SELECT Type of analysis: Specified removal efficiency Treatment efficiency (N, P) (leave empty if net improvement or BMP analysis is used): % Blue Numbers = Red Numbers = VIEW ZONE MAP Input data Calculated or Carryover VIEW MEAN ANNUAL RAINFALL MAP GO TO WATERSHED CHARACTERISTICS STEP 2: Select the STORMWATER TREATMENT ANALYSIS to begin analyzing Best Management Practices. STORMWATER TREATMENT ANALYSIS Select the Reset Input for Stormwater Treatment Analysis button. Systems available for analysis: Retention Basin with option for calculating effluent concentration Wet Detention Exfiltration Trench Pervious Pavement Stormwater Harvesting Underdrain Biofiltration Greenroof Rainwater Harvesting Floating Island with Wet Detention Vegetated Natural Buffer Vegetated Filter Strip Swale Rain Garden User Defined BMP RESET INPUT FOR STORMWATER TREATMENT ANALYSIS Model documentation and example problems. There is a user's manual for the BMPTRAINS model. It can be downloaded from The results from the example problems shown in the manual however may not reflect current model results due to ongoing rainfall map can be updates of the model. METHODOLOGY FOR CALCULATING REQUIRED TREATMENT EFFICIENCY METHODOLOGY FOR RETENTION SYSTEMS METHODOLOGY FOR GREENROOF SYSTEMS Note that the zone map and annual viewed by selecting the appropriate button. METHODOLOGY FOR WET DETENTION SYSTEMS METHODOLOGY FOR WATER HARVESTING SYSTEMS Figure 82 - General Site Information worksheet. 2. Select the Go To Watershed Characteristics button to proceed to the Watershed Characteristics worksheet (Figure 83). Note the input EMC data can be changed or overwritten. a. Indicate the catchment configuration, pre- and post-development land use, catchment areas, non-dcia Curve Number and DCIA percentage. 96
107 WATERSHED CHARACTERISTICS V6.0 GO TO STORMWATER TREATMENT ANALYSIS SELECT CATCHMENT CONFIGURATION CATCHMENT NO.1 CHARACTERISTICS: \ If mixed land uses (side calculation) CLICK ON CELL BELOW TO SELECT Pre-development land use: developed - Wet Flatwoods: TN=1.175 TP=0 with default EMCs CLICK ON CELL BELOW TO SELECT Post-development land use: Highway: TN=1.640 TP=0.220 with default EMCs Total pre-development catchment area: 3.15 AC Figure 83 - Watershed Characteristics worksheet. 3. Select the Stormwater Treatment Analysis button to proceed to the Stormwater Treatment Analysis worksheet. 4. Select the Wet Detention button to proceed to the Wet Detention worksheet (Figure 84). a. Specify the average annual residence time. Also, specify whether the littoral zone is used in the design and indicate the efficiency credit associated with it. CLICK ON CELL BELOW TO SELECT CONFIGURATION A - Single Catchment Pre- and postdevelopment watershed characteristics for the Land use Area Acres non DCIA CN %DCIA Total post-development catchment or BMP analysis area: 3.15 AC Pre-development Non DCIA CN: Pre-development DCIA percentage: 0.00 % Pre-development Annua Post-development Non DCIA CN: Pre-development Annua Post-development DCIA percentage: % Post-development Annu Estimated Area of BMP (used for rainfall excess not loadings) 1.15 AC Post-development Annu Total new highway and higher EMCs than usual. 97
108 Catchment 1 Catchment 2 Catchment 3 Catchment 4 Total pre-development catchment area: ac Total post-development catchment area: ac Average annual residence time (between 1 and 500 days): days Littoral Zone used in the design: YES Littoral Zone efficiency credit (user specifies 10, 15, or 20%): % Total Nitrogen removal required: % Catchment 1 Catchment 2 Catchment 3 Catchment 4 Total Phosphorus removal required: % Remaining treatment efficiency needed (Nitrogen): % Total Nitrogen removal efficiency provided: % Remaining treatment efficiency needed (Phosphorus): % Total Phosphorous removal efficiency provided: % Is the wet detention sufficient: NO Average annual runoff volume: ac-ft/yr Wet Detention Pond Characteristics: To Achieve the Treatment Efficiency Shown in the Graph Below, the Following Must Hold Maximum Permanent Pool Depth: ft Minimum Permanent Pool Volume: ac-ft Treatment Efficiency (%): WET DETENTION POND SERVING: Average Annual Residence Time (days): Figure 84 - Wet Detention worksheet. Blue Numbers = Input data WET DETENTION: V6.1 Red Numbers = Calculated or Carryover Example Problem 9 Input and output for the Wet Efficiency Curve (P) Detention worksheet System Efficiency (P) CAT 1 System Efficiency (P) CAT 2 System Efficiency (P) CAT 3 System Efficiency (P) CAT 4 Efficiency Curve (N) System Efficiency (N) CAT 1 System Efficiency (N) CAT 2 System Efficiency (N) CAT 3 System Efficiency (N) CAT 4 NOTE FOR TREATMENT EFFICIENCY GRAPH: The purpose of the treatment efficiency graphs is to help illustrate the treatment efficiency of the wet detention system as the function of average annual residence time (and permanent pool volume). The graph illustrates that there is a point of diminished return as the permanent pool volume is substantially increased. The lines are produced from the conditions of catchment one, thus other catchments are shown with the data points. GO TO STORMWATER TREATMENT ANALYSIS REQUIRED REMAINING TREATMENT EFFICIENCIES OF TREATMENT SYSTEM IN SERIES WITH WET DETENTION. USE FOR SIZING OF TREATMENT SYSTEM IN SERIES WITH WET DETENTION. Output for the wet detention system indicates how much additional treatment efficiency is needed for each parameter. Use as a guidance in sizing of the pre-treatment vegetated natural buffer. Source of Graphic: draft STORMWATER QUALITY APPLICANT S HANDBOOK dated March 2010, by the Department of Environmental Protection, available at: March
109 5. Select the Stormwater Treatment Analysis button to proceed to the Stormwater Treatment Analysis worksheet. 6. Select the Vegetated Natural Buffer button to proceed to the Vegetated Natural Buffer worksheet (Figure 85). a. Specify appropriate input for the vegetated natural buffer. VEGETATED NATURAL BUFFER (VNB): Used for Type A or A-3 soils > 1' deep V6.1 VEGETATED NATURAL BUFFER SERVING : Example Problem 9 Catchment 1 Catchment 2 Catchment3 Catchment 4 Contributing catchment area: ac Required treatment efficiency (Nitrogen): % Required treatment efficiency (Phosphorus): % Vegetated Natural Buffer width (10 to 350 feet): ft Vegetated Natural Buffer length (length should be same as buffer): ft Vegetated Natural Buffer storage depth not greater than 1 foot: 1.00 ft Width of the area feeding the buffer: ft Water storage capacity of the soil: 0.20 in/in What is the slope of Buffer Width with no collector trench or swale (2-6%)? 6.00 % Provided treatment efficiency (Nitrogen): % Provided treatment efficiency (Phosphorus): % Which efficiency graph do you want to view? Nitrogen Removal efficiency of the VNB. Displayed curves are based on the ratio of the VNB width to contributing area width (for example 0.2 curve indicates contributing area width 5 times greater than the VNB width. Removal Efficiency (%): Input and output for the VNB. Note that the provided treatment efficiency for Nitrogen makes up the deficiency of wet detention Buffer Width (ft): Figure 85 - Vegetated Natural Buffer worksheet System CAT 1 System CAT 2 System CAT 3 System CAT 4 NOTE FOR TREATMENT EFFICIENCY GRAPH: The purpose of the treatment efficiency graphs is to help illustrate the treatment efficiency of the Vegetated Natural Buffer as the function of the Vegetated Natural Buffer width and contributing watershed width. The graph illustrates that there is a point of diminished return as the width of the Vegetated Natural Buffer is substantially increased. Therefore, to provide the most economical BMP treatment system, other alternatives such as "treatment trains" and compensatory treatment should be considered. 7. Select the Stormwater Treatment Analysis button to proceed to the Stormwater Treatment Analysis worksheet. 8. Select the Catchment and Treatment Summary Results button to proceed to the Catchment and Treatment Summary Results worksheet (Figure 86). a. Compare the sum of target Loads with the sum of achieved Loads. If sum of the target loads is smaller than the sum of achieved loads you must increase the size of the VNB. 99

110 CATCHMENTS AND TREATMENT SUMMARY RESULTS V7.3 CALCULATION METHODS: 1. The effectiveness of each BMP in a single catchment is converted to an equivalent capture volume. 2. Certain BMP treatment train combinations have not been evaluated and in practice they are at this time not used, an example is a greenroof following a tree well. 3. If multiple BMPs are used in a single catchment and one of them is detention, then it is assumed to be last in series. PROJECT TITLE BMP Name Example Problem 9 Optional Identification Catchment 1: Catchment 2: Catchment 3: Catchment 4: Wet Detention BMP Name VNB BMP Name Summary Performance of Entire Watershed Catchment A - Single Catchment Configuration 6/23/2014 Nitrogen Pre Load (kg/yr) 3.64 BMPTRAINS MODEL Phosphorus Pre Load (kg/yr) 0.05 Nitrogen Post Load (kg/yr) Phosphorus Post Load (kg/yr) 1.87 Target Load Reduction (N) % 80 Target Load Reduction (P) % 80 Target Discharge Load, N (kg/yr) 2.79 Note: Provided overall efficiency not Target Discharge Load, P (kg/yr) 0.37 sufficient. Another iteration 1 is required. The Provided Overall Efficiency, N (%): 73 addition of another BMP may be the best Provided Overall Efficiency, P (%): 87 option. Discharged Load, N (kg/yr & lb/yr): Discharged Load, P (kg/yr & lb/yr): Load Removed, N (kg/yr & Ib/yr): Load Removed, P (kg/yr & Ib/yr): Figure 86 Catchment and Treatment Summary Results worksheet 100
111 Example problem # 10 Use of Rain Gardens Rain Gardens have been proposed to treat a 2.0-acre low-intensity commercial development. The project location is St. Petersburg, FL. The pre-development land use condition is agricultural-pasture with a Curve Number of 78 and 0% DCIA. The post-development land use condition is low-intensity commercial with a non-dcia Curve Number of 78 and DCIA of 50%. Assume the media in the rain garden is to have dimensions of 80 ft by 30 ft with a depth of 1 foot, thereby making the volume of the media in the rain garden to be 2400 cubic feet. Assume the water storage above the rain garden is 2088 cubic feet. The sustainable void ratio for the media is The problem solution is divided into parts for training purposes, first as a retention BMP and second as a detention one. The detention has as an option to use two media types, namely a compost, shredded paper, and sand (CPS) media and a Dade city clay, tire crumb, and sand (CTS) media. The CPS media has a sustainable void ratio of 0.20 and a depth of 24 inches. The CTS media has a sustainable void ratio of 0.20 and a depth of 12 inches. The high water table is below the media. Part 1. Treating the Rain Garden as a retention system: 1. From the introduction page click on the Click Here to Start button to proceed to the General Site Information worksheet. a. Select the Reset Input for Stormwater Treatment Analysis button to erase any existing data. b. Enter the project name and select the meteorological zone in the General Site Information worksheet (Figure 87). c. Indicate the mean annual rainfall amount in the General Site Information worksheet. d. Select the Net Improvement option from the type of analysis drop down menu in the General Site Information worksheet. 101
112 GENERAL SITE INFORMATION: V6.0 Select the appropriate data in the General Site Information Page worksheet. STEP 1: Select the appropriate Meteorological Zone, input the appropriate Mean Annual Rainfall amount and select the type of analysis Meteorological Zone (Please use zone map): Mean Annual Rainfall (Please use rainfall map): GO TO INTRODUCTION PAGE CLICK ON CELL BELOW TO SELECT Zone Inches NAME OF PROJECT Example Problem 10 CLICK ON CELL BELOW TO SELECT Type of analysis: Net improvement Treatment efficiency (N, P) (leave empty if net improvement or BMP analysis is used): % Blue Numbers = Red Numbers = VIEW ZONE MAP Input data Calculated or Carryover VIEW MEAN ANNUAL RAINFALL MAP GO TO WATERSHED CHARACTERISTICS STEP 2: Select the STORMWATER TREATMENT ANALYSIS to begin analyzing Best Management Practices. STORMWATER TREATMENT ANALYSIS Select the Reset Input for Stormwater Treatment Analysis button. Systems available for analysis: Retention Basin with option for calculating effluent concentration Wet Detention Exfiltration Trench Pervious Pavement Stormwater Harvesting Underdrain Biofiltration Greenroof Rainwater Harvesting Floating Island with Wet Detention Vegetated Natural Buffer Vegetated Filter Strip Swale Rain Garden User Defined BMP RESET INPUT FOR STORMWATER TREATMENT ANALYSIS Figure 87 - General Site Information worksheet. Model documentation and example problems. There is a user's manual for the BMPTRAINS model. It can be downloaded from The results from the example problems shown rainfall map can be in the manual however may not reflect current model results due to ongoing updates of the model. METHODOLOGY FOR CALCULATING REQUIRED TREATMENT EFFICIENCY METHODOLOGY FOR RETENTION SYSTEMS METHODOLOGY FOR GREENROOF SYSTEMS Note that the zone map and annual viewed by selecting the appropriate button. METHODOLOGY FOR WET DETENTION SYSTEMS METHODOLOGY FOR WATER HARVESTING SYSTEMS 2. Select the Watershed Characteristics button to proceed to the Watershed Characteristics worksheet (Figure 88). a. Indicate the catchment configuration, pre- and post-development land use, catchment areas, non-dcia Curve Number and DCIA percentage. 102
113 WATERSHED CHARACTERISTICS V6.0 GO TO STORMWATER TREATMENT ANALYSIS SELECT CATCHMENT CONFIGURATION CATCHMENT NO.1 CHARACTERISTICS: \ If mixed land uses (side calculation) CLICK ON CELL BELOW TO SELECT Pre-development land use: Agricultural - Pasture: TN=3.470 TP=0.616 with default EMCs CLICK ON CELL BELOW TO SELECT Post-development land use: ow-intensity Commercial: TN=1.180 TP=0.17 with default EMCs Total pre-development catchment area: 2.00 AC Figure 88 - Watershed Characteristics worksheet. 3. Select the Stormwater Treatment Analysis button to proceed to the Stormwater Treatment Analysis worksheet. CLICK ON CELL BELOW TO SELECT CONFIGURATION A - Single Catchment Land use Area Acres non DCIA CN %DCIA Total post-development catchment or BMP analysis area: 2.00 AC Pre-development Non DCIA CN: Pre-development DCIA percentage: 0.00 % Pre-development Annua Post-development Non DCIA CN: Pre-development Annua Post-development DCIA percentage: % Post-development Annu Estimated Area of BMP (used for rainfall excess not loadings) 0.00 AC Post-development Annu 4. Select the Rain Garden button to proceed to the Rain Garden worksheet (Figure 89). Total Catchment Characteristics input for the catchment area. 103
114 Catchment 1 Catchment 2 Catchment3 Catchment 4 Contributing catchment area: provided ac Required treatment efficiency (Nitrogen): % Required treatment efficiency (Phosphorus): treatment % Provided retention depth for hydraulic capture (see below): in Provided retention volume for hydraulic capture efficiency efficiency: is ac-ft Is this a retention or detention system? Retention higher than the Type of media mix: View Media Mixes Provided treatment efficiency (Nitrogen): required Provided treatment efficiency (Phosphorus): Volume Storage Input data Sustainable efficiency. void space fraction 0.25 Media volume CF = 2400 Water above media in CF = 2088 Thus volume storage CF= Used for retention depth above in row 10 & volume storage (inches) = Treatment efficiency(%) Figure 89 Rain Garden worksheet. 5. Select the Stormwater Treatment Analysis button to proceed to the Stormwater Treatment Analysis worksheet. Note that the treatment 6. Select the Catchment and Treatment Summary Results button to proceed to the Catchment and Treatment Summary Results worksheet (Figure 90). RAIN (BIO) GARDEN: V6.0 Example Problem Retention depth (inch) Capture Eff. Curve Rain Garden Capture Eff CAT 1 Rain Garden Capture Eff CAT 2 Rain Garden Capture Eff CAT 3 Rain Garden Capture Eff CAT 4 Eff. Curve(N) Sys. Eff. (N) CAT 1 Sys. Eff. (N) CAT 2 Sys. Eff. (N) CAT 3 Sys. Eff. (N) CAT 4 Eff. Curve(P) Sys. Eff. (P) CAT 1 Sys. Eff. (P) CAT 2 Sys. Eff. (P) CAT 3 Sys. Eff. (P) CAT 4 NOTE FOR TREATMENT EFFICIENCY GRAPH: The purpose of this graph is to help illustrate the treatment efficiency of the retention system as the function of retention depth. The graph illustrates that there is a point of diminished return as the retention depth is substantially increased. Therefore, to provide the most economical BMP treatment system, other alternatives such as "treatment trains" and compensatory treatment should be considered. 104
115 CATCHMENTS AND TREATMENT SUMMARY RESULTS V6.0 CALCULATION METHODS: 1. The effectiveness of each BMP in a single catchment is converted to an equivalent capture volume. 2. Certain BMP treatment train combinations have not been evaluated and in practice they are at this time not used, an example is a greenroof following a tree well. 3. If multiple BMPs are used in a single catchment and one of them is detention, then it is assumed to be last in series. PROJECT TITLE Example Problem 10 Optional Identification Catchment 1: Catchment 2: Catchment 3: Catchment 4: BMP1 Rain Garden BMP2 BMP3 Catchment A - Single Catchment Configuration Catchment Nitrogen Pre Load Catchment Phosphorus Pre Load Catchment Nitrogen Post Load Catchment Phosphorus Post Load Target Load Reduction (N) % Target Load Reduction (P) % Target Discharge Load, N (kg/yr) Target Discharge Load, P (kg/yr) Provided Overall Efficiency, N (%): Provided Overall Efficiency, P (%): Discharged Load, N (kg/yr & lb/yr): Discharged Load, P (kg/yr & lb/yr): Load Removed, N (kg/yr & Ib/yr): Load Removed, P (kg/yr & Ib/yr): Summary Performance Figure 90 - Catchment and Treatment Summary Results Again, Note that the provided treatment efficiency is higher than the required treatment efficiency. 1 1/27/2014 BMPTRAINS MODEL Notes: The example problem can end at this evaluation point. However, consider the situation where the rain garden is a detention system rather than a retention system. Additionally, examine the use of two different pollution control media. 105
116 Part 2. Repeat assuming a detention system for two different media types. Data from the general site information worksheet and watershed characteristics worksheet will remain the same. 1. Select the Rain Garden button to proceed to the Rain Garden worksheet (Figure 91). a. Change to a detention problem from the drop down menu and select the compost, shredded paper, and sand (CPS) media mix. This media mix is to be used at a depth of 24 inches, so the media volume needs to be changed to 4800 cubic feet. Additionally, this media has a sustainable void space fraction of Figure 91 below illustrates these changes. Catchment 1 Catchment 2 Catchment3 Catchment 4 Contributing catchment area: ac Required treatment efficiency (Nitrogen): % Required treatment efficiency (Phosphorus): % Provided retention depth for hydraulic capture efficiency (see below): in that Provided retention volume for hydraulic capture efficiency: Note the ac-ft Is this a retention or detention system? Detention Type of media mix: View Media Mixes CPS required treatment Provided treatment efficiency (Nitrogen): Provided treatment efficiency (Phosphorus): Volume Storage Input data Figure 91 Rain Garden. Example Problem 10 Sustainable void space fraction 0.20 Media volume CF = 4800 Water above media in CF = 2088 Therefore, additional Thus volume storage CF= Used for retention depth above in row 10 & volume storage (inches) = Treatment efficiency(%) Retention depth (inch) for Nitrogen is not met but the phosphorus is. treatment is needed Capture Eff. Curve NOTE FOR TREATMENT EFFICIENCY Rain Garden Capture Eff CAT 1 GRAPH: Rain Garden Capture Eff CAT 2 Rain Garden Capture Eff CAT 3 Rain Garden Capture Eff CAT 4 Eff. Curve(N) The purpose of this graph is to help Sys. Eff. (N) CAT 1 illustrate the treatment efficiency of the retention system as the function of retention Sys. Eff. (N) CAT 2 depth. The graph illustrates that there is a Sys. Eff. (N) CAT 3 point of diminished return as the retention Sys. Eff. (N) CAT 4 depth is substantially increased. Therefore, to provide the most economical BMP Eff. Curve(P) treatment system, other alternatives such as Sys. Eff. (P) CAT 1 "treatment trains" and compensatory Sys. Eff. (P) CAT 2 treatment should be considered. Sys. Eff. (P) CAT 3 Sys. Eff. (P) CAT 4 Note that the media volume has increased due to increased depth 106
117 Note: The required treatment for phosphorus is met while the required treatment for nitrogen is not. Change the media type to Dade city clay, Tire crumb, and Sand (CTS) at a depth of 12 inches and rework. 2. Since the location and site characteristics remain the same no changes need to be made to any of the other sheets except the Rain Garden worksheet. a. Select CTS from the media mix drop down list in the Rain Garden worksheet (Figure 92). Also, change the media volume to 2400 cubic feet to account for the decrease in media depth, from 24 inches to 12 inches. Catchment 1 Catchment 2 Catchment3 Catchment 4 Contributing catchment area: ac Required treatment efficiency (Nitrogen): % Required treatment efficiency (Phosphorus): % Provided retention depth for hydraulic capture efficiency (see below): in Provided retention volume for hydraulic capture efficiency: ac-ft Is this a retention or detention system? Detention Type of media mix: View Media Mixes CTS Provided treatment efficiency (Nitrogen): Provided treatment efficiency (Phosphorus): Volume Storage Input data Sustainable void space fraction 0.20 Media volume CF = 2400 Water above media in CF = 2088 Thus volume storage CF= Used for retention depth above in row 10 & volume storage (inches) = Treatment efficiency(%) Figure 92 Rain Garden Selecting a Media Mix RAIN (BIO) GARDEN: V6.0 Example Problem Retention depth (inch) Note that the required treatment for nitrogen and phosphorus is met. Capture Eff. Curve Rain Garden Capture Eff CAT 1 NOTE FOR TREATMENT EFFICIENCY GRAPH: Note that the media volume has decreased due to decreased depth Rain Garden Capture Eff CAT 2 Rain Garden Capture Eff CAT 3 Rain Garden Capture Eff CAT 4 Eff. Curve(N) The purpose of this graph is to help Sys. Eff. (N) CAT 1 illustrate the treatment efficiency of the retention system as the function of retention Sys. Eff. (N) CAT 2 depth. The graph illustrates that there is a Sys. Eff. (N) CAT 3 point of diminished return as the retention Sys. Eff. (N) CAT 4 depth is substantially increased. Therefore, to provide the most economical BMP Eff. Curve(P) treatment system, other alternatives such as Sys. Eff. (P) CAT 1 "treatment trains" and compensatory treatment should be considered. Sys. Eff. (P) CAT 2 Sys. Eff. (P) CAT 3 Sys. Eff. (P) CAT 4 107
118 3. Select the Stormwater Treatment Analysis button to proceed to the Stormwater Treatment Analysis worksheet. 4. Select the Catchment and Treatment Summary Results button to proceed to the Catchment and Treatment Summary Results worksheet (Figure 93). CATCHMENTS AND TREATMENT SUMMARY RESULTS V6.0 CALCULATION METHODS: 1. The effectiveness of each BMP in a single catchment is converted to an equivalent capture volume. 2. Certain BMP treatment train combinations have not been evaluated and in practice they are at this time not used, an example is a greenroof following a tree well. 3. If multiple BMPs are used in a single catchment and one of them is detention, then it is assumed to be last in series. PROJECT TITLE Example Problem 10 Optional Identification Catchment 1: Catchment 2: Catchment 3: Catchment 4: BMP1 Rain Garden BMP2 BMP3 Catchment A - Single Catchment Configuration Catchment Nitrogen Pre Load Catchment Phosphorus Pre Load Catchment Nitrogen Post Load Catchment Phosphorus Post Load Target Load Reduction (N) % Target Load Reduction (P) % Target Discharge Load, N (kg/yr) Target Discharge Load, P (kg/yr) Provided Overall Efficiency, N (%): Provided Overall Efficiency, P (%): Discharged Load, N (kg/yr & lb/yr): Discharged Load, P (kg/yr & lb/yr): Load Removed, N (kg/yr & Ib/yr): Load Removed, P (kg/yr & Ib/yr): Summary Performance met Figure 93 - Catchment and Treatment Summary Results Note that the required treatment for nitrogen and phosphorus is 1 1/27/2014 BMPTRAINS MODEL Note: The required treatment efficiency for nitrogen and phosphorus is met for this media mix. Notice how the treatment efficiency provided for retention is based on a volume captured while the detention system is based on a concentration reduction. This is due to the fact that for a retention system the water is not being collected for surface discharge but is infiltrated, therefore the treatment efficiency is related to the hydraulic capture efficiency. For the detention systems, the water is treated with a pollution control media 108
119 and then collected for discharge. This example showed that, for a detention system, media selection is important as the CPS media was twice as deep and had lower treatment efficiency than the CTS media. This example also showed that the retention system performed better than the detention system for both media types examined. This is due to the fact that 100% of the nitrogen and phosphorus in the infiltrated water will not be discharged downstream. This completes the example problem. 109
120 Example problem # 11 Three Catchments A watershed with three catchments, each having an area of 5 acres, has to be treated to meet net improvement standards. The project location is East of Brooksville, Hernando County, FL. This problem is to be demonstrated in two parts, one assuming the catchments are in series and one assuming the catchments are in parallel. The first catchment pre-development condition is agricultural-pasture with a Curve Number of 78 with 0% DCIA. The post-development conditions are highway with a non-dcia Curve Number of 78 and DCIA of 60%. A swale is to be used which is 1.11 acres. It has a 10 ft top width, swale bottom width of 2 ft, swale and highway length of 4840 ft, highway width of 20 ft, average width of pervious area of 25 ft, swale slope of 0.001, Manning s n of 0.05, a soil infiltration rate of 5 in/hr, and a swale side slope of 5. The second catchment pre-development condition is agricultural-pasture with a Curve Number of 78. The post-development conditions are high-intensity commercial with a non-dcia Curve Number of 78 and DCIA of 80%. A 1-acre retention pond is used for treatment and due to site limitations, only 0.25 inch over the catchment area can be accommodated. The third catchment pre-development condition is agricultural-pasture with a Curve Number of 78. The post-development conditions are low-density residential with a non-dcia Curve Number of 78 and DCIA of 50%. A 1-acre wet-detention pond is to be used with an average annual residence time of 30 days and littoral zone is to be used with 10% credit. Part 1. Treating the catchments in series: 1. From the introduction page click on the Click Here to Start button to proceed to the General Site Information worksheet. a. Select the Reset Input for Stormwater Treatment Analysis button to erase any existing data. b. Enter the project name and select the meteorological zone in the General Site Information worksheet (Figure 94). c. Indicate the mean annual rainfall amount in the General Site Information worksheet. d. Select the Net Improvement option from the Type of analysis drop down menu in the General Site Information worksheet. 110
121 GENERAL SITE INFORMATION: V6.0 STEP 1: Select the appropriate Meteorological Zone, input the appropriate Mean Annual Rainfall amount and select the type of analysis Select the appropriate data in the General Site Information Page Meteorological Zone (Please use zone map): Mean Annual Rainfall (Please use rainfall map): GO TO INTRODUCTION PAGE CLICK ON CELL BELOW TO SELECT Zone Inches NAME OF PROJECT Example Problem 11 CLICK ON CELL BELOW TO SELECT worksheet. Type of analysis: Net improvement Treatment efficiency (N, P) (leave empty if net improvement or BMP analysis is used): % Blue Numbers = Red Numbers = VIEW ZONE MAP Input data Calculated or Carryover VIEW MEAN ANNUAL RAINFALL MAP GO TO WATERSHED CHARACTERISTICS STEP 2: Select the STORMWATER TREATMENT ANALYSIS to begin analyzing Best Management Practices. STORMWATER TREATMENT ANALYSIS Select the Reset Input for Stormwater Treatment Analysis button. Systems available for analysis: Retention Basin with option for calculating effluent concentration Wet Detention Exfiltration Trench Pervious Pavement Stormwater Harvesting Underdrain Biofiltration Greenroof Rainwater Harvesting Floating Island with Wet Detention Vegetated Natural Buffer Vegetated Filter Strip Swale Rain Garden User Defined BMP RESET INPUT FOR STORMWATER TREATMENT ANALYSIS Figure 94 - General Site Information worksheet. Model documentation and example problems. There is a user's manual for the BMPTRAINS model. It can be downloaded from The results map from and the example annual problems shown in the manual however may not reflect current model results due to ongoing updates of the model. METHODOLOGY FOR CALCULATING REQUIRED TREATMENT EFFICIENCY METHODOLOGY FOR RETENTION SYSTEMS METHODOLOGY FOR GREENROOF SYSTEMS Note that the zone rainfall map can be viewed by selecting the appropriate button. METHODOLOGY FOR WET DETENTION SYSTEMS METHODOLOGY FOR WATER HARVESTING SYSTEMS 2. Select the Watershed Characteristics button to proceed to the Watershed Characteristics worksheet. a. Indicate the catchment configuration (the different catchment configurations available can be viewed by selecting the View Catchment Configurations button). For this problem, D - 3 catchments in series (Figure 95). 111
122 GO TO WATERSHED CHARACTERISTICS Select from the 14 different configurations You need to scroll down and right to see all configurations A 1 E 1 A - Single Catchment 2 3 B 1 2 B - 2 Catchment-Series F E - 3 Catchment-Parallel 1 3 C 1 2 F - Mixed-3 Catchment-2 Series-Parallel (A) 2 C - 2 Catchment-Parallel G D D - 3 Catchment-Series Figure 95 - Catchment Configuration Options worksheet. G - Mixed-3 Catchment-2 Series-Parallel (B) H 1 H - 4 Catchment-Series Go back to the Watershed Characteristics worksheet by selecting the Go To Watershed Characteristics button. a. Indicate the pre- and post-development land use, catchment areas, non-dcia Curve Number and DCIA percentage (Figure 96). 112
123 WATERSHED CHARACTERISTICS V6.0 GO TO STORMWATER TREATMENT ANALYSIS SELECT CATCHMENT CONFIGURATION CATCHMENT NO.1 CHARACTERISTICS: \ If mixed land uses (side calculation) CLICK ON CELL BELOW TO SELECT Pre-development land use: Agricultural - Pasture: TN=3.470 TP=0.616 with default EMCs CLICK ON CELL BELOW TO SELECT Post-development land use: Highway: TN=1.640 TP=0.220 with default EMCs Total pre-development catchment area: 5.00 AC Figure 96 - Watershed Characteristics worksheet. 4. Select the Stormwater Treatment Analysis button at the top of the worksheet to proceed to the Stormwater Treatment Analysis worksheet. 5. Select the Swale button to proceed to the Swale worksheet (Figure 97). a. Enter the required input based on the problem givens. CLICK ON CELL BELOW TO SELECT CONFIGURATION D - 3 Catchment-Series Land use Area Acres non DCIA CN %DCIA Total post-development catchment or BMP analysis area: 5.00 AC Pre-development Non DCIA CN: Pre-development DCIA percentage: 0.00 % Pre-development Annua Post-development Non DCIA CN: Pre-development Annua Post-development DCIA percentage: % Post-development Annu Estimated Area of BMP (used for rainfall excess not loadings) 1.11 AC Post-development Annu CATCHMENT NO.2 CHARACTERISTICS: \ If mixed land uses (side calcula CLICK ON CELL BELOW TO SELECT Land use Area Acres non DCIA CN %DCIA Pre-development land use: Agricultural - Pasture: TN=3.470 TP=0.616 Catchment CLICK ON CELL BELOW TO SELECT Post-development land use: High-Intensity Commercial: TN=2.40 TP=0.34 Characteristics Total input for each Total pre-development catchment area: 5.00 AC Total post-development catchment or BMP analysis area: 5.00 AC catchment area. Pre-development Non DCIA CN: Pre-development DCIA percentage: 0.00 % Pre-development Annua Post-development Non DCIA CN: Pre-development Annua Post-development DCIA percentage: % Post-development Annu Estimated Area of BMP (used for rainfall excess not loadings) 1.00 AC Post-development Annu CATCHMENT NO.3 CHARACTERISTICS: \ If mixed land uses (side calcul CLICK ON CELL BELOW TO SELECT Land use Area Acres non DCIA CN %DCIA Pre-development land use: Agricultural - Pasture: TN=3.470 TP=0.616 Catchment CLICK ON CELL BELOW TO SELECT Post-development land use: Low-Density Residential: TN=1.610 TP= 0.19 Characteristics Total input for each Total pre-development catchment area: 5.00 AC Total post-development catchment or BMP analysis area: 5.00 AC catchment area. Pre-development Non DCIA CN: Pre-development DCIA percentage: 0.00 % Pre-development Annua Post-development Non DCIA CN: Pre-development Annua Post-development DCIA percentage: % Post-development Annu Estimated Area of BMP (used for rainfall excess not loadings) 1.00 AC Post-development Annu Total Catchment Characteristics input for each catchment area. 113
124 SWALE SERVING CONTRIBUTING CATCHMENT: Blue Numbers = SWALE V7.3 Red Numbers = Example Problem 11 Input data Calculated or Carryover GO TO STORMWATER TREATMENT ANALYSIS Catchment 1 Catchment 2 Catchment3 Catchment 4 Catchment 1 Catchment 2 Catchment3 Catchment 4 Contributing catchment area: ac Concentration reduction? (If S<= 1% or H>= 6 in) Required treatment efficiency (Nitrogen): % Provided percent mass reductions in surface discharges are: Required treatment efficiency (Phosphorus): % Nitrogen efficiency Swale top width calculated for flood conditions [W]: Note that the ft Phosphorus efficiency Swale bottom width (0 for triangular section) [B]: 2.00 ft If you are you interested in the mass of pollutants removed before percolating into the Swale length [L]: provided ft groundwater? View Media Mixes Average impervious length: ft Specify soil media Average impervious width (including shoulder): treatment ft Nitrogen mass reduction in groundwater discharge % Average width of the pervious area to include swale width: ft Phosphorus mass reduction in groundwarer discharge % Contributing catchment area: efficiency is ft 2 Swale slope (ft drop/ft length) [S]: Manning's N: higher than the in/hr Side slope of swale (horizontal ft/vertical ft) [Z]: required Soil infiltration rate: Infiltrated storage depth: in Cumulative height of the swale blocks [H]: treatment ft Length of the berm upstream of the crest [Lb]: ft Volume of water in swales upstream of swale blocks: efficiency in Total volume: in Provided treatment efficiency (Nitrogen): % Provided treatment efficiency (Phosphorus): % Treatment efficiency(%): Retention depth (inch): Efficiency Curve: Sys. Eff. (N $ P) CAT 1 Sys. Eff. (N $ P) CAT 2 Sys. Eff. (N $ P) CAT 3 Sys. Eff. (N $ P) CAT 4 NOTE FOR TREATMENT EFFICIENCY GRAPH: The purpose of this graph is to help illustrate the treatment efficiency of the swale as the function of retention depth. The graph illustrates that there is diminishing effectiveness as the retention depth is increased. Figure 97 Swale worksheet. 114
125 6. Select the Stormwater Treatment Analysis button to proceed to the Stormwater Treatment Analysis worksheet. 7. Select the Retention Basin button to proceed to the Retention Basin worksheet. a. Specify a 0.25-inch retention depth (Figure 98). Catchment 1 Catchment 2 Catchment 3 Catchment 4 Watershed area: ac Required Treatment Eff (Nitrogen): % Required Treatment Eff (Phosphorus): % Required retention depth over the watershed to meet required efficiency: in Required water quality retention volume: ac-ft Retention volume based on retention depth ac-ft Provided retention depth (inches over the watershed area): treatment in Provided treatment efficiency (Nitrogen): % Provided treatment efficiency (Phosphorus): required is not % Remaining treatment efficiency (Nitrogen): % Remaining treatment efficiency (Phosphorus): met. % Remaining retention depth needed: in Figure 98 - Retention Basin worksheet. 8. Select the Stormwater Treatment Analysis button to proceed to the Stormwater Treatment Analysis worksheet. 9. Select the Wet Detention button to proceed to the Wet Detention worksheet. a. Specify a 30 day average annual residence time, a littoral zone (drop down menu), and a 10% efficiency credit (Figure 99). Figure 99 - Wet Detention worksheet. RETENTION BASIN: V6.0 RETENTION BASIN SERVING: Example Problem 11 RETENTION BASIN FOR MULTIPLE TREATMENT SYSTEMS (if there is a need for additional removal efficiencies in a series of BMPs): WET DETENTION POND SERVING: Catchment 1 Catchment 2 Catchment 3 Catchment 4 Total pre-development catchment area: ac Total post-development catchment area: ac Average annual residence time (between 1 and 500 days): days Littoral Zone or other improvements used? YES Littoral Zone or other improvement efficiency credit: % Total Nitrogen removal required: % Total Phosphorus removal required: % Total Nitrogen removal efficiency provided: % Total Phosphorous removal efficiency provided: % Is the wet detention sufficient: YES Average annual runoff volume: ac-ft/yr To Achieve the Treatment Efficiency Shown in the Graph Below, the Following Must Hold WET DETENTION: V7.1 Example Problem 11 Note that the Minimum Pond Permanent Pool Volume: ac-ft 115
. CATCHMENTS AND TREATMENT SUMMARY RESULTS V7.")
126 10. Select the Stormwater Treatment Analysis button to proceed to the Stormwater Treatment Analysis worksheet. 11. Select the Catchment and Treatment Summary Results button to proceed to the Catchment and Treatment Summary Results worksheet (Figure 100). CATCHMENTS AND TREATMENT SUMMARY RESULTS V7.3 CALCULATION METHODS: 1. The effectiveness of each BMP in a single catchment is converted to an equivalent capture volume. 2. Certain BMP treatment train combinations have not been evaluated and in practice they are at this time not used, an example is a greenroof following a tree well. 3. If multiple BMPs are used in a single catchment and one of them is detention, then it is assumed to be last in series. PROJECT TITLE Example Problem 11 Optional Identification Catchment 1: Catchment 2: Catchment 3: Catchment 4: BMP Name Swale Retention Basin Wet Detention BMP Name BMP Name Summary Performance of Entire Watershed Catchment D - 3 Catchment-Series Configuration Nitrogen Pre Load (kg/yr) Phosphorus Pre Load (kg/yr) 5.64 Nitrogen Post Load (kg/yr) Phosphorus Post Load (kg/yr) 9.23 Target Load Reduction (N) % 53 Target Load Reduction (P) % 39 Target Discharge Load, N (kg/yr) Target Discharge Load, P (kg/yr) 5.64 Provided Overall Efficiency, N (%): Provided Overall Efficiency, P (%): Discharged Load, N (kg/yr & lb/yr): Discharged Load, P (kg/yr & lb/yr): Load Removed, N (kg/yr & Ib/yr): Load Removed, P (kg/yr & Ib/yr): Note that the provided treatment efficiency is higher than the required treatment efficiency /8/2014 BMPTRAINS MODEL Figure Catchment and Treatment Summary Results. Part 2. Treating the catchments in Parallel: 1. Select the Stormwater Treatment Analysis button to return to the Stormwater Treatment Analysis worksheet. 2. All of the existing data can be used for this part of the problem except the catchment configuration needs to be changed. 116
127 3. Select the Watershed Characteristics button to proceed to the Watershed Characteristics worksheet. a. Indicate the catchment configuration. For this part, E - 3 catchments in parallel (Figure 101). GO TO WATERSHED CHARACTERISTICS Select from the 14 different configurations You need to scroll down and right to see all configurations A 1 E 1 A - Single Catchment 2 3 B 1 2 B - 2 Catchment-Series F E - 3 Catchment-Parallel 1 3 C 1 2 F - Mixed-3 Catchment-2 Series-Parallel (A) 2 C - 2 Catchment-Parallel G D D - 3 Catchment-Series Figure Catchment Configuration Options worksheet. G - Mixed-3 Catchment-2 Series-Parallel (B) H 1 H - 4 Catchment-Series b. Leave the pre- and post-development land use, catchment areas, non-dcia Curve Number and DCIA percentage from the previous part (Figure 102). 117
128 WATERSHED CHARACTERISTICS V6.0 GO TO STORMWATER TREATMENT ANALYSIS SELECT CATCHMENT CONFIGURATION CATCHMENT NO.1 CHARACTERISTICS: \ If mixed land uses (side calculation) CLICK ON CELL BELOW TO SELECT Pre-development land use: Agricultural - Pasture: TN=3.470 TP=0.616 with default EMCs CLICK ON CELL BELOW TO SELECT Post-development land use: Highway: TN=1.640 TP=0.220 with default EMCs Total pre-development catchment area: 5.00 AC Figure Watershed Characteristics worksheet. 4. Select the Stormwater Treatment Analysis button to proceed to the Stormwater Treatment Analysis worksheet. 5. Select the Catchment and Treatment Summary Results button to proceed to the Catchment and Treatment Summary Results worksheet (Figure 103). CLICK ON CELL BELOW TO SELECT CONFIGURATION E - 3 Catchment-Parallel Land use Area Acres non DCIA CN %DCIA Total post-development catchment or BMP analysis area: 5.00 AC Pre-development Non DCIA CN: Pre-development DCIA percentage: 0.00 % Pre-development Annua Post-development Non DCIA CN: Pre-development Annua Post-development DCIA percentage: % Post-development Annu Estimated Area of BMP (used for rainfall excess not loadings) 1.11 AC Post-development Annu CATCHMENT NO.2 CHARACTERISTICS: \ If mixed land uses (side calcula CLICK ON CELL BELOW TO SELECT Land use Area Acres non DCIA CN %DCIA Pre-development land use: Agricultural - Pasture: TN=3.470 TP=0.616 CLICK ON CELL BELOW TO SELECT Post-development land use: High-Intensity Commercial: TN=2.40 TP=0.34 Total Total pre-development catchment area: 5.00 AC Total post-development catchment or BMP analysis area: 5.00 AC Pre-development Non DCIA CN: Pre-development DCIA percentage: 0.00 % Pre-development Annua Post-development Non DCIA CN: Pre-development Annua Post-development DCIA percentage: % Post-development Annu Estimated Area of BMP (used for rainfall excess not loadings) 1.00 AC Post-development Annu CATCHMENT NO.3 CHARACTERISTICS: \ If mixed land uses (side calcul CLICK ON CELL BELOW TO SELECT Land use Area Acres non DCIA CN %DCIA Pre-development land use: Agricultural - Pasture: TN=3.470 TP=0.616 CLICK ON CELL BELOW TO SELECT Post-development land use: Low-Density Residential: TN=1.610 TP= 0.19 Total Total pre-development catchment area: 5.00 AC Total post-development catchment or BMP analysis area: 5.00 AC Pre-development Non DCIA CN: Pre-development DCIA percentage: 0.00 % Pre-development Annua Post-development Non DCIA CN: Pre-development Annua Post-development DCIA percentage: % Post-development Annu Estimated Area of BMP (used for rainfall excess not loadings) 1.00 AC Post-development Annu Total Catchment configuration for 2 nd part of problem. 118

129 CATCHMENTS AND TREATMENT SUMMARY RESULTS V7.1 CALCULATION METHODS: 1. The effectiveness of each BMP in a single catchment is converted to an equivalent capture volume. 2. Certain BMP treatment train combinations have not been evaluated and in practice they are at this time not used, an example is a greenroof following a tree well. 3. If multiple BMPs are used in a single catchment and one of them is detention, then it is assumed to be last in series. PROJECT TITLE Example Problem 11 Optional Identification Catchment 1: Catchment 2: Catchment 3: Catchment 4: BMP Name Swale Retention Basin Wet Detention BMP Name BMP Name Catchment E - 3 Catchment-Parallel Configuration Nitrogen Pre Load (kg/yr) Phosphorus Pre Load (kg/yr) Nitrogen Post Load (kg/yr) Phosphorus Post Load (kg/yr) Target Load Reduction (N) % Target Load Reduction (P) % Target Discharge Load, N (kg/yr) Target Discharge Load, P (kg/yr) Provided Overall Efficiency, N (%): Provided Overall Efficiency, P (%): Discharged Load, N (kg/yr & lb/yr): Discharged Load, P (kg/yr & lb/yr): Load Removed, N (kg/yr & Ib/yr): Load Removed, P (kg/yr & Ib/yr): Summary Performance of Entire Watershed in series Figure Catchment and Treatment Summary Results. Note that the provided treatment efficiency is not sufficient for N but is for P when the catchments are in parallel. Also 2 provided treatment is lower than when 5/19/2014 BMPTRAINS MODEL NOTE: This example shows how catchment configurations can be easily changed to examine different configurations. This also shows the benefit of BMPs in series as opposed to parallel
130 Example problem # 12 Four Catchments For this example problem, assume the conditions for Example problem #11 and add an additional 10-acre catchment. The problem is demonstrated twice, once in each of the two configurations shown below (J and K). J J - Mixed-4 Catchment-3 Series-Parallel 4 K K - Mixed-4 Catchment-Series (B) The project location is St. Petersburg, FL. This problem is demonstrated assuming the catchments are in series and assuming the catchments are in parallel. The first catchment pre-development condition is agricultural-pasture with a Curve Number of 78. The post-development conditions are highway with a non-dcia Curve Number of 78 and DCIA of 60%. A swale is to be used which is 1.11 acres. It has a 10 ft top width, swale bottom width of 2 ft, swale and highway length of 4840 ft, highway width of 20 ft, average width of pervious area of 25 ft, swale slope of 0.001, Manning s n of 0.05, a soil infiltration rate of 5 in/hr, and a swale side slope of 5. The second catchment pre-development condition is agricultural-pasture with a Curve Number of 78. The post-development conditions are high-intensity commercial with a non-dcia Curve Number of 78 and DCIA of 80%. A 1-acre retention pond is to be used for treatment and due to site limitations, only 0.25 inch over the catchment area can be accommodated. The third catchment pre-development condition is agricultural-pasture with a Curve Number of 78. The post-development conditions are low-density residential with a non-dcia 120
131 Curve Number of 78 and DCIA of 50%. A 1-acre wet-detention pond is used with an average annual residence time of 30 days and littoral zone with 10% credit. The fourth catchment pre-development condition is agricultural-pasture with a Curve Number of 78. The post-development conditions are light industrial with a non-dcia Curve Number of 78 and DCIA of 60%. A 2-acre wet detention pond with an average annual residence time of 70 days is to be used. A littoral zone with 10% credit is also used. Part 1. Treating the catchments in configuration J: 1. From the introduction page click on the Click Here to Start button to proceed to the General Site Information worksheet. a. Select the Reset Input for Stormwater Treatment Analysis button to erase any existing data. b. Enter the project name and select the meteorological zone in the General Site Information worksheet (Figure 104). c. Indicate the mean annual rainfall amount in the General Site Information worksheet. d. Select the Net Improvement option from the type of analysis drop down menu in the General Site Information worksheet. 121
132 GENERAL SITE INFORMATION: V6.0 STEP 1: Select the appropriate Meteorological Zone, input the appropriate Mean Annual Rainfall amount and select the type of analysis Select the appropriate data in the General Site Information Page Meteorological Zone (Please use zone map): GO TO INTRODUCTION PAGE NAME OF PROJECT Example Problem 12 CLICK ON CELL BELOW TO SELECT Zone 4 Mean Annual Rainfall (Please use rainfall map): Inches CLICK ON CELL BELOW TO SELECT worksheet. Type of analysis: Net improvement Treatment efficiency (N, P) (leave empty if net improvement or BMP analysis is used): % Blue Numbers = Red Numbers = VIEW ZONE MAP Input data Calculated or Carryover VIEW MEAN ANNUAL RAINFALL MAP GO TO WATERSHED CHARACTERISTICS STEP 2: Select the STORMWATER TREATMENT ANALYSIS to begin analyzing Best Management Practices. STORMWATER TREATMENT ANALYSIS Systems available for analysis: Retention Basin with option for calculating effluent concentration Wet Detention Exfiltration Trench Pervious Pavement Stormwater Harvesting Underdrain Biofiltration Greenroof Rainwater Harvesting Floating Island with Wet Detention Vegetated Natural Buffer Vegetated Filter Strip Swale Rain Garden User Defined BMP Select the Reset Input for Stormwater Treatment Analysis button. RESET INPUT FOR STORMWATER TREATMENT ANALYSIS Figure General Site Information worksheet. Model documentation and example problems. There is a user's manual for the BMPTRAINS model. It can be downloaded from The results from the example problems shown in the manual however may not reflect rainfall current model map results can due to be ongoing updates of the model. METHODOLOGY FOR CALCULATING REQUIRED TREATMENT EFFICIENCY button. METHODOLOGY FOR RETENTION SYSTEMS METHODOLOGY FOR GREENROOF SYSTEMS Note that the zone map and annual viewed by selecting the appropriate METHODOLOGY FOR WET DETENTION SYSTEMS METHODOLOGY FOR WATER HARVESTING SYSTEMS 2. Select the Watershed Characteristics button to proceed to the Watershed Characteristics worksheet. a. Indicate the catchment configuration. For this problem, 4 catchments configured as shown in J (Figure 105). J J - Mixed-4 Catchment-3 Series-Parallel 4 Figure Catchment Configuration for part 1 of this problem. b. Indicate the pre- and post-development land use, catchment areas, non-dcia Curve Number and DCIA percentage (Figure 106). 122
133 WATERSHED CHARACTERISTICS V6.0 GO TO STORMWATER TREATMENT ANALYSIS SELECT CATCHMENT CONFIGURATION CATCHMENT NO.1 CHARACTERISTICS: \ If mixed land uses (side calculation) CLICK ON CELL BELOW TO SELECT Pre-development land use: Agricultural - Pasture: TN=3.470 TP=0.616 with default EMCs CLICK ON CELL BELOW TO SELECT Post-development land use: Highway: TN=1.640 TP=0.220 with default EMCs Total pre-development catchment area: 5.00 AC Total post-development catchment or BMP analysis area: 5.00 AC Pre-development Non DCIA CN: Figure Watershed Characteristics worksheet. CLICK ON CELL BELOW TO SELECT CONFIGURATION J - Mixed-4 Catchment-3 Series-Parallel Land use Area Acres non DCIA CN %DCIA Catchment input for each catchment area Pre-development DCIA percentage: 0.00 % Pre-development Annua Post-development Non DCIA CN: Pre-development Annua Post-development DCIA percentage: % are site specific. Post-development Annu Estimated Area of BMP (used for rainfall excess not loadings) 1.11 AC Post-development Annu CATCHMENT NO.2 CHARACTERISTICS: \ If mixed land uses (side calcula CLICK ON CELL BELOW TO SELECT Land use Area Acres non DCIA CN %DCIA Pre-development land use: Agricultural - Pasture: TN=3.470 TP=0.616 CLICK ON CELL BELOW TO SELECT Post-development land use: High-Intensity Commercial: TN=2.40 TP=0.34 Total Total pre-development catchment area: 5.00 AC Total post-development catchment or BMP analysis area: 5.00 AC Catchment Pre-development Non DCIA CN: Pre-development DCIA percentage: 0.00 % Characteristics Pre-development Annua Post-development Non DCIA CN: Pre-development Annua Post-development DCIA percentage: % input Post-development for each Annu Estimated Area of BMP (used for rainfall excess not loadings) 1.00 AC Post-development Annu catchment area. CATCHMENT NO.3 CHARACTERISTICS: \ If mixed land uses (side calcul CLICK ON CELL BELOW TO SELECT Land use Area Acres non DCIA CN %DCIA Pre-development land use: Agricultural - Pasture: TN=3.470 TP=0.616 CLICK ON CELL BELOW TO SELECT Post-development land use: Low-Density Residential: TN=1.610 TP= 0.19 Total Total pre-development catchment area: 5.00 AC Total post-development catchment or BMP analysis area: 5.00 AC Pre-development Non DCIA CN: Catchment Pre-development DCIA percentage: 0.00 % Pre-development Annua Characteristics Post-development Non DCIA CN: Pre-development Annua Post-development DCIA percentage: % input Post-development for each Annu Estimated Area of BMP (used for rainfall excess not loadings) 1.00 AC Post-development Annu CATCHMENT NO.4 CHARACTERISTICS: \ If mixed land uses (side calcul CLICK ON CELL BELOW TO SELECT Land use Area Acres non DCIA CN %DCIA Pre-development land use: Agricultural - Pasture: TN=3.470 TP=0.616 CLICK ON CELL BELOW TO SELECT Post-development land use: Light Industrial: TN=1.200 TP=0.260 Total Total pre-development catchment area: AC Total post-development catchment or BMP analysis area: AC Pre-development Non DCIA CN: Catchment Pre-development DCIA percentage: 0.00 % Pre-development Annua Post-development Non DCIA CN: Characteristics Pre-development Annua Post-development DCIA percentage: % Post-development Annu Estimated Area of BMP (used for rainfall excess not loadings) 2.00 AC input Post-development for each Annu 3. Select the Stormwater Treatment Analysis button at the top of the worksheet. 4. Select the Swale button to proceed to the Swale worksheet (Figure 107). a. Enter the required input data from the problem givens. Total and EMCs for highway catchment area. catchment area. 123
134 SWALE SERVING CONTRIBUTING CATCHMENT: Blue Numbers = SWALE V7.3 Red Numbers = Example Problem 12 Input data Calculated or Carryover GO TO STORMWATER TREATMENT ANALYSIS Catchment 1 Catchment 2 Catchment3 Catchment 4 Catchment 1 Catchment 2 Catchment3 Catchment 4 Contributing catchment area: ac Concentration reduction? (If S<= 1% or H>= 6 in) Required treatment efficiency (Nitrogen): % Provided percent mass reductions in surface discharges are: Required treatment efficiency (Phosphorus): % Nitrogen efficiency Swale top width calculated for flood conditions [W]: Note that the ft Phosphorus efficiency Swale bottom width (0 for triangular section) [B]: 2.00 ft If you are you interested in the mass of pollutants removed before percolating into the Swale length [L]: provided ft groundwater? View Media Mixes Average impervious length: ft Specify soil media Average impervious width (including shoulder): treatment ft Nitrogen mass reduction in groundwater discharge % Average width of the pervious area to include swale width: ft Phosphorus mass reduction in groundwarer discharge % Contributing catchment area: efficiency is ft 2 Swale slope (ft drop/ft length) [S]: Manning's N: higher than the Soil infiltration rate: in/hr Side slope of swale (horizontal ft/vertical ft) [Z]: required Infiltrated storage depth: in Cumulative height of the swale blocks [H]: treatment ft Length of the berm upstream of the crest [Lb]: ft efficiency. Volume of water in swales upstream of swale blocks: in Total volume: in Provided treatment efficiency (Nitrogen): % Provided treatment efficiency (Phosphorus): % Treatment efficiency(%): Retention depth (inch): Figure 107 Swale worksheet. Efficiency Curve: Sys. Eff. (N $ P) CAT 1 Sys. Eff. (N $ P) CAT 2 Sys. Eff. (N $ P) CAT 3 Sys. Eff. (N $ P) CAT 4 NOTE FOR TREATMENT EFFICIENCY GRAPH: The purpose of this graph is to help illustrate the treatment efficiency of the swale as the function of retention depth. The graph illustrates that there is diminishing effectiveness as the retention depth is increased. 124
135 5. Select the Stormwater Treatment Analysis button to proceed to the Stormwater Treatment Analysis worksheet. 6. Select the Retention Basin button to proceed to the Retention Basin worksheet. a. Specify a 0.25-inch retention depth (Figure 108). Catchment 1 Catchment 2 Catchment 3 Catchment 4 Watershed area: ac Required Treatment Eff (Nitrogen): % Required Treatment Eff (Phosphorus): % Required retention depth over the watershed to meet required efficiency: in Required water quality retention volume: ac-ft Retention volume based on retention depth ac-ft Provided retention depth (inches over the watershed area): in Provided treatment efficiency (Nitrogen): % Provided treatment efficiency (Phosphorus): % Remaining treatment efficiency (Nitrogen): % met. Remaining treatment efficiency (Phosphorus): % Remaining retention depth needed: in Figure Retention Basin worksheet. 7. Select the Stormwater Treatment Analysis button to proceed to the Stormwater Treatment Analysis worksheet. RETENTION BASIN: V6.0 RETENTION BASIN SERVING: Example Problem 12 RETENTION BASIN FOR MULTIPLE TREATMENT SYSTEMS (if there is a need for additional removal efficiencies in a series of BMPs): 8. Select the Wet Detention button to proceed to the Wet Detention worksheet. a. Under catchment 3, specify a 30 day average annual residence time, a littoral zone (drop down menu), and a 10% efficiency credit (drop down menu) (Figure 109). b. Under catchment four specify a 70-day average annual residence time. Note that the treatment required is not 125
136 WET DETENTION POND SERVING: Catchment 1 Catchment 2 Catchment 3 Catchment 4 Total pre-development catchment area: ac Total post-development catchment area: ac Average annual residence time (between 1 and 500 days): days Littoral Zone or other improvements used? YES YES Littoral Zone or other improvement efficiency credit: % Total Nitrogen removal required: % Total Phosphorus removal required: % Total Nitrogen removal efficiency provided: % Total Phosphorous removal efficiency provided: % Is the wet detention sufficient: YES YES Average annual runoff volume: ac-ft/yr To Achieve the Treatment Efficiency Shown in the Graph Below, the Following Must Hold WET DETENTION: V7.3 Example Problem 12 Minimum Pond Permanent Pool Volume: ac-ft Treatment Efficiency (%): Average Annual Residence Time (days): Efficiency Curve (P) System Efficiency (P) CAT 1 System Efficiency (P) CAT 2 System Efficiency (P) CAT 3 System Efficiency (P) CAT 4 Efficiency Curve (N) System Efficiency (N) CAT 1 System Efficiency (N) CAT 2 System Efficiency (N) CAT 3 System Efficiency (N) CAT 4 Note both catchment 3 and 4 data are entered here NOTE FOR TREATMENT EFFICIENCY GRAPH: The purpose of the treatment efficiency graphs is to help illustrate the treatment efficiency of the wet detention system as the function of average annual residence time (and permanent pool volume). The graph illustrates that there is a point of diminished return as the permanent pool volume is substantially increased. The lines are produced from the conditions of catchment one, thus other catchments are shown with the data points. Figure Wet Detention worksheet. 9. Select the Stormwater Treatment Analysis button to proceed to the Stormwater Treatment Analysis worksheet. 10. Select the Catchment and Treatment Summary Results button to proceed to the Catchment and Treatment Summary Results worksheet (Figure 110). 126

137 CATCHMENTS AND TREATMENT SUMMARY RESULTS V7.3 CALCULATION METHODS: 1. The effectiveness of each BMP in a single catchment is converted to an equivalent capture volume. 2. Certain BMP treatment train combinations have not been evaluated and in practice they are at this time not used, an example is a greenroof following a tree well. 3. If multiple BMPs are used in a single catchment and one of them is detention, then it is assumed to be last in series. PROJECT TITLE Example Problem 12 Optional Identification Catchment 1: Catchment 2: Catchment 3: Catchment 4: BMP Name Swale Retention Basin Wet Detention Wet Detention BMP Name BMP Name Catchment J - Mixed-4 Catchment-3 Series-Parallel Configuration Nitrogen Pre Load (kg/yr) Phosphorus Pre Load (kg/yr) Nitrogen Post Load (kg/yr) Phosphorus Post Load (kg/yr) Target Load Reduction (N) % Target Load Reduction (P) % Target Discharge Load, N (kg/yr) Target Discharge Load, P (kg/yr) Provided Overall Efficiency, N (%): Provided Overall Efficiency, P (%): Discharged Load, N (kg/yr & lb/yr): Discharged Load, P (kg/yr & lb/yr): Load Removed, N (kg/yr & Ib/yr): Load Removed, P (kg/yr & Ib/yr): Figure Catchment and Treatment Summary Results. Part 2. Treating the catchments in configuration K: 1. All of the existing data can be used for this part of the problem except the catchment configuration needs to be changed. 2. Select the Watershed Characteristics button to proceed to the Watershed Characteristics worksheet. a. Indicate the catchment configuration. For this part, 4 catchments using configuration K (Figure 111). Summary Performance of Entire Watershed Note that the provided treatment efficiency is sufficient. 7/8/2014 BMPTRAINS MODEL
138 K K - Mixed-4 Catchment-Series (B) Figure Catchment Configuration K. b. The pre- and post-development land use, catchment areas, non-dcia Curve Number and DCIA percentage remains the same (Figure 112). 128
139 WATERSHED CHARACTERISTICS V6.0 GO TO STORMWATER TREATMENT ANALYSIS SELECT CATCHMENT CONFIGURATION CATCHMENT NO.1 CHARACTERISTICS: \ If mixed land uses (side calculation) CLICK ON CELL BELOW TO SELECT Pre-development land use: Agricultural - Pasture: TN=3.470 TP=0.616 with default EMCs CLICK ON CELL BELOW TO SELECT Post-development land use: Highway: TN=1.640 TP=0.220 with default EMCs Total pre-development catchment area: 5.00 AC Total post-development catchment or BMP analysis area: 5.00 AC Figure Watershed Characteristics worksheet. 129 CLICK ON CELL BELOW TO SELECT CONFIGURATION K - Mixed-4 Catchment-Series (B) Land use Area Acres non DCIA CN %DCIA Pre-development Non DCIA CN: problem. Pre-development DCIA percentage: 0.00 % Pre-development Annua Post-development Non DCIA CN: Pre-development Annua Post-development DCIA percentage: % Post-development Annu Estimated Area of BMP (used for rainfall excess not loadings) 1.11 AC Post-development Annu CATCHMENT NO.2 CHARACTERISTICS: \ If mixed land uses (side calcula CLICK ON CELL BELOW TO SELECT Land use Area Acres non DCIA CN %DCIA Pre-development land use: Agricultural - Pasture: TN=3.470 TP=0.616 CLICK ON CELL BELOW TO SELECT Post-development land use: High-Intensity Commercial: TN=2.40 TP=0.34 Total Total pre-development catchment area: 5.00 AC Total post-development catchment or BMP analysis area: 5.00 AC Pre-development Non DCIA CN: Pre-development DCIA percentage: 0.00 % Pre-development Annua Post-development Non DCIA CN: Pre-development Annua Post-development DCIA percentage: % Post-development Annu Estimated Area of BMP (used for rainfall excess not loadings) 1.00 AC Post-development Annu CATCHMENT NO.3 CHARACTERISTICS: \ If mixed land uses (side calcul CLICK ON CELL BELOW TO SELECT Land use Area Acres non DCIA CN %DCIA Pre-development land use: Agricultural - Pasture: TN=3.470 TP=0.616 CLICK ON CELL BELOW TO SELECT Post-development land use: Low-Density Residential: TN=1.610 TP= 0.19 Total Total pre-development catchment area: 5.00 AC Total post-development catchment or BMP analysis area: 5.00 AC Pre-development Non DCIA CN: Pre-development DCIA percentage: 0.00 % Pre-development Annua Post-development Non DCIA CN: Pre-development Annua Post-development DCIA percentage: % Post-development Annu Estimated Area of BMP (used for rainfall excess not loadings) 1.00 AC Post-development Annu CATCHMENT NO.4 CHARACTERISTICS: \ If mixed land uses (side calcul CLICK ON CELL BELOW TO SELECT Land use Area Acres non DCIA CN %DCIA Pre-development land use: Agricultural - Pasture: TN=3.470 TP=0.616 CLICK ON CELL BELOW TO SELECT Post-development land use: Light Industrial: TN=1.200 TP=0.260 Total Total pre-development catchment area: AC Total post-development catchment or BMP analysis area: AC Pre-development Non DCIA CN: Pre-development DCIA percentage: 0.00 % Pre-development Annua Post-development Non DCIA CN: Pre-development Annua Post-development DCIA percentage: % Post-development Annu Estimated Area of BMP (used for rainfall excess not loadings) 2.00 AC Post-development Annu Total Catchment configuration for 2 nd part of
. CATCHMENTS AND TREATMENT SUMMARY RESULTS V7.")
140 3. Select the Stormwater Treatment Analysis button at the top of the worksheet to proceed to the Stormwater Treatment Analysis worksheet. 4. Select the Catchment and Treatment Summary Results button to proceed to the Catchment and Treatment Summary Results worksheet (Figure 113). CATCHMENTS AND TREATMENT SUMMARY RESULTS V7.3 CALCULATION METHODS: 1. The effectiveness of each BMP in a single catchment is converted to an equivalent capture volume. 2. Certain BMP treatment train combinations have not been evaluated and in practice they are at this time not used, an example is a greenroof following a tree well. 3. If multiple BMPs are used in a single catchment and one of them is detention, then it is assumed to be last in series. PROJECT TITLE Example Problem 12 Optional Identification Catchment 1: Catchment 2: Catchment 3: Catchment 4: BMP Name Swale Retention Basin Wet Detention Wet Detention BMP Name BMP Name Catchment K - Mixed-4 Catchment-Series (B) Configuration Nitrogen Pre Load (kg/yr) Phosphorus Pre Load (kg/yr) Nitrogen Post Load (kg/yr) Phosphorus Post Load (kg/yr) Target Load Reduction (N) % Target Load Reduction (P) % Target Discharge Load, N (kg/yr) Target Discharge Load, P (kg/yr) Provided Overall Efficiency, N (%): Provided Overall Efficiency, P (%): Discharged Load, N (kg/yr & lb/yr): Discharged Load, P (kg/yr & lb/yr): Load Removed, N (kg/yr & Ib/yr): Load Removed, P (kg/yr & Ib/yr): Summary Performance of Entire Watershed sufficient Note that the provided treatment efficiency is Figure Catchment and Treatment Summary Results /8/2014 BMPTRAINS MODEL NOTE: This example shows how catchment configurations can be easily changed to examine different configurations. This also shows that different configurations can affect the overall result achieved
141 Example problem # 13 BMP Analysis This example problem demonstrates how the model can be used to examine the effectiveness of a BMP without specifying a pre and post condition, or a specified removal. The application is for an existing BMP or it can also be used for new construction. The evaluation can be achieved by using one or more catchments. For BMPTRAINS model input, only post development area and CN number are specified. For this example problem, a single catchment is used and the BMP effectiveness is for a retention basin. A 1 A - Single Catchment The project location is Orlando, FL. There is a small (20%) non highway area in the catchment that contributes and is agricultural-pasture with a Curve Number of 78. The total project area is 6 acres. The highway DCIA is 80% of the catchment. The space for retention is limited and it is desired to examine the effectiveness of a 0.25-acre retention pond. This problem is to be treated as a BMP analysis problem. Solution: 1. From the introduction page click on the Click Here to Start button to proceed to the General Site Information worksheet. a. Select the Reset Input for Stormwater Treatment Analysis button to erase any existing data. b. Enter the project name and select the meteorological zone in the General Site Information worksheet (Figure 114). c. Indicate the mean annual rainfall amount in the General Site Information worksheet. d. Select the BMP Analysis option from the type of analysis drop down menu in the General Site Information worksheet. 131
142 GENERAL SITE INFORMATION: V6.0 Select the appropriate data in the General Site Information Page Meteorological Zone (Please use zone map): worksheet. STEP 1: Select the appropriate Meteorological Zone, input the appropriate Mean Annual Rainfall amount and select the type of analysis Mean Annual Rainfall (Please use rainfall map): GO TO INTRODUCTION PAGE CLICK ON CELL BELOW TO SELECT Zone Inches NAME OF PROJECT Example Problem 13 CLICK ON CELL BELOW TO SELECT Type of analysis: BMP analysis Treatment efficiency (N, P) (leave empty if net improvement or BMP analysis is used): % Blue Numbers = Red Numbers = VIEW ZONE MAP Input data Calculated or Carryover VIEW MEAN ANNUAL RAINFALL MAP GO TO WATERSHED CHARACTERISTICS STEP 2: Select the STORMWATER TREATMENT ANALYSIS to begin analyzing Best Management Practices. Select the Reset Input for if data are in the program that will not be reused. STORMWATER TREATMENT ANALYSIS Systems available for analysis: Retention Basin with option for calculating effluent concentration Wet Detention Exfiltration Trench Pervious Pavement Stormwater Harvesting Underdrain Biofiltration Greenroof Rainwater Harvesting Floating Island with Wet Detention Vegetated Natural Buffer Vegetated Filter Strip Swale Rain Garden User Defined BMP RESET INPUT FOR STORMWATER TREATMENT ANALYSIS Figure General Site Information worksheet. Model documentation and example problems. There is a user's manual for the BMPTRAINS model. It can be downloaded from The results rainfall from the example map problems can be shown in the manual however may not reflect current model results due to ongoing updates of the model. METHODOLOGY FOR CALCULATING REQUIRED TREATMENT EFFICIENCY METHODOLOGY FOR RETENTION SYSTEMS METHODOLOGY FOR GREENROOF SYSTEMS Note that the zone map and annual viewed by selecting the appropriate button. METHODOLOGY FOR WET DETENTION SYSTEMS METHODOLOGY FOR WATER HARVESTING SYSTEMS 2. Select the Watershed Characteristics button to proceed to the Watershed Characteristics worksheet. a. Indicate the catchment configuration. For this problem, a single catchment is used as shown in the BMPTRAINS MODEL as configuration A (Figure 115). A 1 A - Single Catchment Figure Catchment Configuration for this problem. b. Indicate the BMP land use data. Since we are only interested in BMP effectiveness, only the post-development catchment areas non-dcia Curve Number and DCIA percentage are required but the post and pre land use conditions must also be entered (Figure 116). 132
143 WATERSHED CHARACTERISTICS V 8.0 GO TO STORMWATER TREATMENT ANALYSIS SELECT CATCHMENT CONFIGURATION 7/17/2016 CLICK ON CELL BELOW TO SELECT CONFIGURATION A - Single Catchment For comingling, the off-site catchment must be upstream. The delay is only for retention BMPs and must be used in hours as measured by the time of concentration at a one inch/hour rain VIEW AVERAGE ANNUAL RUNOFF Delay [hrs] CATCHMENT NO.1 NAME: New Development For BMP "C" Analysis, Factor must CLICK ON CELL BELOW TO SELECT Pre-development land use: have post land use with default EMCs CLICK ON CELL BELOW TO SELECT description. VIEW EMC & Also FLUCCS enter Post-development land use: Highway: TN=1.520 TP=0.200 with default EMCs GO TO GIS LANDUSE DATA data for post conditions Total pre-development catchment area: AC Total post-development catchment or BMP analysis area: 6.00 AC only. Average annual pre runo Pre-development Non DCIA CN: Average annual post run Pre-development DCIA percentage: % Pre-development Annua Post-development Non DCIA CN: Pre-development Annua Post-development DCIA percentage: % Post-development Annu Estimated BMPArea (No loading from this area) 0.25 AC Post-development Annu Figure Watershed Characteristics worksheet. 3. Select the Stormwater Treatment Analysis button at the top of the worksheet to proceed to the Stormwater Treatment Analysis worksheet. 4. Select the Retention Basin button to proceed to the Basin worksheet. a. A retention area of 0.25 acres that is about an average of 10 feet deep exists and provides for 0.5-inch retention depth over the DCIA. Use retention depth of 0.5 inch (Figure 117). Catchment 1 Catchment 2 Catchment 3 Catchment 4 Watershed area: ac Required Treatment Eff (Nitrogen): TBD TBD TBD TBD % Required Treatment Eff (Phosphorus): TBD TBD TBD TBD % Required retention depth over the watershed to meet required efficiency: in Required water quality retention volume: ac-ft Retention volume based on retention depth ac-ft Provided retention depth (inches over the watershed area): in Provided treatment efficiency (Nitrogen): provided % Provided treatment efficiency (Phosphorus): % Remaining treatment efficiency (Nitrogen): % Remaining treatment efficiency (Phosphorus): % Remaining retention depth needed: in Figure Retention Basin worksheet. 5. Select the Stormwater Treatment Analysis button to proceed to the Stormwater Treatment Analysis worksheet. 6. Select the Catchment and Treatment Summary Results button to proceed to the Catchment and Treatment Summary Results worksheet (Figure 118). RETENTION BASIN: V6.0 RETENTION BASIN SERVING: Example Problem 13 RETENTION BASIN FOR MULTIPLE TREATMENT SYSTEMS (if there is a need for additional removal efficiencies in a series of BMPs): 133 Note removal
144 CATCHMENTS AND TREATMENT SUMMARY RESULTS V 8.0 CALCULATION METHODS: 1. The effectiveness of each BMP in a single catchment is converted to an equivalent capture volume. 2. Certain BMP treatment train combinations have not been evaluated and in practice they are at this time not used, an example is a greenroof following a tree well. 3. Wet detention is last when used in a single catchment with other BMPs, except when followed by filtration PROJECT TITLE BMP Analysis Optional Identification Example Problem 13 New Development Catchment 2 Catchment 3 Catchment 4 BMP Name Retention Basin BMP Name BMP Name Summary Performance of Entire Watershed Catchment A - Single Catchment Configuration Nitrogen Pre Load (kg/yr) 0.00 Phosphorus Pre Load (kg/yr) 0.00 Nitrogen Post Load (kg/yr) Phosphorus Post Load (kg/yr) 3.94 Target Load Reduction (N) % Target Load Reduction (P) % Target Discharge Load, N (kg/yr) Target Discharge Load, P (kg/yr) Provided Overall Efficiency, N (%): Provided Overall Efficiency, P (%): Discharged Load, N (kg/yr & lb/yr): Discharged Load, P (kg/yr & lb/yr): Load Removed, N (kg/yr & Ib/yr): Load Removed, P (kg/yr & Ib/yr): Treatment Objectives or Target /17/2016 BMPTRAINS MODEL Note the discharged N and P load as well as the N and P load removed in both lbs/yr and kg/yr Figure Catchment and Treatment Summary Results. Notes: This example problem illustrates removal with a limited size of BMP, or retention basin in this example. The results show that a retention basin that treats 0.5 inches of the runoff from the watershed removes kg/yr (32.43 lb/yr) of N and 1.94 kg/yr (4.27 lb/yr) of P discharging kg/yr (33.57 lb/yr) of N and 2.01 kg/yr (4.42 lb/yr) of P. The efficiency for retention with the catchment land surface conditions and for the BMP size is 51%. If the retention basin can be deepened to a treatment volume of 1.00 inches of runoff and result in a 74% efficiency. 134
145 Example problem # 14 BMP Analysis for Offsite Drainage into an Onsite BMP This example problem examines the possibility of offsite drainage into an onsite BMP (in this case, a FDOT right of way BMP) when there is no delay time from the off-site area to the treatment area. There are two treatment options; one is to pass the offsite water through the onsite BMP, and thus two catchments in series with a BMP for the second catchment is used. For example, the onsite BMP is a retention basin and the area and treatment volume is limited. Thus, the treatment size of the onsite BMP will not change (0.5 inch over the onsite catchments as the treatment depth). The other option is to examine the benefit of allowing the offsite discharge into a separate system without treatment, which is examined using catchments in parallel. B 1 2 B - 2 Catchment-Series C 1 2 C - 2 Catchment-Parallel The project location is Sanford, FL. The first catchment pre-development and postdevelopment condition is agricultural-pasture with a Curve Number of 78. The total area is 10 acres. No Land use change is expected from pre to post development in catchment one. This is a design problem with limited space for treatment. However, the depth of the retention pond can be up to 13 feet to accommodate offsite catchment flow. The offsite catchment pre-development condition is agricultural-pasture with a Curve Number of 78. The catchment area is 6 acres. The post-development conditions are highway with a non-dcia Curve 135
146 Number of 78 and DCIA of 80%. As in the previous example problem, a 0.25-acre retention basin is used for treatment that is 0.5 inch of treatment over the second catchment area. Part 1. Treating the catchments in configuration B: 1. From the introduction page click on the Click Here to Start button to proceed to the General Site Information worksheet. a. Select the Reset Input for Stormwater Treatment Analysis button to erase any existing data. b. Enter the project name and select the meteorological zone in the General Site Information worksheet (Figure 119). c. Indicate the mean annual rainfall amount in the General Site Information worksheet. d. Select the BMP Analysis option from the type of analysis drop down menu in the General Site Information worksheet. Next, GENERAL SITE INFORMATION: V6.0 Next, Select the appropriate data in the General Site Information Page STEP 1: Select the appropriate Meteorological Zone, input the appropriate Mean Annual Rainfall amount and select the type of analysis Meteorological Zone (Please use zone map): Mean Annual Rainfall (Please use rainfall map): Inches CLICK ON CELL BELOW TO SELECT worksheet. Type of analysis: BMP analysis Treatment efficiency (N, P) (leave empty if net improvement or BMP analysis is used): % Systems available for analysis: Retention Basin with option for calculating effluent concentration Wet Detention Exfiltration Trench Pervious Pavement Stormwater Harvesting Underdrain Biofiltration Greenroof Rainwater Harvesting Floating Island with Wet Detention Vegetated Natural Buffer Vegetated Filter Strip Swale Rain Garden User Defined BMP GO TO INTRODUCTION PAGE CLICK ON CELL BELOW TO SELECT Zone 2 STEP 2: Select the STORMWATER TREATMENT ANALYSIS to begin analyzing Best Management Practices. STORMWATER TREATMENT ANALYSIS First Select the Reset Input for Stormwater Treatment Analysis button if data exists in the model. RESET INPUT FOR STORMWATER TREATMENT ANALYSIS Figure General Site Information worksheet. NAME OF PROJECT Example Problem 14 Blue Numbers = Red Numbers = VIEW ZONE MAP Model documentation and example problems. Input data Calculated or Carryover VIEW MEAN ANNUAL RAINFALL MAP There is a user's manual for the BMPTRAINS model. It can be downloaded from The results from the example problems shown viewed by selecting in the manual however may not reflect current model results due to ongoing updates of the model. METHODOLOGY FOR CALCULATING REQUIRED TREATMENT EFFICIENCY METHODOLOGY FOR RETENTION SYSTEMS METHODOLOGY FOR GREENROOF SYSTEMS GO TO WATERSHED CHARACTERISTICS Note that the zone map and annual rainfall map can be the appropriate button. METHODOLOGY FOR WET DETENTION SYSTEMS METHODOLOGY FOR WATER HARVESTING SYSTEMS 136
147 2. Select the Watershed Characteristics button to proceed to the Watershed Characteristics worksheet. a. Indicate the catchment configuration. For this problem, two catchments configured as shown in BMPTRAINS option B (Figure 120). B 1 2 B - 2 Catchment-Series Figure Catchment Configuration for part 1 of this problem. b. Indicate the pre- and post-development land use. Since we are only interested in BMP effectiveness, only the post-development catchment areas, non-dcia Curve Number and DCIA percentage are required (Figure 121).. NOTE: if there is a delay time for the runoff water from the upstream catchment to reach the regional basin (#2 in the diagram), then the delay time is added on the watershed characteristics worksheet. The delay time of 6 hours is shown below and is calculated using time of concentration formulas and for an average rainfall intensity of 1 inch per hour. A partial screen capture is shown as: WATERSHED CHARACTERISTICS V 8.0 GO TO STORMWATER TREATMENT ANALYSIS SELECT CATCHMENT CONFIGURATION 7/14/2016 For comingling, the off-site catchment must be upstream. The delay is only for retention BMPs and must be used in hours as measured by the time of concentration at a one inch/hour rain Delay [hrs] 6.00 Pre-development land use: with default EMCs Post-development land use: with default EMCs CATCHMENT NO.1 NAME: upstream CLICK ON CELL BELOW TO SELECT Agricultural - Pasture: TN=3.510TP=0.686 CLICK ON CELL BELOW TO SELECT Agricultural - Pasture: TN=3.510TP=0.686 CLICK ON CELL BELOW TO SELECT CONFIGURATION B - 2 Catchment-Series VIEW AVERAGE ANNUAL RUNOFF "C" Factor VIEW EMC & FLUCCS GO TO GIS LANDUSE DATA Also, note that the delay time is only used when the treatment BMP is retention. There is no delay time needed when using a Wet Detention BMP. Also co-mingling is evaluated using two catchments, one upstream (offsite) and the other downstream (onsite or regional). 137
148 WATERSHED CHARACTERISTICS V 8.0 GO TO STORMWATER TREATMENT ANALYSIS CLICK ON CELL BELOW TO SELECT CONFIGURATION SELECT CATCHMENT CONFIGURATION 7/15/2016 B - 2 Catchment-Series For comingling, the off-site catchment must be upstream. The delay is only for retention BMPs and must be used in hours as measured by the time of concentration at a one inch/hour rain VIEW AVERAGE ANNUAL RUNOFF Delay [hrs] CATCHMENT NO.1 NAME: off site upstream "C" Factor CLICK ON CELL BELOW TO SELECT Agricultural - Pasture: TN=3.510TP=0.686 Pre-development land use: with default Catchment EMCs input for CLICK ON CELL BELOW TO SELECT VIEW EMC & FLUCCS Post-development land use: Agricultural - Pasture: TN=3.510TP=0.686 with default the EMCs up-stream GO TO GIS LANDUSE DATA Total pre-development catchment area: AC Total post-development catchment. catchment No delay or BMP analysis area: AC Average annual pre runo Pre-development Non DCIA CN: Average annual post run calculated Pre-development DCIA percentage: % Pre-development Annua Post-development Non DCIA CN: Pre-development Annua Post-development DCIA percentage: % Post-development Annu Estimated BMPArea (No loading from this area) AC Post-development Annu CATCHMENT NO.2 NAME: onsite regional CLICK ON CELL BELOW TO SELECT Pre-development land use: Agricultural - Pasture: TN=3.510TP=0.686 with default EMCs CLICK ON CELL BELOW TO SELECT Post-development land use: Highway: TN=1.520 TP=0.200 with Catchment default EMCs Total pre-development catchment area: AC Characteristics Total post-development catchment or BMP analysis area: 6.00 AC Average annual pre runo Pre-development input Non for DCIA the CN: Average annual post run Pre-development DCIA percentage: % Pre-development Annua Post-development downstream Non DCIA CN: Pre-development Annua Post-development DCIA percentage: % Post-development Annu Estimated BMPArea catchment. (No loading from this area) 0.25 AC Post-development Annu Figure Watershed Characteristics worksheet. 3. Select the Stormwater Treatment Analysis button at the top of the worksheet to proceed to the Stormwater Treatment Analysis worksheet. 4. Select the Retention Basin button to proceed to the Retention Basin worksheet. a. Specify a 0.5-inch retention depth and note a deeper basin than used in the previous example problem to accommodate for the increased volume provided by the offsite flow. For the input data sheet (see Figure 122). 138
149 RETENTION BASIN SERVING: Example Problem 14 Catchment 1 Catchment 2 Catchment 3 Catchment treatment 4 Watershed area: ac Required Treatment Eff (Nitrogen): TBD TBD TBD TBD achieved. % Required Treatment Eff (Phosphorus): TBD TBD TBD TBD % Required retention depth over the watershed to meet required efficiency: in Required water quality retention volume: ac-ft Retention volume based on retention depth ac-ft Provided retention depth (inches over the watershed area): in Provided treatment efficiency (Nitrogen): % Provided treatment efficiency (Phosphorus): % Remaining treatment efficiency (Nitrogen): % Remaining treatment efficiency (Phosphorus): % Remaining retention depth needed: in Figure Retention Basin worksheet. Comparing the removal effectiveness when offsite drainage is added to a fixed area of retention basin at the same average depth to a design with no offsite drainage shows a decrease to 68% (Figure 121) as compared without treating the offsite area or 74% (see comments under Figure 118). 5. Select the Stormwater Treatment Analysis button to proceed to the Stormwater Treatment Analysis worksheet. 6. Select the Catchment and Treatment Summary Results button to proceed to the Catchment and Treatment Summary Results worksheet (Figure 123). RETENTION BASIN: V6.0 Note the RETENTION BASIN FOR MULTIPLE TREATMENT SYSTEMS (if there is a need for additional removal efficiencies in a series of BMPs): 139

150 CATCHMENTS AND TREATMENT SUMMARY RESULTS V 8.0 CALCULATION METHODS: 1. The effectiveness of each BMP in a single catchment is converted to an equivalent capture volume. 2. Certain BMP treatment train combinations have not been evaluated and in practice they are at this time not used, an example is a greenroof following a tree well. 3. Wet detention is last when used in a single catchment with other BMPs, except when followed by filtration PROJECT TITLE co-mingling Optional Identification off site upstream onsite regional Catchment 3 Catchment 4 BMP Name Retention Basin BMP Name BMP Name Summary Performance of Entire Watershed Catchment Configuration B - 2 Catchment-Series Nitrogen Pre Load (kg/yr) Phosphorus Pre Load (kg/yr) Nitrogen Post Load (kg/yr) Phosphorus Post Load (kg/yr) Target Load Reduction (N) % and lb/yr. Target Load Reduction (P) % Target Discharge Load, N (kg/yr) Target Discharge Load, P (kg/yr) Provided Overall Efficiency, N (%): Provided Overall Efficiency, P (%): Discharged Load, N (kg/yr & lb/yr): Discharged Load, P (kg/yr & lb/yr): Load Removed, N (kg/yr & Ib/yr): Load Removed, P (kg/yr & Ib/yr): Note no delay Discharged and Removed Treatment Load in Objectives both kg/yr or Target 7/15/2016 BMPTRAINS MODEL 1 2 Figure Catchment and Treatment Summary Results. Notes: The N discharged is kg/yr (37.54 lb/yr) and the P discharged is 2.64 kg/yr (5.82 lb/yr). The N and P removal are both 64%. The maximum removal at the regional site was 68% removal. There was not a significant difference because the offsite (upstream) had no directly connected impervious area and thus low discharge. If there were a delay, then the co-mingling discharge would be closer to the non-delayed discharged. A delay allows more time for infiltration of the onsite runoff making more storage available for the offsite runoff. 140
151 Part 2. Treating the catchments as parallel flow streams as shown in the BMPTRAINS model configuration C (Figure 123): The offsite flow is bypassed. 1. All of the existing data can be used for this part of the problem except the catchment configuration needs to be changed. 2. Select the Watershed Characteristics button to proceed to the Watershed Characteristics worksheet. a. Indicate the catchment configuration. For this part, 2 catchments using configuration C of the BMPTRAINS Model (Figure 124). We are examining the flow streams separately. C 1 2 C - 2 Catchment-Parallel Figure Catchment Configuration C. b. The pre- and post-development land use, catchment areas, non-dcia Curve Number and DCIA percentage remain the same (Figure 125). Because the offsite flow is not treated and for ½ treatment, the retention basin can be 10 feet (not 13 feet) or less area (0.19 ac) is needed. 141
152 WATERSHED CHARACTERISTICS V6.0 GO TO STORMWATER TREATMENT ANALYSIS SELECT CATCHMENT CONFIGURATION CLICK ON CELL BELOW TO SELECT CONFIGURATION C - 2 Catchment-Parallel CATCHMENT NO.1 CHARACTERISTICS: \ If mixed land uses (side calculation) CLICK ON CELL BELOW TO SELECT Land use Area Acres non DCIA CN %DCIA Pre-development land use: Agricultural - Pasture: TN=3.470 TP=0.616 with default EMCs CLICK ON CELL BELOW TO SELECT Catchment Post-development land use: Agricultural - Pasture: TN=3.470 TP=0.616 configuration for 2 nd with default EMCs Total Total pre-development catchment area: AC part of problem or Total post-development catchment or BMP analysis area: AC Pre-development Non DCIA CN: bypass of offsite flow. Pre-development DCIA percentage: % Pre-development Annua Post-development Non DCIA CN: Pre-development Annua Post-development DCIA percentage: 0.00 % Post-development Annu Estimated Area of BMP (used for rainfall excess not loadings) AC Post-development Annu CATCHMENT NO.2 CHARACTERISTICS: \ If mixed land uses (side calcula CLICK ON CELL BELOW TO SELECT Land use Area Acres non DCIA CN %DCIA Pre-development land use: Agricultural - Pasture: TN=3.470 TP=0.616 CLICK ON CELL BELOW TO SELECT Post-development land use: Highway: TN=1.640 TP=0.220 Total Total pre-development catchment area: AC Total post-development catchment or BMP analysis area: 6.00 AC Pre-development Non DCIA CN: Pre-development DCIA percentage: % Pre-development Annua Post-development Non DCIA CN: Pre-development Annua Post-development DCIA percentage: % Post-development Annu Estimated Area of BMP (used for rainfall excess not loadings) 0.25 AC Post-development Annu Figure Watershed Characteristics worksheet. 5. Select the Stormwater Treatment Analysis button at the top of the worksheet to proceed to the Stormwater Treatment Analysis worksheet. 142

153 6. Select the Catchment and Treatment Summary Results button to proceed to the Catchment and Treatment Summary Results worksheet (Figure 126). CATCHMENTS AND TREATMENT SUMMARY RESULTS V 8.0 CALCULATION METHODS: 1. The effectiveness of each BMP in a single catchment is converted to an equivalent capture volume. 2. Certain BMP treatment train combinations have not been evaluated and in practice they are at this time not used, an example is a greenroof following a tree well. 3. Wet detention is last when used in a single catchment with other BMPs, except when followed by filtration PROJECT TITLE co-mingling Optional Identification off site upstream onsite regional Catchment 3 Catchment 4 BMP Name Retention Basin BMP Name BMP Name Summary Performance of Entire Watershed Catchment Configuration C - 2 Catchment-Parallel Nitrogen Pre Load (kg/yr) Phosphorus Pre Load (kg/yr) Nitrogen Post Load (kg/yr) Phosphorus Post Load (kg/yr) Target Load Reduction (N) % Target Load Reduction (P) % Target Discharge Load, N (kg/yr) Target Discharge Load, P (kg/yr) Provided Overall Efficiency, N (%): Provided Overall Efficiency, P (%): Discharged Load, N (kg/yr & lb/yr): Discharged Load, P (kg/yr & lb/yr): Load Removed, N (kg/yr & Ib/yr): Load Removed, P (kg/yr & Ib/yr): Note: additional offsite loading not treated Treatment increased the discharge Objectives load and decreased the or Target overall effectiveness /15/2016 BMPTRAINS MODEL Figure Catchment and Treatment Summary Results. NOTES: When not treating the offsite drainage, the combined annual N discharged is lb/yr and P discharged is lb/yr compared to treating the offsite in the onsite fixed volume retention basin giving lb/yr N and 5.82 lb/yr P (series treatment, Figure 123). The use of the onsite fixed volume of retention is favored because of the lower discharge load. However, this is not always the result and depends on the rainfall excess from the offsite as well as the size of the onsite treatment. For this set of conditions, and in terms of removal, it would be best to treat onsite the offsite runoff even if the onsite basin size were not increased. 143
154 Example problem # 15 Different N and P removal efficiencies specified This example problem presents the instance of different required and specified removal efficiencies for N and P. For BMP removal effectiveness with different required amounts for N and P, any number of catchments (up to 4) in any configuration can be used. For this example problem, one catchment is used. The project location is in the Tallahassee, Florida area. The catchment pre-development condition is agricultural-general agricultural with a non-dcia Curve Number of 60. The total area is 10 acres. The postdevelopment conditions are light industrial with a non-dcia Curve Number of 60 and DCIA of 70%. A 0.25-acre detention pond for treatment with an average annual residence time of 50 days is possible. In addition, a littoral zone with a 15% efficiency credit is assumed. This problem is treated as a specified removal efficiency problem. The objective is to remove 45% N and 70% P. Solution: 1. From the introduction page click on the Click Here to Start button to proceed to the General Site Information worksheet. a. Select the Reset Input for Stormwater Treatment Analysis button to erase any existing data. b. Enter the project name and select the meteorological zone in the General Site Information worksheet (Figure 127). c. Indicate the mean annual rainfall amount in the General Site Information worksheet. d. Select the Specified Removal Efficiency option from the type of analysis drop down menu in the General Site Information worksheet and enter 45% and 70% for N and P, respectively. 144
155 GENERAL SITE INFORMATION: V6.0 STEP 1: Select the appropriate Meteorological Zone, input the appropriate Mean Annual Rainfall amount and select the type of analysis Select the appropriate data in the General Site Information Page Meteorological Zone (Please use zone map): Mean Annual Rainfall (Please use rainfall map): GO TO INTRODUCTION PAGE CLICK ON CELL BELOW TO SELECT Zone Inches NAME OF PROJECT Example Problem 15 CLICK ON CELL BELOW TO SELECT Type of analysis: Specified removal efficiency Treatment worksheet. efficiency (N, P) (leave empty if net improvement or BMP analysis is used): % Blue Numbers = Red Numbers = VIEW ZONE MAP Input data Calculated or Carryover VIEW MEAN ANNUAL RAINFALL MAP GO TO WATERSHED CHARACTERISTICS STEP 2: Select the STORMWATER TREATMENT ANALYSIS to begin analyzing Best Management Practices. Model documentation and example problems. STORMWATER TREATMENT ANALYSIS Select the Reset Input for Stormwater Treatment Analysis button. Systems available for analysis: Retention Basin with option for calculating effluent concentration Wet Detention Exfiltration Trench Pervious Pavement Stormwater Harvesting Underdrain Biofiltration Greenroof Rainwater Harvesting Floating Island with Wet Detention Vegetated Natural Buffer Vegetated Filter Strip Swale Rain Garden User Defined BMP RESET INPUT FOR STORMWATER TREATMENT ANALYSIS Figure General Site Information worksheet. There is a user's manual for the BMPTRAINS model. It can be downloaded from The results from the example problems shown in the manual however may not reflect current model results due to ongoing updates of the model. METHODOLOGY FOR CALCULATING REQUIRED TREATMENT EFFICIENCY METHODOLOGY FOR RETENTION SYSTEMS METHODOLOGY FOR GREENROOF SYSTEMS Note that the zone map and annual rainfall map can be viewed by selecting the appropriate button. METHODOLOGY FOR WET DETENTION SYSTEMS METHODOLOGY FOR WATER HARVESTING SYSTEMS 2. Select the Watershed Characteristics button to proceed to the Watershed Characteristics worksheet. a. Indicate the catchment configuration. For this problem, 1 catchment configured as shown in A (Figure 128). A 1 A - Single Catchment Figure Catchment Configuration for this problem. b. Indicate the pre- and post-development land use, catchment areas, non-dcia Curve Number and DCIA percentage (Figure 129). 145
156 WATERSHED CHARACTERISTICS V6.0 GO TO STORMWATER TREATMENT ANALYSIS SELECT CATCHMENT CONFIGURATION CATCHMENT NO.1 CHARACTERISTICS: \ If mixed land uses (side calculation) CLICK ON CELL BELOW TO SELECT Pre-development land use: Agricultural - General: TN=2.790 TP=0.431 with default EMCs CLICK ON CELL BELOW TO SELECT Post-development land use: Light Industrial: TN=1.200 TP=0.260 with default EMCs Total pre-development catchment area: AC Total post-development catchment or BMP analysis area: AC Figure Watershed Characteristics worksheet. CLICK ON CELL BELOW TO SELECT CONFIGURATION A - Single Catchment Land use Area Acres non DCIA CN %DCIA Pre-development Non DCIA CN: Pre-development DCIA percentage: 0.00 % Pre-development Annua Post-development Non DCIA CN: Pre-development Annua Post-development DCIA percentage: % Post-development Annu Estimated Area of BMP (used for rainfall excess not loadings) 0.25 AC Post-development Annu 3. Select the Stormwater Treatment Analysis button at the top of the worksheet to proceed to the Stormwater Treatment Analysis worksheet. 4. Select the Wet Detention button to proceed to the Wet Detention worksheet. a. Under catchment 1 specify a 50 day average annual residence time, a littoral zone (drop Total down menu), and a 15% efficiency credit (drop down menu) (Figure 130). Catchment Characteristics input. WET DETENTION POND SERVING: Catchment 1 Catchment 2 Catchment 3 Catchment 4 Total pre-development catchment area: ac Total post-development catchment area: ac Average annual residence time (between 1 and 500 days): days Littoral Zone used in the design: YES Littoral Zone efficiency credit (user specifies 10, 15, or 20%): % Total Nitrogen removal required: Note the % Total Phosphorus removal required: % Total Nitrogen removal efficiency provided: provided % Total Phosphorous removal efficiency provided: % treatment is Is the wet detention sufficient: YES Average annual runoff volume: sufficient ac-ft/yr Wet Detention Pond Characteristics: To Achieve the Treatment Efficiency Shown in the Graph Below, the Following Must Hold Maximum Permanent Pool Depth: ft Minimum Permanent Pool Volume: ac-ft Figure Wet Detention worksheet. 5. Select the Stormwater Treatment Analysis button to proceed to the Stormwater Treatment Analysis worksheet. 6. Select the Catchment and Treatment Summary Results button to proceed to the Catchment and Treatment Summary Results worksheet (Figure 131). WET DETENTION: V Example Problem 15
157 CATCHMENTS AND TREATMENT SUMMARY RESULTS V6.0 CALCULATION METHODS: 1. The effectiveness of each BMP in a single catchment is converted to an equivalent capture volume. 2. Certain BMP treatment train combinations have not been evaluated and in practice they are at this time not used, an example is a greenroof following a tree well. 3. If multiple BMPs are used in a single catchment and one of them is detention, then it is assumed to be last in series. PROJECT TITLE Example Problem 15 Optional Identification Catchment 1: Catchment 2: Catchment 3: Catchment 4: BMP1 Wet Detention BMP2 BMP3 Note the provided Summary Performance treatment Catchment Configuration A - Single Catchment efficiencies are Catchment Nitrogen Pre Load 8.65 sufficient. Catchment Phosphorus Pre Load 1.34 Catchment Nitrogen Post Load Catchment Phosphorus Post Load Target Load Reduction (N) % Target Load Reduction (P) % Target Discharge Load, N (kg/yr) Target Discharge Load, P (kg/yr) Provided Overall Efficiency, N (%): Provided Overall Efficiency, P (%): Discharged Load, N (kg/yr & lb/yr): Discharged Load, P (kg/yr & lb/yr): Load Removed, N (kg/yr & Ib/yr): Load Removed, P (kg/yr & Ib/yr): Figure Catchment and Treatment Summary Results. 1 1/28/2014 BMPTRAINS MODEL NOTE: This example shows how the user can select different target removal efficiencies for N and P. In this case, the target removal effectiveness values of 45 and 70 for N and P respectively were achieved. The target load reduction (effectiveness) is not achieved when there is no credit for littoral zones (40% for N and 68% for P). Also, the discharge loadings increase as the soil increases in clay content or in impervious cover (reflected in the non DCIA CN). 147
 in one BMPTRAINS application (run).")


158 Example problem # 16 More than 4 catchments There may be instances for a watershed where BMP treatment are possible at more than 4 catchments and it is desirable to present the evaluation of effectiveness for the total watershed (including all catchments with treatment) in one BMPTRAINS application (run). This would provide an occasion for breaking the watershed into separate model implementations and then combining the results into one final application of the BMPTRAINS model. Consider as an example a site from North Central Florida that has the option for seven treatment sites at seven catchments. Figure 123 illustrates this condition. Figure 132 More than Four Catchments with Possible BMPs at Each One Breaking the seven catchments into three separate model runs will allow an evaluation for BMPs for which there is no more than four catchments per model run. COMPOSITE BMP Train 1. This is used as input to Train 3. COMPOSITE BMP Train 2. This is used as input to Train 3. Figure 133 Composite Catchment Configurations. COMPOSITE BMP Train 3 showing input from Trains 1 and


159 The pre-condition watershed land use is pasture and the post-condition land use is single family residential. The catchment conditions are listed as follows: This example is sometimes referenced as the complex configuration. The general site information worksheet is the same for all three Composite watersheds and is shown as: Figure 134 General Site Information Input Data. 149

160 The watershed treatment effectiveness is determined for the #1 and #2 composite watershed and then combing the output from these as user defined input to number three composite catchment. For demonstration purposes, net improvement is assumed for each composite catchment however the removal can be varied or adjusted to perform a cost analysis for different levels of treatment at each catchment. For the first composite, the catchment data are: Figure 135 Catchment Data for Composite BMP Train #1. The next Figures display the treatment effectiveness (Figure 136), the stormwater treatment retention worksheet (Figure 137) the wet detention worksheet (Figure 138) and the summary worksheet (Figure 139). The removal effectiveness from this composite 1 catchment becomes user input data for composite catchment #

161 Figure 136 Net Improvement for Composite Catchment #1 151


162 ¾ inch Treatment volume Figure 137 Retention BMP for catchment one of Composite Catchment #1 Example Problem 16 Annual Residence Time Figure 138 Wet Detention BMPs for Composite Catchment #1 152
 along with the half inch retention volumes for each of the catchments (Figure 141). Again, net improvement is assumed for each of the composite catchment.")
163 This is the effectiveness assessment for Composite #1 which is User Input for Composite #3 Figure Effectiveness for Composite Catchment #1 Next, the catchment input data for composite # 2 are entered (Figure 140) along with the half inch retention volumes for each of the catchments (Figure 141). Again, net improvement is assumed for each of the composite catchment. If there are constraints on land availability that lowers the size of the retention volumes, then the BMP option for effectiveness analysis may be used on the general site information worksheet (see Figure 134). The effectiveness summary worksheet is shown in Figure

164 Figure Catchment Characteristics for Composite Catchment #2 154


165 Figure Retention Worksheet for Composite Catchment #2 Example Problem 16. This is the effectiveness assessment for Composite #2 which is User Input for Composite #3 Figure Effectiveness for Composite Catchment #2 155

166 Catchment information for composite #3 are entered as shown in figure 143. The user-defined inputs from composite catchments # 1 and #1 are entered as shown in Figure 144. The retention worksheet is shown in Figure 145 and it is noted that there is treatment at catchment 3. The final assessment is shown in Figure 146. Sum of Run 1 Sum of Run 2 Figure Catchment Data for Composite Catchment #3 156


167 Treatment from Runs 1 and 2 Figure User Defined Effectiveness from Composites # 1 and #2 as input to Composite #3 Figure Retention Worksheet for Composite Catchment #3 157

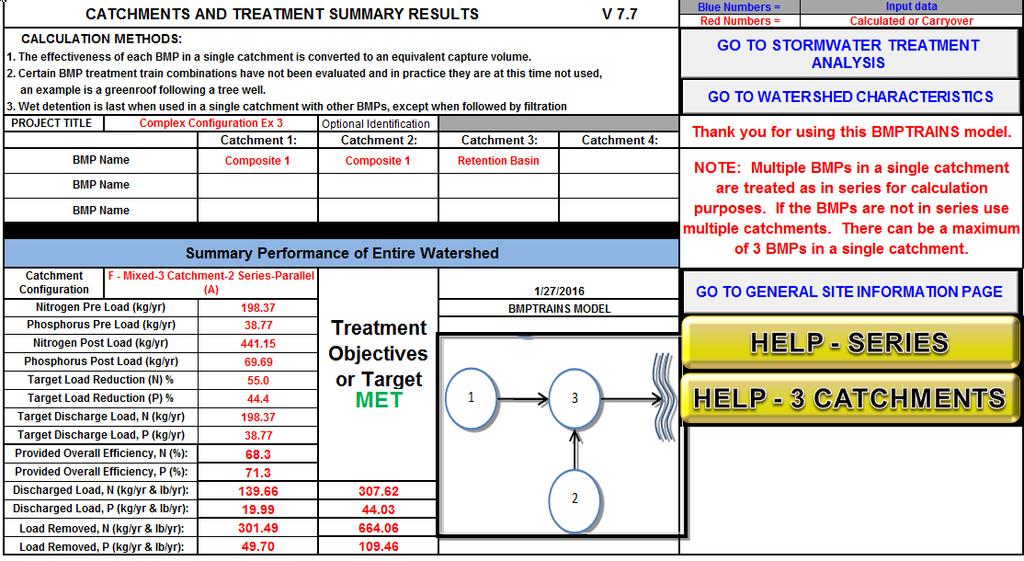
168 Figure Effectiveness Summary worksheet 158
169 Example problem # 17 Cost Analysis Consider a location in Jacksonville, Florida, within meteorological zone 4, with a mean average rainfall of 1270 mm (50 inches). The target removal efficiency of both TN and TP is 80%. The area of interest is a 2.0-acre single catchment. Pre-development conditions were agricultural-general land use with a non-dcia Curve Number of 78 and no DCIA. The postdevelopment land use condition is low-intensity commercial with a non-dcia Curve Number of 78 and 90% DCIA. The post-development condition is assumed to consist of 40% building, 50% parking lot, and 10% green space. The green space is split, with ½ of it around the building and ½ left as natural or available for a retention basin. The two BMPs analyzed in this example are pervious concrete and a retention basin, both having an expected life of 20 years. The pervious concrete section consisted of seven inches of #57 stone, compacted and then topped with a six-inch layer of pervious concrete. The soils were assumed to be sandy and free draining, allowing the system to fully recover in 72 hours from a 5-year design storm event. The retention basin was assumed to have a maximum depth of 12 inches. Recently, a significant land development near the catchment has been completed, resulting in an increase in land costs. Any additional land required to construct the retention basin was assumed to be purchased at a rate of $525,000 per acre, based on local land values from Zillow.com in The differential construction cost to build a pervious pavement BMP compared to a regular pavement was calculated at $200, per acre-ft. of treatment provided. The cost to maintain the installed pervious concrete was $2, per year, based on the cost of vacuum sweeping and other maintenance activities. If pervious concrete was not used as a BMP, there was no associated maintenance cost for vacuum sweeping and other activities. The cost to build the retention basin was based on a capital cost of $0.70 per cubic ft. of water treated in 1997 dollars. This value corresponds to a total capital cost of $45, per acre-ft. of treatment provided in 2016 dollars. The maintenance cost for the retention basin was assumed to be 3% of the capital cost per year (see Appendix B for cost data availability and references). The time period analysis is 20 years at an interest rate of 1.8% which is assumed, based on the most recent values published by the World Bank (appendix B) or for the local conditions and BMP construction. For the first scenario, only a pervious concrete parking lot is used, while for 159
170 the sixth scenario only a retention basin is used. Scenarios two through five have different combinations of the two BMPs in series. BMP Characteristics Pervious Concrete Retention Basin Volume Additional Land Scenario Area [ac] [ac-ft] Required [ac] *Assume pervious concrete has an operational porosity of 25% (Hardin, 2014). Solution: 1. Cost analysis is introduced in the example problems for the first time, thus a detailed navigation is done to facilitate an understanding. From the introduction page click on the Click Here to Start button to proceed to the General Site Information worksheet (see Figure ). a. Select the Reset Input for Stormwater Treatment Analysis button to erase any existing data. b. Enter the project name and select the meteorological zone in the General Site Information worksheet. c. Indicate the mean annual rainfall amount in the General Site Information worksheet. d. Select the Specified Removal Efficiency option from the Type of Analysis drop down menu in the General Site Information worksheet. e. Specify the desired removal efficiency. 160

171 Figure General Site Information worksheet 2. Click Watershed Characteristics. a. In the Click on Cell Below to Select Configuration drop-down menu, select A Single Catchment (see Figure 148). b. Name Catchment No. 1 as Example A c. Select Agricultural General in the drop-down menu for Pre-development land use. d. Select Low-Intensity Commercial in the drop-down menu for Post-development land use. e. Enter the remaining catchment area, percent DCIA, and curve numbers using the given information in the problem statement. f. Input 0.0 acres for Estimated BMPArea (No loading from this area). A value is only input here if the BMP has permanent standing water, such as a wetland or wet detention/retention pond. 161

172 Figure 148 Watershed Characteristics Worksheet Treatment Train Scenario 1 The pervious concrete area, retention basin volume, and additional land required for BMP treatment train Scenario 1 are: BMP Characteristics Pervious Concrete Retention Basin Volume Additional Land Scenario Area [ac] [ac-ft] Required [ac] Note that pervious concrete is the only BMP. And on the watershed characteristics worksheet, the pervious pavement areas do contribute loadings. Nevertheless, enter the pervious pavement areas on the pervious pavement workshop and then the runoff mass loadings are subtracted after the volume of treatment has been reached. 3. Click Go to Stormwater Treatment Analysis. a. Select the Pervious Pavement tab (see Figure 149). b. Enter Pervious Concrete in the Pvmt Name cell (see Figure 150). c. Enter 6.0 in the Pervious Concrete Thickness (in) cell (see Figure 150). d. Enter 25.0 in the Pervious Concrete Operational Porosity (%) cell (see Figure 150). e. Enter 7.0 in the #57 rock Thickness (in) cell (see Figure 150). 162
.")
173 f. Enter 1.0 in the Area of the pervious pavement cell (see Figure 150). Figure 149 Stormwater Treatment Analysis worksheet 163

174 Figure 150 Pervious Pavement BMP tab 4. Click Go to Stormwater Treatment Analysis to return to the Stormwater Treatment Analysis worksheet. 164

175 a. Click Catchments and Treatment Summary Results tab to see if the design meets criteria (see Figure 151). b. If it does not pass, go back and adjust the BMP inputs until it passes. Figure 151 Catchments and Treatment Summary Results Treatment Train Scenario 1, Costs 5. Click Go to Cost Analysis Worksheet. a. Capital and operating costs for pervious pavement. Use these values and adjust the cost to be on a per acre of impervious area treated basis. These are example numbers specific for this site. Capital cost per hectare of impervious area in 2012 dollars Annual operating and maintenance cost per hectare of impervious area in 2012 dollars Capital cost per acre of impervious area in 2012 dollars Annual operating and maintenance cost per acre of impervious area in 2012 dollars $65, $2, $26, $1,
176 b. The literature is providing the cost data on a basis of cost per acre of impervious area, however the model needs the BMP Cost input on a basis of ($/acre-ft) for capital cost and O & M cost on a basis of ($/year) so some modifications are needed. For the basis of this conversion, consider the rainfall on the pavement to all be treated; the buildings will also be considered to translate all the rainfall to runoff. Recall that the site is 2 acres with 40% building and 50% parking lot, thus 90% shall be considered as the Effective Impervious Area which is 1.8 acres. Capital cost per acre of impervious area in 2012 dollars Annual operating and maintenance cost per acre of impervious area in 2012 dollars Acres contributing to the BMP Capital cost in 2012 dollars Annual operating and maintenance cost in 2012 dollars $26, $1, $47, $1, c. Convert values to 2016 dollars using inflation calculator (see Appendix B). Table 1 Costs for pervious pavement in 2016 dollars Capital cost per acre of impervious area in 2016 dollars Annual operating and maintenance cost per acre of impervious area in 2016 dollars Acres contributing to the BMP Capital cost in 2016 dollars Annual operating and maintenance cost in 2016 dollars $27, $1, $49, $2, e. The model is in terms of $/acre-ft of water treated thus a volume calculation needs to be made. The area used for this calculation is the actual area of pervious pavement, 1 acre. The depth used is the Storage provided in specified pervious pavement system from the Pervious Pavement worksheet (2.970 inches). 166
177 Storage volume is 2.97 inches * 1 ft/12 inches * 1 acre = acre-feet Convert capital cost to $/(Acre-ft) in 2016 dollars $49, / acre-feet = $200, per acre-feet e. Enter capital cost and operating cost data into model. 6. Fill in the remaining fields in the Life Cycle Cost Comparison Worksheet (see Figure 152). a. For What type of analysis would you like to perform select Net Present Worth b. The most recent interest rate value published by the World Bank is for the year 2014 so we will use this value, which is 1.8%. c. Problem statement gave life span as 20 years; assume the project duration is the same since not otherwise stated. d. Leave BMP Fixed Cost blank since the source cost data had the Fixed Data and BMP Cost combined into a single value. e. Leave Estimated Future Cost of Replacement blank since the Project Duration and Expected Lifespan are the same. f. Leave Cost Land needed for BMP blank because according to the data for scenario 1, no additional land is needed. g. Enter the Scenario # h. Click Perform Cost Analysis 167

178 Figure Life Cycle Cost Comparison Worksheet 7. The resulting Life Cycle Cost Analysis Summary Capital Cost and Life Cycle Cost of N and P Removed figures and table will be created for Scenario 1 (see Figure 153). 168
179 Figure 153 Life Cycle Cost Analysis Summary 8. Return to the Stormwater Treatment Analysis worksheet. 169
180 Treatment Train Scenario 2 The pervious concrete area, retention basin volume, and additional land required for Scenario 2 is presented in Table 2. Table 2 Scenario 2 BMP Characteristics Pervious Concrete Retention Basin Volume Additional Land Scenario Area [ac] [ac-ft] Required [ac] Select the BMP from the list and enter the information into the tab as you did in Step 3; however, this time you will also have to enter information for the retention basin. a. The information you previously entered for Pervious Pavement should still be in the cells and you will only need to change the value for Area of the pervious pavement system. If the values are not in the cells, re-enter them as you did in Step 3 (using the new area value) (see Figure 154). 170

181 Figure Pervious Pavement BMP worksheet 171

182 Figure Retention Basin BMP worksheet *The problem stated that the provided retention volume for this scenario is acre-ft acre-ft. Use an iterative guess and check approach by entering in a Provided retention depth and seeing if the Retention volume based on retention depth and Total area BMP area becomes the desired value of ac-ft. (see Figure 155). 172
.")
183 10. Click Catchments and Treatment Summary Results to see if the design meets criteria. If it does not pass, then go back and adjust the BMP inputs until it passes (see Figure 156). Figure Catchments and Treatment Summary Results Scenario 2, Costs 11. Click Go to Cost Analysis Worksheet (Figure 157). 173
![Figure 157 - Life Cycle Cost Comparison Worksheet *For pervious pavement, use the BMP Cost [$/acre-ft] and Estimated Annual BMP Maintenance Cost determined in Scenario 1 for Scenario 2; both of](/docs-images/71/65788931/images/184-0.jpg "these are based on the area of impervious area being treated and as stated in Scenario 1 the entire paved and building covered area is being considered impervious for the purpose of cost estimate.")
184 Figure Life Cycle Cost Comparison Worksheet *For pervious pavement, use the BMP Cost [$/acre-ft] and Estimated Annual BMP Maintenance Cost determined in Scenario 1 for Scenario 2; both of these are based on the area of impervious area being treated and as stated in Scenario 1 the entire paved and building covered area is being considered impervious for the purpose of cost estimate. 174
185 a. Table 3 provides capital cost data on a volumetric basis (cubic feet) of water treated for retention basins, the operating cost can be calculated as a percentage of capital cost. Capital cost of $0.7/cubic ft (1997 dollars) Operating cost of 3% of capital cost. 1 acre-foot = ft 3 From Cost sheet: Treatment Volume = Use the Inflation Calculator (see appendix B) to adjust to 2016 dollars. b. Calculate the capital and operating costs. Table 3 Retention basin costs Capital cost per cubic foot of treated water in 1997 dollars Capital cost per acre-foot of treated water in 1997 dollars Capital cost per acre-foot of treated water in 2016 dollars $0.70 $30, $45, c. Enter capital cost and operating cost data into model. The best way to calculate and enter the operating cost is in the model cell for Estimated Annual BMP Maintenance Cost; create a formula to multiply the BMP capital Cost by 3%). 12. Fill in the remaining fields (see Figure ). a. For What type of analysis would you like to perform select Net Present Worth? b. The most recent interest rate value published by the World Bank is for the year 2014 so we will use this value, which is 1.8%. c. Problem statement gave life span as 20 years; assume the project duration is the same since not otherwise stated. d. Leave BMP Fixed Cost blank since the source cost data had the Fixed Data and BMP Cost combined into a single value. 175

186 e. Leave Estimated Future Cost of Replacement blank since the Project Duration and Expected Lifespan are the same. f. Leave Cost Land needed for BMP blank because according to the data for scenario 2, no additional land is needed. g. Enter the Scenario # Figure Updated Life Cycle Cost Comparison Worksheet 176
187 Figure 158 -Life Cycle Cost Analysis Summary 13. Return to the Stormwater Treatment Analysis worksheet 177
188 Treatment Train Scenario 3 The pervious concrete area, retention basin volume, and additional land required for Scenario 3 is presented in Table 4. Table 4 Scenario 3 BMP Characteristics Pervious Concrete Retention Basin Volume Additional Land Scenario Area [ac] [ac-ft] Required [ac] Select the BMP from the list and enter the information into the tab as you did in Step 3; however, this time you will also have to enter information for the retention basin. 178
189 a. The information you previously entered for Pervious Pavement should still be in the cells and you will only need to change the value for Area of the pervious pavement system. If the values are not in the cells, re-enter them as you did in Step 3 (using the new area value) (see Figure ). Figure Pervious Pavement BMP worksheet 179

190 Figure Retention Basin BMP worksheet *The problem stated that the provided retention volume for this scenario is acre-ft. Use an iterative guess and check approach by entering in a Provided retention depth and seeing if the Retention volume based on retention depth and Total area BMP area becomes the desired value (see Figure ). 180

191 15. Click Catchment and Treatment Summary Results a. As seen in the Catchment and Treatment Summary Results, the Treatment Objectives or Target was not met. We will have to go back and adjust the parameters for one or both of the BMPs. b. Return to the Stormwater Treatment Analysis worksheet and click the Retention Basin Tab. Increase the Provided retention depth to in. This results in a corresponding Retention volume based on retention depth and total area BMP area of ac-ft. c. Return to the Stormwater Treatment Analysis worksheet and click Catchment and Treatment Summary Results. The Treatment Objectives have now been met (see Figure 161). Figure Catchments and Treatment Summary Results Scenario 3, Costs 16. Table 3 provides capital cost data on a volumetric basis (cubic feet) of water treated for retention basins, the operating cost is calculated as a percentage of capital cost. 181
192 a. For the retention basin use the same BMP Cost per acre-ft used in Scenario 2, no further data entry is need for capital cost. Additionally, just as in Scenario 2, multiply the formula for Estimated Annual BMP Maintenance Cost is still 3% of the capital BMP Cost. b. For pervious pavement, use the BMP Cost [$/acre-ft] and Estimated Annual BMP Maintenance Cost determined in Scenario 1 for Scenario 3; both of these are based on the area of impervious area being treated and as stated in Scenario 1 the entire paved and building covered area is being considered impervious for the purpose of cost estimate. 17. Fill in the remaining fields (see Figure 162). a. For What type of analysis would you like to perform select Net Present Worth b. The most recent interest rate value published by the World Bank is for the year 2014 so we will use this value, which is 1.8%. c. Problem statement gave life span as 20 years; assume the project duration is the same since not otherwise stated. d. Leave BMP Fixed Cost blank since the source cost data had the Fixed Data and BMP Cost combined into a single value. e. Leave Estimated Future Cost of Replacement blank since the Project Duration and Expected Lifespan are the same. f. Leave Cost Land needed for BMP blank because according to the data for scenario 3, no additional land is needed. g. Enter the Scenario # 182
.")
193 Figure Life Cycle Cost Comparison Worksheet 18. Perform the Cost Analysis (see Figure 163). 183

194 Figure Life Cycle Cost Analysis Summary 19. Return to the Stormwater Treatment Analysis worksheet. 184
195 Treatment Train Scenario 4 The pervious concrete area, retention basin volume, and additional land required for Scenario 4 is presented in Table 5. Table 5 Scenario 4 BMP Characteristics Pervious Concrete Retention Basin Volume Additional Land Scenario Area [ac] [ac-ft] Required [ac] Select the BMP from the list and enter the information into the tab as you did previously; however, this time also enter information for the retention basin. Note: when using pervious pavements, the runoff mass loadings are subtracted based on the size of the BMP and the area are not entered on the watershed characteristics page. 185
 (see Figure 164).")
196 a. The information you previously entered for Pervious Pavement should still be in the cells and you will only need to change the value for Area of the pervious pavement system. If the values are not in the cells, re-enter them as you did in Step 3 (using the new area value) (see Figure 164). Figure Pervious Pavement BMP worksheet 186

197 Figure Retention Basin BMP worksheet *The problem stated that the provided retention volume for this scenario is acre-ft. Use an iterative guess and check approach by entering in a Provided retention depth and seeing if the Retention volume based on retention depth and Total area BMP area becomes the desired value (see Figure 165). 187
198 21. Return to the Stormwater Treatment Analysis worksheet and click Catchment and Treatment Summary Results (see Figure 167). a. If the treatment objectives are not met, adjust the BMP inputs until it passes. Figure Catchments and Treatment Summary Results Scenario 4, Costs 22. This Scenario requires additional land. a. Based on a web site for land cost (Zillow, May 2016), 1 acre of land costs about $525,000. For this scenario, the cost to purchase additional land would be $38,325. b. For the retention basin use the same BMP Cost per acre-ft used in Scenario 2, no further data entry is need for capital cost. Additionally, just as in Scenario 2, multiply the formula for Estimated Annual BMP Maintenance Cost is still 3% of the capital BMP Cost. c. For pervious pavement, use the BMP Cost [$/acre-ft] and Estimated Annual BMP Maintenance Cost determined in Scenario 1 for the current Scenario; both of these are based on the area of impervious area being treated and as stated in Scenario 1 the entire 188
199 paved and building covered area is being considered impervious for the purpose of cost estimate. 23. Fill in the remaining fields. a. For What type of analysis would you like to perform select Net Present Worth? b. The most recent value published by the World Bank is for the year 2014 so we will use this value, which is 1.8%. c. Problem statement gave life span as 20 years; assume the project duration is the same since not otherwise stated. d. Leave BMP Fixed Cost blank since the source cost data had the Fixed Data and BMP Cost combined into a single value. e. Leave Estimated Future Cost of Replacement blank since the Project Duration and Expected Lifespan are the same. f. Leave Cost Land needed for BMP blank because according to the data for scenario 3, no additional land is needed. g. Enter the Scenario # 189

200 Figure Life Cycle Cost Comparison Worksheet 24. Perform Cost Analysis. 190

201 Figure Life Cycle Cost Analysis Summary 25. Return to Stormwater Treatment Analysis worksheet. 191
202 Treatment Train Scenario 5 The pervious concrete area, retention basin volume, and additional land required for Treatment Train Scenario 5 is presented in Table 6. Table 6 Scenario 5 BMP Characteristics Pervious Concrete Retention Basin Volume Additional Land Scenario Area [ac] [ac-ft] Required [ac] Select the BMP from the list and enter the information into the tab as you did in Step 3; however, this time you will also have to enter information for the retention basin. 192
 (see Figure 168).")
203 a. The information you previously entered for Pervious Pavement should still be in the cells and you will only need to change the value for Area of the pervious pavement system. If the values are not in the cells, re-enter them as you did in Step 3 (using the new area value) (see Figure 168). Figure Pervious Pavement BMP worksheet 193

204 Figure Retention Basin BMP worksheet *The problem stated that the provided retention volume for this scenario is acre-ft. Use an iterative guess and check approach by entering in a Provided retention depth and seeing if the Retention volume based on retention depth and Total area BMP area becomes the desired value (see Figure 169). 194
205 27. Return to the Stormwater Treatment Analysis worksheet and click Catchment and Treatment Summary Results (see Figure 170). a. If the treatment objectives are not met, adjust the BMP inputs until it passes. Figure Catchments and Treatment Summary Results Scenario 5, Costs 28. This Scenario requires additional land. a. Based on Zillow, May 2016, 1 acre of land costs about $525,000. For this scenario, the cost to purchase additional land would be $63,000. b. For the retention basin use the same BMP Cost per acre-ft used in Scenario 2, no further data entry is need for capital cost. Additionally, just as in Scenario 2, multiply the formula for Estimated Annual BMP Maintenance Cost is still 3% of the capital BMP Cost. c. For pervious pavement, use the BMP Cost [$/acre-ft] and Estimated Annual BMP Maintenance Cost determined in Scenario 1 for the current Scenario; both of these are based on the area of impervious area being treated and as stated in Scenario 1 the entire 195
206 paved and building covered area is being considered impervious for the purpose of cost estimate. 29. Fill in the remaining fields. a. For What type of analysis would you like to perform select Net Present Worth? b. The most recent value published by the World Bank is for the year 2014 so we will use this value, which is 1.8%. c. Problem statement gave life span as 20 years; assume the project duration is the same since not otherwise stated. d. Leave BMP Fixed Cost blank since the source cost data had the Fixed Data and BMP Cost combined into a single value. e. Leave Estimated Future Cost of Replacement blank since the Project Duration and Expected Lifespan are the same. f. Leave Cost Land needed for BMP blank because according to the data for scenario 3, no additional land is needed. g. Enter the Scenario # 196

207 Figure 173 Life Cycle Cost Comparison Worksheet 30. Perform Cost Analysis. 197

208 Figure 174 Life Cycle Cost Analysis Summary 31. Return to Stormwater Treatment Analysis worksheet. 198
209 Treatment Train Scenario 6 The pervious concrete area, retention basin volume, and additional land required for Scenario 6 is presented in Table 7. Table 7 Scenario 6 BMP Characteristics Pervious Concrete Retention Basin Volume Additional Land Scenario Area [ac] [ac-ft] Required [ac] Select the BMP from the list and enter the information into the tab as you did in Step 3; however, this time you will also have to enter information for the retention basin. 199
.")
210 a. The information you previously entered for Pervious Pavement should still be in the cells and you will need to change the value for Area of the pervious pavement system to 0.0 (see Figure 175 ). 5 Figure Pervious Pavement BMP worksheet 200

211 Figure Retention Basin BMP worksheet *The problem stated that the provided retention volume for this scenario is acre-ft. Use an iterative guess and check approach by entering in a Provided retention depth and seeing if the Retention volume based on retention depth and Total area BMP area becomes the desired value (see Figure 176). 201

212 33. Return to the Stormwater Treatment Analysis worksheet and click Catchment and Treatment Summary Results (see Figure 177). a. If the treatment objectives are not met, adjust the BMP inputs until it passes. Figure Catchments and Treatment Summary Results Scenario 6, Costs 34. This Scenario requires additional land. a. Based on Zillow, May 2016, 1 acre of land costs about $525,000. For this scenario, the cost to purchase additional land would be $89,775. b. For the retention basin use the same BMP Cost per acre-ft used in Scenario 2, no further data entry is need for capital cost. Additionally, just as in Scenario 2, multiply the formula for Estimated Annual BMP Maintenance Cost is still 3% of the capital BMP Cost. c. In Scenario 6 there is no pervious pavement present. 35. Fill in the remaining fields (see Figure 178). a. For What type of analysis would you like to perform select Net Present Worth 202
213 b. The most recent value published by the World Bank is for the year 2014 so we will use this value, which is 1.8%. c. Problem statement gave life span as 20 years; assume the project duration is the same since not otherwise stated. d. Leave BMP Fixed Cost blank since the source cost data had the Fixed Data and BMP Cost combined into a single value. e. Leave Estimated Future Cost of Replacement blank since the Project Duration and Expected Lifespan are the same. f. Leave Cost Land needed for BMP blank because according to the data for scenario 3, no additional land is needed. g. Enter the Scenario # 203

214 Figure Life Cycle Cost Comparison Worksheet 36. Perform Cost Analysis (see Figure 179). 204

215 Figure Life Cycle Cost Analysis Summary 37. As seen in the Life Cycle Cost Analysis Summary, Scenario 3 is the most cost effective treatment method of the six scenarios. Scenario 3 utilizes 0.65 acres of pervious concrete and a retention basin with a volume of acre-feet. In Scenario 3, purchasing additional land is not required. 205
216 Appendix A EMCs and Land Use These are the 2016 Event Mean Concentration (EMC) values and are based on the arithmetic mean for the data collected. They are identified by land use, thus a description for each land use is presented. In addition, Florida Land Use Codes and Classification System (FLUCCS) descriptions are listed and related to the land use descriptions used within this Manual and Model. The user is encouraged to review the definitions of land use and FLUCCS. LAND USE CATEGORY TN TP Agricultural - Citrus: TN=2.240 TP= Agricultural - General: TN=2.800 TP= Agricultural - Pasture: TN=3.510TP= Agricultural - Row Crops: TN=2.650 TP= Conventional Roofs: TN=1.050 TP= High-Intensity Commercial: TN=2.40 TP= Highway: TN=1.520 TP= Light Industrial: TN=1.200 TP= Low-Density Residential: TN=1.645 TP= Low-Intensity Commercial: TN=1.13 TP= Mining / Extractive: TN=1.180 TP= Multi-Family: TN=2.320 TP= Single-Family: TN=2.070 TP= Undeveloped - Dry Prairie: TN=2.025 TP= Undeveloped - Marl Prairie: TN=0.684 TP= Undeveloped - Mesic Flatwoods: TN=1.09 TP= Undeveloped - Ruderal/Upland Pine: TN=1.694 TP= Undeveloped - Scrubby Flatwoods: TN=1.155 TP= Undeveloped - Upland Hardwood: TN=1.042 TP= Undeveloped - Upland Mix Forest: TN=0.606 TP= Undeveloped - Wet Flatwoods: TN=1.213 TP= Undeveloped - Wet Prairie: TN=1.095 TP= Undeveloped - Xeric Scrub: TN=1.596 TP= Apopka Open Space/Recreation/Fallow Crop: TN=1.100 TP= Apopka Forests/Abandoned Tree Crops: TN=1.250 TP= Rangeland/Parkland: TN=1.150 TP= Undeveloped natural communities: TN=1.22 TP= GIS Import Data User Defined 206
217 GENERAL LAND USE CATEGORIES FOR RUNOFF CHARACTERIZATION DATA GENERAL CATEGORY Low-Density Residential Single-Family Residential Multi-Family Residential Low-Intensity Commercial High-Intensity Commercial Industrial Highway Agriculture Open/ Undeveloped Mining/ Extractive Wetlands Open Water/ Lakes DESCRIPTION Rural areas with lot sizes greater than 1 acre or less than one dwelling unit per acre; internal roadways associated with the homes are also included Typical detached home community with lot sizes generally less than 1 acre and dwelling densities greater than one dwelling unit per acre; duplexes constructed on one-third to onehalf acre lots are also included in this category; internal roadways associated with the homes are also included Residential land use consisting primarily of apartments, condominiums, and cluster-homes; internal roadways associated with the homes are also included Areas which receive only a moderate amount of traffic volume where cars are parked during the day for extended periods of time; these areas include universities, schools, professional office sites, and small shopping centers; internal roadways associated with the development are also included Land use consisting of commercial areas with high levels of traffic volume and constant traffic moving in and out of the area; includes downtown areas, commercial sites, regional malls, and associated parking lots; internal roadways associated with the development are also included Land uses include manufacturing, shipping and transportation services, sewage treatment facilities, water supply plants, and solid waste disposal; internal roadways associated with the development are also included Includes major road systems, such as interstate highways and major arteries and thoroughfares; roadway areas associated with residential, commercial, and industrial land use categories are already included in loading rates for these categories Includes cattle, grazing, row crops, citrus, and related activities Includes open space, barren land, undeveloped land which may be occupied by native vegetation, rangeland, and power lines; this land does not include golf course areas which are heavily fertilized and managed; golf course areas have runoff characteristics most similar to single-family residential areas Includes a wide variety of mining activities for resources such as phosphate, sand, gravel, clay, shell, etc. Include a wide range of diverse wetland types, such as hardwood wetlands, cypress stands, grassed wetlands, freshwater marsh, and mixed wetland associations Land use consists of open water and lakes, rivers, reservoirs, and other open waterbodies 207
218 Excerpt from document titled Refining the Indian River Lagoon TMDL Technical Memorandum Report: Assessment and Evaluation of Model Input Parameters Final Report; Prepared by Harvey Harper, Environmental Research & Design, Inc.; July This is a summary of the Level III FLUCCS code assignments to consolidated land use categories with Event Mean Concentrations GENERAL/ EMC FLUCCS CODE LAND USE DESCRIPTION CONSOLIDATED LAND USE LAND USE I.D. NUMBER 2300 Feeding Operations Agriculture AG - GENERAL 2310 Cattle Feeding Operations Agriculture AG - GENERAL 2320 Poultry feeding operations Agriculture AG - GENERAL 2340 Other feeding operations Agriculture AG - GENERAL 2400 Nurseries and Vineyards Agriculture AG - GENERAL 2410 Tree nurseries Agriculture AG - GENERAL 2420 Sod farms Agriculture AG - GENERAL 2430 Ornamentals Agriculture AG - GENERAL 2431 Shade ferns Agriculture AG - GENERAL 2432 Hammock ferns Agriculture AG - GENERAL 2450 Floriculture Agriculture AG - GENERAL 2500 Specialty Farms Agriculture AG - GENERAL 2510 Horse Farms Agriculture AG - GENERAL 2520 Dairies Agriculture AG - GENERAL 2590 Other Specialty Farms Agriculture AG - GENERAL 2200 Tree Crops Citrus AG - CITRUS 2210 Citrus groves Citrus AG - CITRUS 2220 Fruit Orchards Citrus AG - CITRUS 1400 Commercial and Services Commercial HIGH INTENSITY COMMERCIAL 208
219 1410 Retail Sales and Services Commercial HIGH INTENSITY COMMERCIAL 1420 Wholesale Sales and Services <Excluding warehouses associated with industrial use> Commercial LOW INTENSITY COMMERCIAL 1430 Professional Services Commercial LOW INTENSITY COMMERCIAL 1440 Cultural and Entertainment Commercial LOW INTENSITY COMMERCIAL 1450 Tourist Services Commercial HIGH INTENSITY COMMERCIAL 1470 Mixed Commercial and Services Commercial LOW INTENSITY COMMERCIAL 1490 Commercial and Services Under Construction Commercial LOW INTENSITY COMMERCIAL 8130 Bus and truck terminals Commercial HIGH INTENSITY COMMERCIAL 8150 Port facilities Commercial HIGH INTENSITY COMMERCIAL 8160 Canals and Locks Commercial LOW INTENSITY COMMERCIAL 8180 Auto parking facilities - when not directly related to other land uses Commercial LOW INTENSITY COMMERCIAL 3100 Herbaceous Dry Prairie Dry Prairie DRY PRAIRIE* 3210 Palmetto Prairies Dry Prairie DRY PRAIRIE* 3211 Palmetto-Oak Shrubland Dry Prairie DRY PRAIRIE* 3212 Dry Prairie Dry Prairie DRY PRAIRIE* 3220 Coastal Strand Dry Prairie DRY PRAIRIE* 3300 Mixed Rangeland Dry Prairie DRY PRAIRIE* 1300 Residential, High-Density High-Density Residential MULTI FAMILY RES 1310 Fixed Single Family Units High-Density Residential SINGLE FAMILY RES 1330 Residential, High-Density; Multiple Dwelling Units, Low Rise <Two stories or less> High-Density Residential MULTI FAMILY RES 1340 Residential, High-Density; Multiple Dwelling Units, High Rise <Three stories or more> High-Density Residential MULTI FAMILY RES 1350 Residential, High-Density; Mixed Units <Fixed and mobile Homes> High-Density Residential MULTI FAMILY RES 1390 High-Density Under Construction High-Density Residential MULTI FAMILY RES 6181 Cabbage palm hammock Hydric Hammock HYDRIC HAMMOCK* 209
220 6182 Cabbage palm savannah Hydric Hammock HYDRIC HAMMOCK* 1460 Oil and Gas Storage(except industrial use or manufacturing) Industrial INDUSTRIAL 1500 Industrial Under Construction Industrial INDUSTRIAL 1510 Food Processing Industrial INDUSTRIAL 1520 Timber Processing Industrial INDUSTRIAL 1530 Mineral Processing Industrial INDUSTRIAL 1540 Oil and Gas Processing Industrial INDUSTRIAL 1550 Other Light Industrial Industrial INDUSTRIAL 1560 Other Heavy Industrial Industrial INDUSTRIAL 1561 Ship Building and Repair Industrial INDUSTRIAL 1562 Pre-stressed concrete plants Industrial INDUSTRIAL 1590 Industrial Under Construction Industrial INDUSTRIAL 2540 Aquaculture Industrial INDUSTRIAL 8200 Communications Industrial INDUSTRIAL 8220 Communication Facilities Industrial INDUSTRIAL 8300 Utilities Industrial INDUSTRIAL 8310 Electrical power facilities Industrial INDUSTRIAL 8330 Water supply plants Industrial INDUSTRIAL 8340 Sewage Treatment Industrial INDUSTRIAL 8350 Solid waste disposal Industrial INDUSTRIAL 8360 Other treatment ponds Industrial INDUSTRIAL 8390 Utilities under construction Industrial INDUSTRIAL 210
221 GENERAL/ CONSOLIDATED FLUCCS CODE LAND USE DESCRIPTION CONSOLIDATED LAND USE LAND USE I.D. NUMBER 1700 Institutional (Educational, religious, health and military facilities) Institutional LOW INTENSITY COMMERCIAL 1710 Educational Facilities Institutional LOW INTENSITY COMMERCIAL 1720 Religious Institutional LOW INTENSITY COMMERCIAL 1730 Military Institutional LOW INTENSITY COMMERCIAL 1740 Medical and Health Care Institutional LOW INTENSITY COMMERCIAL 1750 Governmental Institutional LOW INTENSITY COMMERCIAL 1770 Other Institutional Institutional LOW INTENSITY COMMERCIAL 1780 Commercial Child Care Institutional LOW INTENSITY COMMERCIAL 1790 Institutional Under Construction Institutional LOW INTENSITY COMMERCIAL 8110 Airports Institutional LOW INTENSITY COMMERCIAL 1100 Residential, Low-Density-Less than two dwelling units/acre Low-Density Residential LOW DENSITY RES 1110 Fixed Single Family Units Low-Density Residential SINGLE FAMILY RES 1180 Residential, Rural < or = 0.5 dwelling units/acre Low-Density Residential LOW DENSITY RES 1190 Low-Density Under Construction Low-Density Residential LOW DENSITY RES 1200 Residential, Medium-Density (Two-five dwelling units per acre) Medium-Density Residential SFR OR MFR DEPENDING ON UNITS 1210 Fixed Single Family Units Medium-Density Residential SINGLE FAMILY RES 1290 Medium-Density Under Construction Medium-Density Residential SFR OR MFR DEPENDING ON UNITS 6250 Hydric pine flatwoods Mesic Flatwoods MESIC FLATWOODS* 1600 Extractive Mining MINING 1610 Strip Mines Mining MINING 211
222 1611 Clays Mining MINING 1620 Sand and Gravel Pits Mining MINING 1632 Limerock or dolomite quarries Mining MINING 1633 Phosphate quarries Mining MINING 1650 Reclaimed Land Mining MINING 1660 Holding Ponds Mining MINING 1320 Mobile Home Units High-Density Residential MULTI FAMILY RES 1810 Swimming Beach Open UNDEVELOPED 1900 Open Land Open UNDEVELOPED 1920 Inactive Land with street patterns but without structures Open UNDEVELOPED 2600 Other Open Lands - Rural Open UNDEVELOPED 2610 Fallow cropland Open UNDEVELOPED 7100 Beaches other than swimming beaches Open UNDEVELOPED 7200 Sand other than beaches Open UNDEVELOPED 7340 Exposed rocks Open UNDEVELOPED 7400 Disturbed land Open UNDEVELOPED 7410 Rural land in transition without positive indicators of intended activity Open UNDEVELOPED 7430 Spoil areas Open UNDEVELOPED 8120 Railroads Open UNDEVELOPED 8320 Electrical power transmission lines Open UNDEVELOPED 9999 (blank) Open UNDEVELOPED 2110 Improved Pasture Pasture PASTURE 2120 Unimproved Pastures Pasture PASTURE 2130 Woodland Pasture Pasture PASTURE 1480 Cemeteries Recreational 1 AVERAGE OF SFR + UNDEVELOPED 1800 Recreational Recreational 1 AVERAGE OF SFR + UNDEVELOPED 1820 Golf Course Recreational 1 AVERAGE OF SFR + UNDEVELOPED 1840 Marinas and Fish Camps Recreational 1 AVERAGE OF SFR + UNDEVELOPED 212
223 8115 Grass Airports Recreational 1 AVERAGE OF SFR + UNDEVELOPED 1830 Race Tracks(horse, dog, car, motorcycle) Recreational 2 AVERAGE OF MFR+UNDEVELOPPED 1850 Parks and Zoos Recreational 2 AVERAGE OF MFR+UNDEVELOPPED 1860 Community Recreational Facilities Recreational 2 AVERAGE OF MFR+UNDEVELOPPED 1870 Stadiums (not associated with high schools, colleges, or universities) Recreational 2 AVERAGE OF MFR+UNDEVELOPPED 1890 Other Recreational(Riding stables, go-cart tracks, skeet ranges, etc) Recreational 2 AVERAGE OF MFR+UNDEVELOPPED 2140 Row Crops Row Crops ROW CROPS 2150 Field Crops Row Crops ROW CROPS 2160 Mixed Crops Row Crops ROW CROPS 2240 Abandoned tree crops Ruderal RUDERAL UPLAND PINE* 4220 Brazilian Pepper Ruderal RUDERAL UPLAND PINE* 4430 Forest regeneration Ruderal RUDERAL UPLAND PINE* 3200 Shrub and Brushland Scrub SCRUBBY FLATWOODS* 4130 Sand pine Scrub XERIC SCRUB* 8100 Transportation Transportation HIGHWAY 8140 Roads and Highways Transportation HIGHWAY 8191 Highways Transportation HIGHWAY 213
224 GENERAL/ CONSOLIDATED FLUCCS CODE LAND USE DESCRIPTION CONSOLIDATED LAND USE LAND USE I.D. NUMBER 4111 Mesic longleaf pine flatwoods Upland Flatwoods MESIC FLATWOODS* 4112 Scrubby Pine flatwoods Upland Flatwoods MESIC FLATWOODS* 4200 Upland Hardwood Forest Upland Flatwoods MESIC FLATWOODS* 4340 Hardwood Conifer Mixed Upland Flatwoods MESIC FLATWOODS* 4120 Longleaf pine - xeric oak Upland Mixed UPLAND MIXED FOREST* 4140 Upland Mixed Forest Upland Mixed UPLAND MIXED FOREST* 4270 Maritime Hammock Upland Mixed UPLAND MIXED FOREST* 4271 Coastal Temperate Hammock Upland Mixed UPLAND MIXED FOREST* 4272 Prairie Hammock Upland Mixed UPLAND MIXED FOREST* 4275 Red Cedar- Cabbage Palm Hammock Upland Mixed UPLAND MIXED FOREST* 4300 Upland Hardwood Forests Continued Upland Mixed UPLAND MIXED FOREST* 4400 Tree Plantations Upland Mixed UPLAND MIXED FOREST* 5474 Spoil islands/coastal islands Upland Mixed UPLAND MIXED FOREST* 5100 Streams and waterways Water WATER 5120 Channelized waterways, canals Water WATER 5200 Lakes Water WATER 5201 Pond Water WATER 5250 Marshy Lakes Water WATER 5300 Reservoirs Water WATER 5330 Reservoirs larger >10 <100 acres water WATER 5400 Bays and estuaries Water WATER 5410 Embayments opening directly to the Gulf or Ocean Water WATER 214
225 5430 Enclosed saltwater ponds within a salt marsh Water WATER 5500 Major Springs Water WATER 5600 Slough Waters water WATER 5710 Atlantic Ocean Water WATER 7420 Borrow areas Water WATER 8370 Surface Water Collection Basin Water WATER 4110 Pine flatwoods Wet Flatwoods WET FLATWOODS* 4113 Hydric pine flatwoods Wet Flatwoods WET FLATWOODS* 4260 Tropical Hardwood Hammock Wet Flatwoods WET FLATWOODS* 4280 Cabbage palm Wet Flatwoods WET FLATWOODS* 6172 Mixed Shrubs Wet Prairies WET PRAIRIE* 6430 Wet prairies Wet Prairies WET PRAIRIE* 6110 Bay swamps Wetland WETLAND* 6120 Mangrove swamp Wetland WETLAND* 6150 Lowland Harwdood Forest/Swamp Wetland WETLAND* 6151 Willow Swamp Wetland WETLAND* 6152 Red Maple Swamp Wetland WETLAND* 6153 Shrub Swamp Wetland WETLAND* 6170 Mixed wetland hardwoods Wetland WETLAND* 6210 Cypress Wetland WETLAND* 6220 Pond pine Wetland WETLAND* 6300 Wetland Forested Mixed Wetland WETLAND* 6400 Freshwater marshes Wetland WETLAND* 6410 Freshwater marshes Wetland WETLAND* 6411 Sawgrass marsh Wetland WETLAND* 6412 Cattail marsh Wetland WETLAND* 6414 Graminoid marsh Wetland WETLAND* 6416 Flag marsh Wetland WETLAND* 6420 Saltwater marshes Wetland WETLAND* 6423 Low salt marsh Wetland WETLAND* 215
226 6424 High salt marsh Wetland WETLAND* 6440 Emergent aquatic vegetation Wetland WETLAND* 6460 Mixed scrub-shrub wetland Wetland WETLAND* 6500 Non-vegetated Wetland Wetland WETLAND* 6510 Tidal creek Wetland WETLAND* 6200 Wetland Coniferous Forest Wetland WETLAND* 4210 Xeric oak Xeric Hammock XERIC HAMMOCK* 4321 Xeric Oak Scrub Xeric Hammock XERIC HAMMOCK* 4322 Xeric Hammock Xeric Hammock XERIC HAMMOCK* 4370 Australian pine Xeric Hammock XERIC HAMMOCK* 4410 Coniferous pine Xeric Hammock XERIC HAMMOCK* * Can always use the general undeveloped/rangeland/forest EMCs instead Further descriptions of the natural communities follow to aid in FLUCCS and Land use assignment 216
227 Natural Community Name Dry Prairie Synonyms Description Location Soils - palm savannah - palmetto prairie - pineland - treeless range Flatland with sand substrate; mesic-xeric; subtropical or temperate nearly treeless plain with a dense ground cover of wiregrass, saw palmetto, and other grasses, herbs, and low shrubs. Other typical plants include broomsedge, carpet grass, runner oak, Indian grass, love grass, blazing star, rabbit tobacco, pine lily, marsh pink, milkwort, goldenrod, musky mint, pawpaw, dwarf wax myrtle, gallberry, stagger bush, fetterbush, and dwarf blueberry. Dry Prairie is closely associated with and often grades into Wet Prairie or Mesic. Occurs on relatively flat, moderately to poorly drained terrain. Dry Prairie is very similar to Mesic Flatwoods in most respects, except that pines and palms are absent or at a density below one tree per acre. Dry Prairies are apparently endemic to Florida and largely confined to a few regions of the State. Soils typically consist of 1 to 3 feet of acidic sands generally overlying an organic hardpan or clayey subsoil. The hardpan substantially reduces the movement of water below and above its surface, such that Dry Prairies may become flooded for short periods during rainy seasons. The normal water table is several inches to several feet below the surface FLUCCS Code/Name 321/Palmetto Prairies 310/Herbaceous 217
228 Natural Community Name Hydric Hammock Synonyms Description Location Soils - wetland hardwood hammock - wet hammock A well-developed hardwood and cabbage palm forest with a variable understory often dominated by palms and ferns. Typical plants include cabbage palm, diamond-leaf oak, red cedar, red maple, swamp bay, sweetbay, water oak, southern magnolia, wax myrtle, saw palmetto, bluestem palmetto, needle palm, poison ivy, dahoon holly, myrsine, hackberry, sweetgum, loblolly pine, Florida elm, swamp chestnut oak, American hornbeam, Hydric Hammock occurs as patches in a variety of lowland situations, often in association with springs or karst seepage, and in extensive forests covering lowlands just inland of coastal communities. Hydric Hammock occurs on low, flat, wet sites where limestone may be near the surface. Hydric Hammock generally grades into Floodplain Swamp, Strand Swamp, Basin Swamp, Baygall, Wet Flatwoods, Coastal Berm, Maritime Hammock, Slope Forest, Upland Mixed Forest, or Upland Hardwood Forest. Hydric Hammock is often difficult to differentiate from Bottomland Forest, Prairie Hammock, and Floodplain Forest. Soils are sands with considerable organic material that, although generally saturated, are inundated only for short periods following heavy rains FLUCCS Code/Name 617/Mixed Wetland Hardwoods 218
229 Natural Community Name Marl Prairie Synonyms Description Location Soils - Scrub cypress - marl flat - sedge flat - spikerush marsh - cypress savannah - coastal prairie - coastal marsh - dwarf cypress savannah Sparsely vegetated flatland with marl over limestone substrate; seasonally inundated; Dominant plants include muhly grass, sawgrass, spikerush, bluestem, beakrush, shoregrass, and pond cypress. Although generally a system of sedges, grasses, and grass-like plants of varying heights and densities, widely scattered, stunted cypress or mangrove trees are often present. Marl Prairies are sparsely vegetated seasonal marshes on flatlands along the interface between deeper wetlands and coastal or upland communities where limestone is near the surface. Marl Prairies are limited to south Florida and have several species endemic to the state. Several very large examples of this NC occur in the Everglades National Park and in Big Cypress National Preserve. Highly alkaline marl soils are from 2 inches to 3.5 feet thick and are fine gray or white muds. The most extensive types are freshwater Perrine marl, and Marine aragonite The substrate may be concrete-like in the winter and spring dry seasons but soft and, slippery when wet. The soils are seasonally flooded but the hydroperiod is highly variable. Marl Prairies are found mostly on coastal sites and may grade into Wet Prairies or Wet Flatwoods. FLUCCS Code/Name 621/Cypress 641/Freshwater Marshes 219
230 Natural Community Name Mesic Flatwoods Synonyms Description Location Soils - pine/palmetto - meso-hydrophytic forest - pine flatwoods - pine savannahs - pine barrens Mesic Flatwoods are characterized as an open canopy forest of widely spaced pine trees with little or no understory but a dense ground cover of herbs and shrubs. Flatland with sand substrate; mesic; subtropical or temperate; frequent fire; slash pine and/or longleaf pine with saw palmetto, gallberry and/or wiregrass or cutthroat grass Understory. Another important physical factor in Mesic Flatwoods is fire several species depend on fire for their continued existence. Mesic Flatwoods are the most widespread biological community in Florida, occupying an estimated 30 to 50% of the state's uplands. Mesic Flatwoods occur on relatively flat, moderately to poorly drained terrain. Mesic Flatwoods are closely associated with and often grade into Wet Flatwoods, Dry Prairie, or Scrubby Flatwoods. The differences between these communities are generally related to minor topographic changes. Wet Flatwoods occupy the lower wetter areas, while Scrubby Flatwoods occupy the higher drier areas. The soils typically consist of 1-3 feet of acidic sands generally overlying an organic hardpan or clayey subsoil. The hardpan substantially reduces the percolation of water below and above its surface. During the rainy seasons, water frequently stands on the hardpan's surface and briefly inundates much of the flatwoods FLUCCS Code/Name 411/Pine Flatwoods 414/Pine - Mesic Oak 428/Cabbage Palm 220
231 Natural Community Name Ruderal/Upland Pine Forest Synonyms Description Location Soils - longleaf pine wiregrass - longleaf pine upland forest - loblolly - shortleaf pine upland forest - clay hills - high pineland Upland Pine Forest is characterized as a rolling forest of widely spaced pines with few understory shrubs and a dense ground cover of grasses and herbs. Pristine areas are dominated by longleaf pine and wiregrass. Other typical plants include southern red oak, runner oak, bluejack oak, blackjack oak, post oak, sassafras, black cherry, gallberry, persimmon, mockernut hickory, twinflower, huckleberry, dangleberry, goldenrod. Upland Pine Forest occurs on the rolling hills of extreme northern Florida.. The soils are composed of sand with variable, sometimes substantial, amounts of Miocene clays. The resultant prevalence of clays helps retain soil moisture. Thus, many plants which previously were restricted to valleys and other low areas may now inhabit the Upland Pine Forests FLUCCS Code/Name 414/Pine - Mesic Oak 423/Oak - Pine - Hickory 221
232 Natural Community Name Scrubby Flatwoods Synonyms Description Location Soils - xeric flatwoods - dry flatwoods Scrubby Flatwoods Are characterized as an open canopy forest of widely scattered pine trees with a sparse shrubby understory and numerous areas of barren white sand. The vegetation is a combination of Scrub and Mesic Flatwoods species; Scrubby Flatwoods often occupy broad transitions or ecotones between these communities. Typical plants include longleaf pine, slash pine, sand live oak, Chapman's oak, myrtle oak, scrub oak, saw palmetto, staggerbush, wiregrass, dwarf blueberry, gopher apple, rusty lyonia, tarflower, golden-aster, lichens, silkbay, garberia, huckleberry, goldenrod, runner oak, pinweeds, and frostweed. Scrubby Flatwoods generally occur intermingled with Mesic Flatwoods along slightly elevated relictual sandbars and dunes. The elevated, deeper sandy soils of scrubby flatwoods engender a drier environment than the surrounding mesic flatwoods, the general sparsity of ground vegetation and the greater proportion of relatively incombustible scruboak leaf litter reduces the frequency of naturally occurring fires. Scrubby Flatwoods are associated with and often grade into Mesic Flatwoods, Scrub, Dry Prairie or Sandhills. The white sandy soil is several feet deep and drains rapidly. However, the water table is unlikely to be very deep. Scrubby Flatwoods normally do not flood even under extremely wet conditions. FLUCCS Code/Name 411/Pine Flatwoods 419/Other Pines 222
233 Natural Community Name Upland Mixed Forest Synonyms Description Location Soils - southern deciduous forest - southern mixed forest - mesic hammock -climax hardwoods -upland hardwoods - beech-magnolia climax - oak-magnolia climax - pine-oak-hickory association - southern mixed hardwoods - clay hills hammocks - Piedmont forest Upland Hardwood Forests and Upland Mixed Forests are characterized as welldeveloped, closed canopy forests of upland hardwoods on rolling hills. These communities have quite similar physical environments and share many species, including southern magnolia, pignut hickory, sweetgum, Florida maple, devil's walking stick, redbud, flowering dogwood, Carolina holly, American holly, spruce pine, loblolly pine, live oak, and swamp chestnut oak. The primary difference between these communities is that Upland Mixed Forests generally lack shortleaf pine, American beech and other more northern species. The canopy is densely closed, except during winter in areas where deciduous trees predominate. Location of this community is predominantly a result of minor climatic differences, Upland Hardwood Forests being most common in northern panhandle Florida, and Upland Mixed Forests being most common in northern and central peninsula Florida. Upland Hardwood and Mixed Forests occur on rolling hills that often have limestone or phosphatic rock near the surface and occasionally as outcrops. associated with and grade into Upland Pine Forest, Slope Forest, or Xeric Hammock. Soils are generally sandy-clays or clayey sands with substantial organic and often calcareous components. The topography and clayey soils increase surface water runoff, although this is counterbalanced by the moisture retention properties of clays and by the often thick layer of leaf mulch which helps conserve soil moisture and create decidedly mesic conditions. FLUCCS Code/Name 414/Pine - Mesic Oak 423/Oak - Pine Hickory 425/Temperate Hardwood 434/Hardwood - Conifer Mixed 438/Mixed Hardwoods 223
234 Natural Community Name Upland Hardwood Forest Synonyms Description Location Soils - southern deciduous forest - southern mixed forest - mesic hammock -climax hardwoods -upland hardwoods - beech-magnolia climax - oak-magnolia climax - pine-oak-hickory association - southern mixed hardwoods - clay hills hammocks - Piedmont forest Upland Hardwood Forests and Upland Mixed Forests are characterized as welldeveloped, closed canopy forests of upland hardwoods on rolling hills. These communities have quite similar physical environments and share many species, including southern magnolia, pignut hickory, sweetgum, Florida maple, devil's walking stick, redbud, flowering dogwood, Carolina holly, American holly, spruce pine, loblolly pine, live oak, and swamp chestnut oak. The primary difference between these communities is that Upland Mixed Forests generally lack shortleaf pine, American beech and other more northern species. The canopy is densely closed, except during winter in areas where deciduous trees predominate. Location of this community is predominantly a result of minor climatic differences, Upland Hardwood Forests being most common in northern panhandle Florida, and Upland Mixed Forests being most common in northern and central Peninsula Florida. Upland Hardwood and Mixed Forests occur on rolling hills that often have limestone or phosphatic rock near the surface and occasionally as outcrops. associated with and grade into Upland Pine Forest, Slope Forest or Xeric Hammock. Soils are generally sandy-clays or clayey sands with substantial organic and often calcareous components. The topography and clayey soils increase surface water runoff, although this is counterbalanced by the moisture retention properties of clays and by the often thick layer of leaf mulch which helps conserve soil moisture and create decidedly mesic conditions. FLUCCS Code/Name 431/Beech Magnolia 434/Hardwood - Conifer Mixed 438/Mixed Hardwoods 224
235 Natural Community Name Wet Flatwoods Synonyms Description Location Soils - hydric flatwoods - pine savannah - cabbage palm/ pine savannah - moist pine barrens - low flatwoods - pond pine flatwoods - pocosin, Located in flatland with sand substrate; seasonally inundated; subtropical or temperate; frequent fire; Wet Flatwoods are characterized as relatively open-canopy forests of scattered pine trees or cabbage palms with either thick shrubby understory and very sparse ground cover, or a sparse understory and a dense ground cover of hydrophilic herbs and shrubs. Typical plants include pond pine, slash pine, sweetbay, spikerush, beakrush, sedges, dwarf wax myrtle, gallberry, saw palmetto, creeping beggar weed, deer tongue, gay feather, greenbrier, bluestem, and pitcher plants. Wet Flatwoods occur on relatively flat, poorly drained terrain. Exotic plants readily invade Wet Flatwoods in south Florida and must be controlled promptly. Flatwoods are closely associated with and often grade into Hydric Hammock, Mesic Flatwoods, Wet Prairie, or Basin Swamp. The soils typically consist of 1 to 3 feet of acidic sands generally overlying an organic hardpan or clay layer. Cabbage palm flatwoods tend to occur on more circa-neutral sands (ph ) underlain by marl or shell beds. The hardpan substantially reduces the percolation of water below and above its surface. During the rainy season, water frequently stands on the surface, inundating the Flatwoods for 1 or more months per year. FLUCCS Code/Name 411/Pine Flatwoods 419/Other Pines 428/Cabbage Palm 622/Pond Pine 624/Cypress - Pine - Cabbage Palm 630/Wetland Forested Mixed 225
236 Natural Community Name Wet Prairie Synonyms Description Location Soils - sand marsh - savanna, pitcher plant prairie -coastal savannah - coastal prairie Wet Prairies occur on flatland with sand substrate; seasonally inundated; subtropical or temperate; annual or frequent fire; Wet Prairie is characterized as a treeless plain with a sparse to dense ground cover of grasses and herbs, including wiregrass, toothache grass, maiden cane, spikerush, and beakrush. Wet Prairie is seasonally inundated or saturated for 50 to 100 days each year and burns every 2 to 4 years. Wax myrtle quickly invades and will dominate Wet Prairies with longer fire intervals. In south Florida, melaleuca invasions can seriously impact Wet Prairies. Wet Prairie occurs on low, relatively flat, poorly drained terrain of the coastal plain. Wet Prairie is closely associated with and often grades into Wet Flatwoods, Depression Marsh, Seepage Slope, Mesic Flatwoods, or Dry Prairie. Soils typically consist of sands often with a substantial clay or organic component. FLUCCS Code/Name 310/Herbaceous 641/Wet Prairies 226
237 Natural Community Name Xeric Scrub. Synonyms Description Location Soils - pine-oak-hickory woods - sand pine scrub - Florida scrub - sand scrub - rosemary scrub - oak scrub -Sand pine Old dune area with deep fine sand substrate; xeric, temperate or subtropical vegetation; rare fire (20-80 yrs); sand pine/scrub oaks/rosemary/ lichens, temperate or subtropical; Scrub occurs in many forms, but is often characterized as a closed to open canopy forest of sand pines with dense clumps or vast thickets of scrub oaks and other shrubs dominating the understory. The ground cover is generally very sparse, being dominated by ground lichens or, rarely, herbs. Open patches of barren sand are common. Ground vegetation is extremely sparse and leaf fall is minimal, thus reducing the chance of frequent ground fires. Scrub occurs on sand ridges along former shorelines. Some of the sand ridges originated as wind-deposited dunes, others as wave-washed sand bars. The rapidly draining soils create very xeric conditions for which the plants appear to have evolved several water conservation strategies. Scrub is associated with and often grades into Sandhill, Scrubby Flatwoods, Coastal Strand, and Xeric Hammock. Some Xeric Hammocks are advanced successional stages of Scrub, making intermediate stages difficult to classify. upland with deep sand substrate; Some Scrub soils are composed of well-washed, deep sands that are brilliant white at the surface; some Scrubs occur on yellow sands. The loose sands drain rapidly. FLUCCS Code/Name 421/Xeric Oak 423/Oak - Pine Hickory 425/Temperate Hardwood 427/Live Oak 432/Sand Live Oak 227
238 Appendix B Cost Considerations and Data Due to the temporal and spatial variation in prices for the same construction practice and product, cost is a user input. User input is also necessary to limit updates to the model with cost information. Reliable sources of cost data can be found from local or site specific construction indexes and cost data, as well as in journal articles and government websites. Published cost data are presented in this section that can be used should the user not have access to site specific or other appropriate data. It should be noted that the cost data presented in this section can be used in the model, but it is recommended that local or user supplied (more recent, site specific, etc.) cost data be used. When using published cost data, it is important to keep in mind inflation if the data are several years old. It is recommended that the consumer price index (CPI) be used to adjust the price of an item to current or past dollars based on inflation. There are consumer price indexes for different segments of the economy. The urban consumer price index (CPI U) is used to estimate the national inflation rate. The CPI U is based on a typical market basket of goods and services utilized by a typical urban consumer (Park, 2002; U.S. Department of Labor Statistics, 2016). CPI-U annual average values for are shown in Table B-1. The CPI is used to calculate an average annual general inflation rate that is used to adjust the price to the desired year; the inflation calculator provided by the US Department of Labor Statistics can do the calculations with input data, see Figure B-1 (Park, 2002; US Department of Labor Statistics, 2016). 228

239 Table B-1 United States CPI-U (U.S. Department of Labor Statistics, 2016) Year CPI-U (Average Annual) To be determined Figure B-1 US Department of Labor Statistics Inflation Calculator (US Department of Labor Statistics, 2016) 229
240 When determining the present value/worth of a proposed project, data can be adjusted to present worth, or any other year, by using an interest rate. The ability to bring all costs to a present worth is critical when comparing opportunity costs of different design options with varying annual operation and maintenance costs and lifespans. It is recommended to use the World Bank for information on interest rates. The World Bank provides yearly real interest rates, as well as other forms of interest rate, for various countries, including the United States (The World Bank), see Table B-2. Real interest rate, also known as inflation-free interest rate, is an estimate of the true earning power of money once the inflation effects have been removed. Real interest rate is used in constant dollar analysis. Constant dollar analysis is used when all cash flow elements needed are provided in constant dollars and you want to compute the equivalent present worth of the constant dollars. Constant dollar analysis is commonly used in the evaluation of long-term public projects since governments do not pay income taxes (Park, 2002). When obtaining costs from journal articles and reports it can be assumed, unless otherwise stated, that the costs presented are in terms of dollars in the year the article was written/submitted. If the year the article is written or submitted is not available, then assume that the cost data are in terms of the year prior to publication. Table B-2 Real Interest Rates for the United States (The World Bank) Year Real Interest Rate (%) The US EPA published the Preliminary Data Summary of Urban Storm Water Best Management Practices report in 1999 (Strassler, Pritts, & Strellec, 1999). This report contains performance and cost data, both capital, Table B-3, and operational for various BMPs, Table B-4. The cost data in Table B-3 do not include geotechnical testing, legal fees, land costs, and other unexpected costs. Cost ranges are provided for retention and detention basins to accommodate economies of scale in design and construction (Strassler, Pritts, & Strellec, 1999). 230
")
241 Table B-3 Typical Base Capital Construction Costs for BMPs (Strassler, Pritts, & Strellec, 1999) 231
242 Table B-4 Annual Maintenance Costs of BMPs (Strassler, Pritts, & Strellec, 1999) The Transportation Research Board published a document titled the NCHRP REPORT 792; this report is an excellent source of data for capital cost, operating cost, life span (see Table B-5), and performance data on a cost basis for various BMPs (Taylor, et al., 2014). It is important to note that several of the tables in this report provide Whole Life Cycle Costs. Care must be taken when using Whole Life Cycle Costs with the BMPTRAINS model. Whole life cycle costs are calculated by bringing the operating costs and capital costs all to a single Present Value; this is exactly what the BMPTRAINS model Net Present Worth Analysis feature does. Whole Life Cycle Costs style data could be evaluated using the Capital Cost feature in the BMPTRAINS model. Care must be exercised when doing this as the assumptions must consistent between the BMPTRAINS Model and the source of the cost data. 232

243 Table B-5 BMP expected life span (Taylor, et al., 2014) Cost data can also be found in journals such as the ASCE Journal of Environmental Engineering. The article by Houle (Houle, Roseen, Ballestero, Puls, & Sherrard Jr., 2013), which discusses capital and maintenance costs on an area and gram of pollutant removed basis for swales, ponds, bioretention, pervious pavements, and others. A few examples of capital and maintenance costs figures and tables from the article are shown below in Figure B-2, Table B-6, & Table B
 [Based on publication date, assume that all operating costs are on a 2012 basis unless otherwise stated.")
244 Figure B-2 Annualized maintenance costs per system per hectare of impervious cover treated per maintenance activity classification (Houle, Roseen, Ballestero, Puls, & Sherrard Jr., 2013) [Based on publication date, assume that all operating costs are on a 2012 basis unless otherwise stated.] Note in Florida a detention pond is the same as the category Retention Pond listed in Figure B
245 Table B-6 Capital and Maintenance Cost Data, with Normalization per Hectare of Impervious Cover Treated (Houle, Roseen, Ballestero, Puls, & Sherrard Jr., 2013) The article from which this cost information came from was published in 2013 & written in Assume all operating costs are on a 2012 basis unless otherwise stated. The capital cost in 2012 is stated in the table. Note that 1 hectare = acres. Table B-7 Summary of Removal Performance and Comparison per kg Removed of TSS and per g Removed of TP and TN as Dissolved Inorganic Nitrogen (DIN) (Houle, Roseen, Ballestero, Puls, & Sherrard Jr., 2013) The article from which this cost information came from was published in 2013 & written in Assume all capital and operating costs are on a 2012 basis unless otherwise stated. The 2012 article by Taylor and Wong discusses the life cycle costs of several types of BMPs including swales, bioretention systems, ponds, filters, and street sweeping (Taylor & Wong, 2002). Table B-8 below compares the life cycle costs of two different types of street sweepers. 235
246 Table B-8 US Street Sweeping Cost Information (Taylor & Wong, 2002) The journal article by Weiss provides the capital costs for various BMPs on a basis of volume of water treated and operating cost based on a percent of capital cost for specific BMPs (Weiss, Gulliver, & Erickson, 2007). Another example of a BMP cost data source is the Summary of Cost Data (2007) spreadsheet published by the International Stormwater Database (Wrigth Waters Engineers, Inc. and GeoSyntec Consultants, 2007). This Excel workbook published by the International Stormwater Database, prepared by Wright Waters Engineers, Inc. and Geosyntec Consultants, contains cost estimates and the year of the estimate for ponds, green roofs, grass swales, porous pavement, infiltration basins & trenches, media filters, and other BMPs. The cost data is normalized to BMP size. Additional cost data may be found in journal articles and government reports such as the reports by Curtis, 2002 (Curtis, 2002) and Geosyntec Consultants, 2015 (Geosyntec Consultants, 2015). 236
247 References for Cost Data (Appendix B) Burack, T. S., Walls, M. J., & Stewart, H. (2008). New Hampshire Stormwater Manual. Retrieved from Chang, N.-B., Islam, K., Marimon, Z., & Wanielista, M. P. (2012, July). Assessing biological and chemical signatures related to nutrient removal by floating islands in stormwater mesocosms. Chemosphere, 88(6), Curtis, M. (2002). Street Sweeping for Pollutant Removal. Montgomery County, Maryland Department of Environmental Protection. Florida Department of Revenue. (2016). Web Sites for Property Appraisers in Florida. Retrieved May 24, 2016, from Florida Department of Revenue: Geosyntec Consultants. (2015). Water Integration for Squamscott Exter (WISE) - Preliminary Integrated Plan. The Science Collaborative of the National Estuarine Research Reserve (NERR). Hardin, M. D. (2006). The Effectiveness of a Specifically Designed Green Roof Stormwater Treatment System Irrigated with Recycled Stormwater Runoff to Achieve Pollutant Removal and Stormwater Volume Reduction. Orlando: University of Central Florida. Harper, H. H., & Baker, D. M. (2007). Evaluation of Current Stormwater Design Criteria within the State of Florida. Tallahassee: Florida Department of Environmental Protection. Retrieved from inal_71907.pdf Hood, A. C., Chopra, M., & Wanielista, M. (2013). Assessment of Biosorption Activated Media under Roadside Swales for the Removal of Phosphorus from Stormwater. 5(1), Retrieved from Houle, J. J., Roseen, R. M., Ballestero, T. P., Puls, T. A., & Sherrard Jr., J. (2013). Comparison of Maintenance Cost, Labor Demands, and System Performance for LID and Conventional Stormater Management. 139(7). Michigan Department of Environmental Quality. (1999). Pollutants Controlled - Calculation and Documentation for Section 319 Watersheds Training Manual. Retrieved from 237
248 National Agricultural Statistics Service. (2015). Land Values 2015 Summary (August 2005). Washington, D.C.: United States Department of Agriculture. Retrieved from O'Reilly, A. M., Wanielista, M. P., Chang, N.-B., Xuan, Z., & Harris, W. G. (2012, August 15). Nutrient removal using biosorption activated media: Preliminary biogeochemical assessment of an innovative stormwater infiltration basin. Science of The Total Environment, 432, Park, C. S. (2002). Contemporary Engineering Economics (3rd ed.). Prentice-Hall, Inc. Pomeroy, C. A. (2009). USER'S GUIDE TO THE BMP AND LID WHOLE LIFE COST MODELS: VERSION 2.0. Water Environment & Reuse Foundation. Retrieved May 25, 2016, from Powell, L. M., Rohr, E. S., Canes, M. E., Cornet, J. L., Dzuray, E. J., & McDougle, L. M. (2005). LOW-IMPACT DEVELOPMENT STRATEGIES AND TOOLS FOR LOCAL GOVERNMENTS: BUILDING A BUSINESS CASE. LMI Government Consulting. Retrieved May 25, 2016, from Sansalone, J., Kuang, X., & Ranieri, V. (2008, October 01). Permeable pavement as a hydraulic and filtration interface for urban drainage. Journal of Irrigation and Drainage Engineering, 134(5), Seters, T. V., Graham, C., & Rocha, L. (2013). Assessment of Life Cycle Costs for Low Impact Development Stormwater Management Practices. Toronto and Region Conservation Authority. Strassler, E., Pritts, J., & Strellec, K. (1999). Preliminary Data Summary of Urban Storm Water Best Management Practices. Washington, D.C.: US EPA. Taylor, A., & Wong, T. (2002). Non-Structural Stormwater Quality Best Management Practices - A literature review of their value and life-cycle costs. Cooperative Research Centre for Catchment Hydrology. Taylor, S., Barrett, M., Leisenring, M., Sahu, S., Pankani, D., Poresky, A.,... Venner, M. (2014). NCHRP REPORT 792: Long-Term Performance and Life-Cycle Costs of Stormwater Best Management Practices. Washington, D.C.: Transportation Research Board. The World Bank. (n.d.). Real interest rate (%). Retrieved 05 03, 2016, from THE WORLD BANK: U.S. Department of Labor Statistics. (2016, March). Consumer Price Index Data from 1913 to (COINNEWS MEDIA GROUP LLC) Retrieved May 09, 2016, from US Inflation 238
249 Calculator: Urban Drainage and Flood Control District. (2015). Urban Storm Drainage Criteria Manual: Volume 3. Denver, CO. Retrieved May 25, 2016, from US Department of Labor Statistics. (2016, April 14). Inflation Calculator. (COINNEWS MEDIA GROUP LLC ) Retrieved May 09, 2016, from US Inflation Calculator: Wanielista, M. P., Yousef, Y. A., Harper, G. M., & Dansereau, L. (1991). Design Curves for the Reuse of Stormwate. Retrieved from %20design%20curves%20for%20the%20reuse%20of%20stormwater.pdf Weiss, P. T., Gulliver, J. S., & Erickson, A. J. (2007, May). Cost and Pollutant Removal of Storm-Water Treatment Practices. Journal of Water Resources Planning and Management, 133(3), Retrieved from Weiss, P., Gulliver, J., & Erickson, A. (2007). Cost and Pollutant Removal of Storm-Water Treatment Practices. 133(7). Wrigth Waters Engineers, Inc. and GeoSyntec Consultants. (2007). Summary of Cost Data (2007). Retrieved April 4, 2016, from International Stormwater Database: 239

250 Appendix C BMP Terminology and Descriptions Descriptions of the stormwater BMPs that are within the BMPTRAINS Model are in this Appendix. This is to ensure that all users have a common understanding of BMP terminology used in Florida. 1. Retention Basin A retention basin is a recessed area within the landscape that is designed to store and retain a defined quantity of runoff, allowing it to percolate through permeable soils into the shallow ground water aquifer. They are constructed or natural depression areas, often integrated into a site s landscaping, where the bottom is typically flat, and turf, natural ground covers or other appropriate vegetative or other methods are used to promote infiltration and stabilize the basin bottom and slopes. Retention basins provide numerous benefits, including reducing stormwater runoff volume, which reduces the average annual pollutant loading that may be discharged from the land. Additionally, many stormwater pollutants such as suspended solids, oxygen demanding materials, heavy metals, bacteria, some varieties of pesticides, and nutrients are removed as runoff percolates through the soil profile. The capture percentage on an annual basis is dependent on the rainfall zone and the size of the basin. The treatment effectiveness of all retention BMPs is directly related to the percentage of the average annual stormwater volume that is captured and not discharged. 240

251 2. Rain Garden or Bioretention Area Rain gardens are small retention basins that can be integrated into a site s landscaping. They also are called Bioretention Systems. A rain garden is a shallow, constructed depression that is planted with deep-rooted Florida-Friendly or native plants. It is located in the landscape or within parking lot islands to receive runoff from hard surfaces such as a roof, a sidewalk, a driveway, or parking area. For design, the water holding of the soil is usually 20% or less and there is a water storage above the soil. Plant selection must be done so that the water storage above the rain garden ground level does not destroy the plants. In some situations, where the SHGWT is high, a modified version of a Rain Garden that is called a detention system with an underdrain can be used. These types of systems are called Biofiltration Systems or Biofiltration Area. In other parts of the country where LID BMPs are commonly used, this type of system actually is called a Bioretention Area even though it actually is a detention BMP 3. Exfiltration Trench An exfiltration trench is a subsurface retention system consisting of a conduit such as perforated pipe surrounded by natural or artificial aggregate that temporarily stores and infiltrates stormwater runoff. Stormwater passes through the perforated pipe and infiltrates through the trench sides and bottom into the shallow ground water aquifer. The perforated pipe increases the storage available in the trench and helps promote infiltration by making delivery of the runoff more effective and evenly distributed over the length of the system. 241

252 4. Swale Swales have been used for roadside stormwater conveyance for a long time but they also can be effective retention BMPs for reducing stormwater pollutant loadings. Swales are defined in Chapter (14), Florida Statutes, as follows: Swale is defined as a manmade trench which: Has a top width to depth ratio of the cross-section equal to or greater than 6:1, or side slopes equal to or flatter than 3 feet horizontal to 1-foot vertical; Contains contiguous areas of standing or flowing water only following a rainfall event; Is planted with or has stabilized vegetation suitable for soil stabilization, stormwater treatment, and nutrient uptake; and Is designed to take consider the soil erosion, soil percolation, slope, slope length, and drainage area so as to prevent erosion and reduce pollutant concentration of any discharge. Typically, swales are online retention systems and their treatment effectiveness is directly related to the amount of the annual stormwater volume that is infiltrated. Swales designed for stormwater treatment can be classified into three categories: Swales with swale blocks or raised driveway culverts 242

253 Swales without swale blocks or raised driveway culverts) Swales incorporated into landscaping (an elongated rain garden) 5. Pervious Pavement Systems Pervious pavement systems include the subsoil, the sub-base, and the pervious pavement. They can include several types of materials or designed systems such as pervious concrete, pervious aggregate/binder products, pervious paver systems, and modular paver systems. At this time, pervious asphalt and pervious pavements using crushed and recycled glass will not be allowed until future improvements are made and verified with testing to address their structural capability, hydraulic performance and manufacturing process. Recent studies on the design, longevity, and infiltration characteristics of pervious pavement systems are available on the University of Central Florida s website Pervious pavement systems are retention systems. They should be used as part of a treatment train to reduce stormwater volume and pollutant load from parking lots, or similar types of areas. As with all infiltration BMPs, the treatment efficiency is based on the amount of the annual runoff volume infiltrated which depends on the available storage volume within the pavement system, the underlying soil permeability, and the ability of the system to readily recover this volume. 243

254 6. Green Roof and Cisterns A greenroof with cistern stormwater treatment system is a vegetated roof followed by storage in a cistern (or other similar device) for the filtrate that is reused for irrigation. A greenroof and cistern system is a retention and reuse BMP. Its effectiveness is directly related to the annual volume of roof runoff that is captured, retained, and reused. The filtrate from the greenroof is collected in a cistern or, if the greenroof is part of a BMP Treatment Train, the filtrate may be discharged to a downstream BMP such as a wet detention pond. A cistern is sized for a specific amount of filtrate and receives no other stormwater. Other pond storage must also provide capacity to detain a specified quantity of filtrate. The retained water is used to irrigate the roof since experience in Florida has shown that irrigation must be provided to maintain the plants. A back up source of water for irrigation is necessary during the dry season. Excess filtrate and excess runoff can be discharged to other stormwater treatment systems, infiltrated into the ground, or used for irrigation or other non-potable purposes. The greenroof and cistern system functions to attenuate, evaporate, and lower the volume of discharge and pollutant load coming from the roof surface. Greenroof systems have been shown to assist in stormwater management by attenuating hydrographs, neutralizing acid rain, reducing volume of discharge, and reducing the annual mass of pollutants discharged. They are most applicable to commercial or public buildings, but have been successfully used on residences. Green roofs are classified in two ways - both by who will have access to the finished roof (either passive or active) and by the depth of soil provided in the plant root zone (either extensive or intensive). Extensive green roofs tend to have passive use, while intensive green roofs support larger plants and tend to have active use. Passive green roofs usually only allow access by maintenance personnel. Active green roofs usually allow access to the public or building occupants in addition to maintenance personnel. In addition, extensive green roofs have a root zone less than 6 inches deep while intensive green roofs have a root zone equal to or greater than 6 inches deep. 244

255 Extensive Green Roof Section Intensive Green Roof Section As an option to the use of wind netting, a parapet usually 30 inches or more in depth is used to minimize wind damage during high wind conditions. 7. Vegetated Natural Buffer Vegetated natural buffers (VNBs) are defined as areas with vegetation suitable for sediment removal along with nutrient uptake and soil stabilization that are set aside between developed areas and a receiving water or wetland for stormwater treatment purposes. They also can be used as the pre-filter for other BMPs. Under certain conditions, VNBs are an effective best management practice for the control of stormwater pollutants in overland flow by providing opportunities for filtration, deposition, infiltration, absorption, adsorption, decomposition, and volatilization. VNBs are most commonly used as an alternative to swale/berm systems installed between backyards and the receiving water. Buffers are intended for use to avoid the difficulties associated with the construction and maintenance of backyard swales on land controlled by individual homeowners. Potential impacts to adjacent wetlands and upland natural areas are reduced because fill is not required to establish grades that direct stormwater flow from the back of the lot towards the front for collection in the primary stormwater 245
256 management system. In addition, impacts are potentially reduced since buffer strips can serve as wildlife corridors, reduce noise, and reduce the potential for siltation into receiving waters. Vegetative natural buffers are not intended to be the primary stormwater management system for residential developments. They are most commonly used only to treat those rear-lot portions of the development that cannot be feasibly routed to the system serving the roads and fronts of lots. The use of a VNB in combination with a primary stormwater management system for other types of development shall only be allowed if the applicant demonstrates that there are no practical alternatives for those portions of the project. 8. Vegetated Filter Strips Runoff water is directed over a vegetated filter strip that has select bio-sorption activated media (BAM) beneath it. Typically, 12 inches of media is used and the removal effectiveness is based on this depth (EPA, 2005). The minimum width in the direction of flow to obtain capture and pollution control is 10 feet. The capture effectiveness is a function of the vegetated filter strip width, the width of the impervious area catchment, the type of BAM and the rainfall zone in which the filter strip is located. There are various BAM media that must be used to get credit for removal. A vegetated cover must be used. The storage capacity of the BAM used is limited to three values depending on the BAM. If native soils are used, the removal effectiveness must be approved by the reviewers and input as a User Defined BMP. A schematics of the strip is shown as: 246
257 9. Rainwater Harvesting System The term rainwater harvesting most commonly refers to water collected from roofs that is stored and reused. Rain is a free source of relatively clean, soft water. As rain falls onto surfaces such as concrete, pavement, and grass it contacts more contaminants than it would from dry fallout on a roof. Harvesting rainwater from roof runoff is an easy, inexpensive way to disconnect impervious surfaces and capture water before it has contacted many potential contaminants. The purpose of capturing and reusing stormwater is to replace the use of potable water. Usually harvested rainwater is reused for outdoor irrigation, and the cost of using it in new developments has been estimated to be about 5-25% of the cost of potable water. Harvested rainwater can be used for a variety of uses ranging from outdoor irrigation and car washing to indoor uses including toilet flushing, clothes washing, irrigation of indoor planters, hose bibs, car washing, and potable use. However, most of these indoor uses require approval of the local County Health Department and Planning Department. There are four types of rainwater harvesting systems: Small residential systems that store rainwater in rain barrels for supplemental irrigation. Large residential or commercial systems that store rainwater in a cistern for irrigation, vehicle washing, dust control, or other outdoor, non-potable uses. Large residential or commercial systems that store rainwater in a cistern as a source of indoor graywater uses such as toilet flushing, urinal flushing, Heating Ventilating and Air Conditioning (HVAC) make-up water, laundry wash water, and outdoor non-potable uses, and Residential or commercial systems that store rainwater in a cistern as a source of potable water. 10. Stormwater Harvesting System Stormwater harvesting systems use treated stormwater for beneficial purposes thus reducing the stormwater volume and mass of pollutants discharged from a retention or wet detention system. It is most often used with wet detention as part of a BMP treatment train. The harvested 247

258 stormwater can be used for numerous uses including irrigating lawns and landscape beds, irrigating green roofs, washing vehicles, industrial cooling and processing, and toilet flushing. To properly design a stormwater harvesting system that will result in a predictable average annual mass removal, water budgets are required. The development of a water budget for stormwater harvesting is done to quantify the capture of runoff or reduction in offsite discharge for a given period of time. Individual components of storage volume, rate of use, and discharge can be accounted for in the water budget. Calculation of these components requires knowledge of many variables, such as watershed soil and impervious characteristics, water use volumes and rates, desired percentage of stormwater runoff to be used, maximum volume of stormwater runoff storage, rainfall data, and evaporation data. The results of long-term simulations of stormwater harvesting ponds over time are presented as Rate-Efficiency-Volume (REV) curves. The REV curves shall be used to design stormwaterharvesting systems to improve the nutrient removal effectiveness of wet detention ponds. Important assumptions that must be understood when using the REV curves include: Net ground water movement into or out of the pond is assumed zero in a year. The use rate is kept constant for each month in a year, and presented on the REV curves as an average rate per day and over the equivalent impervious area (EIA). Irrigation is limited to twice per week with no irrigation after rainfalls equal to or greater than the daily irrigation amount. Rainfall on the pond is equal to the evaporation from the pond. The effectiveness results are long-term averages based on historical rainfall records. The average values for each year will be different. Soil storage in the irrigated area and plant ET are not limiting irrigation application rates. 248

259 11. Wet Detention Systems Wet detention systems are permanently wet ponds that are designed to slowly release a portion of the collected stormwater runoff through an outlet structure. Wet detention systems are often an effective BMP for sites with moderate to high water table conditions. Wet detention treatment systems provide removal of both dissolved and suspended pollutants by taking advantage of physical, chemical, and biological processes within the pond. They are relatively simple to design and operate, provide a predictable recovery of storage volumes within the pond, and are easily maintained by the maintenance entity. As shown in the figures below, the treatment effectiveness of a wet detention system is directly related to the residence time that the stormwater spends within the system before discharge. The longer the residence time, the more time that the various pollutant load reduction mechanisms within the wet detention system have to work. The basic formula for calculating residence time is shown below: Where: Rt = V/Q Rt is residence time V is the volume of the wet detention system permanent pool Q is the average flow rate for the period of time. 249
260 Removal Efficiency of Total Phosphorus in Wet Detention Ponds as a Function of Annual Residence Time Removal Efficiency of Total Nitrogen in Wet Detention Ponds as a Function of Annual Residence Time 250
261 12. Managed Aquatic Plant Systems (MAPS) Managed Aquatic Plant Systems (MAPS) are aquatic plant-based BMPs that remove nutrients through a variety of processes related to nutrient uptake, transformation, and microbial activities. Examples of MAPS include planted littoral zones and floating wetland mats. Harvesting of the biomass is an essential process of the BMP. Maintenance plans must be available. Generally, wet detention systems by themselves can t achieve many required levels of nutrient removal from stormwater. In nearly all cases, a BMP treatment train will be required when using a wet detention system. Sometimes components of the BMP treatment train include source controls or pretreatment BMPs such as retention or swales to reduce either the stormwater volume or nutrient concentrations in stormwater discharged to the wet detention system. However, in many areas, high water tables and slowly percolating soils do not make infiltration practices practical or effective. Managed Aquatic Plant Systems (MAPS) can be incorporated into a wet detention BMP treatment train to provide additional treatment and nutrient removal after the wet pond has provided reduction of pollutants through settling and other mechanisms that occur within the wet pond. 13. Up-flow Filter Systems Up-flow filters are used in conjunction with detention systems, either wet detention or vault systems, to increase treatment train pollutant load removal effectiveness. As the name implies, stormwater enters the bottom of these filters and exits from the top. The value of this flow direction is the filter has a lower potential to plug with debris and particulates. Up-flow filters are very suitable and applicable to ultra-urban development applications because of their capability to remove significant levels of sediments, particulate-bound pollutants (metals, phosphorus and nitrogen) and organics (oil and grease). They are amenable to ultra-urban constraints such as linear configurations and underground installations. The up-flow filter contains media to remove sediment and both particulate and dissolved pollutants. Using a sorption media in the filter increases the removal of dissolved pollutants. For mixed media up-flow filters, there are at least two different types of media that when used together achieve specified pollutant removal effectiveness. Media mixtures that are effective for removing a wide range of pollutant types are sand/clay with other additions (Woelkers et al., 2006), and expanded clay with other media (Ryan et al., 2009, Hardin et al., 2012). Some mixes target specific pollutants, such as used by the Washington State DOT whose mix targets dissolved metals (WSDOT, 2008), and media mixes that target phosphorus (Ma et al., 2009), nitrate (Kim et al., 2003), phosphorus and nitrogen (O Reilly et al., 2012), organics (Milesi et al., 2006), and metals and dioxins (Pitt and Clark, 2010). Thus, a wide selection of media mixtures can be used for media filtration systems (Chang et al., 2010). Most mixed media can treat stormwater, wastewater, groundwater, landfill leachate, and sources of drinking water for nutrient removal via physicochemical and microbiological processes (Chang et al., 2010). The media may include, but are not limited to, compost, clay, zeolite, wheat straw, newspaper, sand, limestone, expanded clay, wood chips, wood fibers, mulch, pumice, bentonite, tire crumb, expanded shale, oyster shell, coconut coir, and soy meal hull 251
262 (Wanielista and Chang, 2008). This document, entitled Alternative Stormwater Sorption Media for the Control of Nutrients, was prepared for the SWFWMD and is available online: Biofiltration Systems with Biosorption Activated Media (BAM) Biofilters or biofiltration systems are a suite of typically offline BMPs that use engineered media, such as Biosorption Activated Media (BAM), to enhance nutrient removal when native soils can t provide adequate pollutant removal or infiltration. Another use is when soils do not have an adequate infiltration rate for retention systems. They also are used in Sensitive Karst Areas to remove nitrates where the sandy soils and infiltration rates allow nitrate movement into the ground water. They can serve both small and large watersheds. The large watersheds typically discharge into retention basins or wet detention ponds. The wet detention ponds may then use up-flow filters on the discharge to further remove nutrients, especially the nitrate form of nitrogen. Small catchment areas can discharge into depression areas or rain gardens that have BAM within them. Typically, these are either offline retention BMPs or online stormwater detention BMPs that serve small drainage areas of up to two acres. Biofiltration systems with BAM incorporate select soils, recycled materials, cellulose, or other mixtures. For the removal of phosphorus, BAM has to display a sorption capacity for phosphorus. For nitrate removal, the BAM must retain moisture and the containment promotes an anoxic zone. Planted vegetation to facilitate treatment for removal of nutrients is common. The use of BAM will also reduce toxic compounds in the discharge waters. There are many opportunities for biofiltration systems and many configurations making them highly applicable for on-site treatment in urban development, especially in areas undergoing redevelopment. They can have an underdrain for surface water discharge but also are designed to function as retention systems. BMPs that can typically use BAM are listed as: Detention rain gardens Retention rain gardens Landscape planter boxes Tree wells or tree box filters Up-Flow Filters after wet detention Up-Flow Filters after baffle box chambers Regional Retention Basins Exfiltration pipes Vegetated Filter Strips 252


263 Cross section of Depression area or a Pavement Biofiltration System Cross section of Landscape Planter Biofiltration System 253

264 Cross section of Tree Box Filter with Underdrain 15. Lined Reuse Pond This is a lined pond used primarily for agricultural pastureland water collection. It has the same design specifications as rainwater harvesting of section 9 of this appendix. One limitation is that the irrigation area is equal to the drainage area, thus this has primary application to pivot type irrigation systems. 254
265 List of References Caraco, Deb. (2010). Watershed Treatment Model (WTM) 2010 User s Guide Center of Watershed Protection. Web. 16 August < watershed-treatment-model.html> Carpenter, D. (2009). Rain Gardens, SOCME meeting presentation, Lawrence Tech University, Southfield Michigan, January 20. Center for Watershed Protection. (2010). Watershed Treatment Model (Beta Version) [Software]. Retrieved from Chang, N., Islam, K., Marimon, Z. and Wanielista, M. (2012) Assessing Biological and Chemical Signatures Related to Nutrient Removal by Floating Islands. Chemosphere, Volume 88, issue 6, pages , July. Denver Urban Drainage and Flood Control District. (2010). Urban Storm Drainage: Criteria Manual, Bioretention Sections. Water Resources Publications, Denver, November. Tetra Tech, Inc. (2008). Clinton River Site Evaluation Tool - User Manual and Guidance. < _set_v1_user_man_may_2008.pdf > Retrieved from on August 2011 Chopra M., Hardin M., Najdavski N., Stuart E., and Wanielista M.P. (2011). Porosity and Curve Numbers for Pervious Pavement Systems. Comstock, Greg. (2010). DES Simple Method Pollutant Loading Spreadsheet Model [Software]. Retrieved District of Columbia, (2014). Green Infrastructure Standards and Supplements. Department of Transportation Environmental Protection Agency (EPA) Riparian Buffer Width, Vegetation Cover, and Nitrogen Removal Effectiveness, EPA 600/R-05,118, Cincinnati Ohio, October. Florida Department of Environmental Protection. FDEP (2010). Draft Statewide Stormwater Treatment Rule Development. March
266 Hardin, M. (2006). The effectiveness of A Specifically Designed Green Roof Stormwater Treatment System Irrigated with Recycled Stormwater Runoff to Achieve Pollutant Removal and Stormwater Volume Reduction. M.S. Thesis. University of Central Florida, Orlando Florida. Hardin, M. (2014). Development of Treatment Train Techniques for the Evaluation of Low Impact Development in Urban Regions, Ph.D. Dissertation, University of Central Florida, Orlando Fl. Harper, Harvey H and David M. Baker. (2007). Evaluation of Current Design Criteria within the State of Florida. Florida Department of Environmental Protection, Tallahassee, Florida Harper, H. (1990). Effects of Stormwater Management Systems on Groundwater Quality. Project WM 190, Florida Department of Environmental Regulation. Hirschman, David, Kelly Collins, and Tom Schuler. (2008) Technical Memorandum: The Runoff Reduction Method. Center of Watershed Protection. Web. 16 August < Hunt, William F. (2010). Jordan/Falls Lake Stormwater Nutrient Load Accounting Model (Beta Version) [Software]. Retrieved from Indian River Lagoon TMDL Technical Memorandum Report: Assessment and Evaluation of Model Input Parameters Final Report; Prepared by Harvey Harper, Environmental Research & Design, Inc.; July Kawula, Robert, Florida Land Cover Classification System, Florida Fish and Wildlife Conservation Commission, Tallahassee, Florida. Low Impact Development Center. Rain Garden Design Templates. Web. 6 Dec < New Hampshire Department of Environmental Services. (2011). Guidance for Estimating Preand Post-Development Stormwater Pollutant Loads. Web. 17 August < North Carolina State Department of Biological and Agricultural Engineering. (2011). Jordan/Falls Lake Stormwater Nutrient Load Accounting Tool (Version 1.0) User s Manual. Web. 15 August < North Carolina Division of Water Quality. (2012). Stormwater Best Management Practices Manuals, with errata updates. Chapter 12, Biofiltration. 256
267 Pomeroy, C.A., and A. Charles Rowney. User s Guide to the BMP SELECT Model. (2009). Water Environment Research Foundation. Web. 15 August < PublicationProfile.cfm&id=swc1r06a> Rowney, A. Charles. (2010). BMP SELECT (Version 1.0.0) [Software]. Retrieved from ublicationprofile.cfm&id=swc1r06a. Ryan, P. et.al. (2010). Nutrient Reduction in a Stormwater Pond Discharge, Water Air Soil Pollution. 208: pp , Springer (DOI ). Tetra Tech, Inc. (2008). Clinton River Site Evaluation Tool (Version V1b) [Software]. Retrieved from United States Environmental Protection Agency (USEPA). (2010). What is Nonpoint Source Pollution? Ecosystems Research Division, Athens, GA. United States Environmental Protection Agency (USEPA). (2007). SUSTAIN - An EPA BMP Process and Placement tool for urban watersheds, by Fu-hsiung Lai, et al. From United States Environmental Protection Agency (USEPA). (2005). Riparian Buffer Width, Vegetative Cover, and Nitrogen Removal Effectiveness. Washington. D.C. Urban Drainage and Flood Control District (2011). Stormwater Best Management Practice Design Workbook (Version 3.01) [Software]. Retrieved from Urban Drainage and Flood Control District. (2010). Urban Storm Drainage Criteria Manual Volume 2, Best Management Practices. Denver, Colorado. Web. 27 Aug < Urban Drainage and Flood Control District. (2010). Urban Storm Drainage Criteria Manual Volume 3, Best Management Practices. Denver, Colorado. Web. 27 Aug < Viessman, W and M J. Hammer. (2005) Water supply and pollution control. Prentice Hall, Virginia Department of Conservation and Recreation. (2011). Virginia Runoff Reduction Method Worksheet [Software]. Retrieved from Virginia Department of Conservation and Recreation. (2011). Virginia Runoff Reduction Method Instructions & Documentation. Web. 16 August < 257
268 Wanielista, M.P, Chang, N., Xuan, Z., Islam, K., and Marimon, Z. (2102). Floating Wetland Systems for Nutrient Removal in Stormwater Ponds, Final Report, FDOT BDK , Rick Renna State Drainage Engineer, Tallahassee Florida, September. Wanielista, M.P., Chopra, M., Hardin M., Kakuturu S. and Runnenbaum N. (2011). Evaluating Runoff and Abstraction from Impervious Surfaces as Components Affecting Recharge. University of Central Florida, Orlando Florida. Wanielista, M.P., Robert Kersten, Ron Eaglin. (1995) Hydrology Water Quantity and Quality Control, J. Wiley and Sons, Second Edition. Wanielista, M.P., Yousef, Y.A., Harper, G.M., and Dansereau, L.D. (1991) Design Curves for the Reuse of Stormwater. Florida Department of Environmental Regulation, November. Wanielista, M.P. and Yousef A. Yousef. Stormwater Management. (1993) John Wiley & Sons. Wanielista, M.P. et.al. (2011) Nitrogen Transport and Transformation in Retention Basins, Marion County, Fl, FDEP, Tallahassee, Fl. 258
269 259

270
CASE STUDIES: SWALE EFFECTIVENESS
 CASE STUDIES: SWALE EFFECTIVENESS B Y : M A R T Y W A N I E L I S T A A N D E R I C L I V I N G S T O N August, 2016 Escambia County ACKNOWLEDGEMENTS The Low Impact Design BMP workshops were presented
BMPTRAINS MODEL: A TRAINING WORKSHOP B Y : M AR T Y W AN I E L I S T A, H AR V E Y H AR P E R AN D M I K E H AR D I N.
 BMPTRAINS MODEL: A TRAINING WORKSHOP B Y : M AR T Y W AN I E L I S T A, H AR V E Y H AR P E R AN D M I K E H AR D I N. PURPOSE OF TRAINING IS TO: Understand the theory essential for estimating annual nutrient
BMPTRAINS MODEL: A TRAINING WORKSHOP B Y : M AR T Y W AN I E L I S T A, H AR V E Y H AR P E R, E R I C L I V I N G S T O N AN D M I K E H AR D I N.
 BMPTRAINS MODEL: A TRAINING WORKSHOP B Y : M AR T Y W AN I E L I S T A, H AR V E Y H AR P E R, E R I C L I V I N G S T O N AN D M I K E H AR D I N. PURPOSE OF TRAINING IS TO: Understand why nutrient removal
BMPTRAINS MODEL: EXAMPLE APPLICATION AND NAVIGATION OF THE MODEL
 Pinellas County Stormwater Management Manual Training Workshop BMPTRAINS MODEL: EXAMPLE APPLICATION AND NAVIGATION OF THE MODEL BY: MARTY WANIELISTA, 2017 PURPOSE : Understand the basis of removal for
LOW IMPACT DEVELOPMENT BIO-SORPTION ACTIVATED MEDIA
 LOW IMPACT DEVELOPMENT BIO-SORPTION ACTIVATED MEDIA M A R T Y W A N I E L I S T A S T O R M W A T E R M A N A G E M E N T A C A D E M Y J U L Y, 2 0 1 6 O R L A N D O F L O R I D A W W W. S T O R M W A
Pinellas County Stormwater Management Manual Training Workshop SMALL COMMERCIAL AREA CASE STUDY
 Pinellas County Stormwater Management Manual Training Workshop SMALL COMMERCIAL AREA CASE STUDY PRE POST (ACTUAL) WHICH IS THE APPROPRIATE PERFORMANCE STANDARD? Post = 90% of Pre vs. 55% N and 80% P reduction
CASE STUDIES: BMPTRAINS MODEL
 CASE STUDIES: BMPTRAINS MODEL B Y : M A R T Y W A N I E L I S T A A N D E R I C L I V I N G S T O N August, 2016 Escambia County ACKNOWLEDGEMENTS The Low Impact Design BMP workshops were presented on August
User s Manual for the BMP Trains 2020 Model
 User s Manual for the BMP Trains 2020 Model For BMP Trains 2020 Version 1.2.7 April 2019 Marty Wanielista, Ron Eaglin, Rich Magee, Harvey Harper, Eric Livingston, Mike Hardin, Przemyslaw Kuzlo, and Ikiensinma
BMP Trains 2020 Model SFWMD Professional Staff Education and Training
 An introduction to BMP TRAINS 2020 with example stormwater BMPs BMP Trains 2020 Model SFWMD Professional Staff Education and Training By: Marty Wanielista, Ikiensinma Gogo-Abite, Antony Rios and Christelle
10/16/2013. The Big Picture of LID and Green Infrastructure. Learning Objectives
 Low impact development (LID) the basic idea behind LID is to manage stormwater in a way that imitates the natural hydrology of a site. Details Matter Selection, Design, and Implementation of Low Impact
STORMWATER MANAGEMENT AND IMPAIRED WATERS. Eric H. Livingston Watershed Management Services, LLC Crawfordville, FL
 STORMWATER MANAGEMENT AND IMPAIRED WATERS Eric H. Livingston Watershed Management Services, LLC Crawfordville, FL Impaired Waters Not meet their WQS Loss of designated uses TOTAL MAXIMUM DAILY LOADS Section
Stormwater BMP Maintenance
 Stormwater BMP Maintenance Background and Definitions What is Stormwater Runoff? Stormwater Stormwater is the result of precipitation that flows overland to streams and other bodies of water Stormwater
CASE STUDIES: CENTRAL OFFICE COMPLEX
 CASE STUDIES: CENTRAL OFFICE COMPLEX B Y : M A R T Y W A N I E L I S T A A N D E R I C L I V I N G S T O N August, 2016 Escambia County ACKNOWLEDGEMENTS The Low Impact Design BMP workshops were presented
Appendix A. Compliance Calculator Guidance
 Compliance Calculator Guidance Appendix A Appendix A. Compliance Calculator Guidance A.1 Introduction The Center for Watershed Protection created the compliance calculator spreadsheet to allow a designer
Opti-Tool: A BMP Optimization Tool for Stormwater Management in EPA Region 1
 Opti-Tool: A BMP Optimization Tool for Stormwater Management in EPA Region 1 Mark Voorhees, EPA Region 1 Khalid Alvi, Tetra Tech April 20, 2016 Project Background Massachusetts (MA) MS4 General Permit
Low Impact Development USING LID TO SOLVE YOUR ERP, TMDL, NPDES, NNC (AND OTHER) PROBLEMS
 PROBLEMS") Low Impact Development USING LID TO SOLVE YOUR ERP, TMDL, NPDES, NNC (AND OTHER) PROBLEMS Prescription to Clean Up Florida Waters: WHAT IS LID? Comprehensive approach Hydrology is integrating framework
Low Impact Development USING LID TO SOLVE YOUR ERP, TMDL, NPDES, NNC (AND OTHER) PROBLEMS Prescription to Clean Up Florida Waters: WHAT IS LID? Comprehensive approach Hydrology is integrating framework
Chapter 3 Calculating the WQCV and Volume Reduction
 Contents 1.0 Introduction... 1 2.0 Hydrologic Basis of the WQCV... 1 2.1 Development of the WQCV... 1 2.2 Optimizing the Capture Volume... 3 2.3 Attenuation of the WQCV (BMP Drain Time)... 4 2.4 Excess
Nonpoint Source Storm Water Management Plan
 Nonpoint Source Storm Water Management Plan Christine Pomeroy Dept. of Civil & Environnmental Eng. University of Utah Carl Adams Watershed Protection Utah Division of Water Quality Definitions Nonpoint
A Case for the Design and Modeling of BMP Infiltration and LID Techniques. By: Bob Murdock
 A Case for the Design and Modeling of BMP Infiltration and LID Techniques 2009 IAFSM Annual Conference 2009 IAFSM Annual Conference By: Bob Murdock Presentation Outline 1. Runoff Reduction (RR) and Low
Evolution of Water Quality BMP Accountability & Effectiveness
 Comprehensive Watershed Evaluation, Planning and Management Evolution of Water Quality BMP Accountability & Effectiveness 29TH Annual Environmental Permitting Summer School Florida Chamber Foundation July
Catchment Scale Stormwater Volume and Pollutant Loading Analyses. Guidance for Municipal Stormwater Program Assessment and Prioritization
 Catchment Scale Stormwater Volume and Pollutant Loading Analyses Guidance for Municipal Stormwater Program Assessment and Prioritization May 2016 Catchment Scale Stormwater Volume and Pollutant Loading
APPENDIX I WATER QUALITY FACTORS FOR FEE CREDIT CALCULATIONS
 APPENDIX I WATER QUALITY FACTORS FOR FEE CREDIT CALCULATIONS January 2018 Storm Water Management Design Manual Appendix I-1 I.1. Purpose There are a wide variety of water quality best management practices
Chapter 12. VIRGINIA RUNOFF REDUCTION METHOD Compliance Spreadsheet User s Guide & Documentation (Version 2.7, April 2013) Table of Contents
 Table of Contents") Virginia Stormwater Management Handbook, Chapter 11 July 2013 Chapter 12 VIRGINIA RUNOFF REDUCTION METHOD Compliance Spreadsheet User s Guide & Documentation (Version 2.7, April 2013) Table of Contents
Virginia Stormwater Management Handbook, Chapter 11 July 2013 Chapter 12 VIRGINIA RUNOFF REDUCTION METHOD Compliance Spreadsheet User s Guide & Documentation (Version 2.7, April 2013) Table of Contents
Project Name: Add a unique name that appropriately identifies the submission
 PTAPP Online Municipal Tracking Tool Instructions Project Name: Add a unique name that appropriately identifies the submission Municipal Project: Check this box if the project is part of municipal efforts
Modeling Techniques for Modeling T Stormwater Pond Sizing to Meet New Criteria in FDEP s State in FDEP s State--wide wide Stormwa u e
 Modeling Techniques for Stormwater Pond Sizing to Meet New Criteria in FDEP s State-wide Stormwater t Rule PONDS Training Workshop October 9, 2009 References Evaluation of Current Stormwater Design Criteria
TMDL and Stormwater Regulations & Policy: Recent Developments and their Implications for MS4 Permit Holders
 14 th Annual EPA Region 6 Stormwater Conference 26 June 2012 TMDL and Stormwater Regulations & Policy: Recent Developments and their Implications for MS4 Permit Holders Michael F. Bloom, PE, CFM, BCEE
15A NCAC 02B.0281 FALLS WATER SUPPLY NUTRIENT STRATEGY: STORMWATER REQUIREMENTS FOR STATE AND FEDERAL ENTITIES The following is the stormwater
 15A NCAC 02B.0281 FALLS WATER SUPPLY NUTRIENT STRATEGY: STORMWATER REQUIREMENTS FOR STATE AND FEDERAL ENTITIES The following is the stormwater strategy, as prefaced in Rule 02B.0275, for the activities
Cost Efficiency and Other
 Cost Efficiency and Other Factors in Urban Stormwater BMP Selection WIP Local Technical Meeting Series November 2013 Greg Busch MarylandDepartmentof the Environment gbusch@mde.state.md.us 1 Which BMPs
POST-CONSTRUCTION STORMWATER MANAGEMENT FOR EROSION CONTROL PROFESSIONALS
 POST-CONSTRUCTION STORMWATER MANAGEMENT FOR EROSION CONTROL PROFESSIONALS Shannon Tillack, P.E., CPESC Wright Water Engineers, Inc. Why do we care about stormwater quality? Board 1 Recreational Uses Slide
Credit Calculations and Calculator Functions
 MIDS Work Group Meeting May 20, 2010 Credit Calculations and Calculator Functions p-gen3-13c Today s Goals The Foundation for the Credits & Calculator Discuss proposed calculations Performance goal requirement
ORDINANCE # 854. Stormwater Management / Operation and Maintenance Requirements
 ORDINANCE # 854 Stormwater Management / Operation and Maintenance Requirements Section 1. Purpose and Authority In accordance with the provisions of Chapters 98, 124, 126, 440, 444, and 446h of the General
Effectiveness of Non-Structural Measures in Watershed Restoration
 Effectiveness of Non-Structural Measures in Watershed Restoration Bill Frost, PE, D.WRE Sr. Water Resources Engineer KCI Technologies, Inc. Sparks, MD 2011 Low Impact Development Symposium Philadelphia,
Infiltration Trench Factsheet
 Infiltration Trench Factsheet Infiltration Trench is a practice that provides temporary storage of runoff using the void spaces within the soil/sand/gravel mixture that is used to backfill the trench for
Appendix 12. Pollutant Load Estimates and Reductions
 Appendix 12. Pollutant Load Estimates and Reductions A pollutant loading is a quantifiable amount of pollution that is being delivered to a water body. Pollutant load reductions can be calculated based
A Summary of the International Stormwater BMP Database
 A Summary of the International Stormwater Tuesday, February 12, 2013, 1:00PM Presented by: Katie Blansett, Ph.D., P.E. Pennsylvania Housing Research Center www.engr.psu.edu/phrc Objective The objective
VOLUME CONTROL using Inter-Event Dry Periods. Stormwater Management Academy UNIVERSITY OF CENTRAL FLORIDA
 VOLUME CONTROL using Inter-Event Dry Periods Stormwater Management Academy UNIVERSITY OF CENTRAL FLORIDA O u t l i n e Why? Basic Principles Specifications and Regulations Watershed Abstractions The VIV
June 27, 2012 Holly Galavotti U.S. EPA
 June 27, 2012 Holly Galavotti U.S. EPA Urban stormwater is a leading source of water quality impairment Urban stormwater identified as source of impairment (2004 WQ Report) 22,559 miles of impaired rivers
POLLUTANT REMOVAL EFFICIENCIES FOR TYPICAL STORMWATER MANAGEMENT SYSTEMS IN FLORIDA
 POLLUTANT REMOVAL EFFICIENCIES FOR TYPICAL STORMWATER MANAGEMENT SYSTEMS IN FLORIDA Presented at the Fourth Biennial Stormwater Research Conference Clearwater, FL October 18-20, 1995 Sponsored By: The
INTRODUCTION BMP DATABASE PROJECTS IN PA
 The International Stormwater BMP Database Part 2: Data Summary for the Design of Residential BMPs PHRC Land Development Brief Katherine L. Blansett, Ph.D., P.E. February 2013 INTRODUCTION This brief is
Chapter 6. Hydrology. 6.0 Introduction. 6.1 Design Rainfall
 6.0 Introduction This chapter summarizes methodology for determining rainfall and runoff information for the design of stormwater management facilities in the City. The methodology is based on the procedures
01719; PH (978) ; FAX (978) ; PH (503) ; FAX (503) ;
 ; FAX (978) ; PH (503) ; FAX (503) ;") Recent Findings from the National Stormwater Best Management Practices Database Project: Applied Research in Practice Marcus Quigley 1 and Eric Strecker 2 1 GeoSyntec Consultants, 629 Massachusetts Avenue,
Recent Findings from the National Stormwater Best Management Practices Database Project: Applied Research in Practice Marcus Quigley 1 and Eric Strecker 2 1 GeoSyntec Consultants, 629 Massachusetts Avenue,
Shifting Tides: Florida's Changing Water Quality Regulations
 Shifting Tides: Florida's Changing Water Quality Regulations Statewide Stormwater Rule & EPA Numeric Nutrient Criteria Chris Martinez Assistant Professor University of Florida Outline - Statewide Stormwater
WHEN AND WHY HIGHER LEVELS OF STORMWATER TREATMENT ARE REQUIRED AND HOW TO ACHIEVE THEM
 WHEN AND WHY HIGHER LEVELS OF STORMWATER TREATMENT ARE REQUIRED AND HOW TO ACHIEVE THEM BY: ERIC LIVINGSTON WATERSHED MANAGEMENT SERVICES, LLC FLORIDA S STORMWATER RULES 1979 Chapter 17-4.248, F.A.C. 1982
Hydrology/Stormwater. Tom Ballestero University of New Hampshire Stormwater Center. Urban Forestry Workshop February 2013
 Hydrology/Stormwater Tom Ballestero University of New Hampshire Stormwater Center Urban Forestry Workshop 25 26 February 2013 Biophysical Services of the urban forest 1 Low Impact Development and Green
TABLE B.3 - STORMWATER BMP POLLUTANT REMOVAL EFFICIENCIES
 BMPS DESCRIPTION p p p p TSS TP Sol P TN Stormwater Ponds**, 8 Stormwater Wetland** and extended detention, and some elements of a shallow marsh equivalent capable of treating the full water quality volume.
Presented by Jane Clary, CPESC Wright Water Engineers, Inc. For Mountain States Chapter, IECA Dec. 2011
 Presented by Jane Clary, CPESC Wright Water Engineers, Inc. For Mountain States Chapter, IECA Dec. 2011 Brief Background on Proposed CO Nutrient Criteria November 21, 2011 Water Quality Control Division
Evaluation of Current Stormwater Design Criteria within the State of Florida
 Evaluation of Current Stormwater Design Criteria within the State of Florida Final Report Prepared for: FLORIDA DEPARTMENT OF ENVIRONMENTAL PROTECTION FDEP Contract No. SO108 June 2007 Prepared By: Harvey
How Climate Change Impacts Urban Runoff and Water Quality Design
 How Climate Change Impacts Urban Runoff and Water Quality Design by J. C. Hayes, C. Privette, III and S. J. Klaine AWRA Conference Anchorage, AK May 4-7, 2009 Presentation Outline Introduction: Why manage
Best Management Practices for Stormwater Quality Treatment in Urban Settings. Lower Mississippi River WMO September 2017
 Best Management Practices for Stormwater Quality Treatment in Urban Settings Lower Mississippi River WMO September 2017 Stormwater 101 Impervious surfaces (pavement, parking lots, etc.): quickly produce
Stormwater Management Update Requirements for Plans and Approvals. Doug Beisch (WEG, now Stantec)
") Stormwater Management Update Requirements for Plans and Approvals Doug Beisch (WEG, now Stantec) April 2, 2014 Introduction and overview Why are we here? About Stantec Williamsburg Environmental Group
Stormwater Management Update Requirements for Plans and Approvals Doug Beisch (WEG, now Stantec) April 2, 2014 Introduction and overview Why are we here? About Stantec Williamsburg Environmental Group
Project Priority List scoring worksheet - stormwater Guidance document
 www.pca.state.mn.us Project Priority List scoring worksheet - stormwater Guidance document PLEASE NOTE: THE MINNESOTA STATE FISCAL YEAR IS FROM JULY 1 JUNE 30 The first step towards receiving either a
Choosing BMPs and Monitoring Them. James Houle and Tim Puls, UNH Stormwater Center
 Choosing BMPs and Monitoring Them James Houle and Tim Puls, UNH Stormwater Center Choosing BMPs Both Willow Brook and this reach of the Cocheco River are listed as impaired for aquatic life(ph) and Primary
IBS Site Drainage: Senior Design Project
 IBS Site Drainage: Senior Design Project Len Wright, Ph.D., PE Lecturer, CEAE Wright.Len@gmail.com September 11, 2008 mwsw204i1.ppt/1 OUTLINE Motivation for Stormwater Management Quantity (both onsite,
Beyond Pipe and Pond. Research Based Stormwater System Design. August 9, 2010
 Beyond Pipe and Pond Research Based Stormwater System Design August 9, 2010 Agenda for the Day Introduction UNHSC: UNHSC: A Resource A for Independent Data Data Unit (UOPs) Unit Operations & Processes
Stormwater Treatment Practice (STP) Calculator Instructions
 Calculator Instructions") Stormwater Treatment Practice (STP) Calculator Instructions The STP Calculator is a tool developed by the Department of Environmental Conservation (DEC) to estimate total phosphorus load reductions achieved
Stormwater Treatment Practice (STP) Calculator Instructions The STP Calculator is a tool developed by the Department of Environmental Conservation (DEC) to estimate total phosphorus load reductions achieved
GUIDELINES FOR STORMWATER BACTERIA REDUCTIONS THROUGH BMP IMPLEMENTATION NY/NJ HARBOR TMDL DEVELOPMENT
 GUIDELINES FOR STORMWATER BACTERIA REDUCTIONS THROUGH BMP IMPLEMENTATION NY/NJ HARBOR TMDL DEVELOPMENT Elevated bacteria in stormwater runoff in urban areas are well documented by many researchers. Monitoring
CHAPTER 7: guidance. categories: Pollutant Removal. Jordan Lake watershed) Cisterns. Bioretention Areas. Green Roofs. Dry. Proprietary Devices
 Cisterns. Bioretention Areas. Green Roofs. Dry. Proprietary Devices") CHAPTER 7: TOOLBOXES A. Water Quality BMP Toolbox The Water Quality BMP Toolbox is intended for use by Town off Cary staff and citizens for guidance regarding implementation of traditional, non-traditional,
CHAPTER 7: TOOLBOXES A. Water Quality BMP Toolbox The Water Quality BMP Toolbox is intended for use by Town off Cary staff and citizens for guidance regarding implementation of traditional, non-traditional,
WHEN AND WHY HIGHER LEVELS OF STORMWATER TREATMENT ARE REQUIRED AND HOW TO ACHIEVE THEM WATERSHED M ANAG EM ENT SERVICES, LLC
 WHEN AND WHY HIGHER LEVELS OF STORMWATER TREATMENT ARE REQUIRED AND HOW TO ACHIEVE THEM BY: ERIC LIVINGSTON WATERSHED M ANAG EM ENT SERVICES, LLC FLORIDA S STORMWATER RULES 1979 Chapter 17-4.248, F.A.C.
The Value of Monitoring in Stormwater Management
 The Value of Monitoring in Stormwater Management Workshop on Exemplary Local Government Stormwater Strategies to Protect and Restore Urban Watersheds: Combining Technology, Economics and Policy May 13,
EFFECTIVENESS AND COMPUTATIONAL AIDS B Y : M A R T Y W A N I E L I S T A
 EFFECTIVENESS AND COMPUTATIONAL AIDS B Y : M A R T Y W A N I E L I S T A ACKNOWLEDGEMENTS The Low Impact Design BMP workshops were presented on August 24 and 25, 2016 at the Escambia County Central Office
Water Resources Management Plan Appendix B
 B u r n s v i l l e M i n n e s o t a Water Resources Management Plan Appendix B Appendix B Page B-1 Burnsville, Minnesota STORM WATER LOW-IMPACT DEVELOPMENT GUIDE MANUAL SHORT ELLIOTT HENDRICKSON INC.
Introduction. Definitions of Land Use Terms Used in Spreadsheets. Tar-Pamlico Stormwater Rule 15A NCAC 2B.0258 Last Modified 3/20/2017
 Tar-Pamlico Stormwater Rule 15A NCAC 2B.0258 Last Modified 3/20/2017 Introduction The set of worksheets included in this file will enable stormwater permit applicants to comply with, and local governments
Paraprofessional Training Session 1
 Paraprofessional Training Session 1 Part 2: Stormwater Basics November 26, 2012 Rutgers University, Cook Campus Christopher C. Obropta, Ph.D., P.E. Extension Specialist in Water Resources Associate Professor
Simple Method for Estimating Phosphorus Export
 Appendix L Simple Method for Estimating Phosphorus Export 1. The Simple Method The Simple Method is a technique used for estimating storm pollutant export delivered from urban development sites. The method
Design Example Residential Subdivision
 Design Example Residential Subdivision Rhode Island Stormwater Design and Installation Standards Manual December 2010 Public Training March 22, 2010 Richard Claytor, P.E. 508-833-6600 Appendix D: Site
L-THIA Online and LID in a watershed investigation
 L-THIA Online and LID in a watershed investigation Larry Theller Agricultural and Biological Engineering, Purdue University Great Lakes Sedimentation Workshop Ann Arbor Mi. L-THIA On-line watershed delineation
Upper Eastern Shore WIP Workshop November 21, 2014
 Clean Water Optimization Tool for Maryland s Eastern Shore Karen Cappiella Program Director Center for Watershed Protection Upper Eastern Shore WIP Workshop November 21, 2014 Funded by the Town Creek Foundation
Mike Mitchell U.S. EPA Region 4
 Mike Mitchell U.S. EPA Region 4 Urban stormwater is a leading source of water quality impairment Urban stormwater identified as source of impairment (2004 WQ Report) 22,559 miles of impaired rivers and
Framework for Accounting and Tracking of Nutrient Loads and Reductions. Mark Voorhees, US EPA Region 1
 Framework for Accounting and Tracking of Nutrient Loads and Reductions Mark Voorhees, US EPA Region 1 Topics for Discussion Background & Context: Watershed Nutrient Issues & NPDES Stormwater Permitting
Appendix F: Modeled Benefits for New Wet Weather Structural BMPs
 Appendix F: Modeled Benefits for New Wet Weather Structural BMPs APPENDIX F: MODELED BENEFITS FOR NEW WET WEATHER STRUCTURAL BMPS F.1 Introduction The purpose of this appendix is to document the methodology
The Next Generation of Stormwater Management and Site Design. Melanie R. Grigsby, P.E. Stormwater Resource Manager, City of Fort Myers
 The Next Generation of Stormwater Management and Site Design Melanie R. Grigsby, P.E. Stormwater Resource Manager, City of Fort Myers History of WMD Stormwater Rule Florida passed the first rule requiring
SWMM5 LID Control for Green Infrastructure Modeling
 SWMM5 LID Control for Green Infrastructure Modeling Ohio Water Environment Association Collection Systems Workshop Matt McCutcheon, E.I. Water Resources Engineer CDM Smith May 9, 2013 11:15 AM 11:45 AM
Opti-Tool for Stormwater and Nutrient Management Mark Voorhees, US Environmental Protection Agency, Region 1
 Opti-Tool for Stormwater and Nutrient Management Mark Voorhees, US Environmental Protection Agency, Region 1 (voorhees.mark@epa.gov) What is Opti-Tool? Opti-Tool (Stormwater Management Optimization Tool)
Shirley E. Clark, Ph.D., P.E. October 5, /30/2012
 Shirley E. Clark, Ph.D., P.E. October 5, 2012 Prior development decisions have led to directly connected impervious areas and pervious areas with heavily-compacted soils. Prince Georges Cty, MD photo 1
Process-Based BMP Design Tool for Post-Construction. October 18, 2012
 Process-Based BMP Design Tool for Post-Construction October 18, 2012 EPA s Stated Goal + Reduce, through regulation, the impacts of new development and redevelopment storm water runoff to the Nation s
Sustainable Stormwater: Optimized Management of Ponds and Other BMPs. Kerry A Reed, P.E., LEED AP MACTEC Engineering and Consulting, Inc.
 Sustainable Stormwater: Optimized Management of Ponds and Other BMPs Kerry A Reed, P.E., LEED AP MACTEC Engineering and Consulting, Inc. Preliminary Conceptual Sustainability Planning for Stormwater Ponds
WHEN AND WHY HIGHER LEVELS OF STORMWATER TREATMENT ARE REQUIRED AND HOW TO ACHIEVE THEM WATERSHED M ANAG EM ENT SERVICES, LLC
 WHEN AND WHY HIGHER LEVELS OF STORMWATER TREATMENT ARE REQUIRED AND HOW TO ACHIEVE THEM BY: ERIC LIVINGSTON WATERSHED M ANAG EM ENT SERVICES, LLC STATEWIDE STORMWATER TREATMENT PROGRAMS STATE YEAR STATE
Presented to the WQGIT August 13, 2012
 RETROFIT PANEL RECOMMENDATIONS Presented to the WQGIT August 13, 2012 The Expert Panel Panelist Ray Bahr Ted Brown LJ Hansen Joe Kelly Jason Papacosma Virginia Snead Bill Stack Rebecca Stack Steve Stewart
EVALUATING LOW IMPACT DEVELOPMENT BEST MANAGEMENT PRACTICES AS AN ALTERNATIVE TO TRADITIONAL URBAN STORMWATER MANAGEMENT
 EVALUATING LOW IMPACT DEVELOPMENT BEST MANAGEMENT PRACTICES AS AN ALTERNATIVE TO TRADITIONAL URBAN STORMWATER MANAGEMENT Brandon Holzbauer-Schweitzer Region 6 Stormwater Conference 10/05/2016 Introduction
VIRGINIA RUNOFF REDUCTION METHOD Compliance Spreadsheet User s Guide & Documentation (April, 2012 Version 2.5)
") VIRGINIA RUNOFF REDUCTION METHOD Compliance Spreadsheet User s Guide & Documentation ( Version 2.5) Table of Contents 1.0 Introduction... 1 2.0 VRRM Compliance Spreadsheet Basics... 2 2.1 Site Data Tab...
VIRGINIA RUNOFF REDUCTION METHOD Compliance Spreadsheet User s Guide & Documentation ( Version 2.5) Table of Contents 1.0 Introduction... 1 2.0 VRRM Compliance Spreadsheet Basics... 2 2.1 Site Data Tab...
Environment, Energy, Security & Sustainability (E2S2)
") Environment, Energy, Security & Sustainability (E2S2) Modeling Your Way Through EISA Patrick N. Deliman, PhD Environmental Laboratory US Army Engineer Research and Development Center US Army Corps of Engineers
Environment, Energy, Security & Sustainability (E2S2) Modeling Your Way Through EISA Patrick N. Deliman, PhD Environmental Laboratory US Army Engineer Research and Development Center US Army Corps of Engineers
DC STORMWATER PLAN CONSOLIDATED TOTAL MAXIMUM DAILY LOAD (TDML) IMPLEMENTATION PLAN
 IMPLEMENTATION PLAN") DC STORMWATER PLAN CONSOLIDATED TOTAL MAXIMUM DAILY LOAD (TDML) IMPLEMENTATION PLAN CONTENTS Introduction 1 The Challenge 5 The Solution 7 Tracking Progress 11 What can you do? 15 INTRODUCTION The DC Stormwater
DC STORMWATER PLAN CONSOLIDATED TOTAL MAXIMUM DAILY LOAD (TDML) IMPLEMENTATION PLAN CONTENTS Introduction 1 The Challenge 5 The Solution 7 Tracking Progress 11 What can you do? 15 INTRODUCTION The DC Stormwater
The Use of WinSLAMM in the Selection, Design and Placement of Stormwater BMPs. Stephen J. Souza, Ph.D. Jacob E. Helminiak, P.E. Princeton Hydro, LLC
 The Use of WinSLAMM in the Selection, Design and Placement of Stormwater BMPs Stephen J. Souza, Ph.D. Jacob E. Helminiak, P.E. Princeton Hydro, LLC 1108 Old York Rd., Ringoes, NJ 08551 908.237.5660 The
Sustainable Water Resource Practices
 Sustainable Water Resource Practices This section is related to and shoudl be read in conjunction with the Land Use Element, and Conservation Element. Implementing sustainable water resource practices
Practical Applications of Stormwater BMPs for addressing Nutrient & Water Quality Challenges in Watersheds
 Practical Applications of Stormwater BMPs for addressing Nutrient & Water Quality Challenges in Watersheds Florida Water Quality Challenges in 2016 St. Lucie River Lake Okeechobee July 2, 2016 Port Mayaca
STORMWATER RUNOFF AND WATER QUALITY IMPACT REVIEW
 SUBCHAPTER 8 STORMWATER RUNOFF AND WATER QUALITY IMPACT REVIEW 7:45-8.1 Purpose and scope of review Except for those projects expressly exempted by this chapter or waived by the Commission, the Commission
Decatur, Georgia Stormwater Management Policy Guidelines. DRAFT November 5, 2014
 Decatur, Georgia Stormwater Management Policy Guidelines Stormwater Management Policy Guidelines Decatur, Georgia STORMWATER MANAGEMENT POLICY GUIDELINES 1.0 Introduction... 3 2.0 Determining Predevelopment
11. Public Utilities. Key Terminology: OVERVIEW STORMWATER MANAGEMENT WATERSHED MANAGEMENT ORGANIZATIONS AND COMMISSIONS. Inventory and Analysis
 Inventory and Analysis 11. Public Utilities Urbanized (drainage): Defined as an area where natural soils, waterways, and environmental functions are replaced with impervious surfaces (roads, parking lots,
Stormwater Retrofitting for Nutrient Reduction
 Stormwater Retrofitting for Nutrient Reduction otos: Chesapeake Bay Program Welcome to the Webcast To Ask a Question Submit your question in the chat box located to the left of the slides. We will answer
CENTRALIZED BMPS TYPICALLY PUBLICLY OWNED & MAINTAINED BMPS, TREATING A LARGE (>20 ACRES) URBAN DRAINAGE WITH MULTIPLE LAND
 URBAN DRAINAGE WITH MULTIPLE LAND") BMP RAM BMP Type Definitions 1 CENTRALIZED BMPS TYPICALLY PUBLICLY OWNED & MAINTAINED BMPS, TREATING A LARGE (>20 ACRES) URBAN DRAINAGE WITH MULTIPLE LAND USES AND OWNERSHIP STRUCTURAL BMP TYPE OTHER NAMES
BMP RAM BMP Type Definitions 1 CENTRALIZED BMPS TYPICALLY PUBLICLY OWNED & MAINTAINED BMPS, TREATING A LARGE (>20 ACRES) URBAN DRAINAGE WITH MULTIPLE LAND USES AND OWNERSHIP STRUCTURAL BMP TYPE OTHER NAMES
Meeting the Chesapeake Bay TMDL
 Meeting the Chesapeake Bay TMDL Local Stormwater Perspective Presented by Rob Hopper, PE Developed with Mike Morgan, PE September 14, 2015 Chesapeake Bay TMDL Local Stormwater Perspective Virginia Stormwater
New Rule Development for Unified Stormwater Quality Rules ERP Phase Two
 New Rule Development for Unified Stormwater Quality Rules ERP Phase Two Caloosahatchee River Watershed Protection Plan Working Team Meeting Wednesday, May 21, 2008 Damon Meiers and Susan Roeder Martin
In order to develop these comprehensive watershed retrofit plans, six key tasks were undertaken, each of which is described further below:
 Date: June 26, 2013 To: From: Christin Jolicoeur, Watershed Planner Jason Papacosma, Watershed Programs Manager Arlington County Department of Environmental Services Laura Gardner, Water Resources Engineer
Monitoring Stormwater Best Management Practices: Why Is It Important and What To Monitor
 Monitoring Stormwater Best Management Practices: Why Is It Important and What To Monitor Scott D. Struck, Ph.D. US EPA, Urban Watershed Management Branch New Jersey Water Monitoring Workshop 4/20/2006
n4.1 Site Assessment for Runoff Reduction Requirements
 Chapter 4 Smart Design for Stormwater Management 4.1 Site Assessment for Runoff Reduction Requirements 4.2 Site Water Balance 4.3 Runoff Reduction Volume 4.4 Runoff Treatment Volume 4.5 Flood Control and
Review of State and Federal Stormwater Regulations November 2007
 Review of State and Federal Stormwater Regulations November 2007 By: James T. Spaulding, PE, CPESC Joseph M. Ducharme, Jr., PE TTG ENVIRONMENTAL CONSULTANTS, LLC 27 LOCKE ROAD, CONCORD, NH 03301-5301 TELEPHONE:
UNH STORMWATER CENTER EFFECTIVE STORMWATER MANAGEMENT Lamprey River Symposium January 16, 2009
 UNH STORMWATER CENTER EFFECTIVE STORMWATER MANAGEMENT Lamprey River Symposium January 16, 2009 James Houle, CPSWQ, Robert Roseen, PE, PhD, Thomas Ballestero, PE, PhD, PH, CGWP, PG, Alison Watts, PhD, Tim
Connecticut Jordan Cove Urban Watershed Section 319 National Monitoring Program Project
 Connecticut Jordan Cove Urban Watershed Section 319 National Monitoring Program Project Figure 7: Jordan Cove Urban Watershed (Connecticut) Project Location 47 Existing residential control watershed with
Created to deliver targeted training on new tools and practices to improve the quality of stormwater runoff.
 The Runoff Reduction Theory Created to deliver targeted training on new tools and practices to improve the quality of stormwater runoff. http://www.cwp.org/cbstp Traditional Stormwater Approaches Focused
Design Handbook. Low Impact Development Best Management Practices
 Design Handbook for Low Impact Development Best Management Practices Prepared by: 9/2011 Riverside County Flood Control and Water Conservation District 1995 Market Street Riverside, CA 92501 TABLE OF CONTENTS