DOUGLAS COUNTY, COLORADO AND INCORPORATED AREAS
|
|
|
- Claude Harris
- 6 years ago
- Views:
Transcription


1 VOLUME 1 OF 3 DOUGLAS COUNTY, COLORADO AND INCORPORATED AREAS COMMUNITY NAME COMMUNITY NUMBER CASTLE PINES, CITY OF CASTLE ROCK, TOWN OF DOUGLAS COUNTY (UNINCORPORATED AREAS) LARKSPUR, TOWN OF LONE TREE, CITY OF PARKER, TOWN OF Douglas County REVISED: MARCH 16, 2016 Federal Emergency Management Agency FLOOD INSURANCE STUDY NUMBER 08035CV001B
2 NOTICE TO FLOOD INSURANCE STUDY USERS Communities participating in the National Flood Insurance Program have established repositories of flood hazard data for floodplain management and flood insurance purposes. This Flood Insurance Study (FIS) may not contain all data available within the repository. It is advisable to contact the community repository for any additional data. This FIS was revised on March 16, Users should refer to Section 10.0, Revisions Description, for further information. Section 10.0 is intended to present the most up-to-date information for specific portions of this FIS report. Therefore, users of this FIS report should be aware that the information presented in Section 10.0 supersedes information in Sections 1.0 through 9.0 of this FIS report. Part or all of this FIS may be revised and republished at any time. In addition, part of this FIS may be revised by the Letter of Map Revision process, which does not involve republication or redistribution of the FIS. It is, therefore, the responsibility of the user to consult with community officials and to check the community repository to obtain the most current FIS components. Initial Countywide FIS Effective Date: September 30, 2005 Revised Countywide FIS Dates: March 16, 2016
3 TABLES OF CONTENTS Table of Contents Volume 1 Revised March 16, 2015 Page 1.0 INTRODUCTION Purpose of Study Authority and Acknowledgments Coordination AREA STUDIED Scope of Study Community Description Principal Flood Problems Flood Protection Measures ENGINEERING METHODS Hydrologic Analyses Hydraulic Analyses Vertical Datum FLOODPLAIN MANAGEMENT APPLICATIONS Floodplain Boundaries Floodways INSURANCE APPLICATIONS FLOOD INSURANCE RATE MAP OTHER STUDIES LOCATION OF DATA BIBLIOGRAPHY AND REFERENCES REVISIONS DESCRIPTION First Revision 105 i
4 Table of Contents Volume 1 continued FIGURES Figure 1 Floodway Schematic 40 TABLES Table 1 Flooding Sources Studied by Detailed Methods 4-7 Table 2 Flooding Sources Studied by Approximate Methods 8-9 Table 3 Letters of Map Revision Table 4 Summary of Discharges Table 5 Manning s n Values Table 6 Vertical Datum Offset Table 37 Table 7 Floodway Data Table 8 Community Map History 98 Exhibit 1 Flood Profiles EXHIBITS Baldwin Gulch Panels 01P 07P Bayou Gulch Panels 08P 017P Big Dry Creek Panels 18P 22P Big Dry Creek Tributary C Panels 23P 25P Exhibit 1 Flood Profiles (Cont d) Table of Contents Volume 2 Revised March 16, 2015 EXHIBITS Carpenter Creek Panels 26P 28P Cherry Creek Panels 29P 46P Daniels Park Drain Panels 47P 48P Drainageway Panels 49P Drainageway Panels 50P Drainageway Panels 51P East Plum Creek Panels 52P 69P East Willow Creek Panels 70P 72P Fourmile Creek Panels 73P 88P Glade Gulch Panels 89P 90P Hangmans Gulch Panels 91P 99P Happy Canyon Creek Panels 100P 103P Highlands Gulch Panels 104P 105P Horse Creek Panels 106P 110P Indian Creek Panel 111P 116P ii
5 Industrial Creek Panels 117P 118P Jarre Creek Panels 119P 121P Table of Contents Volume 3 Revised March 16, 2015 EXHIBITS Exhibit 1 Flood Profiles (Cont d) Lehigh Gulch Panels 122P 123P Little Willow Creek Panels 124P 126P Louviers Gulch Panels 127P 128P McMurdo Gulch Panels 129P 135P McMurdo Gulch Split Flow Panels 136P 137P Mitchell Gulch Panels 138P 139P Mitchell Gulch Tributary 2 Panels 140P Newlin Gulch Panels 141P 144P Omni Tributary Panels 145P 146P Oxide Draw Panels 147P Plum Creek Panels 148P 155P Plum Creek Diversion Channel Panels 156P Rainbow Creek Panels 157P 158P Section 34 Tributary Panels 159P 165P Sellars Gulch Panels 166P 170P Sellars Gulch Tributary 2 Panels 171P South Platte River Panels 172P 186P Sterling Gulch Panels 187P 188P Sulphur Gulch Panels 189P 197P Tallman Gulch Panels 198P 202P Tributary 6400 East Panels 203P 205P Tributary 6400 West Panels 206P 209P Trout Creek Panels 210P 214P West Creek Panels 215P 222P West Plum Creek Panels 223P 229P Willow Creek Panels 230P 235P Willow Creek (At Lone Tree) Panels 236P 238P Tributary 6400 South Panels 239P - 241P Exhibit 2 Flood Insurance Rate Map Flood Insurance Rate Map iii
6 FLOOD INSURANCE STUDY DOUGLAS COUNTY, COLORADO AND INCORPORATED AREAS 1.0 INTRODUCTION 1.1 Purpose of Study This countywide Flood Insurance Study (FIS) revises and updates information on the existence and severity of flood hazards in the geographic area of Douglas County, Colorado, including: the Towns of Castle Rock, Larkspur, and Parker; the Cities of Castle Pines and Lone Tree; and the unincorporated areas of Douglas County (hereinafter referred to collectively as Douglas County). The cities of Aurora and Littleton are multiple county communities but are excluded from this FIS and included in their entirety in the Arapahoe County FIS. This FIS aids in the administration of the National Flood Insurance Act of 1968 and the Flood Disaster Protection Act of This study has developed flood risk data for various areas of the county that will be used to establish actuarial flood insurance rates. This information will also be used by Douglas County to update existing floodplain regulations as part of the Regular Phase of the National Flood Insurance Program (NFIP), and by local and regional planners to further promote sound land use and floodplain development. Minimum floodplain management requirements for participation in the NFIP are set forth in the Code of Federal Regulations at 44 CFR, In some States or communities, floodplain management criteria or regulations may exist that are more restrictive or comprehensive than the minimum Federal requirements. In such cases, the more restrictive criteria take precedence and the State (or other jurisdictional agency) will be able to explain them. 1.2 Authority and Acknowledgments The sources of authority for this FIS are the National Flood Insurance Act of 1968 and the Flood Disaster Protection Act of This FIS was prepared as part of a partial-countywide update to the September 30, 2005 countywide FIS for Douglas County. Information on the authority and acknowledgements for each jurisdiction included in this countywide FIS, as compiled from their previously printed FIS reports, is shown below. Castle Rock, Town of: the hydrologic and hydraulic analyses for the FIS report dated September 30, 1987, were prepared by Howard, Needles, Tammen and Bergendoff, for the Federal Emergency Management Agency (FEMA), under Contract No. H That work was completed in July The hydrologic and hydraulic analyses for portions of the streams studied by approximate methods 1
7 were performed by J. F. Sato and associates Inc., for FEMA, under Contract No. 84-C That work was completed in August Hydrologic information was obtained from the initial Castle Rock FIS, the Douglas County FIS, and previous Urban Drainage and Flood Control District (UDFCD) reports. The major portion of the hydraulic analyses was taken directly from the initial Castle Rock FIS and UDFCD reports. The balance of the analyses was developed by J.F. Sato and Associates, Inc. Douglas County (Unincorporated Areas): the hydrologic and hydraulic analyses for the January , FIS report were prepared by Howard, Needles, Tammen and Bergendoff, for FIA, under Contract No. H That work was completed in July The hydrologic and hydraulic analysis for portions of East Plum Creek and Sellars Gulch and for portions of streams studied by approximate methods were performed by J. F. Sato and Associates, Inc., for FEMA, under Contract No. 84-C That work was completed in August The major portion of the hydrologic information was obtained from the initial Douglas County FIS, and previous UDFCD reports. The balance of the analyses was developed by J.F. Sato and Associates, Inc. Larkspur, Town of: Parker, Town of: the hydrologic and hydraulic analyses for the September 30, 1987, FIS were taken from the FIS for Douglas County. the hydrologic and hydraulic analyses for the February 2, 1996, FIS were taken from the FIS for Douglas County. The authority and acknowledgments for the Cities of Castle Pines and Lone Tree are not included because there are no previously printed FIS reports for those communities. For the 2005 countywide FIS, the updated and new hydrologic and hydraulic analyses were taken from the following UDFCD, Colorado Water Conservation Board (CWCB), and Douglas County reports: Flood Hazard Area Delineation Big Dry Creek (Arapco) & Tributaries, prepared by WRC Engineering, Inc. Flood Hazard Area Delineation Willow Creek, Little Willow Creek, and East Willow Creek, prepared by Greenhorne & O Mara, Inc. Flood Hazard Area Delineation Plum Creek Watershed, prepared by WRC Engineering, Inc. 2
8 Flood Hazard Area Delineation, Cherry Creek Corridor Reservoir to Scott Road, prepared by URS Corporation Plum Creek and East Plum Creek, Flood Hazard Area Delineation (FHAD), Flood Insurance Study Documentation, Technical Appendix, prepared by ICON Engineering, Inc. Kinney Creek and Fonder Draw Flood Hazard Area Delineation (FHAD), Flood Insurance Study Documentation, Technical Appendix, prepared by WRC Engineering, Inc. Post-Wildfire Floodplain Study, Hayman Burn Area, Douglas County, Colorado. In addition to the reports above, updated hydraulic analysis were performed for Hangmans Gulch using digital topography provided by Douglas County. Floodplain delineations were also revised for detailed streams outside of the UDFCD boundary using digital topography provided by Douglas County. Base Map information shown on the unrevised 2005 FIRM panels was provided by the Douglas County GIS Department and the Town of Castle Rock GIS Department. Additional input was provided by the City of Lone Tree and Town of Parker. These data are current as of Base Map information shown on the FIRM panels revised with this update was provided by the same entities and is current as of The coordinate system used for the production of the digital FIRM is Universe Transverse Mercator referenced to North American Datum of 1983 and the GRS 80 spheroid, Western Hemisphere. 1.3 Coordination The purpose of an initial Consultation Coordination Officer s (CCO) meeting is to discuss the scope of the FIS. A final CCO meeting is held to review the results of the study. A meeting was held on July 8, 1976, to discuss streams studied in the original study for Douglas County and the methods of study to be used. The meeting was attended by representatives of FEMA; the Douglas County Planning and Zoning Department; the UDFCD; and Howard, Needles, Tammen and Bergendoff, the study contractor. Subsequent meetings and calls to the Douglas County Planning Director provided pertinent zoning and current development information. For the September 30, 1987, restudy for Douglas County, an initial community coordination meeting was held on April 10, 1984, to set priorities for study reaches. The meeting was attended by representatives of FEMA; CWCB; UDFCD; U.S. Soil Conservation Service (SCS); the Douglas County Planning Department; and J.F. Sato and Associates, Inc., the study contractor. The study area was subsequently modified at the direction of FEMA to include additional reaches to be studied by approximate methods. The final study scope was reviewed with Douglas County Planning Department, Town of Castle Rock, and Engineering Department staff at a meeting on September 17,
9 2.0 AREA STUDIED An intermediate community coordination meeting for the Douglas County restudy was held on July 29, 1985, to discuss the findings of the study. Representatives of FEMA, CWCB, UDFCD, Douglas County Planning Department, Town of Castle Rock, and the study contractor attended the meeting. The following sources were contacted for information during the preparation of the January 5, 1996, FIS for Douglas County. 1. U.S. Soil Conservation Services 2. U.S. Geological Survey (USGS) 3. U.S. Army Corps of Engineers (USACE) 4. Colorado Water Conservation Board 5. Colorado Department of Highways 6. Colorado State Historical Society 7. Douglas County Planning Director 8. M&I, Inc. For the 2005 countywide FIS, a final CCO meeting was held on March 25, 2005, and was attended by representatives of the state, the study contractor, the community, and FEMA. The final CCO meeting for this partial-countywide update was held August 13, 2014 and attended by representatives of the communities, UDFCD, CWCB, the study contractor, and FEMA. 2.1 Scope of Study This FIS covers the geographic area of Douglas County, Colorado. All or portions of the flooding sources listed in Table 1 were studied by detailed methods in the January 5, 1996, FIS. TABLE 1 FLOODING SOURCES STUDIED BY DETAILED METHODS Stream Stream Miles Plum Creek (Sedalia to Chatfield Lake) 8.0 East Plum Creek 21.5 Indian Creek 1.5 West Plum Creek (at Perry Park) 3.0 Hangmans Gulch 2.0 Sellars Gulch 2.7 Carpenter Creek (at Greenland) 1.5 Cherry Creek 16.0 Happy Canyon Creek (at Grandview Estates) 3.5 Newlin Gulch 5.0 Baldwin Gulch 3.5 Sulphur Gulch 5.0 Tallman Gulch 3.0 4
10 TABLE 1 FLOODING SOURCES STUDIED BY DETAILED METHODS - continued Stream Stream Miles Bayou Gulch 4.0 South Platte River 1.5 Horse Creek 0.5 West Creek 1.5 For the September 30, 2005 countywide FIS, the following streams were either restudied or newly studied by detailed methods: Stream Big Dry Creek Big Dry Creek Tributary C Cherry Creek Daniels Park Drain Drainageway Drainageway Drainageway East Plum Creek East Willow Creek Fourmile Creek Limits of Revised or New Detailed Study From the Douglas County/Jefferson County border, which is defined along County Line Road, south 5.9 miles From the confluence with Big Dry Creek to a point approximately 3 miles upstream. From Cherry Creek Reservoir to Scott Road, a point approximately 16.5 miles upstream of the reservoir. From the confluence with Plum Creek to a point approximately 1.6 miles upstream. From the confluence with Plum Creek to a point approximately 0.8 miles upstream. From the confluence with Louviers Gulch to a point approximately 0.8 miles upstream. From the confluence with Indian Creek to a point approximately 0.8 miles upstream. From the confluence with Plum Creek to a point approximately 1.2 miles upstream of the confluence with Drainageway From the confluence with Willow Creek to a point approximately 2.6 miles upstream. From the confluence with the South Platte River to a point approximately 7.8 miles upstream. 5
11 Stream Hangmans Gulch Highlands Gulch Horse Creek Indian Creek Jarre Creek Lehigh Gulch Little Willow Creek Louviers Gulch Oxide Draw Limits of Revised or New Detailed Study From the confluence with East Plum Creek to a point approximately 2.2 miles upstream. From the confluence with Plum Creek to a point approximately 1.5 miles upstream. From the confluence with South Platte River to a point approximately 4.0 miles upstream. From the confluence with Plum Creek to a point approximately 7.2 miles upstream. From the confluence with Plum Creek to a point approximately 2.7 miles upstream. From the confluence with Indian Creek to a point approximately 2.2 miles upstream. From the confluence with Platte Canyon Reservoir to a point 3.5 miles upstream. From the confluence with Plum Creek to a point approximately 1.9 miles upstream. From the confluence with Plum Creek to a point approximately 0.7 miles upstream. Plum Creek From the Highline Canal approximately 8.9 miles upstream to the confluence with East Plum Creek. Plum Creek Diversion Channel Rainbow Creek Sterling Gulch From a point approximately 500 feet upstream of the confluence with Plum Creek to a point approximately 0.6 mile upstream of the confluence with East Plum Creek. From the confluence with Indian Creek to a point approximately 1.5 miles upstream. from the confluence with Plum Creek to a point 1.7 miles upstream 6
12 Stream South Platte River Trout Creek West Creek West Plum Creek Willow Creek Limits of Revised or New Detailed Study From a point 1,600 feet downstream of County Road 97 (Bridge F-10-A8) to a point 3,200 feet upstream of the bridge. From a point 4.2 miles upstream of County Road 97 (Bridge F-10-A8) to a point 1.6 miles upstream of Road 67 (Bridge E-5-1A) From the confluence with the Horse Creek to a point approximately 2.1 miles upstream. From the confluence with Trout Creek to a point approximately 11.5 miles upstream. From the confluence with Plum Creek to a point approximately 2.9 miles upstream. From the confluence with the South Platte River to a point 1.9 miles upstream. For the current, partial-countywide update, all or portions of the following streams were either restudied or newly studied by detailed methods: East Plum Creek, Hangman s Gulch, Industrial Tributary, McMurdo Gulch, McMurdo Gulch Split Flow, Mitchell Gulch, Mitchell Gulch Tributary 2, Omni Tributary, Sellars Gulch, Sellars Gulch Tributary 2, Tributary 6400 East and Tributary 6400 West, and Willow Creek (at Lone Tree). New detailed studies with the City of Castle Rock along Industrial Creek Tributary, Mitchell Gulch Tributary 1, and Sellars Gulch Tributary 1 as well as additional upper reach study areas of several of the above-mentioned new studies are depicted on the FIRM with a shaded Zone X floodplain, indicating future flood hazard areas. Because no FIS tabular information correlates with Zone X (shaded) floodplains, these future flooding reaches are not included in the FIS tables or exhibits. Limits of detailed study are indicated on the Flood Profiles (Exhibit 1) and on the FIRM (Exhibit 2). All or portions of the streams in Table 2 were studied by approximate methods in the January 5, 1996, FIS. 7
13 TABLE 2 FLOODING SOURCES STUDIED BY APPROXIMATE METHODS Stream Stream Miles Badger Gulch 1.6 Bear Creek 6.0 Big Dry Creek 5.7 Carpenter Creek 6.0 Cottonwood Creek 4.5 Dad Clark Gulch 6.5 East Plum Creek 23.0 Garber Creek 4.9 Glade Gulch 1.6 Happy Canyon Creek 9.2 Happy Canyon Creek Tributary 1.6 Haskins Gulch 2.0 Hunt Gulch 1.0 Indian Creek 8.0 Jackson Creek 8.0 Jarre Creek 6.0 Jordan Road Tributary 2.0 Kinney Creek 4.0 KOA Tributary 1.7 Larkspur Butte Tributary 1.6 Marcy Gulch 4.7 McMurdo Gulch 2.4 Mitchell Gulch 1.6 Newlin Gulch 4.7 North Gulch 1.7 Oak Gulch 1.7 Oakland School Gulch 3.2 Piney Creek 2.4 Section 34 Tributary 1.3 Sellars Gulch 3.6 South Newlin Gulch 1.1 Spring Gulch 5.0 Stark Creek 4.0 Tributary A 1.3 Tributary B 1.0 Tributary C 0.6 Tributary D Tributary, East & West Forks South Tributary 2.4 West Plum Creek 15.5 Willow Gulch 2.0 8
14 For the 2005 countywide FIS, the following streams were either restudied or newly studied by approximate methods: Stream Stream Miles Dad Clark Gulch 3.4 Dad Clark Gulch Tributary Dad Clark Gulch Tributary Dad Clark Gulch Tributary Drainageway East Dad Clark Gulch 1.7 East Dad Clark Gulch Tributary Fonder Draw 2.6 Kinney Creek 8.5 Marcy Gulch 3.1 Marcy Gulch Tributary Marcy Gulch Tributary South Platte River 3 Stream Stream Miles South Platte River Unnamed Tributary South Platte River Unnamed Tributary South Platte River Unnamed Tributary South Platte River Unnamed Tributary 4 1 Spring Gulch 1.7 For the 2005 countywide study, the existing FIRM was converted to a Digital FIRM (DFIRM). Detailed analyses were taken from the effective FIRM or from existing UDFCD reports. The existing detailed analysis was originally used in developed areas or areas with a high development potential. The existing approximate analysis was originally used to study those areas that detailed information was not available or those areas having a low development potential or minimal flood hazards. The scope and methods of study were proposed to, and agreed upon by, FEMA, CWCB, UDFCD, and Douglas County. The 2005 countywide FIS also incorporated the determinations of letters issued by FEMA resulting in map changes (Letter of Map Revision [LOMR]), as shown in Table 3, Letters of Map Revision. 9
15 TABLE 3 LETTERS OF MAP REVISION Community Flooding Source(s) and Project Identifier Date Issued Type Town of Castle Rock East Plum Creek Tributary D May 22, 2003 LOMR Tributary B Castle Rock Factory Store Expansion September 12, 2002 LOMR Tributary B to East Plum Creek October 2, 2000 LOMR 6400 Tributary East Fork January 24, 2003 LOMR Tributary D to East Plum Creek September 12, 2000 LOMR Tributary B to East Plum Creek December 3, 1999 LOMR Hangmans Gulch June 18, 1996 LOMR Tributary C to East Plum Creek West Fork of Tributary 6400 August 7, 1995 LOMR Village No. Diversion Channel April 5, 1995 LOMR Unnamed Tributary to Sellars Gulch November 21, 1994 LOMR Omni Drainageway March 10, 1994 LOMR Tributary 6400 East Fork and Tributary 6400 West Fork January 14, 1994 LOMR Douglas County (Unincorporated Areas) Newlin Gulch July 30, 2003 LOMR Bayou Gulch / Cherry Creek July 23, 2003 LOMR Sulpher Gulch June 25, 2003 LOMR East Plum Creek Tributary D May 22, 2003 LOMR Happy Canyon Creek April 24, 2003 LOMR Tributary A January 24, 2003 LOMR Sulpher Gulch January 16, 2003 LOMR Tributary B to East Plum Creek September 12, 2002 LOMR Newlin Gulch June 22, 2001 LOMR Green Acres Tributary March 14, 2001 LOMR Tributary B to East Plum Creek October 2, 2000 LOMR Tributary A of East Plum Creek September 11, 2000 LOMR Big Dry Creek June 29, 2000 LOMR Tributary B to East Plum Creek December 3, 1999 LOMR Tallman Gulch March 29, 1999 LOMR Sulpher Gulch May 4, 1998 LOMR Willow Creek April 17, 1998 LOMR Newlin Gulch August 27, 1997 LOMR Jordan Road Tributary March 3, 1997 LOMR Tributary C to East Plum Creek August 7, 1995 LOMR Village No. Diversion Channel April 5, 1995 LOMR East Plum Creek November 18, 1994 LOMR Jordan Road Tributary August 29, 1994 LOMR Tributary 6400 East Fork and Tributary 6400 West Fork January 14, 1994 LOMR Town of Parker Unnamed Tributary D December 5, 2003 LOMR Cherry Gulch / Newlin Gulch July 30, 2003 LOMR Sulpher Gulch June 25, 2003 LOMR 10
16 For the current partial-countywide update, the following LOMRs were incorporated: TABLE 3 LETTERS OF MAP REVISION - continued Community Flooding Source(s) and Project Identifier Date Issued Type Town of Castle Rock Douglas County (Unincorporated Areas) 6400 Tributary East Fork 6400 Tributary West Fork 6400 South Tributary 6400 South Tributary East Plum Creek Tributary C East Plum Creek 6400 West Stabilization Project July 11, 2007 October 1, 2007 January 16, 2008 September 19, 2008 August 4, 2011 January 13, 2012 May 1, 2015 LOMR LOMR LOMR LOMR LOMR LOMR LOMR Plum Creek April 10, 2006 LOMR Baldwin Gulch July 26, 2006 LOMR Happy Canyon Creek & Badger Gulch January 18, 2007 LOMR Scott Gulch & Scott Gulch Tributary B May 29, 2007 LOMR Cherry Creek May 22, 2008 LOMR Baldwin Gulch August 21, 2008 LOMR Newlin Gulch January 9, 2009 LOMR Newlin Gulch February 6, 2009 LOMR Newlin Gulch April 23, 2009 LOMR Cherry Creek September 25, 2009 LOMR Cottonwood Creek September 25, 2009 LOMR Tributary A of East Plum Creek September 30, 2009 LOMR Badger Gulch November 19, 2009 LOMR Newlin Gulch October 29, 2010 LOMR Cherry Creek April 29, 2011 LOMR Newlin Gulch June 30, 2011 LOMR East Plum Creek January 13, 2012 LOMR Stonegate Tributary January 11, 2013 LOMR 6400 West Stabilization Project May 1, 2015 LOMR Fonder Draw LOMR June 12, 2015 LOMR City of Lone Tree Happy Canyon Creek & Badger Gulch January 18, 2007 LOMR Happy Canyon Creek & Badger Gulch November 22, 2011 LOMR Town of Parker Tallman Gulch March 8, 2006 LOMR Oak Gulch July 12, 2006 LOMR Baldwin Gulch July 26, 2006 LOMR Newlin Gulch January 9, 2009 LOMR Newlin Gulch February 6, 2009 LOMR Baldwin Gulch & Cherry Creek March 6, 2009 LOMR Newlin Gulch April 23, 2009 LOMR Cherry Creek September 25, 2009 LOMR Newlin Gulch Cherry Creek October 29, 2010 April 29, 2011 LOMR LOMR 11
17 2.2 Community Description Douglas County is located slightly northeast of the geographic center of Colorado, south of the City and County of Denver. The county seat is Castle Rock, located approximately 30 miles south of Denver. The 2010 population of Castle Rock was 51,348 (Reference 1). The 2010 population figures for the remainder of Douglas County are Larkspur (245), Lone Tree (11,852), Parker (47,169), and the unincorporated areas of Douglas County (120,950) (Reference 1). Douglas County is bordered on the north by Arapahoe County, on the west by Jefferson County, on the south by Teller and El Paso Counties, and on the east by Elbert County. Castle Rock, Parker, and Lone Tree and the northern portion of Douglas County have developed as residential areas with more development planned. Business and industrial activities in Denver support much of these areas working population. The result has been extensive growth, with a loss of agricultural land use. Most agricultural land use in the county is centered around livestock production; the remainder is cultivation. Douglas County is in the South Platte River watershed. The study areas of the South Platte River, Horse Creek at Deckers, and West Creek are within Pike National Forest. All the other study areas are part of two subbasins, Plum Creek and Cherry Creek. East Plum Creek originates in Pike National Forest and joins West Plum Creek near Sedalia. Plum Creek flows northerly and joins the South Platte River at Chatfield Lake. The climate of the plains area of the county is high inland continental, modified by the Rocky Mountains immediately to the west and Palmer Lake Divide to the south. Precipitation is light with an annual average of 15 to 18 inches. Totals vary substantially for individual years because a large part of the yearly total is from summer thunderstorms. Temperatures in the area range from a high slightly more than 100 degrees Fahrenheit ( o F) to a low of approximately 35 o F. The mean annual air temperature is 47 o F, and the mean summer air temperature is 66 o F. The northern one half of the plains area of the county consists of three basic soil types. Loamy and sandy soils exist on the floodplains and terraces. Terrain in these areas is nearly level to gently sloping to moderately steep, with sandy and gravelly soils on the uplands. Vegetation is mainly grass, with some Gambel oak, mountain mahogany, and ponderosa pine trees (Reference 2). Most of the remaining area is gently sloping to moderately steep, with loamy soils on the uplands. The southern portion of the plains area is gently sloping to the steep, with sandy soils on the uplands and loamy soils on the tablelands. Vegetation on the uplands is mainly mid-size and talk grasses, with Gambel oak and ponderosa pine trees. The tablelands vegetation is mainly western wheatgrass, junigrass, mountain meehley, and Gambel oak. 12
18 2.3 Principal Flood Problems Douglas County is located in an area that is prone to very intense rainfall, sometimes of cloudburst magnitude. Floods have resulted from storms covering large areas with heavy general rainfall as wet as from storms covering small area with extremely intense rainfall. Floods generally occur from May through August. The upland areas are characterized by dissected topographic relief with steep stream slopes. Rapid rises, high maximum discharges, short durations, and comparatively low volumes of total runoff characterize the floods. The roadways that cross the streams and obstruct flood flows are the most significant factor affecting flooding in the area. Other manmade objects, such as building, cars, and fences, as well as the natural vegetation of the flood plains, cause flow obstruction. The following accounts of flooding on the South Platte River, Plum Creek, and Cherry Creek area are representative of typical floods for which information is available. Three separate floods occurred during May and June The first originated in the Cherry Creek and Plum Creek basins, occurring during the night of May 19-20, 1864, and was caused primarily by a cloudburst in the upper part of those basins. On the morning of May 20, the flood inundated the lower portions of Denver at a depth of 1 to 5 feet, leaving great deposits of sand and gravel. Records indicate that 2.08 inches of rain occurred during a 2-hour period on July 14, The heaviest precipitation occurred between Franktown and a point about 5 miles north of Denver; the center was located near Parker. The rainfall started around 3pm and continued until around 5pm. Cherry Creek crested around 10pm and had a peak discharge of 25,000 cubic feet per second (cfs) in Denver. The Cherry Creek Flood Commission estimated that runoff occurred from an area of approximately 200 square miles. Flood damages in the reach between Franktown and the site of the existing Cherry Creek Dam and Reservoir totaled $554,000. In June 1921, the rainfall extended east of the mountains for a considerable distance, and the plains tributaries as well as those in the mountains contributed flow into the South Platte River. No gaging stations were being maintained at the mouths of the tributaries. This flood caused the South Platte River to rise approximately 7 feet in Denver. The local press estimated that approximately 500 houses were inundated and many families were forced to seek higher ground. Three large packing plants and practically all of the lower feeding pens at the Denver Union Stockyards were flooded. Ten acres of railroad yards were flooded to a depth of 1-foot (Reference 3). A severe storm centered over the Bayou Gulch Basin, a tributary to Cherry Creek, during the afternoon of July 28, Heavy rainfall was reported to have occurred in a line bounded by lines 3 miles north of Parker, 4 miles west of Cherry Creek, and 1 mile south of Franktown, and by the Douglas-Elbert County 13
19 line on the east. Unofficial rainfall amounts varied from 1 inch and 3.5 inches and occurred in approximately 2 hours. An estimated peak flow of 8,700 cfs discharged out of Bayou Gulch. The discharge on Cherry Creek, 3 miles north of Parker, was estimated to be 17,000 cfs. Although no damage was experienced in Denver, this was considered a major flood for the upstream part of the basin. The storm of August 2 and 3, 1933, occurred over a 175 square mile area upstream from Franktown. Unofficial rainfall amounts varied from 3 to 9 inches and occurred over a 9-hour period between 6pm on August 2 and 3am on August 3. The most intense activity of the storm occurred between 9pm and 10pm. Waters in the existing Castlewood Dam and Reservoir reached the spillway crest around 11pm. The inflow was estimated at 35,000 cfs. Water overtopped the crest of the dam and the structure failed around 12am. The sudden release of water caused a flood wave to move down the valley. The peak discharge is estimated to have ranged from 126,000 cfs downstream of the dam to approximately 16,500 cfs near the confluence with the South Platte River. The Cherry Creek Flood Commission estimated the damages to be approximately $1 million; approximately $200,000 of this total occurred upstream from Denver. This flood caused additional economic damage to the Cherry Creek basin. Loss of the dam cut off water supply to approximately 3,000 acres of land. The basin suffered a severe recession and many families moved from the area. On September 9 and 10, 1933, a flood was caused by heavy rain on the divide separating Cherry Creek from Plum Creek, Big Dry, and Little Dry Creeks, which enter the South Platte River between the mouth of the South Platte River canyon and Denver. In an investigation of this flood, the office of the State Engineer made a slope-area determination of the flow in Plum Creek and found it to be 5,500 cfs. A large storm front moved into southeastern Colorado on August 25, 1945, and extended over the Cherry Creek Basin. Unofficial rainfall amounts varied from 2 to 5 inches. Severe flooding occurred along Cherry Creek in the Franktown- Parker area. The gaging station at Melvin recorded a peak discharge of 10,700 cfs. Total damages were estimated at $200,000. High intensity, heavy rains occurred at three locations in the Plum Creek Basin on the afternoon of June 16, Over 12 inches fell near Castle Rock and over 14 inches fell near Palmer Lake and near Larkspur in approximately 4 hours. East and West Plum Creeks crested at 126,000 cfs and 38,000 cfs, respectively, during the afternoon. The unit run off above the site on East Plum Creek just downstream from Castle Rock was 1,170 cfs per square mile for a drainage area of approximately 108 square miles. Western tributaries of West Plum Creek and all tributaries of Plum Creek downstream of Sedalia were out of the high rainfall areas and contributed little or no runoff during the flood. The combination of steep slopes, sand and gravel streambed, and relatively open and straight reaches of Plum Creek near Louviers was conductive to high velocities and standing waves. The computed mean velocities in seven cross sections surveyed after the flood were near 15 cfs, which implies maximum 14
20 velocities of approximately 20 to 22 cfs. The amount of scour and fill, the size of the cottonwood trees that were uprooted or bent over, and the matted condition of the debris on trees confirmed the computed velocities. The damage in rural areas of Plum Creek basin was extensive. The heavy runoff deposited all kinds of debris, from sand to huge boulders and trees, on fields and pastures. Road embankments were severely eroded and bridges on County, State and Interstate highways were destroyed. Large-cut banks, particularly along East Plum Creek, were left after land had been washed away. Much of the Town of Castle Rock was inundated, and service to approximately 100 telephones in town was disrupted. Seven homes, a church, the Grand Hall, and the lower part of the main street in Sedalia vanished during the flood. The Denver and Rio Grande Western Railroad between Denver and Palmer Lake, built in , had never been damaged as extensively as it was in Five bridges, many culverts, and about 4 miles of track were damaged. The track was out of service for approximately 6 weeks after the flood. Repairs to the facilities cost $468,000. The Atchison, Topeka, and Santa Fe Railway also follows the South Platte River and Plum Creek, and repairs, primarily to one bridge, cost approximately $500,000. Although the Plum Creek gaging station near Louviers was destroyed, observations indicated that the flow increased from about 150 to 154,000 cfs in less than 3 hours. The recurrence interval of this flood was estimated as greater than 500 years. Prior to the 1965 event, the maximum discharge was 7,700cfs, in August 1945 (Reference 4). Peak discharges along Cherry Creek were 1,000 cfs upstream from Franktown, 39,900 cfs near Melvin, and 58,000 cfs at Cherry Creek Dam. An estimated peak flow of 14,000 cfs discharged from Piney Creek, a right bank tributary of Cherry Creek. During the evening and night of June 16, the Cherry Creek Reservoir impounded a flood that had a volume of 116,000 acre-feet. Three of the 18 small dams constructed by the SCS in the upper Cherry Creek Basin between Franktown and Parker were filled. Two of these were subsequently overtopped and sustained erosion damage. The remaining 15 structures were out of the area of high intensity rainfall and received only moderate runoff. The heavy runoff caused major flooding along the main stem of Cherry Creek from the vicinity of Franktown to the Cherry Creek Reservoir. Approximately 2,720 acres were flooded. Most of the bridges across Cherry Creek were either damaged or destroyed. One life was lost during the flood on Cherry Creek. Flood damages totaled $1,306,000. No floods of consequence have occurred since In the summer of 2002, severe drought conditions in the western United States contributed to an unusually large number of wildfires in Colorado. The Hayman Fire burned approximately 138,000 acres (216 sq. mi.) in the South Platte River Basin (Reference 5), or approximately 10 percent of the basin upstream of the confluence with the North Fork South Platte River, near the community of South Platte. The fire was located in the southwestern corner of Douglas County, and included portions of Jefferson, Park, Teller and El Paso Counties. 15
21 2.4 Flood Protection Measures The possibility of flood damage in the upper Cherry Creek area has been reduced somewhat by the construction of 32 floodwater retarding structures. The SCS completed construction of these structures in 1965 as part of an overall plan. The plan is presented in two watershed work plans (References 6 and 7). These structures were designed for a rural agricultural community with design floods having a 25-year recurrence interval. Chatfield Dam, completed in 1976, provides flood protection, recreation, and water supply facilities for the City of Denver and its environs. The dam is located downstream of the mouth of Plum Creek. The effects on the dam have been taken into consideration in this FIS. 3.0 ENGINEERING METHODS For the flooding sources studied in detail in the county, standard hydrologic and hydraulic study methods were used to determine the flood hazard data required for this FIS. Flood events of a magnitude which are expected to be equaled or exceeded once on the average during any 10-, 50-, 100-, or 500-year period (recurrence interval) have been selected as having special significance for floodplain management and for flood insurance rates. These events, commonly termed the 10-, 50-, 100-, and 500-year floods, have a 10-, 2-, 1-, and 0.2-percent chance, respectively, of being equaled or exceeded during any year. Although the recurrence interval represents the long term average period between floods of a specific magnitude, rare floods could occur at short intervals or even within the same year. The risk of experiencing a rare flood increases when periods greater than 1 year are considered. For example, the risk of having a flood which equals or exceeds the 100-year flood (1-percent chance of annual exceedence) in any 50- year period is approximately 40 percent (4 in 10), and, for any 90-year period, the risk increases to approximately 60 percent (6 in 10). The analyses reported herein reflect flooding potentials based on conditions existing in the county at the time of completion of this FIS. Maps and flood elevations will be amended periodically to reflect future changes. 3.1 Hydrologic Analyses Hydrologic analyses were carried out to establish the peak discharge-frequency relationships for each flooding source studied in detail affecting the community. For each community within Douglas County that has a previously printed FIS report, the hydrologic analyses described in those reports have been compiled and are summarized below. Precountywide Analyses For the January 5, 1996, FIS, the synthetic hydrograph method was used to obtain peak discharge for Plum Creek, East Plum Creek, West Plum Creek (at Perry 16
22 Park), Hangmans Gulch, Sellars Gulch, Unnamed Tributary to Sellars Gulch, Carpenter Creek, Happy Canyon Creek, Newlin Gulch, Baldwin Gulch, Sulphur Gulch, Tallman Gulch, Bayou Gulch, and West Creek. The analysis was based on a 24-hour storm with a Type IIA distribution, as described in the SCS National Engineering Handbook (U.S. Department of Agriculture, 1972). The amount of rainfall was obtained from a precipitation frequency-atlas (U.S. Department of Commerce, 1973) and a real adjustment was applied to convert the point precipitation values to average precipitation over the entire watershed area. Hydrologic soil cover complexes and associated Runoff Curve Numbers were obtained from field investigations, a soil survey of Castle Rock (U.S. Department of Commerce, 1973), an unpublished SCS study of the area, and land use and natural plant coverage maps of Douglas County (U.S. Department of Agriculture, 1971; U.S. Department of Agriculture, 1974; U.S. Department of Agriculture, 1973). Values of 10-, 50-, 100- and 500- year peak discharges were obtained using the computer program developed by the SCS (U.S. Department of Agriculture, 1976). The computed peak discharges compare favorably with the peak discharges estimated using the USGS Technical Manual No. 1 (U.S. Department of the Interior, Technical Manual No.1, 1976). Discharge magnitudes for floods in Cherry Creek analyzed in the 1996 FIS were based on an analysis of stream gaging data at the USGS stream gages located approximately 2.5 miles south of Franktown and 6 miles northwest of Parker. This information was obtained from a USACE Flood Plain Information report (USACE, 1976). Discharge-frequency relationships for the upstream and downstream limits of the study reach were developed using data from the Franktown and Parker stream gages, respectfully. The presence of 32 flood retarding structures in the Cherry Creek Basin constructed by the SCS was taken into consideration. A continuous record of flows at stream gaging station No , located on the South Platte River at South Platte, is available from 1900 to the present, and stream gaging station No , below Cheesman Lake, has a continuous record of flows from 1925 to the present. Discharge magnitudes for floods analyzed in the 1996 FIS detailed study of the South Platte River and Horse Creek were based on statistical analyses of the previously mentioned stream gaging records, as explained in U.S. Water Resources Counsel Bulletin 17 (U.S. Water Resources Council, 1976). Discharge-probability relationships for the upstream and downstream study limits were developed using data from the gaging stations below Cheesman Lake and at South Platte, respectively. Hydrologic information for the streams studied by approximate methods, for the 1996 FIS, was obtained from various sources. Existing UDFCD reports were used directly for Badger Gulch, Big Dry Creek, Cottonwood Creek, Dad Clark Gulch, Happy Canyon Creek, Marcy Gulch, McMurdo Gulch, and Piney Creek (Howard, Needles, Tammen & Bergendoff, 1977; VTN Engineers, Architects, Planners, 1973; Gingery Associates, Inc., Piney Creek, 1975). A drainage area 17
23 versus discharge curve was developed using UDFCD information for Happy Canyon Creek Tributary, Jordan Road Tributary, KOA Tributary, Newlin Gulch, South Newlin Gulch, and Oak Gulch. A procedure that was developed by the SCS was used for the 6400 Tributaries (U.S. Department of Agriculture, 1980), the computer model SWWM was used for Tributary A (U.S. Environmental Protection Agency, Computer Model SWWM) and the SCS TR-20 computer program was used to develop hydrologic information for Glade Gulch and Section 34 Tributary (U.S. Department of Agriculture, 1976). Technical Manual No. 1 (U.S. Department of Agriculture, Technical Manual No. 1, 1976) was used for all other approximate-study reaches. Countywide Analyses Peak discharges for Big Dry Creek, and Big Dry Creek Tributary C were obtained using version CUHPE/PC of the Colorado Urban Hydrograph Procedure (CUHP) by UDFCD (WRC Engineering, Inc., 1996; Urban Drainage and Flood Control District, 1984). A modified 2-hour design storm distribution recommended by the Urban Storm Drainage Criteria Manual (USDCM) (Urban Drainage and Flood Control District, 1984) was used within CUHP to produce runoff hydrographs required for the flow routing required in the UDFCD Stormwater Management Model (SWMM) (Urban Drainage and Flood Control District, 1989). Values of 10-, 50-, 100, and 500-year peak discharges were obtained using the SWMM computer program. Peak discharges for Willow Creek, Little Willow Creek, and East Willow Creek were obtained using version CUHPF/PC of the CUHP by UDFCD (Urban Drainage and Flood Control District, 1996). One-hour rainfall depths were developed using criteria from the Douglas County Drainage Criteria Manual (Greenhorne & O Mara, 1996; Douglas County, 1986) and the USDCM. Onehour rainfall depths distributed over a two-hour design storm were used within CUHP to produce runoff hydrographs required for the flow routing required in the UDFCD Stormwater Management Model (UDSWM386) (Urban Drainage and Flood Control District, 1985). Values of 10-, 50-, and 100-year peak discharges were obtained using the SWMM computer program. Discharge magnitudes for Daniels Park Drain, Drainageways , , , Highlands Gulch, Indian Creek, Jarre Creek, Lehigh Gulch, Louviers Gulch, Oxide Draw, Plum Creek, Rainbow Creek, Sterling Gulch, and West Plum Creek (near the Plum Creek Confluence) were obtained using version CUHP98 (WRC Engineering, Inc., 2001; Urban Drainage and Flood Control District, 1985) of the CUHP by UDFCD. Design storm distributions were developed using criteria from the Douglas County Drainage Criteria Manual and the USDCM. These storm distributions were used within CUHP to produce runoff hydrographs required for the flow routing required in the UDFCD Stormwater Management Model (UDSWM98) (Urban Drainage and Flood Control District, 1989). Values of 10-, 50-, and 100-year peak discharges were obtained for all of the streams listed above using the SWMM computer program. In addition, peak discharges for the 500-year event were obtained for Plum Creek. 18
24 Peak discharges for Cherry Creek were obtained from the 1996 FIS for Douglas County (FEMA, 1996) after these discharges were verified using version CUHP2000 of CUHP and UDSWM (URS Corporation, 2003; Urban Drainage and Flood Control District, Colorado Urban Hydrograph Procedure, CUHP2000, Version 1.1; Urban Drainage and Flood Control District, 2001). With the exception of the 0.9-mile reach of the South Platte River at the community of South Platte, the hydrologic information for the South Platte River, Horse Creek, Trout Creek, and West Creek was obtained from the report, Analysis of Post-Fire Hydrologic Hazards for the 2002 Hayman, Coal Seam and Missionary Ridge Wildfires, Colorado (U.S. Geological Survey, 2004). For the South Platte River the discharge profile used for the current hydraulic analysis for both the main detailed study reach and the approximate study reach was prepared by correlating peak flows at specific nodes within the USGS hydrologic model to physical locations along the South Platte River. As the USGS report did not provide any specific hydrologic information for the South Platte River near the community of South Platte, the peak flows used for the hydraulic analysis of this lower reach were developed by analyzing historical gage data both on the South Platte River downstream of South Platte, and on the North Fork South Platte River which confluences with the South Platte River at the community of South Platte. This analysis assumed that the timing of the 100- year (1-percent annual chance) peak discharges from the various sources in the study area would be nearly concurrent, thereby allowing for direct addition of the peak flows (Anderson Consulting Engineers, 2004). Hydrologic information for the streams studied by approximate methods, for this revision, was obtained from various sources. Existing UDFCD reports were used directly for Dad Clark Gulch, East Dad Clark Gulch, Marcy Gulch, and their respective tributaries, and Spring Gulch (Urban Drainage and Flood Control District, Flood Hazard Area Delineation, Highlands Ranch). Hydrologic information for Drainageway 6631, Plum Creek, East Plum Creek, and the South Platte River and its four unnamed tributaries was obtained from the FIRMs for Douglas County, Colorado (FEMA, 1987). A summary of the drainage area-peak discharge relationships for the streams studied by detailed methods is shown in Table 4, Summary of Discharges. 19
25 TABLE 4 - SUMMARY OF DISCHARGES FLOODING SOURCE AND LOCATION DRAINAGE AREA (sq. miles) PEAK DISCHARGES (cfs) 10-YEAR 50-YEAR 100-YEAR 500-YEAR BALDWIN GULCH At Parker Road ,310 1,600 2,400 At Pine Drive Road At SCS Flood-Control ,350 1,670 2,560 Dam At Antelope Trail ,250 BAYOU GULCH At Confluence With ,930 7,620 9,340 13,800 Cherry Creek At State Highway ,940 7,640 9,400 13,850 At Upstream Limit of Detailed Study ,880 3,660 4,510 6,690 BIG DRY CREEK At County Line Road ,700 2,900 3,550 6,390 At C ,300 2,350 2,950 5,310 At Gleneagles Village ,250 2,100 2,550 4,590 Parkway At S. University Blvd ,440 At Confluence With ,800 4,400 6,000 10,800 Tributary C At S. Quebec Street ,350 3,250 5,850 At Quarry Road ,550 2,100 3,780 At Mcarthur Drive ,250 1,700 3,060 At Valley Road ,200 1,650 2,970 At Upstream Limit of Detailed Study ,100 1,500 2,700 BIG DRY CREEK TRIBUTARY C At Confluence with 3.07 * * 2,400 * Big Dry Creek At McArthur Ranch Road 1.63 * * 1,350 * At Upstream Limit of Detailed Study 0.12 * * 250 * *Data not available 20
26 TABLE 4 - SUMMARY OF DISCHARGES - continued FLOODING SOURCE AND LOCATION DRAINAGE AREA (sq. miles) PEAK DISCHARGES (cfs) 10-YEAR 50-YEAR 100-YEAR 500-YEAR CARPENTER CREEK At Denver & Rio Grande ,220 2,510 3,350 5,570 Western Railroad At County Road ,300 2,660 3,530 5,840 CHERRY CREEK At County Limits * 8,950 26,800 43, ,200 At Cottonwood Drive * 8,670 25,940 42, ,700 At E-470 * 8,480 25,360 41, ,700 At Lincoln Avenue * 8,100 24,200 39, ,740 At West Parker Road * 7,730 23,040 37, ,100 At Stroh Avenue * 6,610 19,570 31, ,200 At Scott Road * 6,000 17,500 27, ,000 At State Highway 86 * 5,500 12,600 19,080 79,000 DANIELS PARK DRAIN At Confluence with Plum Creek ,780 4,200 * At Cement Plant Road ,780 4,200 * (Station 1465) At D&RGW Railroad ,780 4,200 * At Lavaun Way ,780 4,200 * At AT&SF Railroad ,720 4,100 * At U.S. Hwy ,720 4,100 * At Upstream Limit of Detailed Study ,720 4,100 * DRAINAGEWAY At Confluence With Plum Creek * At D&Rgw Railroad * At Lavaun Way * At At&Sf Railroad * At U.S. Hwy * At Upstream Limit of Detailed Study * *Data not available 21
27 TABLE 4 - SUMMARY OF DISCHARGES - continued FLOODING SOURCE AND LOCATION DRAINAGE AREA (sq. miles) PEAK DISCHARGES (cfs) 10-YEAR 50-YEAR 100-YEAR 500-YEAR DRAINAGEWAY At Confluence with Louviers Gulch * At Moore Road * At Upstream Limit of Detailed Study * DRAINAGEWAY At Confluence with Indian Creek * At Upstream Limit of Detailed Study * EAST PLUM CREEK At Confluence with Plum Creek At Haskins Gulch At confluence of Unnamed Zone A near Castle Gate Drive At Confluence of Hangmans Gulch ,020 9,379 8,113 12,460 13,795 13,488 16,650 18,631 18,234 27,730 27,763 27, ,718 13,332 18,048 26,850 At Park Street, In Castle Rock ,248 12,548 16,954 25,192 At Crystal Valley Pkwy, In Castle Rock * 6,533 11,261 15,164 22,402 At I-25, In Larkspur ,300 11,000 14,800 24,800 At County Road ,340 11,100 14,900 25,000 At Perry Park Avenue ,670 11,600 15,400 25,600 At Spruce Mountain Road ,100 6,480 8,660 14,550 EAST WILLOW CREEK At Confluence With Willow Creek ,281 * At Highline Canal ,281 * At Rampart Range Road ,281 * At Roxborough Park Road ,176 * At Upstream Limit of Detailed Study * *Data not available 22
28 TABLE 4 - SUMMARY OF DISCHARGES - continued FLOODING SOURCE AND LOCATION DRAINAGE AREA (sq. miles) PEAK DISCHARGES (cfs) 10-YEAR 50-YEAR 100-YEAR 500-YEAR FOURMILE CREEK Just upstream of Confluence with South Platte River 8.4 * * 312 * Just upstream of YMCA Camp 7.4 * * 306 * At river station * * 261 * GLADE GULCH At confluence with East Plum Creek 1.2 * * 750 * HANGMANS GULCH Downstream of I ,008 1,293 At the Confluence of Tributary B * At Upstream Limit of Detailed Study HAPPY CANYON CREEK At Dogwood Avenue ,350 4,450 5,610 8,660 At Birch Avenue ,310 4,340 5,460 8,340 At Upstream Limit of Detailed Study 9.0 1,860 3,340 4,160 6,270 HIGHLANDS GULCH At Confluence with Plum Creek ,150 1,890 * At D&RWG Railroad ,150 1,890 * At AT&SF Railroad ,150 1,890 * At U.S. HWY ,150 1,770 * At Upstream Limit of Detailed Study ,150 1,720 * HORSE CREEK At Confluence with the South Platte River Just downstream of West Creek and Trout Creek Confluence * * 2,873 * * * 2,679 * *Data not available 23
29 TABLE 4 - SUMMARY OF DISCHARGES - continued FLOODING SOURCE AND LOCATION DRAINAGE AREA (sq. miles) PEAK DISCHARGES (cfs) 10-YEAR 50-YEAR 100-YEAR 500-YEAR INDIAN CREEK At Louviers Road ,550 4,520 6,550 * At Airport Road ,500 4,450 6,500 * At Confluence with ,200 3,400 4,800 * Lehigh Gulch At Private Road ,200 3,400 4,800 * (Station 17997) At Lambert Road ,100 3,200 4,400 * At Rainbow Creek Road ,050 2,920 4,100 * At Confluence with ,050 2,920 4,100 * Rainbow Creek At Cherokee Drive ,050 2,920 4,100 * At Upstream Limit of Detailed Study ,050 2,920 4,100 * INDUSTRIAL TRIBUTARY At Confluence with East Plum Creek * ,162 1,540 At Upstream Limit of Detailed Study * ,145 JARRE CREEK At Confluence with Plum Creek ,330 1,890 * At U.S. HWY ,330 1,890 * At Private Bridge ,320 1,880 * (Station 2805) At Private Bridge ,070 1,520 * (Station 6147) At Private Bridge (Station 8128) ,370 * At Upstream Limit of ,370 * Detailed Study *Data not available 24
30 TABLE 4 - SUMMARY OF DISCHARGES - continued FLOODING SOURCE AND LOCATION DRAINAGE AREA (sq. miles) PEAK DISCHARGES (cfs) 10-YEAR 50-YEAR 100-YEAR 500-YEAR LEHIGH GULCH At Confluence with Indian Creek ,350 1,900 * At Horse Trail Road (Station 8371) ,000 1,400 * At Upstream Limit of Detailed Study ,000 1,400 * LITTLE WILLOW CREEK At Waterton Road ,517 1,881 * At Village Circle West Road ,485 1,844 * At Roxborough Village Detention Pond ,723 2,293 * At Rampart Range Road ,526 2,034 * At Roxborough Road ,386 1,840 * LOUVIERS GULCH At Confluence with Plum Creek ,390 1,960 * At Dismantled ,390 1,960 * Railroad Bridge At Dupont Road ,320 1,870 * At Upstream Limit of Detailed Study ,150 * MCMURDO GULCH At Confluence with Cherry Creek * 1,880 4,449 5,967 8,201 At Confluence with Unnamed Stream * 1,394 3,124 4,144 5,637 At McMurdo Gulch Tributary 5 Confluence * 838 1,474 1,821 2,387 At State Highway 86 * MCMURDO GULCH SPLIT FLOW Entire Reach * MITCHELL GULCH At Mitchell Gulch Tributary 2 Confluence * 583 1,133 1,447 1,947 At Upstream Limit of Detailed Study * *Data not available 25
31 TABLE 4 - SUMMARY OF DISCHARGES - continued FLOODING SOURCE AND LOCATION DRAINAGE AREA (sq. miles) PEAK DISCHARGES (cfs) 10-YEAR 50-YEAR 100-YEAR 500-YEAR MITCHELL GULCH TRIBUTARY 2 At Confluence with Mitchell Gulch * At Enderud Boulevard South Crossing * NEWLIN GULCH At Jordan Road ,920 3,520 4,690 8,150 At West Parker Road ,890 3,450 4,590 7,920 At Upstream Limit of Detailed Study ,020 3,640 4,820 8,300 OMNI TRIBUTARY At Confluence with East Plum Creek * ,227 At Red Hawk Dr * ,035 1,307 OXIDE DRAW At Confluence with ,400 3,530 * Plum Creek At D&RGW Railroad ,400 3,530 * At AT&SF Railroad ,400 3,530 * At U.S. HWY ,400 3,645 * At Upstream Limit of ,400 3,650 * Detailed Study PLUM CREEK At Downstream Limit of ,190 28,730 38,590 69,460 Detailed Study At Titan Road ,150 28,800 38,710 69,680 At Louviers Avenue ,430 29,130 39,100 70,380 At Confluence of ,430 29,130 39,100 70,380 Indian Creek At Airport Road ,430 29,130 39,100 70,380 *Data not available 26
32 TABLE 4 - SUMMARY OF DISCHARGES - continued FLOODING SOURCE AND LOCATION DRAINAGE AREA (sq. miles) PEAK DISCHARGES (cfs) 10-YEAR 50-YEAR 100-YEAR 500-YEAR PLUM CREEK DIVERSION CHANNEL At mouth 2.8 * * 2,180 * RAINBOW CREEK At Cherokee Drive ,470 2,060 * SECTION 34 TRIBUTARY At confluence with East Plum Creek 1.9 * * 1,280 * At Bell Mountain Drive 0.3 * * 610 * SELLARS GULCH At Confluence with Sellars Gulch Tributary ,075 3,461 5,118 5,692 At East Haystack Road ,234 4,807 5,337 At Confluence with Sellars Gulch Tributary ,968 4,373 4,872 SELLARS GULCH TRIBUTARY 2 At Oman Road * 774 1,608 2,019 2,184 At Upstream Limit of Detailed Study * ,121 1,147 SOUTH PLATTE RIVER Downstream of the Community of South Platte * * * 12,150 * At the Confluence with the North Fork of the South Platte River * * * 9,630 * At Deckers * * * 5,750 * Downstream of Cheesman Reservoir * * * 5,220 * *Data not available 27
33 TABLE 4 - SUMMARY OF DISCHARGES - continued FLOODING SOURCE AND LOCATION DRAINAGE AREA (sq. miles) PEAK DISCHARGES (cfs) 10-YEAR 50-YEAR 100-YEAR 500-YEAR STERLING GULCH At Confluence with Plum Creek ,350 18,090 * At Titan Road ,350 18,090 * At Unnamed Tributary ,350 18,090 * At Upstream Limit of Detailed Study * SULPHUR GULCH At Private Road ,400 5,000 6,340 10,310 (Station 890) At Parker Road ,450 5,080 6,440 10,530 At Pikes Peak Drive ,450 5,070 6,430 10,530 At Stonehenge Way 9.6 1,820 3,680 4,640 7,450 At County Road ,030 1,960 2,460 3,960 TALLMAN GULCH At Seibert Circle (Station 520) At Siebert Circle (Station 2,475) At Unnamed Road (Station 5,175) ,310 1,660 2, ,060 1,390 2, ,060 1,390 2,370 TRIBUTARY 6400 EAST At the Confluence with Tributary 6400 West * ,219 At Cherokee Drive * ,158 At Upstream Limit of Detailed Study * ,098 1,405 TRIBUTARY 6400 WEST At the Confluence with Tributary 6400 East * At Morningview Drive * *Data not available 28
34 TABLE 4 - SUMMARY OF DISCHARGES - continued FLOODING SOURCE AND LOCATION DRAINAGE AREA (sq. miles) PEAK DISCHARGES (cfs) 10-YEAR 50-YEAR 100-YEAR 500-YEAR TROUT CREEK Just Upstream of Confluence with Horse Creek Just upstream of Rainbow Falls WEST CREEK Just Upstream of Confluence with Horse Creek Just downstream of Town of WestCreek Just Downstream of Little Creek * * 1,339 * * * 1,305 * 69.3 * * 1,653 * 60.1 * * 1,338 * 54.4 * * * WEST PLUM CREEK (Near the Plum Creek Confluence) At Confluence with East Plum Creek ,450 11,740 19,210 * At U.S. HWY ,450 11,740 19,210 * At Farm Road ,440 11,730 19,190 * (Station 12445) At Upstream Limit of Detailed Study ,440 11,730 19,190 * WEST PLUM CREEK (at Perry Park) At Perry Park Road ,770 5,910 8,320 14,790 (Station 85) At Perry Park Road ,840 6,200 8,730 16,180 (Station 90400) At Red Rock Drive ,660 5,740 7,900 14,500 At Private Road (Station 101,050) 8.1 1,210 2,680 3,620 6,170 *Data not available 29
35 TABLE 4 - SUMMARY OF DISCHARGES - continued FLOODING SOURCE AND LOCATION DRAINAGE AREA (sq. miles) PEAK DISCHARGES (cfs) 10-YEAR 50-YEAR 100-YEAR 500-YEAR WILLOW CREEK At Confluence with East ,844 6,003 7,930 * Willow Creek At Highline Canal ,577 3,690 5,071 * At Rampart Range Road ,577 3,690 5,071 * At Roxborough Park Road ,244 3,114 4,308 * At Unnamed Dirt Road ,197 2,998 4,164 * (Station 21720) At Unnamed Dirt Road ,419 3,302 * (Station 27364) At Unnamed Reservoir ,319 3,116 * (Station 31600) At Unnamed Tributary ,047 2,770 * (Station 33671) At Upstream Limit of Detailed Study ,774 2,419 * WILLOW CREEK (AT LONE TREE) Upstream of C-470 * 2,149 3,502 4,236 5,622 At Lone Tree Parkway * 520 1,014 1,145 1,578 At East Lincoln Avenue * , SOUTH TRIBUTARY ,129 * *Data not available The stillwater elevation of 5,539.2 feet North American Vertical Datum of 1988 has been determined for the 1% annual chance flood for the entire shoreline of the Platte Canyon Reservoir 3.2 Hydraulic Analyses Analyses of the hydraulic characteristics of flooding from the sources studied were carried out to provide estimates of the elevations of floods of the selected recurrence intervals. Users should be aware that flood elevations shown on the FIRM represent rounded whole-foot elevations and may not exactly reflect the elevations shown on the Flood Profiles or in the Floodway Data tables in the FIS report. For construction and/or floodplain management purposes, users are encouraged to use the flood elevation data presented in this FIS in conjunction with the data shown on the FIRM. 30
36 Locations of selected cross sections used in the hydraulic analyses are shown on the Flood Profiles (Exhibit 1) and on the FIRM (Exhibit 2). Flood profiles were drawn showing the computed water-surface elevations for floods of the selected recurrence intervals. The hydraulic analyses for this FIS were based on unobstructed flow. The flood elevations shown on the profiles are thus considered valid only if hydraulic structures remain unobstructed, operate properly, and do not fail. Pre-countywide Analyses Cross sections for the flooding sources studied by detailed methods were obtained from field surveys except for portions of East Plum and Happy Canyon Creeks, Sellars, Newlin, Baldwin, Sulphur, and Tallman Gulches. These areas were photographed and mapped, then digitized cross sections were obtained from the contour plans. All bridges, dams, and culverts were field surveyed to obtain elevation data and structural geometry. Water-surface elevations of floods of the selected recurrence intervals were computed for the 1996 FIS using the SCS WSP-2 computer program (U.S. Department of Agriculture, 1976), for Plum Creek; the portions of East Plum Creek where it flows through the Towns of Larkspur, Castle Rock, and Sedalia; West Plum Creek (at Perry Park); Indian Creek; Hangmans Gulch; the portion of Sellars Gulch through the Town of Castle Rock; Unnamed Tributary to Sellars Gulch; Sulphur Creek; Happy Canyon Creek; Newlin Gulch; Baldwin Gulch; Sulphur Gulch; Tallman Gulch, Bayou Gulch; South Platte River; Horse Creek; and West Creek. These profiles and elevations were compared with historic floods and the flood stages then determined. The water surface profiles for the selected recurrence intervals were developed using the USACE HEC-2 step backwater computer program (USACE, 1973) for portions of East Plum Creek between the Towns of Larkspur and Castle Rock, and between the Towns of Castle Rock and Sedalia; and the portion of Sellars Gulch upstream of the Town of Castle Rock. The water-surface profiles for Cherry Creek utilized in the 1996 FIS were obtained from a USACE Flood Plain Information report (U.S. Water Resources Council, 1976), and were developed using the USACE HEC-2 step-backwater computer program (USACE, 1973). The computations were based on channel and flood plain conditions as represented by the survey data gathered in April 1975 and as supplemented by later field investigations. The methods used in estimating elevations of streams studied by approximate methods included the direct use of UDFCD information, calculation of normal depth from field cross sections with an estimation of top width, and direct use of drainage area versus discharge and drainage area versus depth in channel curves from USGS Technical Manual No. 1 (U.S. Department of the Interior, Technical Manual No.1, 1976). 31
37 Generally, roughness factors (Manning s n ) used in the hydraulic computations were estimated by field investigation and from pictures of the stream and its floodplain using Roughness Characteristics of Natural Channels (VTN Engineers, Architects, Planners, 1973), Open-Channel Hydraulics (Gingery Associates, Inc., 1975), and Handbook of Applied Hydraulics (Jack G. Raub Company, 1981). Table 3 shows the channel and overbank n values for the streams studied by detailed methods. Countywide Analyses Cross sections for Big Dry Creek, Big Dry Creek Tributary C, Willow Creek, Little Willow Creek, East Willow Creek, Daniels Park Drain, Drainageways , , and , Highlands Gulch, Indian Creek, Jarre Creek, Lehigh Gulch, Louviers Gulch, Oxide Draw, Plum Creek (from the downstream limits upstream to 0.7 miles upstream of Airport Road), Rainbow Creek, Sterling Gulch, and West Plum Creek, all of which were studied by detailed methods were digitized from digital topographic mapping (WRC Engineering, Inc., 1996; Greenhorne & O Mara, Inc. 1996; WRC Engineering, Inc., 2001). Water-surface elevations of floods of the selected recurrence intervals were developed using the USACE HEC-RAS River Analysis System computer program (USACE, 1997), for Daniels Park Drain, Drainageways , , and , Highlands Gulch, Indian Creek, Jarre Creek, Lehigh Gulch, Louviers Gulch, Oxide Draw, Plum Creek, Rainbow Creek, Sterling Gulch, and West Plum Creek (near the Plum Creek Confluence). Water-surface elevations of floods of the selected recurrence intervals were developed using the USACE HEC-RAS River Analysis System computer program (USACE, 2008), for the new or revised studies along East Plum Creek, Hangman s Gulch, Industrial Creek, Industrial Creek Tributary, McMurdo Gulch, McMurdo Gulch Split Flow, Mitchell Gulch, Mitchell Gulch Tributaries 1 and 2, Omni Creek, Sellars Gulch, Sellars Gulch Tributaries 1 and 2, Tributary 6400 East and Tributary 6400 West, and Willow Creek (at Lone Tree). The water surface profiles for the selected recurrence intervals were developed using the USACE HEC-2 step backwater computer program (USACE, 1990) for Big Dry Creek, Big Dry Creek Tributary C, Willow Creek, Little Willow Creek, and East Willow Creek. Water-surface elevations for Cherry Creek, Plum Creek (from approximately 0.7 miles upstream of Airport Road upstream to the confluence West Plum Creek), and East Plum Creek (from the confluence with Plum Creek upstream to approximately 1.2 miles upstream of Drainageway 6631) were obtained from the UDFCD Flood Hazard Area Delineation (URS Corporation, 2003; ICON Engineering, Inc., 2004), and were developed using the USACE HEC-RAS computer program, using the HEC-GeoRAS extension for ArcView (USACE, 2001; USACE, 2000). 32
38 The water-surface elevations for Hangman s Gulch were revised using HEC-RAS, digital topography provided by Douglas County, and the existing hydraulic structure information from the effective FIS (FEMA, 1996). Hydraulic analyses for the South Platte River included three distinct reaches: (a) detailed floodplain mapping was defined for a 0.9-mile reach in the vicinity of South Platte, at the confluence with the North Fork South Platte River; (b) detailed floodplain mapping was also defined for a 13.4-mile reach from Nighthawk to just below Wigwam; and (c) an approximate floodplain was delineated for a 1.7-mile reach starting at the upstream end of the main detailed study reach and continuing upstream through the Wigwam area. For the South Platte River study, three hydraulic models were prepared using the USACE HEC-RAS River Analysis System (USACE, 2004). The first (a) hydraulic model analyzed the 100-year (1-percent annual chance) flood and the 1- foot rise floodway for the 0.9-mile reach of the South Platte River in the vicinity of the community of South Platte. The second (b) hydraulic model analyzed the 100-year flood and the 1-foot rise floodway for the 13.4-mile reach of the South Platte River from Nighthawk to just downstream of the Wigwam area. The third (c) hydraulic model evaluated the 100-year flood for the 1.7-mile reach of the South Platte River in the vicinity of Wigwam. Although the third reach was studied using a detailed model, the floodplain is defined as approximate primarily due to the lack of data for the three private bridges located within this reach (Anderson Consulting Engineers, 2004). Analyses of the hydraulic characteristics of flooding from Horse Creek, Trout Creek, West Creek, and Fourmile Creek were carried out to provide estimates of the elevations of flooding for the 100-year recurrence interval event. The slopearea method was used for determination of the starting water-surface elevations for all streams. Water-surface profiles for the 100-year event were developed using the USACE HEC-RAS River Analysis System (USACE, 2004). Due to the relatively steep channel slope of the streams, the mixed-flow procedure (subcritical and supercritical analyses) was used within HEC-RAS to establish the water surface profile. Cross section data for Horse Creek, Trout Creek, West Creek, and Fourmile Creek was obtained from LIDAR mapping obtained January 9, The below-water sections were obtained by field measurement. All bridges and culverts were measured to obtain elevation data and structure geometry. Manning s n values for the following streams were based on photographic documentation, field visits, and engineering judgment: Daniels Park Drain, Drainageways , , and , East Plum Creek, Highlands Gulch, Indian Creek, Jarre Creek, Lehigh Gulch, Louviers Gulch, Oxide Draw, Plum Creek, Rainbow Creek, Sterling Gulch, and West Plum Creek (near the Plum Creek Confluence), Big Dry Creek, Big Dry Creek Tributary C, Willow Creek, Little Willow Creek, East Willow Creek, Cherry Creek, South Platte River, Horse Creek, West Creek, Trout Creek, and Fourmile Creek. 33
39 Roughness coefficients for all other streams were taken from the analyses used in the 1996 FIS for Douglas County. Roughness coefficients for the 1996 FIS were estimated by field investigation and from pictures of the stream and its floodplain using USGS water Supply Paper 1849 (U.S. Department of the Interior, 1967; ), Open Channel Hydraulics (Ven Te Chow, 1959) and Handbook of Applied Hydraulics (Davis Sorenson, 1969). Roughness factors for all streams studies by detailed methods are shown in Table 5, Manning s n Values. Plum Creek East Plum Creek West Plum Creek (at Perry Park) Indian Creek Hangmans Gulch Sellars Gulch Carpenter Creek Happy Canyon Creek Newlin Gulch Baldwin Gulch Sulphur Gulch Tallman Gulch Bayou Gulch TABLE 5 MANNING S n VALUES STREAM CHANNEL n OVERBANK n South Platte River Fourmile Creek Horse Creek Trout Creek West Creek Daniels Park Drain Drainageway Drainageway Drainageway Highlands Gulch Indian Creek Jarre Creek Lehigh Gulch Louviers Gulch Oxide Draw Plum Creek Plum Creek Diversion Channel Rainbow Creek Sterling Gulch West Plum Creek Big Dry Creek Big Dry Creek Tributary C Willow Creek Little Willow Creek
40 TABLE 5 MANNING S n VALUES continued STREAM CHANNEL n OVERBANK n East Willow Creek Willow Creek (At Lone Tree) Cherry Creek Industrial Tributary McMurdo Gulch McMurdo Gulch Split Flow Mitchell Gulch Mitchell Gulch Tributary Omni Tributary Sellars Gulch Tributary Tributary 6400 East Tributary 6400 West Qualifying bench marks within a given jurisdiction that are cataloged by the National Geodetic Survey (NGS) and entered into the National Spatial Reference System (NSRS) as First or Second Order Vertical and have a vertical stability classification of A, B, or C are shown and labeled on the FIRM with their 6- character NSRS Permanent Identifier. Bench marks catalogued by the NGS and entered into the NSRS vary widely in vertical stability classification. NSRS vertical stability classifications are as follows: Stability A: Monuments of the most reliable nature, expected to hold position/elevation well (e.g., mounted in bedrock) Stability B: Monuments which generally hold their position/elevation well (e.g. concrete bridge abutments) Stability C: Monuments which may be affected by surface ground movements (e.g. concrete monument below frost line) Stability D: Mark of questionable or unknown vertical stability (e.g., concrete monument above frost line, or steel witness post) To obtain up-to-date elevation information on National Geodetic Survey (NGS) bench marks shown on the FIRM (Exhibit 2), please contact the Information Services Branch of the NGS at (301) , or visit their website at Map users should seek verification of non-ngs monument elevations when using these elevations for construction or floodplain management purposes. 35
41 It is important to note that temporary vertical monuments are often established during the preparation of a flood hazard analysis for the purpose of establishing local vertical control. Although these monuments are not shown on the FIRM, they may be found in the Technical Support Data Notebook associated with this FIS and FIRM. Interested individuals may contact FEMA to access this data. For information on additional control points maintained by Douglas County that are not shown on the FIRM (Exhibit 2), please visit: Vertical Datum All FISs and FIRMs are referenced to a specific vertical datum. The vertical datum provides a starting point against which flood, ground, and structure elevations can be referenced and compared. Until recently, the standard vertical datum in use for newly created or revised FISs and FIRMs was the National Geodetic Vertical Datum of 1929 (NGVD 29). With the finalization of the North American Vertical Datum of 1988 (NAVD 88), many FIS reports and FIRMs are being prepared using NAVD 88 as the referenced vertical datum. All flood elevations shown in this FIS report and on the FIRM are referenced to NAVD 88. Structure and ground elevations in the community must, therefore, be referenced to NAVD 88. It is important to note that adjacent communities may be referenced to NGVD 29. This may result in differences in base flood elevations across the corporate limits between the communities. As noted above, the elevations shown in the FIS report and on the FIRM for Douglas County and Incorporated Areas are referenced to NAVD 88. Ground, structure, and flood elevations may be compared and/or referenced to NGVD 29 by applying a standard conversion factor. The conversion from NGVD 29 to NAVD 88 ranged between 3.10 and 3.97 for this county. Accordingly, due to the statistically significant range in conversion factors, an average conversion factor could not be established for the entire county. The elevations shown in the FIS report and on the FIRM were, therefore, converted to NAVD 88 using a stream-by-stream approach. In this method, an average conversion was established for each flooding source and applied accordingly. The conversion factor for each flooding source in the community may be found in the following table as well as on the FIRM. The vertical datum offset values used for this countywide are include in Table 6, Vertical Offset Table. The flooding sources partially or completely restudied in detail as part of this partial-countywide update were referenced to NAVD 1988 at the time of study and therefore, they do not require a vertical datum offset. These sources include East Plum Creek, Hangman s Gulch, Industrial Creek, Industrial Creek Tributary, McMurdo Gulch, McMurdo Gulch Split Flow, Mitchell Gulch, Mitchell Gulch 36
42 Tributaries 1 and 2, Omni Creek, Sellars Gulch, Sellars Gulch Tributaries 1 and 2, Tributary 6400 East and Tributary 6400 West, and Willow Creek (at Lone Tree). TABLE 6 VERTICAL DATUM OFFSET TABLE Vertical Datum Offset (ft) Vertical Datum Offset (ft) Flooding Source Flooding Source Baldwin Gulch 3.10 Newlin Gulch 3.14 Bayou Gulch 3.22 Plum Creek, Cross Section A to D 3.12 Big Dry Creek 3.15 South Platte River 3.67 Big Dry Creek, Tributary C 3.15 Sulphur Gulch 3.13 Carpenter Creek 3.93 Tallman Gulch 3.16 Cherry Creek, Cross Section BR to CU 3.23 West Creek 3.97 East Plum Creek, Cross Section CO to CZ 3.49 West Plum Creek, Cross Section W to AM 3.68 East Plum Creek, Cross Section DA to EM 3.71 Happy Canyon Creek 3.12 Horse Creek 3.67 Example: To convert Baldwin Gulch elevations to NAVD 88, 3.10 feet were added to the NGVD 29 elevations. The BFEs shown on the FIRM represent whole-foot rounded values. For example, a BFE of will appear as 6202 on the FIRM and will appear as Therefore, users that wish to convert the elevations in this FIS to NGVD29 should apply the stated conversion factor(s) to elevations shown on the Flood Profiles and supporting data tables in the FIS report, which are shown at a minimum to the nearest 0.1 foot. For more information on NAVD88, see Converting the National Flood Insurance Program to the North American Vertical Datum of 1988, FEMA Publication FIA- 20/June 1992, or contact the Vertical Network Branch, National Geodetic Survey, Coast and Geodetic Survey, National Oceanic and Atmospheric Administration, Rockville, Maryland (Internet address FLOODPLAIN MANAGEMENT APPLICATIONS The NFIP encourages State and local governments to adopt sound floodplain management programs. To assist in this endeavor, each FIS provides 100-year floodplain data, which may include a combination of the following: 10-, 50-, 100-, and 500-year flood elevations; delineations of the 100-year and 500-year floodplains; and 100-year floodway. This information is presented on the FIRM and in many components of the FIS, including Flood Profiles, Floodway Data tables, and Summary of Stillwater Elevation tables. Users should reference the data presented in the FIS as well as additional information that may be available at the local community map repository before making flood elevation and/or floodplain boundary determinations. 37
43 4.1 Floodplain Boundaries To provide a national standard without regional discrimination, the 1-percent annual chance (100-year) flood has been adopted by FEMA as the base flood for floodplain management purposes. The 0.2-percent annual chance (500-year) flood is employed to indicate additional areas of flood risk in the community. For the streams studied in detail, the 100-year floodplains have been delineated using the flood elevations determined at each cross section. Between cross sections, the boundaries were interpolated using topographic maps at a scale of 1:1,200 with contour intervals of 2 feet (WRC Engineering, Inc., 1996; Greenhorne & O Mara, Inc., 1996; WRC Engineering, Inc., 2001; URS Corporation, 2003) for areas within the UDFCD. In addition, the 500-year floodplain was also delineated for Plum Creek, East Plum Creek, Big Dry Creek, and Big Dry Creek Tributary C. For areas south of the UDFCD boundary the 100- and 500-year floodplains have been delineated using the flood elevations determined at each cross section, as represented on the 1996 FIS (FEMA, 1996). Between cross sections, the boundaries were interpolated using Douglas County topographic maps with a contour interval of 5 feet, or site specific topography from a Letter of Map Revision, with the exception of West Plum Creek. The floodplain boundary for West Plum Creek was taken directly from the effective FIRM for Douglas County (Reference 33). Floodplains for the 100-year (1-percent annual chance) event for the South Platte River, Trout Creek, Fourmile Creek, West Creek, and Horse Creek were delineated on ortho-rectified aerial photograph and contours at a 2-foot interval. The topography was prepared based on aerial photography taken on January 8, The above-water LiDAR data provided by the County was supplemented with bathymetric field survey data provided by Douglas County and prepared by ICON Engineering, Inc. The 100- and 500-year floodplain boundaries are shown on the FIRM (Exhibit 2). On this map, the 100-year floodplain boundary corresponds to the boundary of the areas of special flood hazards (Zones A AE, AH, AO, AR, and D), and the 500-year floodplain boundary corresponds to the boundary of areas of moderate flood hazards. In cases where the 100- and 500-year floodplain boundaries are close together, only the 100-year floodplain boundary has been shown. Small areas within the floodplain boundaries may lie above the flood elevations but cannot be shown due to limitations of the map scale and/or lack of detailed topographic data. For the streams studied by approximate methods, only the 100-year floodplain boundary is shown on the FIRM (Exhibit 2). Approximate 100-year floodplain boundaries for Dad Clark Gulch, East Dad Clark Gulch, and Marcy Gulch and their respective tributaries, and Spring Gulch were taken directly from UDFCD information (Urban Drainage and Flood Control District, Flood Hazard Area Delineation, Highlands Ranch). Approximate 100- year flood plain boundaries for Drainageway 6631, East Plum Creek, and the South 38
44 Platte River and its 4 unnamed tributaries were obtained from the effective FIRM for Douglas County (FEMA, 1987). All other approximate 100-year flood plain boundaries were delineated on USGS topographic maps (U.S. Department of the Interior, 1965 et cetera) using elevations estimated by the hydraulic analyses described previously. In some portions of the study area the boundaries were taken directly from the effective FIRM for Douglas County (FEMA, 1986). 4.2 Floodways Encroachment on floodplains, such as structures and fill, reduces flood-carrying capacity, increases flood heights and velocities, and increases flood hazards in areas beyond the encroachment itself. One aspect of floodplain management involves balancing the economic gain from floodplain development against the resulting increase in flood hazard. For purposes of the NFIP, a floodway is used as a tool to assist local communities in this aspect of floodplain management. Under this concept, the area of the 100-year floodplain is divided into a floodway and a floodway fringe. The floodway is the channel of a stream, plus any adjacent floodplain areas, that must be kept free of encroachment so that the 100-year flood can be carried without substantial increases in flood heights. Minimum Federal standards limit such increases to 1.0 foot, provided that hazardous velocities are not produced. The floodways in this study are presented to local agencies as a minimum standard that can be adopted directly or that can be used as a basis for additional floodway studies. The floodways presented in this FIS were computed for certain stream segments on the basis of equal conveyance reduction from each side of the floodplain. Floodway widths were computed at cross sections. Between cross sections, the floodway boundaries were interpolated. The results of the floodway computations are tabulated for selected cross sections (Table 7). The computed floodways are shown on the FIRM (Exhibit 2). In cases where the floodway and 100-year floodplain boundaries are either close together or collinear, only the floodway boundary is shown. Encroachment into areas subject to inundation by floodwaters having hazardous velocities aggravates the risk of flood damage, and heightens potential flood hazards by further increasing velocities. A listing of stream velocities at selected cross sections is provided in Table 7, Floodway Data. To reduce the risk of property damage in areas where the stream velocities are high, the community may wish to restrict development in areas outside the floodway. Near the mouths of streams studied in detail, floodway computations are made without regard to flood elevations on the receiving water body. Therefore, "Without Floodway" elevations presented in Table 7 for certain downstream cross sections of Jarre Creek and West Plum Creek are lower than the regulatory flood elevations in that area, which must take into account the 1-percent annual chance flooding due to backwater from other sources. 39
45 Portions of the floodways for South Platte River extend beyond the county boundary. No floodways were computed for Fourmile Creek, Trout Creek, West Creek, and Plum Creek Diversion Channel. The area between the floodway and 100-year floodplain boundaries is termed the floodway fringe. The floodway fringe encompasses the portion of the floodplain that could be completely obstructed without increasing the water-surface elevation of the 100-year flood by more than 1.0 foot at any point. Typical relationships between the floodway and the floodway fringe and their significance to floodplain development are shown in Figure 1, Floodway Schematic. SCHEMATIC Figure 1 40
46 FLOODING SOURCE CROSS SECTION Baldwin Gulch A B C D E F G H I J K L M N O P Q R S T U V DISTANCE 1 WIDTH (FEET) SECTION AREA (SQUARE FEET) MEAN VELOCITY (FEET PER SECOND) REGULATORY BASE FLOOD WATER-SURFACE ELEVATION (FEET NAVD) WITHOUT WITH INCREASE 1, , , , , , , , , , , , , , , , , , , , , , , , , , , , , , , , , , , , , , , , , , , , , , , , , , , , , , , , , , , , , , , , , , , , , , , , , , , , , , , , , , , , , , , , Bayou Gulch A 1, , , , B 2, , , , Feet Above Mouth 2 Encroachment limited to channel banks; elevation increase may be less than 1.0 foot T A B L E 7 FEDERAL EMERGENCY MANAGEMENT AGENCY DOUGLAS COUNTY, CO AND INCORPORATED AREAS 41 DATA BALDWIN GULCH
47 42
48 43
49 44
50 Carpenter Creek A B C D E F G H I J K L M FLOODING SOURCE CROSS SECTION DISTANCE 1 WIDTH (FEET) SECTION AREA (SQUARE FEET) MEAN VELOCITY (FEET PER SECOND) REGULATORY BASE FLOOD WATER-SURFACE ELEVATION (FEET NAVD) WITHOUT WITH INCREASE 14, , , , , , , , , , , , , , , , , , , , , , , , , , , , , , , , , , , , , , , , , , , , , , , , , , , , Cherry Creek A B C D E F G H I J K 110, , , , , , , , , , , , , , , , , , , , , , , , , , , , , , , , , , , , , , , , , , , , , , , , , , , , , , , Feet above mouth 2 Encroachment limited to channel banks; elevation increase may be less than 1.0 foot T A B L E 7 FEDERAL EMERGENCY MANAGEMENT AGENCY DOUGLAS COUNTY, CO AND INCORPORATED AREAS DATA CARPENTER CREEK CHERRY CREEK 45
51 Cherry Creek (continued) FLOODING SOURCE CROSS SECTION L M N O P Q R S T U V W X Y Z AA AB AC AD AE AF AG AH AI AJ DISTANCE 1 WIDTH (FEET) SECTION AREA (SQUARE FEET) MEAN VELOCITY (FEET PER SECOND) REGULATORY BASE FLOOD WATER-SURFACE ELEVATION (FEET NAVD) WITHOUT WITH INCREASE 119, , , , , , , , , , , , , , , , , , , , , , , , , , , , , , , , , , , , , , , , , , , , , , , , , , , , , , , , , , , , , , , , , , , , , , , , , , , , , , , , , , , , , , , , , , , , , , , , , , , , , , , , , , , , , , , , , , , , , , , , ,268 1,105 6, , , , Feet above mouth T A B L E 7 FEDERAL EMERGENCY MANAGEMENT AGENCY DOUGLAS COUNTY, CO AND INCORPORATED AREAS DATA CHERRY CREEK 46
52 Cherry Creek (continued) FLOODING SOURCE CROSS SECTION AK AL AM AN AO AP AQ AR AS AT AU AV AW AX AY AZ BA BB BC BD BE BF BG BH BI DISTANCE 1 WIDTH (FEET) SECTION AREA (SQUARE FEET) MEAN VELOCITY (FEET PER SECOND) REGULATORY BASE FLOOD WATER-SURFACE ELEVATION (FEET NAVD) WITHOUT WITH INCREASE 143,060 1,120 5, , , , , , , , , , , , , , ,121 1,000 5, , , , , , , , , , , , , , , , , , , , , , , , , , , , , , , , , , , , , , , , , , , , , , , , , , , , , , , , , , , , , , , , , , , , , , , , , , , , , , , , , , , , , , , , , ,009 1,133 6, , , , , , , , , , , , , , , , , , , Feet above mouth T A B L E 7 FEDERAL EMERGENCY MANAGEMENT AGENCY DOUGLAS COUNTY, CO AND INCORPORATED AREAS 47 DATA CHERRY CREEK
53 48
54 49
55 50
56 51
57 FLOODING SOURCE CROSS SECTION East Plum Creek (continued) E F G H I J K L M N O P Q R S T U V W X Y Z AA DISTANCE 1 WIDTH (FEET) SECTION AREA (SQUARE FEET) AB 1 Stream distance in feet above confluence with Plum Creek. 2 Total Top Width may include ineffective flow area and/or high ground MEAN VELOCITY (FEET PER SECOND) REGULATORY BASE FLOOD WATER-SURFACE ELEVATION (FEET NAVD) WITHOUT WITH INCREASE 4, , , , , , , , , , , , , , , , , , , , , , , , , , , , , , , , , , , , , , , , , , , , , , , , , , , , , , , , , , , , , , , , , , , , , , , , , , , , , , , , , , , , , , , , , , , , , , , , , , , , , , , , , , , , , , , , , , , , , , , , TABLE 7 FEDERAL EMERGENCY MANAGEMENT AGENCY DOUGLAS COUNTY,CO AND INCOPRPORATED AREAS DATA EAST PLUM CREEK 52
58 FLOODING SOURCE CROSS SECTION East Plum Creek (Cont'd) AC AD AE AF AG AH AI AJ AK AL AM AN AO AP AQ AR AS AT AU AV AW AX AY AZ DISTANCE 1 WIDTH 2 (FEET) SECTION AREA (SQUARE FEET) BA 1 Stream distance in feet above confluence with Plum Creek. 2 Total Top Width may include ineffective flow area and/or high ground MEAN VELOCITY (FEET PER SECOND) REGULATORY BASE FLOOD WATER-SURFACE ELEVATION (FEET NAVD) WITHOUT WITH INCREASE 24, , , , , , , , , , , , , , , , , , , , , , , , , , , , , , , , , , , , , , , , , , , , , , , , , , , , , , , , , , , , , , , , , , , , , , , , , , , , , , , , , , , , , , , , , , , , , , , , , , , , , , , , , , , , , , , , , , , , , , , , , , , , , TABLE 7 FEDERAL EMERGENCY MANAGEMENT AGENCY DOUGLAS COUNTY,CO and Incorporated Areas DATA EAST PLUM CREEK 53
59 FLOODING SOURCE CROSS SECTION DISTANCE 1 WIDTH 2 (FEET) East Plum Creek (Cont'd) BB BC BD BE BF BG BH BI BJ BK BL BM BN BO BP BQ BR BS BT BU BV BW BX SECTION AREA (SQUARE FEET) BY 1 Stream distance in feet above confluence with Plum Creek. 2 Total Top Width may include ineffective flow area and/or high ground MEAN VELOCITY (FEET PER SECOND) REGULATORY BASE FLOOD WATER-SURFACE ELEVATION (FEET NAVD) WITHOUT WITH INCREASE 43, , , , , , , , , , , , , , , , , , , , , , , , , , , , , , , , , , , , , , , , , , , , , , , , , , , , , , , , , , , , , , , , , , , , , , , , , , , , , , , , , , , , , , , , , , , , , , , , , , , , , , , , , , , , , , , , , , , , , , , , TABLE 7 FEDERAL EMERGENCY MANAGEMENT AGENCY DOUGLAS COUNTY,CO and Incorporated Areas DATA EAST PLUM CREEK 54
60 FLOODING SOURCE CROSS SECTION East Plum Creek (Cont'd) BZ CA CB CC CD CE CF CG CH CI CJ CK CL CM CN CO CP CQ CR CS CT CU CV CW CX CY CZ DISTANCE 1 WIDTH 2 (FEET) SECTION AREA (SQUARE FEET) DA 1 Stream distance in feet above confluence with Plum Creek. 2 Total Top Width may include ineffective flow area and/or high ground MEAN VELOCITY (FEET PER SECOND) REGULATORY BASE FLOOD WATER-SURFACE ELEVATION (FEET NAVD) WITHOUT WITH INCREASE 61, , , , , , , , , , , , , , , , , , , , , , , , , , , , , , , , , , , , , , , , , , , , , , , , , , , , , , , , , , , , , , , , , , , , , , , , , , , , , , , , , , , , , , , , , , , , , , , , , , , , , , , , , , , , , , , , , , , , , , , , , , , , , , , , , , , , , , , , , , , , TABLE 7 FEDERAL EMERGENCY MANAGEMENT AGENCY DOUGLAS COUNTY,CO and Incorporated Areas 55 DATA EAST PLUM CREEK
61 FLOODING SOURCE CROSS SECTION East Plum Creek (continued) DB DC DD DE DF DG DH DI DJ DK DL DM DN DO DP DQ DR DS DT DU DV DW DX DY DISTANCE 1 WIDTH 2 (FEET) SECTION AREA (SQUARE FEET) DZ 1 Stream distance in feet above confluence with Plum Creek. 2 Total Top Width may include ineffective flow area and/or high ground MEAN VELOCITY (FEET PER SECOND) REGULATORY BASE FLOOD WATER-SURFACE ELEVATION (FEET NAVD) WITHOUT WITH INCREASE 83, , , , , , , , , , , , , , , , , , , , , , , , , , , , , , , , , , , , , , , , , , , , , , , , , , , , , , , , , , , , , , , , , , , , , , , , , , , , , , , , , , , , , , , , , , , , , , , , , , , , , , , , , , , , , , , , , , , , , , , , , , , , TABLE 7 FEDERAL EMERGENCY MANAGEMENT AGENCY DOUGLAS COUNTY,CO and Incorporated Areas DATA EAST PLUM CREEK 56
62 FLOODING SOURCE CROSS SECTION East Plum Creek (continued) EA EB EC ED EE EF EG EH EI EJ EK EL EM DISTANCE WIDTH (FEET) SECTION AREA (SQUARE FEET) MEAN VELOCITY (FEET PER SECOND) REGULATORY BASE FLOOD WATER-SURFACE ELEVATION (FEET NAVD) WITHOUT WITH INCREASE 106, , , , , , , , , , , , , , , , , , , , , , , , , , , , , , , , , , , , , , , , , , , , , , , , , , , , , , , , , , , , , , East Willow Creek A B C D E F G H I 1 Stream distance in feet above confluence with Plum Creek. 2 Feet above confluence with Willow Creek 3 Total Top Width may include ineffective flow area and/or high ground , , , , , , , , , , , , , , , , , , , , , , , , , , , , , , , , , , , TABLE 7 FEDERAL EMERGENCY MANAGEMENT AGENCY DOUGLAS COUNTY,CO and Incorporated Areas DATA EAST PLUM CREEK - EAST WILLOW CREEK 57
63 CROSS SECTION East Willow Creek (continued) J K L M N O P Q R S FLOODING SOURCE DISTANCE 1 WIDTH (FEET) SECTION AREA (SQUARE FEET) MEAN VELOCITY (FEET PER SECOND) REGULATORY BASE FLOOD WATER-SURFACE ELEVATION (FEET NAVD) WITHOUT WITH INCREASE 6, , , , , , , , , , , , , , , , , , , , , , , , , , , , , , , , , , , , , , , , Hangman's Gulch A B C D E F G H , , , , , , , , , , , , , , , , , , , , , , , , , , , , , , , Feet Above Confluence with Willow Creek 2 Stream Distance In Feet Above Confluence with East Plum Creek 3 Total Top Width may include ineffective flow area and/or high ground TABLE 7 FEDERAL EMERGENCY MANAGEMENT AGENCY DOUGLAS COUNTY, CO AND INCORPORATED AREAS DATA EAST WILLOW CREEK - HANGMAN'S GULCH 58
64 FLOODING SOURCE CROSS SECTION Happy Canyon Creek A B C D E F G H I J K L M N O P Q R S T U V W X Y DISTANCE 1 WIDTH (FEET) SECTION AREA (SQUARE FEET) MEAN VELOCITY (FEET PER SECOND) REGULATORY BASE FLOOD WATER-SURFACE ELEVATION (FEET NAVD) WITHOUT WITH INCREASE 5, , , , , , , , , , , , , , , , , , , , , , , , , , , , , , , , , , , , , , , , , , , , , , , , , , , , , , , , , , , , , , , , , , , , , , , , , , , , , , , , , , , , , , , , , , , , , , , , , , , , , , , Feet Above Mouth 2 Encroachment Limited to Channel Banks; Elevation Increase May Be Less Than 1.0 Foot TABLE 7 FEDERAL EMERGENCY MANAGEMENT AGENCY DOUGLAS COUNTY, CO AND INCORPORATED AREAS DATA HAPPY CANYON CREEK 59
65 Happy Canyon Creek (continued) Z AA AB FLOODING SOURCE CROSS SECTION DISTANCE 1 WIDTH (FEET) SECTION AREA (SQUARE FEET) MEAN VELOCITY (FEET PER SECOND) REGULATORY BASE FLOOD WATER-SURFACE ELEVATION (FEET NAVD) WITHOUT WITH INCREASE 21, , , , , , , , , , , , Highlands Gulch A B C D E F G H I J K L M N O P Q R , , , , , , , , , , , , , , , , , , , , , , , , , , , , , , , , , , , , , , , , , , , , , , , , , , , , , , , , , , , , , , , , , , , , , , Feet Above Mouth 2 Feet above Confluence with Plum Creek TABLE 7 FEDERAL EMERGENCY MANAGEMENT AGENCY DOUGLAS COUNTY, CO AND INCORPORATED AREAS DATA HAPPY CANYON CREEK - HIGHLANDS GULCH 60
66 61
67 62
68 Indian Creek (continued) FLOODING SOURCE CROSS SECTION AS AT AU AV AW AX AY AZ BA BB BC BD BE BF BG BH BI BJ BK BL BM DISTANCE 1 WIDTH (FEET) SECTION AREA (SQUARE FEET) MEAN VELOCITY (FEET PER SECOND) REGULATORY BASE FLOOD WATER-SURFACE ELEVATION (FEET NAVD) WITHOUT WITH INCREASE 28, , , , , , , , , , , , , , , , , , , , , , , , , , , , , , , , , , , , , , , , , , , , , , , , , , , , , , , , , , , , , , , , , , , , , , , , , , , , , , , , , , , , , , Feet Above Confluence with Plum Creek TABLE 7 FEDERAL EMERGENCY MANAGEMENT AGENCY DOUGLAS COUNTY, CO AND INCORPORATED AREAS DATA INDIAN CREEK 63
69 Industrial Tributary FLOODING SOURCE CROSS SECTION DISTANCE 1 WIDTH (FEET) SECTION AREA (SQUARE FEET) MEAN VELOCITY (FEET PER SECOND) REGULATORY BASE FLOOD WATER-SURFACE ELEVATION (FEET NAVD) WITHOUT WITH INCREASE A B C , , , , , , , , , , , Jarre Creek A B , , , , , , Stream Distance In Feet Above Confluence with East Plum Creek 2 Feet Above Confluence with Plum Creek 3 Total Top Width may include ineffective flow area and/or high ground 4 Elevation computed without consideration of backwater effects from Plum Creek TABLE 7 FEDERAL EMERGENCY MANAGEMENT AGENCY DOUGLAS COUNTY, CO AND INCORPORATED AREAS DATA INDUSTRIAL TRIBUTARY - JARRE CREEK 64
70 65
71 66
72 67
73 68
74 Louviers Gulch (continued) FLOODING SOURCE CROSS SECTION N O P Q R S DISTANCE WIDTH (FEET) SECTION AREA (SQUARE FEET) MEAN VELOCITY (FEET PER SECOND) REGULATORY BASE FLOOD WATER-SURFACE ELEVATION (FEET NAVD) WITHOUT WITH INCREASE 6, , , , , , , , , , , , , , , , , , , , , , , , McMurdo Gulch A B C D E F G H I J K L M N O P Q 1 Feet Above Mouth 2 Stream Distance In Feet Above Confluence with Cherry Creek 3 Total Top Width may include ineffective flow area and/or high ground , , , , , , , , , , , , , , , , , , , , , , , , , , , , , , , , , , , , , , , , , , , , , , , , , , , , , , , , , , , , , , , , , , , TABLE 7 FEDERAL EMERGENCY MANAGEMENT AGENCY DOUGLAS COUNTY, CO AND INCORPORATED AREAS DATA LOUVIERS GULCH MCMURDO GULCH 69
75 McMurdo Gulch (continued) FLOODING SOURCE CROSS SECTION R S T U V W X Y Z AA AB AC AD AE DISTANCE 1 WIDTH 3 (FEET) SECTION AREA (SQUARE FEET) MEAN VELOCITY (FEET PER SECOND) REGULATORY BASE FLOOD WATER-SURFACE ELEVATION (FEET NAVD) WITHOUT WITH INCREASE 20, , , , , , , , , , , , , , , , , , , , , , , , , , , , , , , , , , , , , , , , , , , , , , , , , , , , , , , , McMurdo Gulch Split Flow A B C D E F 1 Stream Distance In Feet Above Confluence with Cherry Creek 2 Stream Distance In Feet Above Confluence with McMurdo Gulch 3 Total Top Width may include ineffective flow area and/or high ground , , , , , , , , , , , , , , , , , , , , , , TABLE 7 FEDERAL EMERGENCY MANAGEMENT AGENCY DOUGLAS COUNTY, CO AND INCORPORATED AREAS DATA MCMURDO GULCH - MCMURDO GULCH SPLIT FLOW 70
76 FLOODING SOURCE CROSS SECTION Mitchell Gulch A B C D E F G DISTANCE WIDTH 3 (FEET) SECTION AREA (SQUARE FEET) MEAN VELOCITY (FEET PER SECOND) REGULATORY BASE FLOOD WATER-SURFACE ELEVATION (FEET NAVD) WITHOUT WITH INCREASE 11, , , , , , , , , , , , , , , , , , , , , , , , , , , , , Stream Distance In Feet Above Confluence with Cherry Creek 2 Stream Distance In Feet Above Confluence with Mitchell Gulch 3 Total Top Width may include ineffective flow area and/or high ground TABLE 7 FEDERAL EMERGENCY MANAGEMENT AGENCY DOUGLAS COUNTY, CO AND INCORPORATED AREAS DATA MITCHELL GULCH 71
77 Mitchell Gulch Tributary 2 A B FLOODING SOURCE CROSS SECTION DISTANCE WIDTH (FEET) SECTION AREA (SQUARE FEET) MEAN VELOCITY (FEET PER SECOND) REGULATORY BASE FLOOD WATER-SURFACE ELEVATION (FEET NAVD) WITHOUT WITH INCREASE , , , , , , , Newlin Gulch A B C D E F G H I J K L M N O P Q 1 Stream Distance In Feet Above Confluence With Mitchell Gulch 2 Total Top Width may include ineffective flow area and/or high ground 3 Feet Above Confluence with Cherry Creek , , , , , , , , , , , , , , , , , , , , , , , , , , , , , , , , , , , , , , , , , , , , , , , , , , , , , , , , , , , , , , , , , , , , , TABLE 7 FEDERAL EMERGENCY MANAGEMENT AGENCY DOUGLAS COUNTY, CO AND INCORPORATED AREAS DATA MITCHELL GULCH TRIBUTARY 2 NEWLIN GULCH 72
78 Newlin Gulch (continued) FLOODING SOURCE CROSS SECTION R S T U V W DISTANCE WIDTH (FEET) SECTION AREA (SQUARE FEET) MEAN VELOCITY (FEET PER SECOND) REGULATORY BASE FLOOD WATER-SURFACE ELEVATION (FEET NAVD) WITHOUT WITH INCREASE 17, , , , , , , , , , , , , , , , , , , , , , , , Omni Tributary A B C D , , , , , , , , , , , , , , , Feet Above Confluence with Cherry Creek 2 Stream Distance In Feet Above Confluence with East Plum Creek 3 Total Top Width may include ineffective flow area and/or high ground TABLE 7 FEDERAL EMERGENCY MANAGEMENT AGENCY DOUGLAS COUNTY, CO AND INCORPORATED AREAS 73 DATA NEWLIN GULCH - OMNI TRIBUTARY
79 Oxide Draw FLOODING SOURCE CROSS SECTION DISTANCE WIDTH (FEET) SECTION AREA (SQUARE FEET) MEAN VELOCITY (FEET PER SECOND) REGULATORY BASE FLOOD WATER-SURFACE ELEVATION (FEET NAVD) WITHOUT WITH INCREASE A B C D E F G H I , , , , , , , , , , , , , , , , , , , , , , , , , , , , , , , , , Plum Creek A B C D E 8, ,804 6, , , , , ,265 6, , , , , , , , , , , , , , , , , , , Stream Distance In Feet Above Confluence with Plum Creek 2 Encroachment Limited to Channel Banks; Elevation Increase May Be Less Than 1.0 Foot 3 Feet Above Confluence with Chatfield Lake TABLE 7 FEDERAL EMERGENCY MANAGEMENT AGENCY DOUGLAS COUNTY, CO AND INCORPORATED AREAS DATA OXIDE DRAW - PLUM CREEK 74
80 75
81 Plum Creek (continued) FLOODING SOURCE CROSS SECTION AE AF AG AH AI AJ AK AL AM AN AO AP AQ AR AS AT AU AV AW AX AY AZ BA BB BC 1 Feet Above Confluence with Chatfield Lake DISTANCE 1 WIDTH (FEET) SECTION AREA (SQUARE FEET) MEAN VELOCITY (FEET PER SECOND) REGULATORY BASE FLOOD WATER-SURFACE ELEVATION (FEET NAVD) WITHOUT WITH INCREASE 35, , , , , , , , , , , , , , , , , , , , , , , , , , , , , , , , , , , , , , , , , , , , , , , , , , , , , , , , , , , , , , , , , , , , , , , , , , , , , , , , , , , , , ,652 1,022 7, , , , , , , , , , , , , , , , , , , , , , , , , , , , , , , , , , , , , , , TABLE 7 FEDERAL EMERGENCY MANAGEMENT AGENCY DOUGLAS COUNTY, CO AND INCORPORATED AREAS DATA PLUM CREEK 76
82 Plum Creek (continued) FLOODING SOURCE CROSS SECTION BD BE BF BG BH BI BJ BK BL BM BN BO DISTANCE WIDTH (FEET) SECTION AREA (SQUARE FEET) MEAN VELOCITY (FEET PER SECOND) REGULATORY BASE FLOOD WATER-SURFACE ELEVATION (FEET NAVD) WITHOUT WITH INCREASE 49, , , , , , , , , , , , , , , , , , , , , , , , , , , , , , , , , , , , , , , , , ,224 6, , , , , , , , , , , , , , , , , , , Rainbow Creek A B C D E F G H I , , , , , , , , , , , , , , , , , , , , , , , , , , , , , , , , , , Feet Above Confluence with Chatfield Lake 2 Feet Above Confluence with Indian Creek TABLE 7 FEDERAL EMERGENCY MANAGEMENT AGENCY DOUGLAS COUNTY, CO AND INCORPORATED AREAS 77 DATA PLUM CREEK - RAINBOW CREEK
83 Rainbow Creek (continued) FLOODING SOURCE CROSS SECTION J K L M N O P Q R S DISTANCE WIDTH (FEET) SECTION AREA (SQUARE FEET) MEAN VELOCITY (FEET PER SECOND) REGULATORY BASE FLOOD WATER-SURFACE ELEVATION (FEET NAVD) WITHOUT WITH INCREASE 3, , , , , , , , , , , , , , , , , , , , , , , , , , , , , , , , , , , , , , , , Sellars Gulch A B C D E F G H I J K L 1 Feet Above Confluence with Indian Creek 2 Stream Distance In Feet Above Confluence with East Plum Creek 3 Total Top Width may include ineffective flow area and/or high ground , , , , , , , , , , , , , , , , , , , , , , , , , , , , , , , , , , , , , , , , , , , , , , , , TABLE 7 FEDERAL EMERGENCY MANAGEMENT AGENCY DOUGLAS COUNTY, CO AND INCORPORATED AREAS DATA RAINBOW CREEK - SELLARS GULCH 78
84 Sellars Gulch (continued) FLOODING SOURCE CROSS SECTION M N O P Q R S T U V W DISTANCE WIDTH 3 (FEET) SECTION AREA (SQUARE FEET) MEAN VELOCITY (FEET PER SECOND) REGULATORY BASE FLOOD WATER-SURFACE ELEVATION (FEET NAVD) WITHOUT WITH INCREASE 15, , , , , , , , , , , , , , , , , , , , , , , , , , , , , , , , , , , , , , , , , , , , Sellars Gulch Tributary 1 A B C D E F G , , , , , , , , , , , , , , , , , , , , , , , , , , , , Stream Distance In Feet Above Confluence with East Plum Creek 2 Stream Distance In Feet Above Confluence with Sellars Gulch 3 Total Top Width may include ineffective flow area and/or high ground TABLE 7 FEDERAL EMERGENCY MANAGEMENT AGENCY DATA DOUGLAS COUNTY, CO AND INCORPORATED AREAS SELLARS GULCH - SELLARS GULCH TRIBUTARY 1 79
85 FLOODING SOURCE CROSS SECTION Sellars Gulch Tributary 2 A B C D E F DISTANCE 1 WIDTH (FEET) SECTION AREA (SQUARE FEET) MEAN VELOCITY (FEET PER SECOND) REGULATORY BASE FLOOD WATER-SURFACE ELEVATION (FEET NAVD) WITHOUT WITH INCREASE , , , , , , , , , , , , , , , , , , , , , , South Platte River A -1, , , , , B , , , , C , , , , D , , , , E , , , , F 1, , , , , G 2, , , , H 3, , , , I 22, , , , , J 23, , , , , K 24, , , , Stream Distance In Feet Above Confluence with Sellars Gulch 2 Feet Above Jefferson County Bridge F-10-8A at County Road 97 3 Total Top Width may include ineffective flow area and/or high ground 4 Width extends totally or partially beyond county boundary TABLE 7 FEDERAL EMERGENCY MANAGEMENT AGENCY DOUGLAS COUNTY, CO AND INCORPORATED AREAS 80 DATA SELLARS GULCH TRIBUTARY 2 - SOUTH PLATTE RIVER
86 81
87 82
88 83
89 84
90 85
91 FLOODING SOURCE CROSS SECTION DISTANCE WIDTH (FEET) SECTION AREA (SQUARE FEET) MEAN VELOCITY (FEET PER SECOND) REGULATORY BASE FLOOD WATER-SURFACE ELEVATION (FEET NAVD) WITHOUT WITH INCREASE Tallman Gulch A , , , B , , , C 1, , , , D 1, , , , E 2, , , , F 2, , , , G 3, , , , H 4, , , , I 4, , , , J 5, , , , K 7, , , , L 9, , , , M 10, , , , N 11, , , , O 13, , , , Stream Distance in Feet Above Confluence with Sulphur Gulch TABLE 7 FEDERAL EMERGENCY MANAGEMENT AGENCY DOUGLAS COUNTY, CO AND INCORPORATED AREAS DATA TALLMAN GULCH 86
92 FLOODING SOURCE CROSS SECTION Tributary 6400 East A B C D E F G H I DISTANCE 1 WIDTH (FEET) SECTION AREA (SQUARE FEET) MEAN VELOCITY (FEET PER SECOND) REGULATORY BASE FLOOD WATER-SURFACE ELEVATION (FEET NAVD) WITHOUT WITH INCREASE 8, , , , , , , , , , , , , , , , , , , , , , , , , , , , , , , , , , , , , Feet Above Confluence with East Plum Creek 2 Floodway = Floodplain TABLE 7 FEDERAL EMERGENCY MANAGEMENT AGENCY DOUGLAS COUNTY, CO AND INCORPORATED AREAS DATA TRIBUTARY 6400 EAST 87
93 FLOODING SOURCE CROSS SECTION Tributary 6400 West A B C D E F G H I J DISTANCE 1 WIDTH (FEET) SECTION AREA (SQUARE FEET) MEAN VELOCITY (FEET PER SECOND) REGULATORY BASE FLOOD WATER-SURFACE ELEVATION (FEET NAVD) WITHOUT WITH INCREASE 8, , , , , , , , , , , , , , , , , , , , , , , , , , , , , , , , , , , , , , , , Feet Above Confluence with East Plum Creek 2 Floodway = Floodplain TABLE 7 FEDERAL EMERGENCY MANAGEMENT AGENCY DOUGLAS COUNTY, CO AND INCORPORATED AREAS DATA TRIBUTARY 6400 WEST 88
94 89
95 90
96 91
97 92
98 93
99 FLOODING SOURCE CROSS SECTION Willow Creek (At Lone Tree) AD AE AF AG AH AI DISTANCE 1 WIDTH (FEET) SECTION AREA (SQUARE FEET) MEAN VELOCITY (FEET PER SECOND) REGULATORY BASE FLOOD WATER-SURFACE ELEVATION (FEET NAVD) WITHOUT WITH INCREASE 19, , , , , , , , , , , , , , , , , , , , , , , , Stream Distance In Feet Above Confluence With Little Dry Creek TABLE 7 FEDERAL EMERGENCY MANAGEMENT AGENCY DOUGLAS COUNTY, CO AND INCORPORATED AREAS DATA WILLOW CREEK (AT LONE TREE) 94
100 FLOODING SOURCE CROSS SECTION DISTANCE 1 WIDTH (FEET) SECTION AREA (SQUARE FEET) MEAN VELOCITY (FEET PER SECOND) REGULATORY BASE FLOOD WATER SURFACE ELEVATION WITHOUT FEET (NGVD) (NAVD) WITH INCREASE Tributary 6400 South A , , , B , , , C 1, , , , D 1, , , , E 2, , , , F 3, , , , G 4, , , , H 5, , , , I 9, , , , J 10, , , , K 10, , , , L 11, , , , M 12, , , , N 13, , , , O 13, , , , Stream distance in feet above Confluence with East Plum Creek 2 Elevation computed without consideration of backwater from East Plum Creek T A B L E 10 TABLE 7 FEDERAL EMERGENCY MANAGEMENT AGENCY DOUGLAS COUNTY, CO AND INCORPORATED AREAS DATA TRIBUTARY 6400 SOUTH
101 5.0 INSURANCE APPLICATIONS For flood insurance rating purposes, flood insurance zone designations are assigned to a community based on the results of the engineering analyses. The zones are as follows: Zone A Zone A is the flood insurance rate zone that corresponds to the 100-year floodplains that are determined in the FIS by approximate methods. Because detailed hydraulic analyses are not performed for such areas, no base flood elevations or depths are shown within this zone. Zone AE Zone AE is the flood insurance rate zone that corresponds to the 100-year floodplains that are determined in the FIS by detailed methods. In most instances, whole-foot base flood elevations derived from the detailed hydraulic analyses are shown at selected intervals within this zone. Zone AH Zone AH is the flood insurance rate zone that corresponds to the areas of the 100- year shallow flooding (usually areas of ponding) where average depths are between 1 and 3 feet. Whole-foot base flood elevations derived from the detailed hydraulic analyses are shown at selected intervals within this zone. Zone AO Zone AO is the flood insurance rate zone that corresponds to the area of the 100- year shallow flooding (usually sheet flow on sloping terrain) where average depths are between 1 and 3 feet. Average whole-foot depths derived from the detailed hydraulic analyses are shown within this zone. Zone AR Area of special flood hazard formerly protected from the 1% annual chance flood event by a flood control system that was subsequently decertified. Zone AR indicates that the former flood control system is being restored to provide protection from the 1% annual chance or greater flood event. Zone A99 Zone A99 is the flood insurance rate zone that corresponds to areas of the 100- year floodplain that will be protected by a Federal flood protection system where construction has reached specified statutory milestones. No base flood elevations or depths are shown within this zone. 96
102 Zone X Zone X is the flood insurance rate zone that corresponds to areas outside the 500-year floodplain, areas within the 500-year floodplain, and areas of 100-year flooding where average depths are less than 1 foot, areas of 100-year flooding where the contributing drainage area is less than 1 square mile, and areas protected from the 100-year flood by levees. No base flood elevations or depths are shown within this zone. Zone D Zone D is the flood insurance rate zone that corresponds to unstudied areas where flood hazards are undetermined, but possible. 6.0 FLOOD INSURANCE RATE MAP The FIRM is designed for flood insurance and floodplain management applications. For flood insurance applications, the map designates flood insurance rate zones as described in Section 5.0 and, in the 100-year floodplains that were studied by detailed methods, shows selected whole-foot base flood elevations or average depths. Insurance agents use the zones and base flood elevations in conjunction with information on structures and their contents to assign premium rates for flood insurance policies. For floodplain management applications, the map shows by tints, screens, and symbols, the 100- and 500-year floodplains. On selected FIRM panels, floodways and the locations of selected cross sections used in the hydraulic analyses and floodway computations are shown where applicable. The current FIRM presents flooding information for the entire geographic area of Douglas County. Previously separate Flood Hazard Boundary Maps (FHBMs) and/or FIRMs were prepared for each identified floodprone incorporated community within the county. This countywide FIRM also includes flood hazard information that was presented separately on Flood Boundary and Floodway Maps (FBFMs), where applicable. Historical data relating to the maps prepared for each floodprone community, up to and including the September 30, 2005, countywide FIS are presented in Table 8, Community Map History. 7.0 OTHER STUDIES Several other flood studies have been completed for Douglas County streams. Flood hazard area delineations for Piney, Cottonwood, Lane Tree, and Murphy Creeks (Gingery Associates, Inc., 1975; Gingery Associates, Inc., Piney Creek; Gingery and Associates, Inc., Flood Hazard Area Delineations, 1975) were completed by Gingery Associates in October 1975 for UDFCD. The 10- and 50-year flood discharges are calculated and the 100-year profile and floodplain limits are shown. 97
103 COMMUNITY NAME INITIAL IDENTIFICATION FLOOD HAZARD BOUNDARY MAP REVISIONS DATE FIRM EFFECTIVE DATE FIRM REVISIONS DATE 1 Castle Pines, City of February 7, 1975 September 6, 1977 September 3, 1980 September 30, 1987 March 15, 1993 January 5, 1996 Castle Rock, Town of March 29, 1974 January 9, 1977 August 15, 1978 September 30, 1987 Douglas County February 7, 1975 September 6, 1977 September 3, 1980 September 30, 1987 (Unincorporated Areas) March 15, 1993 January 5, 1996 Larkspur, Town of September 30, 1987 None September 30, Lone Tree, City of February 7, 1975 None September 3, 1980 September 30, 1987 March 15, 1993 January 5, 1996 Parker, Town of September 30, 1987 None September 30, 1987 July 4, 1989 March 2, 1993 February 2, Dates for this community taken from the Unincorporated Areas of Douglas County TABLE 8 FEDERAL EMERGENCY MANAGEMENT AGENCY DOUGLAS COUNTY, CO AND INCORPORATED AREAS COMMUNITY MAP HISTORY 98
104 Flood Hazard Area Delineation Big Dry Creek (Arapco) (WRC Engineering, Inc., 1996), prepared for UDFCD by WRC Engineering, Inc, was completed in November 1996 and shows the 100-year floodplain boundary and water surface profile. Flood Hazard Area Delineation Willow Creek, Little Willow Creek, and East Willow Creek (Greenhorne & O Mara, Inc., 1996), prepared for UDFCD by WRC Engineering, Inc, was completed in December 1996 and shows the 100-year floodplain boundary and water surface profile. Flood Hazard Area Delineation Plum Creek Watershed (WRC Engineering, Inc., 2001), prepared for UDFCD by WRC Engineering, Inc, was completed in November 2001 and shows the 100-year floodplain boundary and water surface profile. Flood Hazard Area Delineation, Cherry Creek Corridor Reservoir to Scott Road, (URS Corporation, 2003) was prepared for UDFCD by URS Corporation, was completed in May 2003 and shows the 100-year floodplain boundary and water surface profile. Plum Creek and East Plum Creek Flood Hazard Area Delineation (ICON Engineering, Inc., 2004), prepared for the UDFCD by ICON Engineering, Inc., was completed in May 2004 and shows the 100-year and 500-year floodplain boundaries and water surface profiles from approximately 0.7 miles upstream of Airport Road on Plum Creek upstream to 1.2 miles upstream of Drainageway 6631 on East Plum Creek. Flood Hazard Area Delineation, Highlands Ranch, an unpublished study was prepared by UDFCD and shows the approximate 100-year floodplain boundary. Major Drainageway Planning, Little Dry Creek (McCall-Ellingson and Morrill, Inc., 1974), prepared for UDFCD by McCall-Ellingson and Morrill, Inc, was completed in February 1974 and shows the 100-year floodplain boundary and water surface profile. Major Drainage Master Plan, Big Dry Creek, completed by VTN Colorado, Inc. in June 1975, shows the 100-year flood plain boundary and water surface profile (VTN Colorado, Inc., 1975). This study was also prepared for UDFCD. A USACE Flood Plain information report on Cherry Creek (USACE, 1976) prepared for UDFCD includes determinations of 10-, 50-, 100-, and 500-year flood discharges and water surface profiles. The 1996 FIS included verification of the USACE hydrologic and hydraulic analysis. One area of disagreement was noted. At the confluence of Happy Canyon and Cherry Creeks, a significant difference in existing terrain was observed when the comparison of the mapping was made. The stream channel was relocated subsequent to the USACE mapping when a change in land use occurred. The 1996 FIS was based on more recent conditions and utilizes COE data to show flood plain limits in this area. Howard, Needles, Tammen & Bergendoff completed a report (Howard, Needles, Tammen & Bergendoff, 1977) in November 1977 for UDFCD. The 10-, 50-, 100-, and 500-year flood discharges were calculated for future flood conditions and the 100-year profile and flood plain boundaries are shown. 99
105 The Jack G. Raub Company completed Flood Hazard Area Delineations reports for Dad Clark Gulch in May 1981 and for Marcy Gulch in February 1983 (Jack G. Raub Company, 1981; Jack G. Raub Company, 1983). The 100-year flood plain boundaries and profiles are shown. The 1996 FIS includes these streams, but is based on the present condition of the study area. The study results are necessarily different. USGS Flood-Prone Area Maps for Douglas County (U.S. Department of the Interior, 1973) were used for general information and reference purposes. These maps, however, reflect approximate flood hazard area boundaries and are superseded by this FIS. This is a multi-volume FIS. Each volume may be revised separately, in which case it supersedes the previously printed volume. Users should refer to the Table of Contents in Volume 1 for the current effective date of each volume; volumes bearing these dates contain the most up-to-date flood hazard data. Information pertaining to revised and unrevised flood hazards for each jurisdiction within Douglas County has been compiled into this FIS. Therefore, this FIS supersedes all previously printed FIS Reports, FHBMs, FBFMs, and FIRMs for all of the incorporated and unincorporated jurisdictions within Douglas County. 8.0 LOCATION OF DATA Information concerning the pertinent data used in the preparation of this study can be obtained by contacting FEMA, Mitigation Division, Denver Federal Center, Building 710, Box 25267, Denver, Colorado BIBLIOGRAPHY AND REFERENCES 1. U.S. Department of Commerce, Bureau of the Census, 2010 Census of Population, Number of Inhabitants, Colorado 2. U.S. Department of Agriculture, Soil Conservation Service, Natural Plant Cover Map, Douglas County, Colorado, Scale 1:125,000, U.S. Department of the Interior, Geological Survey, Water-Supply Paper 997, Floods in Colorado, U.S. Department of the Interior, Geological Survey, Water-Supply Paper 1850-B, Floods of June 1965 in South Platte River Basin, Colorado, U. S. Geological Survey, Analysis of Post-Fire Hydrologic Hazards for the 2002 Hayman, Coal Seam, and Missionary Ridge Wildfires, Colorado, Water Resources Investigation Report 04-XXXX, prepared in cooperation with the Federal Emergency Management Agency, Denver, CO, April 7, 2004 (draft). 6. U.S. Department of Agriculture, Soil Conservation Service, Franktown-Parker Tributaries of Cherry Creek Watershed 100
106 7. U.S. Department of Agriculture, Soil Conservation Service, West Cherry Creek Watershed 8. U.S. Department of Agriculture, Soil Conservation Service, Hydrology, National Engineering Handbook, Section 1, U.S. Department of Commerce, National Oceanic and Atmospheric Administration, Atlas 2, Precipitation-Frequency Atlas of Western United States, Volume III, Colorado, U.S. Department of Agriculture, Soil Conservation Service, Soil Survey of Castle Rock Area, Colorado, U.S. Department of Agriculture, Soil Conservation Service, Land Use Map, Douglas County, Colorado, Scale 1:120,000, U.S. Department of Agriculture, Soil Conservation Service, Technical Release 20, Computer Program for Project Formulation-Hydrology, June U.S. Department of the Interior, Geological Survey, Technical Manual No. 1, Manual for Estimating Flood Characteristics of Natural Flow Streams in Colorado, U.S. Department of the Army, Corps of Engineers, Flood Plain Information, Cherry Creek-Cherry Creek Lake through Franktown, Colorado, U.S. Water Resources Council, Guidelines for Determining Flood Flow Frequency, Bulletin 17, Howard, needles, Tammen & Bergendoff, Flood Hazard area Delineation for Happy Canyon Creek, Badger Gulch, Newlin Gulch, Baldwin Gulch, Sulphur Gulch, and Tallman Gulch, November VTN Engineers, Architects, Planners, Major Drainageway Master Plan, Bg Dry Creek, October Gingery Associates, Inc., Flood Hazard Area Delineation, Cottonwood Creek, October Jack G. Raub Company, Flood Hazard Area Delineation, Dad Clark Gulch, Englewood, Colorado, May Jack G. Raub Company, Flood Hazard Area Delineation, Marcy Gulch, Englewood, Colorado, February Gingery Associates, Inc., Flood Hazard area Delineation, Piney Creek, October
107 22. U.S. Department of Agriculture, Soil Conservation Service, Technical Release 55, Procedures for Determining Peak Flows in Colorado, March U.S. Environmental Protection Agency, Computer Model SWWM 24. WRC Engineering, Inc., Flood Hazard Area Delineation Big Dry Creek (Arapco) & Tributaries, November Urban Drainage and Flood Control District, Colorado Urban Hydrograph Procedure Computer Program PC Version (CUHPE/PC), Users Manual, January Urban Drainage and Flood Control District, Urban Storm Drainage Criteria Manual, March 1969, Revised May 1975, Revised May Urban Drainage and Flood Control District, UDSWM-2PC, A Personal Computer Digital Model for Rainfall/Runoff Prediction and Watershed Simulation, Users Manual, January Urban Drainage and Flood Control District, Colorado Urban Hydrograph Procedure, Version F, May Greenhorne & O Mara, Inc., Flood Hazard Area Delineation Willow Creek, Little Willow Creek, and East Willow Creek, December Douglas County, Douglas County Drainage Criteria Manual, Urban Drainage and Flood Control District, Storm Water Management Model 386, March WRC Engineering, Inc., Flood Hazard Area Delineation Plum Creek Watershed, November Federal Emergency Management Agency, Flood Insurance Rate Map, Douglas County, Colorado (Unincorporated Areas), January 5, URS Corporation, Flood Hazard Area Delineation, Cherry Creek Corridor Reservoir to Scott Road, May Urban Drainage and Flood Control District, Colorado Urban Hydrograph Procedure, CUHP2000, Version Urban Drainage and Flood Control District, Urban Drainage Stormwater Management Model (UDSWM), February Anderson Consulting Engineers, South Platte river Post-Wildfire Floodplain Study, Hayman Burn Area, Douglas County, Colorado, November 24,
108 38. Urban Drainage and Flood Control District, Flood Hazard Area Delineation, Highlands Ranch, Unpublished. 39. Federal Emergency Management Agency, Flood Insurance Rate Map, Douglas County, Colorado (Unincorporated Areas), September 30, U.S. Department of Agriculture, Soil Conservation Service, Technical Release 61, WSP-2 Computer Program, May U.S. Department of the Army Corps of Engineers, Hydrologic Engineering Center, HEC-2 Water Surface Profiles, Generalized Computer Program, Davis, California, October U.S. Army Corps of Engineers, Hydrologic Engineering Center, HEC-RAS River Analysis System, April U.S. Army Corps of Engineers, Hydrologic Engineering Center, HEC-2 Water Surface Profiles, User s manual, September ICON Engineering, Inc., Plum Creek and East Plum Creek Flood Hazard Area Delineation, Flood Insurance Study Update Documentation, Technical Appendix, May U.S. Army Corps of Engineers, Hydrologic Engineering Center, HEC-RAS River Analysis System, January U.S. Army Corps of Engineer, Hydrologic Engineering Center, HEC-GeoRAS, An Extension for Support of HEC-RAS Using Arc-View, April U.S. Army Corps of Engineers, Hydrologic Engineering Center, HEC-RAS River Analysis System, Version 3.1.2, April U.S. Department of the Interior, Geological Survey, Water-Supply Paper 1849, Roughness Characteristics of Natural Streams, Ven Te Chow, Open-Channel Hydraulics, New York: McGraw-Hill Book Company, Davis Sorenson, Handbook of Applied Hydraulics, Third Edition, New York: McGraw-Hill Book Company, U.S. Department of the Interior, Geological Survey, 7.5-Minute Series Topographic Maps: Scale 1:24,000, Contour Interval 10 feet: Highlands Ranch, Colorado (1965); Littleton, Colorado (1965); Parker, Colorado (1965); Piney Creek, Colorado (1966) 52. U.S. Department of the Interior, Geological Survey, 7.5-Minute Series Topographic Maps: Scale 1:24,000, Contour Interval 20 feet: Castle Rock North, Colorado (1965); Castle Rock South, Colorado (1965); Greenland, Colorado 103
109 (1954); Cherry Valley School, Colorado (1966); Russelville Gulch, Colorado (1966); Sedalia, Colorado (1965) 53. U.S. Department of the Interior, Geological Surcey, 7.5-Minute Series Topographic Maps: Scale 1:24,000, Contour Interval 40 feet: Cheesman Lake, Colorado (1956); Deckers, Colorado (1954); Devils Head, Colordao (1956); Kassler, Colorado (1965): Platte Canyon, Colorado (1956) 54. Gingery and Associates, Inc., Flood Hazard area Delineations, October McCall-Ellingson and Morrill, Inc., Major Drainageway Planning, Little Dry Creek, February VTN Colorado, Inc., Major Drainageway Master Plan, Big Dry Creek, June U.S. Department of the Interior, Geological Survey, Flood-Prone Area Maps of Douglas County, Colorado,
110 10.0 REVISIONS DESCRIPTION This section has been added to provide information regarding significant revisions made since the original Flood Insurance Study was printed. Future revisions may be made that do not result in the republishing of the Flood Insurance Study report. To assure that any user is aware of all revisions, it is advisable to contact the Community Map Repository. Please reference the FIRM Index Map for a listing of repositories in Douglas County First Revision This study was revised on March 16, 2016 to incorporate new hydrologic and hydraulic study data and recent Letters of Map Revision (LOMRs). This revision was completed by the UDFCD under its May 17, 1999 agreement with FEMA, entitled Cooperating Technical Partners Mapping Activity Statement No. 21. The final community meeting was held August 13, 2014 at the UDFCD Board Room. UDFCD contracted ICON Engineering, Inc., to incorporate the flood hazard data from various sources, to prepare the data in conformance with FEMA's DFIRM specifications, and to produce the revised DFIRM panels. Specifically, new hydraulic and hydrologic studies resulted in new or revised detailed studies along East Plum Creek, Hangman s Gulch, Industrial Tributary, McMurdo Gulch, McMurdo Gulch Split Flow, Mitchell Gulch, Mitchell Gulch Tributary 2, Omni Tributary, Sellars Gulch, Sellars Gulch Tributary 2, Tributary 6400 East and Tributary 6400 West, and Willow Creek (at Lone Tree). New detailed studies with the City of Castle Rock along Tributary to Industrial Tributary, Mitchell Gulch Tributary 1, and Sellars Gulch Tributary 1 as well as additional upper reach study areas of several of the above-mentioned new studies are depicted on the FIRM with a shaded Zone X floodplain, indicating future flood hazard areas. Because no FIS tabular information correlates with Zone X (shaded) floodplains, these future flooding reaches are not included in the FIS tables or exhibits. Finally, several LOMRs issued since the original countywide FIS became effective were incorporated into the revised DFIRM panels. With the exception of the Willow Creek FHAD within and near the City of Lone Tree, the new studies were generated by the Town of Castle Rock, Colorado as updates to many of the draingeways affecting its jurisdiction. The new studies are known as Flood Hazard Area Delineation (FHAD) studies and additional information on their development is available from the Town of Castle Rock, and in the case of Willow Creek, from UDFCD. 105
111
112
113

114

115

116

117

118

119

120

121

122

123

124

125

126
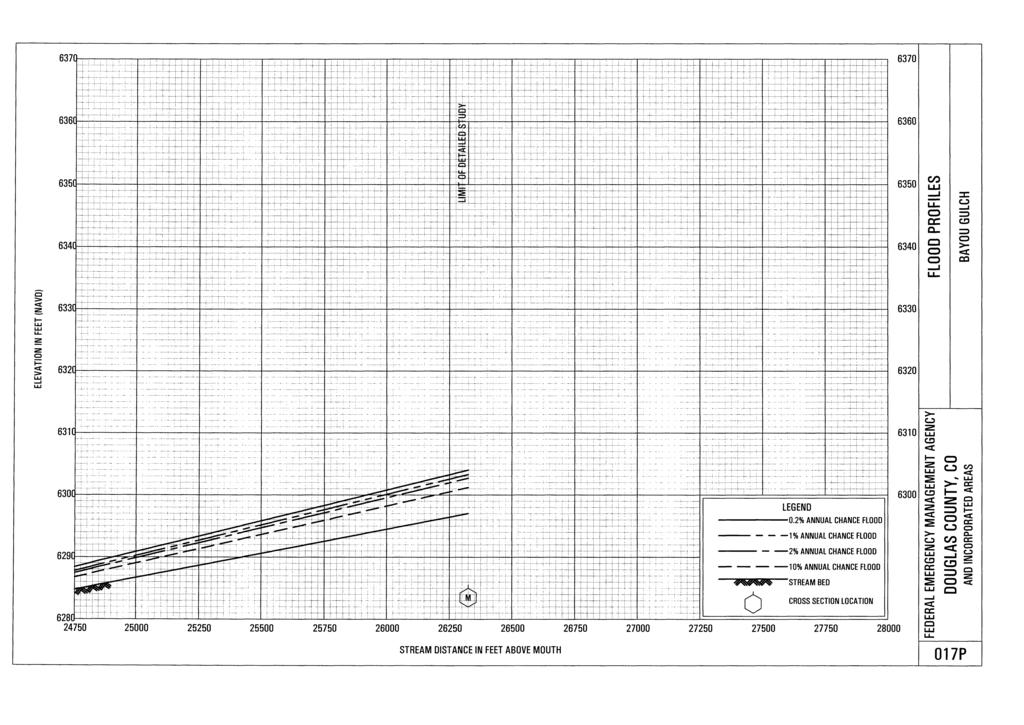
127

128

129

130

131
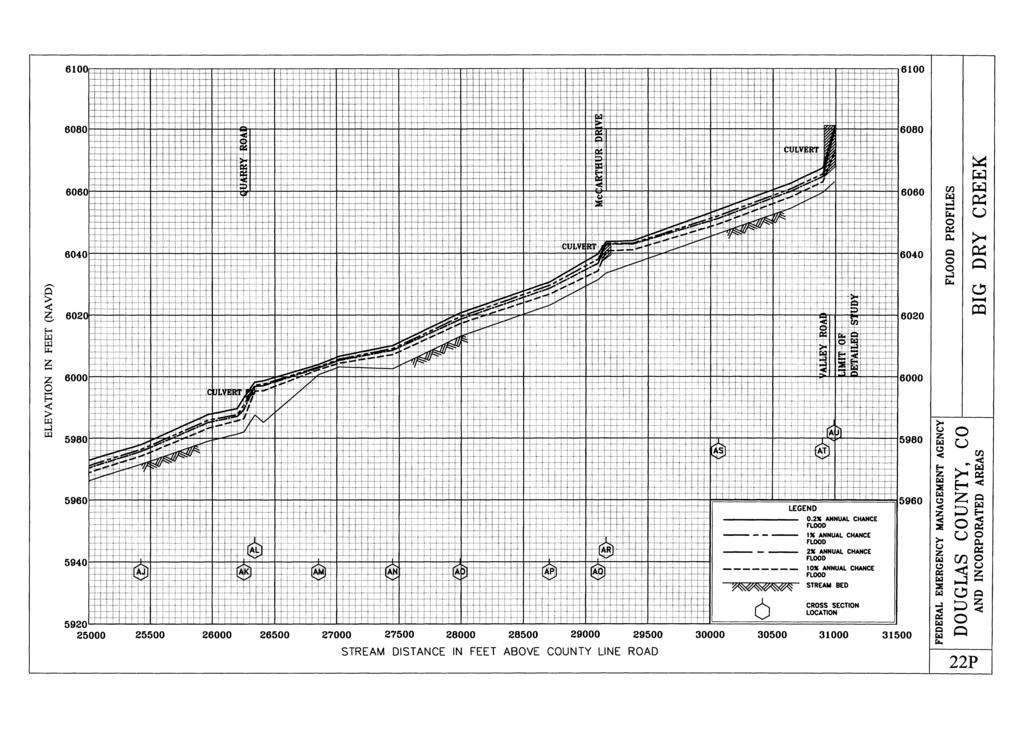
132

133

134

135
SECTION IV WATERSHED TECHNICAL ANALYSIS
 A. Watershed Modeling SECTION IV WATERSHED TECHNICAL ANALYSIS An initial step in the preparation of this stormwater management plan was the selection of a stormwater simulation model to be utilized. It
LANIER COUNTY, GEORGIA
 LANIER COUNTY, GEORGIA AND INCORPORATED AREAS Community Name Community Number Lanier County LAKELAND, CITY OF 130120 LANIER COUNTY (UNINCORPORATED AREAS) 130555 Effective: December 17, 2010 FLOOD INSURANCE
WALKER COUNTY, GEORGIA
 WALKER COUNTY, GEORGIA AND INCORPORATED AREAS Walker County Community Name Community Number CHICKAMAUGA, CITY OF 130181 LAFAYETTE, CITY OF 130182 LOOKOUT MOUNTAIN, CITY OF 130448 ROSSVILLE, CITY OF 130183
SECTION III: WATERSHED TECHNICAL ANALYSIS
 Trout Creek Watershed Stormwater Management Plan SECTION III: WATERSHED TECHNICAL ANALYSIS A. Watershed Modeling An initial step this study of the Trout Creek watershed was the selection of a stormwater
JACKSON COUNTY, GEORGIA AND INCORPORATED AREAS
 Jackson County JACKSON COUNTY, GEORGIA AND INCORPORATED AREAS COMMUNITY NAME COMMUNITY NUMBER ARCADE, CITY OF 130597 BRASELTON, TOWN OF 130343 COMMERCE, CITY OF 130212 HOSCHTON, CITY OF 130344 JACKSON
A Hydrologic Study of the. Ryerson Creek Watershed
 A Hydrologic Study of the Ryerson Creek Watershed Dave Fongers Hydrologic Studies Unit Land and Water Management Division Michigan Department of Environmental Quality May 8, 2002 Table of Contents Summary...2
DAWSON COUNTY, GEORGIA
 DAWSON COUNTY, GEORGIA AND INCORPORATED AREAS Dawson County COMMUNITY NAME COMMUNITY NUMBER DAWSON COUNTY 130304 (UNINCORPORATED AREAS) DAWSONVILLE, CITY OF 130064 SEPTEMBER 26, 2008 FLOOD INSURANCE STUDY
FLOOD INSURANCE STUDY
 FLOOD INSURANCE STUDY BERKELEY COUNTY, WEST VIRGINIA AND INCORPORATED AREAS COMMUNITY NAME COMMUNITY NUMBER Berkeley County BERKELEY COUNTY (UNINCORPORATED AREAS) 540282 *HEDGESVILLE, TOWN OF 545550 MARTINSBURG,
KAY COUNTY, OKLAHOMA. Federal Emergency Management Agency AND INCORPORATED AREAS
 KAY COUNTY, OKLAHOMA AND INCORPORATED AREAS Notice: This preliminary FIS report includes only revised Flood Profiles. See Notice to Flood Insurance Users page for additional details. Community Name Community
4. Present Activities and Roles
 4. Present Activities and Roles The present missions, authorities, activities and roles of the various agencies involved with flood protection, floodplain management and flood-damage reduction are identified
Prepared for: City of Jeffersonville. November Prepared by
 JEFFERSONVILLE STORMWATER MASTER PLAN HYDRAULICS APPENDIX JEFFERSONVILLE, INDIANA Prepared for: City of Jeffersonville November 2011 Prepared by Christopher B. Burke Engineering, Ltd. 115 W. Washington
INFLOW DESIGN FLOOD CONTROL SYSTEM PLAN 40 C.F.R. PART PLANT YATES ASH POND 3 (AP-3) GEORGIA POWER COMPANY
 GEORGIA POWER COMPANY") INFLOW DESIGN FLOOD CONTROL SYSTEM PLAN 40 C.F.R. PART 257.82 PLANT YATES ASH POND 3 (AP-3) GEORGIA POWER COMPANY EPA s Disposal of Coal Combustion Residuals from Electric Utilities Final Rule (40 C.F.R.
INFLOW DESIGN FLOOD CONTROL SYSTEM PLAN 40 C.F.R. PART 257.82 PLANT YATES ASH POND 3 (AP-3) GEORGIA POWER COMPANY EPA s Disposal of Coal Combustion Residuals from Electric Utilities Final Rule (40 C.F.R.
III. INVENTORY OF EXISTING FACILITIES
 III. INVENTORY OF EXISTING FACILITIES Within the Growth Management Boundary, the existing storm drainage facilities are largely associated with development that has historically occurred in the ten drainage
Freight Street Development Strategy
 Freight Street Development Strategy Appendix B: Naugatuck River Floodplain Analysis Freight Street Development Strategy DECEMBER 2017 Page B-1 1.0 NAUGATUCK RIVER FLOODPLAIN AT FREIGHT STREET 1.1 Watershed
LAKE COUNTY HYDROLOGY DESIGN STANDARDS
 LAKE COUNTY HYDROLOGY DESIGN STANDARDS Lake County Department of Public Works Water Resources Division 255 N. Forbes Street Lakeport, CA 95453 (707)263-2341 Adopted June 22, 1999 These Standards provide
INFLOW DESIGN FLOOD CONTROL SYSTEM PLAN 40 C.F.R. PART PLANT YATES ASH POND B (AP-B ) GEORGIA POWER COMPANY
 GEORGIA POWER COMPANY") INFLOW DESIGN FLOOD CONTROL SYSTEM PLAN 40 C.F.R. PART 257.82 PLANT YATES ASH POND B (AP-B ) GEORGIA POWER COMPANY EPA s Disposal of Coal Combustion Residuals from Electric Utilities Final Rule (40 C.F.R.
INFLOW DESIGN FLOOD CONTROL SYSTEM PLAN 40 C.F.R. PART 257.82 PLANT YATES ASH POND B (AP-B ) GEORGIA POWER COMPANY EPA s Disposal of Coal Combustion Residuals from Electric Utilities Final Rule (40 C.F.R.
CLEVELAND COUNTY, OKLAHOMA AND INCORPORATED AREAS VOLUME 1 OF 3
 CLEVELAND COUNTY, OKLAHOMA AND INCORPORATED S VOLUME 1 OF 3 PRELIMINARY SEPTEMBER 30, 2011 Community Name Community Number CLEVELAND COUNTY, UNINCORPORATED S 400475 LEXINGTON, CITY OF 400043 MOORE, CITY
NEW CASTLE COUNTY, DELAWARE, AND INCORPORATED AREAS
 NEW CASTLE COUNTY, DELAWARE, AND INCORPORATED AREAS Community Name Community Number ARDEN, VILLAGE OF 100052 *AREDENCROFT, VILLAGE OF 100057 ARDENTOWN, VILLAGE OF 100058 *BELLEFONTE, TOWN OF 100021 DELAWARE
STEPHENS COUNTY, OKLAHOMA AND INCORPORATED AREAS
 STEPHENS COUNTY, OKLAHOMA AND INCORPORATED AREAS Community Name Community Number BRAY, TOWN OF 400536 COMANCHE, CITY OF 405376 DUNCAN, CITY OF 400202 EMPIRE CITY, CITY OF 400520 LOCO, CITY OF 400521 MARLOW,
Engineering Report Preliminary Floodplain Study. Executive Summary
 Executive Summary Engineering Report Preliminary Floodplain Study The Federal Emergency Management Agency (FEMA) has updated the Flood Insurance Rate Maps (FIRM) for Finney County, including the City of
PENNINGTON COUNTY, SOUTH DAKOTA AND INCORPORATED AREAS VOLUME 1 OF 3
 PENNINGTON COUNTY, SOUTH DAKOTA AND INCORPORATED AREAS VOLUME 1 OF 3 Community Name Community Number BOX ELDER, CITY OF 460089 HILL CITY, CITY OF 460116 KEYSTONE, TOWN OF 460231 NEW UNDERWOOD, CITY OF
SEWRPC Staff Memorandum
 SEWRPC Staff Memorandum EVALUATION OF PROPOSED STORMWATER QUANTITY MANAGEMENT FOR THE DES PLAINES RIVER WATERSHED PORTION OF THE PROPOSED FOXCONN DEVELOPMENT IN THE VILLAGE OF MOUNT PLEASANT June, 2018
DAVIESS COUNTY, KENTUCKY AND INCORPORATED AREAS Daviess County
 DAVIESS COUNTY, KENTUCKY Daviess County COMMUNITY NAME COMMUNITY NUMBER DAVIESS COUNTY (UNINCORPORATED AREAS) 210062 OWENSBORO, CITY OF 210063 *WHITESVILLE, CITY OF 210438 *NON-FLOODPRONE COMMUNITY REVISED
INFLOW DESIGN FLOOD CONTROL SYSTEM PLAN 40 C.F.R. PART PLANT BOWEN ASH POND 1 (AP-1) GEORGIA POWER COMPANY
 GEORGIA POWER COMPANY") INFLOW DESIGN FLOOD CONTROL SYSTEM PLAN 40 C.F.R. PART 257.82 PLANT BOWEN ASH POND 1 (AP-1) GEORGIA POWER COMPANY EPA s Disposal of Coal Combustion Residuals from Electric Utilities Final Rule (40 C.F.R.
INFLOW DESIGN FLOOD CONTROL SYSTEM PLAN 40 C.F.R. PART 257.82 PLANT BOWEN ASH POND 1 (AP-1) GEORGIA POWER COMPANY EPA s Disposal of Coal Combustion Residuals from Electric Utilities Final Rule (40 C.F.R.
INFLOW DESIGN FLOOD CONTROL SYSTEM PLAN 40 C.F.R. PART PLANT DANIEL ASH POND B MISSISSIPPI POWER COMPANY
 INFLOW DESIGN FLOOD CONTROL SYSTEM PLAN 40 C.F.R. PART 257.82 PLANT DANIEL ASH POND B MISSISSIPPI POWER COMPANY EPA s Disposal of Coal Combustion Residuals from Electric Utilities Final Rule (40 C.F.R.
Bridge Replacement Project. Preliminary Hydraulic Study. Lincoln, California BRLS-5089 (021) BRIDGE 19C Mcbean Park Drive at Auburn Ravine
 BRIDGE 19C Mcbean Park Drive at Auburn Ravine") Bridge Replacement Project Preliminary Hydraulic Study Lincoln, California BRLS-5089 (021) BRIDGE 19C 0059 Mcbean Park Drive at Auburn Ravine Prepared By: Prepared By: Date 11/25/2014 Thomas S. Plummer
Bridge Replacement Project Preliminary Hydraulic Study Lincoln, California BRLS-5089 (021) BRIDGE 19C 0059 Mcbean Park Drive at Auburn Ravine Prepared By: Prepared By: Date 11/25/2014 Thomas S. Plummer
BLACK HAWK COUNTY, IOWA AND INCORPORATED AREAS
 VOLUME 2 OF 3 BLACK HAWK COUNTY, IOWA AND INCORPORATED AREAS COMMUNITY NAME BLACK HAWK COUNTY, UNINCORPORATED AREAS COMMUNITY NUMBER 190535 CEDAR FALLS, CITY OF 190017 DUNKERTON, CITY OF 190018 ELK RUN
OLMSTED COUNTY, MINNESOTA AND INCORPORATED AREAS
 OLMSTED COUNTY, MINNESOTA AND INCORPORATED AREAS Community Name Community Number *BYRON, CITY OF 270751 CHATFIELD, CITY OF 270125 DOVER, CITY OF 270566 EYOTA, CITY OF 270329 OLMSTED COUNTY 270626 (UNINCORPORATED
Chapter 4. Drainage Report and Construction Drawing Submittal Requirements
 4.0 Introduction The requirements presented in this section shall be used to aid the design engineer or applicant in the preparation of drainage reports, drainage studies, and construction drawings for
WAVERLY FLOODPLAIN BACKGROUND INFORMATION
 WAVERLY FLOODPLAIN BACKGROUND INFORMATION Who designates the floodplains in Waverly? The Federal Emergency Management Agency (FEMA) is responsible for delineating floodplains. The floodplain FEMA uses
Douglas County 2008 PFIS Appeal, 2010 Effective FIS Restudies ( ), and Alpine View Estates Flood Study
, and Alpine View Estates Flood Study") Douglas County 2008 PFIS Appeal, 2010 Effective FIS Restudies (2010-2015), and Alpine View Estates Flood Study Douglas County 2008 PFIS Appeal, and 2010 Effective FIS Re- Studies (2010-2015) (Prior to
Douglas County 2008 PFIS Appeal, 2010 Effective FIS Restudies (2010-2015), and Alpine View Estates Flood Study Douglas County 2008 PFIS Appeal, and 2010 Effective FIS Re- Studies (2010-2015) (Prior to
Hydrology and Flooding
 Hydrology and Flooding Background The 1996 flood Between February 4, 1996 and February 9, 1996 the Nehalem reporting station received 28.9 inches of rain. Approximately 14 inches fell in one 48 hour period.
INITIAL INFLOW DESIGN FLOOD CONTROL SYSTEM PLAN PLANT MCMANUS ASH POND A (AP-1) 40 CFR
 40 CFR") INITIAL INFLOW DESIGN FLOOD CONTROL SYSTEM PLAN PLANT MCMANUS ASH POND A (AP-1) 40 CFR 257.82 EPA s Disposal of Coal Combustion Residuals from Electric Utilities Final Rule (40 C.F.R. Part 257 and Part
INITIAL INFLOW DESIGN FLOOD CONTROL SYSTEM PLAN PLANT MCMANUS ASH POND A (AP-1) 40 CFR 257.82 EPA s Disposal of Coal Combustion Residuals from Electric Utilities Final Rule (40 C.F.R. Part 257 and Part
Boulder Creek Hydrologic Analysis
 Final Report Boulder Creek Hydrologic Analysis Prepared for Colorado Department of Transportation August 2014 9191 S. Jamaica Street Englewood, CO 80112 Contents Section Page Acronyms and Abbreviations...
HYDROLOGY REPORT HEACOCK & CACTUS CHANNELS MORENO VALLEY, CALIFORNIA NOVEMBER 2005 REVISED APRIL 2006 REVISED AUGUST 2006
 HYDROLOGY REPORT HEACOCK & CACTUS CHANNELS MORENO VALLEY, CALIFORNIA NOVEMBER 2005 REVISED APRIL 2006 REVISED AUGUST 2006 RIVERSIDE COUNTY FLOOD CONTROL AND WATER CONSERVATION DISTRICT TABLE OF CONTENTS
Estimating the 100-year Peak Flow for Ungagged Middle Creek Watershed in Northern California, USA
 American Journal of Water Resources, 2014, Vol. 2, No. 4, 99-105 Available online at http://pubs.sciepub.com/ajwr/2/4/3 Science and Education Publishing DOI:10.12691/ajwr-2-4-3 Estimating the 100-year
INFLOW DESIGN FLOOD CONTROL SYSTEM PLAN 40 C.F.R. Part PLANT MCINTOSH ASH POND 1 GEORGIA POWER COMPANY
 INFLOW DESIGN FLOOD CONTROL SYSTEM PLAN 40 C.F.R. Part 257.82 PLANT MCINTOSH ASH POND 1 GEORGIA POWER COMPANY EPA s Disposal of Coal Combustion Residuals from Electric Utilities Final Rule (40 C.F.R. Part
OCONEE COUNTY, GEORGIA
 OCONEE COUNTY, GEORGIA AND INCORPORATED AREAS Oconee County Community Name Community Number *BISHOP, TOWN OF 130620 *BOGART, CITY OF 130490 NORTH HIGH SHOALS, TOWN OF 130368 OCONEE COUNTY 130453 (UNINCORPORATED
TIFT COUNTY, GEORGIA AND INCORPORATED AREAS. Tift County. Revised: September 29, 2010 FLOOD INSURANCE STUDY NUMBER 13277CV000A
 TIFT COUNTY, GEORGIA AND INCORPORATED AREAS Community Name Community Number Tift County OMEGA, CITY OF 130552 TIFT COUNTY (UNINCORPORATED AREAS) 130404 TIFTON, CITY OF 130171 TY TY, CITY OF 130172 Revised:
SAW MILL RIVER DAYLIGHTING ANALYSIS AT RIVER PARK CENTER
 SAW MILL RIVER DAYLIGHTING ANALYSIS AT RIVER PARK CENTER Prepared for: Struever Fidelco Cappelli LLC McLaren Project No. 6 August 28 TABLE OF CONTENTS. INTRODUCTION 2. SAW MILL RIVER: FEMA STUDY... 2..
CHAPTER 3 FLOOD RELATED STUDIES
 CHAPTER 3 FLOOD RELATED STUDIES Although the area has experienced regular flooding there have been few formal flood studies until more recently. There are a number of water quality studies in the basins.
TABLE OF CONTENTS. 1.0 Background Watershed Description Hydrology - HEC-HMS Models Hydraulics - HEC-RAS Models...
 TABLE OF CONTENTS 1.0 Background... 1 2.0 Watershed Description... 1 3.0 Hydrology - HEC-HMS Models... 2 3.1 Hydrologic Approach... 2 3.2 Drainage Areas... 2 3.3 Curve Numbers... 2 3.4 Lag Times... 3 3.5
Appendix Q Draft Location Hydraulic Study Report For the State Route 32 Widening Between Fir Street and Yosemite Drive at Dead Horse Slough and South
 Appendix Q Draft Location Hydraulic Study Report For the State Route 32 Widening Between Fir Street and Yosemite Drive at Dead Horse Slough and South Fork Dead Horse Slough in the, California Draft Location
6.0 Runoff. 6.1 Introduction. 6.2 Flood Control Design Runoff
 October 2003, Revised February 2005 Chapter 6.0, Runoff Page 1 6.1 Introduction 6.0 Runoff The timing, peak rates of discharge, and volume of stormwater runoff are the primary considerations in the design
APPENDIX J-3 Technical Report on Airport Drainage, Northern Sector Airport and Ordinance Creek Watershed, Airport Creek Hydrologic Models
 APPENDIX J-3 Technical Report on Airport Drainage, Northern Sector Airport and Ordinance Creek Watershed, Airport Creek Hydrologic Models Introduction Technical Report on Airport Drainage Appendix J-3:
Development of Stage-Discharge Ratings for Site 2240 Bear Creek at Cold Spring
 Development of Stage-Discharge Ratings for Site 2240 Bear Creek at Cold Spring Prepared for: Urban Drainage and Flood Control District 2480 W. 26 th Avenue Suite 156-B Denver, CO 80211 May 19, 2006 (Rev
COLUMBIA COUNTY, GEORGIA
 COLUMBIA COUNTY, GEORGIA AND INCORPORATED AREAS Community Name Community Number COLUMBIA COUNTY 130059 (UNINCORPORATED AREAS) GROVETOWN, CITY OF 130265 HARLEM, CITY OF 130266 COLUMBIA COUNTY Effective:
Technical Memorandum No River Geometry
 Pajaro River Watershed Study in association with Technical Memorandum No. 1.2.5 River Geometry Task: Collection and Analysis of River Geometry Data To: PRWFPA Staff Working Group Prepared by: J. Schaaf
INFLOW DESIGN FLOOD CONTROL SYSTEM PLAN PLANT GASTON GYPSUM POND ALABAMA POWER COMPANY
 INFLOW DESIGN FLOOD CONTROL SYSTEM PLAN PLANT GASTON GYPSUM POND ALABAMA POWER COMPANY Section 257.82 of EPA s regulations requires the owner or operator of an existing or new CCR surface impoundment or
Cherokee County Future Conditions Floodplain Development
 TECHNICAL MEMORANDUM Cherokee County Future Conditions Floodplain Development Prepared for: Prepared by: Geoff Morton, P.E., County Engineer Cherokee County Richard Greuel, P.E.,, Inc. Richard Taylor,
JACKSON COUNTY, OREGON AND INCORPORATED AREAS
 JACKSON COUNTY, OREGON AND INCORPORATED AREAS COMMUNITY NAME COMMUNITY NUMBER ASHLAND, CITY OF 410090 CENTRAL POINT, CITY OF 410092 EAGLE POINT, CITY OF 410093 GOLD HILL, CITY OF 410094 JACKSON COUNTY,
BULLOCH COUNTY, GEORGIA
 BULLOCH COUNTY, GEORGIA AND INCORPORATED AREAS Community Name Community Number BROOKLET, TOWN OF 130020 BULLOCH COUNTY 130019 (UNINCORPORATED AREAS) *PORTAL, TOWN OF 130582 REGISTER, TOWN OF 130549 STATESBORO,
Chapter 6. Hydrology. 6.0 Introduction. 6.1 Design Rainfall
 6.0 Introduction This chapter summarizes methodology for determining rainfall and runoff information for the design of stormwater management facilities in the City. The methodology is based on the procedures
Case Study 19. Mill Creek Embedded Box Culvert Vented Ford
 Case Study. Mill Creek Embedded Box Culvert Vented Ford Location Southeast Missouri. Mark Twain National Forest; Houston-Rolla Ranger District. Southeast of Rolla, south of Interstate 44, off of State
4.2 Cherry Creek & Stillhouse Branch
 Section 4 Withlacoochee Basin 4.2 Cherry Creek & Stillhouse Branch 4.2.1 Introduction The information presented in this sub-basin plan for Cherry Creek and Stillhouse Branch is intended to provide the
San Luis Obispo Creek Watershed Hydrologic Model Inputs
 Jeff Werst San Luis Obispo County Department of Public Works 1050 Monterey Street San Luis Obispo CA 93408 December 14, 2007 Subject: San Luis Obispo Creek Watershed Hydrology and Hydraulic Model Dear
INITIAL RUN-ON AND RUN-OFF CONTROL PLAN 40 C.F.R. PART 257
 INITIAL RUN-ON AND RUN-OFF CONTROL PLAN 40 C.F.R. PART 257.81 HUFFAKER ROAD (PLANT HAMMOND) PRIVATE INDUSTRIAL LANDFILL (HUFFAKER ROAD LANDFILL) GEORGIA POWER COMPANY EPA s Disposal of Coal Combustion
Watersheds. A river is the report card for its watershed. Alan Levere. Arizona Water Issues 2010 The University of Arizona HWR203 1
 Watersheds A river is the report card for its watershed. Alan Levere 1 What separates watersheds? How do you identify watershed boundaries? Drainage Divides River Networks boto.ocean.washington.edu/gifs/purus.gif
Project Drainage Report
 Design Manual Chapter 2 - Stormwater 2A - General Information 2A-4 Project Drainage Report A. Purpose The purpose of the project drainage report is to identify and propose specific solutions to stormwater
5/25/2017. Overview. Flood Risk Study Components HYDROLOGIC MODEL (HEC-HMS) CALIBRATION FOR FLOOD RISK STUDIES. Hydraulics. Outcome or Impacts
 CALIBRATION FOR FLOOD RISK STUDIES. Hydraulics. Outcome or Impacts") HYDROLOGIC MODEL (HEC-HMS) CALIBRATION FOR FLOOD RISK STUDIES C. Landon Erickson, P.E.,CFM Water Resources Engineer USACE, Fort Worth District April 27 th, 2017 US Army Corps of Engineers Overview Flood
HYDROLOGIC MODEL (HEC-HMS) CALIBRATION FOR FLOOD RISK STUDIES C. Landon Erickson, P.E.,CFM Water Resources Engineer USACE, Fort Worth District April 27 th, 2017 US Army Corps of Engineers Overview Flood
PUTNAM COUNTY, FLORIDA AND INCORPORATED AREAS
 PUTNAM COUNTY, FLORIDA AND INCORPORATED AREAS PUTNAM COUNTY Community Name Community Number CRESCENT CITY, CITY OF 120408 INTERLACHEN, TOWN OF 120391 PALATKA, CITY OF 120273 POMONA PARK, TOWN OF 120418
Public Works and Engineering
 6.C Exhibit Incorporated in 1909 Public Works and Engineering Committee Report To: From: Mayor and Board of Trustees Bill Emmerich For Village Board Meeting of: November 27, 2017 Subject: Division and
TECHNICAL GUIDANCE and CASE STUDY for INEFFECTIVE FLOW and CONVEYANCE SHADOW AREAS
 Utilities electric stormwater wastewater water 700 Wood St. PO Box 580 Fort Collins, CO 80522 970.221.6700 970.221.6619 fax 970.224.6003 TDD utilities@fcgov.com fcgov.com/utilities TECHNICAL GUIDANCE and
LOWER SWEETWATER CREEK
 LOWER SWEETWATER CREEK STORMWATER MANAGEMENT MASTER PLAN Prepared for the Hillsborough County Board of County Commissioners By Public Works Department/Engineering Division Stormwater Management Section
INFLOW DESIGN FLOOD CONTROL SYSTEM PLAN PLANT GREENE COUNTY ASH POND ALABMA POWER COMPANY
 INFLOW DESIGN FLOOD CONTROL SYSTEM PLAN PLANT GREENE COUNTY ASH POND ALABMA POWER COMPANY Section 257.82 of EPA s regulations requires the owner or operator of an existing or new CCR surface impoundment
OGLE COUNTY, ILLINOIS AND INCORPORATED AREAS
 OGLE COUNTY, ILLINOIS AND INCORPORATED AREAS COMMUNITY NAME COMMUNITY NUMBER Ogle County ADELINE, VILLAGE OF 170835 BYRON, CITY OF 170526 *CRESTON, VILLAGE OF 171289 *DAVIS JUNCTION, VILLAGE OF 171076
Informational Meeting- July 21, Boxelder B-2/B-3 Watershed Planning Study
 Informational Meeting- July 21, 2015 Boxelder B-2/B-3 Watershed Planning Study Agenda Introductions Background & History Purpose & Need NRCS Watershed Planning Program Work Completed to Date Longer term
DRAINAGE STUDY CROWS LANDING INDUSTRIAL BUSINESS PARK. Stanislaus County. Prepared by:
 DRAINAGE STUDY FOR CROWS LANDING INDUSTRIAL BUSINESS PARK Stanislaus County Prepared by: March, 2017 Revised November, 2017 Table of Contents EXECUTIVE SUMMARY... 1 1. INTRODUCTION... 2 2. HYDROLOGY...
COTTONWOOD CREEK RECLAMATION PHASE I & II
 COTTONWOOD CREEK RECLAMATION PHASE I & II COTTONWOOD CREEK RECLAMATION Stream Stabilization Approach to Urban Runoff Quality Cherry Creek Basin Water Quality Authority The Problem The Cherry Creek Reservoir
TRUMBULL COUNTY OHIO AND INCORPORATED AREAS
 TRUMBULL COUNTY OHIO AND INCORPORATED AREAS Community Community Name Number (1) CORTLAND, CITY OF 390823 GIRARD, CITY OF 390536 HUBBARD, CITY OF 390537 LORDSTOWN, VILLAGE OF 390812 MCDONALD, VILLAGE OF
MRG Bernalillo to Belen GRR
 MRG Bernalillo to Belen GRR Appendix H Hydrology and Hydraulics July 2017 Albuquerque District South Pacific Division Rio Grande Floodway Bernalillo to Belen, Mt. View - Isleta to Belen Unit Bernalillo
MODOC COUNTY, CALIFORNIA
 MODOC COUNTY, CALIFORNIA AND INCORPORATED AREAS COMMUNITY NAME COMMUNITY NUMBER ALTURAS, CITY OF 060193 MODOC COUNTY (UNINCORPORATED AREAS) 060192 REVISED: PRELIMINARY: FEBRUARY 14, 2013 FLOOD INSURANCE
APPENDIX A. Hydraulic Investigations: Cascade Mall at Burlington
 APPENDIX A m SUMMARY REPORT FOR E.I.S. Hydraulic Investigations: Cascade Mall at Burlington July 12, 1982 John E. Norman, P.E. 14779 Northeast 32nd, #A201 Bellevue, WA 98007 (206) 882-1767 92 General A
Little Thompson River Hydrologic Analysis
 Draft Report Little Thompson River Hydrologic Analysis Phase 2: Little Thompson River above Big Thompson River Prepared for Colorado Department of Transportation March 27, 2015 9191 S. Jamaica Street Englewood,
Technical Memorandum No Basis of Comparison
 Pajaro River Watershed Study in association with Technical Memorandum No. 1.2.1 Basis of Comparison Task: Basis of Comparison To: PRWFPA Staff Working Group Prepared by: J. Schaaf Reviewed by: R. Raines
Stormwater Management Studies PDS Engineering Services Division ES Policy # 3-01
 Stormwater Management Studies PDS Engineering Services Division Revised Date: 2/28/08 INTRODUCTION The City of Overland Park requires submission of a stormwater management study as part of the development
TREMPEALEAU COUNTY, WISCONSIN AND INCORPORATED AREAS
 TREMPEALEAU COUNTY, WISCONSIN Community Name Community Number Arcadia, City of 550439 Blair, City of 550440 Eleva, Village of 550441 Ettrick, Village of 550442 Galesville, City of 550443 Independence,
Airport Master Plan. Floodplain Report. Prepared by: Prepared for: Illinois Department of Transportation
 Airport Master Plan Floodplain Report Prepared by: Prepared for: Illinois Department of Transportation July 10, 2013 Table of Contents Topic Page Number Cover Sheet... Cover Sheet Table of Contents...
EFFECT OF RAINGAGE DENSITY ON RUNOFF SIMULATION MODELING by ABSTRACT
 EFFECT OF RAINGAGE DENSITY ON RUNOFF SIMULATION MODELING by Ben Urbonas, P.E., D.WRE 1, Michael Paul Jansekok 2, James C.Y. Guo, PhD, P.E. 3 ABSTRACT Rainfall and runoff data for a 3.08 square mile urban
DEKALB COUNTY STORMWATER MANAGEMENT PLAN PHASE 2
 DEKALB COUNTY STORMWATER MANAGEMENT PLAN PHASE 2 Introduction DeKalb County, Illinois, located approximately 50 miles west of Lake Michigan, is rectangular in shape, with a north/south dimension of 36
Section 6: Stormwater Improvements
 Section 6: Stormwater Improvements A major objective of this study was to identify opportunities for improvements to address the widespread water quality impairments caused by stormwater runoff in the
CEDAR RUN WATERSHED ACT 167 STORMWATER MANAGEMENT PLAN FINAL REPORT
 CEDAR RUN WATERSHED ACT 167 STORMWATER MANAGEMENT PLAN FINAL REPORT I. PURPOSE OF THE REPORT The purpose of this report is to summarize the findings and recommendations of the Cedar Run Watershed Act 167
Section 600 Runoff Table of Contents
 Section 600 Runoff Table of Contents 601 INTRODUCTION...600-1 602 RATIONAL METHOD...600-1 602.1 Rational Method Formula...600-2 602.2 Time of Concentration...600-2 602.3 Intensity...600-4 602.4 Runoff
Little Thompson River Hydrologic Analysis
 Final Report Little Thompson River Hydrologic Analysis Prepared for Colorado Department of Transportation August 2014 9191 S. Jamaica Street Englewood, CO 80112 Contents Section Page Acronyms and Abbreviations...
Case Studies in Hazard Class Reductions Implementation of NY s Guidance for Dam Hazard Classification
 Case Studies in Hazard Class Reductions Implementation of NY s Guidance for Dam Hazard Classification Gregory J Daviero, PhD, PE, Principal Kevin Ruswick, PE, CFM, Associate May 2, 2014 Schnabel Engineering
DRAFT. Jacob Torres, P.E.; Nick Fang, Ph.D., P.E.
 \ Memorandum SSPEED Center at Rice University Department of Civil & Environmental Engineering 6100 Main MS-317 Houston, Texas 77005-1827 sspeed.rice.edu tel: 713-348-4977 To Andy Yung, P.E. CFM; Lane Lease,
Who s in Charge!? 8/9/2018. Houston Geological Society Presents. Peak Floods Brays Bayou
 Houston Geological Society Presents An Informational Workshop Flooding and Floodplains in the Houston Area: Past, Present, and Future: Part 1 Presented May 18, 2018 Dr. William R. Dupre Professor Emeritus
APPENDIX F RATIONAL METHOD
 7-F-1 APPENDIX F RATIONAL METHOD 1.0 Introduction One of the most commonly used procedures for calculating peak flows from small drainages less than 200 acres is the Rational Method. This method is most
Distribution Restriction Statement Approved for public release; distribution is unlimited.
 CECW-EH-Y Regulation No. 1110-2-1464 Department of the Army U.S. Army Corps of Engineers Washington, DC 20314-1000 Engineering and Design HYDROLOGIC ANALYSIS OF WATERSHED RUNOFF Distribution Restriction
MARQUETTE COUNTY, MICHIGAN
 Marquette County MARQUETTE COUNTY, MICHIGAN (ALL JURISDICTIONS) COMMUNITY NAME COMMUNITY NUMBER COMMUNITY NAME COMMUNITY NUMBER *CHAMPION, TOWNSHIP OF 261285 * NEGAUNEE, CITY OF 261291 CHOCOLAY,CHARTER
THE EFFECTS OF URBANIZATION ON THE MINGO CREEK WATERSHED
 THE EFFECTS OF URBANIZATION ON THE MINGO CREEK WATERSHED by Tim Marshall (presented at the Sixth Conference on Hydrometeorology in Indianapolis, IN, 1984) 1. INTRODUCTION Urbanization of flood plains presents
CARROLL COUNTY, GEORGIA
 CARROLL COUNTY, GEORGIA AND INCORPORATED AREAS Community Name Community Number BOWDON, CITY OF 130244 CARROLL COUNTY 130464 (UNINCORPORATED AREAS) CARROLLTON, CITY OF 130208 MOUNT ZION, CITY OF 130286
Drainage Criteria Manual Review
 City of Colorado Springs Stormwater Management Assessment and Standards Development Drainage Criteria Manual Review March 8, 2013 Springsgov.com/City Agencies/Stormwater/Stormwater Engineering/ Stormwater
INFLOW DESIGN FLOOD CONTROL SYSTEM PLAN PLANT BARRY ASH POND ALABAMA POWER COMPANY
 INFLOW DESIGN FLOOD CONTROL SYSTEM PLAN PLANT BARRY ASH POND ALABAMA POWER COMPANY Section 257.82 of EPA s regulations requires the owner or operator of an existing or new CCR surface impoundment or any
APPENDIX E APPENDIX E ESTIMATING RUNOFF FOR SMALL WATERSHEDS
 APPENDIX E ESTIMATING RUNOFF FOR SMALL WATERSHEDS March 18, 2003 This page left blank intentionally. March 18, 2003 TABLES Table E.1 Table E.2 Return Frequencies for Roadway Drainage Design Rational Method
Chapter 11 Culverts and Bridges
 Chapter 11 Culverts and Bridges Contents 1.0 Introduction... 1 2.0 General Design... 1 2.1 Design Criteria... 1 2.2 Design Flows... 1 2.3 Permitting and Regulations... 1 2.4 Aesthetics and Safety... 2
Stream Reaches and Hydrologic Units
 Chapter United States 6 Department of Agriculture Natural Resources Conservation Service Chapter 6 Stream Reaches and Hydrologic Units Rain clouds Cloud formation Precipitation Surface runoff Evaporation
APPENDIX E ESTIMATING RUNOFF FROM SMALL WATERSHEDS
 ESTIMATING RUNOFF FROM SMALL WATERSHEDS June 2011 THIS PAGE LEFT BLANK INTENTIONALLY. June 2011 TABLES Table E.1 Table E.2 Return Frequencies for Roadway Drainage Design Rational Method Values June 2011
DR DRAINAGEWAY THORNTON VALLEY SUBDIVISION OVERALL DEVELOPMENT PLAN & CONCEPTUAL SITE PLAN SWC OF COLO BLVD & THORNTON PKWY THORNTON, CO
 /CONCEPTUAL SITE PLAN TRACT A, THORNTON VALLEY FILING NO. 1 LOCATED IN THE NE 1/4 OF SEC. 24, T. 2 S., R. 68 W., OF THE 6TH P.M., CITY OF UNTY OF ADAMS, STATE OF COLORADO Planning. Architecture. Engineering.
2. DEFINITIONS. American Association of State Highway and Transportation Officials.
 2. DEFINITIONS 2.010 Definitions [See Amendment 2] In addition to words and terms that may be defined elsewhere in this manual, the following words and terms shall have the meanings defined below: AASHTO: