Derivation of Unit Hydrograph (UH) Module Objectives. Unit Hydrograph. Assumptions in Unit Hydrograph theory. Derivation of Unit Hydrograph
|
|
|
- Berniece Greene
- 6 years ago
- Views:
Transcription
1 PRINT VERSION MODULE Derivation of Unit Hydrograph (UH) Module Objectives References Unit Hydrograph Assumptions in Unit Hydrograph theory Derivation of Unit Hydrograph Unit Hydrograph from a Hydrograph with isolated peak Unit Hydrograph from Complex Flood Hydrograph Collins' Method De convolution of Direct Runoff Hydrograph Unit Hydrograph by Clark Model Determination of time of concentration, Tc Determination of Basin storage coefficient (K) Time Area Concept Instantaneous Unit Hydrograph Unit Hydrograph for Ungauged Catchments Changing Unit Hydrograph Durations Averaging of Unit Hydrograph Contributors Top of page MODULE OBJECTIVES To understand the type of hydro meteorological records needed for UH derivation To familiarize with steps involved in extraction of Direct Runoff Hydrograph (DRH) from flood hydrograph and rainfall excess from rainfall hyetograph To determine UH by different approaches To learn how to convert a UH of given duration to another duration Top of page
 hydrograph resulting from one unit of effective rainfall, which is uniformly distributed over the basin at a uniform rate during a")
2 UNIT HYDROGRAPH The Unit Hydrograph (UH) is the simplest but at the same time a very powerful tool for hydrological analysis in general and flood forecasting in particular. The unit hydrograph may be defined as the direct runoff (outflow) hydrograph resulting from one unit of effective rainfall, which is uniformly distributed over the basin at a uniform rate during a specified period of time known as unit time or unit duration. The following paragraphs make this statement still clearer. Effective rainfall should be uniformly distributed over the basin, i.e. if there are five rain gauges in the basin, which represent the areal distribution of rainfall over the basin, all the five rain gauges should record for almost same amount of rainfall during specified time. A watershed shown on the right here fully marks this stipulation, while converse is true in respect of left one. In addition, effective rainfall should be at a uniform rate during the unit duration. If the average rainfall over a particular basin during 6 hour is 126mm, a unit hydrograph of 6 hours duration can be derived only if the intensity of rainfall is more or less 21 mm/hour over 6 hours. If the same amount of rainfall is distributed with varied intensity, the unit hydrograph cannot be precisely estimated by simple method. The unit quantity of effective rainfall is normally taken as 1mm or 1cm; and the outflow hydrograph is expressed by discharge in cumec. The unit duration may be of 1 hour duration or more, depending upon the size of the catchment, storm characteristics and operational facilities. However, the unit duration cannot be more than the time of concentration or basin lag or period of rise. The concept of time of concentration has been covered in detail later in the chapter.
3 Top of page ASSUMPTIONS IN UNIT HYDROGRAPH THEORY The following are the basic assumption in the unit hydrograph theory: The unit hydrograph theory assumes the principle of time invariance. This implies that the direct runoff hydrograph from a given drainage basin due to a given pattern of effective rainfall will be always same irrespective of the time, i.e. even if the basin characteristics change with season etc., the unit hydrograph remains the same. Unit Hydrograph theory assumes the principle of linearity, superimposition or proportionality. It means that: If the ordinates of a unit hydrograph of say 1 hour duration are 0,1,6,4,3,2,1,0 units respectively, the effective rainfall of 2 units falling in 1 hour will produce a direct runoff hydrographs having ordinates of 0,2,12,8,6,4,2,0 units. Secondly, if the effective rainfall of two units occurs in 2 hours, i.e. 1 unit per hour, the direct runoff hydrograph ordinates will be obtained by summing up the corresponding ordinates of the two unit hydrographs as shown here. DERIVATION OF UNIT HYDROGRAPH (UH) Top of page Selection of a particular UH derivation techniques primarily governed by three factors: The UH is best derived from the observed hydrograph resulting from a storm which fulfils
4 the two basic conditions i.e., the rainfall is more or less uniformly distributed over the basin and has a reasonably uniform intensity. Such a hydrograph will generally form an isolated peak. In case, such a hydrograph is not available, the UH has to be derived from the analysis of an observed multi peaked flood hydrograph resulting from several spells of rainfall of varying intensities. When the observed discharge and rainfall data at short interval are not available, the synthetic UH is derived with the help of basin characteristics.. In this module, UH derivation under all three conditions has been illustrated step wise. At the end of this module, it is expected that reader would be able handle UH assignment independently. Top of page CASE I UNIT HYDROGRAPH FROM A HYDROGRAPH WITH ISOLATED PEAK The steps involved in derivation of UH from the analysis of the flood hydrograph with a single peak are as follows; Inspect discharge records at watershed outlet and corresponding rainfall events to identify events exhibiting isolated, well defined and single peak with considerable run off volume. Pick up as many sets of such records as available. A plot displaying rainfall and corresponding rise in flood hydrograph, such as here, can help selection of records.
5 Note A no break/continuous discharge series, as shown in the plot, is developed by transforming hourly river stage (also water level) into discharge with the help of rating equation. Rating equation used for this purpose must be developed for the period to which flood event belongs to. A rating equation/curve is an equation that relates discharge with water level observed at a site, and is mathematically expressed as Q = c * (G G o ) n Where, c, G o ; & n are constants; and G is water level. While gathering information as listed above, it is recommended that Storms with rainfall should have been active for duration of around 20 to 30 % of basin lag. Various studies estimate basin lag as 50 75% of T c, time of concentration. Later part of this chapter describes ways to estimate T c, Storms should have generated rainfall excess between 1 cm and 4.5 cm. 2. A flood hydrograph is a basin (catchment) response driven by occurrence of rainfall event plus contribution of base flow. Had there been no rainfall over the basin, 'Bulge' (rise) in flood hydrograph would have not appeared. Secondly, all water that falls over a catchment does not reach the river/stream because of 'losses'; and only a fraction of it contributes to this 'Bulge'. This

6 bulge is termed as Direct Runoff Hydrograph (DRH). The part that reaches the stream is called as 'Rainfall excess'. Hydrologist seeks to develop a relationship between 'rainfall excess' and DRH. Apparently, the next step is separation of base flow from flood hydrograph to compute volume of DRH. Following are couple of methods outlined for separation of base flow. Fixed base method (A B D) This method suggests the extension of the base flow line along its general trend before the rise of the hydrograph up to a point B directly below the runoff hydrograph peak. From B, a straight line BD is drawn to meet the hydrograph at point D, which is N days away from B in the time scale. 'N' is determined by an empirical relation by Linsley as: N (in days) = 0.83 A 0.2 Where, A is the area of the drainage basin in square kilometers.
7 Variable Slope Method (A B C E) This method requires identification of two additional points on the recession limb of hydrograph one is inflection point; while the other is point E. At inflection point, curve changes its concavity. This point also indicates end of surface flow to river. This point beyond, discharge is a combination of interflow (also called as sub surface flow) and base flow. After a while, interflow also ceases; and only base flow remains in the river. The 'E' suggests this stage. Once, these two points are located on the graph, a line from 'E' is drawn backward to meet a vertical line from inflection point. A line A B C E divides the DRH and base flow. Nevertheless, for flood studies, the base flow component is rather insignificant and hence does not influence the magnitude of peak runoff substantially. Therefore, inaccuracies involved in separation of base flow are not crucial in overall flood studies. 3. Computation of direct runoff hydrograph ordinates by deducting base flow ordinates from that of the corresponding observed flood hydrograph. 4. Scanning and analysis of the rainfall data of all rain gauge stations in and around the basin with a view to; Obtaining areal rainfall over the catchment by appropriate methods, such as Thiessen Polygon or Isohyetal technique, and Estimating phi index. Volume of DRH equals the product of catchment area and rainfall excess over the basin. This simple analogy helps us estimate depth of rainfall excess. Rainfall Excess = Volume of DRH / Catchment Area A gap between effective rainfall and averaged rainfall points to losses. Here, in the plot,? index (also known as loss rate) is drawn in a manner that partitions hyetograph into two parts lower indicates losses, while upper rainfall excess.
8 5. As DRH is a consequence of given rainfall excess, say 'x' unit. Estimation of the ordinates of the UH is obtained by dividing the ordinates of direct runoff hydrograph by 'x' rainfall excess. How to fix duration of UH? A plot shown here exhibits duration of rainfall as 5 unit, of which only during 3 unit duration rainfall exceeds 'loss rate'. Thus, for this case, UH duration is a 3 unit. 6. This process is repeated for all records picked up for this purpose. 7. It is highly probable that UHs derived for more than one record may differ in duration of excess rainfall. They need to be converted to an identical duration before attempting step 8. A discussion on conversion of UH duration has been added toward the end of this module. 8. All such UHs are eventually averaged. For this, first peaks, Qp, of all UH are averaged to give Qp, followed by time to peak, tp and time base, Tb of UHs. All other ordinates are adjusted in such a way that total run off volume of UH equals the product of 1cm/mm and catchment area. More discussions on conversion of UH duration and averaging of UH have been added toward the end of this chapter. UNIT HYDROGRAPH FROM COMPLEX FLOOD HYDROGRAPH Top of page Flood hydrographs with a single and sharp peak resulting from an intense and uniform rainfall are very uncommon. Often times, observed hydrographs contain multiple peaks of various magnitudes resulting from several spells of rainfall. UH, in such cases, are derived by Collins' Method Matrix method Instantaneous Unit Hydrograph

9 Top of page UNIT HYDROGRAPH DETERMINATION BY COLLIN'S METHOD This method uses trial and error approximations to compute UH from complex hydrograph. The basic steps involved in this method can be best gathered by an illustrative example. This example is available in excel file of this week schedule, which can be downloaded by participants. Example The direct runoff hydrograph at site S and the effective hydrograph due to a particular storm over the catchment of river R are tabulated below. We will use the given DRH and ERH to derive unit hydrograph because of 1mm effective rainfall. Catchment area is 8570 km 2.

10 Note The effective rainfall hyetograph blocks are for 3 hour intervals. Therefore, the unit duration of the unit hydrograph thus derived will be of 3 hour unit duration. The following steps guide the reader to obtain UH by this method. i) From the observed flood hydrograph and observed rainfall hyetograph DRH and ERH are separated as explained earlier; ii) The ordinates of the DRH at different time are written under Column 2 of the Table 3; iii) Trial & error of determining UH ordinates begins with selection of first set of trial values representing ordinates of UH. This we can do by dividing the ordinates of DRH with 11mm effective rainfall, and recording them under column 3 of the Table 3; iv) The ordinates of the assumed unit hydrograph are summed up as cumec. But the sum of ordinates of the unit hydrograph at 3 hour interval, U for a catchment area of 8570 km 2 should be: Hence, Catchment Area * rainfall depth (1mm) = volume of UH = Sum of UH ordinates, U * time interval between UH ordinates
11 where A = area of catchment in km 2, =8570 km 2, & t = time interval in hour = 3 hours v) In order to satisfy condition stated above, all the assumed ordinates are multiplied by a factor 1.01 (793/785.4) and the adjusted values are entered in col.4 of the table; vi) The ordinates on adjusted UH (col.4) are multiplied by 2.4, first burst of rainfall, and are written under col.5. Similarly, the ordinates of adjusted unit hydrograph (col.4) are multiplied by 3.0 mm, third burst of rainfall, and are reflected in col.7 after shifting it by 6 hours. Why this shift is warranted here? It is so because 3.0 mm rainfall begins after 6hrs from the start of the storm.; vii) The ordinates in col.5 and 7 are now added together and written under column 8. This gives the DRH resulting from rainfall excess (2.4mm + 3.0mm) excepting the largest one, i.e. 5.6mm; viii) The DRH ordinates obtained in col.8 are deducted from the ordinates of DRH in col.2, and are noted down in col.6. This is a DRH as a result of 5.6mm of rainfall. First ordinate due to 5.6 mm rainfall is made zero as this represents the beginning of contribution of 5.6mm rainfall; ix) The values in col.6 are divided by 5.6mm to give the unit hydrograph, and are fed in col.9. Since, this is a UH, it is necessary to re validate its volume against condition stipulated under Para (iv) above. The sum of ordinates of this UH as written in col. 9 is now 777. These ordinates are, therefore, multiplied by 1.02 (793/777) to readjust its values as reflected in col.10. x) The weighted average of the two unit hydrographs (the assumed one as in column 4 and calculated one as in col.10) is reached in the following manner: xi) The weighted average ordinates are written under column 11 of the Table 3. The ordinates of the unit hydrograph in column 11 and column 4 are now compared for differences. If significant differences are noticed between the two, 2nd iteration begins with unit hydrograph ordinates of column 11; and this will occupy column 4. Thus, the process is iterative and will go on till the differences in the assumed and calculated unit hydrographs reduce to insignificant level.


12 The ordinates of the derived unit hydrograph are tabulated below. At times, it is possible that the lower part of the unit hydrograph may not be uniform. In such cases, it is smoothened and redrawn smoothly with least variations in a manner that its volume should fulfil condition of Para (iv).
13 Top of page UNIT HYDROGRAPH DERIVATION BY DE CONVOLUTION OF DIRECT RUNOFF HYDROGRAPH The discrete convolution equation allows the computation of direct runoff, Qn given excess rainfall, P m and the unit hydrograph, U n m+1. The reverse process, called de convolution, can be utilised to derive a unit hydrograph given data on P m and Q n. Suppose that there are 'M' pulses or burst of rainfall excess and 'n' pulse of direct runoff in the storm considered; then N equation can be written for Q n, n = 1,2,.,n, in terms of (n m + 1) unknown values of the unit hydrograph. If Q n and P m are given and U n m+1 is required, the set equations is over determined, because there are more equations (N) than unknowns (n m + 1). The term n M in the equation restrains the total nos. of P*U terms for Qn. In first case, when n is M, m = 1, 2, n; while in case n is M, m = 1,2,.M. (For more details, reader may refer to Applied Hydrology by Ven Te Chow) Let us derive term for Q 1, assuming total number of rainfall pulse, M = 3 Here, n =1 (M =3), hence, m =1, therefore,


14 Example An observed hydrograph with rainfall excess is given as under. The time interval is 3 hours between readings. Catchment area is 7092 km 2. Table 1: Ordinates of DRH and Effective Rainfall Hyetograph (ERH)

15 Let us first define number of equations. There are 3 pulses of rainfall so M = 3. There are 13 pulses of observed direct runoff so n = 13. The number of unit hydrograph ordinates is therefore, n m +1 = = 11 ordinates. Applying this piece of information, set up of matrices for Q, P and U appear as below Where, [Q] is 13 by 1 matrix with discharge ordinates; [P] is a 13 by 11 matrix having three rainfall impulse of given duration; and [U] is unknown matrix of 11 by 1 size whose ordinates are to be determined. In matrix form, information of tabular chart reduces to [Q] 13*1 = [P] 13*11. [U] 11*1 To solve this problem for [U] matrix, we choose only 11 equations to obtain 11 unknown UH ordinates using following equation. [U] = [P] 1 [Q] Result obtained using MS excel shown next has generated a few negative terms in the falling limb of UH; and this has to be adjusted by the reader in such a way as to total volume of UH must be equal to the volume of runoff emerging form the catchment as a result of 1mm uniform &


16 effective rainfall over it. This example, thus, underlines the likelihood of a few negative and abnormal terms in the calculation and need subsequent readjustment. Adjusted unit hydrograph is shown below. At this stage, reader is advised to refer to the excel sheet for familiarizing themselves with calculation part of this example. UNIT HYDROGRAPH BY CLARK MODEL Top of page The Clark model uses two parameters, time of concentration, 'Tc', and storage constant, 'K', and a time area histogram concept. Before, we set out for UH by Clark model, let us first familiarize ourselves with these new terminologies. DETERMINATION OF TIME CONCENTRATION, Tc Top of page The first parameter, time of concentration is the time taken by a water particle from the hydraulically farthest point to the basin outlet. An estimate of this travel time is the time from the end of runoff producing rainfall over the basin to the inflection point on the recession limb of the direct Runoff Hydrograph (DRH). Because of complexities involved in rainfall runoff process, all such incidences never produce reproducible 'Tc' nor can we ever know true Tc. And therefore, an averaged value of 'Tc' from observed data should be considered for analysis. Alternatively, any empirical equation, most valid for area under study is recommended for use. Some of the
.")
17 empirical equations normally used for estimation of this parameter are as under: (For more discussion on 'Tc', reader may please refer to Hydrologic Analysis and Design by Richard H. McCuen and Technical Reference Manual of HEC HMS software). Top of page DETERMINATION OF BASIN STORAGE COEFFICIENT (K) This coefficient represents the temporary storage of precipitation excess in the watershed as it drains to the outlet point. K is expressed in terms of time. If observed short interval flood discharges at site are available, then hydraulically, K is estimated by using the formula: Where; Q 1 : correspond to the discharge, after separating base flow, at the point of inflection on the recession limb of flood hydrograph. Q 2 : correspond to the discharge, after separating base flow, after time t on the recession limb of flood hydrograph. t: time interval between Q 1 and Q 2. Adopting a suitable base flow, the value of K can be computed for different hydrographs and an average value can be worked out. TIME AREA CONCEPT Top of page The time area diagram represents the areas that will contribute to the flow at the outlet over successive periods of time. Once the time of concentration is known, lines of equal time interval

18 called isochrones can be drawn with assumption that time of travel is directly proportional to distance from the outlet to isochrones. In the picture shown here, dashed lines in yellow mark isochrones. The US Army Corps of Engineers recommends following formula to develop time area table/diagram for estimation of inflow from areas bounded between successive isochrones. An example at the end of this discussion explains the use of this equation. The time area diagram is considered as the inflow to a hypothetical reservoir (S = KO; this implies that there is absence of wedge storage) and routed through the reservoir to obtain the outflow hydrograph which is the required instantaneous UH for the basin. Before routing, inflow from incremental areas between isochrones is converted into discharge units by following equation; Where 'ai' is the area in km2 and 't' is the routing period in hours. Here, we will take a pause to understand as to how this model produces an outflow with timearea concept; and inflow is generated by each time area zone due to instantaneous 1mm effective rainfall. Let us consider the uppermost part of the catchment. Being uppermost part of the watershed, it does not receive any outflow (O 0 =0). Instead, it produces I1 runoff which takes 1 hr (if tc for the catchment is 6hrs; and isochrones are separated by 1hr each) to reach at the tip of area just below it with a magnitude of O i routed by following equation. O i = CI i + (1 C)O i 1 Where C = (t/(k+0.5t)), here, t is routing interval in hr, k is basin storage coefficient; and I i and O i are the inflow and outflow at the end of period t i. In other words, for uppermost area, outflow is obtained by O 1 = CI 1 + (1 C)* 0 Now, let us consider the area downstream of first one. Like above, this part generates inflow, I 2 and receives O 1 as outflow from upper area. Using routing equation, this area will produce O 2 as O 2 = CI 2 + (1 C)* O 1 This process is continued till we reach terminal point of the catchment/study area.
 To obtain unit hydrograph for durations other than routing interval (provided that it is exact multiple of routing interval t. The following equation is used.")
19 The IUH can be converted to a unit hydrograph of same unit duration as routing interval simply averaging two instantaneous hydrographs lagged by the selected duration that is, Q i = 0.5(O i + O i 1 ) To obtain unit hydrograph for durations other than routing interval (provided that it is exact multiple of routing interval t. The following equation is used. Where Q i is ordinate of unit hydrograph of desired duration D = nt. The computation of a 1 hr unit hydrograph by this method is described ahead with an example. Example Derive UH for a project site using Clark model with physiographic characteristics of the basin given in Table 1. No observed flood hydrograph is available at the project site.


20 Solution Determination of The time of concentration (T c ) Since, no observed flood hydrograph is available at project dam site, Tc, time of concentration is determined using the Kirpich, the Kerby and the California formulae as shown in Table 2. The average value as 6.0 hour based on 3 formulae is adopted for project catchment up to project site. Since the time of concentration adopted is 6 hr, the catchment area has been divided into six isochrones representing 1 hr equal travel time. The equation developed by U.S. Army Corps of Engineers is used to estimate the time area relationship of the watersheds. Table 3 presents the resulting Time Area relationship for river upto dam site. Note For HEC HMS software savvy readers, calculation reflected in table 3 is not essential. HEC HMS software needs two key parameters, i.e. Tc and K to be input appropriately in its environment, and rest of calculation and UH output are handled by software in no time. From the Table 3, the value of catchment area can be used developing inflow for each computational time interval using excel sheet.

21 Determination of Basin storage coefficient (K) Since the site specific observed short interval discharge data is not available for dam site, therefore basin storage coefficient is estimated based on regional values of K available for concerned river. For estimating the value of storage coefficient 'K', observed complex flood hydrographs from 3rd to 7th September 2001, 22nd to 25th Jul 2002, September 2004 flood hydrographs at one G&D site on the same river have been used. The detail is given below: Therefore from Table 4, the Storage coefficient K can be taken as 9.0. Assuming a base flow of 450 m³/s, the value of K has been computed for different hydrographs at another site on the same river as shown in Table 5. The average value of 8.0 hr has been adopted for observed hydrographs at this G&D site, an average value of attenuation constant K equal to 8.0 hr has been worked out based on 4 flood events.


22 The K is estimated based on the fact that for a given regional value of this parameter at a particular site, the dimensionless parameter (also called as attenuation ratio) approximately remains constant. The value of this parameter for second and first G&D sites is given in the Table 6: Above value of dimensionless parameter, which is almost equal, suggests in favour of conclusion given by U.S. Army Corps of Engineers that the value of this dimensionless parameter remains more or less constant over a region. Based on this fact, the value of K estimated for given project site is 5.4 hr (for Tc = 6.0hr). Having determined catchment area, time of concentration, Tc and storage coefficient, K, a model depicting basin is developed in HEC HMS and basin is subjected to 10mm=1cm effective rainfall for 1 hr duration. Resulting hydrograph, i.e. 1 hr duration UH and its ordinates are available below:
 of rainfall falling over the catchment in zero")
23 Top of page INSTANTANEOUS UNIT HYDROGRAPH The instantaneous Unit Hydrograph is defined as unit hydrograph or infinitesimally small duration. In other words, IUH is the direct runoff hydrograph at the outlet of the catchment resulting from 1 unit (1mm) of rainfall falling over the catchment in zero time. Of course, this
24 is only a fictitious situation and a concept to be used in hydrograph analysis. Derivation of IUH There are various methods for the determination of an IUH from the given effective rainfall hyetograph and direct runoff hydrograph. But the most common is the model suggested by Nash in Nash proposed a conceptual model by considering a drainage basin as 'n' identical linear reservoirs in series. By routing a unit inflow through the reservoirs a mathematical equation for IUH can be derived. The ordinate of the IUH at time t is given by, Where, n = no. Of the reservoir; and K= a reservoir constant, also called as storage coefficient. The values of K and n in Nash model can be evaluated by the method of moments by using the following relations: Where, M DRH1 = First moment arm of Direct Runoff Hydrograph (DRH) M ERH1 = First moment arm of Effective Rainfall Hyetograph (ERH) M DRH2 = Second moment arm of DRH M ERH2 = Second moment arm of ERH The unit of the ordinates of IUH is per sec (sec 1). When the ordinates are multiplied by the total volume of runoff (in cubic meters) resulting from 1mm of rainfall over the catchment area, the unit will be cumecs. Derivation of Unit Hydrograph from IUH For finding the unit hydrograph from IUH, the area under the IUH is plotted with respect to time at the point. The entire area from the start of IUH at different time interval gives points of S Curve. If a unit hydrograph of T hour duration is required, the S Curve so arrived at is shifted by T hour and the difference in the ordinates of the two S Curves is computed and divided by T. The resulting curve forms the unit hydrograph of T hour duration. To illustrate derivation of UH by Nash method, an example is presented ahead. Example

25 A storm of mild intensity was experienced in the catchment of river Baitarani during the period from to The rainfall was rather non uniform. The average hourly rainfall over the catchment and the resulting observed discharge at Anandpur site are furnished in Table 1 & 2. The area of catchment of River Baitarani up to Anandpur is 8570 sqkm. With this set of data pertaining to this storm, an IUH followed by the unit hydrograph of one hour unit duration have been computed below: The various steps involved in the procedure are as follows: 1. Separation of base flow to find DRH The anticipated recession curve of the smaller peak just before this flood was continued till the time of the peak, i.e. point B. A suitable point was chosen on the falling limb at a distance of about 2t to 2.5t where 't' is the time from the rise of flood hydrograph to the peak. These points B & C were joined by a straight line. The curve thus separates the base flow from total flood. The base flow thus separated is deducted from the corresponding ordinates of the flood hydrograph to get the direct runoff hydrograph (DRH).
26 2. Separation of Rainfall Excess from Total Rainfall The total hourly rainfall (average over the basin) is shown in the table above. Since the storm under consideration is in the month of September and there was a heavy storm in August and yet another storm of smaller intensity in early September, the loss may be considered to take place at a uniform rate. Let the loss be at the uniform rate of 'X' mm/hour. Additionally, the total volume of of DRH is worked out to be Volume of DRH = 4344 cumecs* 3hrs Where, 4344 is total sum of DRH ordinates and 3hrs is time interval between two adjacent DRH ordinates. Total direct runoff = 13032x3.6 = 5.475mm, 8570 Where, 8570 is the area of catchment of River Baitarani up to Anandpur in sqkm. Now let the loss rate, X be more than 2 mm/hour.

27 Substituting the value of X, the effective rainfall at different time is obtained. For the purpose of analysis, the hourly ordinate will involve a lot of computational work, and therefore, only the three hourly rainfall ordinates have been considered. The hourly rainfalls are assumed to be uniform during three hours and accordingly, the ordinates of DRH and ERH are shown in Table A.1 below

28 3. Calculation of n and K
29
")
30 Hence, for analysis the values of K and n may be taken as 4 hr and 4 respectively (In case of very sandy soil characteristics of the catchment 'n' may be taken as 5 if its value works out to be 4.47, whereas for hilly or semi hilly regions of catchment, n should be 4). 4. To estimate the ordinates of IUH Once n and K are found out, the ordinates of the IUH can be found very easily by using the relation This will give ordinates in units of Sec 1. To find the ordinates in cumec, it is multiplied by catchment area contribution due to 1mm effective rainfall. Thus for first time unit U(1), Area = 8570 * 10 6 m 2, K = 4 * 60 * 60 sec, (n 1)! = (4 1)! = 6, t = 1 hr. Pl note that in term (t/k), K would be 4hr as we are considering t in hr. This step is repeated for rest of time units to generate IUH. The ordinates of IUH are given in Table below:

31 It will be seen that the last ordinate is never zero. This is because of the fact that the recession of IUH is generally defined by an exponential function which has zero value only at infinity. Hence, the recession is terminated at a suitable point and volume adjusted 5. Derivation of 1 Hr. duration Unit Hydrograph from IUH The t th hour ordinates of the 1 hour duration unit hydrograph can be very easily found by simply taking the average of t th hour and (t 1) th hour ordinates of the IUH. Column 2 of the Table above gives the ordinates of the IUH (rounded off figures) the column 5 gives the ordinates of the 1 hour duration unit hydrograph.
32 Top of page UNIT HYDROGRAPH FOR UNGUAGED CATCHMENTS More often than not, project sites suffer from inadequate length of hydro meteorological data or even no data to deduce any reliable hydrological inputs or to develop reliable transfer function in the form of a UH. In several cases, constraint of this kind is not uncommon in India, which compels an engineer to resort to develop a synthetic unit hydrograph. A Synthetic Unit Hydrograph (SUH) takes its shape and size according to the physical characteristics of the basin under study. There are few methods of developing SUH. Some of the common methods for derivation of synthetic unit hydrograph for a basin are as follows: Snyder method Among several known methods for development of synthetic unit hydrograph, the one suggested by F. F. Snyder (1938) is most commonly used. Snyder analyzed a large number of hydrographs from drainage basins in the Appalachian Mountain region in the United States, ranging in area from 25 sq. km. to 25,000 sq. km. To sketch a unit hydrograph, it is necessary to know the time of the peak, the peak flow and the time base. The elements must be determined for every particular or regional location of the drainage basin. Snyder proposed the following empirical formula for the lag time (Hr.) from mid point of effective rainfall duration t r to peak of a unit hydrograph: t p = C t (L. L c ) 0.3 in which t p = the basin lag in hours, from midpoint of effective rainfall duration t r to peak of a unit graph: L= the length of the main stream from the outlet to the divide in kms; L c =the distance from the outlet to a point on the stream nearest to the centroid of the basin; and C t = a coefficient The location of the center of area may be determined by cutting the basin outline from cardboard and marking the point of intersection of plumb lines drawn with the map suspended from different corners. The coefficient C t varies from 1.0 to 2.2 with lower values associated with basins of steeper slopes. For the standard duration of effective rainfall t r, Snyder proposed:
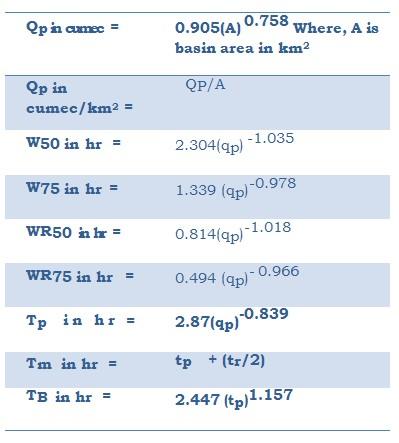
33 For the rains of this duration, he found that synthetic unit hydrograph peak Q p in cumecs may be obtained from the equation: And in cumecs/sq km by the relation Where, A = the drainage area in square kms. C p = coefficient ranging from 4.0 to 5.0 Q p = peak flood in cumec. For the time base T (in days) of the synthetic unit hydrograph U.S. Army Corps of Engineer adopted the following expression These equations are sufficient to construct a synthetic unit hydrograph for a storm of duration t r The value of Snyder's coefficients C t and C p are found to vary considerably depending upon the topography, geology and climate. Snyder indicated that the coefficient C t is affected by basin slopes S. Linsely, Kohler and Paulhus have suggested and expression for t p in which the basin slope S has been considered. Where, N=0.38 and C =1.2 for mountainous drainage areas; 0.72 for foothills; and 0.35 for valley areas. From gauged to ungauged basin by transposition of unit hydrograph If unit hydrographs are available for several areas adjacent to a basin for which a unit hydrograph is required but for which necessary data are lacking, then transposition of
34 available unit hydrograph will ordinarily give better results than resorting to a synthetic procedure. Sherman originally proposed that the ordinates and abscissas of unit hydrograph for similar basins might be assumed to be proportional to the square roots respective drainage areas. Further details are available in any textbook on applied hydrology. Based on set of equations recommended by Flood Estimation Reports (FER) FER for 26 hydro meteorologically homogenous subzones in India are reports jointly brought by Central Water Commission (CWC); India Meteorological Department (IMD); Research, Design & Standard Organization (RDSO); and Ministry of Shipping & Transport (MoST). In each report, a number of mathematical relationships between physiographic parameters and components of unit hydrograph, derived on multiple regression technique, exist. The stepby step procedures as to how to develop UH based on FER are illustrated in paragraphs to follow. Step 1 Physiographic parameters 1. Location of catchment area to be identified from Survey of India topo sheet and measure the catchment area (A) 2. Measure the length of the longest stream in Km. (L) 3. Length of the longest stream from a point opposite to C.G. of catchment to the point of study in Km. (L c ) 4. Compute Equivalent Slope in m/km. (S eq ) To determine equivalent slope, reader may look at following plot which displays longitudinal profile and formula used for the purpose. We will use this formula a little later to calculate Seq.
35 With advances in information technology in recent years and also with the availability of Digital Elevation Model (DEM), distillation of physiographic parameters is relatively faster and accurate. Illustrated example in later part of this chapter demonstrates the application of GIS technique to deduce these parameters. The DEM data are available for free at sites Step 2 To construct 1 hour SUH Availability of physical parameters of catchment enables one to estimate the components of SUH using following SUH equations for a Zone, say X;
36
37 Notations/components used in above table are used to construct an SUH using a plot shown here. If the volume of UH so defined deviates from the volume of runoff generated by catchment because of 1cm rainfall excess, falling limb of the hydrograph is suitably modified without altering the points of synthetic parameters such that the volume of UH equals the theoretical value. The SUH ordinates at one hour interval after corrections are taken as the final estimate of SUH. Succeeding example presents stepwise procedure to develop SUH of 1 hr duration. ILLUSTRATIVE EXAMPLE Top of page Important Note 1. This example is based on hypothetical equations and is used to demonstrate the steps required to design a synthetic UH. For real case studies, users are requested to refer to Flood Estimation Report relevant to the area under study. Such reports are available with CWC and concerned State Govt. departments.) 2. Readers ignorant of application of GIS software and Geo HMS add on package will find it difficult to follow initial steps of this example. The particulars of a catchment/project site are as follows: (i) Name of watershed : A (ii) Name of Tributary : X (iii) Location : Lat ' 00 " Long ' 48 " (vi) Topography : Moderate Slope Step 1: Physiographic Parameters The Survey of India released topo sheets marked with contours is primary requisites to extract basin physical parameters. Unquestionably, this process is tedious and fraught with possible errors. Alternatively, Windows based GIS presentation Fig.1 software, such as Arc View 3.X or similar packages can be used to extract these parameters through analysis of DEM. To showcase strength of GIS based analysis of basin, two SRTM grids 55_7 and 55_8 are first merged followed by extraction of a part from whole DEM, which is likely to cover outlet point and its contributing area. This relatively small sized patch of DEM was imported in Geo HMS window (an extension package that works on Arc View GIS 3.2a) for terrain and hydrological analysis. A series of options on Geo HMS supported menus lead users to successfully obtain a network of streams and corresponding catchment areas. This process is termed as terrain processing.

38 Having reached a stage as shown in Fig.2, it is possible in the system to locate project by defining outlet at pre determined latitude and longitude. In Fig.2, hypothetical project location is displayed by a point in red. A hydrologist is concerned about area shedding water at this outlet; and therefore, only this area is abstracted at this stage for hydrological analysis subsequently.

39 Fig.3 displays the output of hydrological processing containing delineated watershed for project location; the location of centre of gravity (CG) of the basin; longest flow path. These features of this basin can be exported to HEC HMS software for developing design flood hydrograph or any other hydrological analysis. A set of information extracted for estimating SUH equations are as below: Area km 2 Length of longest flow path, L 56.4 km Centroidal flow path, Lc 28.2 km


40 Fig.4 plots the longitudinal profile of the river/basin along longest flow path. This plot and table presented below are used to estimate equivalent slope.

41 Step 2 : 1 hr Synthetic UH parameters generated by 1cm effective rainfall SUH parameters as given below are computed by using equations given in step 2 are as following:

42 An SUH based on the estimated parameters in step 2 is shown below. The discharge ordinates of this graph at 1 hr interval are multiplied by 1 hr and are summed up to ascertain whether it agrees with principle of UH. Raw UH so arrived overestimates the runoff; and therefore its falling limb ordinates are readjusted in a manner to represent basin's true UH. CHANGING UNIT HYDROGRAPH DURATIONS Top of page The unit duration of the UH derived from various records may not be alike. In order to compare and average them, it is necessary to convert all of them to the same unit duration. There may be two types of cases; 1. When UH of shorter unit duration't' is known and a UG of longer duration T is to be derived where T is a multiple of t, i.e., T=nt such that n = 1, 2, 3,...n. This can be achieved simply by the principle of super imposition. Let us grasp it with an example. We have an 1 unit UH of 2 hr duration; and it needs to be converted to a 4 hr duration. Please refer to the table shown here. The 2 hour UH is displaced by two hours; and is added to first UH. The summed up UH is a result of 2 unit rainfall spread over (2hr+2hr) = 4hr duration. To obtain 1 unit 4hr duration of UH, Last column is divided by 2.

43 2. Otherwise, the UH of other duration can be derived by S curve. The S curve is a hydrograph produced by a continuous effective rainfall at a constant rate for an indefinite period. The S hydrograph can be constructed by summing up a series of identical UHs spaced at intervals equal to the unit duration of the UH. After the S hydrograph is constructed, the UH of a given duration is derived with following procedures. Assume that the S hydrograph derived is due to effective rainfall intensity of 1/t 0 mm/hour. Now, advance or offset the position of S hydrographs for a period equal to the desired duration of UH, say t n hours; and tabulate the difference between ordinates of original S hydrograph and offset S hydrograph. This will be the hydrograph due to (1/t 0 ) * t n = t n /t 0 mm of rainfall occurring in tn hours. Divide ordinates of the hydrograph thus obtained by t n /t 0. The resulting hydrograph will be the UH of tn hour duration. 3. HEC HMS software uses UH as transfer function to generate response of a basin following occurrences of rainfall. In HEC HMS, UH of known duration, say t hr is to be fed in the HEC HMS keeping its ordinates spaced at t hr apart. For example, if UH of 1mm rainfall derived is of 3hr duration, ordinates of UH must be entered at 3hr interval. Software automatically converts this UH to other duration according to rainfall interval chosen by user. Thus, conversion of a UH from one duration to another is omitted. AVERAGING UNIT HYDROGRAPH Top of page Three distinct unit hydrographs for Anandpur site on river Baitarani, as tabulated below, have been developed by employing different techniques of UH derivation as highlighted in preceding paragraphs. The figures in bold and italic mark the peak value of respective columns. A cursory look at ordinates recorded under three methods reveals that the peaks, time base, and time of occurrence of three unit hydrographs differs from one another. As a matter of fact, if various storms are considered for development of unit graph for the same catchment, a marked variation will be observed especially in the peak as well as the time of occurrence of the peak. Therefore, it had better derive an average unit hydrograph for practical use. If several unit hydrographs are averaged by averaging concurrent ordinates, it is highly probable that the resulting average unit graph has a broader, and a quite possibly a lower peak than any of the individual graphs.


44 The correct average unit hydrograph should be obtained by locating the average peak and the average time of occurrence of the peak and sketching a menu unit hydrograph having an area equal to 1mm of runoff and resembling the individual graph as much as possible. In the backdrop of discussion above, pattern of averaged UH is determined as below. To find the average unit hydrograph, the average peak was found to be 141 cumecs and average time of occurrence of peak was estimated to be 15 hours. Similarly the average base length is estimated to be 48 hours. Now that essential component of UH are estimated, a suitable unit hydrograph is drawn in a manner such that: The area of the unit hydrograph is equal to 1mm; and The shape resembles the shape of the three individual hydrographs.
45 The average unit hydrograph thus obtained is shown by dotted line. However, the averaging of the unit hydrograph can't be resorted to all cases. It has been observed that for practical purposes the shape of the unit hydrograph is hugely governed by factors, such as amount of effective rainfall, rainfall distribution pattern, and the storm movement etc This aspect of UH is briefly demonstrated here with the help of a few diagrams. For more on this subject, readers are encouraged to refer to any good book on hydrology. Adjacent figure illustrates how the storm movement influences the shape of unit hydrograph. Yet another picture exhibits how the concentration of localized rainfall activity over the basin can significantly alter limbs and peak of UH. The third picture demonstrates the distinction between impact of a concentrated and heavy effective rainfall and uniform rainfall of same amount over the catchment. In brief, it is not necessary that similar features will be reflected in all the storms. As a matter of fact, the formation and distribution of the runoff is quite complex process in which large numbers of factors are involved.
46 Hence for the operational use, the scheme of the unit hydrograph is to be laid down after taking into account the primary influencing factors. It is not enough, and certainly not, to use one un changeable unit hydrograph for formulation of flood forecast. Different unit hydrographs should be identified for the various conditions which have various influences on formation and time distribution of the runoff. These unit hydrographs may then be judiciously applied under different conditions.
47 REFERENCES Top of page 1. Patra, K C, (2001), Hydrology & Water Resources Engineering, Narosa Publishing House 2. Ven Te Chow, David R Maidment, Larry W Mays, (International Edition 1988), Applied Hydrology, McGraw Hill Book Company 3. Raghunath, H M, (2006), Hydrology Principles, Analysis, Design, New Age International (P) Limited 4. Richard H McCuen, (1989), Hydrologic Analysis and Design, Prentice Hall, New Jersey 5. A multitude of e learning materials available at CONTRIBUTORS Anup K Srivastava, Director, National Water Academy Top of page
IJSER. within the watershed during a specific period. It is constructed
 International Journal of Scientific & Engineering Research, Volume 5, Issue 7, July-014 ISSN 9-5518 306 within the watershed during a specific period. It is constructed I. INTRODUCTION In many instances,
Module 3. Lecture 6: Synthetic unit hydrograph
 Lecture 6: Synthetic unit hydrograph Synthetic Unit Hydrograph In India, only a small number of streams are gauged (i.e., stream flows due to single and multiple storms, are measured) There are many drainage
Rainfall - runoff: Unit Hydrograph. Manuel Gómez Valentín E.T.S. Ing. Caminos, Canales y Puertos de Barcelona
 Rainfall - runoff: Unit Hydrograph Manuel Gómez Valentín E.T.S. ng. Caminos, Canales y Puertos de Barcelona Options in many commercial codes,, HMS and others HMS Menu Transform method, User specified,
1 n. Flow direction Raster DEM. Spatial analyst slope DEM (%) slope DEM / 100 (actual slope) Flow accumulation
 slope DEM / 100 (actual slope) Flow accumulation") 1 v= R S n 2/3 1/2 DEM Flow direction Raster Spatial analyst slope DEM (%) Flow accumulation slope DEM / 100 (actual slope) 0 = no cell contributing 215 = 215 cell contributing towards that cell sqrt (actual
1 v= R S n 2/3 1/2 DEM Flow direction Raster Spatial analyst slope DEM (%) Flow accumulation slope DEM / 100 (actual slope) 0 = no cell contributing 215 = 215 cell contributing towards that cell sqrt (actual
Analysis of Flood Routing
 Dhaka Univ. J. Sci. 6(): 69-73, 014 (July) Analysis of Flood Routing Md. Motaleb Hossain Department of Mathematics, Dhaka University, Dhaka 1000, Bangladesh (Received: 6 May 01; Accepted: 4 May 014) Abstract
UNIT HYDROGRAPH AND EFFECTIVE RAINFALL S INFLUENCE OVER THE STORM RUNOFF HYDROGRAPH
 UNIT HYDROGRAPH AND EFFECTIVE RAINFALL S INFLUENCE OVER THE STORM RUNOFF HYDROGRAPH INTRODUCTION Water is a common chemical substance essential for the existence of life and exhibits many notable and unique
Flood mitigation study on a GIS platform for an ungauged catchment: a case study
 Water Resources Management VI 151 Flood mitigation study on a GIS platform for an ungauged catchment: a case study A. K. Gopinath 1 & T. Radhakrishnan 2 1 Water Resources Dept, Govt. of Kerala, India 2
Module 3. Lecture 4: Introduction to unit hydrograph
 Lecture 4: Introduction to unit hydrograph (UH) The unit hydrograph is the unit pulse response function of a linear hydrologic system. First proposed by Sherman (1932), the unit hydrograph (originally
What is runoff? Runoff. Runoff is often defined as the portion of rainfall, that runs over and under the soil surface toward the stream
 What is runoff? Runoff Runoff is often defined as the portion of rainfall, that runs over and under the soil surface toward the stream 1 COMPONENTS OF Runoff or STREAM FLOW 2 Cont. The types of runoff
International Journal of Scientific & Engineering Research, Volume 5, Issue 7, July-2014 ISSN Sruthy Nattuvetty Manoharan
 ISSN 2229-5518 210 Sruthy Nattuvetty Manoharan Department of Civil Engineering Government Engineering College, Thrissur Thrissur, 680009 sruthy.n.m@gmail.com a spatially distributed excess rainfall. It
Hydrology and Water Resources Engineering
 Hydrology and Water Resources Engineering SUB GSttingen 214 868 613 K.C. Patra 't'v Mai Narosa Publishing House New Delhi Chennai Mumbai Calcutta CONTENTS Preface vii 1. Introduction 1 1.1 General 1 1.2
2
 1 2 3 4 5 6 The program is designed for surface water hydrology simulation. It includes components for representing precipitation, evaporation, and snowmelt; the atmospheric conditions over a watershed.
Introduction, HYDROGRAPHS
 HYDROGRAPHS Sequence of lecture Introduction Types of Hydrograph Components of Hydrograph Effective Rainfall Basin Lag or Time Lag Parts of Hydrograph Hydrograph Analysis Factors Affecting Hydrograph Shape
Development of a GIS Tool for Rainfall-Runoff Estimation
 Development of a GIS Tool for Rainfall-Runoff Estimation Ashraf M. Elmoustafa * M. E. Shalaby Ahmed A. Hassan A.H. El-Nahry Irrigation and Hydraulics Department, Ain Shams University, Egypt NARSS, Egypt
Hydrology and Water Management. Dr. Mujahid Khan, UET Peshawar
 Hydrology and Water Management Dr. Mujahid Khan, UET Peshawar Course Outline Hydrologic Cycle and its Processes Water Balance Approach Estimation and Analysis of Precipitation Data Infiltration and Runoff
SEES 503 SUSTAINABLE WATER RESOURCES. Floods. Instructor. Assist. Prof. Dr. Bertuğ Akıntuğ
 SEES 503 SUSTAINABLE WATER RESOURCES Floods Instructor Assist. Prof. Dr. Bertuğ Akıntuğ Civil Engineering Program Middle East Technical University Northern Cyprus Campus SEES 503 Sustainable Water Resources
CIVE22 BASIC HYDROLOGY Jorge A. Ramírez Homework No 7
 Hydrologic Science and Engineering Civil and Environmental Engineering Department Fort Collins, CO 80523-1372 (970) 491-7621 CIVE22 BASIC HYDROLOGY Jorge A. Ramírez Homework No 7 1. Obtain a Unit Hydrograph
To estimate the magnitude of a flood peak the following alternative methods available: 1. Rational method 2. Empirical method
 Methods for estimating flood To estimate the magnitude of a flood peak the following alternative methods available: 1. Rational method 2. Empirical method 3. Unit-hydrograph technique 4. Flood-frequency
Remote Sensing and GIS Applications in Determination of Geomorphological Parameters and Design Flood for a Himalyan River Basin, India
 International Research Journal of Earth Sciences ISSN 2321 2527 Int. Res. Earth Sci. Remote Sensing and GIS Applications in Determination of Geomorphological Parameters and Design Flood for a Himalyan
Autumn semester of Prof. Kim, Joong Hoon
 1 Autumn semester of 2010 Prof. Kim, Joong Hoon Water Resources Hydrosystems System Engineering Laboratory Laboratory 2 A. HEC (Hydrologic Engineering Center) 1 Established in the U.S. Army Corps of Engineers(USACE)
5/25/2017. Overview. Flood Risk Study Components HYDROLOGIC MODEL (HEC-HMS) CALIBRATION FOR FLOOD RISK STUDIES. Hydraulics. Outcome or Impacts
 CALIBRATION FOR FLOOD RISK STUDIES. Hydraulics. Outcome or Impacts") HYDROLOGIC MODEL (HEC-HMS) CALIBRATION FOR FLOOD RISK STUDIES C. Landon Erickson, P.E.,CFM Water Resources Engineer USACE, Fort Worth District April 27 th, 2017 US Army Corps of Engineers Overview Flood
HYDROLOGIC MODEL (HEC-HMS) CALIBRATION FOR FLOOD RISK STUDIES C. Landon Erickson, P.E.,CFM Water Resources Engineer USACE, Fort Worth District April 27 th, 2017 US Army Corps of Engineers Overview Flood
UPDATE OF ARC TP108 RUN-OFF CALCULATION GUIDELINE
 UPDATE OF ARC TP108 RUN-OFF CALCULATION GUIDELINE Bodo Hellberg, Stormwater Action Team, Auckland Regional Council Matthew Davis, Stormwater Action Team, Auckland Regional Council ABSTRACT This paper focuses
Comparison of Rational Formula Alternatives for Streamflow Generation for Small Ungauged Catchments
 ENGINEER - Vol. XXXXIV, No. 04, pp, [29-36], 2011 The Institution of Engineers, Sri Lanka Comparison of Rational Formula Alternatives for Streamflow Generation for Small Ungauged s W.M.D.Wijesinghe and
CONTINUOUS RAINFALL-RUN OFF SIMULATION USING SMA ALGORITHM
 CONTINUOUS RAINFALL-RUN OFF SIMULATION USING SMA ALGORITHM INTRODUCTION Dr. R N Sankhua Director, NWA, CWC, Pune In this continuous rainfall-runoff simulation, we will perform a continuous or long-term
Prediction of Flood Area Based on the Occurrence of Rainfall Intensity
 Prediction of Flood Area Based on the Occurrence of Rainfall Intensity Agus Suharyanto Abstract Flood is one of natural hazard often occurs in many areas. During raining season flood is occur in many areas
DEVELOPMENT OF PEAK RUNOFF HYDROGRAPHS FOR OBA AND OTIN RIVERS IN OSUN STATE, NIGERIA
 DEVELOPMENT OF PEAK RUNOFF HYDROGRAPHS FOR OBA AND OTIN RIVERS IN OSUN STATE, NIGERIA 1 Adejumo, L. A., 1 Adeniran, K. A., 2 Salami, A.W., 3 Abioye Tunde., and 4 Adebayo, K. R 1 Department of Agricultural
Sixth Semester B. E. (R)/ First Semester B. E. (PTDP) Civil Engineering Examination
/ First Semester B. E. (PTDP) Civil Engineering Examination") CAB/2KTF/EET 1221/1413 Sixth Semester B. E. (R)/ First Semester B. E. (PTDP) Civil Engineering Examination Course Code : CV 312 / CV 507 Course Name : Engineering Hydrology Time : 3 Hours ] [ Max. Marks
CAB/2KTF/EET 1221/1413 Sixth Semester B. E. (R)/ First Semester B. E. (PTDP) Civil Engineering Examination Course Code : CV 312 / CV 507 Course Name : Engineering Hydrology Time : 3 Hours ] [ Max. Marks
Advanced Hydrology Prof. Dr. Ashu Jain Department of Civil Engineering Indian Institute of Technology, Kanpur. Lecture 1
 Advanced Hydrology Prof. Dr. Ashu Jain Department of Civil Engineering Indian Institute of Technology, Kanpur Lecture 1 Good morning and welcome to this video course on Advanced Hydrology. My name is Ashu
ADDIS ABABA INSTITUTE OF TECHNOLOGY MASTER S THESIS RUNOFF ESTIMATION BY GIUH BASED CLARK AND NASH MODELS FOR SHAYA RIVER MULUGETA MUSSIE
 ADDIS ABABA INSTITUTE OF TECHNOLOGY MASTER S THESIS RUNOFF ESTIMATION BY GIUH BASED CLARK AND NASH MODELS FOR SHAYA RIVER By MULUGETA MUSSIE Thesis Advisor PROFESSOR Dr. P. SREENIVASULU June, 2013 i ADDIS
Chapter 6. The Empirical version of the Rational Method
 Chapter 6 The Empirical version of the Rational Method The Empirical version is named because the parameters it uses (apart from rainfall data) are arbitrary and are generally based on experience or observation
NASH IUH PARAMETERS ESTIMATION USING METHOD OF MOMENTS- A CASE STUDY
 INTRODUCTION Empirical models for flood estimation are based on observational data and calibrated input-output relationship without description of individual processes. Inglis and DeSouza formula, hosla
2. Potential Extreme Peak Discharge in Texas
 2. Potential Extreme Peak Discharge in Texas This part of the work is focused on using GIS to apply the latest USGS peak discharge equations to create a 500m grid that stores the potential peak discharge
A NEW HYDROLOGIC RESPONSE FUNCTION PHYSICALLY DERIVED FROM DEM AND REMOTE SENSING IMAGE
 Proc. of the 2nd Asia Pacific Association of Hydrology and Water Resources (APHW) Conference, July 5-8, 2004, Suntec Singapore International Convention Exhibition Centre, Singapore, vol. 2, pp. 268-275,
ESTIMATING THE CLARK INSTANTANEOUS UNIT HYDROGRAPH PARAMETERS FOR SELECTED GAUGED CATCHMENTS IN THE WEST COAST OF PENINSULAR MALAYSIA
 ESTIMATING THE CLARK INSTANTANEOUS UNIT HYDROGRAPH PARAMETERS FOR SELECTED GAUGED CATCHMENTS IN THE WEST COAST OF PENINSULAR MALAYSIA Sazali Osman 1, Ismail Abustan 2 1 Senior Assistant Director, Department
Rational Method Hydrological Calculations with Excel COURSE CONTENT
 Rational Method Hydrological Calculations with Excel Harlan H. Bengtson, PhD, P.E. COURSE CONTENT 1. Introduction Calculation of peak storm water runoff rate from a drainage area is often done with the
MODULE 1 RUNOFF HYDROGRAPHS WORKSHEET 1. Precipitation
 Watershed MODULE 1 RUNOFF HYDROGRAPHS WORKSHEET 1 A watershed is an area of land thaaptures rainfall and other precipitation and funnels it to a lake or stream or wetland. The area within the watershed
ENGINEERING HYDROLOGY
 ENGINEERING HYDROLOGY Prof. Rajesh Bhagat Asst. Professor Civil Engineering Department Yeshwantrao Chavan College Of Engineering Nagpur B. E. (Civil Engg.) M. Tech. (Enviro. Engg.) GCOE, Amravati VNIT,
Synthesis of Unit Hydrographs for Texas Watersheds
 Synthesis of Unit Hydrographs for Texas Watersheds Theodore G. Cleveland, UH William H. Asquith, USGS David B. Thompson, R.O. Anderson Xing Fang, Auburn University July 17, 2007 Acknowledgements Research
RAINFALL RUN-OFF AND BASEFLOW ESTIMATION
 CHAPTER 2 RAINFALL RUN-OFF AND BASEFLOW ESTIMATION 2.1 Introduction The west coast of India receives abundant rainfall from the southwest monsoon. The Western Ghats escarpment (Sahyadri mountain range)
Learning objectives. Upon successful completion of this lecture, the participants will be able to describe:
 Solomon Seyoum Learning objectives Upon successful completion of this lecture, the participants will be able to describe: The different approaches for estimating peak runoff for urban drainage network
Unit 2: Geomorphologic and Hydrologic Characteristics of Watersheds. ENVS 435: Watershed Management INSTR.: Dr. R.M. Bajracharya
 Unit 2: Geomorphologic and Hydrologic Characteristics of Watersheds ENVS 435: Watershed Management INSTR.: Dr. R.M. Bajracharya Watersheds are hydro-geologic units Water flow and cycling are basic and
A GEOGRAPHIC INFORMATION SYSTEM BASED SPATIALLY DISTRIBUTED RAINFALL RUNOFF MODEL
 A GEOGRAPHIC INFORMATION SYSTEM BASED SPATIALLY DISTRIBUTED RAINFALL RUNOFF MODEL by Khalid Naseem Khan B.E. in Civil Engineering, University of Roorkee, 1998 Submitted to the Graduate Faculty of School
Distributed Hydrological Model For An Ungauged Subcatchment
 Distributed Hydrological Model For An Ungauged Subcatchment Dr. Krishna Mohan M Professor of Civil Engineering, Malla Reddy Engg College (Autonomous under JNTUH), Secunderabad Abstract Rainfall and runoff
5/11/2007. WinTR-55 for Plan Reviewers Small Watershed Hydrology Hydrology Terms and Definitions
 WinTR-55 for Plan Reviewers Small Watershed Hydrology Hydrology Terms and Definitions 1 Course Outline Overview Review of Hydrology Terms and Definitions Modeling Single Sub-area Watersheds Multiple Sub-area
The Texas A&M University and U.S. Bureau of Reclamation Hydrologic Modeling Inventory (HMI) Questionnaire
 Questionnaire") The Texas A&M University and U.S. Bureau of Reclamation Hydrologic Modeling Inventory (HMI) Questionnaire May 4, 2010 Name of Model, Date, Version Number Dynamic Watershed Simulation Model (DWSM) 2002
The Texas A&M University and U.S. Bureau of Reclamation Hydrologic Modeling Inventory (HMI) Questionnaire May 4, 2010 Name of Model, Date, Version Number Dynamic Watershed Simulation Model (DWSM) 2002
Flood forecasting model based on geographical information system
 192 Remote Sensing and GIS for Hydrology and Water Resources (IAHS Publ. 368, 2015) (Proceedings RSHS14 and ICGRHWE14, Guangzhou, China, August 2014). Flood forecasting model based on geographical information
1. Stream Network. The most common approach to quantitatively describing stream networks was postulated by Strahler (1952).
.") 1. Stream Network The most common approach to quantitatively describing stream networks was postulated by Strahler (1952). First Order Streams streams with no tributaries. Second Order Streams begin at
1. Stream Network The most common approach to quantitatively describing stream networks was postulated by Strahler (1952). First Order Streams streams with no tributaries. Second Order Streams begin at
SECTION III: WATERSHED TECHNICAL ANALYSIS
 Trout Creek Watershed Stormwater Management Plan SECTION III: WATERSHED TECHNICAL ANALYSIS A. Watershed Modeling An initial step this study of the Trout Creek watershed was the selection of a stormwater
Flood forecasting model based on geographical information system
 doi:10.5194/piahs-368-192-2015 192 Remote Sensing and GIS for Hydrology and Water Resources (IAHS Publ. 368, 2015) (Proceedings RSHS14 and ICGRHWE14, Guangzhou, China, August 2014). Flood forecasting model
THE RATIONAL METHOD FREQUENTLY USED, OFTEN MISUSED
 THE RATIONAL METHOD FREQUENTLY USED, OFTEN MISUSED Mark Pennington, Engineer, Pattle Delamore Partners Ltd, Tauranga ABSTRACT The Rational Method has been in use in some form or another at least since
Flood routing for selected gauged basins in Malaysia
 International Robotics & Automation Journal Research Article Open Access Flood routing for selected gauged basins in Malaysia Abstract Flood hydrographs are required for the design of hydraulic structures
HYDROLOGIC MODELING CONSISTENCY AND SENSITIVITY TO WATERSHED SIZE
 HYDROLOGIC MODELING CONSISTENCY AND SENSITIVITY TO WATERSHED SIZE by James C.Y. Guo. Professor, Civil Engineering, U. Of Colorado at Denver, James.Guo@cudenver.edu.. And Eric Hsu, Project Engineer, Parson
PERFORMANCE OF REPRESENTATIVE UNIT HYDROGRAPH DERIVED FROM DIFFERENT NUMBER OF CASES
 Civil Engineering Forum Volume XXI/2 - May 2012 PERFORMANCE OF REPRESENTATIVE UNIT HYDROGRAPH DERIVED FROM DIFFERENT NUMBER OF CASES Sri Harto Br Department of Civil and Environmental Engineering, Faculty
Runoff Hydrographs. The Unit Hydrograph Approach
 Runoff Hydrographs The Unit Hydrograph Approach Announcements HW#6 assigned Storm Water Hydrographs Graphically represent runoff rates vs. time Peak runoff rates Volume of runoff Measured hydrographs are
Development of Synthetic Unit Hydrograph at Kakkadavu Dam
 International Journal of Mechanics and Solids. ISSN 0973-1881 Volume 12, Number 1 (2017), pp. 113-124 Research India Publications http://www.ripublication.com/ijms.htm Development of Synthetic Unit Hydrograph
SPATIAL-TEMPORAL ADJUSTMENTS OF TIME OF CONCENTRATION
 JOURNAL O LOOD ENGINEERING J E 1(1) January June 2009; pp. 21 28 SPATIAL-TEMPORAL ADJUSTMENTS OF TIME OF CONCENTRATION Kristin L. Gilroy & Richard H. McCuen Dept. of Civil and Environmental Engineering,
WHAT IS SOIL? soil is a complex system of organic and inorganic (mineral) compounds Soil properties depend on formation process particle size climate
 compounds Soil properties depend on formation process particle size climate") Lecture 5, Soil water and infiltration WHAT IS SOIL? soil is a complex system of organic and inorganic (mineral) compounds Soil properties depend on formation process particle size climate THE IMPORTANCE
Lecture 5, Soil water and infiltration WHAT IS SOIL? soil is a complex system of organic and inorganic (mineral) compounds Soil properties depend on formation process particle size climate THE IMPORTANCE
STUDY OF RAINFALL-RUNOFF RESPONSE OF A CATCHMENT USING SCS CURVE NUMBER COMBINED WITH MUSKINGUM ROUTING TECHNIQUES
 Int. J. Struct. & Civil Engg. Res. 214 Ratul Das, 214 Research Paper ISSN 2319 69 www.ijscer.com Vol. 3, No. 3, August 214 214 IJSCER. All Rights Reserved STUDY OF RAINFALL-RUNOFF RESPONSE OF A CATCHMENT
Hydrologic Study Report for Single Lot Detention Basin Analysis
 Hydrologic Study Report for Single Lot Detention Basin Analysis Prepared for: City of Vista, California August 18, 2006 Tory R. Walker, R.C.E. 45005 President W.O. 116-01 01/23/2007 Table of Contents Page
Introduction. Keywords: Oil Palm, hydrology, HEC-HMS, HEC-RAS. a * b*
 The Effect of Land Changes Towards in Sg. Pandan Perwira Bin Khusairi Rahman 1,a* and Kamarul Azlan bin Mohd Nasir 1,b 1 Faculty of Civil Engineering, Universiti Teknologi Malaysia, Malaysia a * wirakhusairirahman@gmail.com,
Chapter H. Introduction to Surface Water Hydrology and Drainage for Engineering Purposes
 Chapter H. Introduction to Surface Water Hydrology and Drainage for Engineering Purposes As seen in Figure H.1, hydrology is a complex science that deals with the movement of water between various stages
Available online at ScienceDirect. Procedia Engineering 125 (2015 )
") Available online at www.sciencedirect.com ScienceDirect Procedia Engineering 125 (2015 ) 263 269 The 5th International Conference of Euro Asia Civil Engineering Forum (EACEF-5) Evaluation of drainage channels
Available online at www.sciencedirect.com ScienceDirect Procedia Engineering 125 (2015 ) 263 269 The 5th International Conference of Euro Asia Civil Engineering Forum (EACEF-5) Evaluation of drainage channels
A simple model for low flow forecasting in Mediterranean streams
 European Water 57: 337-343, 2017. 2017 E.W. Publications A simple model for low flow forecasting in Mediterranean streams K. Risva 1, D. Nikolopoulos 2, A. Efstratiadis 2 and I. Nalbantis 1* 1 School of
Overview of NRCS (SCS) TR-20 By Dr. R.M. Ragan
 TR-20 By Dr. R.M. Ragan") Overview of NRCS (SCS) TR-20 By Dr. R.M. Ragan TR-20 is a computer program for the simulation of runoff occurring from a single storm event. The program develops flood hydrographs from runoff and routes
Overview of NRCS (SCS) TR-20 By Dr. R.M. Ragan TR-20 is a computer program for the simulation of runoff occurring from a single storm event. The program develops flood hydrographs from runoff and routes
Estimation of Infiltration Parameter for Tehri Garhwal Catchment
 Estimation of Infiltration Parameter for Tehri Garhwal Catchment Ashish Bhatt 1 H L Yadav 2 Dilip Kumar 3 1 UG Student, Department of civil engineering, G B Pant Engineering College, Pauri, UK-246194 2,3
JOURNAL OF APPLIED SCIENCES RESEARCH
 Copyright 2015, American-Eurasian Network for Scientific Information publisher JOURNAL OF APPLIED SCIENCES RESEARCH ISSN: 1819-544X EISSN: 1816-157X JOURNAL home page: http://www.aensiweb.com/jasr Published
Alpha College of Engineering. Fifth Semester B.E. Question Bank. Hydrology and irrigation engineering
 Alpha College of Engineering Fifth Semester B.E. Question Bank Hydrology and irrigation engineering UNIT 1: INTRODUCTION & PRECIPITATION 1.Explain in brief the different types of precipitation. 2.How do
ENGN.4010 ENGINEERING CAPSTONE DESIGN Watershed Analysis. CiA
 RATIONAL METHOD Q CiA Where: Q = Maximum Rate of Runoff (cfs) C = Runoff Coefficient i = Average Rainfall Intensity (in/hr) A = Drainage Area (in acres) RATIONAL METHOD Assumptions and Limitations: Watershed
FAST WATER / SLOW WATER AN EVALUATION OF ESTIMATING TIME FOR STORMWATER RUNOFF
 FAST WATER / SLOW WATER AN EVALUATION OF ESTIMATING TIME FOR STORMWATER RUNOFF Factors Affecting Stormwater Runoff: Rainfall intensity % Impervious surfaces Watershed size Slope Soil type, soil compaction
INTENSE STORM-RUNOFF ROUTING OF HATIRJHEEL-BEGUNBARI LAKE OF DHAKA CITY
 Proceedings of the 3 rd International Conference on Civil Engineering for Sustainable Development (ICCESD 2016), 12~14 February 2016, KUET, Khulna, Bangladesh (ISBN: 978-984-34-0265-3) INTENSE STORM-RUNOFF
Estimating the 100-year Peak Flow for Ungagged Middle Creek Watershed in Northern California, USA
 American Journal of Water Resources, 2014, Vol. 2, No. 4, 99-105 Available online at http://pubs.sciepub.com/ajwr/2/4/3 Science and Education Publishing DOI:10.12691/ajwr-2-4-3 Estimating the 100-year
Cumulative Precipitation
 Problem 1: Hyetograph Construction (4 pts) Use the rainfall information below to construct both the cumulative (inch) and incremental (in/hr) hyetographs. Note: the incremental hyetograph must be formatted
RAINFALL-RUNOFF STUDY FOR SINGAPORE RIVER CATCHMENT
 10 th International Conference on Hydroinformatics HIC 2012, Hamburg, GERMANY RAINFALL-RUNOFF STUDY FOR SINGAPORE RIVER CATCHMENT CHI DUNG DOAN (1)(3), JIANDONG LIU (1), SHIE-YUI LIONG (1), ADRI VERWEY
Chapter 1 Introduction
 Engineering Hydrology Chapter 1 Introduction 2016-2017 Hydrologic Cycle Hydrologic Cycle Processes Processes Precipitation Atmospheric water Evaporation Infiltration Surface Runoff Land Surface Soil water
Modclark Model: Improvement and Application
 IOSR Journal of Engineering (IOSRJEN) ISSN: 2250-3021 Volume 2, Issue 7(July 2012), PP 100-118 Modclark Model: Improvement and Application 1 Dr. Amartya Kumar Bhattacharya, 2 Dr.Bruce M. McEnroe, 3 Dr.Hongying
ASSESSMENT OF DRAINAGE CAPACITY OF CHAKTAI AND RAJAKHALI KHAL IN CHITTAGONG CITY AND INUNDATION ADJACENT OF URBAN AREAS
 Proceedings of the 4 th International Conference on Civil Engineering for Sustainable Development (ICCESD 2018), 9~11 February 2018, KUET, Khulna, Bangladesh (ISBN-978-984-34-3502-6) ASSESSMENT OF DRAINAGE
Engineering Hydrology. Class 16: Direct Runoff (DRO) and Unit Hydrographs
 and Unit Hydrographs") Engineering Hydrology Class 16: and s Topics and Goals: 1. Calculate volume of DRO from a hydrograph; 2. Complete all steps to develop a. Class 14: s? HG? Develop Ocean Class 14: s? HG? Develop Timing
Engineering Hydrology Class 16: and s Topics and Goals: 1. Calculate volume of DRO from a hydrograph; 2. Complete all steps to develop a. Class 14: s? HG? Develop Ocean Class 14: s? HG? Develop Timing
Address for Correspondence
 Research Paper DYNAMIC FLOOD ROUTING AND UNSTEADY FLOW MODELLING: A CASE STUDY OF UPPER KRISHNA RIVER 1 Doiphode Sanjay L* 2 Oak Ravindra A. Address for Correspondence 1 M tech Student, Bharati Vidyapeeth
EVALUATION OF THE HEC-1 MODEL FOR FLOOD FORECASTING AND SIMULATION IN THE HORMOZGAN PROVINCE, IRAN
 JOURNAL OF ENVIRONMENTAL HYDROLOGY The Electronic Journal of the International Association for Environmental Hydrology On the World Wide Web at http://www.hydroweb.com VOLUME 9 2001 EVALUATION OF THE HEC-1
ONE DIMENSIONAL DAM BREAK FLOOD ANALYSIS FOR KAMENG HYDRO ELECTRIC PROJECT, INDIA
 ONE DIMENSIONAL DAM BREAK FLOOD ANALYSIS FOR KAMENG HYDRO ELECTRIC PROJECT, INDIA S. Masood Husain Nitya Nand Rai Director Assistant Director Foundation Engineering & Special Analysis Directorate Central
Simulation of Event Based Runoff Using HEC-HMS Model for an Experimental Watershed
 International Journal of Hydraulic Engineering 213, 2(2): 28-33 DOI: 1.5923/j.ijhe.21322.2 Simulation of Event Based Runoff Using HEC-HMS Model for an Experimental Watershed Reshma T *, Venkata Reddy K,
Reservoir on the Rio Boba
 Reservoir on the Rio Boba Michael J. Burns II Guillermo Bustamante J. James Peterson Executive Summary The National Institute of Water Resources in the Dominican Republic (INDRHI) plans to construct a
Introduction to Hydrology, Part 2. Notes, Handouts
 Introduction to Hydrology, Part 2 Notes, Handouts Precipitation Much of hydrology deals with precipitation How much? How frequently/infrequently? What form? How quickly? Seasonal variation? Drought frequency?
2.2.1 Statistical methods (Frequency Analysis)
") 2.' LITERATURE SURVEY 2.1 General Flood is considered as unusually high stage of the river. It is perhaps better described as that stage at which the stream channel gets filled and above which it overflows
2.' LITERATURE SURVEY 2.1 General Flood is considered as unusually high stage of the river. It is perhaps better described as that stage at which the stream channel gets filled and above which it overflows
ANALYSIS OF HYDRAULIC FLOOD CONTROL STRUCTURE AT PUTAT BORO RIVER
 Civil Engineering Forum Volume XXII/ - May 03 ANALYSIS OF HYDRAULIC FLOOD CONTROL STRUCTURE AT PUTAT BORO RIVER Ruhban Ruzziyatno Directorate General of Water Resources, Ministry of Public Works, Republic
CE 2031 WATER RESOURCES ENGINEERING L T P C
 CE 2031 WATER RESOURCES ENGINEERING L T P C 3 0 0 3 QUESTION BANK PART - A UNIT I GENERAL 1. Write short notes on Water Resources Survey. 2. How do you calculate Average Annual Runoff depth? 3. Write short
URBAN FLOODING: HEC-HMS
 1.0 Introduction URBAN FLOODING: HEC-HMS -Sunil Kumar, Director, NWA All major ancient civilisations were developed in the river valleys because river served as source of water, food, transportation and
APPENDIX E APPENDIX E ESTIMATING RUNOFF FOR SMALL WATERSHEDS
 APPENDIX E ESTIMATING RUNOFF FOR SMALL WATERSHEDS March 18, 2003 This page left blank intentionally. March 18, 2003 TABLES Table E.1 Table E.2 Return Frequencies for Roadway Drainage Design Rational Method
Snyder Unit Hydrograph Parameters for Malasian Catchments
 , pp.88-95 http://dx.doi.org/10.14257/astl.2017.146.17 Snyder Unit Hydrograph Parameters for Malasian Catchments Hazalizah bt Hamzah¹, Jer Lang Hong² and Kee An Hong 3 ¹ Drainage and Irrigation Department,
Impact Study of a check dam on Ground Water Recharge
 Impact Study of a check dam on Ground Water Recharge 1 P.Arun Raja, C. Dinesh, B.Jagadeesan 1,, UG Student, Department of Civil Engineering, Mamallan Institute of Technology, Kanchipuram, INDIA Abstract:
Hydrologic Engineering Center. Training Course on. Hydrologic Modeling with HEC-HMS. Davis, CA. Course Description
 Hydrologic Engineering Center Training Course on Hydrologic Modeling with HEC-HMS Davis, CA Course Description The course provides an introduction to HEC-HMS for new users, focusing both on using the program
Norman Maclean Snowmelt Flow rate Storm flows fs (c flow m a tre S
 Eventually, all things merge into one, and a river runs through it. Norman Maclean Understanding Streamflow ADEQ SW Short Course June 13, 213 Phoenix, AZ Hydrographs Discharge (Q) USGS flow data & plots
Hydrologic Engineering Center Hydrologic Modeling System (HEC-HMS) Sunil KUMAR Director, National Water Academy
 Sunil KUMAR Director, National Water Academy") Hydrologic Engineering Center Hydrologic Modeling System (HEC-HMS) Sunil KUMAR Director, National Water Academy 22 April 2015 NWA, Pune Exercise Objective: To determine hydrological Response of the given
Hydrologic Engineering Center Hydrologic Modeling System (HEC-HMS) Sunil KUMAR Director, National Water Academy 22 April 2015 NWA, Pune Exercise Objective: To determine hydrological Response of the given
FLOOD FORECASTING USING FGM MODEL IN CHINDWIN RIVER BASIN. Win Win Zin 1*, F. Nestmann 2, J. Ihringer Introduction
 Malaysian Journal of Civil Engineering 21(2) : 135-151 (2009) FOOD FORECASTING USING FGM MODE IN CHINDWIN RIVER BASIN Win Win Zin 1*, F. Nestmann 2, J. Ihringer 2 1 Department of Civil Engineering, Yangon
Flood Modelling and Water Harvesting Plan for Paravanar Basin
 International Journal of ChemTech Research CODEN (USA): IJCRGG, ISSN: 0974-4290, ISSN(Online):2455-9555 Vol.10 No.14, pp 01-08, 2017 Flood Modelling and Water Harvesting Plan for Paravanar Basin Dhinesh
Hydrology for Folsom Dam Water Control Manual Update
 Hydrology for Folsom Dam Water Control Manual Update Brian Walker, EIT Civil Engineer, Hydrology Section U.S. Army Corps of Engineers Sacramento District 1325 J Street Sacramento, CA 95816 Tel: (916) 557-7376
Hydrologic Engineering Center. Training Course on. Hydrologic Modeling with HEC-HMS April 2018 Davis, CA. Course Description
 Hydrologic Engineering Center Training Course on Hydrologic Modeling with HEC-HMS 23-27 April 2018 Davis, CA Course Description The course provides an introduction to HEC-HMS for new users, focusing both
RAINFALL-RUNOFF SIMULATION IN AN EXPERIMENTAL BASIN USING GIS METHODS
 JOURNAL OF ENVIRONMENTAL HYDROLOGY The Electronic Journal of the International Association for Environmental Hydrology On the World Wide Web at http://www.hydroweb.com VOLUME 14 2006 RAINFALL-RUNOFF SIMULATION
APPENDIX IV. APPROVED METHODS FOR QUANTIFYING HYDROLOGIC CONDITIONS OF CONCERN (NORTH ORANGE COUNTY)
") APPENDIX IV. APPROVED METHODS FOR QUANTIFYING HYDROLOGIC CONDITIONS OF CONCERN (NORTH ORANGE COUNTY) Hydromodification design criteria for the North Orange County permit area are based on the 2- yr, 24-hr
APPENDIX IV. APPROVED METHODS FOR QUANTIFYING HYDROLOGIC CONDITIONS OF CONCERN (NORTH ORANGE COUNTY) Hydromodification design criteria for the North Orange County permit area are based on the 2- yr, 24-hr
Estimation of Hydrological Outputs using HEC-HMS and GIS
 Nigerian Journal of Environmental Sciences and Technology (NIJEST) www.nijest.com ISSN (Print): 2616-051X ISSN (electronic): 2616-0501 Vol 1, No. 2 July 2017, pp 390-402 Estimation of Hydrological Outputs