Advancing catchment science through high-frequency monitoring of water quality
|
|
|
- Jemima Stevenson
- 6 years ago
- Views:
Transcription


1 Advancing catchment science through high-frequency monitoring of water quality Professor Kevin Hiscock School of Environmental Sciences University of East Anglia, Norwich Research Park, Norwich, NR4 7TJ 8 July 2014
2 Outline The problem diffuse water pollution from agriculture Introduction to the Demonstration Test Catchments Project Water quality data resolution monthly, daily & sub-daily sampling Exceedance curves and water quality standards Conceptual model insights Solute flux calculations Data presentation & archiving
 Nature 490:")
3 Mueller et al. (2012) Nature 490:

4 Challenge no. 1 Global distribution of >400 eutrophication-associated dead zones mapped against the global human footprint 1,2 1 Diaz & Rosenberg (2008) 2 Sanderson et al. (2002)

5 Catchment pollution sources

6 The Demonstration Test Catchments The DTC project aims to evaluate the extent to which on-farm mitigation measures can cost-effectively reduce the impacts of water pollution on river ecology while maintaining food production capacity


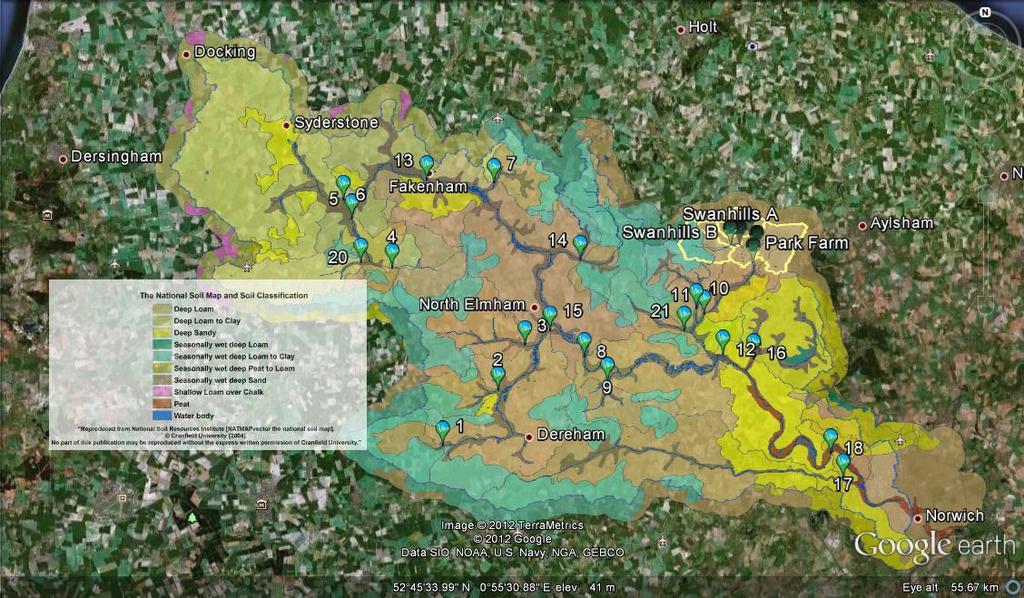
7 Wensum catchment location and conceptual model Rainfall

8 Storm event 27 November 2012 View 1 (Wood Dalling) Stream B Stinton Hall Farm Monitoring Station Stream A


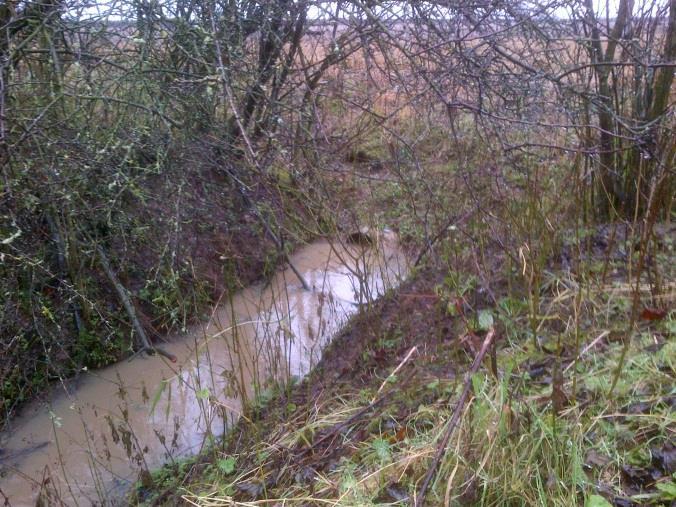
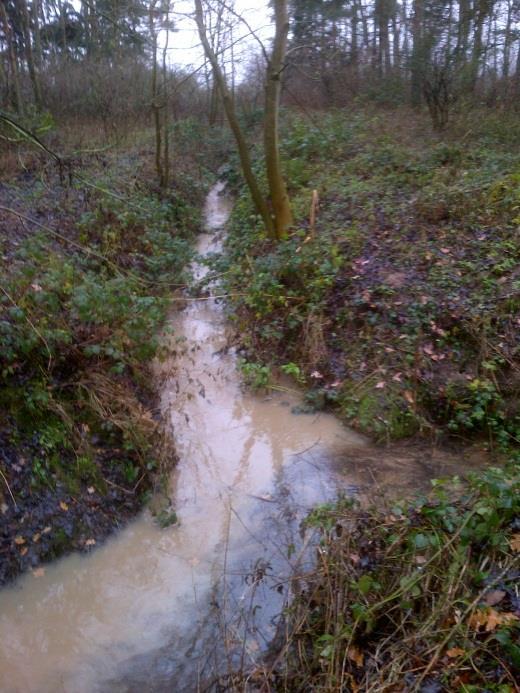
9 View 1 (Wood Dalling) 27 November 2012

10

11 Blackwater sub-catchment study area

12 Hydro-meteorology weather station & rain gauge


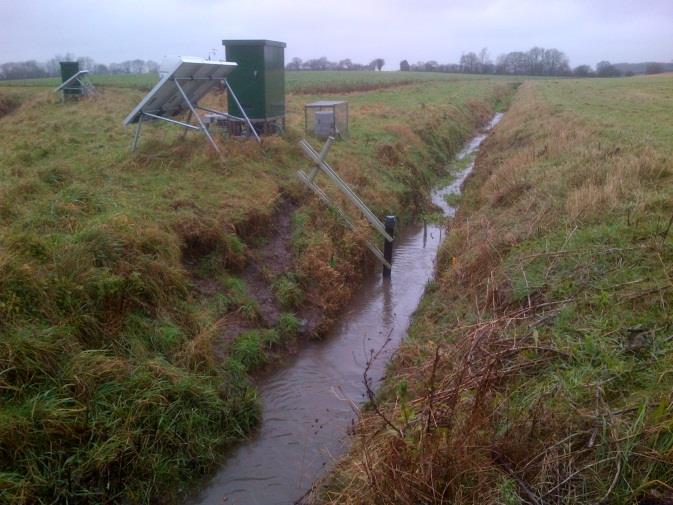
13 Water quality monitoring - mini kiosk installation Taking half hourly measurements of: DO ph Conductivity Chlorophyll a Temperature Turbidity Stage ISCO automatic sampler to be triggered during storm events


14 Water quality monitoring - high spec kiosk installation Mains power Total and dissolved phosphorus analyser Pump Automatic water sampler Telemetry system Flow cell with multiparameter sonde and nitrate probe

15 Nitrate (mg N/L) Nitrate (mg N/L) Nitrate (mg N/L) Monthly grab sample data Tat Tatterford Common Wensum - Helhoughton Bridge Wensum - Swanton Morley
 Weekly grab sample data 15 10 Tat -")

16 Nitrate (mg N/L) Nitrate (mg N/L) Nitrate (mg N/L) Weekly grab sample data Tat - Tatterford Common Wensum - Helhoughton Bridge Wensum Swanton - Morley Bridge
17 Data trends Stinton Hall Farm, E
18 NO 3 exceedance curve Stinton Hall E, April 2011 Dec 2012 EU Drinking Water Directive/NVZ limit Kiosk data: 8.7% of the monitoring period with concentrations >50 mg/l Grab sample data: exceedance recorded once A concentration frequency target may be more meaningful ecologically than average concentrations or loads as it relates directly to the duration of exposure of aquatic organisms to N, P and sediment
19 Total P exceedance curve Stinton Hall E, April 2011 Dec 2012 Kiosk data: 21.5% of the monitoring period with concentrations >100 mg P L -1 Grab sample data: 11.6% exceedance Environment Agency and Natural England target for main Wensum SSSI g_fen_dwpp_finalversion.pdf
 Nitrate-N, TP, TRP (mg/l)")
20 Example monitoring data - Stinton Hall Farm, E - October 2013 Rainfall = mm Water level (m) Nitrate-N, TP, TRP (mg/l)
 Air temp. (min) = -2.")
21 Detection of road salt runoff at Swanhills A 20 November 2012 Water temp. (min) = 5.20 o C Pathway to Swanhills A EC peak = 1142 ms/cm (3-hour lag) Air temp. (min) = o C Rainfall = 2.2 mm

22 Diurnal patterns Stinton Hall, Site E


23 Low, mid and high flow conditions Oct 2011 Sept 2012

24 Annual contribution to flow and pollutant loads under low, mid and high flow conditions Oct 2011 Sept 2012 N.B. Gaps in phosphorus record are likely to mean that there is an underestimation of the high-flow contribution Flow
25 Inter-annual comparison Park Farm, F Oct- Dec 2011 Total rainfall 120 mm Total N lost 2916 kg (5.4 kg/ha) Total P lost 31 kg (0.06 kg/ha)
26 Inter-annual comparison Park Park Farm, Farm, F Oct- April Dec Total rainfall 243 mm Total 65% N lost higher 15,378 N loss kg 5.3 times more N than 2011 (equivalent to 13,032*) (28.6 kg/ha) *NH 3 NO 3 at 300/tonne 21% higher P loss Total P lost 180 kg 5.8 times more P than 2011 (0.33 kg/ha)

27 Data presentation via Wensum Alliance website

28 Data presentation via Google earth application

29 Data retrievable at the original level of aggregation. Information accessible via intelligent queries that combine multiple datasets (and subsets) in novel ways. Intelligent restructuring of data via the use of linked data architecture. Fully compliant with EU INSPIRE Directive. Linkable with EU and international datasets via Link Data.

30 Summary & Reflections High-frequency monitoring provides unprecedented information on catchment processes (sources, mobilisation, pathways and delivery mechanisms). Field-based bankside systems require constant attention a rigorous maintenance schedule is required to keep sensors in working order. Data quality control and archiving is a demanding task. Web-based sensor technology provides greater certainty in supporting an evidenced-based approach to implementing agri-environmental policy.
Reducing diffuse nitrate pollution in an intensive arable catchment: an interdisciplinary approach
 Reducing diffuse nitrate pollution in an intensive arable catchment: an interdisciplinary approach Kevin Hiscock, Andrew Lovett, Faye Outram, Steve Dugdale, Zanist Hama-Aziz, Nick Garrard & Lister Noble
Catchment science and the Wensum Demonstration Test Catchment Project
 Catchment science and the Wensum Demonstration Test Catchment Project UK-China Sustainable Agriculture Innovation Network Workshop 18 March 2011 Kevin Hiscock (k.hiscock@uea.ac.uk) What's the problem?
Real-time Water Quality Monitoring
 Real-time Water Quality Monitoring Amanjot Singh, Ph.D., P. Eng. Water Quality Engineer Credit Valley Conservation Authority November 14, 212 Focus Current sampling methods their objectives and limitations
Arkansas Water Resources Center
 Arkansas Water Resources Center WATER SAMPLING, ANALYSIS AND ANNUAL LOAD DETERMINATIONS FOR TSS, NITROGEN AND PHOSPHORUS AT THE L ANGUILLE RIVER NEAR PALESTINE Submitted to the Arkansas Soil and Water
Role of high frequency water quality analysis in confirming catchment hydrology interpretation
 Role of high frequency water quality analysis in confirming catchment hydrology interpretation Michael DONN, Olga BARRON, Tony BARR CSIRO Land and Water, Australia Introduction Nutrient export to the Swan
LOXAHATCHEE RIVER WATER QUALITY EVENT SAMPLING TASK 2: FINAL REPORT ASSESSMENT OF LOXAHATCHEE RIVER WATER QUALITY
 LOXAHATCHEE RIVER WATER QUALITY EVENT SAMPLING TASK 2: FINAL REPORT ASSESSMENT OF 2007-2008 LOXAHATCHEE RIVER WATER QUALITY In Partial Fulfillment of Agreement No. 4600001281 For the Period October 2007
Diffuse pollution in groundwater-dominated agricultural catchments
 Diffuse pollution in groundwater-dominated agricultural catchments Magdalena Bieroza & Louise Heathwaite Lancaster Environment Centre Lancaster University 3 rd September 2014 Water quality responses to
Arkansas Water Resources Center
 Arkansas Water Resources Center WATER QUALITY SAMPLING, ANALYSIS AND ANNUAL LOAD DETERMINATIONS FOR TSS, NITROGEN AND PHOSPHORUS IN THE BAYOU BARTHOLOMEW AT GARRETT BRIDGE, AR AND NEAR PORTLAND, AR Submitted
July 2009 WATER QUALITY SAMPLING, ANALYSIS AND ANNUAL LOAD DETERMINATIONS FOR NUTRIENTS AND SOLIDS ON
 July 2009 WATER QUALITY SAMPLING, ANALYSIS AND ANNUAL LOAD DETERMINATIONS FOR NUTRIENTS AND SOLIDS ON THE BALLARD CREEK, 2008 LESLIE B. MASSEY, WADE CASH, AND BRIAN E. HAGGARD Submitted to Arkansas Natural
Fall Line Input Monitoring on the Potomac River at Chain Bridge
 Fall Line Input Monitoring on the Potomac River at Chain Bridge 1983-2007 Metropolitan Washington Council of Governments and Occoquan Watershed Monitoring Laboratory Regional Monitoring Subcommittee Meeting
Temporal Variability of Phosphorus Concentration in the stream to Squam Lake, New Hampshire during Storm Events
 Temporal Variability of Phosphorus Concentration in the stream to Squam Lake, New Hampshire during Storm Events Anju Shrestha, Dr. Mark B. Green & Dr. Joseph N. Boyer Plymouth State University Environmental
Kinley Creek Monitoring Sites Monitoring Data Summary for August 19 th, 2017 September 18 th, 2017
 Kinley Creek Monitoring Sites Monitoring Data Summary for August 19 th, 217 September 18 th, 217 Data Gaps The KINA station experienced submergence issues that affected specific conductivity from the date
Arkansas Water Resources Center
 Arkansas Water Resources Center WATER QUALITY SAMPLING, ANALYSIS AND ANNUAL LOAD DETERMINATIONS FOR TSS, NITROGEN AND PHOSPHORUS AT THE WASHINGTON COUNTY ROAD 195 BRIDGE ON THE WEST FORK OF THE WHITE RIVER
Continuous Surrogate Monitoring for Pollutant Load Estimation in Urban Water Systems
 Continuous Surrogate Monitoring for Pollutant Load Estimation in Urban Water Systems Anthony A. Melcher Jeffery S. Horsburgh, Bryce A. Mihalevich Civil and Environmental Engineering, Utah State University,
October 29, Monitoring Data Analysis for September 20 October 21, Gills Creek Monitoring Sites
 October 9, Monitoring Data Analysis for September October, Gills Creek Monitoring Sites Over the course of the monitoring period (September through October, ), an overall decrease in water temperature
Sensitivity of the pesticide application date for pesticide fate modelling during floods using the SWAT model
 Sensitivity of the pesticide application date for pesticide fate modelling during floods using the SWAT model L. Boithias*, S. Sauvage, R. Srinivasan, F. Macary, JM. Sánchez-Pérez *l.boithias@gmail.com
University of Arkansas, Fayetteville. Marc Nelson. L. Wade Cash. Keith Trost. Jennifer Purtle
 University of Arkansas, Fayetteville ScholarWorks@UARK Technical Reports Arkansas Water Resources Center 6-1-2005 Water Quality Sampling, Analysis and Annual Load Determinations for Nutrients and Sediment
TSS The TSS analyser was operational during the reporting period. The composite sampler is in place to cover any shortfalls in the TSS analyser.
 Interim Environmental Report Period Ending: 28th May 28 Compiled By: Siobhan Quinn & Thomas McGlynn Approved By: Tony Doyle 1 Monitoring Data 1.1 Monitoring Equipment Axonics Axonics plant operated as
Real-Time Water Quality Monitoring Network in Newfoundland and Labrador
 Real-Time Water Quality Monitoring Network in Newfoundland and Labrador Overview Objectives of Real-Time Water Quality Monitoring Program in NL Real-Time Water Quality Monitoring Network in NL - - - Provincial
MCAS Cherry Point Implements Innovative Water Quality Monitoring System
 MCAS Cherry Point Implements Innovative Water Quality Monitoring System System Reduces NPDES Manpower Requirements, Provides Real-Time Water Quality Data MARINE CORPS AIR Station (MCAS) Cherry Point s
July 2009 WATER QUALITY SAMPLING, ANALYSIS AND ANNUAL LOAD DETERMINATIONS FOR THE ILLINOIS RIVER AT ARKANSAS HIGHWAY 59 BRIDGE, 2008
 July 29 WATER QUALITY SAMPLING, ANALYSIS AND ANNUAL LOAD DETERMINATIONS FOR THE ILLINOIS RIVER AT ARKANSAS HIGHWAY 59 BRIDGE, 28 LESLIE B. MASSEY, WADE CASH, AND BRIAN E. HAGGARD Submitted to Arkansas
NERRS Science. Collaborative Project
 NERRS Science Collaborative Project Detecting non point nitrogen sources and transport pathways in the Great Bay watershed and engaging decision makers in the science Investigators: Dr. William H. McDowell,
Research and Environmental Management at the Catchment scale
 Research and Environmental Management at the Catchment scale the Demonstration Test Catchments Programme as an example Bob Harris Secretariat A joint programme of Defra, WAG and the Environment Agency
Agricultural-Driven Eutrophication
 Agricultural-Driven Eutrophication Professor Louise Heathwaite Department of Geography University of Sheffield Phosphorus Loading to UK Waters Land Leaks! P P load load -1 yr -1 Kg Kg ha ha-1 yr-1 Agriculture
Impact of Legacy Soil Phosphorus on P Loss in Runoff from a Grazed Grassland Hillslope. Rachel Cassidy, Donnacha Doody & Catherine Watson
 Impact of Legacy Soil Phosphorus on P Loss in Runoff from a Grazed Grassland Hillslope Rachel Cassidy, Donnacha Doody & Catherine Watson Despite the implementation of EU regulations controlling the use
Kinley Creek Monitoring Sites Monitoring Data Summary for March 30 th, 2017 May 3 rd, 2017
 Kinley Creek Monitoring Sites Monitoring Data Summary for March 3 th, 17 May 3 rd, 17 Data Gaps The KINA and KINB stations did not experience any gaps in the data record during this monitoring period.
H1: Watershed land use and stream bank morphology determine sediment load and P- N speciation sensitive to timing, frequency, and intensity of rain-sn
 Question 1: What is the relative importance of endogenous inlake processes (e.g. internal loading, ice cover, hydrodynamics) versus exogenous to-lake processes (e.g. land use change, snow/rain timing,
Acidity and Alkalinity:
 Evaluation of Pollution Sources to Lake Glenville Quarterly Report December 2018 Kimberlee K Hall, PhD Environmental Health Program, Western Carolina University Summary Chemical and microbial analysis
Outer Cove Brook Network
 Real Time Water Quality Report Outer Cove Brook Network Deployment Period August 6 to September 4, 2013 Government of Newfoundland & Labrador Department of Environment and Conservation Water Resources
Environmental Report - Status Week Ending: Thur 12 h May2006 Generated By: Siobhan Quinn/Mairtin Naughton/Sandra Barber Checked By: Leslie Finnegan
 Environmental Report - Status Week Ending: Thur 12 h May2006 Generated By: Siobhan Quinn/Mairtin Naughton/Sandra Barber Checked By: Leslie Finnegan 1 Monitoring Data 1.1 Monitoring Equipment Axonics System
Arkansas Water Resources Center
 Arkansas Water Resources Center ILLINOIS RIVER 23 POLLUTANT LOADS AT ARKANSAS HIGHWAY 59 BRIDGE Submitted to the Arkansas Soil and Water Conservation Commission and the Arkansas-Oklahoma Arkansas River
Long Harbour Real-Time Water Quality Monitoring Network. Annual Report
 Long Harbour Real-Time Water Quality Monitoring Network Annual Report 2008 Prepared by: Date: Ryan Pugh Ph: 709.729.16.81 Fx: 709.729.0320 ryanpugh@gov.nl.ca March 2, 2009 Table of Contents Table of Contents...
Outer Cove Brook Network
 Real Time Water Quality Report Outer Cove Brook Network Deployment Period May 3 to June 4, 2013 Government of Newfoundland & Labrador Department of Environment and Conservation Water Resources Management
Arkansas Water Resources Center
 Arkansas Water Resources Center WATER QUALITY SAMPLING, ANALYSIS AND ANNUAL LOAD DETERMINATIONS FOR TSS, NITROGEN AND PHOSPHORUS AT THE WYMAN BRIDGE ON THE WHITE RIVER Submitted to the Arkansas Soil and
The data used for this reporting period was taken from the on-site meteorological station.
 Environmental Report - Final Week Ending: Thur 15 th Mar 27 Generated By: Siobhan Quinn/Sandra Barber Checked By: Tony Doyle 1 Monitoring Data. 1.1 Monitoring Equipment Axonics Axonics plant ran for the
Pat Conrad, Joe Pallardy, Kristine Maurer Water Quality Monitoring Summary Report
 technical memo Project Name 2017 Water Quality Monitoring Date 4/9/2018 To / Contact info From / Contact info Regarding Kayla Bergman: Squaw Creek WMA Pat Conrad, Joe Pallardy, Kristine Maurer 2017 Water
TSS The TSS analyser was operational during the reporting period. The composite sampler is in place to cover any shortfalls in the TSS analyser.
 Interim Environmental Report Period Ending: 3 th April 28 Compiled By: Siobhan Quinn, Aoife Reynolds & Thomas McGlynn Approved By: Tony Doyle 1 Monitoring Data 1.1 Monitoring Equipment Axonics Axonics
Manure Applications on Frozen and Snow Covered Soils
 Manure Applications on Frozen and Snow Covered Soils Kevan Klingberg University of Wisconsin Discovery Farms / Extension 2011 North American Manure Expo July 20, 2011 Negative Impacts of Improper Manure
Jordan River TMDL Update
 Jordan River TMDL Update 2010 Watershed Symposium August 4 th, 2010 Hilary N. Arens Utah Division of Water Quality Jordan River TMDL Outline What is a TMDL and what is the Jordan impaired for? Evaluation
PREDICTED EFFECTS OF EXTERNAL LOAD REDUCTIONS AND IN-LAKE TREATMENT ON WATER QUALITY IN CANYON LAKE A SUPPLEMENTAL SIMULATION STUDY
 PREDICTED EFFECTS OF EXTERNAL LOAD REDUCTIONS AND IN-LAKE TREATMENT ON WATER QUALITY IN CANYON LAKE A SUPPLEMENTAL SIMULATION STUDY FINAL REPORT Submitted to: Lake Elsinore-San Jacinto Watershed Authority
Nutrient Cycling and Water Quality on California Rangelands
 Nutrient Cycling and Water Quality on California Rangelands Randy Dahlgren Department of Land, Air and Water Resources University of California - Davis Core Research Team Barbara Allen-Diaz Rob Atwill
Keeyask Infrastructure Project
 Keeyask Infrastructure Project Terrestrial and Aquatic Monitoring Plan Annual Report 2013-2014 December 2014 KEEYASK INFRASTRUCTURE PROJECT TERRESTRIAL AND AQUATIC MONITORING PLAN Water Quality: Annual
Monitoring good water quality conditions: a comparative river and catchment analysis
 Monitoring good water quality conditions: a comparative river and catchment analysis Brian Kronvang, Jørgen Windolf and Gitte Blicher-Mathiesen Department of Bioscience, Aarhus University Introduction
IMPROVE s Evolution. Data Tools Publications Special Studies Education Activities.
 IMPROVE s Evolution Data Tools Publications Special Studies Education Activities http://vista.cira.colostate.edu/improve VIEWS VIEWS To be Archived Datasets to be included IMPROVE aerosol data Forest
Arkansas Water Resources Center
 Arkansas Water Resources Center ILLINOIS RIVER 21 POLLUTANT LOADS AT ARKANSAS HIGHWAY 59 BRIDGE Submitted to the Arkansas Soil and Water Conservation Commission By Marc A. Nelson, Arkansas Water Resources
Waterford River at Kilbride
 Real Time Water Quality Report Waterford River at Kilbride Deployment Period June 2, 2015 to August 20, 2015 Government of Newfoundland & Labrador Department of Environment and Conservation Water Resources
URBAN NON-POINT SOURCE IMPACTS ON SEATTLE AREA STREAM PHOSPHORUS TRANSPORT
 URBAN NON-POINT SOURCE IMPACTS ON SEATTLE AREA STREAM PHOSPHORUS TRANSPORT Michael T. Brett, Sara E. Stanley, Benjamin O. Brattebo, Micaela Ellison & Giorgios Arhonditsis Department of Civil & Environmental
2016 HLWD WATER QUALITY RESULTS CATHERINE WEGEHAUPT WATERSHED TECHNICIAN JULY 2017 BOARD MEETING
 2016 HLWD WATER QUALITY RESULTS CATHERINE WEGEHAUPT WATERSHED TECHNICIAN JULY 2017 BOARD MEETING JACK CREEK 1200 2016 JACK CREEK HYDROGRAPH 1.80 1000 1.60 1.40 MEAN DAILY DISCHARGE (CFS) 800 600 400
Tsulquate River Community Watershed Water Quality Objectives Attainment Report
 Tsulquate River Community Watershed Water Quality Objectives Attainment Report Environmental Quality Section Environmental Protection Division West Coast Region 2013 Report Prepared by: Clayton Smith.
Lake Wallenpaupack Watershed Assessment Project
 Submitted to: Pennsylvania Growing Greener Grants Center Submitted by: Lake Wallenpaupack Watershed Management District HC 1 Box 15D Paupack, PA 18451 Table of Contents Title Page Executive Summary...
Monitoring agricultural subwatersheds containing conservation practices in the Black Hawk Lake watershed
 Agricultural and Biosystems Engineering Monitoring agricultural subwatersheds containing conservation practices in the Black Hawk Lake watershed Leigh Ann Long, M.S. Research Associate lalong@iastate.edu
Preliminary evaluation of VTA effectiveness to protect runoff water quality on small pork production facilities in Texas
 Texas Water Resources Institute TR-452 November 2013 Preliminary evaluation of VTA effectiveness to protect runoff water quality on small pork production facilities in Texas Kevin Wagner, Texas Water Resources
Monitoring to Ensure Quality. Katie Kennedy-Fairfax Water
 Monitoring to Ensure Quality Katie Kennedy-Fairfax Water Virginia s Largest Water Utility (1 in 5 Virginians on Public Supply) One of 25 Largest Water Utilities in the Country Nearly 2 Million Retail
Yoshinaga Ikuo *, Y. W. Feng**, H. Hasebe*** and E. Shiratani****
 NITROGEN REMOVAL FUNCTION OF PADDY FIELD IN A CIRCULAR IRRIGATION SYSTEM Yoshinaga Ikuo *, Y. W. Feng**, H. Hasebe*** and E. Shiratani**** * National Institute for Rural Engineering, Tsukuba Science City
Leary s Brook at Prince Philip Drive
 Real-Time Water Quality Report Leary s Brook at Prince Philip Drive Deployment Period January 18, 216 to February 22, 216 Government of Newfoundland & Labrador Department of Environment and Conservation
Predicting algal growth under climate change in the upper Thames Mike Hutchins, CEH Wallingford
 Predicting algal growth under climate change in the upper Thames Mike Hutchins, CEH Wallingford (plus Richard Williams, Christel Prudhomme, Sue Crooks) Changes in the Thames by 2080 Brought about by economic
LM0308: Catchment Management for Water Quality
 LM0308: Catchment Management for Water Quality Case Study 5: Uncertainty in ecological responses to water quality control measures at the river basin scale. Lead: Richard Williams (CEH); Andy Wade (University
Lake Elsinore and San Jacinto Watersheds Authority. Canyon Lake Phase 2 Water Quality Monitoring Plan
 Lake Elsinore and San Jacinto Watersheds Authority December 2010 Background Canyon Lake was formed in 1928 when the Canyon Lake (Railroad Canyon) Dam was constructed; the lake has three main sections the
Barnegat Bay Water Quality and Quantity Monitoring Program
 Barnegat Bay Water Quality and Quantity Monitoring Program Helen Pang, Trish Ingelido, Ariane Giudicelli, Barbara Hirst, Amanda Lotto and Jill Lipoti Water Monitoring and Standards NJDEP 2013 Delaware
RED LAKE RIVER FARM TO STREAM TILE DRAINAGE STUDY - Red Lake Watershed District -
 RED LAKE RIVER FARM TO STREAM TILE DRAINAGE STUDY - Red Lake Watershed District - Project Background RLWD Received a Grant of $17,500 from the Northwest Minnesota Foundation Originally focused upon wild
CITY OF LONDON WASTEWATER TREATMENT OPERATIONS ENVIRONMENTAL & ENGINEERING SERVICES DEPARTMENT 2013 ANNUAL REPORT ADELAIDE WASTEWATER TREATMENT PLANT
 CITY OF LONDON WASTEWATER TREATMENT OPERATIONS ENVIRONMENTAL & ENGINEERING SERVICES DEPARTMENT 2013 ANNUAL REPORT ADELAIDE WASTEWATER TREATMENT PLANT FEBRUARY 2014 Adelaide Wastewater Treatment Plant 2013
Estero Americano Watershed Sediment Reduction Project, Phase II, Sonoma and Marin Counties, CA. Draft Quarterly Monitoring Report Item B.4.
 Estero Americano Watershed Sediment Reduction Project, Phase II, Sonoma and Marin Counties, CA Draft Quarterly Monitoring Report Item B.4.2 This quarterly report summarizes data collected from December
AN INVESTIGATION IN TO THE RELATIONSHIP OF GROUNDWATER AND SURFACE WATER IN THE HYPORHEIC ZONE, A CASE STUDY OF THE RIVER BLACKWATER, NORFOLK
 AN INVESTIGATION IN TO THE RELATIONSHIP OF GROUNDWATER AND SURFACE WATER IN THE HYPORHEIC ZONE, A CASE STUDY OF THE RIVER BLACKWATER, NORFOLK by 100033473 Thesis presented in part-fulfillment of the degree
Channel Islands Harbor Nutrient Sources & Sinks Study
 Channel Islands Harbor Nutrient Sources & Sinks Study Prepared by: Aquatic Bioassay & Consulting Laboratories, Inc. 29 N Olive St., Ventura, CA 93001 & Aquatic EcoTechnologies November, 2018 1 Introduction
Arkansas Water Resources Center
 Arkansas Water Resources Center WATER QUALITY MONITORING OF MOORES CREEK ABOVE LINCOLN LAKE Submitted to the Arkansas Soil and Water Conservation Commission By M.A. Nelson L.W. Cash G.K. Trost Arkansas
Redwood Shores Lagoon November 2016 Monthly Water Quality Monitoring Report
 Redwood Shores Lagoon November 2016 Monthly Water Quality Monitoring Report Prepared for Redwood City Public Works Services Department 1400 Broadway Redwood City, CA 94063-2594 Prepared by Clean Lakes,
44 W E & T w w w. w e f. o r g / m a g a z i n e 2007 Water Environment & Technology All rights reserved
 Philadelphia deploys automatic samplers as soon as possible after a rain event. This sampler features a protective fiberglass enclosure, plastic protective pipe for the water sample line, and a cable for
Redwood Shores Lagoon February 2019 Monthly Water Quality Monitoring Report
 Redwood Shores Lagoon February 2019 Monthly Water Quality Monitoring Report Prepared for Redwood City Public Works Services Department 1400 Broadway Redwood City, CA 94063-2594 Prepared by Clean Lakes,
Surface Water Sampling
 Surface Water Sampling Steve Howatt Who are we? CRO based out of Prince Edward Island, CANADA We have two research farms: New Glasgow, Prince Edward Island serving Zone 1 (1A) St Marc-sur-Richelieu, Quebec
Predicting future change in water flows and quality in urbanising catchments
 Predicting future change in water flows and quality in urbanising catchments Mike Hutchins (CEH Wallingford) and G. Bussi, S. Dadson, J. Fidal, A. Hagen-Zanker, O. Hitt, J. Jones, T. Kjeldsen, M. Loewenthal,
CE 2031 WATER RESOURCES ENGINEERING L T P C
 CE 2031 WATER RESOURCES ENGINEERING L T P C 3 0 0 3 QUESTION BANK PART - A UNIT I GENERAL 1. Write short notes on Water Resources Survey. 2. How do you calculate Average Annual Runoff depth? 3. Write short
Nutrient Removal Mechanisms in a Cold Climate Gravel Wetland Alison Watts, Robert Roseen, Kim Farah, Heather Gilbert, Jamie Houle
 Nutrient Removal Mechanisms in a Cold Climate Gravel Wetland Alison Watts, Robert Roseen, Kim Farah, Heather Gilbert, Jamie Houle The 2009 New Hampshire Joint Water and Watershed Conference Concord, NH
Keeyask Infrastructure Project
 Keeyask Infrastructure Project Terrestrial and Aquatic Monitoring Plan Annual Report 2014-2015 December 2015 KEEYASK INFRASTRUCTURE PROJECT TERRESTRIAL AND AQUATIC MONITORING PLAN Water Quality: Annual
Water Resources on PEI: an overview and brief discussion of challenges
 Water Resources on PEI: an overview and brief discussion of challenges Components: Components and links Atmospheric water Surface water (including glacial water) Groundwater Links: Precipitation (atm(
Redwood Shores Lagoon May 2017 Monthly Water Quality Monitoring Report
 Redwood Shores Lagoon May 2017 Monthly Water Quality Monitoring Report Prepared for Redwood City Public Works Services Department 1400 Broadway Redwood City, CA 94063-2594 Prepared by Clean Lakes, Inc.
Mercantile Creek Community Watershed Water Quality Objectives Attainment Report
 Mercantile Creek Community Watershed Water Quality Objectives Attainment Report Environmental Quality Section Environmental Protection Division Coast Region 2015 Report Prepared by: Martina Kopat. Approved
STORMWATER PURIFICATION CAPABILITY OF BIOECODS
 ADVANCES IN HYDRO-SCIENCE AND ENGINEERING, VOLUME VI 1 STORMWATER PURIFICATION CAPABILITY OF BIOECODS L.M. Sidek 1, A. Ainan 2, N.A. Zakaria 3, A. Ab. Ghani 4, R. Abdullah and K.R. Ayub 6 ABSTRACT A storm
Phosphorus management in a changing world: using models to build a bridge between science and policy
 Phosphorus management in a changing world: using models to build a bridge between science and policy MN Futter, J Crossman, PG Whitehead IPW Sept 10, 2013 Acknowledgements Andrew Wade, Dan Butterfield,
Modelling approach to predict peak inflows at the Argyle block cave mine, Western Australia
 Modelling approach to predict peak inflows at the Argyle block cave mine, Western Australia Geoff Beale 2, Toddy Syaifullah 1, Dadang Saepulloh 1, Stuart Daley 2 1 Argyle Diamond Mine, Rio Tinto, Perth,
WATER AND NUTRIENT BALANCES FOR THE TWIN FALLS IRRIGATION TRACT
 WATER AND NUTRIENT BALANCES FOR THE TWIN FALLS IRRIGATION TRACT D. Bjorneberg 1, D. Westermann 1 and N. Nelson 2 1 USDA ARS, Kimberly, ID 2 Kansas State University ABSTRACT Surface water return flow from
SUMMARY REPORT. Brik Zivkovich, M.S., EIT Graduate Engineering Intern, Master Planning Program
 SUMMARY REPORT BY: Holly Piza, P.E. Project Manager, Master Planning Program Brik Zivkovich, M.S., EIT Graduate Engineering Intern, Master Planning Program SUBJECT: Water quality summary report of the
Climate Change in Europe s Cities
 in Europe s Cities Copernicus for Climate Adaptation and Mitigation Copernicus EU Copernicus EU Copernicus EU www.copernicus.eu WHY IS COPERNICUS NEEDED IN EUROPE S CITIES? Climate Copernicus Climate Service
CE QUAL W2 Model Applications to Examine the Effects of Operations on Fish Habitat in Lake Murray
 CE QUAL W2 Model Applications to Examine the Effects of Operations on Fish Habitat in Lake Murray Meeting to Report on Preliminary Results Andy Sawyer and Jim Ruane, REMI May 22, 2007 Relicensing Issues
Beneficial Management Practices to Reduce the Risk of Surface Water Contamination from Manured Agricultural Fields in South Coastal British Columbia
 Beneficial Management Practices to Reduce the Risk of Surface Water Contamination from Manured Agricultural Fields in South Coastal British Columbia Laurens J.P. van Vliet Agriculture and Agri-Food Canada
EMPACT Beach Water Quality Study
 EMPACT Beach Water Quality Study Madison Department of Public Health 2002-2003 2003 Wisconsin State Laboratory of Hygiene U.S. Geological Survey US EPA EMPACT PROGRAM Environmental Monitoring for Public
Rocky River Monitoring Study, Division of Water Resources- Water Sciences Intensive Survey Branch
 Rocky River Monitoring Study, 2016 Division of Water Resources- Water Sciences Intensive Survey Branch Thank You Tim Sweeny Town of Siler City Area of Study 6.7 mile stretch of River located in Chatham
Table 1: QA/QC Data Comparison Rankings for deployment between June 24 and July 21, 2009.
 General The Water Resources Management Division staff monitors the real-time web page on a daily basis. This monthly deployment report interprets the data from a water quality monitoring station on Minipi
The Dissolved Oxygen Status of the Inland Bays : First Draft. Chris Bason Delaware Center for the Inland Bays CIB STAC July 16, 2010
 The Dissolved Oxygen Status of the Inland Bays 1998 2009: First Draft Chris Bason Delaware Center for the Inland Bays CIB STAC July 16, 2010 Importance A primary impairment under the Clean Water Act --
Impact analysis of the decline of agricultural land-use on flood risk and material flux in hilly and mountainous watersheds
 Proc. IAHS, 370, 39 44, 2015 doi:10.5194/piahs-370-39-2015 Author(s) 2015. CC Attribution 3.0 License. Impact analysis of the decline of agricultural land-use on flood risk and material flux in hilly and
Rules of the South Florida Water Management District EVERGLADES PROGRAM Chapter 40E-63, F.A.C.
 Rules of the South Florida Water Management District EVERGLADES PROGRAM Chapter 40E-63, F.A.C. Samira Daroub BMP Training April 11, 2013 Everglades Research and Education Center Outline The Everglades
Waterford River Kilbride NF02ZM0009 December 2013 to January 2014
 Waterford River @ Kilbride NF02ZM0009 December 2013 to January 2014 Government of Newfoundland & Labrador Department of Environment and Conservation Real Time Water Quality Monthly Report Waterford River
Continuous, Real-time Nutrient Data and Regression Models Valuable Information for Monitoring Aquatic Ecosystem Restoration
 Continuous, Real-time Nutrient Data and Regression Models Valuable Information for Monitoring Aquatic Ecosystem Restoration Teresa Rasmussen, Jennifer Graham, Mandy Stone, US Geological Survey, Kansas
Improving the River Petteril Online Story Map featuring a case study in catchment management
 Improving the River Petteril Online Story Map featuring a case study in catchment management Summary The Improving the River Petteril story map presents a catchment management case study for the River
Nicholas A. Reckinger. June 11, 2007
 Comparison of Phosphorus Forms at Different Spatial Scales and Assessment of an Area-Weighted P-Index to Multi-Field Watersheds Nicholas A. Reckinger June 11, 2007 Watershed Activities Affect Water Quality
EXECUTIVE SUMMARY LEGISLATIVE REPORT January 2004
 EXECUTIVE SUMMARY LEGISLATIVE REPORT January 4 January, 4 RiverNet Program RIVERNET: Continuous Monitoring of Water Quality in the Neuse River Basin Dr. William J. Showers Dept. of Marine, Earth & Atmospheric
Cover Crops. Why are we interested in these?
 Cover Crops Cover Crops Why are we interested in these? Clive Wood Kings / Frontier To cover --- Introduction. Nutrient capture. Weed reduction Black grass. On farm use / 5 Top cover crops. CAP Reform
SNAMP water research. Topics covered
 SNAMP water research SNAMP water team UC Merced Topics covered Objectives, goals & overview What & why the water component of SNAMP Pre-treatment Observations Water Quality Water Quantity Modeling & Scenarios:
Influences of Land Use during the Puddling Period on Water Balance and Quality in a Rice Farming Area
 IJERD International Journal of Environmental and Rural Development (211) 2 1 Research article erd Influences of Land Use during the Puddling Period on Water Balance and Quality in a Rice Farming Area MOHAMMED
Nutrient distributions and the interaction between coastal wetlands and the nearshore of Lake Ontario
 Nutrient distributions and the interaction between coastal wetlands and the nearshore of Ontario Krista Chomicki and Gary Bowen International Association of Great s Research, 25 Type Durham Region Coastal
Improving runoff water quality from small pork production facilities using vegetative treatment areas
 Improving runoff water quality from small pork production facilities using vegetative treatment areas Texas Water Resources Institute TR-501 March 2017 Kevin Wagner Texas Water Resources Institute Rehanon