MEG Energy. Christina Lake. 2015/2016 Performance Presentation Commercial Scheme Approval No
|
|
|
- Gwen Caldwell
- 6 years ago
- Views:
Transcription

1 MEG Energy Christina Lake MasterProject PowerPoint Regional 2015/2016 Performance Presentation Commercial Scheme Approval No September 6, 2016
2 Disclaimer This presentation is not, and under no circumstances is to be construed to be a prospectus, offering memorandum, advertisement or public offering of any securities of MEG Energy Corp. ( MEG ). Neither the United States Securities and Exchange Commission (the SEC ) nor any other state securities regulator nor any securities regulatory authority in Canada or elsewhere has assessed the merits of MEG s securities or has reviewed or made any determination as to the truthfulness or completeness of the disclosure in this document. Any representation to the contrary is an offence. Recipients of this presentation are not to construe the contents of this presentation as legal, tax or investment advice and recipients should consult their own advisors in this regard. MEG has not registered (and has no current intention to register) its securities under the United States Securities Act of 1933, as amended (the U.S. Securities Act ), or any state securities or blue sky laws and MEG is not registered under the United States Investment Act of 1940, as amended. The securities of MEG may not be offered or sold in the United States or to U.S. persons unless registered under the U.S. Securities Act and applicable state securities laws or an exemption from such registration is available. Without limiting the foregoing, please be advised that certain financial information relating to MEG contained in this presentation was prepared in accordance with IFRS as issued by the International Accounting Standards Board, which differs from generally accepted accounting principles in the United States and elsewhere. Accordingly, financial information included in this document may not be comparable to financial information of United States issuers. The information concerning petroleum reserves and resources appearing in this document was derived from a report of GLJ Petroleum Consultants Ltd. dated effective as of December 31, 2015, which has been prepared in accordance with the Canadian Securities Administrators National Instrument entitled Standards of Disclosure for Oil and Gas Activities ( NI ) at that time. The standards of NI differ from the standards of the SEC. The SEC generally permits U.S. reporting oil and gas companies in their filings with the SEC, to disclose only proved, probable and possible reserves, net of royalties and interests of others. NI , meanwhile, permits disclosure of estimates of contingent resources and reserves on a gross basis. As a consequence, information included in this presentation concerning our reserves and resources may not be comparable to information made by public issuers subject to the reporting and disclosure requirements of the SEC. There are significant differences in the criteria associated with the classification of reserves and contingent resources. Contingent resource estimates involve additional risk, specifically the risk of not achieving commerciality, not applicable to reserves estimates. There is no certainty that it will be commercially viable to produce any portion of the resources. The estimates of reserves, resources and future net revenue from individual properties may not reflect the same confidence level as estimates of reserves, resources and future net revenue for all properties, due to the effects of aggregation. Further information regarding the estimates and classification of MEG s reserves and resources is contained within the Corporation s public disclosure documents on file with Canadian Securities regulatory authorities, and in particular, within MEG s most recently filed annual information form (the AIF ). MEG s public disclosure documents, including the AIF, may be accessed through the SEDAR website ( at MEG s website ( or by contacting MEG s investor relations department. Anticipated netbacks are calculated by adding anticipated revenues and other income and subtracting anticipated royalties, operating costs and transportation costs from such amount. 2
3 Disclosure Advisories Forward-Looking Information This document may contain forward-looking information including but not limited to: expectations of future production, revenues, expenses, cash flow, operating costs, steam-oil ratios, pricing differentials, reliability, profitability and capital investments; estimates of reserves and resources; the anticipated reductions in operating costs as a result of optimization and scalability of certain operations; and the anticipated sources of funding for operations and capital investments. Such forward-looking information is based on management's expectations and assumptions regarding future growth, results of operations, production, future capital and other expenditures, plans for and results of drilling activity, environmental matters, business prospects and opportunities. By its nature, such forward-looking information involves significant known and unknown risks and uncertainties, which could cause actual results to differ materially from those anticipated. These risks include, but are not limited to: risks associated with the oil and gas industry, for example, the securing of adequate supplies and access to markets and transportation infrastructure; the availability of capacity on the electricity transmission grid; the uncertainty of reserve and resource estimates; the uncertainty of estimates and projections relating to production, costs and revenues; health, safety and environmental risks; risks of legislative and regulatory changes to, amongst other things, tax, land use, royalty and environmental laws; assumptions regarding and the volatility of commodity prices and foreign exchange rates; risks and uncertainties associated with securing and maintaining the necessary regulatory approvals and financing to proceed with MEG s future phases and the expansion and/or operation of MEG s projects; risks and uncertainties related to the timing of completion, commissioning, and start-up, of MEG s future phases, expansions and projects; the operational risks and delays in the development, exploration, production, and the capacities and performance associated with MEG's projects; and uncertainties arising in connection with any future disposition of assets. Although MEG believes that the assumptions used in such forward-looking information are reasonable, there can be no assurance that such assumptions will be correct. Accordingly, readers are cautioned that the actual results achieved may vary from the forward-looking information provided herein and that the variations may be material. Readers are also cautioned that the foregoing list of assumptions, risks and factors is not exhaustive. Further information regarding the assumptions and risks inherent in the making of forward-looking statements can be found in MEG s most recently filed AIF, along with MEG's other public disclosure documents. Copies of the AIF and MEG's other public disclosure documents are available through the SEDAR website which is available at The forward-looking information included in this document is expressly qualified in its entirety by the foregoing cautionary statements. Unless otherwise stated, the forward-looking information included in this document is made as of the date of this document and MEG assumes no obligation to update or revise any forward-looking information to reflect new events or circumstances, except as required by law. Market Data This presentation contains statistical data, market research and industry forecasts that were obtained from government or other industry publications and reports or based on estimates derived from such publications and reports and management s knowledge of, and experience in, the markets in which MEG operates. Government and industry publications and reports generally indicate that they have obtained their information from sources believed to be reliable, but do not guarantee the accuracy and completeness of their information. Often, such information is provided subject to specific terms and conditions limiting the liability of the provider, disclaiming any responsibility for such information, and/or limiting a third party s ability to rely on such information. None of the authors of such publications and reports has provided any form of consultation, advice or counsel regarding any aspect of, or is in any way whatsoever associated with, MEG. Further, certain of these organizations are advisors to participants in the oil sands industry, and they may present information in a manner that is more favourable to that industry than would be presented by an independent source. Actual outcomes may vary materially from those forecast in such reports or publications, and the prospect for material variation can be expected to increase as the length of the forecast period increases. While management believes this data to be reliable, market and industry data is subject to variations and cannot be verified due to limits on the availability and reliability of data inputs, the voluntary nature of the data gathering process and other limitations and uncertainties inherent in any market or other survey. Accordingly, the accuracy, currency and completeness of this information cannot be guaranteed. None of MEG or its affiliates has independently verified any of the data from third party sources referred to in this presentation or ascertained the underlying assumptions relied upon by such sources. 3
4 MEG Energy Corp. Meeting Agenda Overview Simon Geoghegan Geosciences Greg Helman Reservoir John Kelly Operations Bill Mazurek Water Scott Rayner Compliance & Environment Mike Robbins Future Plans Sachin Bhardwaj 4
 is a public Calgary-based energy company focused on the development and recovery of")
5 MEG Energy Corp. Who We Are MEG Energy Corp. (MEG) is a public Calgary-based energy company focused on the development and recovery of bitumen and the generation of power in northeast Alberta. 5
 technology to extract bitumen from the oil sands")
6 MEG Energy Corp. Who We Are Established in 1999 Utilize steam-assisted gravity drainage (SAGD) technology to extract bitumen from the oil sands Operating Area Christina Lake Project Phases 2 (includes Phase 1) and 2B 50%-ownership of the Access Pipeline 6
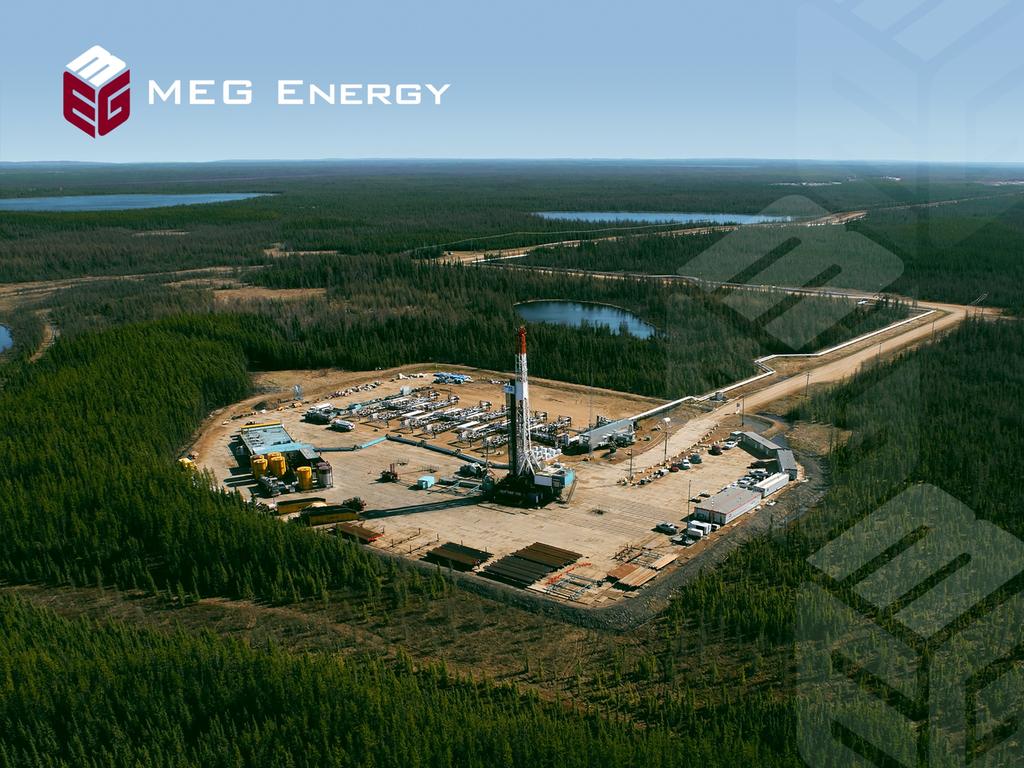
7 Christina Lake Regional Project (CLRP) 7
 An Efficient Technology")
8 Steam-Assisted Gravity Drainage (SAGD) An Efficient Technology 8
9 Christina Lake Regional Project Project history Phase 1 Approved in February 2005 for bitumen production of 477 m 3 /d (3,000 bpd) Sustained steaming commenced March 2008 Phase 2 Approved in March 2007 for total production of 3,975 m 3 /d or 25,000 bpd (incremental 3,523 m 3 /d or 22,000 bpd) First steam Q Phase 1/2 pads: A, B, C, D, E, F, V Phase 2B Approved plant expansion to 9,540 m 3 /d or 60,000 bpd (incremental 5,540 m 3 /d or 35,000 bpd) First steam Q Phase 2B pads: M, N, J, K, G, H, P, T, U, AP, AF, AG, AN Phase 3 Approval granted January 2012, expansion to 33,390 m 3 /d or 210,000 bpd 9
10 Christina Lake Regional Project Operating Highlights 2015 bitumen production from both Phase 2 and 2B facilities averaged 80,025 bpd Q bitumen production of 76,640 bpd including scheduled plant turnaround Fieldwide SOR of 2.4 Expanded implementation of emsagp 10


11 Christina Lake Regional Project (CLRP) T78 T77 T76 Access Pipeline R7 R6 R5 R4W4 Phase 2/2B CPF Approved Development Area 11
12 CLRP Active Development Area (ADA) Water Disposal Pattern T Pattern V Patterns B-F Water Source PL Water source Pipeline Pattern A Pattern AP Pattern U T77 Drilled SAGD Wells Pattern G Pattern M Pattern AN Pattern H Pattern N Pattern P T76 R6 R5W4 12
13 GEOSCIENCES
14 CLRP Geoscience Review Well and Seismic Data Core hole update 4-D Seismic Update SAGD Drilling update Stratigraphic Framework Geologic Overview Type log Reservoir and Pay Parameters Active Development Area Bitumen Pay Developable pay Isopach map Approved undrilled pattern volumetrics Top and Base pay Structure maps Structure Sections over exploited area Cap Rock Geology Basal Aquifer Net sand Isopach Active Development Area Associated Gas Resources Observation Wells 14

15 Christina Lake Regional Project (CLRP) T78 CLRP Project Area Approved Development Areas Access Pipeline CPF = Central Plant Facility T77 CPF T76 R7 R6 R5 R4W4 15

16 CLRP Wabiskaw / McMurray Cores T78 CLRP Project Area Wabiskaw / McMurray Core T cored wells 86% of all wells are cored T76 R7 R6 R5 R4W4 16
17 CLRP 2016 Stratigraphic Test Wells T78 CLRP Project Area 2016 Wells T77 Over the 2016 reporting period 4 coreholes were drilled. No special core analysis was done. No GeoMechanical analysis was done. No reservoir Fracture pressure or Caprock Integrity tests were done. T76 R7 R6 R5 R4W4 17

 T77 T76 R7 R6 R5")
18 CLRP 3D Seismic T78 CLRP Project Area 3D Seismic Time Lapse 3D (2014) Time Lapse 3D (2016) T77 T76 R7 R6 R5 R4W4 18


19 CLRP 4D Seismic MEG OSL Time Lapse 3D (2016) Shot Point Receivers T77 R5W4 Seismic was shot in JanuaryFebruary 2016 over a period of 7days. The shooting parameters involved 70m x 90m shotreceiver line spacing and 30m receiver and shot intervals. On the active surface pads, Vibroseis was used in lieu of the standard Dynamite source. 19

 and seismic shot in January")

20 4D Seismic Survey Paleozoic Time Delay Map MEG OSL Central Plant Time delay of the Paleozoic time structure from Seismic shot before production (2007) and seismic shot in January 2016 T77 Time Delay is directly related to the level of steam chamber development High R5W4 Low 20
 Pattern P T76 R6")
21 CLRP Active Development Area (ADA) Water Disposal Pattern T Pattern U Pattern V Patterns B-F Water Source PL Water source Pipeline Recent Infill Drilling Recent SAGD Redrills Pattern A Pattern AP T77 Pattern G Pattern AN Pattern H Pattern M Pattern N 334 horizontal wells (SAGD & Infill wells) Pattern P T76 R6 R5W4 21

22 CLRP: Wabiskaw/McMurray Stratigraphy 1AA/ W4 Wabiskaw Valley 1AC/ W4 Clearwater C mud Clearwater C mud Wabiskaw Marker upper Wabiskaw mud Wabiskaw C Sand Wabiskaw D Shale McMurray A1 McMurray Channel McMurray Channel McMurray Formation Stratigraphic Unit lower Clearwater C upper Wabiskaw Wabiskaw C Wabiskaw D Shale Wabiskaw D Valley McMurray A1 upper McMurray Channel lower McMurray Channel Beaverhill Lake Facies Association offshore mud offshore / lower shoreface mud shoreface sand bay mud bay sand and mud shoreface sand / coal tidal flat / creek sand and mud fluvial / estuarine channel sand and mud carbonate mudstone McMurray stratigraphy after ERCB RGS 2003 Beaverhill Lake 22

23 CLRP: Wabiskaw / McMurray Reference Well 1AE/ W400 Clearwater C Gas Gas bioturbated sandy mud muddy IHS cross stratified sand cross stratified sand shale shale shale bioturbated sandy mud Cap Rock Wabiskaw C Wabiskaw D McMurray muddy IHS mud rip up clasts cross stratified sand SAGD Interval B/W Water Sand Injector Producer BHL 23
24 CLRP: McMurray SAGD Pay Parameters SAGD Pay 10 m continuous pay (defined from cores, images and well logs) R t = Deep Induction Ø density 25% S o (bitumen saturation) 50% gas and coal excluded parameters for S o calculation 24

25 CLRP: Average McMurray Reservoir Properties 25
 So 50% (~6 wt% bulk mass oil); Porosity (density) 25%; T77 R6 R5W4 R4 min contour =10m contour interval = 5 m")
26 CLRP ADA Total McMurray SAGD Pay 10 m CLRP Project Area SAGD Patterns T77 SAGD Pay Cutoffs: continuous bitumen pay 10 m (defined by logs, images and core) So 50% (~6 wt% bulk mass oil); Porosity (density) 25%; T77 R6 R5W4 R4 min contour =10m contour interval = 5 m 26
27 CLRP: OBIP Approved Development Areas Pattern AH CLRP Project Area SAGD Patterns Approved Patterns Pattern T Pattern AQ Pattern A Pattern U Pattern V Patterns B-F Pattern L Pattern DB Pattern DC T77 Pattern AP Pattern AQ Pattern DD Pattern AN Pattern AP South Pattern G Pattern H Pattern M Pattern N SAGD Pay Cutoffs: continuous bitumen pay 10 m (defined by logs, images and core) So 50% (~6 wt% bulk mass oil); Porosity (density) 25%; Pattern P T76 R6 Pattern AT Pattern AR R5W4 R4 min contour =10m contour interval = 5 m 27
28 CLRP: OBIP Approved Development Areas 28

29 CLRP ADA Base SAGD Pay Structure CLRP Project Area SAGD Patterns Pattern T Pattern V Patterns B-F Pattern U Pattern A T77 Pattern AP Pattern AN Pattern G Pattern H Pattern M Pattern N Pattern P T76 R6 R5W4 R4 contour interval = 5 m 29

30 CLRP ADA Top SAGD Pay Structure CLRP Project Area SAGD Patterns Pattern T Pattern V Patterns B-F Pattern U Pattern A T77 Pattern AP Pattern AN Pattern G Pattern H Pattern M Pattern N contour interval = 5 m Pattern P T76 R6 R5W4 R4 30
31 CLRP: Cross Sections for scheme area F CLRP Project Area SAGD Patterns Pattern T Pattern AP E E Pattern AN G G F A Pattern V Pattern U Pattern A A D C D Pattern G Pattern H Patterns B-F C B Pattern M Pattern N T77 B Pattern P T76 R6 R5W4 31


32 CLRP: Structural Cross Section A-A A 111/ W4 1AB/ W4 1AA/ W4 A Clearwater C Wabiskaw Marker Cap Rock Wabiskaw C Sand Wabiskaw C Top McMurray non-reservoir lithofacies SAGD pay Water Sand McMurray Formation Injector Producer Stacked Pattern Development (Multiple Pay Intervals) A A 32

33 CLRP: Structural Cross Section B-B B 1AA/ W4 100/ W4 1AA/ W4 B Wabiskaw Marker Wabiskaw C Sand Clearwater C Cap Rock Wabiskaw C non-reservoir lithofacies SAGD pay Water Sand Top McMurray McMurray Formation B Injector Producer B 33

34 CLRP: Structural Cross Section C-C C 1AB/ W4 102/ W4 C Clearwater C Wabiskaw Marker Cap Rock Wabiskaw C Sand Top McMurray Wabiskaw C SAGD pay non-reservoir lithofacies McMurray Formation Water Sand C Injector Producer C 34

35 CLRP: Structural Cross Section D-D D 1AA/ W4 100/ W4 D Clearwater C Wabiskaw Marker Cap Rock Wabiskaw C Sand Top McMurray Wabiskaw C SAGD pay non-reservoir lithofacies McMurray Formation Water Sand D Injector Producer D 35

36 CLRP: Structural Cross Section E-E E 1AA/ W4 102/ W4 E Clearwater C Wabiskaw Marker Cap Rock Wabiskaw C Sand Wabiskaw C Wabiskaw D Wabiskaw D Valley Fill Top McMurray SAGD pay non-reservoir lithofacies McMurray Formation Injector Producer E E 36

37 CLRP: Structural Cross Section F-F F 1AB/ W4 1AA/ W4 F Clearwater C Wabiskaw Marker Cap Rock Wabiskaw C Sand Wabiskaw C Wabiskaw D Wabiskaw D Valley Fill Top McMurray non-reservoir lithofacies SAGD pay non-reservoir lithofacies McMurray Formation Water Sand Water Sand Injector Producer F F 37

38 CLRP: Structural Cross Section G-G G 1AC/ W4 1AE/ W4 100/ W4 G Wabiskaw C Sand Wabiskaw Marker Clearwater C Cap Rock Wabiskaw C Wabiskaw D non-reservoir lithofacies Reservoir currently unexploited Reservoir currently unexploited non-reservoir lithofacies SAGD pay Water Sand Top McMurray non-reservoir lithofacies McMurray Formation G Injector Producer G 38
39 CLRP Lower Clearwater Cap Rock 1AE/ W4 Clearwater C WBSK Mkr mud mud Lower Clearwater Cap Rock WBSK C WBSK D Shale WBSK D McMurray non-reservoir lithofacies Lower Clearwater Cap Rock = 10.9 m thick SAGD Pay Bitumen / Water Contact Water Sand Beaverhill Lake 39

40 CLRP ADA Lower Clearwater Cap Rock CLRP Project Area Drilled SAGD Patterns T77 Active Development Area Average Cap rock Thickness = 10.7 m Minimum Thickness = 8.5 m Maximum Thickness = 12.3 m Thickness in Metres T76 R6 R5W4 R4 40

41 CLRP ADA Basal McMurray Net Water Isopach CLRP Project Area Drilled SAGD Patterns Pattern T Pattern V Patterns B-F T77 Pattern U Pattern A Pattern AP Pattern AN Pattern G Pattern H Pattern M Pattern N Pattern P T76 Contour Interval = 5 m R6 R5W4 R4 41

42 CLRP ADA Associated McMurray Gas Pools MEG OSL Drilled SAGD Patterns Gas Pool in direct or indirect contact with SAGD interval Small gas caps; no repressuring required Depleted gas cap not in direct contact with SAGD interval T77 Low gas cap pressure due to legacy gas production; MEG is repressuring gas cap T76 R6 R5W4 R4 Note: Not all SAGD intervals in the pool wells are directly connected to associated gas 42
43 CLRP ADA OB and Cased Wells MEG OSL Approved Development Area Instrumented OB Wells Non-Instrumented OB wells T77 Christina Lake T76 R6 R5W4 43
44 Well Spacing Pattern Operating Average Spacing Average Spacing Wellpairs Between SAGD Pairs (m) Between SAGD Pair to Infill (m) A B BB + D C + D D-D6-D E + F F - F V G NA H NA J NA K NA M NA N NA T NA U NA AP AF NA AG NA AN P NA TOTAL
45 RESERVOIR
46 CLRP Reservoir Review Wells Schematics Well Integrity Management Workovers Artificial Lift Current Performance Field performance Pattern performance Cased hole logs emsagp update Associated gas cap re-pressuring 46
47 WELLS
48 Well Completions SAGD Injector 13 3/8 Surface Casing 9 5/8 Intermediate Casing 7 Tubing 4.5 Tubing Liner Hanger 3.5 Tubing 7 Slotted Liner Steam injected into both long tubing and short tubing Blanket gas on annulus 48
49 Well Completions SAGD Producer (Gas Lift) 13 3/8 Surface Casing 9 5/8 Intermediate Casing 7 Tubing 4.5 Tubing Bubble Tube 1.25 Gas Lift & Instrument String Liner Hanger 3.5 Tubing 7 Slotted Liner Thermocouples are inside the instrument string to provide temperature measurements at selected locations Bubble tube landed near bottom of well to provide pressure measurement 49
50 Well Completions SAGD Producers (ESP) 13 3/8 Surface Casing 9 5/8 Intermediate Casing 4.5 Tubing Bubble Tube 1.25 Instrument String Liner Hanger Slotted Liner ESP Thermocouples or thermal fibre are inside the instrument string to provide temperature measurements at selected locations Tail Pipe Bubble tube is landed near ESP to provide pressure measurement for SAGD producer 50
51 Well Completions Outflow Control Devices 13 3/8 Surface Casing 9 5/8 Intermediate Casing 7 Tubing 4.5 Tubing Liner Hanger 3.5 Tubing 7 Slotted Liner Consists of several holes placed mid-way of the long tubing to distribute steam at the middle of the well in addition to the heel and toe Current installation are V1I and M4I and results to date have been positive 51
52 Well Completions Inflow Control Devices 13 3/8 Surface Casing 9 5/8 Intermediate Casing 4.5 Tubing Bubble Tube 1.25 Instrument String Liner Hanger Slotted Liner ESP Tail Pipe Upset production port (UPP) typically consists of holes located at the crossover from 4.5 to 3.5 tubing and is always open Inflow control device typically consists of a sliding sleeve with holes that is initially closed and later opened when the well is mature ICD To date, MEG has only utilized ICDs in the production tubing and not on the liner UPP 52
53 Well Completions Infill Producers 13 3/8 Surface Casing 9 5/8 Intermediate Casing 5.5 Tubing Rod String 1.25 Instrument String Liner Hanger Slotted Liner Reciprocating Pump Tail Pipe Thermocouples or thermal fibre are inside the instrument string to provide temperature measurements at selected locations Bottom hole pressure is estimated from fluid level measurement 53
54 Temperature Measurement Have historically relied on four-point thermocouple strings in all SAGD and infill wells due to proven accuracy Currently have installed thermal fibre on V, AP and AN infill wells, AF and P Pad SAGD producers, and recent re-drills on AP and M Pads (AP4P, M3P, M4P, M6P, M9P) Recent fibre installations have demonstrated improved data quality, reliability, and cost, and thermal fibre is expected to be the technology for future pads 54
55 Observation Wells Temperature / Pressure Observation Cased Observation 8 5/8 Surface Casing 4 1/2 Production Casing Thermocouple Bundle Piezometers Thermocouples are landed over expected steam zone Piezometers are placed in areas of geological interest (gas, bitumen, water zones and potential pay breaks) 55
56 Water Source Wells 13 3/8 Surface Casing 9 5/8 Production Casing 4 1/2 Production Tubing ESP 5 1/2 Wire Wrap Screen 56
57 Water Disposal Wells 13 3/8 Surface Casing 9 5/8 Production Casing 7 Production Tubing Isolation Packer 57
58 CLRP Well Integrity Management Well Integrity Program for CLRP Includes: SAGD, Infill, Observation, Gas-Repressure, Core-Holes, Legacy Gas, Source and Disposal Wells The Well Integrity Program includes: Well Integrity Management System (well tracking and monitoring) Targeted selection casing integrity checks and Well Servicing support Casing design and failure mechanism identification Compliance assurance, AER commitments and reporting Inactive Well Compliance Program management 58
59 CLRP Legacy Wells T78 T77 MEG OSL Existing SAGD patterns Type 1B wells (D&A) Type 2B wells (D&C, DC&A) Type 2B wells zone abandoned Type 1B: D&A with non-thermal cement Type 2B: D&C with non-thermal cement T76 R7 R6 R5 R4W4 59
60 Legacy Well Thermal Compatibility Thermal compatibility addressed on a pad by pad basis in conjunction with IDA amendment applications Specific D-20 abandonment applications have been filed and approved for requisite wells within the ADA MEG has developed a thermal compatibility program which has been reviewed by AER staff. The program includes: A detailed assessment of compatibility of existing wellbores within the CLRP project area General abandonment strategies to ensure well integrity thermal development areas Monitoring and surveillance plans 60
61 CLRP Well Workovers Re-drills Issue In-zone isolated liner impairment on AP4P SAGD producer well identified in 2015 Highlights The impairment occurred during the production ramp up following an ESP replacement combined with opening an ICD Four-point thermocouple data did not show that steam temperature was reached, however sand production and damaged instrumentation string occurred Well was successfully re-drilled and put on production Outcomes and Lessons Learned Improved processes implemented for future production ramp up following pump replacements, especially when combined with opening of an ICD as inflow characteristics of the wells may change Well was completed with thermal fibre to improve temperature data resolution 61
62 CLRP Artificial Lift 135 Electric submersible pumps (ESP) in operation Approximately 55% ESPs rated to 250 o C and 45% rated to 220 o C Operating pressures range from 2,100-3,200kPag Design fluid rates m 3 /d Run-time between pulls is days Run-time improvements have been realized by utilizing higher quality equipment where required 42 rod pumps installed in the infill wells Operating pressures range from 2,000-2,500kPag Design fluid rates m 3 /d 62
63 CLRP Well Workovers Re-drills Issue Suspected liner plugging identified on wells at M Pad, leading to the re-drilling of 4 SAGD producers Highlights Wells exhibited high pressure drop across the liner and much lower production rates for the quality of pay All 4 wells were successfully re-drilled and placed on production, and demonstrated significantly improved rates and pressure drop Producer laterals were drilled to improve overall trajectories and were on average approximately 0.5m to 1.5m higher TVD than the original wells At the time of the project, commercially available stimulation fluids did not demonstrate a probability of success and would still require significant expenditure Perforation of plugged slotted liner was estimated to have similar cost to re-drilling but without the high certainty of restoring productivity Outcomes and Lessons Learned Changes made to well cleanout and fluids used during drilling and completions Assessing other underperforming wells with similar characteristics to identify candidates for re-drill or stimulation 63
64 SCHEME PERFORMANCE

65 CLRP Pattern Layout Water Disposal Pattern T Pattern V Patterns B-F Water Source PL Water source Pipeline Pattern A Pattern AP Pattern U T77 Drilled SAGD Wells Pattern G Pattern M Pattern AN Pattern H Pattern N Pattern P T76 R6 R5W4 65
66 CLRP Reservoir Performance First steam into Phase 1 (3 WPs) effectively started in March 2008 First steam into Phase 2 wells started in August 2009 First steam into Phase 2B wells started in Q Wells were started up in stages, dictated by steam availability The combined bitumen production from Phases 1 and 2 reached the design capacity of 3,975 m 3 /d (25,000 bopd) by late April Phase 2B production ramp-up bettered that of Phase 2. Total production from all phases reached 11,340 m 3 /d (71,300 bopd) in Q2 2014, exceeded the combined initial design capacity of 9,539 m 3 /d (60,000 bopd). Production averaged 80,033 bopd in 2015 In Q1 2016, MEG achieved quarterly production of 76,640 bopd, a period which included a scheduled plant turnaround. April production averaged over 75,000 bopd. 66
67 CLRP Production Performance Scheduled Plant Turnaround Phase 1+2+2B Design Capacity Phase 1+2 Design Capacity 77 67
68 CLRP Reservoir Performance (continued) Current steam chamber pressure is between 2,000 and 2,700 kpag for Phases 1 and 2, between 2,100 and 3,450 kpag for Phase 2B. The steam chamber pressure is close to the initial pressure in the basal water zone where bottom water is present. The Phase 1 emsagp pilot was initiated in December 2011, which showed very successful results. In 2013 emsagp was expanded to wells A4, A5, A6 and patterns B, C, D, E and F, and has demonstrated the process to be repeatable on a commercial scale. The SOR of the emsagp wells (36 SAGD WP s and 37 infill wells) averaged 1.8 relative to the SAGD design level of 2.8 in the period, which allowed MEG to utilize the freed up steam to bring more SAGD wells on production. The SOR of emsagp wells has continued to improve year over year. The SOR of CLRP has ranged from 2.2 to 2.6 over the last 12 months and averaged 2.4 with new well start-ups. 68

69 CLRP Performance SOR of All Patterns Phase 2 Start-up Phase 2B Start-up 78 69
, a result of edge or bottom water incursion")
70 CLRP Performance Pattern A emsagp in A4, A5 and A6 Start emsagp Pilot Start A7 and A8 on production 79 Increased water to steam ratio noted recently was mostly from two edge SAGD well pairs (A6 and A8), a result of edge or bottom water incursion 70

71 CLRP Performance Pattern B emsagp of B1 - B6 Start B7 and B8 on production 71
72 CLRP Performance Pattern C emsagp of C1 C6 and D6 Start 72
73 CLRP Performance Pattern D emsagp Start 73

74 CLRP Performance Pattern E emsagp Start 74
75 CLRP Performance Pattern F emsagp Start 75

76 CLRP Performance Pattern V 76

77 CLRP Performance Pattern G Drop in production in 2015 largely due to liner impairment on G4 77

78 CLRP Performance Pattern H 78
79 CLRP Performance Pattern J Drop in production in 2015 largely due to liner impairment on J4 79

80 CLRP Performance Pattern K 80

81 CLRP Performance Pattern M M9P and M10P have very low production due to poor producer inflow, lowering the overall WSR. Both wellpairs operate at low pressure so steam is not considered lost to thief zones 4 producers were redrilled and exhibit improved fluid rates and water recovery, consistent with lower water recovery being a result of poor inflow rather than steam loss to thief zones 81

82 CLRP Performance Pattern N 82

83 CLRP Performance Pattern T 83
84 CLRP Performance Pattern U 84
85 CLRP Performance Pattern AP 85

86 CLRP Performance Pattern AF 86

87 CLRP Performance Pattern AG 87

88 CLRP Performance Pattern AN 88

89 CLRP Performance Pattern P 89

90 CLRP ADA OB and Cased Wells MEG OSL Approved Development Area Instrumented OB Wells Non-Instrumented OB wells T77 Christina Lake T76 R6 R5W4 90


91 OBB1 Logging Results Sandy IHS Before NCG Co-injection ~3 years SAGD After NCG Co-injection ~3 years emsagp Vertical chamber growth through IHS is observed after co-injection of NCG
92 Original Bitumen in Place SAGDable Bitumen In Place Calculate pay height above producer. Add 50m effective drainage length past first and last slots, unless poor reservoir is encountered m Bullnose For blank sections >100m, only include 100m for effective length. Expect to access 50m from either side. Total Bitumen In Place +50m Use full pay height 2 ICP 92
93 Total Bitumen in Place Operating Average Average Average Average Pattern Wellpairs h (m) L (m) Porosity Oil Saturation OBIP (m 3 ) A % 72% 3,815,000 B % 82% 1,371,000 BB + D % 83% 3,199,000 C + D % 75% 3,889,000 D-D6-D % 78% 1,847,000 E + F % 77% 3,278,000 F - F % 78% 2,148,000 V % 72% 3,464,000 G % 71% 1,237,000 H % 72% 1,237,000 J % 76% 4,191,000 K % 75% 3,496,000 M % 75% 7,185,000 N % 80% 6,634,000 T % 81% 3,325,000 U % 80% 2,414,000 AP % 83% 7,393,000 AF % 82% 2,862,000 AG % 77% 1,872,000 AN % 83% 4,940,000 P % 76% 4,655,000 TOTAL ,452,000 Note: h is net Pay: SAGD base to SAGD Top L is Liner length (including blanks) with 50m added to each end (100m total) 93
94 Bitumen Recovery Pattern Operating Average Average Average Average SAGDable Ultimate Cumulative Recovery Wellpairs h (m) L (m) Porosity Oil Saturation BIP (m 3 ) Recovery (m 3 ) Production (m 3 ) (% SAGDable) A % 72% 3,296,000 1,812,800 1,873, % B % 82% 1,246, , , % BB + D % 83% 2,714,000 1,492,700 1,374, % C + D % 75% 3,453,000 1,899,150 2,877, % D-D6-D % 78% 1,622, , , % E + F % 77% 2,915,000 1,603,250 1,760, % F - F % 78% 1,867,000 1,026,850 1,018, % V % 72% 2,970,000 1,633, , % G % 71% 1,025, , , % H % 72% 509, ,950 62, % J % 76% 3,592,000 1,975, , % K % 75% 2,996,000 1,647, , % M % 75% 6,469,000 3,557,950 1,069, % N % 81% 5,887,000 3,237, , % T % 81% 2,803,000 1,541, , % U % 80% 2,033,000 1,118, , % AP % 83% 6,439,000 3,541,450 1,278, % AF % 82% 2,278,000 1,252, , % AG % 77% 1,701, , , % AN % 83% 4,187,000 2,302, , % P % 76% 4,655,000 2,560,250 72, % TOTAL ,002,000 33,001,100 17,025, % Note: Production volume and number of operating wellpairs are as of April 2016 h is net pay above the producer L is Liner length (including blanks) with 50m added to each end (100m total) Cumulative production includes associated infill wells 94
95 Update on Enhanced Modified Steam and Gas Push (emsagp)

: Dec. 2011 35% R.F. Pad B (B1-B6): Feb.")
: Aug. 2013 33% R.F. Pad E (E1-E6, F1): Jan.")
: Jan. 2014 36% R.F. Rest of Pad A (A4-A6): April 2014 30% R.")
96 Phase 1 and Phase 2 Pad Layout Pattern B Pattern D Pattern V Pattern F Pattern BB Pattern E Pattern C Pattern A emsagp Rollout: Pad A Pilot (A1-A3): Dec % R.F. Pad B (B1-B6): Feb % R.F. Pad C (C1-C6, D6): July % R.F. Pad D (D1-D5): Aug % R.F. Pad E (E1-E6, F1): Jan % R.F. Pad F (F2-F6): Jan % R.F. Rest of Pad A (A4-A6): April % R.F. 96
97 Phase 1 emsagp (Pilot) Recovery Phase SAGD emsagp Bitumen Production (bbl) 3,048,000 3,065,000 Recovery of SAGDable OOIP (%) SOR in the Phase Note: SAGDable OOIP = 8,799,000 bbls Production of the emsagp phase was to April 30,

98 Bitumen Rates for Phases 1 and 2 98

99 Steam Rates for Phases 1 and 2 99
100 Performance Comparison of Phases 1 and 2 Comparison is facilitated by introducing normalized bitumen production Normalized bitumen rate = bitumen rate / SOIP, where SOIP is SAGDable Oil In Place The normalized rates have the dimension of time -1 and can therefore be compared for projects having different number of wells. Normalized rates are expressed as recovery rates per year 100
101 Performance Comparison of Phases 1 and 2 SAGD emsagp 3.7yrs 4.3yrs The normalized bitumen rates plotted against SAGDable recovery indicate a similar ultimate emsagp bitumen recovery for Phases 1 and 2 emsagp suggests an additional recovery of ~10-12% over SAGD (without infill wells) with a significant reduction in SOR 101

102 Performance Comparison of Phases 1 and 2 SAGD emsagp 3.7yrs 4.3yrs The normalized bitumen rates plotted against SAGDable recovery indicate a similar ultimate emsagp bitumen recovery for Phases 1 and 2 emsagp suggests an additional recovery of ~10-12% over SAGD with an significant reduction in SOR 102
103 emsagp Produced Water to Steam Ratio (WSR) k rw Relative Permeability Chamber evaporation 4 1 Connate Sw at discovery NCG co-injection reduces SOR leading to recovery of some of the retained water 3 Water Saturation in Chamber 2 During SAGD operation, a part of the injected water (condensed steam) is retained in the reservoir as chamber develops (point 1 to point 2). WSR is expected to be <1 When the recovery process is transitioned from SAGD to emsagp, the NCG co-injection reduces the SOR recovering some of the retained water (point 2 to point 3) Partial pressure of steam starts to drop (while total pressure stays constant) and the temperature of the chamber falls. The stored heat is recovered by evaporating the water surrounding the hot reservoir rocks. Chamber becomes progressively drier and water saturation inside the chamber could go below initial connate water saturation (point 3 to point 4). WSR is expected to be >1 For pads that are connected bottom water, it is possible that WSR can be further increased due to bottom water production. Production practice has been put in place to minimize bottom water intrusion by monitoring produced water chemistry 103
104 Conclusions emsagp has been successfully implemented to Phases 1 and 2 After several years of operation, emsagp has demonstrated better performance than SAGD: better recoveries (~10%-12% higher) with significant SOR reductions (~30-50% lower) Steam freed up from emsagp process has been redeployed to new SAGD wells to increase overall production beyond nameplate capacity without installing any new additional steam capacity It appears that further enhancements to emsagp is possible Normalized rate plot for Phases 1 and 2 shows that the bitumen rates and recoveries are trending to the same levels, although steam reductions were more conservative on Phase 2 Given the similarity of Phase 2 and Phase 1 bitumen production, it appears that there is room for further steam optimization and reduction of ISOR in emsagp 104
105 Conclusions From experience at Phase 2, it appears that optimal timing can differ depending on resource For pay that is not encumbered by thief zones (bottom water), the greatest benefit in production and cumulative SOR could be realized by implementing emsagp at or before 30% recovery 105
106 CLRP Gas Cap Re-pressuring
107 Gas Cap Re-pressuring Project Update The AER approval was granted in November 2012 Natural gas injection into 5 wells commenced in June 2013 Total injection to date was 246 e6m3 (~8.7 BCF), with an average injection rate of 104 e3m3/day ( ~3.7mmscf/day) over the period Pressure responses have been observed in all 5 monitoring wells Estimated gas zone pressure above the active SAGD patterns (M & N) was about 2,000 kpag, about the same level as the initial gas cap pressure Performance to date indicates faster pressure increase over the active SAGD area which allows for a lower gas injection rate and volume Plan is to maintain the current pressure on top of the active SAGD area and monitor pressures in gas and SAGD zones closely 107

108 CLRP Gas Cap Re-pressure Scheme (Patterns M & N) 102/13-03 T77 103/05-03 Observation Wells 100/ /06-03 T76 R5W4 108

109 Observation Well Pressure Readings Injection Start The 100/02-33 well is roughly 1,600 meters away from the active injection/sagd area 109

110 Gas Injection 110
111 OPERATIONS
112 Operations Overview Operation Overview sulphur Recovery Unit Incident Bitumen Treatment Water Treatment Steam Generation Power Generation Gas Usage 112

113 CPF Site Plan 113
114 Integrated Distribution/Gathering System 114
115 Water and Steam Process Overview Phase 1 and 2 Produced Water P-1 PW/HLS Feed Skim TK IGF ORF Produced W TK HLS 1 PW FWKO/Treater PAD s Filters Neutralization TK BFW Preheater RAW W TK Steam Generator A HP BFW Pump Source Water Wells Source Water Wells Sludge Recir Pumps HP Steam Generator Inc Steam BFW Preheater BFW Transfer Pumps HP Steam Sep P-1 Primary WAC/ Polisher WAC Primary SAC Steam Generator B Phase 1 Pond HP BFW Pump LP Steam Separator Inc Steam Blowdown Cooler Steam Generator P-1 BFW TK P-1 Treated Water Cooler Polisher WAC BFW Tank Inc Steam BFW TK P-2 HP Steam Sep Steam Generator P-2 Glycol Glycol Process Ponds 1 LP Steam Sep P1 Disposal TK HP BFW Pumps BFW LP Steam Condenser LP BFW Pumps LP BD Cooler BD Disposal/Glycol Disposal Well Disposal Well HRSG Condensate Pot TITLE Water Treatment Sketch Rev 1 MEG ENERGY Calgary, AB DATE 6/4/2013 FULL FILENAME SCALE REVISED 6/10/2013 NTS REV IM SHEET 1 OF 1 115
116 Water and Steam Process Overview Phase 2B Magox Lime Produced Water From IGF Oil Removal Filter Vessel A-C Produced Water Tank Dilution/Service Pumps A/B Dilution Water Cooler Hot Lime Softener Feed Pumps A/B PW/HLS Feed Exchanger A-F Hot Lime Softener Vessel Hot Lime Softener Sludge Recirculation Pumps A/B After Filter Feed Pumps A/B Dirty Back Transfer Pumps Wash Tank A/B Phase 2 Process Pond A/B After Filters A-G McMurray Source Water Wells WACs A-F Acid Scrubber Hot Lime Softener Caustic Pumps A/B Acid Regen Pump A/B Caustic Regen Pump A/B Acid Tank Caustic Tank Oil Removal Filter Dirty Backwash/ De-sand Tank Oil Removal Filter Dirty Backwash Transfer Pumps A/B To Skim Tank Sludge Holding Tank To Sludge Treatment Facility Hot Lime Softener Sludge Transfer Pumps A/B Regen Waste Disposal Tank Neutralization Pumps A/B Neutralization Tank LP BFW Pumps A/B/C Phase 2B Boiler Feed Water Tank Phase 2 Boiler Feed Water Tank HP Steam Separator Pads Steam Generators A-D HP BFW Pumps A-C BFW Condenser HP Steam Separator Disposal Water Filters A/B Disposal Booster Pumps A/B Water Disposal Pumps 2B-P-271A/B Phase 2B Disposal Water Wells A/B Phase 2 Disposal Water Wells A/B Heat Recovery Steam Generator Glycol Exchangers A/B Glycol Condenser Produced Gas Exchanger Disposal Water Tank MP Steam Separator Regen Waste Filters A/B Regen Waste Disposal Pumps A/B Regen Waste Disposal Booster Pumps A/B Fuel Gas Coalescer TITLE Emulsion Exchanger Glycol Blowdown Exchangers A/B Glycol Blowdown Exchangers A/B DRAWN BY Phase 2B Water Treatment MEG ENERGY Calgary, AB FULL FILENAME T:\OPTIMIZATION ENGINEERING\COPY (1) OF PH. 2B WATER TREATMENT AND DEOILING AER PRESENTATION.VSD REVISED 6/2/2014 DATE 5/23/2014 SCALE NTS REV 1 SHEET 1 OF 1 116
117 Oil Treatment Overview Phase 1 and 2 PAD s Glycol Sales Oil Exchangers Treater A Inlet Separator Emulsion Exchangers A/B/C/D Glycol Glycol Exchanger Free Water Knockout P-2 Sales Oil Transfer Pumps Produced Water Tank Treater B Glycol Emulsion Exchangers Produced Water Exchanger A/B/C Skim Tank Induced Gas Flotation ORF Diluent Tank Diluent Pump P-2 Off Spec Tank Diluent Pump P-1 Glycol Sales Oil Exchanger Inlet Separator P-1 Emulsion Exchanger Free Water Knockout/Treater P-1 Disposal Water Wells A/B/C Glycol Produced Water Exchanger Skim Tank Induced Gas Flotation Slop Oil Tank Sales Oil Tank A/B TITLE Deoiling Sketch Rev 1 MEG ENERGY Calgary, AB DATE 6/4/2013 FULL FILENAME W:\OPERATION\ERCB PRESENTATION\WATER TREATMENT AND DEOILING SKETCH REV 2.VSD SCALE REVISED 6/4/2013 NTS REV IM SHEET 1 OF 1 117
118 Oil Treatment Overview Phase 2B PAD s Emulsion Exchanger 2B-E-101 Glycol Exchanger 2B-E-102 Produced Gas Separator 2B-V-103 Treater 2B-V-107A/B Diluent Recovery Exchanger 2B-E-144 Sales Oil Exchanger 2B-E-111 A/B/C/D/E/F Diluent Recovery Separator 2B-V-145 Recovered Diluent Pump 2B-P-146A/B Inlet Separator 2B-V-100 Emulsion Exchanger 2B-E-104 Glycol Exchanger 2B-E-105 Free Water Knockout 2B-V-106A/B Sales Oil Transfer Pump 2B-P-110A/B/C Produced Water Tank 2-T-134 Emulsion Transfer Pump 2B-P-123 A/B/C Emulsion Exchanger 2B-E-109 A/B/C/D/E/F Produced Water Exchanger 2-E-112 A/B/C/D/E/F Produced Water Exchanger 2B-E-143A/B Skim Tank 2B-T-113 Induced Gas Flotation 2B-V-115 Oil Removal Filter 2B-F-131 A/B/C De-sand Pump 2B-P-121 Produced Water Transfer Pump 2B-P-120A/B Hydrocarbon Condensate Pump 2B-555A/B Vapour Recovery Unit Discharge Separator 2B-V-538 Vapour Recovery Unit Ring Fluid Cooler 2B-E-528A/B Induced Gas Flotation Froth Pump 2B-P-117A/B Oil Removal Filter Dirty Backwash Transfer Pump 2B-P-133A/B Oil Removal Filter Dirty Backwash/ De-Sand Tank 2B-T-132 Diluent Pump 2B-P-403A/B/C Diluent Tank 2B-T-402 Liquid Ring Vapour Recovery Unit Compressor 2B-K-509A/B Bottoms Pump 2B-P-404A/B Sales Oil Tank 2B-T-400A/B/C Slop Tank 1-T-405 Off Spec Tank 2-T-405 DRAWN BY TITLE Phase 2B Oil Treatment MEG ENERGY Calgary, AB FULL FILENAME T:\OPTIMIZATION ENGINEERING\COPY (1) OF PH. 2B WATER TREATMENT AND DEOILING AER PRESENTATION.VSD REVISED 6/4/2013 DATE 6/4/2013 SCALE NTS REV 1 SHEET 1 OF 1 118
119 Additions/Modifications No significant additions or modifications have been made in

120 CLRP Production Performance Scheduled Plant Turnaround Phase 1+2+2B Design Capacity Phase 1+2 Design Capacity
121 Facility Performance: Sulphur Recovery Unit Incident Summary Liquid level in the spent scavenger tank was lowered below the electric immersion heater during a routine tank offloading operation. The immersion heater coils rapidly heated to above the auto ignition temperature of the tank contents resulting in an internal fire and explosion. Unit was offline for approximately seven weeks for investigation and repair. Sulphur recovery rate was ramped back to 70% and the unit was tested at various flows and pressures. 121
122 Facility Performance: Sulphur Recovery Unit Incident Summary (continued) A number of changes were made to the design including: Installation of a nitrogen blanketing system. Change to an external source of heat (tank tracing). Installation of a flame arrestor on the tank vent. Addition of low level alarms/trips. MEG is completing a root cause analysis with the engineering contractor and implementing changes to the design process to reduce the likelihood of similar issues. For more details, refer to AER Incident Investigation FIS#
123 Facility Performance: Bitumen Treatment Performance over original design primarily due to operation with naphtha diluent and equipment design factors. 123
124 Facility Performance: Bitumen Treatment Successes Implemented various debottlenecking projects to increase capacity and enhance the reliability of the Phase 2B plant. Performed capacity testing in both Phase 2 and Phase 2B to establish plant capacity and identify bottlenecks. Continue skimming and fluid management strategy to reduce trucking. Issues Being Addressed Produced water exchanger fouling. Skim fluid management in Phase 2B. 124
125 Facility Performance: Bitumen Treatment Future Actions Continue to implement plant capacity testing for possible future operating scenarios. Continued optimization of slop oil treating and reduction initiatives. 125
126 Facility Performance: Water Treatment 126
127 Facility Performance: Water Treatment Successes Continue recycling high blowdown volumes. Saline water use. Implemented alternate steam generator internal treatment chemical. Mono media in after filters. Issues Being Addressed Examining impact of boiler feed water quality parameters on steam generator reliability. Optimization of water treating chemical usage. ph trials in HLS to minimize free OH concentration. Saline water system corrosion in plant being addressed with monitoring and alternate materials. 127
128 Facility Performance: Water Treatment Future Actions Optimize the use of blowdown recycle with saline water usage to reduce contaminant recycle to BFW. Examine alternate methods of monitoring HLS ph. 128
129 Facility Performance: Steam Generation 129
130 Facility Performance: Steam Generation Successes Stable operation throughout the year Successfully completed tube repairs on both Phase 2 and Phase 2B HRSGs. Implemented more detailed steam generator availability and utilization tracking. Addressed root cause of HRSG relief valve leaking. Issues Being Addressed Testing overall HP steam system control philosophy. Tube corrosion issues in Phase 2 and Phase 2B HRSGs. 130
131 Facility Operations: Steam Generation Future Actions ICP (Inductively Coupled Plasma) testing used to track ion transport through the steam generators. Continue to implement overall HP steam distribution control philosophy. Continue monitoring of steam generator tube corrosion. Examine methods for online cleaning of steam generators. 131

132 Facility Performance: Power Generation 132
133 Facility Performance: Power Generation 133
134 Facility Performance: Power Generation Successes Stable operation throughout the year. Testing completed on Phase 2B emergency generator. Issues Being Addressed No significant issues. 134

135 Facility Performance: Gas Usage 135
136 Facility Performance: Gas Usage 136
137 Facility Measurement Well Tests Well tests used to determine bitumen and water production rates for each well Pads are equipped with test separators Each production well receives 1 testing hour per 40 hours in operation Test durations shall be optimized to obtain as many representative production well tests as possible for each month Reservoir GOR = 5; Gas Proration Factor = 1 Water cuts via in-line meters or spot samples with manual S&W measurement Examining alternative S&W method using emulsion density Field Steam Measurement Electronic diagnostics on smart vortex steam meters (Rosemount 8800D) have improved safe operations and reduced O&M costs. 137
138 Facility Measurement Facility Gas Balance >5% Switch to Gas-Oil Ratio January 2016 Improve accuracy of solution gas reporting to account for NCG returns Petrinex limitations to entering negative values and alerts on produced gas to flare Alternative method of reporting gas balances and solution gas to flare is being examined. Achieve facility gas balance <5% Accuracy of solution gas Work within Petrinex 138

139 MEG Energy WATER Master PowerPoint
140 Water Management Water Use Intensity, Volumes and Recycle Water Source Water Disposal Water Use Optimization 140

141 CLRP Water Use Intensity 141
 Plant Turnaround Produced Water 142")
142 Monthly Water Volumes Reporting Year Calendar Year Plant Turnaround Disposal Non-Saline Water (CLW) Plant Turnaround Produced Water 142
143 Water Recycle and D81 Limits Calendar Year Reporting Year 9.78% 8.83% 9.45% 8.28% D81 Compliant in
144 Produced Water to Steam Injected Ratio Plant Turnaround Plant Turnaround Reporting Year (0.99) Calendar Year (0.98) 144
145 CLRP Source Water Well Locations W4 CLWA Source Pad 1F1/ W4/00 (CLWA Source Well; Active) 1F1/ W4/00 (CLWA Source Well; Active) W4 CLWA/McM Source Pad 1F1/ W4/00 (McM Saline Source Well; Active) 1F1/ W4/00 (McM Saline Source Well; Active) 1F2/ W4/00 (CLWA Source Well; Active) 1F1/ W4/00 (CLWA Source Well; Active) W4 CLWA Source Pad 1F1/ W4/00 (CLWA Source Well; Active) 1W0/ W4/00 (CLWA Source Well; Active) 1F1/ W4/00 (CLWA Source Well; Active) W4 CLWA Source Pad 1F1/ W4/00 (CLWA Source Well; Active) 1F1/ W4/00 (CLWA Source Well; Active) 1F2/ W4/00 (CLWA Source Well; Active) W4 CLWA Source Pad 1F1/ W4/00 (CLWA Source Well; Future) 1F1/ W4/00 (CLWA Source Well; Future) - 10 active Clearwater non-saline source wells - 2 active McMurray saline source well 145
 McMurray Saline Wells Plant Turnaround Clearwater Non-Saline Wells")
146 Source Well Production Reporting Year (1.7MM m 3 ) Calendar Year (1.8 MM m 3 ) McMurray Saline Wells Plant Turnaround Clearwater Non-Saline Wells Plant Turnaround 146
147 Source Water Management Saline McMurray groundwater production ongoing since November 2013 System outage between August 2015 and February 2016 due to aqueous CO 2 corrosion. System back on-line. Non-saline Clearwater A and Ethel Lake groundwater production and pressure monitored in accordance with Water Act licenses Ethel Lake, Clearwater and McMurray aquifers are responding to pumping as expected 147
148 CLRP McMurray Disposal Wells 100/ W4M (Active) 102/ W4M (Active) 103/ W4M (Active) 100/ W4M (Active) (blowdown) Disposal pipelines 100/ W4M (Active) (regeneration) - 5 active McMurray disposal wells ERCB Approval No Maximum WHIP 4,230 kpag 148

 100/11-29 100/09-29")
149 Disposal Summary Calendar Year (1.1MM m 3 ) Reporting Year (1.2MM m 3 ) 100/ / /
150 Wellhead Injection Pressures *100/ W4/00 well on vacuum during operation 150
151 Disposal Temperatures 151

152 Basal McMurray Water Sand Pressure Monitoring 152
153 Water Use Optimization MEG continues to optimize blowdown recycle (exceeding design and adjusting to operational limitations) Saline water use (McMurray) ongoing since November MEG plans to continue to utilize saline water for make-up. Technology advancement to reduce SOR (emsagp) Blowdown evaporator planned to further improve water recycle capabilities 153

154 MEG Energy COMPLIANCE & ENVIRONMENT Master PowerPoint
155 Compliance & Environment Reporting Year Highlights Our Monitoring Approach Sulphur Production and Removal Greenhouse Gas Management Compliance Summary Reclamation 155

156 MEG s Extensive Monitoring Detecting any changes that may occur due to our developments Air Chemical analysis and flow rates for all fuel streams and stack emissions. We also monitor ambient air quality around our facilities. Groundwater Check water quantities and quality. This includes our groundwater use as well as leak detection systems for our recycling ponds, waste management facility and tank farms. Regional Monitoring MEG participates in a number of regional monitoring initiatives and groups such as the Alberta Biodiversity Monitoring Institute, the Wood Buffalo Environmental Association, and the new Alberta, Canada, Joint Oil Sands Monitoring program. Soil Soil analysis and laboratory testing for any chemical changes or contaminations Surface Water/Wetlands Monitor surface water quantity and quality in nearby water bodies and watercourses Wildlife Winter tracking, monitoring wildlife corridors using remote cameras, and employee wildlife sighting cards Vegetation Monitor species composition and abundance 156
157 Other Environmental Initiatives MEG also participates in the following environmental initiatives: Industrial Footprint Reduction Options Group (ifrog) University of Alberta led research collaboration focused on enhancing construction and wetlands reclamation practices in boreal Alberta Regional Industry Caribou Collaboration (RICC/COSIA)- A group of companies from the oil sands and forestry sectors collaborating with the Government of Alberta and other institutions to address caribou conservation and recovery in NE Alberta. This program is a multi-pronged strategy comprised of 4 pillars: (i) research on caribou, predators and their habitats, (ii) coordinated footprint management, (iii) site-specific assessment of wildlife and vegetation responses to reclamation treatments on linear features, and (iv) broad-scaled, active adaptive management study design (treatment vs control) across large areas. Faster Forests (COSIA)- The Faster Forests program is a reclamation research collaboration amongst seven oil & gas operators designed to identify reclamation techniques which can accelerate re-vegetation of sites disturbed by industry exploration activity. Wood Buffalo Environmental Association (WBEA)- WBEA monitors the environment of the Regional Municipality of Wood Buffalo in north-eastern Alberta 157
158 Sulphur Production and Removal Sulphur Recovery Unit (SRU) Scavenger Tank Incident Incident occurred in a tank associated with CLRP SRU on March 3 leaving the SRU non-operational for approximately 7 weeks. AER issued an Enforcement Order requiring MEG to submit a repair and interim operating plan. Resulted in <70% recovery for Q SRU start up occurred on April 21. Alberta Ambient Air Quality Objectives (AAAQO) and Lower Athabasca Regional Plan (LARP) levels were not exceeded during the interim operating period. AER Incident investigation closed on April 15, Final incident report submitted Q

159 Daily Inlet Sulphur Average inlet sulphur surpassed 1 t/d in 2014 triggering scheme sulphur recovery requirements 159
160 Sulphur Removal Inlet Sulphur (t/d) Recovery (%) Apr-15 May-15 Jun-15 Jul-15 Aug-15 Sep-15 Oct-15 Nov-15 Dec-15 Jan-16 Feb-16 Mar-16 Apr-16 Quarterly Average Inlet Sulphur Quarterly Average Recovery
161 SO 2 Emissions Plant Turnaround SRU Resolved S02 Emissions (t/d) SRU Incident 0.00 Apr-15 May-15 Jun-15 Jul-15 Aug-15 Sep-15 Oct-15 Nov-15 Dec-15 Jan-16 Feb-16 Mar-16 Apr-16 EPEA Approval Limit S02 Emissions 90-Day Rolling Average SO2 161
, use of co-generation technology for steam generation, and ongoing reservoir efficiency technologies")
162 Greenhouse Gas (GHG) Management Reporting Year Calendar Year MEG CLRP continues to produce one of the lowest net GHG intensity barrels in the industry. GHG performance is attributed to reservoir performance (low SOR s), use of co-generation technology for steam generation, and ongoing reservoir efficiency technologies (ie. emsagp). 162
163 Compliance Summary Regulatory Inspections and Audits Two satisfactory AER drilling inspections occurred on January 7, 2015 and January 25, 2015 to ensure compliance with Directive 037. Satisfactory pipeline inspection on January 14, 2015 Satisfactory AER Manual 001 facility inspection at CLRP on February 24, 2015 AER Inspection and site tour of CLRP project on July 22, 2015 to ensure compliance with soil conservation and reclamation requirements of aspects of EPEA approval. Satisfactory AER Manual 001 inspection of SAGD Facility and wellpads February 24, Satisfactory inspection of SRU facility, reconstruction and remediation May 29,
164 Compliance Summary Self-Disclosures & Non-Compliances MEG reported 3 scheme related self-disclosures to the AER during the reporting period: February 15, 2016: Process fluid leak into Storm Pond. February 18, 2016: Phase 2 utility water tank containment deficiency. March 3, 2016: SRU spent scavenger storage tank fire. On April 1, 2016 MEG received an Enforcement Order under EPEA related to March 3 SRU tank fire. The AER issued an Enforcement Order acknowledging the SRU outage and, as a result, potential for daily emissions limit exceedances. The order required MEG to submit an Interim Operating and Repair Plan for operation and repair of the facility. The AER temporarily suspended the daily sulphur emission limit of 2.0 t/day during the period of the enforcement order. During the repair period, there were no exceedances of Alberta Ambient Air Quality Objectives or LARP air quality management triggers. MEG has a robust process for monitoring and internally reporting its inlet sulphur rates, sulphur recovery rates and SO 2 emissions. MEG will continue to refine this system to ensure compliance with its EPEA limits. MEG is currently working to expand sulphur capacity to provide additional operating flexibility in the event of an outage. 164
165 Compliance Summary MEG reported 5 EPEA approval contraventions to the AER during the reporting period: August 20, 2015: Continuous Emissions Monitoring System (CEMS) Non- Compliance Missed 90% uptime requirement September 20, 2015: Flare Outage Non-Compliance Phase 2 HP flare outage. October 4, 2015: Continuous Emissions Monitoring System (CEMS) Non- Compliance Late submission of the August 2015 electronic CEMS data file March 19-21, 2016: Daily sulphur dioxide limit Non-Compliance Exceedance of the daily sulphur dioxide limit on 3 days. 165
166 Ambient Air Quality Monitoring Continuous Ambient Air Monitoring Trailer and Passive Sampling MEG employed the use of a continuous ambient air monitoring trailer from July to December 2015 for phases 1, 2 and 2B as required by our approval. Four passive monitors are installed around the CLRP site for the measurement of H 2 S and SO 2 with readings taken on a monthly basis. No ambient air contraventions were reported in Two reported exceedances of EPEA sulphur emissions limits in March 2016 related to SRU fire. 166
167 Ambient Air Quality Monitoring Continuous Monitoring Results Maximum Reading (ppbv) Month of Maximum Reading Limit (ppbv) SO March H2S 3.3 February Concentration (ppbv) Maximum One Hour Ground-Level Concentration Apr-15 May-15 Jun-15 Jul-15 Aug-15 Sep-15 Oct-15 Nov-15 Dec-15 Jan-16 Feb-16 Mar-16 Apr-16 SO2 There were no exceedances of Ambient Air Quality Objectives during the reporting period. As required by the terms and conditions of the EPEA approval, MEG is required to assess ambient air quality with a continuous monitoring station for six months per year. MEG had a 3 rd party operated continuous monitoring station at the facility at the time of the SRU incident and for the duration of the SRU outage. In addition, MEG was assessing potential impacts to regional air quality using available data from the Wood Buffalo Environmental Association (WBEA) trailer at Conklin Lookout. During this period, no exceedances of AAAQO or LARP regional management triggers were recorded at either monitoring location. 167 H2S


168 Ambient Air Quality Monitoring Passives Sampling Results 168
169 Gas Usage Calendar Year Reporting Year Overall gas conservation >99% MEG reported 26 flaring and 0 venting notifications to the AER from April to December 2015 including exceedances and outages. MEG reported 8 flaring and 0 venting notifications to the AER from January to April in 2016 including exceedances and outages. 169
170 Conservation & Reclamation Reporting Year Highlights Wetland Reclamation Trial Program Completed planting of the trial site. Completed first vegetation survey of site. Borrow Pit 31 Completed planting of Northern portion of borrow pit to prepare for closure and reclamation certification. Ongoing OSE Reclamation and Assessment Program Ongoing research and monitoring programs Woodland Caribou Mitigation and Monitoring Program Canadian Oil Sands Innovation Alliance Faster Forest Program Rare Plant Mitigation and Monitoring 170
171 OSE Reclamation Summary January to December 2015: Reclamation Certificates Submitted for: CLRP CLRP CLRP Jackfish Kirby Thornbury Reclamation Certificates Received: May River May River Jackfish January to April 2016: Reclamation Certificates Submitted for: CLRP Duncan May River May River
172 Conservation & Reclamation Linear Disturbance Deactivation As required by MEG s EPEA Caribou Mitigation and Monitoring Plan, MEG initiated a project to perform linear restoration activities in townships and W4M in the winter of The work was completed in partnership with the Regional Industry Caribou Collaboration (RICC). The project occurred from February 10 28, 2016 and a total of 12.7 km of linear features were treated. The resulting total habitat restored, accounting for the 500 meter buffer, is about 600 hectares. 172
173 Compliance To the best of MEG s knowledge, the Christina Lake Regional Project is in compliance with all conditions and regulatory requirements related to Approval No

174 MEG Energy CLRP Master PowerPoint FUTURE PLANS
175 Regulatory Activity April April 2016 Various Directive 56 licenses and amendments for well pads and field facilities Scheme pattern amendments for pads AR, AT, L Expansion of NCG Co-Injection on Pads A through F and V April April 2017 emsagp applications for G, H, J, K, T, U, AF and AG patterns Application for emvapex pilot in June 2016 Off-spec fluid injection project Q
176 CLRP Future Plans Continued development of emsagp within Active Development Area Ongoing progress of brownfield development within existing facility footprint Ongoing pattern addition within CLRP development area Ongoing resource assessment 176


177 CLRP Future Development T78 CLRP Project Area Approved SAGD Patterns Planned Pattern Additions Central Plant Access pipeline T77 T76 R7 R6 R5 R4W4 177

178 CLRP Future Development T78 CLRP Project Area Approved SAGD Patterns Planned Pattern Additions Central plant Core locations Access pipeline T77 T76 R7 R6 R5 R4W4 178

179 Questions and Comments
MEG Energy. Christina Lake. 2016/2017 Performance Presentation Commercial Scheme Approval No
 MEG Energy Christina Lake MasterProject PowerPoint Regional 2016/2017 Performance Presentation Commercial Scheme Approval No. 10773 June 13, 2017 Disclaimer This presentation is not, and under no circumstances
JAPAN CANADA OIL SANDS LTD. HANGINGSTONE DEMO PROJECT 2004 Presented on Monday, March 7, 2005 Presentation Outline
 Thermal In-Situ Scheme Progress Report JAPAN CANADA OIL SANDS LTD. HANGINGSTONE DEMO PROJECT 2004 Presented on Monday, March 7, 2005 Presentation Outline 1. Introduction Project Background, Activity Summary
Examining Reservoir Water Retention During SAGD. Thursday January 31 st, 2013
 Examining Reservoir Water Retention During SAGD Thursday January 31 st, 2013 Forward-looking information and advisories This presentation contains "forward-looking information" within the meaning of applicable
Progressing C-SAGD recovery of bitumen from the Grosmont D reservoir
 Progressing C-SAGD recovery of bitumen from the Grosmont D reservoir LARICINA ENERGY Steve Brand P. Eng. WHOC15-280 Organized by: Outline Project overview 1D experience and knowledge gained Early cycle
Seal Main HCSS Pilot Subsurface Review
 Seal Main HCSS Pilot Subsurface Review Subsurface Agenda 1. Background 2. Geology 3. Drilling and Completions 4. Artificial Lift 5. Well Instrumentation 6. 4D Seismic 7. Scheme Performance 8. Future Plans
January 2011 to September 2012 Kirby ERCB Directive 54 Annual Performance Presentation
 January 2011 to September 2012 Kirby ERCB Directive 54 Annual Performance Presentation September 26, 2012 Premium Value Defined Growth Independent OUTLINE PAGE # Kirby Approval 11475 (South) 5-69 Background
Air injection & displacement for recovery with oil horizontal (AIDROH) project Approval #11618 Performance presentation
 project Approval #11618 Performance presentation") Air injection & displacement for recovery with oil horizontal (AIDROH) project Approval #11618 Performance presentation ERCB offices Calgary February 2013 Advisory This document contains forward-looking
Air injection & displacement for recovery with oil horizontal (AIDROH) project Approval #11618 Performance presentation ERCB offices Calgary February 2013 Advisory This document contains forward-looking
Air injection & displacement for recovery with oil horizontal (AIDROH) project Approval #11618 Performance presentation
 project Approval #11618 Performance presentation") Air injection & displacement for recovery with oil horizontal (AIDROH) project Approval #11618 Performance presentation AER Office Calgary March 2014 Advisory This document contains forward-looking information
Air injection & displacement for recovery with oil horizontal (AIDROH) project Approval #11618 Performance presentation AER Office Calgary March 2014 Advisory This document contains forward-looking information
Pelican Lake SAGD Pilot
 Pelican Lake SAGD Pilot AER Approval 11469B April 16, 2015 Annual Update January 1, 2014 December 31, 2014 Disclaimer This Cenovus Pelican Lake SAGD Pilot January 1, 2014 to December 31, 2014 Update (
2018 Directive 054 Performance Presentation
 2018 Directive 054 Performance Presentation Seal Scheme Approval No. 11320F September 2018 Agenda Subsurface 1. Overview 2. Geology / Geoscience 3. Drilling and Completions 4. Scheme Performance 5. Injection
Cenovus EnCAID approval #10440J Performance presentation
 Cenovus EnCAID approval #10440J Performance presentation Claire Hong Staff Production/Completion Engineer Dubert Gutierrez Sr. Reservoir Engineer AER offices Calgary February 2015 Advisory This document
Harmon Valley South HCSS Pilot Approval Annual Performance Presentation
 Harmon Valley South HCSS Pilot Approval 11895 Annual Performance Presentation 11-Feb-2015 Subsurface Agenda 1. Background 2. Geology 3. Drilling and Completions 4. Artificial Lift 5. Well Instrumentation
VSD is a commercially proven technology for bitumen recovery that is used worldwide and in Western Canada by other operators.
 RECOVERY PROCESS Section 4.1 APPLICATION FOR APPROVAL OF THE CARMON CREEK PROJECT VOLUME 1: PROJECT DESCRIPTION SELECTED RECOVERY PROCESS 4.1.1 SELECTION BASIS Vertical steam drive (VSD), complemented
Sunshine Oilsands Ltd. BA Code A2TF WEST ELLS SAGD. Scheme No E AER In Situ Performance Presentation 2017
 Sunshine Oilsands Ltd. BA Code A2TF WEST ELLS SAGD Scheme No. 11764E AER In Situ Performance Presentation 2017 Presenters Qi Jiang, P. Eng., Ph.D. Chief Technology Officer Eugene Dembicki, M.Sc., P.Geol.
6 DRILLING AND COMPLETIONS
 Cenovus FCCL Ltd. 6-1 Drilling and Completions 6 DRILLING AND COMPLETIONS 6.1 OVERVIEW This section contains information about the drilling and completion of wells within the CLTP. Well counts, locations
Seal Main HCSS Pilot Approval Annual Performance Presentation
 Seal Main HCSS Pilot Approval 11377 Annual Performance Presentation 11-Feb-2015 Agenda Introductions Seal Main Horizontal Cyclic Steam Stimulation (HCSS) Pilot Subsurface Surface Harmon Valley South HCSS
2017 Directive 54 Performance Presentation
 2017 Directive 54 Performance Presentation Seal Scheme Approval No. 11320E September 2017 Agenda Subsurface 1. Overview 2. Geology / Geoscience 3. Drilling and Completions 4. Scheme Performance 5. Injection
vapour leaving from the top and routed to gas treatment diluted bitumen leaving from the middle produced water leaving from the bottom
 Section 6.2 APPLICATION FOR APPROVAL OF THE CARMON CREEK PROJECT VOLUME 1: PROJECT DESCRIPTION CPF PROCESSES 6.2.1 INLET FACILITIES AND EMULSION TREATING The bitumen, water and gas produced from the field
CAPROCK INTEGRITY FOCUS Analyzing How To Utilize Technical Testing Methodologies To Ensure Caprock Integrity. Tuesday, May 24 th, 2011
 CAPROCK INTEGRITY FOCUS Analyzing How To Utilize Technical Testing Methodologies To Ensure Caprock Integrity Tuesday, May 24 th, 2011 Forward-Looking Information and Advisories This presentation contains
Groundwater Supply Development at Canadian Natural Resources Limited s In Situ Oil Sands Operations
 THE PREMIUM VALUE DEFINED GROWTH INDEPENDENT Groundwater Supply Development at Canadian Natural Resources Limited s In Situ Oil Sands Operations Overview, Challenges and Lessons Learned Dave Edwards, P.Geol.
JAPAN CANADA OIL SANDS HANGINGSTONE SAGD PROJECT
 Public Disclosure Document for the proposed JAPAN CANADA OIL SANDS HANGINGSTONE SAGD PROJECT May 7 th, 2008 I. INTRODUCTION Japan Canada Oil Sands Limited (JACOS) continues to evaluate the development
Orion In Situ Oil Sands 2015 Progress Update. Presented May 25, 2016
 Orion In Situ Oil Sands 2015 Progress Update Presented May 25, 2016 Agenda Introduction Geoscience Scheme Performance Surface Operations Compliance Future Plans 2 Project Location Osum Production Corp.
Pelican Lake SAGD Pilot Approval 11469A 2011 Update. ERCB Offices March 21, 2012.
 Approval 11469A 2011 Update ERCB Offices March 21, 2012. Introduction and Overview Introduction Subsurface Issues Related to Resource Evaluation and Recovery Directive 054, Section 3.1.1 Surface Operations,
Proposed East Manson Unit No. 5 Application for Enhanced Oil Recovery Waterflood Project Middle Bakken East Manson, Manitoba
 Proposed East Manson Unit No. 5 Application for Enhanced Oil Recovery Waterflood Project Middle Bakken East Manson, Manitoba April 23, 2015 Crescent Point Resources Partnership Table of Contents Section
Oil Sands Development in Canada by SAGD - Further Challenges to Improve Efficiency -
 Oil Sands Development in Canada by SAGD - Further Challenges to Improve Efficiency - Nov-29, 2017 JAPEX (Japan Petroleum Exploration Co., Ltd) Canada Oil Sands Project Dept. Tanetomo (Tom) Izumi Japan
Grizzly Oil Sands. Algar Lake SAGD Project 2015 In Situ Performance Presentation Scheme Approval No C May 13, 2015
 Algar Lake SAGD Project 2015 In Situ Performance Presentation Scheme Approval No. 11688C May 13, 2015 Outline and Presenters Introduction and Project Background Alan Stroich Geoscience Jinxiu Qi Drilling
History Matching Field Results from a SAGD / Light Hydrocarbon Process (SAGD+ TM )
") WHOC12-442 History Matching Field Results from a SAGD / Light Hydrocarbon Process (SAGD+ TM ) E.C. LAU, M.D. JOHNSON, T. LAU Connacher Oil & Gas Limited This paper has been selected for presentation and/or
WHOC12-442 History Matching Field Results from a SAGD / Light Hydrocarbon Process (SAGD+ TM ) E.C. LAU, M.D. JOHNSON, T. LAU Connacher Oil & Gas Limited This paper has been selected for presentation and/or
Original Plan Phase 1 - Work progress (cumulative) 90% 94% 95% 97% 97% 99%
 90% 94% 95% 97% 97% 99%") CANADIAN NATURAL RESOURCES LIMITED ANNOUNCES FIRST QUARTER 2008 UPDATE ON THE PROGRESS OF THE HORIZON OIL SANDS PROJECT CALGARY, ALBERTA APRIL 30, 2008 FOR IMMEDIATE RELEASE Canadian Natural Resources
CANADIAN NATURAL RESOURCES LIMITED ANNOUNCES FIRST QUARTER 2008 UPDATE ON THE PROGRESS OF THE HORIZON OIL SANDS PROJECT CALGARY, ALBERTA APRIL 30, 2008 FOR IMMEDIATE RELEASE Canadian Natural Resources
Pengrowth Energy Corporation Lindbergh SAGD Project 2013 Annual Performance Presentation Scheme Approval No. 6410I.
 Pengrowth Energy Corporation Lindbergh SAGD Project 2013 Annual Performance Presentation Scheme Approval No. 6410I October 1, 2013 Introduction and Overview Introduction Subsurface Issues Related to Resource
Grizzly Oil Sands ULC
 May River SAGD Project A-1 Appendix A Table A-1 ERCB Draft 23 Oil Sands Project Applications (ERCB 2013) 3 GENERAL APPLICATION REQUIREMENTS 3.3 Project Description Requirements 3.3.1 Applicant and the
2016 Sluggin It Out Conference Mike Verney Associate
 2016 Sluggin It Out Conference Mike Verney Associate 1 » Operating Projects» Netback prices at various WTI assumptions» Reported operating costs» Break Even short term pricing fluctuations» Break Even
Telephone Lake project
 Telephone Lake project Cenovus Energy Inc. is a Canadian oil company. We re committed to applying fresh, progressive thinking to safely and responsibly unlock energy resources the world needs. Our operations
PRELIMINARY FEASIBILITY STUDY
 PRELIMINARY FEASIBILITY STUDY OF THE CADOTTE LEASES ALBERTA, CANADA REPORT NUMBER: QE-25620080229 REPORT DATE: FEBRUARY 29, 2008 Prepared on Behalf of: Strata Oil and Gas, Inc. Norwest Questa Engineering
Penn West Petroleum Ltd. Seal Main HCSS Pilot and Harmon Valley South Annual ERCB Progress Presentation
 Penn West Petroleum Ltd. Seal Main HCSS Pilot and Harmon Valley South Annual ERCB Progress Presentation 2013-01-17 Advisory General: This presentation is for information purposes only and is not intended
January 8, 2010 SUBJECT. Middle Bakken Formation / Three Forks Formation. Daly Bakken Three Forks Pool (01 62B) Daly Field, Manitoba
 Daly Field, Manitoba") January 8, 2010 SUBJECT Middle Bakken Formation / Three Forks Formation Daly Bakken Three Forks Pool (01 62B) Daly Field, Manitoba Proposed Unitization of Ebor Unit No. 2 Application for Enhanced Oil Recovery
January 8, 2010 SUBJECT Middle Bakken Formation / Three Forks Formation Daly Bakken Three Forks Pool (01 62B) Daly Field, Manitoba Proposed Unitization of Ebor Unit No. 2 Application for Enhanced Oil Recovery
GROUSE GROUSE IN SITU OIL SANDS PROJECT. Proposed Development Plan. Plain Language Project Summary
 GROUSE Proposed Development Plan GROUSE IN SITU OIL SANDS PROJECT Plain Language Project Summary ABOUT CANADIAN NATURAL WHO WE ARE Canadian Natural Resources Limited (Canadian Natural) is a senior independent
is a paradigm shift in produced water treatment technology occurring at SAGD facilities?
 Water Technologies & Solutions technical paper is a paradigm shift in produced water treatment technology occurring at SAGD facilities? Paper presented at the Canadian International Petroleum Conference
Annual Performance Presentation
 Annual Performance Presentation In Situ Oil Sands Schemes 9673 / 10147 / 10423 / 10787 April 2017 Premium Value Defined Growth Independent Agenda Current Approvals Geological Overview Drilling, Completions,
EnCana Christina Lake In Situ Oil Sands Scheme 2007 Update
 EnCana Christina Lake In Situ Oil Sands Scheme 2007 Update June 8, 2007 June 8, 2007 Agenda Introduction Geology and Geophysics Project Performance Operations and Water Compliance Gas Over Bitumen SAP
New Zealand Energy Corp.
 New Zealand Energy Corp. Investor Business Update November 2016 CAUTIONARY NOTES FORWARD-LOOKING INFORMATION This document contains certain forward-looking information and forward-looking statements within
Murphy Oil Company LTD.
 Murphy Oil Company LTD. Seal Polymer Pilot Scheme Approval No. 11320B Annual ERCB Progress Presentation June 3, 2013 1 Agenda Subsurface Surface Conclusions 2 Subsurface Background Geology Drilling & Completions
Effects of Well Placement using Multi- Segmented Wells in a Full Field Thermal Model for SAGD: Athabasca Oil Sands
 PAPER 2008-464 Effects of Well Placement using Multi- Segmented Wells in a Full Field Thermal Model for SAGD: Athabasca Oil Sands F. AKRAM Schlumberger Canada Limited This paper has been selected for presentation
HILDA LAKE SAGD PILOT PERFORMANCE SUMMARY 2004 AEUB PRESENTATION BLACKROCK VENTURES INC
 HILDA LAKE SAGD PILOT PERFORMANCE SUMMARY 2004 AEUB PRESENTATION BLACKROCK VENTURES INC FEBRUARY, 2004 HILDA LAKE SAGD PILOT PERFORMANCE SUMMARY 2003-2004 PRESENTATION OUTLINE PRODUCTION SUMMARY P1 AND
2012 Annual Performance Presentation McKay River Thermal Project
 2012 Annual Performance Presentation McKay River Thermal Project Outline Introductions 3.1.1 Subsurface Overview Related to Resource Evaluation and Recovery 3.1.2 Surface Operations, Compliance, and Issues
NEVADA EXPLORATION PROJECT
 Energizing the World, Bettering People s Lives NEVADA EXPLORATION PROJECT Legislative Committee on Public Lands June 12, 2014 Kevin Vorhaben, Rockies/Frontier Business Unit Manager Forward-looking Statements
Annual Surmont SAGD Performance Review Approvals 9426, 11596, and April 6, 2016 Calgary, Alberta, Canada
 Annual Surmont SAGD Performance Review Approvals 9426, 11596, and 9460 April 6, 2016 Calgary, Alberta, Canada Introduction, Overview and Highlights Subsection 3.1.1 (1) Ownership and Approvals Ownership
PENGROWTH ENERGY CORPORATION LINDBERGH SAGD PROJECT 2017 ANNUAL PERFORMANCE PRESENTATION SCHEME APPROVAL 6410P
 PENGROWTH ENERGY CORPORATION LINDBERGH SAGD PROJECT 2017 ANNUAL PERFORMANCE PRESENTATION SCHEME APPROVAL 6410P 2018 01 17 SUBSURFACE ISSUES: TABLE OF CONTENTS 1. Brief Background of the Scheme 2. Geology/Geoscience
Project Summary Table BlackPearl Resources Inc Blackrod Commercial SAGD Project Proponent Name: BlackPearl Resources Inc. Date: November, 2011
 Project Summary Table BlackPearl Resources Inc Blackrod Commercial SAGD Project Proponent Name: BlackPearl Resources Inc. Date: vember, 2011 Project Name: Blackrod Commercial SAGD Project Company Contact
TSX-V: YO. September. Duvernay Shale Peters & Co. Energy Conference
 TSX-V: YO September Duvernay Shale Peters & Co. Energy Conference Yoho Quick Facts SYMBOL YO TSX.V BASIC SHARES (Insiders 14.8%) DILUTED SHARES (WA Exercise Price of options $2.90) MARKET CAP 46.4 MM *
William Wilmot Matrix Solutions Inc. 118, Avenue S.W., Calgary, Alberta, Canada
 Hydrogeologic Assessment in Support of the Development of the Peace River Oil Sands Deposit: A Case Study Concerning a Pilot-Scale in-situ SAGD Operation William Wilmot Matrix Solutions Inc. 118, 319-2
Enhancing SAGD Bitumen Production Through Conductive, Convective and Radiant Heating
 Enhancing SAGD Bitumen Production Through Conductive, Convective and Radiant Heating Rudy Strobl*, Statoil Canada Ltd., Calgary, Alberta rudstr@statoil.com Bryce Jablonski, Statoil Canada Ltd., Calgary,
Pryme Energy Limited ASX Code: PYM Turner Bayou Project Update and Investor Presentation
 Pryme Energy Limited ASX Code: PYM Turner Bayou Project Update and Investor Presentation April 2012 Disclaimer, Forward Looking Statements and Competent Person Statement This presentation has been prepared
T S X : R M X N Y S E. M K T : R B Y. Rubicon Begins Stockpiling Mill Feed for Projected Production Commencing Mid-2015
 T S X : R M X N Y S E. M K T : R B Y News Release D e c e m b e r 1 8, 2014 Rubicon Begins Stockpiling Mill Feed for Projected Production Commencing Mid-2015 TORONTO, Ontario Rubicon Minerals Corporation
ADVISORY G R A N I T E O I L C O R P. T S X : G X O 2
 218 AGM ADVISORY Certain statements contained in this Presentation constitute forward-looking statements or information (collectively "forward-looking statements") within the meaning of applicable securities
Well Pad Automation Improves Capital Efficiency and Reduces Fiscal Risk Michael Machuca* Emerson Process Management
 URTeC: 1874921 Well Pad Automation Improves Capital Efficiency and Reduces Fiscal Risk Michael Machuca* Emerson Process Management Copyright 2014, Unconventional Resources Technology Conference (URTeC)
ADVISORY G R A N I T E O I L C O R P. T S X : G X O 2
 218 AGM ADVISORY Certain statements contained in this Presentation constitute forward-looking statements or information (collectively "forward-looking statements") within the meaning of applicable securities
Alberta Energy Regulator Suite 1000, Street SW Calgary, Alberta T2P 0R4 Attention: Steve Thomas, P.Eng., Section Leader In-Situ Oil Sands
 East Tower, 5 th Ave Place Suite 800, 425-1 st Street S.W. Calgary, Alberta T2P 3L8 Tel: 403-750-0810 Fax: 403-263-0767 www.laricinaenergy.com August 7, 2013 Alberta Energy Regulator Suite 1000, 250 5
2013 PERFORMANCE PRESENTATION (SUBSURFACE) LONG LAKE MARCH 19, 2014
 LONG LAKE MARCH 19, 2014") 2013 PERFORMANCE PRESENTATION (SUBSURFACE) LONG LAKE MARCH 19, 2014 PURPOSE This presentation contains information to comply with Alberta Energy Regulator s Directive 054 Performance Presentations, Auditing,
2013 PERFORMANCE PRESENTATION (SUBSURFACE) LONG LAKE MARCH 19, 2014 PURPOSE This presentation contains information to comply with Alberta Energy Regulator s Directive 054 Performance Presentations, Auditing,
For personal use only Operations Update
 2016 Operations Update 1 Highlights 2016 is set to be an exciting year of delivery for Range Most active onshore work programme in Trinidad amongst independents Largest scale waterflood projects in recent
Annual Performance Presentation
 Annual Performance Presentation In Situ Oil Sands Schemes 9673 / 10147 / 10423 / 10787 March 2014 Premium Value Defined Growth Independent Agenda Current Approvals Geological Overview Drilling, Completions,
BP Alaska Heavy Oil Production from the Ugnu Fluvial-Deltaic Reservoir*
 BP Alaska Heavy Oil Production from the Ugnu Fluvial-Deltaic Reservoir* Josef Chmielowski 1 Search and Discovery Article #80289 (2013)** Posted May 27, 2013 *Adapted from oral presentation given at 2013
Suncor MacKay River Project 2017 AER Performance Presentation. Reporting Period: September 1, 2017 to August 31, 2018
 Suncor MacKay River Project 2017 AER Performance Presentation Reporting Period: September 1, 2017 to August 31, 2018 Table of Contents Sub Surface Presentation Surface Presentation Appendix A: 1 Suncor
CONDENSATION INDUCED WATER HAMMER
 CONDENSATION INDUCED WATER HAMMER RISKS AND ISSUES ASSOCIATED WITH SAGD OPERATIONS Jeff Dancey, P. Eng. Baker Engineering and Risk Consultants, Inc. OUTLINE CONDENSATION INDUCED WATER HAMMER (CIWH) - EXPLANATION
DEPARTMENT OF ENVIRONMENTAL QUALITY OIL, GAS, AND MINERALS DIVISION OIL AND GAS OPERATIONS. Filed with the Secretary of State on
 DEPARTMENT OF ENVIRONMENTAL QUALITY OIL, GAS, AND MINERALS DIVISION OIL AND GAS OPERATIONS Filed with the Secretary of State on These rules become effective immediately upon filing with the Secretary of
Annual Surmont SAGD Performance Review Approval April 4, 2018 Calgary, Alberta, Canada
 Annual Surmont SAGD Performance Review Approval 9426 April 4, 2018 Calgary, Alberta, Canada Table of Contents AER Scheme Approval #9426 Subsurface Subsection 3.1.1 (1): Introduction, Overview and Highlights
SPE Reservoir Engineering and Production Optimization Mike Verney, P. Eng. February 28, 2017
 SPE Reservoir Engineering and Production Optimization Mike Verney, P. Eng. February 28, 2017 1 » Monograph 4 Estimating Ultimate Recovery of Developed Wells in Low Permeability Reservoirs» Purpose assess
INTERIM DIRECTIVE ID 91-3
 ID 91-03: Heavy Oil/Oil Sands Operations Page 1 of INTERIM DIRECTIVE ID 91-3 28 March 1991 To: All Oil and Gas Operators All In Situ Oil Sands Operators All Drilling and Servicing Contractors HEAVY OIL/OIL
Thermal Recovery Status and Development Prospect for Heavy Oil in China
 UNITAR Centre for Heavy Crude and Tar Sands 1998 1 No.1998.198 Thermal Recovery Status and Development Prospect for Heavy Oil in China Liu Wenzhang Research Institute of Petroleum Exploration and Development,
Unconventional Resources
 Houston, Texas (World Headquarters) 4620 Southerland Road Houston, TX, 77092 Phone: 1-800-462-7617 or 713-462-7617 E-mail: info@tamintl.com Aberdeen, Scotland Phone: 44-1224-875105 E-mail: info@tam-northsea.com
ATHABASCA OIL CORPORATION AER LEISMER UPDATE
 ATHABASCA OIL CORPORATION AER LEISMER UPDATE May 2017 INTRODUCTION 2 SUBSURFACE o o o Project Description & Status Geoscience 4-D Seismic & Monitoring Marcus Hoehn o o o o Well Design & Instrumentation
Successful Completion Optimization of the Eagle Ford Shale
 Successful Completion Optimization of the Eagle Ford Shale Supplement to SPE Paper 170764 Presented at the Society of Petroleum Engineers Annual Technical Conference and Exhibition Amsterdam, The Netherlands
Kuwait EPF. Early Production Facilities MARCOM-AGC
 Kuwait EPF Early Production Facilities MARCOM-AGC 1 Enhanced Oil Recovery Techniques Water Flooding Cold Heavy Oil Production with Sand (CHOPS) processing plant Steam Flooding Surface Treatment Pumping
Rule 326: Mechanical Integrity Guidance
 COGCC OPERATOR GUIDANCE RULE 326: MECHANICAL INTEGRITY GUIDANCE Document Control: Created Date: May 15, 2015 Last Updated Date: May 15, 2015 Last Updated By: Dave Kulmann Review Cycle: Yearly Review Systems
Next Generation SAGD Produced Water Treatment Technology Development. ESAA Watertech 2012 Banff, Alberta April 12, 2012
 Next Generation SAGD Produced Water Treatment Technology Development ESAA Watertech 2012 Banff, Alberta April 12, 2012 Energy and water are co-dependent Energy is required for making water and water is
The Alberta Energy Regulator (AER) has approved this directive on February 17, 2016.
 has approved this directive on February 17, 2016.") Directive 007 Release date: February 17, 2016 Effective date: February 17, 2016 Replaces previous edition issued February 25, 2015 Volumetric and Infrastructure Requirements The Alberta Energy Regulator
Directive 007 Release date: February 17, 2016 Effective date: February 17, 2016 Replaces previous edition issued February 25, 2015 Volumetric and Infrastructure Requirements The Alberta Energy Regulator
SAGD Water Disposal Options, Associated Impacts, and Strategies to Improve Environmental Footprint. Basil Perdicakis, January 27, 2011
 SAGD Water Disposal Options, Associated Impacts, and Strategies to Improve Environmental Footprint Basil Perdicakis, January 27, 2011 Statoil Canada Kai Kos Dehseh (KKD) Lease Leismer site currently producing
Timber Creek Field Study for Improving Waterflooding
 The 2 nd Minnelusa Workshop of EORI Timber Creek Field Study for Improving Waterflooding Shaochang Wo Gillette, Wyoming June 4, 2014 Project Summary and Timeline A collaborative study between EORI and
PRODUCTION WELL WATER SHUT-OFF TREATMENT IN A HIGHLY FRACTURED SANDSTONE RESERVOIR
 WRI-01-R010 PRODUCTION WELL WATER SHUT-OFF TREATMENT IN A HIGHLY FRACTURED SANDSTONE RESERVOIR Final Report By Lyle A. Johnson Jr. July 2001 Work Performed Under Cooperative Agreement DE-FC26-98FT40323
MAY 2016 ALLAN ALBERTSON, P.ENG., TYLER HALLMAN, P.ENG.
 MULTILATERAL WELLS CAN BE EMPLOYED IN HEAVY OIL FORMATIONS REQUIRING ADDITIONAL RESERVOIR EXPOSURE TO ACHIEVE TARGET PRODUCTION RATES AND IMPROVE ECONOMICS MAY 2016 ALLAN ALBERTSON, P.ENG., TYLER HALLMAN,
Innovative Energy Technologies Program
 Alberta Department of Energy Innovative Energy Technologies Program BRINTNELL FIELD ORSETAIL POLYMER FLOOD PILOT PROJECT Canadian Natural Resources Limited Annual Report June 30th, 2009 Innovative Energy
Brownfield Projects. Equinox Engineering
 BROWNFIELD PROJECTS Equinox Engineering Brownfield Projects Equinox Engineering Ltd. is a world class provider of EPCM services to the global oil and gas marketplace. Founded in 1997, Equinox has successfully
Cold Lake expansion project
 Cold expansion project Initial project description Plain language summary March 2016 Our commitment Imperial Oil Limited s success depends on our ability to maintain an open dialogue with, and ongoing
Monell Unit CO 2 Flood
 Monell Unit CO 2 Flood Patrick Draw Field Sweetwater County, Wyoming May 29 th, 2008 Prepared by: Jason Gaines Senior Reservoir Engineer APC Forward Looking Statement This presentation contains forward-looking
Thermal In-Situ Scheme Progress Report for 2016 Japan Canada Oil Sands Limited Hangingstone. Approval No (Demonstration Project)
") Thermal In-Situ Scheme Progress Report for 2016 Japan Canada Oil Sands Limited Hangingstone Approval No. 8788 (Demonstration Project) 1. Background Hangingstone Expansion Project 2. Subsurface Geosciences
Thermal In-Situ Scheme Progress Report for 2016 Japan Canada Oil Sands Limited Hangingstone Approval No. 8788 (Demonstration Project) 1. Background Hangingstone Expansion Project 2. Subsurface Geosciences
Greenfields Petroleum Corporation
 Greenfields Petroleum Corporation TSX.V: GNF & GNF.DB Investor Bahar Update February 2014 Forward-Looking Statements This presentation contains forward-looking statements. More particularly, this presentation
Monitoring Plan for a Cyclic Steam Stimulation (CSS) Pilot Test in Orinoco Oil Belt, Venezuela
 Pilot Test in Orinoco Oil Belt, Venezuela") Monitoring Plan for a Cyclic Steam Stimulation (CSS) Pilot Test in Orinoco Oil Belt, Venezuela Repsol Technology Center (CTR), Madrid PEA 2016 Aberdeen, Scotland, UK 1. What is Pilot Test? Why monitoring
Monitoring Plan for a Cyclic Steam Stimulation (CSS) Pilot Test in Orinoco Oil Belt, Venezuela Repsol Technology Center (CTR), Madrid PEA 2016 Aberdeen, Scotland, UK 1. What is Pilot Test? Why monitoring
Cardero Provides Update on Metallurgical Coal Quality at the Carbon Creek Deposit, Northeast British Columbia
 NR13-20 August 15, 2013 Cardero Provides Update on Metallurgical Coal Quality at the Carbon Creek Deposit, Northeast British Columbia Wood Mackenzie Completes Positive Project Benchmarking Study Vancouver,
Greenfields Petroleum Corporation
 Greenfields Petroleum Corporation TSX.V: GNF & GNF.DB Investor Bahar Update May 2014 Forward-Looking Statements This presentation contains forward-looking statements. More particularly, this presentation
Alberta Oil and Gas Regulations The Key to Wellbore Integrity
 Alberta Oil and Gas Regulations The Key to Wellbore Integrity Presented by Theresa Watson at the Third Wellbore Integrity Network Meeting Santa Fe, New Mexico March 13, 2007 Overview Alberta Oil and Gas
Pressure Communication
 Pressure Communication Industry, government collaborate on gas over bitumen R&D BY DEBORAH JAREMKO Slant drilling has helped push bitumen development, but more advances are needed 44 Oilweek February 2006
North Platte Inboard Lower Tertiary Discovery. December 2012
 NYSE: CIE www.cobaltintl.com North Platte Inboard Lower Tertiary Discovery Forward Looking Statements Neither the United States Securities and Exchange Commission nor any other state securities regulator
Investment Highlights
 Disclaimer This Presentation is provided on the basis that none of the Company nor its respective officers, shareholders, related bodies corporate, partners, affiliates, employees, representatives and
Meadow Creek West. Project overview:
 Project overview: Meadow Creek West will be a steam assisted gravity drainage (SAGD) oil sands development in northeast Alberta. Meadow Creek West is an additional phase to our Meadow Creek project and
Upgrading with a soft touch
 Upgrading with a soft touch Canadian Heavy Oil Conference 4 November 2014 Agenda Heavy Oil Industry the market & its challenges Upgrading in Canada Fractal Systems JetShear Technology Commercializing JetShear
T S X : R M X N Y S E. M K T : R B Y
 T S X : R M X N Y S E. M K T : R B Y News Release A p r i l 1 4, 2015 Rubicon s Phoenix Gold Project Commences Mill Commissioning and Remains on Schedule for Mid-2015 Projected Initial Production TORONTO,
Experiences in the Salt Creek Field CO2 Flood
 Experiences in the Salt Creek Field CO2 Flood Ken Hendricks Anadarko Petroleum Corp. 5 th Annual Wellbore Integrity Network May 13-14, 2009 Calgary, Alberta Thank you This presentation contains forward-looking
Non-intrusive wellhead surveillance to support brownfield production optimisation recent case studies
 Non-intrusive wellhead surveillance to support brownfield production optimisation recent case studies Agenda Introduction Produce the Technical Limit Typical Sonar Applications Sonar Technology Case Studies
Husky Oil Operations Limited Tucker Thermal Project Commercial Scheme #9835
 Husky Oil Operations Limited Tucker Thermal Project Commercial Scheme #9835 Annual Performance Presentation Energy Resources Conservation Board May 23 rd, 2013 1 3.1.1. Subsurface Issues Table of Contents
Using Modelling to Improve Wastewater Disposal Strategies
 Using Modelling to Improve Wastewater Disposal Strategies Gordon MacMillan, P.Geol. Matrix Solutions Jens Schumacher, M.Sc., Matrix Solutions Maxime Claprood, Ph.D., P.Eng., Matrix Solutions Michael L.
California Dreamin. on such a winter s day. The Mommas and the Papas
 Stuart M. Heisler, P.E. Senior Technical Director PARSONS Bakersfield, California Michael Dejak, P. Eng. VP Business Development Eco-Tec Inc. Calgary, Alberta Presentation for Canadian Heavy Oil Association