Annual Performance Presentation
|
|
|
- Jared Barnett
- 6 years ago
- Views:
Transcription


1 Annual Performance Presentation In Situ Oil Sands Schemes 9673 / / / March 2014 Premium Value Defined Growth Independent
2 Agenda Current Approvals Geological Overview Drilling, Completions, and Artificial Lift Field Performance and Surveillance Cap Rock Integrity & Monitoring Future Development Plans Facilities Measuring & Reporting Facility Future Plans Water Use, Conservation & Disposal AER Compliance Conclusions Slide 2


3 Brintnell Location Twp R23 R22 R21 R20 R19W4 Slide 3
4 Primary and Enhanced Approval Regions Enhanced Recovery Schemes Primary Recovery Schemes Slide 4

5 CNRL Brint W4M Type Log Slide 5

6 Wabiskaw A Net Pay Map Slide 6

7 Wabiskaw Structure Map Slide 7

8 Produced Oil Viscosity Map Slide 8
9 Brintnell Regional Reservoir Properties Upper Wabiskaw Sand Depth of m TVD Net Pay Range 1 9m Porosity 28 32% Permeability md Temperature deg. C Water Saturation 30 40% Oil Viscosity (dead oil) ,000cp@ 15 deg. C Initial Reservoir Pressure kpa Slide 9
10 Drilling, Completions, and Artificial Lift Slide 10

11 Typical Drilling Configuration Build Section Intermediate Casing Points Lined Horizontal Section Well spacing is largely controlled by existing primary development CNRL has generally experienced that m interwell spacing provides the best balance between efficient recovery and flood stability while managing the risks in placement of horizontal wells. The range in interwell spacing is dependent on reservoir conditions (oil viscosity, net pay) Slide 11

.")
12 Typical Well Configurations Producer Injector Intermediate Casing landed in Wabiskaw sand (producers and injectors). Slide 12
13 EOR History and Current Approvals Slide 13

14 Polymer Flood Development Slide 14
15 Field Overview Nov 2012 May 2013: Lack of facility capacity and related treating issues field wide New battery brought online in May 2013 Approximately 62% of the approved EOR scheme areas are currently developed and under flood as of the end of 2013 Slide 15
16 Field Performance and Surveillance Slide 16

17 Approval % of Approval Area under Polymerflood Slide 17
18 Approval Production Update 2013: Significant injection shut-in for depressurization in preparation for offset drilling operations Slide 18
19 Approval Discussion Contains the most mature polymer flood patterns including the original pilot area which began flooding in Entire scheme area is currently under flood. No changes to patterns or well counts in First Polymer Response in April 2006 from the HTL6 Pilot area. Peak production occurred from mid 2007 to early 2010 at 650 m3/d oil. Gradual increase in watercut since early 2010 to 60% has resulted in a declining oil rate. Throughout 2013, a significant portion of injection was shut-in due to offset drilling operations. Cumulative oil recovered to date is E6m3 (12.4 MMbbl) Oil viscosity ranges from 1,300 cp to 2,800 cp. Slide 19


20 Approval % of Approval Area under Polymerflood Slide 20
21 Approval Production Update : Significant number of production wells converted to injection : Gradual ramp up in volumes due to multiple small expansion phases. Started Polymer Injection Slide 21
22 Approval Discussion Polymerflood started in 2006 covering roughly 5% of the approval area split between 3 small groups. The flood was expanded every year up to In 2012, small area from PRSA 9884 was added to the approval. Currently 70% of the approval area in under flood. Small portion of approval area under waterflood starting in This area was converted to polymer in 2008 and First polymer response occurred in July Oil volumes continued to ramp up through 2013 and does not appear to have plateaued; watercut has remained flat through Significant portions of the approval area are affected by higher in-situ water saturation and/or oil viscosity. Response in these regions has been more delayed and erratic when compared to other portions of the pool. Slide 22
23 Approval Discussion Main expansion phases occurred in 2009 & 2010 and involved significant reduction in production wells for conversion to injection. By converting rather than infilling, the initial fillup volume per injector was higher and therefore initial oil response occurred over a longer timeframe. Drilled 26 wells in the approval area in of these wells have been or will be completed as new injectors in the flood. The remaining 11 wells are completed and will remain as producers. 3 additional wells were planned for the 2013 program but spilled over into the 2014 drill program. Included in the 2013 program were 4 JV wells partnered with Cenovus along the borders of our landbases. Cumulative oil recovered to date is E6m3 (93.1 MMbbl). Oil viscosity ranges from 1,100 cp to 50,000 cp. Slide 23
24 Approval % of Approval Area under Polymerflood Slide 24
25 Approval Production Update Nov 2012 May 2013: Lack of facility capacity and related treating issues Slide 25
26 Approval Discussion Polymerflood started in Dec 2007 covering roughly 4% of the approval area split into 2 small groups. There were no expansions until 2010, since then there has been an expansion completed in every year including Currently 45% of the approval area is under flood. First polymer response occurred in November Polymer injection was commenced in the Peerless and Sandy Lake portions of the area in 2013; production wells are activated/reactivated as dictated by fluid levels and/or surface pressure readings. Oil production remained flat through 2013; the west block experienced production issues with sand in a few wells which resulted in lost productionand offset the ramp up volumes in the rest of the group. A series of workovers performed in late 2013/early 2014 have restored much of the lost production from this region Slide 26
27 Approval Discussion The south and east blocks had production restricted in early 2013 due to issues with field treating capacity. Comparatively large primary production in these areas was targeted instead of active flood regions. Volumes restored by mid-2013 and continued to ramp up with new producer startups in the flood areas. Drilled 7 wells in the approval area in of these wells has been completed as a new injector in the flood. The remaining 6 wells are completed as producers. Cumulative oil recovered to date is E6m3 (43.0 MMbbl). Oil viscosity ranges from 1,100 cp to 14,400 cp. Slide 27
28 Approval % of Approval Area under Polymerflood Slide 28
29 Approval 9673 Production Update : Reduced injection rates to try and reduce or heal channeling resulting from the previous waterflooding. Drop in watercut and total produced fluid rates as a result. Polymer injection begins All injection is now polymer 2013: Maintained constant injection rates to determine what impact the reduced injection has on the flood performance Slide 29
30 Approval 9673 Discussion Originally approved for waterflood in 2004; waterflood was expanded in 2005/2006 to cover roughly 40% of the current approval area. Waterflood peak production occurred from late 2007 to early 2009 at 1850 m3/d oil. Polymerflood began in Sept 2008 covering 6% of approval area. Existing waterflood patterns remained unchanged at this time. In 2009 all waterflood areas were converted to polymer and a small expansion area from primary was added; additional small expansions from primary were conducted in each year from 2010 to Currently 70% of the approval area is under flood. First polymer response occurred in Sept 2009 but due to declining production from the waterflood areas, have only recently started to see a ramp up in oil volumes from the polymer flood. Slide 30
31 Approval 9673 Discussion The conversion from water to polymer allowed injection rates to be reduced while maintaining similar reservoir pressure; decreases in watercut were also expected due to the improved conformance Following two years of reducing injection rates and declining watercuts, injection was held fairly stable in 2013 to assess what impact the reduction in injection had in reducing the watercut Throughout 2013, there have been signs of improved conformance from the polymer flood with increasing oil volumes and a steady decline in watercut with the stable injection rate 2013 drill program included 1 JV well partnered with Cenovus along the border of our landbasesin this approval area. Cumulative oil recovered to date E6m3 (36.2 MMbbl). Oil viscosity ranges from 600 cp to 13,000 cp. Slide 31


32 Estimated Ultimate Recovery Factors for Flooded Areas Approval 9673 Total area OBIP 97,439,555 m 3 OBIP under flood: 78,437,884 m 3 RF to date: 7% Estimated ultimate recovery factors: 14-18% Approval Total area OBIP 205,220,952m 3 OBIP under flood: 81,382,556 m 3 RF to date: 6% Estimated ultimate recovery factors: 19-24% Approval Total area OBIP 8,987,327 m 3 OBIP under flood: 8,987,327 m 3 RF to date: 22% Estimated ultimate recovery factors: 28-32% Approval Total area OBIP 229,018,235 m 3 OBIP under flood: 162,832,446 m 3 RF to date: 9% Estimated ultimate recovery factors: 20-23% *The recovery factors shown for each area represent the recovery for the portions of the scheme approval areas that are currently under polymer flood Slide 32
 100/14-31-081-22W4/0 (100%)")
 102/15-31-081-22W4/0 (100%)")
33 Good Performance HTL1 HTL1 Pad Well list and allocation factors: 100/ W4/0 (100%) 100/ W4/0 (100%) 100/ W4/0 (100%) 102/ W4/0 (100%) 102/ W4/0 (100%) 102/ W4/0 (100%) 103/ W4/0 (100%) Approval Slide 33

34 Good Performance HTL1 Slide 34
")
 100/15-25-081-23W4/0 (100%)")
35 Average Performance WB 24 WB Pad 24: 100/15-25 Pattern Well List and allocation factors: 100/ W4/0 (50%) 100/ W4/0 (50%) 100/ W4/0 (50%) 100/ W4/0 (50%) 100/ W4/0 (100%) Approval Slide 35
36 Average Performance WB 24 Slide 36

 104/07-24-080-22W4/0 (50%) Approval 10423")
37 Below Average Performance SB 26 SB 26103/10-24 Pattern Well List and allocation factors: 102/ W4/0 (50%) 103/ W4/2 (100%) 104/ W4/0 (50%) Approval Slide 37
38 Below Average Performance SB 26 Slide 38
39 Summary of Good/Average/Poor Areas 30% RF vs PV Inj 25% Slope ofrf Curve 20% RF 15% Response Times 10% 5% 0% 0% 5% 10% 15% 20% 25% 30% PV Inj SB26 WB24 HTLP1 Slide 39
40 Cap Rock Integrity Slide 40
41 Cap Rock Integrity - Anomalies 2013 Anomalies: Date of Event Location Cause of Alarm Details/Description of Anomalous Event Operations Review of Injection Well Initial Injection Pressure (MM/DD/YYYY) (Pad Name and UWI) (kpag) (kpag) (m3/d) (m3/d) Anomalous Pressure Initial Injection Rate Anomalous Rate Cause of Anomaly May 15, 2013 SLP 6 00/ W4 Drop in injection pressure Over a 24 hour period, injection pressure dropped by 1550 KPa from 4874 KPa to 3324 KPa. During that same time frame, the injection rate increased by 13 m3/d from 134 m3/d to 147 m3/d. Everything working properly Accessing new highly permeable reservoir August 17, 2013 BP 18 00/ W4/0 Drop in injection pressure Over 8 days, well experienced a staggered pressure drop of roughly 1700kPa from roughly 5838 kpa to 4157 kpa Everything working properly Breakthrough November 3, 2013 SLP4 04/13D W4 Drop in injection pressure On Nov 3 at about 6:30pm the pressure on this well dropped off from around normal pressure of about 5600kpa down to about 4300kpa where it is currently at. At the same time the flow rate increased from an average of about 25m3/d to over 100m3/d. Everything working properly Accessing new highly permeable reservoir November 30, 2013 CBP 17 02/ W4/0 Drop in injection pressure During a 5 hour period, the pressure dropped from around 5570kPa to roughly 4000 kpa while in that same time frame the rate increased from 66 m3/d to nearly 280 m3/d Everything working properly Accessing new highly permeable reservoir 9 anomalies in 2012; 18 anomalies in 2011 Slide 41
42 Cap Rock Integrity - Anomalies Anomaly refers to an increase in polymer injection rate accompanied by a loss in injection pressure neither of which are linked to an operational change. An anomaly as described above, will occur quickly, often within hours. Due to the use of long horizontal wells, there are often differences in permeability along the wellbore length. Many of the anomalies have been linked to accessing new reservoir which, in essence, is accessing these different permeability regions. Localized gas caps may also result in a change in injectivity as they are encountered. These types of anomalies occur early in the flood life. CNRL has seen a drop in these anomalies in the past two years due to comparatively fewer new injection well startups. Slide 42
43 Cap Rock Integrity SLP4 04/13D-32 Rate Increase: 25 to 100 m3/d; Pressure Drop: 5600 to 4300 kpa Anomaly occurred due to the breakdown of a wellbore sand obstruction or near wellbore lower perm barrier which allowed injection fluids to access a new, higher perm, portion of the reservoir. Injection was temporarily shut-in to allow the near wellbore region to equalize and stabilize under new downhole conditions. Well has returned to pre-anomaly operating conditions and has no indications that cap rock integrity has been affected. Slide 43
44 Cap Rock Integrity SLP4 04/13D-32 Hall slope briefly shallowed indicating an improvement in injectivity. After the shut-in equalization period, slope has returned to the normal trend. Anomaly The Hall plot is used to identify changes in flow conditions in the injection well. Changes in slope indicate either an improvement or reduction of injectivity. Slide 44
45 Future Development Plans Slide 45
46 Future Development Plans Canadian Natural plans to continue with the expansion of the polymer flood at Brintnell over the next several years. Expansion will push the flood to the southeastern and western edges of the pool. The focus of the 2014 capital program will be: Complete 2013 injection well program bordering Cenovus lands, as part of joint well agreement Infill drill regions in Scheme areas and to optimize existing flood patterns Implement flood expansion in western portion of Scheme area Re-drill two existing wells in Scheme area 9673 Primary drilling in Scheme area CNRL received approval in 2012 to implement a surfactant pilot in the field. Presently, CNRL is re-evaluating the pilot area and conducting further lab testing prior to moving ahead. No field work has taken place at this time to support a pilot. Slide 46
47 Facilities Slide 47

48 Brintnell Batteries CHOPS Battery: Online mid May Old Central Brintnell Battery converted to Truck in CHOPS battery North Brintnell Battery CHOPS Battery Central 1-36 Brintnell Battery South Brintnell Battery New Central Battery. Online mid May Slide 48
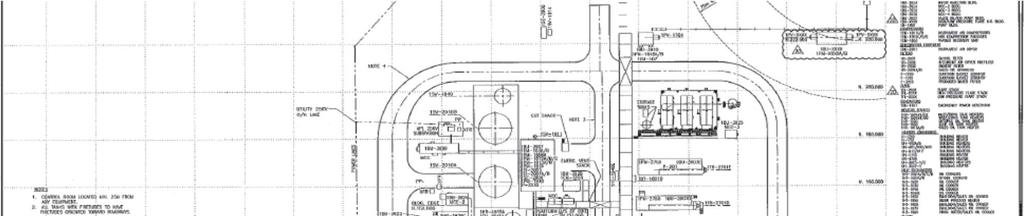
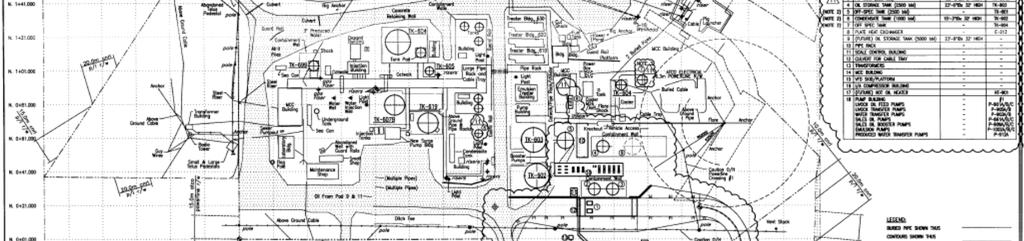
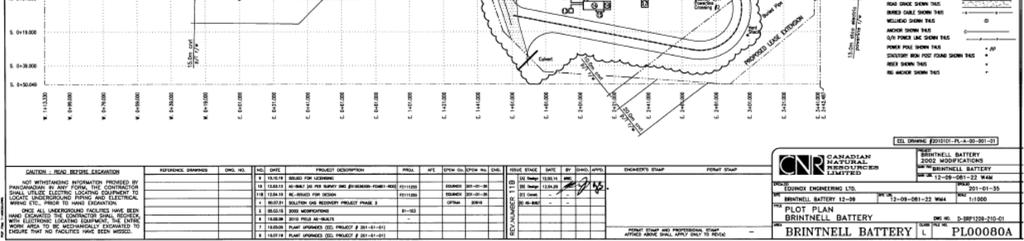
49 Facility: NB W4 Battery Plot Plan Refer to Appendix A Slide 49

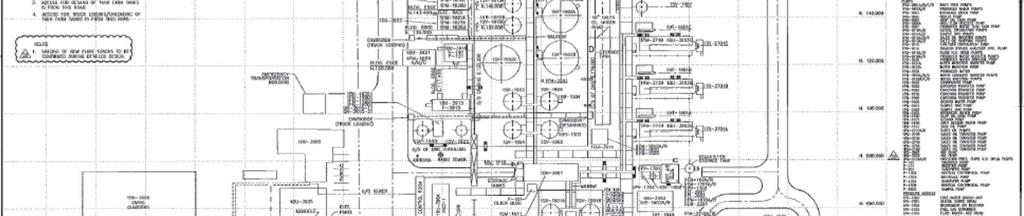
50 Facility: SB W4 Battery Plot Plan Refer to Appendix B Slide 50
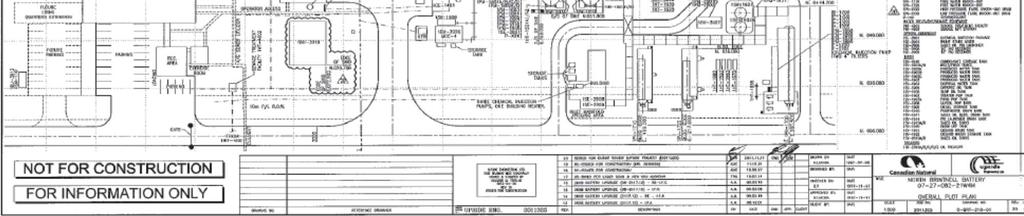
51 Facility: BT W4 Battery Plot Plan Refer to Appendix C Slide 51
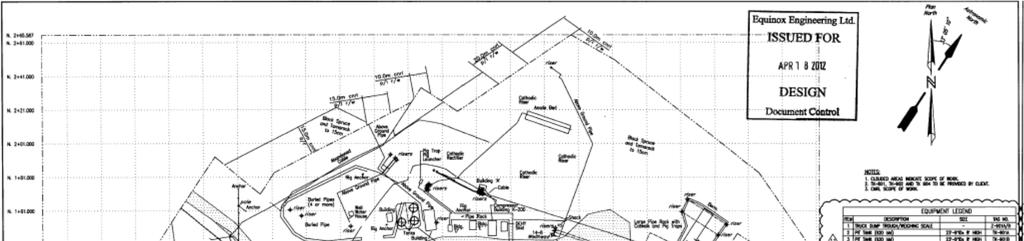
52 Facility: CB W4 Battery Plot Plan Refer to Appendix D Slide 52

53 CB W4 Battery Slide 53


54 Facility: Typical Brintnell Battery PFD Refer to Appendix E Slide 54
55 Facility Modifications Reasons for Modifications: Oil Treating: 1-36 Battery Online (May 2013): may require more heat input to process Battery is off the grid. Converted to CHOPS battery only (May 2013) Heat integration: investigating indirect heating of fluid to reduce OPEX. Integrity: Continue working details of plan to rebuild all existing flood areas over next several years; future flood areas to be rebuilt as the flood is expanded (identify higher risk areas to complete first). Construction ongoing. Working towards 2016/2017 compliance. All high risk sour pipelines have been lined as of February 2014 Slide 55
56 Battery Performance North Brintnell 7-27 Produced Water (m3) 1,374,731 1,775,300 2,096,258 2,292,879 2,386,085 1,484,277 1,795,440 1,567,398 Recycle Rates (m3) 1,220,482 1,779,160 2,057,161 2,238,740 2,330,418 1,453,371 1,786,316 1,559,325 Oil Produced (m3) 705, , , , , ,263 1,075,836 1,027,258 Produce Recycle 88.8% 100.2% 98.1% 97.6% 97.7% 97.9% 99.5% 99.5% Average Daily Recycle (m3/d) 3,344 4,874 5,621 6,134 6,385 3,982 4,881 4,272 Central Brintnell Produced Water (m3) 167, , , , , , , ,284 Recycle Rates (m3) 0 26, , , , , , ,583 Oil Produced (m3) 568, , , , , , , ,914 Produce Recycle 0.0% 13.9% 59.5% 91.4% 93.4% 88.6% 81.9% 73.0% Average Daily Recycle (m3/d) Central Brintnell 1-36 Produced Water (m3) 638,159 Recycle Rates (m3) 565,099 Oil Produced (m3) 584,297 Produce Recycle 88.6% Average Daily Recycle (m3/d) 2,457 South Brintnell 9-02 Produced Water (m3) 341, , , , ,095 1,014,789 1,505,539 1,384,546 Recycle Rates (m3) 0 22, , , , ,109 1,412,965 1,274,107 Oil Produced (m3) 441, , , , , ,847 1,080,977 1,055,952 Produce Recycle 0.0% 5.4% 34.5% 37.6% 22.3% 81.1% 93.9% 92.0% Average Daily Recycle (m3/d) ,255 3,861 3,491 Total Water Volumes Produced Water (m3) 1,883,520 2,382,129 2,865,183 3,216,258 3,485,267 2,901,838 3,703,800 3,733,387 Fresh Water (m3) 512,766 1,026,684 1,493,264 1,433,242 1,553,045 1,479,780 1,876,840 2,042,937 Brackish Water (m3) - Grosmont 1,438,110 1,661, ,664 2,963,684 3,999,848 6,274,361 4,780,011 3,800,437 Disposal Volume (m3) 663, , , , , , , ,200 Total Produce Recycle (%) 64.8% 76.8% 83.4% 86.7% 80.5% 90.8% 95.3% 93.8% Average Daily Recycle (m3/d) 3,344 5,009 6,529 7,644 7,686 7,215 9,642 9,598 Slide 56
57 Measuring and Reporting Slide 57
58 Measurement and Reporting Methods of Measurement: Oil and Water: flow meters and test tanks. Solution Gas: orifice meters/gor Testing Typical Well Testing: Frequency and duration: well testing as per Directive 17. Meter installations to replace test tanks (high volume and flood producers). Part of all new pad expansions and rebuilds. Field Proration Factors: Within acceptable range (Oil: 0.905, Water: 1.047). Slide 58
59 Measurement and Reporting Continued Optimization: Remove test tanks and install flow meters on pads/wells Increase testing frequency and duration Improve proration factors Perform testing inline Eliminates gas venting from tanks Reduces fuel gas consumption Reduces potential for spill Standardize testing equipment across field Reduce downtime and maintenance Increase reliability in calibration Improve& revise BS&W testing procedures for better accuracy Slide 59
60 Pipelines In 2012 finished interconnecting emulsion pipelines to all 3 batteries Installed micro-motion flow meters to measure the volumes transferred between facilities Allowed us to maximize the available capacity of each battery Continues to minimize lost production during plant outages 3 Batteries for the area: North Brintnell 7-27, Central Brintnell 1-36, South Brintnell 9-02 Possible future OSR amalgamation (OSR 101 and OSR 006) would allow for more simplified accounting processes Slide 60
61 Future Facility Plans Slide 61
62 Facility Future Plans Major Activities: Pad Rebuilds Continue with Polymer Expansion(s) as corporate budgets allow Slide 62
63 Water Use Slide 63
64 Non-Saline Water Use Canadian Natural currently has license with Alberta Environment and Water for the annual diversion of up to 2,151,310 m3 of nonsaline water for injection with an expire date of CNRL received a renewal of this license in early Canadian Natural has not increased the amount of licensed non-saline water since 2006, yet has significantly increased the amount of area under flood as seen in the polymer flood section of this presentation. Working to optimize the use of fresh water for polymer hydration to maximize its benefit Significant investment has been made in infrastructure and increased operating cost in order to continue to expand the polymer flood without the use of additional non-saline water to our current license. In Compliance with Alberta Environment and Water regarding monthly reporting, observation well monitoring, and all other terms of the License. Slide 64


65 Brintnell Total Injection Slide 65
66 2013 Injection Water Summary Polymer Injection Volumes (m³) Jan Feb Mar Apr May Jun Jul Aug Sep Oct Nov Dec Produced Water to Injection 248, , , , , , , , , , , ,856 Fresh Make-Up Water 142, , , , , , , , , , , ,375 Saline Make-Up Water 366, , , , , , , , , , , ,148 Total 757, , , , , , , , , , , ,379 Total Injection Volumes (m³) Produced Water to Injection 2,382,129 47% 2,865,183 56% 3,216,258 42% 3,485,267 39% 2,901,838 27% 3,388,006 34% 3,522,671 38% Fresh Make-Up Water 1,026,684 20% 1,493,264 29% 1,433,242 19% 1,553,045 17% 1,479,780 14% 1,876,840 19% 2,041,938 22% Saline Make-Up Water 1,661,989 33% 764,664 15% 2,963,684 39% 3,999,848 44% 6,274,361 59% 4,780,011 48% 3,800,437 41% Total 5,070,802 5,123,111 7,613,184 9,038,160 10,655,979 10,044,856 9,365,047 Slide 66

67 Non-Saline Well Locations Slide 67
68 Non-Saline Water Make up Wells Well Name UWI Production Interval Maximum Rate of Diversion (m3/day) Maximum Annual Diversion Vol (m3) 2013 Average Diversion Volumes (m3/day) Annualized Max Daily diversion Volume (M3/day) WSW BP25 - QUAT 100/ W4/ , WSW BP11 - QUAT 1F2/ W4/ , , WSW BP2 - GR 1AA/ W4/ ,200 1,750, WSW BP11 - GR 1F1/ W4/ WSW HTP2 - GR 1F1/ W4/ , ,683 WSW HTP6 - GR 1F1/ W4/ WSW NHTP16 - GR 1F1/ W4/ WSW WBP30 - GR 100/ W4/ WSW NHP 13 - GR 100/ W4/ WSW HHP 15 - GR 100/ W4/ Total Fresh Water % 0.00% Volume (m3) % % % % % Difference % 31-Dec-1219-Feb-1310-Apr-1330-May-1319-Jul-13 7-Sep Oct-1316-Dec-13 Cumm. Diversion License % Difference Slide 68

69 Saline Water Source Map Slide 69
70 2013 Saline Water Source Well Diversion Volumes (m³) Well Name January February March April May June July August September October November December Totals BR NORTH 1F1/ W4/00 SRC 27,884 25,548 26,413 28,290 37,022 54,381 57,134 63,281 53,492 56,804 59,748 62, ,441 BR NORTH NBP24 1F1/ W4/ BR NORTH NBP24 1F1/ W4/ ,346-3,346 BR NORTH NBP6 1F1/ W4/00 SRC BR NORTH NHP5 1F1/ W4/ BR NORTH NHP9 1F2/ W4/ BR SOUTH SBP16 1F1/ W4/00 32,686 35,758 39,840 36, ,637 64,655 61, ,108 BR SOUTH SBP28 1F1/ W4/00 43,574 53,535 63,510 10,583-24,232 31,174-17,618 12, ,058 BR SOUTH SBP4 1F1/ W4/00 42,634 36,393 35,338 38,783 41,496 39,280 21,837 52,378 55,557 39,894 37,037 39, ,025 BR SOUTH SBP6 1F1/ W4/ ,720 64,030 40,706 55,488 69,993 51,159 62, ,851 BR SOUTH WSW 1F1/ W4/00 117, ,345 96,530 57,251 75,291 77, ,718 50,892 6,220 3,158 2, ,187 BR SOUTH WSW 1F1/ W4/00-20,803 83,012 57,428 38,977 14,685 51,841 81,362 58,264 61,192 69,794 64, ,554 BRINTNELL BP9 1F1/ W4/00 101,977 85,011 35,371 95,282 64,463 58,105 12,701 17,264 34,241 12,364 16,605 7, ,592 Totals 366, , , , , , , , , , , ,148 3,800,437 Slide 70
71 Water Usage and Disposal Total Water Volumes Produced Water (m3) 2,382,129 2,865,183 3,216,258 3,485,267 2,901,838 3,703,800 3,522,671 Fresh Water (m3) 1,026,684 1,493,264 1,433,242 1,553,045 1,479,780 1,876,840 2,041,938 Brackish Water (m3) - Grosmont 1,661, ,664 2,963,684 3,999,848 6,274,361 4,780,011 3,800,437 Disposal Volume (m3) 553, , , , , , ,200 Total Produce Recycle (%) 76.80% 83.40% 86.70% 80.50% 90.80% 95.30% 94.00% Average Daily Recycle (m3/d) 5,009 6,529 7,644 7,686 7,215 9,642 9,900 Improvements over past year on water handling capability at batteries to reduce disposal water and increase produced water recycling ratios recycle at 94.0%. CNRL continues to be in compliance with AENV water diversion license. CNRL Disposal injection in compliance with Directive 51 Guidelines and Approvals. Slide 71
72 Pelican Lake Water Information Pelican Lake Water Information Fresh Water (m3/day) - Quaternary and Grand Rapids Brackish Water (m3/day) - Grosmont Total Water (m3/day) Total Water per barrel of oil Brackish Water per barrel of oil Fresh Water per barrel of oil Produced Water Recycle (m3/day) Recycle Rates 64.8% 76.8% 83.4% 86.7% 80.5% 90.8% 95.3% 94.0% Oil Produced (bbl/day) Pelican Lake Water Information 2013 Monthly Jan Feb Mar Apr May Jun Jul Aug Sep Oct Nov Dec Fresh Water (m3/day) - Quaternary and Grand Rapids 4,610 5,266 5,553 5,517 5,603 5,748 5,762 5,717 5,951 5,849 5,825 5,722 Brackish Water (m3/day) - Grosmont 11,807 12,943 12,259 12,401 10,364 10,281 10,941 10,812 9,218 8,085 8,452 7,585 Total Water (m3/day) 16,417 18,209 17,812 17,918 15,967 16,029 16,702 16,529 15,169 13,934 14,277 13,307 Total Water per barrel of oil Brackish Water per barrel of oil Fresh Water per barrel of oil Produced Water Recylce (m3/day) Recycle Rates 93.30% 92.97% 93.96% 94.19% 95.05% 97.18% 97.28% 96.83% 96.41% 91.30% 90.01% 89.54% Oil Produced (bbl/day) 36,802 38,903 38,881 38,223 40,176 46,066 45,558 45,439 46,218 45,796 46,186 46,964 Slide 72

73 Water and Oilfield Disposal Map Slide 73
74 Disposal Well Data m3/d / W4/ Jul-13 8-Sep Oct Dec-13 Injected Volume (m3) Injection Pressure (kpa) kpa m3/d 00/ W4/ Jul-13 8-Sep Oct Dec-13 Injected Volume (m3) Injection Pressure (kpa) kpa m3/d 00/ W4/ Jan Apr Jul Oct-13 Injected Volume (m3) Injection Pressure (kpa) kpa m3/d 00/ W4/ Jan Apr Jul Oct-13 Injected Volume (m3) Injection Pressure (kpa) kpa Slide 74
75 AER Compliance Slide 75
76 Hydrogen Sulphide Souring of production to occur over time, currently in Engineering and Construction phase to ensure compliance across the entire Field to handle sour production (<1% H2S). H2S produced at padsitesand batteries is expected to be in low concentration and volume. CNRL collects solution gas at batteries and wellsitesin a common solution gas gathering system. Some well sites with total produced gas < 2e³m³ are now being scrubbed and vented if they have D60 approvals. Gas to be sweetened in field and at major facility sites (emulsion batteries, compressor station). Slide 76
77 AER Compliance CNRL continues to work with AER regarding injection well integrity: Formation/hydraulic isolation Cement bond Casing corrosion Facility souring gas gathering system conversion to handle solution gas production before it becomes an issue (integrity, licensing, environmental). Process of upgrading existing batteries and wellsitefacilities to meet current regulations and codes for the expected service (higher WCT, higher TDS, less than 1% H2S). Timeline to be completed over next 3-5 years throughout field (existing facilities met regulations at time of original construction). Priority on areas where we have seen corrosion through inspections, and areas with high water cut Slide 77
78 AER Compliance Canadian Natural Resources is not aware of any outstanding compliance issues regarding the current approvals. CNRL currently in compliance with other regulatory bodies (SRD, DFO, AENV). Reclamation programs: Well and Pipeline abandonments as required by Directives 65 and 13. Inactive wells: currently compliant. Long Term Inactives. Review future flood areas to properly downhole suspend/abandon wells within a reasonable time of start of injection (some wells to be completed for flood monitoring). Slide 78
79 Outstanding Applications Application (Approval 9673) Proposing to redrill the existing NBP8 00/ W4 injection well Slide 79
80 Conclusion Canadian Natural continues to be committed to maximizing the value of the resource for the both itself and the Province of Alberta through it s Royalty Interest Results from the polymer flood continue to be encouraging Continuing to evaluate the impacts of oil viscosity and water production on the ultimate performance and recovery under polymer flooding CNRL continues to optimize the operation of the flood and expand to new, more challenging areas CNRL has improved produced water recycle to record high levels New technology is under investigation to reduce costs, and increase recovery factor Compliance with all AER regulations, including cap rock integrity monitoring, and communication with the AER continues to be a top priority. Slide 80
81 THE FUTURE CLEARLY DEFINED Premium Value Defined Growth Independent
Murphy Oil Company LTD.
 Murphy Oil Company LTD. Seal Polymer Pilot Scheme Approval No. 11320B Annual ERCB Progress Presentation June 3, 2013 1 Agenda Subsurface Surface Conclusions 2 Subsurface Background Geology Drilling & Completions
Air injection & displacement for recovery with oil horizontal (AIDROH) project Approval #11618 Performance presentation
 project Approval #11618 Performance presentation") Air injection & displacement for recovery with oil horizontal (AIDROH) project Approval #11618 Performance presentation ERCB offices Calgary February 2013 Advisory This document contains forward-looking
Air injection & displacement for recovery with oil horizontal (AIDROH) project Approval #11618 Performance presentation ERCB offices Calgary February 2013 Advisory This document contains forward-looking
Cenovus EnCAID approval #10440J Performance presentation
 Cenovus EnCAID approval #10440J Performance presentation Claire Hong Staff Production/Completion Engineer Dubert Gutierrez Sr. Reservoir Engineer AER offices Calgary February 2015 Advisory This document
JAPAN CANADA OIL SANDS LTD. HANGINGSTONE DEMO PROJECT 2004 Presented on Monday, March 7, 2005 Presentation Outline
 Thermal In-Situ Scheme Progress Report JAPAN CANADA OIL SANDS LTD. HANGINGSTONE DEMO PROJECT 2004 Presented on Monday, March 7, 2005 Presentation Outline 1. Introduction Project Background, Activity Summary
Seal Main HCSS Pilot Approval Annual Performance Presentation
 Seal Main HCSS Pilot Approval 11377 Annual Performance Presentation 11-Feb-2015 Agenda Introductions Seal Main Horizontal Cyclic Steam Stimulation (HCSS) Pilot Subsurface Surface Harmon Valley South HCSS
Moving from Secondary to Tertiary Recovery Stages. 9 TH ANNUAL WYOMING EORCO2 CONFERENCE JULY 14-16, 2015 Casper, WY By Jim Mack MTech Ventures LLC
 Moving from Secondary to Tertiary Recovery Stages 9 TH ANNUAL WYOMING EORCO2 CONFERENCE JULY 14-16, 2015 Casper, WY By Jim Mack MTech Ventures LLC 1 Outline Reservoir Data Geologic Data Formation Data
January 2011 to September 2012 Kirby ERCB Directive 54 Annual Performance Presentation
 January 2011 to September 2012 Kirby ERCB Directive 54 Annual Performance Presentation September 26, 2012 Premium Value Defined Growth Independent OUTLINE PAGE # Kirby Approval 11475 (South) 5-69 Background
Pelican Lake SAGD Pilot Approval 11469A 2011 Update. ERCB Offices March 21, 2012.
 Approval 11469A 2011 Update ERCB Offices March 21, 2012. Introduction and Overview Introduction Subsurface Issues Related to Resource Evaluation and Recovery Directive 054, Section 3.1.1 Surface Operations,
Effects of Enhanced Oil Recovery on Production Engineers, Elm Coulee Field, Bakken Reservoir, Richland County, Montana
 Montana Tech Library Digital Commons @ Montana Tech Petroleum Engineering Faculty Scholarship 9-2013 Effects of Enhanced Oil Recovery on Production Engineers, Elm Coulee Field, Bakken Reservoir, Richland
Timber Creek Field Study for Improving Waterflooding
 The 2 nd Minnelusa Workshop of EORI Timber Creek Field Study for Improving Waterflooding Shaochang Wo Gillette, Wyoming June 4, 2014 Project Summary and Timeline A collaborative study between EORI and
Progressing C-SAGD recovery of bitumen from the Grosmont D reservoir
 Progressing C-SAGD recovery of bitumen from the Grosmont D reservoir LARICINA ENERGY Steve Brand P. Eng. WHOC15-280 Organized by: Outline Project overview 1D experience and knowledge gained Early cycle
Pelican Lake SAGD Pilot
 Pelican Lake SAGD Pilot AER Approval 11469B April 16, 2015 Annual Update January 1, 2014 December 31, 2014 Disclaimer This Cenovus Pelican Lake SAGD Pilot January 1, 2014 to December 31, 2014 Update (
Waterflood Monitoring and Management. On-Line Monitoring. Waterflood Monitoring and Management. Waterflood Systems
 Waterflood Monitoring and Management 1 2 Waterflood Monitoring and Management Waterflood Systems Injection System: Water supply system, Injection wells Reservoir System Production System: Production wells,
Telephone Lake project
 Telephone Lake project Cenovus Energy Inc. is a Canadian oil company. We re committed to applying fresh, progressive thinking to safely and responsibly unlock energy resources the world needs. Our operations
Gaps and Challenges for Light and Tight EOR
 Gaps and Challenges for Light and Tight EOR Williston Basin Petroleum Conference Regina, May 3, 2017 Presented by Kelvin (Kelly) D. Knorr, P. Eng. Operations Manager, Energy Division Saskatchewan Research
Thermal Recovery Status and Development Prospect for Heavy Oil in China
 UNITAR Centre for Heavy Crude and Tar Sands 1998 1 No.1998.198 Thermal Recovery Status and Development Prospect for Heavy Oil in China Liu Wenzhang Research Institute of Petroleum Exploration and Development,
Recovery Process - Cold Heavy Oil
 Recovery Process - Cold Heavy Oil CHOPS (Cold Heavy Oil Production with Sand) CHOPS is a heavy oil recovery technique where the reservoir sand is deliberately produced to improve reservoir performance.
The SPE Foundation through member donations and a contribution from Offshore Europe
 Primary funding is provided by The SPE Foundation through member donations and a contribution from Offshore Europe The Society is grateful to those companies that allow their professionals to serve as
Steam Injection. Dr. Helmy Sayyouh Petroleum Engineering Cairo University
 Steam Injection Dr. Helmy Sayyouh Petroleum Engineering Cairo University 1 Increasing Temperature Lowers Viscosity... Fig. 11-1 2 Single-Parameter Viscosity Correlation Fig. 11-5 Two-parameter correlation
6 DRILLING AND COMPLETIONS
 Cenovus FCCL Ltd. 6-1 Drilling and Completions 6 DRILLING AND COMPLETIONS 6.1 OVERVIEW This section contains information about the drilling and completion of wells within the CLTP. Well counts, locations
EnCana Christina Lake In Situ Oil Sands Scheme 2007 Update
 EnCana Christina Lake In Situ Oil Sands Scheme 2007 Update June 8, 2007 June 8, 2007 Agenda Introduction Geology and Geophysics Project Performance Operations and Water Compliance Gas Over Bitumen SAP
Production Performance Optimisation
 Production Performance Optimisation Unlocking the Value of Marginal Assets: Production Optimisation through Effective Integrated Production System Modelling by Fortune Bikoro, Ph.D. Gas Lift Workshop -
PRODUCTION WELL WATER SHUT-OFF TREATMENT IN A HIGHLY FRACTURED SANDSTONE RESERVOIR
 WRI-01-R010 PRODUCTION WELL WATER SHUT-OFF TREATMENT IN A HIGHLY FRACTURED SANDSTONE RESERVOIR Final Report By Lyle A. Johnson Jr. July 2001 Work Performed Under Cooperative Agreement DE-FC26-98FT40323
Enhanced Oil Recovery. Chemical Flooding. ENHANCED OIL RECOVERY Cairn India Limited.
 Enhanced Oil Recovery Chemical Flooding. 2 3 Enhanced Oil Recovery (EOR) is a term for special techniques to increase the amount of crude oil that can be extracted from a field, over and above conventional
Appraising the Performance of Cyclic Production Scheme through Reservoir Simulation, a Case Study Tariq Al-Zahrani, Saudi Aramco
 SPE 152151 Appraising the Performance of Cyclic Production Scheme through Reservoir Simulation, a Case Study Tariq Al-Zahrani, Saudi Aramco Copyright 2012, Society of Petroleum Engineers This paper was
CANADIAN NATURAL RESOURCES LIMITED
 PERFORMANCE PRESENTATION FOR IN-SITU OIL SANDS SCHEMES CANADIAN NATURAL RESOURCES LIMITED LINDBERGH MOOSEHILLS MOOSEHILLS APPROVAL # s 9387, 9415 LINDBERGH APPROVAL # s 8017, 8069, 8087, 8174, 8434, 8908
Frequently Asked Questions
 Frequently Asked Questions Directive 083: Hydraulic Fracturing Subsurface Integrity January 2016 Q1. How does the AER differentiate between a dual- and single-barrier system? A1. A dual-barrier system
Electric Forward Market Report
 Mar-01 Mar-02 Jun-02 Sep-02 Dec-02 Mar-03 Jun-03 Sep-03 Dec-03 Mar-04 Jun-04 Sep-04 Dec-04 Mar-05 May-05 Aug-05 Nov-05 Feb-06 Jun-06 Sep-06 Dec-06 Mar-07 Jun-07 Sep-07 Dec-07 Apr-08 Jun-08 Sep-08 Dec-08
VALUE I GROWTH I INNOVATION. AER 2014 Annual Presentation. Saleski Thermal Pilot AER Approval 11337
 VALUE I GROWTH I INNOVATION AER 2014 Annual Presentation Saleski Thermal Pilot AER Approval 11337 September 2014 Agenda Background Project Overview Geological Update Scheme Performance Facility Performance
SPE Abstract. Introduction
 SPE 149944 Succesful Application of Metal PCP Rechnology to Maximize Oil Recovery in SAGD Process R. Arystanbay, SPE, W. Bae, SPE, Huy X. Nguyen, SPE, Sejong University; S. Ryou, SPE, W. Lee, T. Jang,
SHALE FACTS. Production cycle. Ensuring safe and responsible operations
 SHALE FACTS Production cycle Ensuring safe and responsible operations Statoil is committed to developing our shale projects in a safe, responsible and open manner. Statoil takes a long term perspective
Optimal Tertiary Recovery Strategies for Mature Wells. More Oil, Naturally. Daan Veeningen
 Optimal Tertiary Recovery Strategies for Mature Wells More Oil, Naturally Daan Veeningen August 26 th, 2015 Offsetting Price: More Oil Discovering New Fields Exploiting Tight Fields Extracting Mature Fields
Enhanced Coalbed Methane (ECBM) Field Test at South Qinshui Basin, Shanxi Province, China
 Field Test at South Qinshui Basin, Shanxi Province, China") Enhanced Coalbed Methane (ECBM) Field Test at South Qinshui Basin, Shanxi Province, China Bill Gunter, Sam Wong, David Law, ARC Feng Sanli,Ye Jianping, Fan Zhiqiang, CUCBM GCEP workshop August 22-23, 2005
Enhanced Coalbed Methane (ECBM) Field Test at South Qinshui Basin, Shanxi Province, China Bill Gunter, Sam Wong, David Law, ARC Feng Sanli,Ye Jianping, Fan Zhiqiang, CUCBM GCEP workshop August 22-23, 2005
WATER-BASED ENHANCED OIL RECOVERY(EOR)
") WATER-BASED ENHANCED OIL RECOVERY(EOR) Global Water-Based EOR Potential is Estimated at 750 Billion Barrels - Shell 1 2 REDEFINING WATER TREATMENT FOR THE OIL & GAS INDUSTRY H 2 Ocean Spectrum TM technology
WATER-BASED ENHANCED OIL RECOVERY(EOR) Global Water-Based EOR Potential is Estimated at 750 Billion Barrels - Shell 1 2 REDEFINING WATER TREATMENT FOR THE OIL & GAS INDUSTRY H 2 Ocean Spectrum TM technology
Connectivity Analysis; Understanding Waterflood Behavior, Connectivity for EOR Analysis. Richard Baker September-2012 Jackson Hole Wyoming
 Connectivity Analysis; Understanding Waterflood Behavior, Connectivity for EOR Analysis Richard Baker September-2012 Jackson Hole Wyoming Outline Executive Summary Background/What are we trying to do?
SACROC CO 2 Flood Project Challenges: Past, Present, and Future
 SACROC CO 2 Flood Project Challenges: Past, Present, and Future Presented at the 19 th Annual CO 2 Flooding Conference December 11-13, 2013 Midland, Texas 1 SACROC is in the Kelly-Snyder Field, largest
This presentation is based upon work supported by the Department of Energy National Energy Technology Laboratory under DE FC26 05NT42590 and was
 Experimental Monitoring at SECARB s Citronelle Field Site (Coming soon to a CO 2 EOR project near you!) Prepared For: Surveillance and Monitoring of CO 2 Injection Projects Short Course Prepared By: George
Husky Oil Operations Limited Tucker Thermal Project Commercial Scheme #9835
 Husky Oil Operations Limited Tucker Thermal Project Commercial Scheme #9835 Annual Performance Presentation Energy Resources Conservation Board May 23 rd, 2013 1 3.1.1. Subsurface Issues Table of Contents
Shell Canada Limited. Shell s Comments for Phase 4: Oral Proceeding Related to Alberta Energy Regulator Proceeding No
 Shell Canada Limited Shell s Comments for Phase 4: Oral Proceeding Related to Alberta Energy Regulator Proceeding No. 1769924 January 22, 2014 Good (morning/afternoon) Panel Members, AER staff, members
2016 Sluggin It Out Conference Mike Verney Associate
 2016 Sluggin It Out Conference Mike Verney Associate 1 » Operating Projects» Netback prices at various WTI assumptions» Reported operating costs» Break Even short term pricing fluctuations» Break Even
MEG Energy. Christina Lake. 2016/2017 Performance Presentation Commercial Scheme Approval No
 MEG Energy Christina Lake MasterProject PowerPoint Regional 2016/2017 Performance Presentation Commercial Scheme Approval No. 10773 June 13, 2017 Disclaimer This presentation is not, and under no circumstances
CAP Excess Water Task Force
 Agenda Number 2. CAP Excess Water Task Force Patrick Dent PE CAP Water Control Manager September 6, 2017 Introduction Excess Water is defined as all Project Water that is in excess of the amounts used,
For personal use only Operations Update
 2016 Operations Update 1 Highlights 2016 is set to be an exciting year of delivery for Range Most active onshore work programme in Trinidad amongst independents Largest scale waterflood projects in recent
Building an Enhanced Oil Recovery Culture to Maximise Asset Value. Marco Rotondi Stavanger, 28 th April 2015
 Building an Enhanced Oil Recovery Culture to Maximise Asset Value Marco Rotondi Stavanger, 28 th April 2015 Building an Enhanced Oil Recovery Culture - Agenda 1 Introduction 2 Challenges & Solutions 2.1
Upstream Production Measurement Solutions
 Upstream Production Measurement Solutions Superior flow and density measurement Best-in-class measurement It s challenging to keep a balance between operations, maintenance and compliance, while delivering
SPE Introduction. Objectives. There are three primary objectives of this new pumping method:
 SPE 109141 Using a New Artificial-Lift System in Mexican Mature Oil Fields Vann Roy R./Vann Pumping, Gachuz-Muro Heron/Pemex E&P, Alcazar-Cancino Luis O./Pemex E&P, Guerra-López Mauricio/LLEGAR EOR International
This is Reservoir Engineering COPYRIGHT. By the end of this lesson, you will be able to:
 Learning Objectives This is Reservoir Engineering By the end of this lesson, you will be able to: Describe what reservoir engineers do, and why they do it Describe the general layout and structure of this
ADVANCED OIL RECOVERY
 ADVANCED OIL RECOVERY Low Cost Enhanced Oil Recovery Releases Trapped Oil Alters Production Declines No Capital Expense Increases Reserves 92% Average Production Increases World Wide The Titan Process
This document can be made available in other accessible formats as soon as practicable and upon request. Staff Report. Infrastructure & Public Works
 This document can be made available in other accessible formats as soon as practicable and upon request Staff Report Infrastructure & Public Works Report To: Committee of the Whole Meeting Date: March
The Alberta Energy Regulator (AER) has approved this directive on February 17, 2016.
 has approved this directive on February 17, 2016.") Directive 007 Release date: February 17, 2016 Effective date: February 17, 2016 Replaces previous edition issued February 25, 2015 Volumetric and Infrastructure Requirements The Alberta Energy Regulator
Directive 007 Release date: February 17, 2016 Effective date: February 17, 2016 Replaces previous edition issued February 25, 2015 Volumetric and Infrastructure Requirements The Alberta Energy Regulator
Historic IOR/EOR practices in the Minnelusa
 Historic IOR/EOR practices in the Minnelusa Jim Mack & Mike Lantz EORI Minnelusa Workshop Gillette, WY, May 6-7, 2013 Outline Introduction: Why EOR in the Minnelusa? Historical Development of Minnelusa
BC Hydro Generation system operation Columbia Basin Regional Advisory Committee
 BC Hydro Generation system operation Columbia Basin Regional Advisory Committee Renata Kurschner Director, Generation Resource Management 11 September 2014 Generation System Operation Coordination of provincial
E&P A Hart Energy Publication
 E&P A Hart Energy Publication GLOBAL EXPLORATION & PRODUCTION NEWS November 2009 MEOR finds oil where it has already been discovered On average, with the best currently available technology, only 35% to
Electric Price Outlook April 13, 2017
 Electric Price Outlook April 13, 2017 Scott Drzycimski, Director Customer, Community and Economic Development Jason Nielsen, Manager Regulatory Affairs Keeping you informed Ongoing pricing outlook webinars
Ikatan Ahli Teknik Perminyakan Indonesia Simposium Nasional dan Kongres X Jakarta, November Makalah Profesional IATMI
 Ikatan Ahli Teknik Perminyakan Indonesia Simposium Nasional dan Kongres X Jakarta, 12 14 November 28 Makalah Profesional IATMI 8-39 utilization as an alternative artificial lift in Sembakung field, East
ISO Monitoring and Measurement Nonconformance and Corrective and Preventative Action
 ISO 14001 4.5.1 Monitoring and Measurement 4.5.2 Nonconformance and Corrective and Preventative Action 4.5.1 Monitoring and Measurement The organization shall establish and maintain documented procedures
Project Summary Table BlackPearl Resources Inc Blackrod Commercial SAGD Project Proponent Name: BlackPearl Resources Inc. Date: November, 2011
 Project Summary Table BlackPearl Resources Inc Blackrod Commercial SAGD Project Proponent Name: BlackPearl Resources Inc. Date: vember, 2011 Project Name: Blackrod Commercial SAGD Project Company Contact
Analysis Fraction Flow of Water versus Cumulative Oil Recoveries Using Buckley Leverett Method
 Analysis Fraction Flow of Water versus Cumulative Oil Recoveries Using Buckley Leverett Method Reza Cheraghi Kootiani, and Ariffin Bin Samsuri International Science Index, Physical and Mathematical Sciences
SOUTH CASPER CREEK: Steamflood Pilot Implementation
 SOUTH CASPER CREEK: Steamflood Pilot Implementation By: Jeremy Wagner, Citation Oil and Gas Corp. 2010 Wyoming EOR/IOR Conference Jackson, WY Sept 13-14, 2010 SCC South Casper Creek (SCC) brief overview
Traffic Division Public Works Department Anchorage: Performance. Value. Results.
 Mission Promote safe and efficient area-wide transportation that meets the needs of the community and the Anchorage Municipal Traffic Code requirements. Direct Services Design, operate and maintain the
Feasibility of Gas Drive in Fang-48 Fault Block Oil Reservoir
 2007 Petroleum Science Vol.4 No.3 Feasibility of Gas Drive in Fang-48 Fault Block Oil Reservoir Cui Lining 1, 2, Hou Jirui 1, 2 and Yin Xiangwen 1, 2 (1. Key Laboratory of Petroleum Engineering under Ministry
Adjustment to Oil Saturation Estimate Due to Various Reservoir Drive Mechanisms
 Cloud Publications International Journal of Advanced Petroleum Engineering and Technology 2014, Volume 1, Issue 1, pp. 17-26, Tech-316 Research Article Open Access Adjustment to Oil Saturation Estimate
Incremental Oil Recovery from Depleted Oilfields in a Low Oil Price Environment
 Incremental Oil Recovery from Depleted Oilfields in a Low Oil Price Environment Bringing New Life to Mature, Depleted Oil Fields ENERCOM S THE OIL & GAS CONFERENCE DENVER, COLORADO AUGUST 13-17, 2017 An
Annual Environmental Report for Glennon Bros. Cork Ltd.
 Annual Environmental Report for Glennon Bros. Cork Ltd. Period: January 2009 to December 2009 To: The Environmental Protection Agency From: Glennon Bros. Cork Ltd. License no. P0344-01 Date: 31/03/2010
Outlook for Natural Gas Demand for Winter
 Outlook for Natural Gas Demand for 2010-2011 Winter Energy Ventures Analysis, Inc. (EVA) Overview Natural gas demand this winter is projected to be about 295 BCF, or 2.5 percent, above demand levels recorded
Mechanism of Excessive Water Production in an Iranian Offshore Oilfield
 2012 International Conference on Bioscience, Biochemistry and Bioinformatics IPCBEE vol.3 1(2012) (2012)IACSIT Press, Singapoore Mechanism of Excessive Water Production in an Iranian Offshore Oilfield
Bureau of Land Management Oil and Gas Program
 Bureau of Land Management Oil and Gas Program Presentation to the Production Accountants Society of Oklahoma Steve Tryon, Field Manager February 6, 2013 The Bureau of Land Management (BLM) is a small agency
Permian Field Tour. Occidental Petroleum Corporation. October 11, 2017
 Permian Field Tour Occidental Petroleum Corporation October 11, 2017 Permian Field Tour Permian Resources Permian EOR 2 Technology + Innovation Value Based Development System Oxy s Competitive Advantage
Data Collection by National Regulators
 Data Collection by National Regulators Revision 6 Page 1 of 17 Data Collection by National Regulators Revision 6 December 20 th, 2012 Data Collection by National Regulators Revision 6 Page 2 of 17 Contents
Canadian Natural Resources Limited
 2014 ABAER 008 Canadian Natural Resources Limited Application for Disposal Lloydminster Field July 28, 2014 ALBERTA ENERGY REGULATOR Decision 2014 ABAER 008: Canadian Natural Resources Limited, Application
Heating the University of Glasgow with river sourced heat pumps. Adam McConkey Andrew Poon-King Zhibin Yu
 Heating the University of Glasgow with river sourced heat pumps Adam McConkey Andrew Poon-King Zhibin Yu Opportunity - Reduce Glasgow University s 1.9 m gas bill - The University is set to upgrade its
Renewable Energy in The Netherlands
 Renewable Energy in The Netherlands Dr. Martien Visser Professor Energy Transition & Network Integration Hanze University of Applied Sciences Groningen Partner of the Energy Academy Europe E-mail: b.m.visser@pl.hanze.nl
MONTHLY UPDATE REPORT - PRIMROSE SOUTH W4M AUGUST 19 TO SEPTEMBER 22, 2014
 MONTHLY UPDATE REPORT - PRIMROSE SOUTH 09-21-067-04 W4M AUGUST 19 TO SEPTEMBER 22, 2014 1 Introduction The Primrose South in situ oil sands project is located in the Cold Lake Air Weapons Range approximately
Reservoir Engineering
 Reservoir Engineering How much oil is in place? How much oil is recoverable? How can I maximize oil recovery? Under economic constraints Origin of Petroleum Where are the resources? Traps Dome trap Fault
Production/Injection Optimization Using Numerical Modeling at Ribeira Grande, São Miguel, Azores, Portugal
 Proceedings World Geothermal Congress 21 Bali, Indonesia, 25-29 April 21 Production/Injection Optimization Using Numerical Modeling at Ribeira Grande, São Miguel, Azores, Portugal Minh Pham 1, Chris Klein
Forward Looking Statements
 December 8 10, 2009 Forward Looking Statements This document contains forward-looking statements. All statements other than statements of historical facts included in this document, including but not limited
Oil Sands Development in Canada by SAGD - Further Challenges to Improve Efficiency -
 Oil Sands Development in Canada by SAGD - Further Challenges to Improve Efficiency - Nov-29, 2017 JAPEX (Japan Petroleum Exploration Co., Ltd) Canada Oil Sands Project Dept. Tanetomo (Tom) Izumi Japan
Well-Based Monitoring
 Rick Chalaturnyk Petroleum Geomechanics Research Group Department of Civil and Environmental Engineering University of Alberta Well-Based Monitoring IEA MONITORING and VERIFICATION NETWORK Meeting 2006
Cold Lake expansion project
 Cold expansion project Initial project description Plain language summary March 2016 Our commitment Imperial Oil Limited s success depends on our ability to maintain an open dialogue with, and ongoing
CO 2 EOR Operational Considerations Case Study
 Taking on the World s Toughest Energy Challenges. TM CO 2 EOR Operational Considerations Case Study James D. Rose Business Development Manager, Asia Pacific 1 Introduction China has fields that should
Water Conservation, Efficiency and Productivity Plan Progress Report Upstream Oil and Gas Sector
 Guide Water Conservation, Efficiency and Productivity Plan Progress Report Upstream Oil and Gas Sector January 2016 2016-0037 The Canadian Association of Petroleum Producers (CAPP) represents companies,
New Hope Crushed Stone. Monthly Update Solebury Communications Group October 2017
 New Hope Crushed Stone Monthly Update Solebury Communications Group October 2017 Tom Wolf, Governor Patrick McDonnell, Secretary October 2017 Project Status STATUS AS OF: October 31, 2017 PROJECT START
New Acid Stimulation Treatment to Sustain Production Los Angeles Downtown Oil Field U.S. Department of Energy Grant No.
 New Acid Stimulation Treatment to Sustain Production Los Angeles Downtown Oil Field U.S. Department of Energy Grant No. DE-FG26-99BC15247 Richard C. Russell St. James Oil Corporation Abstract New Acid
PRELIMINARY FEASIBILITY STUDY
 PRELIMINARY FEASIBILITY STUDY OF THE CADOTTE LEASES ALBERTA, CANADA REPORT NUMBER: QE-25620080229 REPORT DATE: FEBRUARY 29, 2008 Prepared on Behalf of: Strata Oil and Gas, Inc. Norwest Questa Engineering
Hydraulic Fracturing & Public Health: What we know, what we can infer and how we can move forward
 Hydraulic Fracturing & Public Health: What we know, what we can infer and how we can move forward Merry Turtiak, Alberta Health Canadian Public Health Association 2014 May 29, 2014 Overview The Basics:
Low Energy/Emissions EOR
 Low Energy/Emissions EOR June, 2004 New Paradigm Engineering Ltd. Overview What is the EOR Prize? Gas Injection Concepts Business Case for Moving Now Unique Opportunities in SE Saskatchewan? Next Steps
Ground-Coupled Heat Pump And Energy Storage
 Ground-Coupled Heat Pump And Energy Storage By Ed Lohrenz, Member ASHRAE; and Sergio Almeida, P.Eng., Member ASHRAE Ground-coupled heat pump (GCHP) systems consume less purchased energy than an HVAC system
Draft Directive 051. Wellbore Injection Requirements. Contents. Revised edition August 14, Replaces previous edition issued March 1994.
 Draft Directive 051 Revised edition August 14, 2012. Replaces previous edition issued March 1994. Wellbore Injection Requirements The Energy Resources Conservation Board (ERCB/Board) has approved this
Heavy Oil Reservoir Characterization Using Low Field NMR
 Heavy Oil Reservoir Characterization Using Low Field NMR Jonathan Byran* University of Calgary and TIPM Laboratory, Calgary, AB jlbryan@ucalgary.ca A. Kantzas University of Calgary and TIPM Laboratory,
Stormwater Reuse Through Aquifer Storage & Recovery
 Stormwater Reuse Through Aquifer Storage & Recovery CITY OF NAPLES, FLORIDA PRESENTED BY: GREGG R. STRAKALUSE, P.E. DIRECTOR-STREETS & STORMWATER DEPT. DECEMBER 12, 2014 FLORIDA STORMWATER ASSOCIATION
Well Pad Automation Improves Capital Efficiency and Reduces Fiscal Risk Michael Machuca* Emerson Process Management
 URTeC: 1874921 Well Pad Automation Improves Capital Efficiency and Reduces Fiscal Risk Michael Machuca* Emerson Process Management Copyright 2014, Unconventional Resources Technology Conference (URTeC)
BP Alaska Heavy Oil Production from the Ugnu Fluvial-Deltaic Reservoir*
 BP Alaska Heavy Oil Production from the Ugnu Fluvial-Deltaic Reservoir* Josef Chmielowski 1 Search and Discovery Article #80289 (2013)** Posted May 27, 2013 *Adapted from oral presentation given at 2013
OIL & GAS. solutions and services. tecnologiasparis.net/klmoilllc.com. Paris Technologies
 OIL & GAS solutions and services OIL KLM Partner Company LLC, KLM OIL MX and MX TECHNOLOGIES PARIS tecnologiasparis.net/klmoilllc.com CK-1430 TECNOLOGY We discovered the CK-1430 as result of years of investigations
Final Flexible Capacity Needs Assessment for 2018
 Final Flexible Capacity Needs Assessment for 2018 April 28, 2017 1 Table of Contents 1. Introduction... 3 2. Summary... 3 3. Defining the ISO System-Wide Flexible Capacity Need... 5 4. Forecasting Minute-by-Minute
Bauxite & Alumina. Johnny Undeli. Capital Markets Day 2013 (1)
") Bauxite & Alumina Johnny Undeli Capital Markets Day 2013 (1) World-class asset base, focus on operational improvements Alunorte temporary production setback, operational improvements being implemented
Bauxite & Alumina Johnny Undeli Capital Markets Day 2013 (1) World-class asset base, focus on operational improvements Alunorte temporary production setback, operational improvements being implemented
Situation and Outlook of the Canadian Livestock Industry
 Situation and Outlook of the Canadian Livestock Industry 2011 USDA Agricultural Outlook Forum Tyler Fulton February 25, 2011 tyler@hamsmarketing.ca Lost in Translation Canadian Livestock Industry - Outline
Safely Harvesting Energy
 ONTARIO OIL AND NATURAL GAS PRODUCTION Safely Harvesting Energy An Overview of Hydraulic Fracturing in Ontario A Briefing Note prepared by the: Ontario Petroleum Institute Executive Summary The Ontario
Water Management Barnett Shale November 21, 2008
 Water Management Barnett Shale November 21, 2008 Today s Discussion Hydraulic fracturing & water use Saltwater disposal Water transport options Brentwood water pipeline systems Recycling technology Questions
Jubilee Field Reservoir Description and Waterflood Performance Overview Stephen Sills, Kosmos Energy, and Dominic Agyapong, Tullow Oil
 OTC 23451 Jubilee Field Reservoir Description and Waterflood Performance Overview Stephen Sills, Kosmos Energy, and Dominic Agyapong, Tullow Oil Copyright 2012, Offshore Technology Conference This paper
Thermal In-Situ Scheme Progress Report for 2014 Japan Canada Oil Sands Limited Hangingstone
 Thermal In-Situ Scheme Progress Report for 2014 Japan Canada Oil Sands Limited Hangingstone Approval Nos. 8788 (Demo) & 11910 (Expansion Project) Presented on February 17, 2015 1. Background - Hangingstone