Mr. Fred Logan. Type of Document Final
|
|
|
- Dora Brooks
- 6 years ago
- Views:
Transcription

1 Mr. Fred Logan Revised Hydrogeology, Terrain Analysis and Impact Assessment Report Type of Document Final Project Name Hydrogeology, Terrain Analysis and Impact Assessment Jock River Estates Phase II Formerly Village of Richmond City of Ottawa, Ontario Project Number OTEN B Prepared By: Reviewed By: Shawn Doherty, P.Eng. Mark McCalla, P.Geo. exp Services Inc Queensview Drive Ottawa, ON K2B 7H6 Canada Date Submitted September 28, 2011
2


3
4
5 Mr. Fred Logan Hydrogeology, Terrain Analysis and Impact Assessment Report Jock River Estates Phase II, Formerly Village of Richmond City of Ottawa, Ontario OTEN B September 28, 2011 Executive Summary Exp Services Inc. (formerly Trow Associated Inc.) was originally retained by Mr. GB Padam to conduct a hydrogeological investigation and related studies for a proposed residential subdivision on Sangeet Place in the City of Ottawa, Ontario (formerly Village of Richmond). Refer to Figures 1 & 2 in Appendix A for the site location and surrounding area. Following the submission of the first version of the hydrogeological report, we were then retained by Mr. Fred Logan to conduct any investigations and additional revisions. It is proposed that the property will be subdivided into 11 residential lots with average lot sizes of approximately 0.84 hectare (2.1 acres) as shown on Figure 3 in Appendix A. The development will be serviced by individual water wells and Class IV sewage disposal systems. The purpose of the investigation described within was to assess the suitability of the site for development on private services. The assessment consisted of the following tasks: On-site hydrogeologic conditions were investigated through the construction and testing of two domestic water wells. The wells were drilled on the subject property in December, 2008 by Air- Rock Drilling Company in accordance with Ontario Regulation 903. An existing water well (TW3), located on Lot #1 of the development was also tested. The Water Well Records for the two new water wells are included in Appendix B. Water quantity was assessed on the basis of six-hour constant-rate pumping tests conducted on the wells and subsequent recovery tests. Water quality was evaluated through chemical and bacteriological analysis of samples collected at the beginning and end of each pumping test. All field and desktop work as part of this hydrogeological investigation was done in general accordance with MOE Procedure D-5-5. Overburden soil conditions at the subject site were investigated through the completion of 6 test pits in December Each test pit was logged for depth, soil characteristics and groundwater conditions. Three of the test pits were subsequently outfitted with slotted standpipes to determine the overburden static water elevation. An assessment was undertaken to determine the nature of any impacts to downgradient groundwater resources arising from the installation of on-site sewage disposal systems. Long term monitoring of TW2 was conducted to assess long term impacts from the neighbouring golf course s permit to take water on the future wells. On the basis of the information obtained, recommendations for the construction of water wells and on-site sewage disposal systems are presented. Based on the above work program, the following are the conclusions: 1. Water well records for 18 wells drilled near the site, the neighbouring development to the north identified as Phase I, indicate that well yields are in excess of the required 13.6 L/min. The wells generally extend to depths ranging from 14 to 55 m from surface. 2. Two water supply wells were completed in limestone bedrock on the property and an existing well located on Lot #1 was also tested in support of this assessment. Six-hour constant rate pumping tests followed by recovery tests conducted on each of these wells indicate well yields at or in I
6 Mr. Fred Logan Hydrogeology, Terrain Analysis and Impact Assessment Report Jock River Estates Phase II, Formerly Village of Richmond City of Ottawa, Ontario OTEN B September 28, 2011 excess of the tested rates. These rates are more than adequate to supply the MOE recommended L/min flow rate for a 4-bedroom residence. 3. The wells drilled within the subject property are suspected of drawing water from high yield water bearing fractures likely within the Oxford Formation. 4. A water level datalogger was installed in TW2 for a period of 11 days in the month of August and 7 days in the month of September to identify potential changes in the aquifer static levels based on high water usage from the Centennial Golf Course. No changes in water levels were identified and static water levels from all readings are relatively constant. 5. The pumping tests indicate that minor well interference was noted at selected monitoring wells during the pumping tests, suggesting a hydraulic connection between two of the wells. However, the pumping tests were conducted at flow rates well above the anticipated household flow rates. A conservative evaluation of the well interference at the site predicts a drawdown ranging from 0.16 m/well at the center of the property to 0.13 m/well at the property limits based on standard water usage over 30 years. 6. Groundwater quality in the bedrock aquifer met all health related criteria of the Ontario Drinking Water Standards for those parameters tested after all testing was complete. Turbidity and hardness were noted to be above the applicable aesthetic objective guidelines at the end of the test in each of the test wells. Given that the minimal aesthetic objectives can be easily treated, they are not considered to be a concern. All concentrations were below the D-5-5 treatability limits and exp considers the groundwater to be suitable for use as potable water. 7. The construction of 6 test pits revealed that surficial soil deposits consist of sandy topsoil and organic material. This material is underlain by weathered limestone bedrock over most of the subject site, but closer to the river, there is a glacial till unit that consists of either clayey silt (Test Pit #5 on Lot #5) or silty sand (Test Pit #6 on Lot #6) between the topsoil and 0.5 m of weathered bedrock. Therefore, raised field beds are likely going to be required to minimize impact to the septic systems to the shallow groundwater and the poorly draining material. 8. The thin soil veneer at the site has posed some questions regarding potential septic effluent impact to the aquifer. Based on a detailed test pit / shovel excavation program, it is our opinion that the site is not considered to be sensitive and that the aquifer (with no fractures less than 10 m from surface) is not under risk. Exp sampled two existing residential wells and TW3 (located within 60 m of neighbouring septic systems) and did not find any elevated nitrate/nitrite, surficial related impacts, elevated sodium from softeners that would suggest short circuiting of the aquifer. 9. A nitrate impact assessment indicates that the installation of the Class IV sewage disposal systems will not result in unacceptable degradation of the water supply aquifer at the downgradient site boundary. All zones of surficial bedrock / roadways and other non-permeable areas were omitted from the calculation. In summary, the proposed residential development was assessed through a review of the neighbouring site conditions as well as a more detailed investigation (intrusive) within the site. Monitoring and sampling programs were designed to assess the current impacts stemming from pesticide / herbicide use and high water yield to which no impacts were observed. The program also focused on assessing impacts from the Jock River by reviewing potential surface water impact infiltration into TW2 at which no indication of impacts were noted. Finally, water samples were also collected from neighbouring dwellings (with similar soil conditions) and assessed for septic impacts to which none were noted. Based on the results of the hydrogeological, terrain and impact assessment evaluation, it is recommended that the proposed residential development be approved for development. II
7 Mr. Fred Logan Hydrogeology, Terrain Analysis and Impact Assessment Report Jock River Estates Phase II, Formerly Village of Richmond City of Ottawa, Ontario OTEN B September 28, 2011 Table of Contents Executive Summary 1.0 Introduction General Methodology Original Workplan for March 2009 Submission Addendum #1 Workplan Addendum #2 Workplan Site Location and Physiography Environmental Impacts Topography / Drainage Geology Surficial Geology Bedrock Geology Desktop Hydrogeology Conceptual Hydrogeological Model Summary Hydrogeology Neighbouring Site Hydrogeology Well Construction Water Quantity Well Yields Well Interference Cumulative Well Impact Summary Water Quality General Test Well # Test Well # Test Well # Summary Neighbourhood Wells / Property Treatment Systems I III
8 Mr. Fred Logan Hydrogeology, Terrain Analysis and Impact Assessment Report Jock River Estates Phase II, Formerly Village of Richmond City of Ottawa, Ontario OTEN B September 28, Sewage Disposal Site Sensitivity Background Work Program Soil Results / Terrain Analysis Impact Assessment Nitrate Impact Assessment Shoreline Setback Assessment Conclusions Recommendations References 37 List of Tables Table 1: Well Construction Summary... 7 Table 2: Well Interference Measurements Table 3: Recommended Shoreline Scores List of Appendices Appendix A: Figures Appendix B: MOE Well Records Appendix C: Pump Test Data Appendix D: Groundwater Chemistry Appendix E: Test Pit Logs, Grain Size Analyses and Water Surplus Data IV
9 Mr. Fred Logan Hydrogeology, Terrain Analysis and Impact Assessment Report Jock River Estates Phase II, Formerly Village of Richmond City of Ottawa, Ontario OTEN B September 28, Introduction 1.1. General Exp Services Inc. (exp), formerly as Trow Associates Inc., was originally retained by Mr. GB Padam to conduct a hydrogeological investigation and related studies for a proposed residential subdivision on Sangeet Place in the City of Ottawa, Ontario (formerly Village of Richmond). Refer to Figures 1 & 2 in Appendix A for the site location and surrounding area. It is proposed that the property be subdivided into 11 residential lots with average lots sizes of approximately 0.84 hectare (2.1 acres) as shown on Figure 3 in Appendix A. The development will be serviced by individual water wells and Class IV sewage disposal systems. The purpose of the investigation described within was to assess the suitability of the site for development on private services. Exp (as Trow) completed a Hydrogeological, Terrain Analysis and Impact Assessment Study (Report # OTEN A, March 2009) as part of the original subdivision application process. Comments were then received in a letter dated January 20, 2010 that needed to be addressed to move forward with the subdivision applications. In addition, the City of Ottawa (Ottawa) has provided several additional comments that need to be addressed in their Planning Comments letter dated March 28, Subsequently, exp was then hired by Mr. Fred Logan to address the comments. To address the above comments, Exp provided a report entitled Addendum #1, Hydrogeological Services, Terrain Analysis and Impact Assessment, Jock River Estates Phase 2, Richmond, ON dated June 22, Comments to this addendum were then submitted to Exp on August 4, 2011 by the Rideau Valley Conservation Authority (RVCA). This report is intended to address the comments in one comprehensive report Methodology Original Workplan for March 2009 Submission Background information relating to local geology and hydrogeology was obtained from published maps and reports, and Ontario Ministry of the Environment (MOE) Water Well Records. On-site hydrogeologic conditions were investigated through the construction and testing of two domestic water wells. The wells were drilled on the subject property in December, 2008 by Air-Rock Drilling Company in accordance with Ontario Regulation 903. An existing water well (TW3), located on Lot #1 of the development was also tested. The Water Well Records for the two new water wells and the existing water well are included in Appendix B. Water quantity of the site was assessed on the basis of six-hour constant-rate pumping tests conducted on the three wells. Monitoring of the recovery of the wells subsequent to pump shut down was conducted for 24 hours or until 95 % recovery was noted. The non-pumping wells were monitored during the tests to identify potential well interference. 1
10 Mr. Fred Logan Hydrogeology, Terrain Analysis and Impact Assessment Report Jock River Estates Phase II, Formerly Village of Richmond City of Ottawa, Ontario OTEN B September 28, 2011 Water quality, was evaluated through chemical and bacteriological analysis of samples collected at the beginning and end of each pumping test. Both samples were collected for a suite of parameters identified as a detailed private well package consisting of major anions, inorganics, organics and bacteriological parameters. Turbidity was periodically monitored in the field during the tests. Two water samples were also collected from residences nearby for analyses of water quality parameters. All field and desktop work as part of this hydrogeological investigation was done in general accordance with MOE Procedure D-5-5. A total of two wells (TW1 and TW2) were drilled on the subject site to complement the previously existing TW3. Overburden soil conditions at the subject site were investigated through the completion of 6 test pits in December Each test pit was logged for depth, soil characteristics and groundwater conditions. Three of the test pits were subsequently outfitted with slotted standpipes to determine the overburden static water elevation. An assessment was undertaken to determine the nature of any impacts to downgradient groundwater resources arising from the installation of on-site sewage disposal systems. On the basis of the information obtained, recommendations for the construction of water wells and on-site sewage disposal systems are presented Addendum #1 Workplan The majority of the workplan prepared to complete Addendum #1 consisted of providing additional interpretation to the original 2009 report, which will be added to this report where required. The comments were directed at providing additional information regarding neighbouring impacts to the site, details on the neighbourhood well sampling, and objective aesthetic exceedences amongst others. Concerns were also related to thin soils on the site and potential impact of septic systems on the soils and the Jock River. To address the concerns regarding the Jock River, Exp completed a phosphate loading assessment to assess the required buffer zone from the river that would be associated with no impacts on the river. With respect to minimizing impacts on the groundwater table, Exp excavated over 100 shovel holes throughout the property to assess soil depths. The soil depth analysis was based on extending the shovel holes to depths of 0.3 m (based on previous precedence set by the local health unit and precedence set for Phase I of the development where 0.25 m of soil was considered sufficient for a septic field bed) Addendum #2 Workplan With the exception of additional interpretation and the preparation of more detailed figures, Exp placed a water level datalogger in TW2 on two occasions for a period of over 7 days each to assess potential impacts from the neighbouring golf course to the west on the subject wells. Based on a review of the Environmental Bill of Rights (EBR) website, it was determined that a Permit to Take Water (PTTW) has been provided to the Centennial Golf Course for dewatering of their well for irrigation and surface water from their pond. The data from the dataloger would show if the water level within TW1 was lowered by the pumping of the golf course well(s). 2
11 Mr. Fred Logan Hydrogeology, Terrain Analysis and Impact Assessment Report Jock River Estates Phase II, Formerly Village of Richmond City of Ottawa, Ontario OTEN B September 28, Site Location and Physiography The site consists of approximately 10.2 hectares (25 acres) of land located south of the Village of Richmond and approximately 44 m to the northwest of the Jock River. The site is currently accessed via Sangeet Place to the northwest (see Figure 2). The subject property currently consists of a dense forest. A rough access road currently provides access through the central portion of the property Environmental Impacts The neighbouring properties are described as follows: North: Residential properties bound the site to the north of the property. They are not a concern to the long term impacts to the subject site. Testing and interviews have been conducted on two residential dwelling (section 3.4.6). North/east: Agricultural properties bound the site to the north/northeast. It is noted that agricultural lands are often associated with nitrates (i.e. fertilizers) and pesticides. However, testing of nitrates from the on-site test wells did not display any elevated nitrate levels. Secondly, pesticides testing from a select on-site well did not display any detectable pesticides and/or herbicides. South west: A golf course bounds the southwest portion of the property and is often attributed with pesticide/herbicide usage. As part of our well water testing program for the proposed subdivision, pesticides and herbicides were sampled and were not detected from a select well within the proposed subdivision. South: The Jock River bounds the site to the south and presents no concern to the subject property. Based on a review of the neighbouring properties, no areas of potential sources of contamination to the groundwater supply are not present such as gas stations / landfills / industrial properties or other properties of that nature within a 500 m radius of the subject property. Exp provides more detailed discussion regarding the assessment of impacts stemming from the agricultural land and golf courses in Section Exp notes the presence of agricultural properties north of the subject property. Based on the separation distance between the farming property and the subject site, exp does not consider the agricultural operations to be a concern for the subject property with respect to groundwater impact. Exp does not consider pesticide or herbicide use to be a concern from the agricultural properties. However, due to the presence of the golf course located to the south and west of the subject property, a groundwater sample was collected for pesticide analysis from Test Well #3, which is located approximately 80 m northeast of the golf course, on Lot #1. No organophosphate pesticides or herbicides were detected in the groundwater sample collected from Test Well #3. Based on a review of the EBR website, it is reported that a PTTW has been provided to the Centennial Golf Course for the purpose of dewatering two wells and a pond (surface water). The water is supplied to the clubhouse (from one well) and is also used for irrigations purposes (other well and pond). The actual hydrogeological report that was to have been provided for the application was not provided but solely the 3
12 Mr. Fred Logan Hydrogeology, Terrain Analysis and Impact Assessment Report Jock River Estates Phase II, Formerly Village of Richmond City of Ottawa, Ontario OTEN B September 28, 2011 permit and the record of water takings in 2009 and Refer to the Neighbouring Well (Section 3.4.6) discussion for detail regarding impacts of the golf course on the subject site. Based on the above, the neighbouring land uses including agricultural and golf course operations do not appear to have had any negative impacts on the subject site. Also, there are no other potential sources of contamination such as retail fuel outlets, dry cleaners, landfills and other similar land uses within the general area which would negatively impact the groundwater within the proposed subdivision 1.4. Topography / Drainage The general site topography of the area (i.e. within a 500 m radius) is primarily flat with less than a 4 m difference in elevation. The higher elevations are generally noted within the golf course property and northwestern portions of the subject site at elevations 100 masl and the general slope downward towards the Jock River and the east. Based on the area and regional slopes, general flow (i.e. bedrock groundwater, topographical slopes) is in the eastern direction according to the Jock River Water Plan Interim Report. With respect to the site, the topography is fairly flat, with the exception of a small knob/outcrop within the western portion of the site. This knob/outcrop (101 masl) is generally limited to 2 to 3 m above the rest of the site which generally is measured at between 97 to 99 masl. The ground surface then drops to approximately 96 masl along the shores of the Jock River. The Jock River flows from west to east when nearing the subject site and is estimated to be approximately 1m deep in the area (95 masl). Outside of the property boundaries, the Jock River flood plain extends into the golf course, approximately 300 m beyond the normal water elevation of the creek. Similarly, once passed the property to the east, the flood plain extends well beyond the Jock River eventually stretching to Ottawa Street, east of the site. Within the current development, a small portion of the flood plain does extend into the southern corner of Lot 5 and slightly into Lot 4. Current plans for the subject development do not propose for any wells / septics / houses within the floodplain. Surface water drainage is considered poor based on the presence of standing water in the northern portion of the property on portions of Lots 9 and 10. It is anticipated that this surface water accumulation is seasonal and results from localized poor drainage due the proximity of the bedrock surface in this portion of the subject property. (Refer to Figure 2/3 for Lot locations). However, it is suspected that fill will be imported and drainage patterns and storm drainage will be redirected and controlled as part of the proposed stormwater management plan. As a result, it is unlikely that stormwater runoff and overburden groundwater flow within the southern portion of the property will be directed toward this poorly drained area (portions of Lots 9 and 10). 4
13 Mr. Fred Logan Hydrogeology, Terrain Analysis and Impact Assessment Report Jock River Estates Phase II, Formerly Village of Richmond City of Ottawa, Ontario OTEN B September 28, Geology 2.1. Surficial Geology Surficial geology as mapped by S.H. Richard et al. (1974) indicates that the site consists of surficial glacial deposits composed of a heterogeneous mixture of material ranging from clay to large boulders, is generally sandy, and grades downwards into unmodified till. The surface is generally modified by wave or river action and the topography is flat to hummocky. Based on the information collected from the test-pit program at the site and from the previous test pit program completed by Simmering & Associated Ltd. Consulting Engineers, for Phase 1 to the north in December 1994, the overburden geology is similar to that described in the mapping. The surficial layer, approximately 0.2 m to 0.25 m thick, consists primarily of sandy topsoil and organic material. This material is underlain by weathered limestone bedrock over most of the subject site, but closer to the river, there is a glacial till unit that consists of either clayey silt (Test Pit #5 on Lot #5) or silty sand (Test Pit #6 on Lot #6) between the topsoil and weathered bedrock. Depth to bedrock ranges from approximately 0.2 m to 1.2 m across the subject property. Isolated layers of glacial till to silty clay material were also noted within the northeastern portion of Phase 1 of the development. Refer to Appendix E for the test pit logs and grain size analysis. Several test pits were also previously excavated as part of the prior work conducted for Phase I (subdivision to northwest), during the 1994 work program. Soil depths and characteristics were generally the same with thin coverage of topsoil (primarily less than 1 m) with isolated areas underlain by silty sand to silty clay to depths in the area of 1.5 m. It is noted that well records drilled did report some thickness up to 2.5 m but that could be representative of soils within the surficial weathered rock which cannot be differentiated during the well drilling. Based on the above, it is anticipated that the local surficial geology of the area consists of a thin veneer of unconsolidated material. Given that the development to the north has similar surficial geology features, it is our opinion that the information from the development can be used to determine whether impacts to the aquifer are anticipated from the use of septic systems on shallow bedrock formations Bedrock Geology The bedrock geology of the subject property consists of Lower Ordovician-aged bedrock of the Oxford Formation as mapped by Carson (1981). The formation consists primarily of light to dark grey, light to medium brown, and blue grey, finely to coarsely crystalline dolostone and limestone that weathers light to dark grey, pale to medium brown, and buff, and occurs in beds 5 to 40 cm thick. It has been reported that the thickness of the Oxford Formation in the Ottawa area is up to 73 m. Based on the mapping, an interpreted geologic boundary between the Rockcliffe Formation and the Oxford Formation is located to the west and south of the subject property. The Rockcliffe Formation, dating to the Middle Ordovician, consists of pale to medium green and white calcareous sandstone and is generally less than 2 m in thickness in the vicinity of the subject property. 5
14 Mr. Fred Logan Hydrogeology, Terrain Analysis and Impact Assessment Report Jock River Estates Phase II, Formerly Village of Richmond City of Ottawa, Ontario OTEN B September 28, Desktop Hydrogeology A review of MOE Water Well Records indicated that 18 wells were drilled near the site and that all wells were completed into bedrock (Appendix B). These are predominantly well records from wells drilled from 1980 to The MOE Water Well Records also indicate that well yields are in excess of the required 13.6 L/min. It is noted that the wells predominantly show that the well yield is produced from the combination of 2 water bearing fractures. First water bearing fractures were generally found at depths of 14m to 20 m (45 to 70 ft) with a second zone of water bearing fractures noted at approximately 33 to 40 m (110 to 130 ft). It is anticipated that some wells may have extended deeper to get additional well bore storage and/or to capture additional water. Alternatively, the shallower fractures might have produced less water. The wells generally extend to depths ranging from 14 to 55 m from surface, with an average well depth of 34 m. Static water level measurements from the MOE Records range from 1 to 8 m from surface with an average of 3.4 m from surface. The drilling program completed as part of the Phase 1 Development (1994) consisted of the drilling of three bedrock wells. Two of the wells extended to depths of 16.3m, whereas the other extended to 34 m. Water was found at varying depths ranging from 14 m to 35 m (45 ft to 115 ft). It appears that the water volume also stems from more than one water bearing fracture within a single well as evidenced by the well extending to 34 m with water bearing fractures at 20 m and 26 m (72 and 118 ft). All of these wells extend into the Oxford Formation Conceptual Hydrogeological Model Summary The site consists of a vacant woodlot located within sparsely populated land. It is bounded by a golf course to the west, agricultural lands to the north and northeast, woodlots to the east and the Jock River to the south. Based on a review of the neighbouring sites, and additional investigations, there are no concerns regarding impacts to the proposed development. A flood plain stretching from the Jock River extends slightly into proposed Lot 4 and 5 but well into the golf course. The site topography of the area is generally flat and directed towards the south / southeast (Jock River), whereas the regional topography shows an eastern downward slope. Similarly, the regional bedrock groundwater flow direction is towards the east. The general characteristic of the area consists of a thin, yet variable, thickness of overburden material over the limestone bedrock formation, reportedly of the Oxford Formation. Based on local well records, the top 0.5 m of the bedrock is weathered. The majority of the well records in the area report that wells extend to depths of 14 to 55 m with an average of 34 m. As discussed in the well construction section, the wells drilled within the subject fall within this range. Well yields in the area are also generally high with all wells much more than L/min for a 4-bedroom house. 6
15 Mr. Fred Logan Hydrogeology, Terrain Analysis and Impact Assessment Report Jock River Estates Phase II, Formerly Village of Richmond City of Ottawa, Ontario OTEN B September 28, Hydrogeology 3.1. Neighbouring Site Hydrogeology A review of the hydrogeology from the test wells drilled as part of the Phase I development of the site consisted of the testing of three wells. Two of the wells were drilled to depths of 19 m with a third well to a depth of 41 m. Water bearing fractures were observed at depths of 18 m from the two shallower wells (one of which is located on the subject site) and the other at 36 m. All of the wells were shown to exceed the tested well yields of 22 L/min and were shown to have transmissivities between 18 and 60 m 2 /day Well Construction On December 19, 2008, two 152-mm diameter test wells were constructed on Lot 4 and Lot 9 using air rotary drilling techniques. An additional well, previously drilled on Lot 1 of the property was incorporated into the pump test program of this report to satisfy requirements of Procedure D-5-5. All of the wells are completed in limestone/sandstone bedrock and in accordance with Ontario Regulation 903. The wells all extend a minimum of 40 cm beyond ground surface and are capped. Well records are included in Appendix B. The wells were constructed into bedrock and were outfitted with steel casings extending into bedrock. The summary of the well depths are as follows: Trow Well No. Table 1: Well Construction Summary Completion Depth (m) Depth to Rock (m) Test Well #1 (Lot 9) Test Well #2 (Lot 4) Test Well #3 (previously drilled on Lot 1) Water Found (m) 11 m, 14 m, 22.5 m 13m, 28 m Casing Depth (m) Grout Pumped in Annular Space (L) m 6.7 unknown The annular space of all wells was sealed by pumping grout from the bottom of the cased hole, through the drill rods until the grout was noted at the surface. The grouting consisted of the pumping cement at the bottom of the well followed by the pumping of quick-gel to bring the grout to the top of the well. The casing was then set in the grout filled open hole by hydraulic hammering. All well casings were equipped with a casing shoe at the bottom. Following completion of the well drilling program, each well was developed with air pressure to clean out the well. Subsequently, water flowed from the well for approximately 20 minutes to remove mud and rock fragments. Lastly, the well driller completed a one-hour pump and recovery test as per the O.Reg. 903 requirements for well technician contractors to determine the optimum flow rates for the subsequent 6- hour pumping test. 7
16 Mr. Fred Logan Hydrogeology, Terrain Analysis and Impact Assessment Report Jock River Estates Phase II, Formerly Village of Richmond City of Ottawa, Ontario OTEN B September 28, 2011 Based on the water well records, the thickness of overburden from the three wells ranged from 0.9 m in Test Well #2 to 1.1 m in Test Well #1. It is noted that approximately 0.5 m of rock (i.e. potentially weathered bedrock) was identified above the limestone surface site wide. However, approximately 9.5 m of competent bedrock was traversed prior to intercepting the first water bearing fracture at 10.7 m from surface at the location of Test Well #1 on Lot 9, while approximately 11.9 m of competent bedrock was traversed prior to intercepting the first water bearing fracture at 12.8 m from surface at the location of Test Well #2 on Lot 4. Based on the test well construction, it is evident that the bedrock formation is fairly uniform on the site. The depth to bedrock levels suggests a fairly flat bedrock surface. It is recommended that future bedrock wells on this property be cased to at least 3 m into bedrock or to 6 m depth, whichever is greater. Casing the wells 3 m into rock will ensure that the casing extends beyond any surficial weathered bedrock. All wells must be constructed in accordance with Ontario Regulation 903. It is recommended that the installation and grouting of the well casing be observed by a qualified professional. The professional should either be a professional engineer, a professional geoscientist, or a suitably trained inspector. With respect to Lot 5 and 6, nearer the Jock River, it is recommended that the casing extend 10 m from surface to provide additional protection from the minimal potential of connection with the Jock River. The ground elevation in the area of these wells is in the order of 98 masl and casing would extend to 88 masl, which is 7 m lower than the anticipated depth of the Jock River (95 masl). Based on the water found at TW2, the water bearing fractures would be in the order of 84 masl, which is 11 m below the Jock River. As a result, connection with the Jock River is not anticipated Water Quantity Well Yields Information on groundwater quality at the site was determined by completing six-hour pumping tests followed by recovery tests on the newly installed test wells. In addition, Trow conducted a pumping test on an additional well previously drilled on Lot #1 (Test Well #3) to satisfy requirements of the Procedure D-5-5. Interpretation of the well yield characteristics of the test wells was conducted by calculating the specific capacity and the transmissivity of the well. The specific capacity of the well is the ratio of discharge of a well to drawdown. The transmissivity of an aquifer is the rate at which water is transmitted through a unit width of the aquifer under a unit hydraulic gradient. The calculation of the transmissivity for the pumping test was conducted using the Cooper-Jacob method which is based on the following assumptions: 1) the aquifer is confined by the bedrock formation; 2) water was discharged at a constant rate; 3) the well fully penetrates the bedrock aquifer; 4) discharge from the well is derived exclusively from storage in the aquifer. These assumptions and methods were used in determining the transmissivity values in this section. The Theis recovery method was used in the analysis of the transmissivity for the recovery test. Tabular and graphical representations of the data collected from these pump tests are presented in Appendix D. In addition, the pump test programs were designed to identify whether the wells could supply the MOE recommended L/min flow rate for the proposed subdivision development that might consist of 4-bedroom dwellings. 8
17 Mr. Fred Logan Hydrogeology, Terrain Analysis and Impact Assessment Report Jock River Estates Phase II, Formerly Village of Richmond City of Ottawa, Ontario OTEN B September 28, 2011 Test Well #1 Test Well #1 was pumped for six hours at a constant rate of 59 L/min on January 7, Drawdown at the end of the test was 5.5 m, which represents approximately 20 % of the available drawdown based on a static water level of 3.37 m. Specific capacity from the well was calculated to be 10.7 L/min/m after 360 minutes. The well recovered 95 % of the observed drawdown within 80 minutes of the end of the test and 98 % within 22 hours of the test. An aquifer transmissivity of 35 m 2 /day was calculated using the Cooper-Jacob method and data from the pumping well. The recovery data suggests a transmissivity of 36 m 2 /day using the Theis method. The above-noted transmissivity values are both within the same order of magnitude and are considered representative of the water producing capabilities of the local aquifer. Based on the observed drawdown/recovery relationship, it is concluded that the long-term yield of Test Well #1 is in excess of the tested rate of 59 L/min, and more than sufficient to supply the requirements of a single-family house. This rate exceeds the MOE minimum yield of 13.6 L/min (18.75 L for a 4-bedroom dwelling) to supply a single family residence. Test Well #2 Test Well #2 was pumped at a constant rate of 90 L/min for 360 minutes on January 8, Drawdown at the end of the test was 0.74 m, which represents 2.6 % of the total available drawdown based on a static water level of 2.54 m. Specific capacity after 360 minutes of pumping was calculated at L/min/m of drawdown. The well recovered 91 % of the observed drawdown within 60 minutes of the end of the test and 93 % within 22 hours of the test. Exp is not concerned regarding being slightly less than the required 95% recovery given that the drawdown of 0.74 m is minimal and the pumping rate of the program was well above the minimum required rate. Aquifer transmissivities of 313 and 440 m 2 /day were calculated using the pumping well drawdown and recovery data, respectively. The drawdown during the test was observed to be stable with no evident negative or positive boundaries encountered. Based on the observed drawdown/recovery relationships from the test well, the long-term yield of Test Well #2 is in excess of the tested rate of 90 L/min, and more than sufficient to supply the needs of a single family home. This rate exceeds the MOE minimum yield of 13.6 L/min (18.75 L for a 4-bedroom dwelling) to supply a single-family residence. Test Well #3 Test Well #3 was drilled on Lot #1 prior to the current investigation. Test Well #3 was pumped at a constant rate of 51 L/min for 360 minutes on January 9, The maximum drawdown measured at the end of the test was 1.48 m. This figure represents about 9 % of the total available drawdown of approximately 16 m, based on a static water level of 4.1 m. The specific capacity after 360 minutes of pumping was 34.5 L/min/m of drawdown. The well-recovered 89 % of the observed drawdown within 100 minutes, at which time the test was terminated in order to ensure the water quality samples arrived at the analytical laboratory before closing. 9
18 Mr. Fred Logan Hydrogeology, Terrain Analysis and Impact Assessment Report Jock River Estates Phase II, Formerly Village of Richmond City of Ottawa, Ontario OTEN B September 28, 2011 Test Well #3 previously underwent a pumping and recovery test conducted by others in At that time the well as pumped at a constant rate of 22 L/min for 6 hours and a total drawdown of 0.32 m over the course of the test was observed. The water level recovered 100 % within 60 minutes of the termination of the pump test. Since the pumping rate (51 L/min) used by Trow greatly exceeds the MOE minimum yield of 13.6 L/min, and the water level recovered to 100 % within 60 minutes during that previous investigation conducted by others, it is Trow s professional opinion that Test Well #3 would have recovered to 95 % of the observed drawdown within 24 hours. An aquifer transmissivity value of 48 m 2 /day was calculated from the drawdown data using the Cooper and Jacob method. The transmissivity calculated from recovery data was 37 m 2 /day using the Theis method. The drawdown during the test was observed to be stable with no evident negative or positive boundaries encountered. Based on the observed drawdown/recovery relationships, the long-term yield of Test Well #3 is in excess of the tested rate of 51 L/min, and is considered sufficient to supply the needs of a single-family home. This rate exceeds the MOE minimum yield of 13.6 L/min (18.75 L for a larger house) to supply a singlefamily residence Well Interference During each pump test program, each non-pumping test well was used as a monitoring well to determine potential well interference at the site and the overall impact on the aquifer with increased groundwater usage. Therefore, as an example, while Test Well #1 was being pumped, the monitoring wells would include Test Well #2, and Test Well #3. The water levels were measured periodically at the monitoring wells during the pump test. All data is shown in Appendix C. The actual total drawdown from the monitoring wells and the distances from the pumping well are identified in the following table. Table 2: Well Interference Measurements Production Well Total Drawdown (m) Monitoring Wells Test Well #1 Test Well #2 Test Well #3 Distance Total Drawdown Distance Total Drawdown (m) (m) (m) (m) Distance (m) Test Well # Test Well # Test Well # Note: Distance indicates the total horizontal distance between the pumping well and the monitoring well. Based on the above, it is anticipated that Test Well #1 and Test Well #3 are hydraulically connected. The transmissivity value determined using Test Well #3 as a monitoring well during the pumping of Test Well #1 was 49 m2/day. Following the above-noted drawdowns in the monitoring wells, it is noted that these wells showed signs of recovery after pump shut off. Test Well #3 recovered 99 % within 18 hours after ending the pump test at Test Well #1. A similar recovery for Test Well #1 likely occurred after the completion of the pump test at Test Well #3, although not confirmed by direct measurement. This is not considered to be a significant concern as over 18,360 L of water was withdrawn from Test Well #3 and 10
19 Mr. Fred Logan Hydrogeology, Terrain Analysis and Impact Assessment Report Jock River Estates Phase II, Formerly Village of Richmond City of Ottawa, Ontario OTEN B September 28, ,240 L of water was withdrawn from Test Well #1 during the pump tests. This is well beyond what any of the wells would be required to produce when serving residential purposes and presents worst case scenarios. It is generally estimated that the peak water demand for a 4-bedroom house would be 2,250 L of water per day, well below the pump test withdrawal rates. Even at that, the available drawdown impacted in monitoring wells were below 2 % of available drawdown. Very little drawdown was noted in Test Well #2 during the pumping of Test Well #1 and Test Well #3. It is anticipated that Well #2 is not hydraulically connected to the other two test wells. It must be noted that at the lowest pumping rate used during the three pumping tests conducted on the property (51 L/min at Test Well #3), in excess of 18,000 L of water was pumped from a single source. This pumping rate is far higher than the anticipated water usage. Based on the information in the pump test summary tables in Appendix C, it appears that the water levels recover following the pumping of the well and a long-standing impact is not suspected. Since the pumping rates well in excess of the required 13.5 L/min (18.75 L for a larger house) were used during the test and thus provide a worst-case scenario, therefore at the lower flow rates expected from residential usage, the impacts of well interference should be minimal Cumulative Well Impact Approach 1: Geometric Mean Transmissivity Based on the various data from the on-site pumping tests, an evaluation was conducted to determine the potential impact associated with advancing and pumping several wells at once on the subject property. The evaluation was conducted by assuming an average daily flow rate of 3000 L/day (higher than the peak water demand) and by using the geometric mean transmissivity value determined through the three pumping tests undertaken at the subject property. It was assumed that 11 wells (based on the proposed 11 lots in the development) would be installed on the property over a distance of 0 m to 300 m and each well would have a transmissivity of 80.7 m 2 /day (the geometric mean transmissivity from the three on-site wells). The geometric mean storage coefficient from these wells, as determined from the limited monitoring well data, was valued at 7.7 x 10⁻⁶, which is similar to commonly observed storativity values for limestone bedrock in the Ottawa region. Based on the above-noted assumptions, it was determined that the 30 year average drawdown on the site would range from 0.05 m to 0.06 m on a per well basis, with the largest drawdown occurring in the central portion of the property and the smallest drawdown at the property boundary. Based on the depths of the two newly drilled wells and one previously-drilled well at the subject site, which ranged between 19.8 to 30.5 m, combined with the static water levels of generally 2.5 to 4.1 m from top of casing, the total impact over the 30 years would account for approximately 0.2 % to 0.4 % of the available drawdown. Therefore, there is no anticipated concern of cumulative well impact based on the water quantity at the site. Refer to Appendix C for the mutual well interference calculation. Approach 2: Low Producing Wells (Test Well #1) A second low probability approach for determining mutual well interference was completed using the worst case well yield (Test Well #1) over the entire property. As a result, a transmissivity value of 35 m 2 /day was determined and used for the mutual well interference calculations. A storage coefficient 11
20 Mr. Fred Logan Hydrogeology, Terrain Analysis and Impact Assessment Report Jock River Estates Phase II, Formerly Village of Richmond City of Ottawa, Ontario OTEN B September 28, 2011 value of 1.2x10⁻⁷ was used, which is the value calculated for Test Well #1. Assuming the same number of lots and the same pumping rates as Approach 1, the drawdown would range between 0.13 m to 0.16 m per well, with the largest drawdown occurring in the central portion of the property and the smallest drawdown at the property boundary. Based on the depths of the two newly drilled wells and one previously-drilled well at the subject site, which ranged between 19.8 to 30.5 m, combined with the static water levels of generally 2.5 to 4.1 m from top of casing, the total impact over the 30 years would account for approximately 0.6 % to 1 % of the available drawdown. Therefore, there is no anticipated concern of cumulative well impact based on the water quantity at the site. Alternatively, if we use the lowest transmissivity value calculated for the subject site, as above, but instead use the published storage coefficient value of 1 x 10⁻⁵, which is common for limestone bedrock formations in the Ottawa area, the drawdown at the property boundary is calculated to be 0.10 m and in the central portion of the subject site to be 0.13 m. Therefore, there is no anticipated concern regarding cumulative well impact at the site Summary Based on the above-noted information, each of the newly drilled wells at the subject site provides the required yield of 13.6 L/min as recommended by the MOE for single unit residential dwellings (18 L/min for a larger home). Well yields from the newly drilled Test Wells were in excess of 59 L/min, and after extended pumping at these flow rates, total drawdowns ranged from 2.4 % to 20 % of the available drawdowns from the wells. It is noted that the well yield from Test Well #3, located on Lot 1 of the subject property was 51 L/min with a total drawdown of approximately 9 %. This well was pumped at a more conservative rate since the well construction details were not known to exp and we did not want to further dewater the well. Nevertheless, exp still feels that Test Well #3 can easily provide a sufficient amount of water for residential purposes. Based on the above, the aquifer will provide sufficient water for residential usage. In addition, water levels were measured in observation test wells at the subject site during the pumping test program at which only minor well interference was noted. Notable drawdowns (up to 0.75 m) in the observation test wells were limited to Test Well #3 during the pumping of Test Well #1, and vice versa suggesting a hydraulic connection between both wells at the high pumping rates used during the tests (i.e. >51 L/min). Only minor drawdowns were noted at Test Well #2 in response to pumping at Test Wells #1 and #3 and vice versa. It is exp s professional opinion that observed drawdowns will be less at the lower flow rates typical of residential usage, therefore the observed well interference (Test Wells #1 and #3) is not significant. Based on a review of the pumping test diagrams as requested by the RVCA, there is no evidence to suggest that a positive boundary exists for the pumped wells Test Well 1 and Test Well 2. It is noted that well TW1 only slightly reached steady state. It has been our professional experience that the majority of the pumping tests conducted reach such equilibrium if pumping at the correct pumping rate (i.e. the well yield). Exp suggests that this is indicative of the well drawing water from within the hydrogeological network of fractures within the aquifer. This is not necessarily indicative of a leaky aquifer. The Cooper- Jacob method is considered to be suitable for an assessment of the aquifer properties for this scenario understanding that the professional calculates the transmissivity based on an appropriate best-fit line, which was appropriately completed for this job and would provide a transmissivity within 5% accuracy. It 12
21 Mr. Fred Logan Hydrogeology, Terrain Analysis and Impact Assessment Report Jock River Estates Phase II, Formerly Village of Richmond City of Ottawa, Ontario OTEN B September 28, 2011 has been our experience that the majority of the pumping tests conducted at the correct rate provide similar curves on a Cooper-Jacob method and not been historically representative of leaky aquifers. Secondly, wells TW1 and TW2, located nearest the Jock River, are both drilled to a depth of 30 m (100 ft) and the Jock River is only approximately 1 m deep in the area. Within Test Well #2, water bearing fractures were first found at 14 m, 11 m lower than the base of the Jock River. As a result, the potential for connection between the Jock River and the wells is minimal and a positive boundary is not anticipated. Other indicators that the wells are not connected to surface water include no notable increases in surficial parameters during the pumping such as turbidity, DOC, organic nitrogen, tannin and lignin. Therefore, there is no evidence to suggest that the shallow water from the Jock River is connected to the water bearing fractures within TW1 and TW2. It is our opinion that TW3 is relatively representative of TW1 and TW2. Water was found within TW3 at a depth of 17.3 m (57 ft), whereas water was found for TW1 and TW2 within three small fractures at depths between 11 m and 22.2 m (35 ft and 73 ft). TW1 and TW2 have well yields of 45 to 94 L/min, respectively, whereas TW3 has a well yield of approximately 51 L/min which is similar in well production to TW1 and TW2. Based on the above, long term impact on the aquifer water bearing capability is not suspected and it is determined that the aquifer can supply the water required 13.6 L/min (18 L/min for larger homes) for the subdivision development. The following recommendations are provided as best management practices. The wells should be drilled to depths of at least 30 m +/- 5m (depths of Test Well #1 and Test Well #2). Exp does not anticipate that well bore storage and water quantity will be a concern but provides the recommendation to alleviate potential future concerns. For the wells currently tested, the well casing depth of 6 m is considered satisfactory as the water quality and quantity meets the requirement. It is recommended that casing depth for future wells extend to 6 m for wells represented by TW#2 and future ones to the north (further from the Jock River). For Lots 5 and 6, it is recommended that the well casing extend to 10 m to better protect well water from potential surficial fractures, however, not anticipated Water Quality General The water quality in the bedrock aquifers was assessed through chemical, physical, and bacteriological analyses of samples collected at the beginning and end of the pumping tests. Two samples were collected during each pump test, the first sample being collected within the first 60 minutes of the test and the second sample being collected after 300 minutes of pumping. Each sample was submitted to Caduceon Environmental Laboratories in Ottawa, Ontario. The samples were analysed for a private well water quality package, which includes bacteriological parameters, general inorganic parameters, metals and organics. For the purpose of this report, samples collected at the beginning of the test are identified by A and samples collected near the end of the test are identified by B. It is noted that exp also collected a sample from Test Well #3 for pesticide analyses. Exp is not aware of any former agricultural activities within the subject site, however, the presence of the adjacent golf course to the south and west was noted. It is noted that water samples were collected from two neighbouring 13
22 Mr. Fred Logan Hydrogeology, Terrain Analysis and Impact Assessment Report Jock River Estates Phase II, Formerly Village of Richmond City of Ottawa, Ontario OTEN B September 28, 2011 residential properties to the northwest, (Well 400 and Well 420). All of the results of the chemical analyses are shown in Appendix D. Prior to collecting samples for bacteria, free and total chlorine were measured in the field to be under 0.05 mg/l, thus indicating that no residual chlorine remained in the well. No colour change was observed in the vials during field measurements. Turbidity was also measured periodically in the field during each pumping test. Turbidity levels generally decreased as the pump tests progressed. The field readings are included within the pump test data (Appendix C). The results of the tests, presented in Appendix D, indicate that the groundwater available from the bedrock aquifer is fair to good in quality, and meets all health related criteria of the Ontario Drinking Water Standards for those parameters tested. The water is considered to be hard as evidenced by elevated hardness in the three test wells. The water quality from each well tested as part of this program is discussed in the ensuing sections: Test Well #1 The analytical results from the groundwater sample collected on January 7, 2009 did not exceed any health-related criteria outlined in the Ontario Drinking Water Standards (ODWS). Nevertheless, it is noted that sodium was identified to be above the criteria of 20 mg/l. This criterion applies to persons with low salt diets, and therefore, it is recommended that the local medical officers of health be notified. No bacteriological parameters were detected from the sample collected near the end of the test. Several aesthetic parameters exceeded the applicable criteria: colour, turbidity, iron and hardness. However, the colour exceedence and the elevated iron concentrations was identified in early sample (TW1 Start) only, which is not considered representative of the aquifer characteristics given the lack of well development prior to collecting the initial sample. Conversely, at the end of the test, the elevated turbidity and hardness remained but showed a general decrease in magnitude. The water is considered very hard however, it is below the D-5-5 treatability limit of 500 mg/l. Both turbidity and elevated water hardness are easily treated with conventional residential treatment systems as discussed in Section Test Well #2 The analytical results from groundwater sample collected on January 8, 2009 did not exceed any healthrelated criteria outlined in the ODWS. Nevertheless, it is noted that sodium was identified to be above the criteria of 20 mg/l. This criterion applies to persons with low salt diets only, and therefore, it is recommended that the local medical officers of health be notified. No bacteriological parameters were detected from the sample collected near the end of the test. Only total dissolved solids, turbidity and hardness exceeded the applicable ODWS aesthetic criteria. However, these parameters are easily treated with conventional residential treatment systems as discussed in Section An examination of the Langelier Saturation Index and Ryznar Stability Index indicate the scaling potential and the corrosivity of the water is minimal, which is discussed in the summary below. 14
23 Mr. Fred Logan Hydrogeology, Terrain Analysis and Impact Assessment Report Jock River Estates Phase II, Formerly Village of Richmond City of Ottawa, Ontario OTEN B September 28, Test Well #3 The analytical results from groundwater sample collected on January 9, 2009 did not exceed any health related criteria outlined in the ODWS. Nevertheless, it is noted that sodium was identified to be above the criteria of 20 mg/l. This criterion applies to persons with low salt diets, and therefore, it is recommended that the local medical officers of health be notified. No bacteriological parameters were detected from the sample collected near the end of the test. Several aesthetic parameters exceeded the applicable criteria: hydrogen sulphide, turbidity, and hardness. However, the elevated hydrogen sulphide concentration was identified in early sample (TW3 Start) only, which is not considered representative of the aquifer characteristics given the lack of well development prior to collecting the initial sample. A nitrate level of 0.4 mg/l was observed within the well, which is well below the aesthetic criteria of 10 mg/l. It is not anticipated that this low concentration of nitrate to be related to septic and/or other surficial impacts given that ammonia, nitrite, DOC and other surficial related parameters all also very low and well below their respective criteria. Exp does not have any concerns regarding the presence of trace concentrations of nitrate within the well. An increase in chloride from 145 to 182 mg/l was observed during the pumping test, which was conducted at a flow rate of 51 L/min of the course of 6 hours. Similarly, hardness levels increased from 359 to 436 mg/l and TDS levels also increased from 534 mg/l to above 612 mg/l, which is above the guideline (a discussion on TDS is provided in the summary below). This could stem from the high flow rates from the pumping test which could result in the disturbance of solids/minerals that may be present within other further fractures of the aquifer. Based on our professional experience, such concentrations would stabilize under lower flow conditions (which would be the case for residential usage). Exp does not have any concerns regarding these levels given that neighbourhood wells (as discussed later) drilled to similar depths and encountering similar water bearing fracture depths do not display elevated hardness/tds and chloride levels. Both turbidity and elevated water hardness are easily treated with conventional residential treatment systems as discussed in Section An examination of the Langelier Saturation Index and Ryznar Stability Index indicate the scaling potential and the corrosivity of the water is minimal Summary To summarize, at the completion of all well chlorination, pumping and sampling programs, there are no outstanding concerns at the subject site regarding water quality. Limited aesthetic objectives for iron, TDS and the elevated sodium concentrations are not considered a concern at this time. It is noted that TW3 was completed at a shallower depth than TW1 and TW2 within the subject site and the majority of the wells within the area. TW3 was drilled to a depth of 61 ft whereas the remaining wells on site were drilled to depths of 100 ft. Neighbouring wells on Phase 1 are closer to 140 ft in depth. The water quality within TW3 is suitable for consumption but the water quality is slightly better in the other two on-site wells. The following summarizes the aesthetic objectives for the wells within the subject property: Sodium: Low level sodium identified within the drinking water is above the ODWS for persons on low salt diets. As a result, the local medical officer is to be notified of these conditions. It is 15
24 Mr. Fred Logan Hydrogeology, Terrain Analysis and Impact Assessment Report Jock River Estates Phase II, Formerly Village of Richmond City of Ottawa, Ontario OTEN B September 28, 2011 anticipated that the low level sodium is indicative of the local groundwater quality (i.e. limestone formation). There is no evidence to suggest that outside sources are contributing to the low level sodium since there are no road salt storage depots in the area nor are there any trends to suggest that higher sodium levels are identified nearer the roadways. Based on the measured hardness concentrations in the samples from the test wells, the local groundwater is considered very hard, but is treatable. Iron: The iron concentrations within the sample collected at the beginning of the pump test at Test Well #1 decreased to lower levels by the end of the test. It is noted that only one well displayed an iron concentration above the ODWS aesthetic objective. Therefore, the iron levels could be associated with solids within the bedrock fractures that were somewhat purged during the pumping tests. In addition, low level iron can be natural to the groundwater formation and often decreases with additional pumping. Total Dissolved Solids: Elevated TDS and mineralized water can often lead to corrosion within piping systems. Consequently, exp assessed the water corrosion and encrustation concerns by reviewing the Langelier and Ryznar Index based on information provided by the American Water Works Association, The Langelier Index was determined for the water supply with TW2 and TW3, which is an index used to establish the corrosivity of the water supply. The Langelier Index is determined based on the levels of ph, TDS, calcium and alkalinity in the water supply. Based on the Langelier Index, water is considered corrosive if the index is less than 0.5 and is considered to have a potential for scaling if the value is higher of the Langelier Index is higher than 0.5. Based on the calculations conducted, the Langelier index was determined to be 0.5 and 0.9 for the two wells, respectively thus is not considered to be corrosive. However, some scaling may occur, which could be reduced by a softener. The Ryznar Stability Index was determined to assess the corrosiveness of water based on TDS values and calcium ion concentrations from the water supply. Ryznar Index values below 7 are generally considered to not be corrosive. The higher the Ryznar Index, the more corrosive is the water supply. Based on the water quality analysis from the water sample collected from TW2 and TW3, the Ryznar Index was determined to be 6.1 to 6.4, respectively. Given that the value is less than 7, the water is not deemed to be corrosive and should not cause pipe corrosion. The Ryznar and Langelier Index were determined using the values from the following parameters: TDS, temperature, ph, alkalinity, hardness, chloride and sulphate. It is also noted that elevated TDS issues can alter the taste of the water. High mineral content in the water (i.e. hardness, conductivity) may be contributing to elevated TDS and may hamper the palatability of the water. Exp has not identified any elevated parameters that would impact the taste of the water. In addition, the sodium and chloride levels are within the aesthetic objectives and thus should not negatively impact the taste of the water supply. No indications of surface water or surficial impact are suspected based on the analytical chemistry. Surficial related parameters such as Dissolved Organic Carbon (DOC), organic nitrogen, Total Kjeldahl Nitrogen and ammonia are all considered low and below the aesthetic objectives. 16
25 Mr. Fred Logan Hydrogeology, Terrain Analysis and Impact Assessment Report Jock River Estates Phase II, Formerly Village of Richmond City of Ottawa, Ontario OTEN B September 28, Neighbourhood Wells / Property It is understood that Procedure D-5-5 allows for the sampling of residential water wells within a 500 m radius of the subject site. As per industry standard and our previous practice on similar subdivisions, not all of the wells are sampled as per such a program, and generally 10 % (2 to 5 houses) are included in the sampling program. Exp attempted to collect water and interview well owners that would be representative of the site conditions based on type of septic system, upgradient vs. downgradient of the wells, similar site conditions and well information (if previously observed). However, it is understood that due to site access, homeowner availability and confidentiality reasons, the optimal residences are not always selected. The information collected from the neighbourhood well assessment is then used to predict and/or assess potential impacts from development on the aquifer moving forward. As part of the assessment program, interviews and water sampling were conducted at selected residential dwellings neighbouring the subject property (Figure 2 in Appendix A). A summary of the residential information is as follows: Well Northwest of the site (Easting m, Northing m): The property has a single bedrock well reportedly drilled to 42.7 m (140 ft) in depth with a diameter of 152 mm (6 inches) according to the homeowner. Based on the suspected well record data, water was reportedly found at a depth of 164 ft. with no surficial water bearing fractures. Overburden material was observed to be approximately 3 m thick and described as till. No concerns regarding water quantity were identified by the owner. Well owner operates a water softener. Water quality results from this well displayed elevated turbidity, hardness and iron concentrations. The owner mentioned a slight sulfur odour to the water. No health related exceedences of septic related impacts were identified from the water quality analysis. The resident reports that their septic system consists of a two-chamber septic tank to an inground leaching bed. However, based on a review of the site, it is anticipated that the bed is partially raised as part of the site grading. Well Northwest of the site (Easting m, Northing m): The property has a single bedrock well reportedly drilled to 39.6 m (130 ft) in depth with a diameter of 152 mm (6 inches). The suspected well record for the site reports that water bearing fractures were identified at 88 and 125 ft with the well extending to 130 ft deep. The well extends into grey limestone formation and the overburden was reported as loam over stones approximately 2 m thick (likely thin overburden over weathered bedrock). Based on the depth of the shallower water bearing fracture, it is anticipated that this well is representative of the TW1 and TW2 drilled within the subject site, with similar overburden conditions (i.e. loam over stones/weathered rock). No concerns regarding water quantity were identified by the owner. Well owner operates a water softener. Water quality results from this well displayed elevated hardness. 17
26 Mr. Fred Logan Hydrogeology, Terrain Analysis and Impact Assessment Report Jock River Estates Phase II, Formerly Village of Richmond City of Ottawa, Ontario OTEN B September 28, 2011 The resident reports that their septic system consists of a two-chamber septic tank to an inground leaching bed. However, based on a review of the site, it is anticipated that the bed is partially raised as part of the site grading. In general, the water qualities from the two residents on Sangeet Place are considered good. There is no indication of septic impacts on the water supply based on the collection of these two samples. Exp does not suspect any long term impacts on the water supply with respect to water quality. These wells, as the case with the proposed wells, have been drilled in areas with thin soil cover and would receive similar impacts from septic systems as would be the case with the proposed wells. Given that these impacts were not identified during the first few years of operation within these wells, shirt circuiting of septic impact to the aquifer is not being observed and is not anticipated. It is exp s opinion that neighbouring wells Well 400 and Well 420 provide sufficient water quantity and water quality data. The well at 420 Sangeet Place draws water from similar depths and similarly from several fractures as that identified with TW1 (3 to 6 L/min at 10.6 m, 14.6m, 22.2 m with the remaining 35 L/min at 30 m) and TW2 (13 L/min at 14 ft and 75 L/min at 30 m). The well yields were also similar. Given that water quantity concerns have not been reported by either of the residences interviewed as part of the program (primarily from 420 Sangeet place) and that the on-site wells provide the required 13.6 L/min well yield (18.75 L/min for larger homes), Exp does not anticipate any long term impacts with respect to water quantity and/or quality at the site. Centennial Golf Course Well Based on the regional groundwater flow directions pointing towards the east, any impacts stemming from the operation of the golf course to the west (i.e. use of fertilizers, nitrates and other such organics) would be evidenced within the subject wells at this time. The golf course has been in operations for several years. Thin soil cover is present over the southern portions of the golf course as reported by several well records that report soil thickness in the order of 0.3 to 1 m. The soil thickness within the northern portions (i.e. closer to Ottawa Street) were slightly thicker, in the order of 1 to 2 m. The impacts stemming from the potential use of pesticides from the Centennial Golf Course were also verified through the collection of a sample of pesticides/herbicides from on-site well Test Well 3 (Lot 1) during the pumping test program. Based on a review of the analytical data, no pesticides or herbicides were detected. Given that golf course impacts stemming from application of fertilizers/nutrients on the thin soil cover were not observed within the site wells, it is not anticipated that surficial impacts (fertilizer, septic effluent) are not short circuiting into the aquifer. The golf course is also considered of requiring a high water yield and is currently registered as having a Permit to Take Water (PTTW) with two registered groundwater takings and one surface water taking. The groundwater takings consist of Well-PW98 which is permitted to pump at flows of L/min (805,186 L/day) for the purpose of irrigation and Clubhouse well which is permitted to pump at a rate of 34.1 L/min (32,732 L/day) for public supply. However, based on a review of their water takings, the water takings are much lower than requested. The water takings appear to be recorded four to five times within a month. Over the course of the 2010 calendar year, a total of 667,374 Litres of water was drawn from the well between May 17 to September 2. As a result, the requested water taking for a day was actually more than what was withdrawn within the whole year. To verify the impacts of the golf course well, static water levels were recorded on August 11 and August 22, 2011 from TW2 and TW3. The water level within TW2 increased by 0.05 m and decreased within TW3 by 0.49 m during that time. Continuous monitoring was also conducted from TW2 to identify 18
27 Mr. Fred Logan Hydrogeology, Terrain Analysis and Impact Assessment Report Jock River Estates Phase II, Formerly Village of Richmond City of Ottawa, Ontario OTEN B September 28, 2011 changes every 10 minutes for an 11 day period by placing a datalogger within that well. Based on a review of the water levels from the datalogger, the static water level varied by no more than 0.2 m. It is anticipated that the pumping wells would have been used during this period since minimal precipitation was recorded within that time. During the previously discussed interview program, the residents from 400 and 420 Sangeet Place did not report any concerns regarding water shortages, low water pressure and/or dry wells. As a result, it is not anticipated that the golf course water usage is impacting the water usage within the proposed development. Based on the above, the high pumping rates and use of pesticides from the Centennial Golf Course do not appear to have a negative impact on the aquifer conditions within the subject site boundaries. Neighbourhood Summary The neighbourhood well impact summary consisted of interviews / sampling of two residential wells on Sangeet Place, the review of the PTTW from the Centennial Golf Course and associated well records, a review of local reports. Based on the above, there is no indication of poor water quality and/or surficial impact from the sampled residential wells. Secondly, surficial impacts (i.e. high nutrient loading/pesticides) from the neighbouring golf course were also not observed within sampled wells. Lastly, water quantity impact from neighbouring wells and/or stemming from the golf course PTTW are also not anticipated Treatment Systems Based on the above-noted water quality data, sporadic aesthetic related exceedences were identified in the groundwater samples collected from the on-site test wells. Even though the aesthetic exceedences will not cause any health-related concerns, they can still hamper the colour and taste of the water. The aesthetic objectives exceedences at the site consisted of TDS, turbidity and hardness. Turbidity levels at the site were identified to be above 1 NTU, however, it is common practice to lower turbidity levels to below 1 NTU prior to using ultraviolet (UV) disinfection for bacteria treatment if a homeowner chooses to install UV treatment. Cartridge Filter: o o Softener o Lowers the turbidity to acceptable levels Used as pre-treatment for the use of UV units to ensure that turbidity levels are below 1 NTU, if UV systems are to be installed Lowers water hardness to acceptable levels Reverse Osmosis System o Lowers total dissolved solids concentrations to aesthetic levels. 19
28
29 Mr. Fred Logan Hydrogeology, Terrain Analysis and Impact Assessment Report Jock River Estates Phase II, Formerly Village of Richmond City of Ottawa, Ontario OTEN B September 28, Sewage Disposal 4.1. Site Sensitivity Background The current Procedure D-5-4 Technical Guideline for Individual On-Site Sewage Systems : Water Quality Impact Assessment, Revised August 1996 indicates that subdivision approval will not be permitted for proposed development on exposed bedrock, highly conductive soils (cobbles, gravel, coarse sand) and in areas with thin soil cover. It is considered that such a site would be characterized as being hydrogeologically sensitive. However, a specific soil thickness and/or maximum hydraulic conductivity is not specified and it is up to the proponent to establish the appropriate soil cover characteristics to accommodate a private residential development. It is understood that the Ontario Building Code Section 8 states that a septic system field bed is permissible to be constructed on a lot that has a minimum of 10 cm thick of soil cover over the footprint of the field bed and associated mantle on a residential lot. However, it is our understanding that the building code does not apply to the planning stage and the specific theory to support the soil thickness is unknown. As a result, to establish the sufficient soil thickness, exp refers back to prior discussions with local health units and our professional experience. Based on prior discussions with the health unit on other similar developments, it was determined that a soil thickness of 30 cm of native soil is required to accommodate a septic system to 1) provide a proper buffer below the underlying field bed and 2) provide sufficient soil for downgradient nitrate dilution prior to entering the bedrock and/or migrating off property. The soil thickness of 30 cm is well above the Ontario Building Code requirement of 10 cm to accommodate a field bed on a residential lot. Recently, it was suggested that a soil thickness of 2 m is required to suggest that the site is not sensitive based on discussions with the RVCA and the MOE. It is our understanding that that classification is based on a statement within O.Reg. 511/09 and O.Reg. 153/04 pertaining to Records of Site Conditions that classifies a sensitive as a site with less than a consistent cover of 2 m. However, one has to remember that the purpose of the referenced regulation is to separate a sensitive site for the purpose of classifying contaminated from an industrial and/or commercial site. Secondly, the criterion is also intended to classify concentrations of soil contamination and/or overburden/shallow bedrock contamination based on potential sources of contamination. This regulation is not intended to be used to asses for nitrate dilution, septic system installation and hydrogeological assessment for subdivision development. Previously, O.Reg. 153/04 referred to a potentially sensitive site as being a site where more than 1/3 of the site has soil thickness of less than 2 m. However, this was never referenced within residential subdivision applications / conservation authority comments and/or other documents that may be associated the D-5-4. The soil thickness of 30 cm of native soil has generally been accepted as sufficient soil to allow for the installation of a field bed and/or allow for nitrate dilution. 21
30 Mr. Fred Logan Hydrogeology, Terrain Analysis and Impact Assessment Report Jock River Estates Phase II, Formerly Village of Richmond City of Ottawa, Ontario OTEN B September 28, 2011 In addition to these above statements, discussions with local neighbours and the collection of water samples from existing homeowners also suggests that the given site is not sensitive with respect to impacts on the aquifer. Two residential wells were sampled as part of the existing study to assess for potential impacts stemming from the use of septic field beds and increased water usage and no impacts were identified. Based on the review of the results from wells sampled from 400 and 420 Sangeet Place, there is no indication of septic system impacts within the aquifer. Understanding that these wells have been more developed than TW1, TW2 and TW3, it can be said that septic system indicator parameters such as nitrate, nitrite, and ammonia are either non-detectable and/or very low. Secondly, both dwellings operate water softeners that would typically discharge elevated sodium and chloride (to a lesser extent) to the aquifer. Sodium and chloride levels were well within the acceptable ranges for the residential water wells. Therefore, it is our opinion that the septic systems are not negatively impacting the underlying aquifer within the existing development. This can be used to support the observations collected as part of the site sensitivity assessment prior to moving forward with septic location identification Work Program Original work plans consisted of assessing the nature and distribution of overburden materials on the site through the construction of 6 test pits in December The test pits were excavated across the subject site to determine the general soil conditions at the site. Samples were collected from the different soil stratigraphy from each test pit for further laboratory grain size analysis. All soils were logged for soil type, colour, moisture and sample number. The locations of the test pits are shown on Figure 3 (Appendix A) and descriptions of the materials encountered are presented in Appendix E. Based on the thin soil cover on the site, exp returned to the site to excavate several shovel holes to better estimate soil thickness distribution on the site. To determine whether the site is sensitive and also identify suitable septic locations, exp staff mobilized to the site to complete several shovel holes to confirm the soil thickness in well over 100 locations at the site. The locations were selected based on evidence of shallow soils and/or rocks at surface. The locations were logged for GPS coordinates and soil thickness. Subsequently, all locations mapped were shown on Figure 2 and listed as: 1) location with less than 15 cm of soil; 2) locations with soil between 15 cm to 30 cm thick; and 3) locations with more than 30 cm of soil. Subsequently, all locations with consistently less than 30 cm of soil where then traced to determine the limits of the shallow soil. If a single shovel hole displayed between 15 and 30 cm within a zone consistently showing more than 30 cm, it was not considered to be strictly representative of thin soil cover. Select soil samples from both work programs were submitted for grain size analysis Soil Results / Terrain Analysis To proceed with the development, the case has to be made to determine whether the site is sensitive. Based on the information collected from the test-pit program at the site, the overburden geology is similar to information described in the mapping. The surficial layer, approximately 0.2 m to slightly over 0.3 m thick, consists primarily of sandy topsoil and organic material. This material is underlain by approximately 0.5 m weathered limestone bedrock over most of the subject site, but closer to the river, there is a glacial till unit that consists of either clayey silt (Test Pit #5 on Lot #5) or silty sand (Test Pit #6 22
31 Mr. Fred Logan Hydrogeology, Terrain Analysis and Impact Assessment Report Jock River Estates Phase II, Formerly Village of Richmond City of Ottawa, Ontario OTEN B September 28, 2011 on Lot #6) between the topsoil and weathered bedrock. Refer to Appendix E for the test pit logs and grain size analysis. Shallow overburden groundwater was intercepted just above the bedrock surface in three of the six test pits. It is also noted that standing water was identified in the northern portion of the property on portions of Lots 9 and 10. It is anticipated that this surface water accumulation is seasonal and stems from localized poor drainage due the proximity of the bedrock surface in this portion of the subject property. Nevertheless, the general groundwater flow direction is anticipated to be in the southeasterly direction towards the Jock River. Based on the shovel excavation work program conducted in 2011, thin soil cover (consistently less than 30 cm) on the property is limited to two areas: 1) an area of Lot 1 and 2) an area spanning Lot 8 / 9. Within these areas, the cover ranges from soils less than 15 cm thick to rock observed at surface. These areas have been classified as no septic zones on the site. A small portion of the bedrockas a result, septic systems will not be allowed on sensitive portions of the site and effluent flow will be directed away from these areas. The remaining portions of the site outside of these no septic zones are not considered to be sensitive. The soils within the non-sensitive portion of the site consists of a layer of topsoil classified as sand, some silt and trace of gravel to silty sand, some gravel. The hydraulic conductivity of the topsoil ranges between 1.6 x 10⁻⁵ to < 3.6 x 10⁻³ m/s. These materials display some protective properties while also providing a medium for nitrate dilution. The clay material, identified near TP6 and TP5 was determined to have a hydraulic conductivity of < 1.6 x 10⁻⁵ m/s. Based on the above, the overburden material on the site is not characterized as a gravel, cobble and/or coarse sand. Secondly, with the exception of the no septic zones the soil thickness generally exceeds 30 cm and therefore, it is considered that the site is not sensitive. Secondly, all wells on the site generally will not encounter water bearing rock fractures until 10 m with the higher producing fractures encountered further below that depth. This also provides a level of protection from the water bearing fractures. Septic System Sizing As noted above, the defining soil feature at the site below the topsoil is silt to sand material with isolated clay and gravel areas. A total of three soil samples were submitted from the defining soil layers for laboratory grain size analysis. Based on the laboratory results, the majority of the soils below the topsoil at the site consist of silt with sand, some gravel and clay or sand with gravel and silt, some clay. The hydraulic conductivity of this material generally ranges from 2.5 x 10⁻⁵ cm/s to 3.6 x 10⁻⁵ cm/s, which is based on soil samples submitted from depths of 0.25 m in TP-3 and 0.5 m in TP-6. The hydraulic conductivities were determined using Hazen s formula based on the grain size analysis, which provides an approximate estimate. These values for hydraulic conductivity are typical for silt and silty sand matrices. The percolation time on the majority of the site would therefore range from 14 to 16 min/cm. It is estimated that the overburden thickness throughout the site ranges from 0.25 / 0.3 m to 1.2 m, with the exception of the no-septic zone. However, the southeastern portion of the subject site (near the Jock River) is underlain by a higher proportion of low permeability soils (i.e., clay and silt). These lots will require fully raised leaching beds given that the percolation time for clay material is not acceptable. It is also noted that most of the subject site has only a thin covering of overburden material over the bedrock. Also, the subject site has the potential for a seasonally high water table and the presence of standing water on a portion of the subject site (parts of Lots 9 and 10) was noted. All of these above-noted conditions (i.e. clay, silt, shallow 23
32 Mr. Fred Logan Hydrogeology, Terrain Analysis and Impact Assessment Report Jock River Estates Phase II, Formerly Village of Richmond City of Ottawa, Ontario OTEN B September 28, 2011 bedrock, high water table and standing water) are not considered acceptable for the use of in-ground Class IV septic systems. For the reasons outlined above, it is anticipated that the majority of the lots on subject site will require fully raised leaching beds. The beds will be a minimum of 1.5 m in height above the water table with side slopes of 4:1 on three sides of the bed including upgradient and cross-gradient of the bed. In addition, a mantle of 15 m in length would be required along the downgradient portions of the bed. In the event that imported sand fill would be used for the field bed, it is anticipated that the material would have a percolation rate of 12 min/cm thus requiring a total pipe length of 180 m. Assuming that the pipes need to be spaced a distance of 1.6 m from each other and cannot extend more than 30 m in length, a total area including the mantle and sloping for the fully raised field bed is approximately 1200 m 2. This area could be minimized for specific areas within the sites where water levels may be deeper based on data collected at the time of construction. Nevertheless, the maximum required size of field bed could fit within each lot. Septic System Locations Understanding that the site as a whole is not considered to be hydrogeologically sensitive, it was determined that the development could proceed. It is understood that the field beds will be raised due to soils being less than 1 m thick and based on prevalent standing / ponding water. Mandatory septic field bed locations have been specified for Lot 1, Lot 8 and Lot 9 due to thin soil veneers (no septic zones) within those lots. Refer to Figure 4 for the proposed field bed locations. It is noted that a consistent 30 cm of soil could not be found within the footprint of Lot 9. As a result, exp assessed the lot and selected a field bed location with the most soil thickness. The northwestern portion of Lot 9 displayed the thickest soil cover (generally between 15 and 30 cm). To compensate for the lack of soil, it is recommended that a 20 cm clay seal underlie the field bed and associated mantle on this lot. This will help mitigate any short circuiting of the septic effluent directly to the bedrock. Within Lot 5 and 6, it is required that the field beds be located outside of any flood plain zone, as shown on Figure 4. Remaining septic systems have been located to flow away from areas of thin soil veneer / surficial bedrock and/or in the direction of the topography as per Figure 4. Discussion Based on the thinner soil veneer at the subject site (less than 2m), the RVCA has recommended that the minimum/average lot size exceed 1 hectare in size. Exp is not in agreement with this generalization that a site with less than 2 m of soil is characterized as a sensitive. It is our opinion, based on the scope of work conducted above, that the site is not sensitive. Subsequently, additional steps have been taken to minimize potential impacts to the bedrock aquifer. Following the work program conducted to specify septic field bed locations, it was determined that sufficient soil thickness and suitable soils (based on hydraulic conductivities from four soil samples) was present on 10 of 11 lots. Lot 9, with less than our recommended soil thickness, is to be outfitted with a clay seal to underlie the field bed. It is our opinion that the placement of septic systems on the side is not a concern based on the following: Septic systems are not proposed on areas with consistently less than 30 cm of soil. 24
33 Mr. Fred Logan Hydrogeology, Terrain Analysis and Impact Assessment Report Jock River Estates Phase II, Formerly Village of Richmond City of Ottawa, Ontario OTEN B September 28, 2011 A clay seal is recommended to underlie the field bed within lot 9. This is due to a small portion of soil that is less than 30 cm and some soils to the west of the bed less than 15 cm. A total of nine shovel holes were excavated in the area of the proposed field bed. Within the footprint of the tiles, all three shovel holes excavated displayed soils above 30 cm. Within the mantle, one hole has soils less than 30 cm. Two shovel holes with less than 15 cm of soil were identified on the boundary of the mantle. The 20 cm clay seal (as shown on Figure 3) is recommended as a best management practice to prevent any short circuiting of the effluent. It is understood that this is not practical within the entire development but such recommendations have been approved by the RVCA in the past for a single lot or two within a development. Septic systems have been placed to direct the effluent away from surficial bedrock / thin soil veneer. The residential development is of a low density with the smallest lot being 0.81 hectare with an average lot density of 0.84 hectare. If you were to include the common lands (i.e. right of way), the average lot would be in the order of 0.9 hectare. This considered to be a large lot (well above village lot size) and is not much below lot size requirements if the site were deemed to be sensitive. As per the nitrate dilution calculations, a total of 15 lots could be accommodated on the site but only 11 lots are planned thus lowering any septic loading impact on the site. Additional fill material will be brought in to raise septic field beds which will add additional medium for nitrate dilution to the site. No water bearing fractures are present in the top 10 m of the bedrock. The top 10 m of bedrock will offer some additional protection to the shallow aquifer. Current plans propose that the wells be located more than 30 m from the recommended septic field bed locations. This will minimize the potential for any short circuiting from a field bed to the nearest well. Surface water flow is predominantly in the direction of the Jock River where some additional clay materials are present within Lot 5 and 6 which will serve as a partial barrier to septic effluent. Similar site conditions found in Phase I (thin soil cover over weathered rock) have not resulted in the presence of parameters indicative of septic effluent within wells from 400 and 420 Sangeet Place. The well from 420 Sangeet place is considered to be representative of conditions in the proposed development. New Technology It is understood that the field beds for a Class IV sewage system required to handle the sewage from a luxury home, occupy substantial portions (i.e., approximately 15 %) of the property. Based on the information collected from the site, the field beds are proposed to be raised for the reasons previously outlined. However, there are new technologies available that could reduce the size of the septic system footprint for each property such as class VII septic systems. It is also noted that the tertiary systems can also reduce the concentrations of nitrates septic effluent, which would lessen the potential of nitrate impacts to the aquifer below. If these septic systems are to be incorporated into the design of the properties at the time of design/construction stage, it is recommended that the systems be installed as per the Ontario Building Code. 25
34
35 Mr. Fred Logan Hydrogeology, Terrain Analysis and Impact Assessment Report Jock River Estates Phase II, Formerly Village of Richmond City of Ottawa, Ontario OTEN B September 28, Impact Assessment 5.1. Nitrate Impact Assessment The MOE Procedure D-5-4 presents a methodology for assessing the potential impact of on-site sewage disposal systems to groundwater resources. The procedure employs a three step process, with the need to proceed to a step dependent upon the conditions determined by the previous step. Step One considers lot sizes. If the proposed development has a minimum lot size of 1.0 hectares or larger, no further evaluation is necessary. Since the average lot size proposed for this development is 0.84 hectare, the condition required for Step One is not fulfilled, and the assessment proceeds to Step Two. Step Two considers system isolation. In areas where the underlying water supply aquifer(s) are protected by upward gradients or deposits of low permeability materials, the minimum lot size will not be determined by potential impact. Given that the overburden material at the site does not comprise of a consistent layer of low permeability clay or till that could serve as isolation, Step Two is not fulfilled and the assessment must proceed to Step Three. Step Three considers contaminant attenuation and a study is required to determine the risk of exceeding the allowable nitrate concentration of 10 mg/l at property boundaries based on the proposed septic systems. The following method used to determine the risk is the predictive method at which contaminant attenuation is based. For the purposes of this calculation, it is assumed that each lot will produce 1,000 L/day of sewage effluent containing 40 mg/l nitrate. The 1,000 L/day value is less than the design flow, but is recognized as a representative average value for subdivision lots. The calculation can be conducted for areas where there is sufficient soil for nitrate dilution (i.e. locations where there is more than 30 cm of soil) and also must exclude other non-permeable surfaces such as roadways, driveway and rooftops. The following equation arrives at the given nitrate content: [NO 3 - ] gw = Background Nitrate + [NO 3 - ] effluent x (# Lots) x (Daily Flow) x (365 days/year) D w + Volume of Sewage [NO 3 - ] gw = average nitrate content of groundwater on-site following development with infiltration as the only attenuating mechanism. [NO 3 - ] effluent t= 40 mg/l = 40g/m 3 D w = Annual volume of precipitation infiltration available for dilution A = A x W s x I f = downgradient area available for infiltration = site footprint (not including roads) driveways houses (outcrops and/or areas of thin soil cover) = 92,400 m m m m 2 27
36 Mr. Fred Logan Hydrogeology, Terrain Analysis and Impact Assessment Report Jock River Estates Phase II, Formerly Village of Richmond City of Ottawa, Ontario OTEN B September 28, 2011 W s I f = water surplus for loam from Environment Canada using data collected at the Ottawa airport (see Appendix E) = 0.33 m = infiltration factor based on a mix of rolling land (elevation change within the property is between 101 masl to 98 masl with gradual sloping throughout the property in the order of 0.2 to 0.4% 0.2 based on a medium combination of clay and loam (topsoil) 0.20 based on woodland cover throughout the entire property 0.20 Total is 0.6 Therefore D w = 16,434 m 3 Volume of Sewage = 11 x 1000 L/day x 365 days/yr = 4,015,000 litres = 4,015 m 3 Therefore [NO 3 - ] = 40g/m 3 x 11 lots x 1 m 3 /day x 365 days/yr 16,434 m 3 + 4,015 m 3 = 7.8 g/m 3 As per the current regulations, a nitrate level of 10 g/m 3 is allowed at the development boundary. Based on current site conditions, the nitrate level would be well below 10 g/m 3 and therefore, there are no concerns regarding off-site nitrate impacts. The bedrock groundwater sampling program displayed a nitrate concentration 0.4 mg/l at Test Well #3. Assuming this nitrate concentration, the nitrate levels at the property boundary would be 8.5 mg/l and below the maximum concentration of 10 mg/l. Given that existing nitrate levels on the site range and from the neighbouring development to the north range from non-detectable to 0.4 mg/l (sample at end of Test Well #3 pump test), it does not appear that the existing development to northwest (Jock River Estates Phase I), agricultural land to the north and a golf course to the south and west of the property has had an impact on the site Shoreline Setback Assessment Based on a review of the site conditions and topographic mapping, the only notable water body that approaches the proposed development is the Jock River. To protect the Jock River from septic impacts, a buffer zone is to be established for the river. No other notable water bodies are present that would require phosphate loading calculations for the purpose of establishing a buffer zone. Exp used the Rideau Lakes Basin Carrying Capacities and Proposed Shoreline Development Policies, February 1992 to further define the minimum setback requirements (Michael Michalski Associates & Anthony Usher Planning Consultants). The surface impact assessment was conducted within the southern portions of the site, which border the Jock River. This method determines the setback based on soil depth, soil type, slope and vegetative cover at the subject site. The soil type used as part of these assessments was based on the test pits excavated within Lot 5 and 6. 28
37 Mr. Fred Logan Hydrogeology, Terrain Analysis and Impact Assessment Report Jock River Estates Phase II, Formerly Village of Richmond City of Ottawa, Ontario OTEN B September 28, 2011 Exp assessed the proposed shoreline buffer distance at two segments (A-A, B-B ) of the river as shown in Figure 3. It is exp s professional opinion that two separate cross-sections are representative of the near shoreline characteristics. The scoring system for the two cross-sections is shown in Table 1. Parameter Table 3: Recommended Shoreline Scores Description Score Description Score Section A-A Soil Depth Depth is between 0.8 to 1 m 4 Section B-B Soil is greater is between 1 and 1.5 m thick, Soil Type Clayey silt, trace of sand 3 Silty sand, clayey sand 3 2 Slope Vegetation Cover Average Slope is 0-9% where field beds to be installed Disturbed fields, old fields, meadows 0 3 Average Slope is 0-9% where field beds to be installed Disturbed fields, old fields, meadows Score 10 Score The table above displays values/constants which are established based on associated scores for soil type, topography and vegetative cover within the Rideau Lakes Basin Carrying Capacities and Proposed Shoreline Development Policies. A summation of the scores for each topographical section (shown in the figure) then corresponds to an associated setback distance (i.e. a score of 10 requires a setback of 30 m). It is understood that the above procedure was originally developed to assess surface water conditions within the Rideau Basin. However, exp has previously used this same scoring system to assess setbacks for prior developments outside of the Rideau Basin. The current Ottawa Official Plan requests that a 30 m buffer zone be established from all surface water features. This scoring system which is based on arbitrarily (independent of what specific surface water source whether it be Rideau River or Jock River) assessing the requirement for potential additional set back from the nearest contaminant source based on criteria original discussed below. Based on the calculations performed above, additional setback to the Ottawa Official plan setback is not required. The 30 m setback is deemed sufficient based on the following: There is satisfactory soil depth to provide a level of septic effluent retention prior to entering the creek; The slope of the ground from the proposed residential development is less than 9% and would promote infiltration and subsequent phosphate (septic effluent) attenuation in the on-site soils rather than promoting surface water run-off. The mixed disturbed fields, old fields and meadows provide some infiltration into the overburden cover rather than direct surface water runoff to the drain. Based on the above, the proposed site development incorporates these minimum set-backs (Appendix A). Assuming this setback is in place, exp does not suspect that the Jock River would be impacted from the installation of the septic systems. 29
38 Mr. Fred Logan Hydrogeology, Terrain Analysis and Impact Assessment Report Jock River Estates Phase II, Formerly Village of Richmond City of Ottawa, Ontario OTEN B September 28, 2011 As discussed in previous sections, a flood plain associated with the Jock River extends beyond the Jock River and into Lot 4 and Lot 5. No septic systems / dwellings / wells are located within the flood plain to minimize any potential impacts from flood waters interacting with potential sources of contamination. Exp performed the shoreline setback calculation for Lot #5 and Lot #6 and determined that there is sufficient buffer between the potential locations of the future septic fields and the Jock River while also ensuring that septic field beds are outside of the flood plain. 30
39
40 Mr. Fred Logan Hydrogeology, Terrain Analysis and Impact Assessment Report Jock River Estates Phase II, Formerly Village of Richmond City of Ottawa, Ontario OTEN B September 28, Conclusions An investigation was conducted to assess the suitability of a site on Sangeet Place in the City of Ottawa, Ontario (formerly Village of Richmond) for a proposed residential subdivision. The proposed development will consist of single family residences served by individual water wells and Class IV sewage disposal systems. Based on the results of this investigation, the following conclusions and recommendations are presented: 1. Water well records for 18 wells drilled near the site, the neighbouring development to the north identified as Phase I, indicate that well yields are in excess of the required 13.6 L/min (18.75 L/min for 4 bedroom house). The wells generally extend to depths ranging from 14 to 55 m from surface. 2. Two water supply wells were completed in limestone bedrock on the property and an existing well located on Lot #1 was also tested in support of this assessment. Six-hour constant rate pumping tests followed by recovery tests conducted on each of these wells indicate well yields at or in excess of the tested rates. These rates are more than adequate to supply the MOE recommended L/min flow rate for a 4-bedroom residence. 3. The wells drilled within the subject property are suspected of drawing water from high yield water bearing fractures likely within the Oxford Formation. 4. A water level datalogger was installed in TW2 for a period of 11 days in the month of August and 7 days in the month of September to identify potential changes in the aquifer static levels based on high water usage from the Centennial Golf Course. No changes in water levels were identified and static water levels from all readings are relatively constant. 5. The pumping tests indicate that minor well interference was noted at selected monitoring wells during the pumping tests, suggesting a hydraulic connection between two of the wells. However, the pumping tests were conducted at flow rates well above the anticipated household flow rates. A conservative evaluation of the well interference at the site predicts a drawdown ranging from 0.16 m/well at the center of the property to 0.13 m/well at the property limits based on standard water usage over 30 years. 6. Groundwater quality in the bedrock aquifer met all health related criteria of the Ontario Drinking Water Standards for those parameters tested after all testing was complete. Turbidity and hardness were noted to be above the applicable aesthetic objective guidelines at the end of the test in each of the test wells. Given that the minimal aesthetic objectives can be easily treated, they are not considered to be a concern. All concentrations were below the D-5-5 treatability limits and exp considers the groundwater to be suitable for use as potable water. 7. The construction of 6 test pits revealed that surficial soil deposits consist of sandy topsoil and organic material. This material is underlain by weathered limestone bedrock over most of the subject site, but closer to the river, there is a glacial till unit that consists of either clayey silt (Test Pit #5 on Lot #5) or silty sand (Test Pit #6 on Lot #6) between the topsoil and 0.5 m of weathered bedrock. Therefore, raised field beds are likely going to be required to minimize impact to the septic systems to the shallow groundwater and the poorly draining material. 31
41 Mr. Fred Logan Hydrogeology, Terrain Analysis and Impact Assessment Report Jock River Estates Phase II, Formerly Village of Richmond City of Ottawa, Ontario OTEN B September 28, The thin soil veneer at the site has posed some questions regarding potential septic effluent impact to the aquifer. Based on a detailed test pit / shovel excavation program, it is our opinion that the site is not considered to be sensitive and that the aquifer (with no fractures less than 10 m from surface) is not under risk. Exp sampled two existing residential wells and TW3 (located within 60 m of neighbouring septic systems) and did not find any elevated nitrate/nitrite, surficial related impacts, elevated sodium from softeners that would suggest short circuiting of the aquifer. 9. A nitrate impact assessment indicates that the installation of the Class IV sewage disposal systems will not result in unacceptable degradation of the water supply aquifer at the downgradient site boundary. All zones of surficial bedrock / roadways and other non-permeable areas were omitted from the calculation. In summary, the proposed residential development was assessed through a review of the neighbouring site conditions as well as a more detailed investigation (intrusive) within the site. Monitoring and sampling programs were designed to assess the current impacts stemming from pesticide / herbicide use and high water yield to which no impacts were observed. The program also focused on assessing impacts from the Jock River by reviewing potential surface water impact infiltration into TW2 at which no indication of impacts were noted. Finally, water samples were also collected from neighbouring dwellings (with similar soil conditions) and assessed for septic impacts to which none were noted. Based on the results of the hydrogeological, terrain and impact assessment evaluation, it is recommended that the proposed residential development be approved for development. 32
42 Mr. Fred Logan Hydrogeology, Terrain Analysis and Impact Assessment Report Jock River Estates Phase II, Formerly Village of Richmond City of Ottawa, Ontario OTEN B September 28, Recommendations All wells drilled on this property should be constructed in accordance with Ontario Regulation 903. The casing of bedrock wells should extend at least 3 m into competent bedrock while ensuring the casing maintains the minimum 6 m length from surface. Grouting procedures are to be supervised by a Professional Engineer. It is recommended that well casings within Lot 5 and 6 (i.e. nearest the Jock River) extend to a depth of 10 m. It is recommended that drinking water wells be drilled to depths between 30 to 54 m based on the depths of wells sampled/tested as part of this program. Any well that would extend those depths would have to undergo additional chemical analysis (similar to that conducted as part of this report) prior to commissioning. It is recommended that best management water conservation practices be used as part of this residential development such as low flow water attachments and/or water usage off of peak hours It is recommended that the separation distance between drinking water wells and the proposed septic systems/field beds be a minimum of 30 m (to provide additional separation distance) due to the thinner soil veneer at the site Aesthetic objective exceedences were observed from the test wells. Based on aesthetic objective exceedences, the following recommendations apply: o o o Elevated hardness levels are present within the groundwater supply. It is recommended that softeners be used to treat hardness, if desired. Elevated TDS was detected in the groundwater supply. Even though it is not anticipated to hamper the taste or the odour, it is recommended that a point-of-use residential reverse osmosis system be installed, if desired. Based on sodium levels above 20 mg/l, it is recommended that persons on low salt diets install a point-of-use reverse osmosis system. It is recommended that well users pump their well for a minimum of 24 hrs and collect water samples for bacteriological analysis prior to using their well for consumption purposes. Well users should collect water samples on a semi-annual basis. It is recommended that well users follow best management practices to conserve water such as low flow water devises. It is recommended that the historical well pit on the site be abandoned in accordance with O.Reg. 903 if it is allowed to be abandoned barring archeological significance. Current assessments and field bed sizes were completed assuming that Class IV septic systems are to be used. Exp recommends that consideration be given for the usage of tertiary systems and other improved technologies. The use of tertiary systems and other improved technologies could further reduce the levels of septic impacted effluent and minimize any potential impacts to shallow groundwater. o Best management practices are recommended such as regular pumping of the septic system, cursory inspection of break-out, consideration as to what materials are being discharge to the septic. 33
43 Mr. Fred Logan Hydrogeology, Terrain Analysis and Impact Assessment Report Jock River Estates Phase II, Formerly Village of Richmond City of Ottawa, Ontario OTEN B September 28, 2011 It is recommended that septic field beds be installed specifically in the locations shown on Figure 4 to maintain their separation distance from drinking water wells, flood plain limits and away from areas of thin soil veneer. No septic systems are to be installed on the No septic zones or direct flow away from the septic zones. If it is being proposed at the design stage to alter the location of the field beds and/or wells, it is recommended that an engineer be consulted. It is recommended that all field beds be completed as raised fields due to the shallow soils on the site, in accordance with the Ontario Building Code. Current design plans call for the use of fill at the site for grading and drainage purposes. It is recommended that existing soil thickness on the site be maintained and/or additional fills be added to the site as part of the design plan. Based on the results of the hydrogeological, terrain and impact assessment evaluation, it is recommended that the proposed residential development be approved for development. It is recommended that a 20 cm clay seal underlie the raised field for Lot 9. 35
44
45 Mr. Fred Logan Hydrogeology, Terrain Analysis and Impact Assessment Report Jock River Estates Phase II, Formerly Village of Richmond City of Ottawa, Ontario OTEN B September 28, References 1. Cooper, H.H. and Jacob, C.E., 1946: A Generalized Graphical Method for Evaluating Formation Constants and Summarizing Well-Field History. Trans, Amer. Geophys. Union, Vol. 27, No IV, pp Freeze, R.A. and Cherry, J.A., 1979: Groundwater: Prentice Hall. 3. Ministry of the Environment, D-5-5 Technical Guideline for Private Wells: Water Supply Assessment, August 1996 (revision). 4. Ministry of the Environment, Ontario Drinking Water Standards, Hantush, M.S. and Jacob, C.E. (1955), Non-steady radial flow in an infinite leaky aquifer, Am. Geophys. Union Trans., v. 36, p Richard S.H. et al., 1974: Surficial Materials and Terrain Features (Ottawa-Hull), Map 1425A, Scale 1: 125,000 Geological Survey of Canada. 7. Carson, D.M., et al., 1982: Paleozoic Geology of the Kemptville Area, Map P.2493, Scale 1:50,000 Ontario Geological Survey. 8. Johnson Division, 1986: Groundwater and Wells, 2nd Edition; F.G. Driscoll, Principal Author. 9. Ministry of the Environment: Water Well Records. 10. Ministry of the Environment 1995: MOEE Hydrogeological Technical Information Requirements for Land Development Applications. 11. Ministry of the Environment, 1982: Excerpt from MOE Policy, Procedures, and Guidelines for Private Sewage Disposal Systems. 12. Ontario Building Code, 1997: Regulation 403/97, Code & Guide for Sewage Systems Ministry of Municipal Affairs and Housing. 13. Harrison, 1976: Ottawa-Hull: 1: 125,000: Map 1508A, Generalized Bedrock Geology, Geological Survey of Canada. 14. Theis, C.V., 1935: The relation between the lowering of the piezometric surface and the rate, and the duration of discharge of a well using groundwater storage. Trans, Amer, Geophys. Union, 2, pp
46
47 Appendix A: Figures Mr. Fred Logan Hydrogeology, Terrain Analysis and Impact Assessment Report Jock River Estates Phase II, Formerly Village of Richmond City of Ottawa, Ontario OTEN B September 28, 2011
48

49 FLOOD PLAIN SITE LOCATION PROVINCIAL SIGNIFICANT WETLAND The new identity of Trow exp Services Inc. t: f: Queensview Drive, Suite 100 Ottawa, ON K2B 8H6, Canada DATE SEPTEMBER 2011 DESIGN CHECKED C.H. M.G.M. P.G. DRAWN BY CLIENT: TITLE: ONTARIO INC. SITE LOCATION PLAN JOCK RIVER ESTATES, RICHMOND, ON. project no. scale OTT B0 N.T.S. FIG 1
50 CONCEPTUAL HYDROGEOLOGICAL MODEL - JOCK RIVER ESTATES, RICHMOND, ON.
51 SOIL TYPE & THICKNESS MAP - JOCK RIVER ESTATES, RICHMOND, ON.

52 LOT LAYOUT PLAN - JOCK RIVER ESTATES, RICHMOND, ON.
53 Appendix B: MOE Well Records Mr. Fred Logan Hydrogeology, Terrain Analysis and Impact Assessment Report Jock River Estates Phase II, Formerly Village of Richmond City of Ottawa, Ontario OTEN B September 28, 2011
54

55

56

57
58 TOWNSHIP CONCESSION (LOT) GOULBOURN TOWNSHIP CON 02(020) GOULBOURN TOWNSHIP CON 02(021) GOULBOURN TOWNSHIP CON 02(021) Well Computer Print Out Data as of February Page: 1 / 3 UTM 1 DATE 2 CNTR / W / W / W 1119 CASING DIA 4 STAT LVL/PUMP LVL 7 RATE 8 /TIME HR:MIN WATER5,6 DETAIL / / 1:0 06 UK 0088 UK / / 1: / / 1:0 WATER USE 9 SCREEN WELL # (AUDIT#) WELL TAG # INFO 10 DEPTHS TO WHICH FORMATIONS EXTEND 5,11 DO (Z13684) A BRWN LOAM STNS PCKD 0005 GREY LMSN LYRD HARD 0123 DO (Z60316) A BRWN LOAM STNS PCKD 0008 GREY LMSN 0135 DO (Z65015) A FILL 0004 WHIT QTZ 0048 LMSN 0060 GOULBOURN TOWNSHIP CON 02(021) / W / / 1:0 DO (Z30799) A CLAY SNDY 0008 GREY LMSN 0120 GOULBOURN TOWNSHIP CON 02(021) / W / / 1:0 DO (Z13703) A BRWN CLAY STNS WBRG 0000 GREY LMSN HARD 0123 GOULBOURN TOWNSHIP CON 02(021) / W FR 0045 FR / / 1:0 MN () GREY SAND 0005 GREY LMSN 0084 GOULBOURN TOWNSHIP CON 02(021) GOULBOURN TOWNSHIP CON 02(021) GOULBOURN TOWNSHIP CON 02(021) / W / W / W FR / / 1: / / 1:0 / / :0 DO () GREY SAND 0008 GREY CLAY 0020 GREY HPAN STNS 0028 GREY LMSN 0048 DO (Z13832) A BRWN LOAM STNS 0008 GREY HPAN 0012 GREY LMSN (Z60334) GOULBOURN TOWNSHIP CON 02(021) / W / / 1:0 DO (Z30808) A CLAY GRVL 0009 GREY LMSN 0120 GOULBOURN TOWNSHIP CON 03(021) / W / / 1:0 DO (Z13694) A GREY LMSN HARD 0120 GOULBOURN TOWNSHIP CON (005) GOULBOURN TOWNSHIP CON (012) GOULBOURN TOWNSHIP CON (013) GOULBOURN TOWNSHIP 02(002) / W W 2007/ / W / W / / 1:0 06 FR / / 1:0 06 FR / 005 / 1: / / 1:0 DO (Z57245) A YLLW SAND FILL SOFT 0003 BRWN SNDS HARD 0063 DO (Z57244) A BRWN CLAY SOFT 0004 BRWN SNDS HARD 0120 DO (Z57243) A BRWN TILL BLDR HARD 0011 BRWN SNDS HARD 0179 DO (Z90246) A GRVL 0008 LMSN 0111 GREY SNDS 0140 GOULBOURN TOWNSHIP 02(021) W 2006/ / / 1:0 DO (Z48693) A LOAM 0003 LMSN 0080 GOULBOURN TOWNSHIP 02(021) / W / / 1:0 DO (Z48694) A LOAM 0002 LMSN 0115
59 TOWNSHIP CONCESSION (LOT) KINGSTON CITY (010) Well Computer Print Out Data as of February Page: 2 / 3 UTM 1 DATE 2 CNTR / W 6006 CASING DIA 4 WATER5,6 DETAIL 06 FR 0089 FR 0109 STAT LVL/PUMP LVL 7 RATE 8 /TIME HR:MIN 003 / / 1:0 WATER USE 9 SCREEN WELL # (AUDIT#) WELL TAG # INFO 10 DEPTHS TO WHICH FORMATIONS EXTEND 5,11 DO (Z85698) A BRWN CLAY SOFT 0006 GREY LMSN SNDS HARD 0129
60 Well Computer Print Out Data as of February Page: 3 / 3 Notes: 1. UTM in Zone, Easting, Northing and Datum is NAD83; L: UTM estimated from Centroid of Lot; W: UTM not from Lot Centroid 2. Date Work Completed 3. Well Contractor Licence Number 4. Casing diameter in inches 5. Unit of Depth in Feet 6. See Table 4 for Meaning of Code 7. STAT LVL: Static Water Level in Feet ; PUMP LVL: Water Level After Pumping in Feet 8. Pump Test Rate in GPM, Pump Test Duration in Hour : Minutes 9. See Table 3 for Meaning of Code 10. Screen Depth and Length in feet 11. See Table 1 and 2 for Meaning of Code 1. Core Material and Descriptive terms Code Description Code Description Code Description Code Description Code Description BLDR BOULDERS FCRD FRACTURED IRFM IRON FORMATION PORS POROUS SOFT SOFT CHRT CHERT FLDS FELDSPAR LOOS LOOSE QSND QUICKSAND STNY STONEY CLAY CLAY FLNT FLINT LTCL BSLT BASALT FGRD FINE-GRAINED LIMY LIMY PRDG PREVIOUSLY SPST SOAPSTONE DUG COARSE- PREV. CGRD FGVL FINE GRAVEL LMSN LIMESTONE PRDR STKY STICKY GRAINED DRILLED COARSE CGVL FILL FILL LOAM TOPSOIL QRTZ QUARTZITE STNS STONES GRAVEL LIGHT- COLOURED QTZ QUARTZ THIK THICK CLN CLEAN FOSS FOSILIFEROUS LYRD LAYERED ROCK ROCK THIN THIN CLYY CLAYEY FSND FINE SAND MARL MARL SAND SAND TILL TILL CMTD CEMENTED GNIS GNEISS MGRD CONG CONGLOMERATE GRNT GRANITE MGVL SHLE SHALE UNKN UNKNOWN TYPE SHLY SHALY VERY VERY CRYS CRYSTALLINE GRSN GREENSTONE MRBL MARBLE SHRP SHARP WBRG CSND COARSE SAND GRVL GRAVEL MSND MEDIUM SAND SHST SCHIST WDFR DKCL WATER- BEARING WOOD FRAGMENTS DARK- COLOURED MEDIUM- GRAINED MEDIUM GRAVEL GRWK GREYWACKE MUCK MUCK SILT SILT WTHD WEATHERED DLMT DOLOMITE GVLY GRAVELLY OBDN OVERBURDEN SLTE SLATE DNSE DENSE GYPS GYPSUM PCKD PACKED SLTY SILTY DRTY DIRTY HARD HARD PEAT PEAT SNDS SANDSTONE DRY DRY HPAN HARDPAN PGVL PEA GRAVEL SNDY SANDY 2. Core Color Code Description WHIT WHITE GREY GREY BLUE BLUE GREN GREEN YLLW YELLOW BRWN BROWN RED RED BLCK BLACK BLGY BLUE-GREY 3. Water Use Code Description Code Description DO Domestic OT Other ST Livestock TH Test Hole IR Irrigation DE Dewatering IN Industrial MO Monitoring CO Commercial MN Municipal PS Public AC Cooling And A/C NU Not Used 4. Water Detail Code Description Code Description FR Fresh GS Gas SA Salty IR Iron SU Sulphur MN Mineral UK Unknown

61


62


63

64

65


66

67


68


69


70


71


72


73


74

75


76
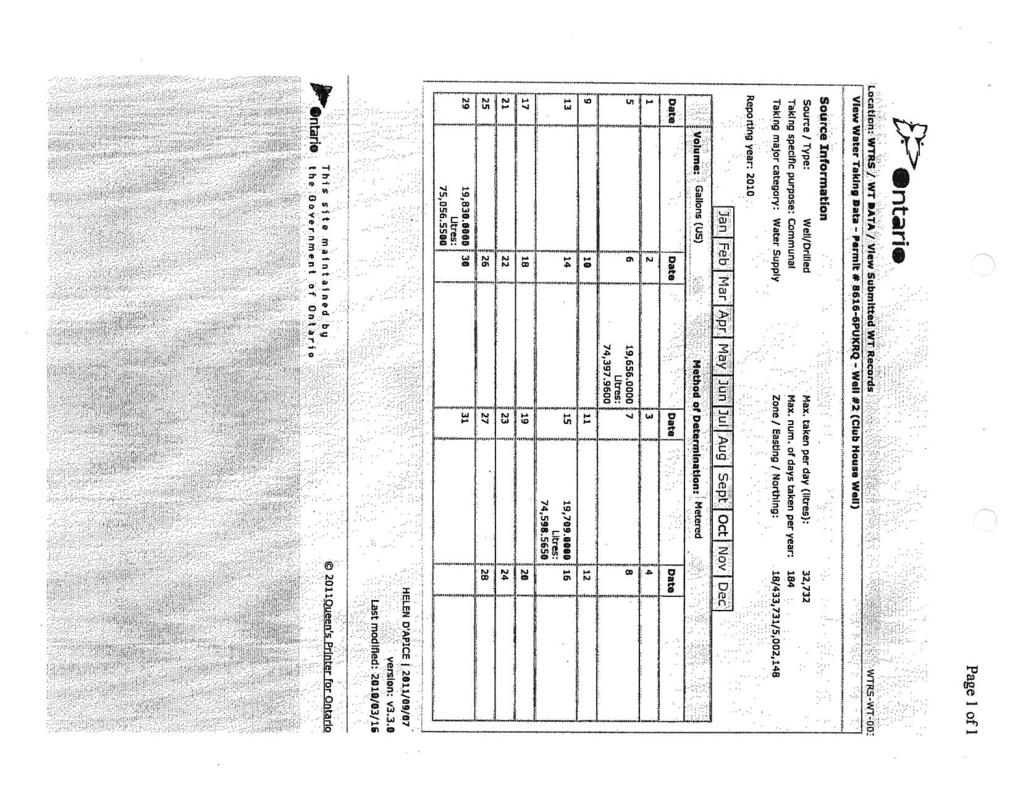
77

78

79

80


81


82

83

84


85


86
87 Appendix C: Pump Test Data Mr. Fred Logan Hydrogeology, Terrain Analysis and Impact Assessment Report Jock River Estates Phase II, Formerly Village of Richmond City of Ottawa, Ontario OTEN B September 28, 2011
88
89 OTEN A Pump Test on Test Well #1 Pump Test conducted on January 7, 2009 Pump Rate Pump Depth 59 L/min 29 m Running Time (min) Pump Test Water Levels (m) Drawdown (m) Recovery Time (min) Recovery Test Running Time (min) Water Levels (m) Residual Drawdown (m) Turbidity Time Turb (NTU) Total chlorine was less than 0.01 mg/l at 330 min Free chlorine was at 0.05 mg/l at 330 min (factory calibration used for chlorimeter) Water observations: cloudy and grey for first 5 min then cleared up. No odours detected Monitoring Well Data Well # Water Levels (m) Pump test Recovery Time (min) Test Well # nm 2.54 Test Well # nm = no measurement taken
90 OTEN A Pump Test on Test Well #2 Pump Test conducted on January 8, 2009 Pump Rate Pump Depth 90 L/min 12 m Running Time (min) Pump Test Water Levels (m) Drawdown (m) Recovery Time (min) Recovery Test Water Running Levels Time (min) (m) Residual Drawdown (m) Turbidity Time Turb (NTU) Total chlorine was less than 0.01 mg/l at 330 m Free chlorine was at 0.01 mg/l at 330 min (factory calibration used for chlorimeter) Water observations: cloudy and brown for first 5-10 min then cleared up. Slight sulphur odour detected Monitoring Well Data Well # Water Levels (m) Pump test Recovery Time (min) Test Well # nm 3.50 Test Well # nm 4.10 nm = no measurement taken
91 OTEN A Pump Test on Test Well #3 Pump Test conducted on January 9, 2009 Pump Rate Pump Depth 51 L/min 17m Pump Test Recovery Test Water Recovery Water Running Levels Drawdown (m) Time Levels Time (min) (m) (min) (m) Running Time (min) Turbidity Time Turb (NTU) Residual Drawdown (m) nm Total chlorine was at 0.02 mg/l at 330 min Free chlorine was at 0.02 mg/l at 330 min (factory calibration used for chlorimeter) Water observations: cloudy and brown for first 10 min then cleared up. Slight sulphur and organic decay odour detected at beginning of test. Monitoring Well Data Well # Water Levels (m) Pump test Time (min) Test Well # nm Test Well # nm nm = no measurement taken
92
93
94
95
96
97
98
99
100
101
102
103 OTEN A Mutual Well Interference (Geomean Transmissivity) Approach 1 Assuming the entire property is representative of the geomean transmissivity of the on-site wells 30 year average WELL INTERFERENCE ================= T=Q*W(u)/4*PI*dd m²/s ao S=(4*u*T*t)/r² 7.73E-06 ai t= sec 30 years 9.46E+08 aii dd=q*w(u)/(4*pi*t) aiii Q= m³/s 3m 3 /day 3.47E-05 m 3 /s aiv u=r²*s/4tt av W(u)=-ln u +[{[(av*u+aiv)u+aiii]u+aii}u+ai]u+ao Distance # Wells Avg r u W(u) DD/well m m (metres) E E E E
104 OTEN A Mutual Well Interference (Lowest Transmissivity) Approach 2 Assuming the entire property is representative of the lowest transmissivity of the on-site wells 30 year average WELL INTERFERENCE ================= T=Q*W(u)/4*PI*dd m²/s ao S=(4*u*T*t)/r² 1.2E-07 ai t= sec 30 years 9.46E+08 aii dd=q*w(u)/(4*pi*t) aiii Q= m³/s 3m 3 /day 3.47E-05 m 3 /s aiv u=r²*s/4tt av W(u)=-ln u +[{[(av*u+aiv)u+aiii]u+aii}u+ai]u+ao Distance # Wells Avg r u W(u) DD/well m m (metres) E E E E
105 1 Test Well #1 Drawdown Outside of Pumping Tests Change in Water Levels /08/ /08/ /08/ /08/ /08/ /08/ /08/ /08/ /08/ Series Date
106 1 TW1 Water Levels Outside of Pumping Test in Water Levels Change Sep 11 8 Sep 11 9 Sep Sep Sep Sep Sep Sep Sep Series Date
107 Appendix D: Groundwater Chemistry Mr. Fred Logan Hydrogeology, Terrain Analysis and Impact Assessment Report Jock River Estates Phase II, Formerly Village of Richmond City of Ottawa, Ontario OTEN B September 28, 2011
108
109 OTEN A Groundwater Analytical Results General Water Chemistry Test Well #1 Test Well #2 Test Well #3 Neighbouring Residential Wells PARAMETER UNITS Type of Criteria ODWS Criteria D-5-5 Treatability W1 Start W1 End W2 Start W2 End W3 Start W3 End Well 400 Well 420 Date 7-Jan-09 7-Jan-09 8-Jan-09 8-Jan-09 9-Jan-09 9-Jan Jan Jan-09 Lot 9 Lot 4 Lot 1 Sangeet Place Sangeet Place Total Coliform ct/100ml MAC 1 ; < 1 < 1 < 1 < 1 < 1 < 1 < 1 n/a E. Coli ct/100ml MAC 1 - < 1 < 1 < 1 < 1 < 1 < 1 < 1 n/a Background ct/1ml MAC < 1 < 1 < 1 < n/a Alkalinity as CaCO 3 mg/l OG 30 to Chloride mg/l OG Colour TCU AO Conductivity µmho/cm n/v n/v Dissolved Organic Carbon mg/l AO Fluoride 8 mg/l MAC Hydrogen Sulphide mg/l AO < 0.01 < 0.01 < < 0.01 N-NH 3 (Ammonia) mg/l n/v n/v - < 0.01 < N-NO 2 (Nitrite) mg/l MAC < 0.1 < 0.1 < 0.1 < 0.1 < 0.1 < 0.1 < 0.1 < 0.1 N-NO 3 (Nitrate) mg/l MAC < 0.1 < 0.1 < 0.1 < 0.1 < < 0.1 < 0.1 ph -log 10 [H+] AO Phenols mg/l n/v n/v - < < < < < < < < Sulphate mg/l AO Tannin & Lignin mg/l n/v n/v Total Dissolved Solids mg/l AO Organic Nitrogen mg/l AO Total Kjeldahl Nitrogen mg/l n/v n/v Turbidity NTU MAC/AO Hardness as CaCO 3 mg/l OG Calcium mg/l n/v n/v Magnesium mg/l n/v n/v Potassium mg/l n/v n/v Sodium mg/l AO 20 6 ; Iron mg/l AO Manganese mg/l AO Notes : AO= aesthetic objective, OG = operational guideline, MAC = maximum allowable concentration 1. Ontario Drinking Water Standards is used as the health related criteria 2. Bold - concentration exceeds ODWS Shaded - concentration exceeds D-5-5 treatability 3. OG (operational guideline) criteria are for treated drinking water systems. 4. n/a - not analysed 5. n/v - no value 6. Sodium value is a health related criteria for people with low salt diets. ` 7. D-5-5 criteria for raw water 8. Where supplies contain naturally occurring fluoride at levels higher than 1.5 mg/l but less than 2.4 mg/l, the Ministry of Health and Long-Term Care recommends an approach through local boards of health to raise public and professional awareness to control excessive exposure to fluoride from other sources. 9. Under D-5-5, hardness is accepted at values below 500 mg/l. Note: phenol concentration is below the criteria from any of the phenol sub-categories in the ODWS.
110 OTEN A Groundwater Analytical Results Pesticides & Herbicides PARAMETER Date UNITS Type of Criteria ODWS Criteria W3 9-Jan-09 Alachlor mg/l MAC < Aldicarb mg/l MAC < Aldrin + Dieldrin mg/l MAC < Atrazine + Metabolites mg/l MAC < Azinphos-methyl mg/l MAC 0.02 < Bendiocarb mg/l MAC 0.04 < Benzo(a)pyrene mg/l MAC < Bromoxynil mg/l MAC < Carbaryl mg/l MAC 0.09 < Carbofuran mg/l MAC 0.09 < Chlordane (Total) mg/l MAC < Chlorpyrifos mg/l MAC 0.09 < Cyanazine mg/l MAC 0.01 < DDT + Metabolites mg/l MAC 0.03 < Diazinon mg/l MAC 0.02 < Dicamba mg/l MAC 0.12 < Dichlorophenol, 2,4- mg/l MAC 0.9 < Dichlorophenoxy acetic acid, 2,4- (2,4-D) mg/l MAC 0.1 < Diclofop-methyl mg/l MAC < Dimethoate mg/l MAC 0.02 < Dinoseb mg/l MAC 0.01 < Diquat mg/l MAC 0.07 < Diuron mg/l MAC 0.15 < Glyphosate mg/l MAC 0.28 < Heptachlor + Heptachlor Epoxide mg/l MAC < Lindane (Hexachlorocyclohexane, Gamma) mg/l MAC < Malathion mg/l MAC 0.19 < Methoxychlor mg/l MAC 0.9 < Metolachlor mg/l MAC 0.05 < Metribuzin mg/l MAC 0.08 < Paraquat mg/l MAC 0.01 < Parathion mg/l MAC 0.05 < Pentachlorophenol mg/l MAC 0.06 < Phorate mg/l MAC < Picloram mg/l MAC 0.19 < Poly-Chlorinated Biphenyls (PCB's) mg/l MAC < Prometryne mg/l MAC < Simazine mg/l MAC 0.01 < Temephos mg/l MAC 0.28 < 0.01 Terbufos mg/l MAC < Tetrachlorophenol, 2,3,4,6- mg/l MAC < Triallate mg/l MAC 0.23 < 0.01 Trichlorophenol 2,4,6- mg/l MAC < Trichlorophenoxy acetic acid, 2,4,5- mg/l MAC 0.28 < 0.01 Trifluralin mg/l MAC <
111 Notes : AO= aesthetic objective, OG = operational guideline, MAC = maximum allowable concentration 1. Ontario Drinking Water Standards is used as the health related criteria 2. Bold - concentration exceeds appropriate criteria
112 CERTIFICATE OF ANALYSIS Final Report C.O.C.: C04285 Report To: Trow Consulting Engineers Ltd. 154 Colonnade Rd South Ottawa, ON, K2E 7J5 Attention: Rob Renaud DATE RECEIVED: DATE REPORTED: SAMPLE MATRIX: 08-Jan Jan-09 Water Caduceon Environmental Laboratories 2378 Holly Lane Ottawa, Ontario, K1V 7P1 Tel: Fax: JOB/PROJECT NO.: P.O. NUMBER: WATERWORKS NO. REPORT No. B OTEN A Client I.D.: Sample I.D.: Date Collected: W1 Start W1 End W2 Start W2 End B B B B Jan Jan Jan Jan-09 Parameter Units M.D.L. Reference Method Date/Site Analyzed Hardness (as CaCO3) mg/l 1 SM Jan-09/O Alkalinity (as CaCO3) mg/l 5 EPA Jan-09/O Conductivity µmho/cm 1 SM Jan-09/O ph ph Units EPA Jan-09/O Colour TCU 1 SM Jan-09/O Turbidity NTU 0.1 SM Jan-09/O Fluoride mg/l 0.1 EPA Jan-09/O Chloride mg/l 0.5 EPA Jan-09/O Nitrite (N) mg/l 0.1 EPA Jan-09/O < 0.1 < 0.1 < 0.1 < 0.1 Nitrate (N) mg/l 0.1 EPA Jan-09/O < 0.1 < 0.1 < 0.1 < 0.1 Sulphate mg/l 1 EPA Jan-09/O Calcium mg/l 0.02 SM Jan-09/O Magnesium mg/l 0.01 SM Jan-09/O Sodium mg/l 0.2 SM Jan-09/O Potassium mg/l 0.1 SM Jan-09/O Iron mg/l SM Jan-09/O Manganese mg/l SM Jan-09/O Silica mg/l 0.02 SM Jan-09/O Ammonia (N)-Total mg/l 0.01 EPA Jan-09/O < 0.01 < Total Kjeldahl Nitrogen mg/l 0.05 EPA Jan-09/O Organic Nitrogen mg/l 0.05 EPA Jan-09/O Dissolved Organic Carbon mg/l 0.2 EPA Jan-09/O Hydrogen Sulphide mg/l 0.01 SM4500-S2 12-Jan-09/O 0.03 < 0.01 < 0.01 < 0.01 Phenolics mg/l EPA Jan-09/O < < < < Tannins and Lignins mg/l 0.1 SM5500B 12-Jan-09/O Total Coliform cts/100ml 1 MOE E Jan-09/O < 1 < 1 < 1 < 1 E coli cts/100ml 1 MOE E Jan-09/O < 1 < 1 < 1 < 1 Background cts/100ml 1 MOE E Jan-09/O < 1 < 1 < 1 < 1 M.D.L. = Method Detection Limit Site Analyzed=K-Kingston,W-Windsor,O-Ottawa,P-Peterborough,M-Moncton Greg Clarkin, BSc., C. Chem Lab Manager - Ottawa District Page 1 of 2.
113 CERTIFICATE OF ANALYSIS Final Report C.O.C.: C04285 Report To: Trow Consulting Engineers Ltd. 154 Colonnade Rd South Ottawa, ON, K2E 7J5 Attention: Rob Renaud DATE RECEIVED: DATE REPORTED: SAMPLE MATRIX: 08-Jan Jan-09 Water Caduceon Environmental Laboratories 2378 Holly Lane Ottawa, Ontario, K1V 7P1 Tel: Fax: JOB/PROJECT NO.: P.O. NUMBER: WATERWORKS NO. REPORT No. B OTEN A Client I.D.: Sample I.D.: Date Collected: W1 Start W1 End W2 Start W2 End B B B B Jan Jan Jan Jan-09 Parameter Units M.D.L. Reference Method Date/Site Analyzed Anion Sum meq/l Calc. 12-Jan-09/O Cation Sum meq/l Calc. 12-Jan-09/O % Difference % Calc. 12-Jan-09/O Ion Ratio AS/CS Calc. 12-Jan-09/O Sodium Adsorption Ratio - Calc. 12-Jan-09/O TDS(ion sum calc.) mg/l Calc. 12-Jan-09/O Conductivity (calc.) µmho/cm Calc. 12-Jan-09/O TDS(calc.)/EC(actual) - Calc. 12-Jan-09/O EC(calc.)/EC(actual) - Calc. 12-Jan-09/O Langelier Index(25 C) S.I. Calc. 12-Jan-09/O M.D.L. = Method Detection Limit Site Analyzed=K-Kingston,W-Windsor,O-Ottawa,P-Peterborough,M-Moncton Greg Clarkin, BSc., C. Chem Lab Manager - Ottawa District Page 2 of 2.
114 CERTIFICATE OF ANALYSIS Final Report C.O.C.: C04286 Report To: Trow Consulting Engineers Ltd. 154 Colonnade Rd South Ottawa, ON, K2E 7J5 Attention: Rob Renaud DATE RECEIVED: DATE REPORTED: SAMPLE MATRIX: 10-Jan Jan-09 Groundwater Caduceon Environmental Laboratories 2378 Holly Lane Ottawa, Ontario, K1V 7P1 Tel: Fax: JOB/PROJECT NO.: P.O. NUMBER: WATERWORKS NO. REPORT No. B OTEN A Client I.D.: Sample I.D.: Date Collected: W3 Start W3 End W3 Pest./Herb. B B B Jan Jan Jan-09 Parameter Units M.D.L. Reference Method Date/Site Analyzed Hardness (as CaCO3) mg/l 1 SM Jan-09/O Alkalinity (as CaCO3) mg/l 5 EPA Jan-09/O Conductivity µmho/cm 1 SM Jan-09/O ph ph Units EPA Jan-09/O Colour TCU 1 SM Jan-09/O Turbidity NTU 0.1 SM Jan-09/O Fluoride mg/l 0.1 EPA Jan-09/O Chloride mg/l 0.5 EPA Jan-09/O Nitrite (N) mg/l 0.1 EPA Jan-09/O < 0.1 < Nitrate (N) mg/l 0.1 EPA Jan-09/O < Sulphate mg/l 1 EPA Jan-09/O Calcium mg/l 0.02 SM Jan-09/O Magnesium mg/l 0.01 SM Jan-09/O Sodium mg/l 0.2 SM Jan-09/O Potassium mg/l 0.1 SM Jan-09/O Iron mg/l SM Jan-09/O Manganese mg/l SM Jan-09/O Silica mg/l 0.02 SM Jan-09/O Ammonia (N)-Total mg/l 0.01 EPA Jan-09/O Total Kjeldahl Nitrogen mg/l 0.05 EPA Jan-09/O Organic Nitrogen mg/l 0.05 EPA Jan-09/O Dissolved Organic Carbon mg/l 0.2 EPA Jan-09/O Hydrogen Sulphide mg/l 0.01 SM4500-S2 13-Jan-09/O Phenolics mg/l EPA Jan-09/O < < Tannins and Lignins mg/l 0.1 SM5500B 12-Jan-09/O Total Coliform cts/100ml 1 MOE E Jan-09/O < 1 < 1 -- E coli cts/100ml 1 MOE E Jan-09/O < 1 < 1 -- M.D.L. = Method Detection Limit Site Analyzed=K-Kingston,W-Windsor,O-Ottawa,P-Peterborough,M-Moncton Greg Clarkin, BSc., C. Chem Lab Manager - Ottawa District Page 1 of 4.
115 CERTIFICATE OF ANALYSIS Final Report C.O.C.: C04286 Report To: Trow Consulting Engineers Ltd. 154 Colonnade Rd South Ottawa, ON, K2E 7J5 Attention: Rob Renaud DATE RECEIVED: DATE REPORTED: SAMPLE MATRIX: 10-Jan Jan-09 Groundwater Caduceon Environmental Laboratories 2378 Holly Lane Ottawa, Ontario, K1V 7P1 Tel: Fax: JOB/PROJECT NO.: P.O. NUMBER: WATERWORKS NO. REPORT No. B OTEN A Client I.D.: Sample I.D.: Date Collected: W3 Start W3 End W3 Pest./Herb. B B B Jan Jan Jan-09 Parameter Units M.D.L. Reference Method Date/Site Analyzed Background cts/100ml 1 MOE E Jan-09/O Anion Sum meq/l Calc. 12-Jan-09/O Cation Sum meq/l Calc. 12-Jan-09/O % Difference % Calc. 12-Jan-09/O Ion Ratio AS/CS Calc. 12-Jan-09/O Sodium Adsorption Ratio - Calc. 12-Jan-09/O TDS(ion sum calc.) mg/l Calc. 12-Jan-09/O Conductivity (calc.) µmho/cm Calc. 12-Jan-09/O TDS(calc.)/EC(actual) - Calc. 12-Jan-09/O EC(calc.)/EC(actual) - Calc. 12-Jan-09/O Langelier Index(25 C) S.I. Calc. 12-Jan-09/O Alachlor µg/l 0.3 EPA Jan-09/K < 0.3 Aldicarb µg/l 3 EPA Jan-09/K < 3 Aldrin + Dieldrin µg/l 0.02 Calc. 16-Jan-09/K < 0.02 Atrazine + Metabolites µg/l 0.5 Calc. 16-Jan-09/K < 0.5 Azinphos-methyl µg/l 1 EPA Jan-09/K < 1 Bendiocarb µg/l 3 EPA Jan-09/K < 3 Benzo(a)pyrene µg/l EPA Jan-09/K < Bromoxynil µg/l 0.3 EPA Jan-09/K < 0.3 Carbaryl µg/l 3 EPA Jan-09/K < 3 Carbofuran µg/l 1 EPA Jan-09/K < 1 Chlordane (Total) µg/l 0.04 Calc. 16-Jan-09/K < 0.04 Chlorpyrifos µg/l 0.5 EPA Jan-09/K < 0.5 Cyanazine µg/l 0.5 EPA Jan-09/K < 0.5 DDT + Metabolites µg/l 0.1 Calc. 16-Jan-09/K < 0.1 Diazinon µg/l 1 EPA Jan-09/K < 1 Dicamba µg/l 5 EPA Jan-09/K < 5 M.D.L. = Method Detection Limit Site Analyzed=K-Kingston,W-Windsor,O-Ottawa,P-Peterborough,M-Moncton Greg Clarkin, BSc., C. Chem Lab Manager - Ottawa District Page 2 of 4.
116 CERTIFICATE OF ANALYSIS Final Report C.O.C.: C04286 Report To: Trow Consulting Engineers Ltd. 154 Colonnade Rd South Ottawa, ON, K2E 7J5 Attention: Rob Renaud DATE RECEIVED: DATE REPORTED: SAMPLE MATRIX: 10-Jan Jan-09 Groundwater Caduceon Environmental Laboratories 2378 Holly Lane Ottawa, Ontario, K1V 7P1 Tel: Fax: JOB/PROJECT NO.: P.O. NUMBER: WATERWORKS NO. REPORT No. B OTEN A Client I.D.: Sample I.D.: Date Collected: W3 Start W3 End W3 Pest./Herb. B B B Jan Jan Jan-09 Parameter Units M.D.L. Reference Method Date/Site Analyzed Dichlorophenol, 2,4- µg/l 0.1 EPA Jan-09/K < 0.1 Dichlorophenoxy acetic µg/l 5 EPA Jan-09/K < 5 acid, 2,4- (2,4-D) Diclofop-methyl µg/l 0.5 EPA Jan-09/K < 0.5 Dimethoate µg/l 1 EPA Jan-09/K < 1 Dinoseb µg/l 0.5 EPA Jan-09/K < 0.5 Diquat µg/l 5 EPA Jan-09/K < 5 Diuron µg/l 5 EPA Jan-09/K < 5 Glyphosate µg/l 25 EPA Jan-09/K < 25 Heptachlor + Heptachlor µg/l 0.1 Calc. 16-Jan-09/K < 0.1 Epoxide Lindane µg/l 0.1 EPA Jan-09/K < 0.1 (Hexachlorocyclohexane, Gamma) Malathion µg/l 5 EPA Jan-09/K < 5 Methoxychlor µg/l 0.1 EPA Jan-09/K < 0.1 Metolachlor µg/l 3 EPA Jan-09/K < 3 Metribuzin µg/l 3 EPA Jan-09/K < 3 Paraquat µg/l 1 EPA Jan-09/K < 1 Parathion µg/l 3 EPA Jan-09/K < 3 Pentachlorophenol µg/l 0.1 EPA Jan-09/K < 0.1 Phorate µg/l 0.3 EPA Jan-09/K < 0.3 Picloram µg/l 5 EPA Jan-09/K < 5 Poly-Chlorinated Biphenyls µg/l 0.05 EPA Jan-09/K < 0.05 (PCB's) Prometryne µg/l 0.1 EPA Jan-09/K < 0.1 Simazine µg/l 0.5 EPA Jan-09/K < 0.5 Temephos µg/l 10 EPA Jan-09/K < 10 M.D.L. = Method Detection Limit Site Analyzed=K-Kingston,W-Windsor,O-Ottawa,P-Peterborough,M-Moncton Greg Clarkin, BSc., C. Chem Lab Manager - Ottawa District Page 3 of 4.
117 CERTIFICATE OF ANALYSIS Final Report C.O.C.: C04286 Report To: Trow Consulting Engineers Ltd. 154 Colonnade Rd South Ottawa, ON, K2E 7J5 Attention: Rob Renaud DATE RECEIVED: DATE REPORTED: SAMPLE MATRIX: 10-Jan Jan-09 Groundwater Caduceon Environmental Laboratories 2378 Holly Lane Ottawa, Ontario, K1V 7P1 Tel: Fax: JOB/PROJECT NO.: P.O. NUMBER: WATERWORKS NO. REPORT No. B OTEN A Client I.D.: Sample I.D.: Date Collected: W3 Start W3 End W3 Pest./Herb. B B B Jan Jan Jan-09 Parameter Units M.D.L. Reference Method Date/Site Analyzed Terbufos µg/l 0.3 EPA Jan-09/K < 0.3 Tetrachlorophenol, 2,3,4,6- µg/l 0.1 EPA Jan-09/K < 0.1 Triallate µg/l 10 EPA Jan-09/K < 10 Trichlorophenol 2,4,6- µg/l 0.1 EPA Jan-09/K < 0.1 Trichlorophenoxy acetic µg/l 10 EPA Jan-09/K < 10 acid, 2,4,5- Trifluralin µg/l 0.5 EPA Jan-09/K < 0.5 M.D.L. = Method Detection Limit Site Analyzed=K-Kingston,W-Windsor,O-Ottawa,P-Peterborough,M-Moncton Greg Clarkin, BSc., C. Chem Lab Manager - Ottawa District Page 4 of 4.
118 CERTIFICATE OF ANALYSIS Final Report C.O.C.: C04336 Report To: Trow Consulting Engineers Ltd. 154 Colonnade Rd South Ottawa, ON, K2E 7J5 Attention: Rob Renaud DATE RECEIVED: DATE REPORTED: SAMPLE MATRIX: 23-Jan Jan-09 Water Caduceon Environmental Laboratories 2378 Holly Lane Ottawa, Ontario, K1V 7P1 Tel: Fax: JOB/PROJECT NO.: P.O. NUMBER: WATERWORKS NO. REPORT No. B OTEN A Client I.D.: Sample I.D.: Date Collected: Well 400 Well 420 B B Jan Jan-09 Parameter Units M.D.L. Reference Method Date/Site Analyzed Hardness (as CaCO3) mg/l 1 SM Jan-09/O Alkalinity (as CaCO3) mg/l 5 EPA Jan-09/O Conductivity µmho/cm 1 SM Jan-09/O ph ph Units EPA Jan-09/O Colour TCU 1 SM Jan-09/O 4 3 Turbidity NTU 0.1 SM Jan-09/O Fluoride mg/l 0.1 EPA Jan-09/O Chloride mg/l 0.5 EPA Jan-09/O Nitrite (N) mg/l 0.1 EPA Jan-09/O < 0.1 < 0.1 Nitrate (N) mg/l 0.1 EPA Jan-09/O < 0.1 < 0.1 Sulphate mg/l 1 EPA Jan-09/O Calcium mg/l 0.02 SM Jan-09/O Magnesium mg/l 0.01 SM Jan-09/O Sodium mg/l 0.2 SM Jan-09/O Potassium mg/l 0.1 SM Jan-09/O Iron mg/l SM Jan-09/O Manganese mg/l SM Jan-09/O Silica mg/l 0.02 SM Jan-09/O Ammonia (N)-Total mg/l 0.01 EPA Jan-09/O Total Kjeldahl Nitrogen mg/l 0.05 EPA Jan-09/O Organic Nitrogen mg/l 0.05 EPA Jan-09/O Dissolved Organic Carbon mg/l 0.2 EPA Jan-09/O Hydrogen Sulphide mg/l 0.01 SM4500-S2 27-Jan-09/O 0.04 < 0.01 Phenolics mg/l EPA Jan-09/O < < Tannins and Lignins mg/l 0.1 SM5500B 28-Jan-09/O Total Coliform cts/100ml 1 MOE E Jan-09/O < 1 -- E coli cts/100ml 1 MOE E Jan-09/O < 1 -- Background cts/100ml 1 MOE E Jan-09/O 2 -- M.D.L. = Method Detection Limit Site Analyzed=K-Kingston,W-Windsor,O-Ottawa,P-Peterborough,M-Moncton Greg Clarkin, BSc., C. Chem Lab Manager - Ottawa District Page 1 of 2.
119 CERTIFICATE OF ANALYSIS Final Report C.O.C.: C04336 Report To: Trow Consulting Engineers Ltd. 154 Colonnade Rd South Ottawa, ON, K2E 7J5 Attention: Rob Renaud DATE RECEIVED: DATE REPORTED: SAMPLE MATRIX: 23-Jan Jan-09 Water Caduceon Environmental Laboratories 2378 Holly Lane Ottawa, Ontario, K1V 7P1 Tel: Fax: JOB/PROJECT NO.: P.O. NUMBER: WATERWORKS NO. REPORT No. B OTEN A Client I.D.: Sample I.D.: Date Collected: Well 400 Well 420 B B Jan Jan-09 Parameter Units M.D.L. Reference Method Date/Site Analyzed Anion Sum meq/l Calc. 27-Jan-09/O Cation Sum meq/l Calc. 27-Jan-09/O % Difference % Calc. 27-Jan-09/O Ion Ratio AS/CS Calc. 27-Jan-09/O Sodium Adsorption Ratio - Calc. 27-Jan-09/O TDS(ion sum calc.) mg/l Calc. 27-Jan-09/O Conductivity (calc.) µmho/cm Calc. 27-Jan-09/O TDS(calc.)/EC(actual) - Calc. 27-Jan-09/O EC(calc.)/EC(actual) - Calc. 27-Jan-09/O Langelier Index(25 C) S.I. Calc. 27-Jan-09/O M.D.L. = Method Detection Limit Site Analyzed=K-Kingston,W-Windsor,O-Ottawa,P-Peterborough,M-Moncton Greg Clarkin, BSc., C. Chem Lab Manager - Ottawa District Page 2 of 2.
120

121 Appendix E: Test Pit Logs, Grain Size Analyses and Water Surplus Data Mr. Fred Logan Hydrogeology, Terrain Analysis and Impact Assessment Report Jock River Estates Phase II, Formerly Village of Richmond City of Ottawa, Ontario OTEN B September 28, 2011
Hydrogeology,Terrain Analysis and Impact Assessment Report 3400 Old Montreal Road, Ottawa, Ontario
 Hydrogeology,Terrain Analysis and Impact Assessment Report 3400 Old Montreal Road, Ottawa, Ontario Client: Humanics Universal Inc. 601 Brookridge Crescent Ottawa, Ontario K4A1Z6 Type of Document: Final
patersongroup Potable Water Supply Assessment Commercial Site Development 4139 Moodie Drive Ottawa, Ontario Prepared For
 Geotechnical Engineering patersongroup Environmental Engineering Hydrogeology Geological Engineering Materials Testing Building Science Potable Water Supply Assessment Commercial Site Development 4139
Reference Guideline #1. Hydrogeological Impact Assessment
 Reference Guideline #1 Hydrogeological Impact Assessment Reference Guideline #1 Hydrogeological Impact Assessment Hydrogeological assessments are required for some subdivision applications when triggered
(this cover page left intentionally blank)
") 4. Siting the Well (this cover page left intentionally blank) 4. Siting the Well Chapter Table of Contents Chapter Table of Contents Chapter Description... 4 Regulatory Requirements Well Siting... 4 Relevant
4. Siting the Well (this cover page left intentionally blank) 4. Siting the Well Chapter Table of Contents Chapter Table of Contents Chapter Description... 4 Regulatory Requirements Well Siting... 4 Relevant
NEW BRUNSWICK DEPARTMENT OF ENVIRONMENT AND LOCAL GOVERNMENT. Environmental Impact Assessment WATER SUPPLY SOURCE ASSESSMENT GUIDELINES
 NEW BRUNSWICK DEPARTMENT OF ENVIRONMENT AND LOCAL GOVERNMENT Environmental Impact Assessment WATER SUPPLY SOURCE ASSESSMENT GUIDELINES Department of Environment and Local Government January 2012 Table
Strength. Performance. Passion. Paris Pit CAP. April 30, Permit To Take Water Application Holcim (Canada) Inc.
 Inc.") Strength. Performance. Passion. Paris Pit CAP April 30, 2013 Permit To Take Water Application 2012 Holcim (Canada) Inc. Agenda Welcome Minutes from Last Meeting Dufferin Paris Pit - General Update Review
Strength. Performance. Passion. Paris Pit CAP April 30, 2013 Permit To Take Water Application 2012 Holcim (Canada) Inc. Agenda Welcome Minutes from Last Meeting Dufferin Paris Pit - General Update Review
TERRAIN ANALYSIS AND HYDROGEOLOGICAL INVESTIGATION PROPOSED RIVERBEND MIXED USE SUBDIVISION
 TERRAIN ANALYSIS AND HYDROGEOLOGICAL INVESTIGATION PROPOSED RIVERBEND MIXED USE SUBDIVISION PART OF LOTS 7&8, CONCESSION 4 FORMER TOWNSHIP OF GOULBOURN NOW THE CITY OF OTTAWA Submitted to: Westboro Mortgage
Hydrogeological Studies & Best Management Practices for Groundwater Protection Guidelines. Regional Official Plan Guidelines
 Hydrogeological Studies & Best Management Practices for Groundwater Protection Guidelines Regional Official Plan Guidelines Halton Region Official Plan Guidelines The Regional Official Plan (ROP) is Halton
June i TABLE OF CONTENTS
 June 2005 - i - 05-526 TABLE OF CONTENTS SECTION PAGE 1.0 INTRODUCTION... 1 1.1 Purpose of the Investigation... 1 1.2 Description of the Project and Scope of Work... 1 1.3 Site Geology... 1 1.4 Site Description
Potential effects evaluation of dewatering an underground mine on surface water and groundwater located in a rural area
 Potential effects evaluation of dewatering an underground mine on surface water and groundwater located in a rural area ITRODUCTIO Michel Mailloux* Eng. M.Sc, Vincent Boisvert, M.Sc, Denis Millette, Eng.,
Hydrogeological Assessment for Subdivision Development, Village of Ida
 Hydrogeological Assessment for Subdivision Development, Village of Ida Cambium Reference No.: 3751-001 January 7, 2015 Prepared for: Mr. Ian Cameron Cambium Inc. P.O. Box 325 52 Hunter Street East, Peterborough
Submitted to: Kerry Currie, Property Manager Karson Aggregates P.O. Box Carp Road Carp, Ontario K0A 1L0
 June 214 REPORT ON Level 1 Hydrogeological and Hydrological Assessment in Support of a Category 1 Class 'A' Pit Below Water Proposed Kennedy Pit Lot 7, Concession Geographic Township of Torbolton City
patersongroup Phase I - Environmental Site Assessment Vacant Land, Strandherd Drive at Kennevale Drive Ottawa, Ontario Prepared For Regional Group
 Geotechnical Engineering patersongroup Environmental Engineering Hydrogeology Geological Engineering Materials Testing Building Science Vacant Land, Strandherd Drive at Kennevale Drive Ottawa, Ontario
WELLHEAD PROTECTION DELINEATION REPORT FOR THE VILLAGE OF BEAR LAKE DECEMBER 2002
 WELLHEAD PROTECTION DELINEATION REPORT FOR THE VILLAGE OF BEAR LAKE DECEMBER 2002 Prepared by: Gosling Czubak Engineering Sciences, Inc. 1280 Business Park Drive Traverse City, Michigan 48686 Telephone:
MR. & MRS. HERBERT DAY 5595 Hartnell Road Site 7A - 5, R.R. 8 VERNON, B.C. V1T 8L6
 EVALUATION OF WATER SUPPLY FOR A PkOPOSED SUBDIVISION LOCATED NORTHWEST OF THE INTERSECTION OF HARTNELL ROAD AND DAY ROAD, AT VERNON, B.C. Prepared for MR. & MRS. HERBERT DAY 5595 Hartnell Road Site 7A
GUIDELINES FOR HYDROGEOLOGICAL STUDIES AND STANDARDS FOR PRIVATE SERVICES
 GUIDELINES FOR HYDROGEOLOGICAL STUDIES AND STANDARDS FOR PRIVATE SERVICES June 2000 Page 12 PART 1 TABLE OF CONTENTS INTRODUCTION...1 PART 2 PRIVATE SERVICING GUIDELINES...3 2.1 PRIVATE SEWAGE DISPOSAL
NEW BRUNSWICK DEPARTMENT OF ENVIRONMENT AND LOCAL GOVERNMENT. Environmental Impact Assessment WATER SUPPLY SOURCE ASSESSMENT GUIDELINES
 NEW BRUNSWICK DEPARTMENT OF ENVIRONMENT AND LOCAL GOVERNMENT Environmental Impact Assessment WATER SUPPLY SOURCE ASSESSMENT GUIDELINES Department of Environment and Local Government April 2017 Table of
Background. AEM Tier 2 Worksheet Farmstead Water Supply Evaluation. AEM Principle: Glossary
 AEM Tier 2 Worksheet Glossary Casing: Steel or plastic pipe installed while drilling a well, to prevent collapse of the well bore hole and the entrance of contaminants, and to allow placement of a pump
August 1, 2013 Reference No S048 Page 1 of 5
 August 1, 2013 Reference No. 1201-S048 Page 1 of 5 Caledon Villas Corp. 55 Blue Willow Drive Woodbridge, Ontario L4L 9E8 Attention: Mr. John Spina Re: Addendum to Soil Investigation for Proposed Residential
Debrob Investments Limited FUNCTIONAL SERVICING REPORT DRAFT PLAN OF SUBDIVISION, CITYVIEW DRIVE CITY OF GUELPH
 JULY 2013 DOCUMENT CONTROL Client: Project Name: Report Title: IBI Reference: 25528 Cityview Drive Version: JULY 2013 Digital Master: Originator: Reviewer: Authorization: [File Location] Scott MacDonald,
REGION OF PEEL PUBLIC WORKS DESIGN, SPECIFICATIONS & PROCEDURES MANUAL LINEAR INFRASTRUCTURE
 REGION OF PEEL PUBLIC WORKS DESIGN, SPECIFICATIONS & PROCEDURES MANUAL LINEAR INFRASTRUCTURE GUIDELINES FOR HYDROGEOLOGIC ASSESSMENT AND REPORTING REQUIREMENTS NEW DEVELOPMENTS ON MUNICIPAL SERVICES REVISED
Protecting, maintaining and improving the health of all Minnesotans MEMORANDUM
 Protecting, maintaining and improving the health of all Minnesotans DATE: MEMORANDUM TO: Licensed and Registered Well Contractors City of Minneapolis FROM: Patricia A. Bloomgren, Director Division of Environmental
Livingston County Department of Public Health Environmental Health Division. Hydrogeologic Investigation Requirements for Land Division Developments
 Livingston County Department of Public Health Environmental Health Division Hydrogeologic Investigation Requirements for Land Division Developments Reviewed March 1, 2013 Table of Contents Scope/Authority..1
Numerical Groundwater Flow Model Report. Caloosa Materials, LLC 3323 Gulf City Road Ruskin, Florida 33570
 Numerical Groundwater Flow Model Report Caloosa Materials, LLC 3323 Gulf City Road Ruskin, Florida 33570 GHD 2675 Winkler Ave Suite 180 Fort Myers, FL 33901 11138224 Report July 27, 2017 Table of Contents
GROUND WATER. Practice Note # water. sensitive. urban. design \ \ \ \ \ \ \ \ \ \ \ \ \ \ \ \ \ \ \ \ \ \ \ \ \ \ \ \
 2013 water. sensitive. urban. design \ \ \ \ \ \ \ \ \ \ \ \ \ \ \ \ \ \ \ \ \ \ \ \ \ \ \ \ Practice Note #8 GROUND Water Smart design is the effective planning, design and building of homes, subdivisions,
Irrigation. Branch. Groundwater Quality in the Battersea Drainage Basin
 AGRICULTURE, FOOD AND RURAL DEVELOPMENT Irrigation Branch Groundwater Quality in the Battersea Drainage Basin Groundwater quality in the Battersea drainage basin was monitored between 1995 and 21 to characterize
210 Prescott Street, Unit 1 (613) P.O. Box 189 Kemptville, Ontario K0G 1J0 FAX: (613) May 5,
 P.O. Box 189 Kemptville, Ontario K0G 1J0 FAX: (613) May 5,") Civil Geotechnical Structural Environmental Hydrogeology 210 Prescott Street, Unit 1 (613) 860-0923 P.O. Box 189 Kemptville, Ontario K0G 1J0 FAX: (613) 258-0475 May 5, 2014 140208 Alium Investments Ltd.
Civil Geotechnical Structural Environmental Hydrogeology 210 Prescott Street, Unit 1 (613) 860-0923 P.O. Box 189 Kemptville, Ontario K0G 1J0 FAX: (613) 258-0475 May 5, 2014 140208 Alium Investments Ltd.
Design Checklist for EWB-USA Chapters Working on Drilled Well
 Design Checklist for EWB-USA Chapters Working on Drilled Well TAC Review for Phase 2 Borehole development and aquifer evaluation The following checklist provides a list of specific information that must
Hydrogeological Assessment and Water Balance th Avenue, Markham. Sixteenth Land Holdings Inc.
 Hydrogeological Assessment and Water Balance 4134 16 th Avenue, Markham Sixteenth Land Holdings Inc. R.J. Burnside & Associates Limited 6990 Creditview Road, Unit 2 Mississauga ON L5N 8R9 CANADA September
August 28, 2018 File: PE2122-LET.01
 patersongroup August 28, 2018 File: PE2122-LET.01 Minto Communities 200-180 Kent Street Ottawa, Ontario K1P 0B6 Attention: Mr. Kevin Harper Consulting Engineers 154 Colonnade Road South Ottawa, Ontario
11 HYDROLOGY, HYDROGEOLOGY AND DRAINAGE
 11 HYDROLOGY, HYDROGEOLOGY AND DRAINAGE 11.1 introduction 11.1.1 The objective of this section and the statements presented is to assess the existing hydrological and hydrogeological conditions to understand
Lowen Hydrogeology Consulting Ltd.
 Consulting Ltd. September 23, 2012 LHC Project File: 1218 Shawnigan Residents Association PO Box 443 Shawnigan Lake, BC V0R 2W0 Attention : Gary Horwood, President Dear Sir: Re: Proposed SIA Contaminated
Supplemental Guide II-Delineations
 Supplemental Guide II-Delineations Contents Source Water Protection Area Delineation... 1 Delineation Criteria for Systems Using Groundwater Sources... 2 Time of Travel... 4 Flow Boundaries... 4 Delineation
patersongroup Prepared For Ontario Inc. October 17, 2013 Report: PH2095-REP.01
 Geotechnical Engineering patersongroup Environmental Engineering Hydrogeology Geological Engineering Archaeology Materials Testing Building Science Hydrogeological Assessment and Terrain Analysis Proposed
GEOTECHNICAL INVESTIGATION PROPOSED OUTFALL LOCATION CITY OF MORGAN S POINT DRAINAGE HARRIS COUNTY, TEXAS REPORT NO
 GEOTECHNICAL INVESTIGATION PROPOSED OUTFALL LOCATION CITY OF MORGAN S POINT DRAINAGE HARRIS COUNTY, TEXAS REPORT NO. 1140198001 Reported to: SIRRUS ENGINEERS, INC. Houston, Texas Submitted by: GEOTEST
REGION OF DURHAM DRILLED WELLS AND LOT SIZING POLICIES AS APPLIED TO CONSENTS (SEVERANCES) AND DRAFT PLANS OF SUBDIVISION
 AND DRAFT PLANS OF SUBDIVISION") REGION OF DURHAM DRILLED WELLS AND LOT SIZING POLICIES AS APPLIED TO CONSENTS (SEVERANCES) AND DRAFT PLANS OF SUBDIVISION October 2010 DRILLED WATER WELL POLICY OBJECTIVE To ensure drilled wells are provided
REGION OF DURHAM DRILLED WELLS AND LOT SIZING POLICIES AS APPLIED TO CONSENTS (SEVERANCES) AND DRAFT PLANS OF SUBDIVISION October 2010 DRILLED WATER WELL POLICY OBJECTIVE To ensure drilled wells are provided
November 13, Mr. Alfred Artinger Reid s Heritage Homes 6783 Wellington Road 34, RR #22 Cambridge, Ontario N3C 2V4
 November 13, 2017 Mr. Alfred Artinger Reid s Heritage Homes 6783 Wellington Road 34, RR #22 Cambridge, Ontario N3C 2V4 Subject: 19-59 Lowes Road Guelph, Ontario Our Ref.: 160-P-0010233-0-08-305-HD-L-0001-02
Gravity driven dewatering systems for landfill expansion
 Waste Management and the Environment IV 183 Gravity driven dewatering systems for landfill expansion S. A. Smith. & J. A. Smyth Richardson Smith Gardner and Associates, Inc, USA Abstract A landfill site
Submitted to: Michael Walters Tomlinson Environmental Services Ltd Power Road Ottawa, Ontario K1G 3N4
 REPORT March 2012 REPORT ON Hydrogeological Investigation and Terrain Analysis Tomlinson Environmental Services Ltd. Resource Recovery Centre, Carp, Ontario Submitted to: Michael Walters Tomlinson Environmental
OUTLINE OF PRESENTATION
 GROUNDWATER?? OUTLINE OF PRESENTATION What is groundwater? Geologic investigation Definitions: aquifer and aquitard, unconfined and semi-confined Water level and interpretation of water level data Well
Design Guideline for Gravity Systems in Soil Type 1. January 2009
 Design Guideline for Gravity Systems in Soil Type 1 January 2009 This page is intentionally blank. Design Guideline for Gravity Systems in Soil Type 1 January 2009 For information or additional copies
For inspection purposes only.
 6 INDAVER IRELAND - Carranstown Duleek Statement of Evidence Eur.Geol Teri Hayes B.Sc M.Sc P.Geo, 1.O Experience 1.1 My name is Teri Hayes. I am a Senior Hydrogeologist and Director of White Young Green
Chapter DRINKING WATER
 Whatcom County Code Chapter 24.11 DRINKING WATER Page 1 of 30 Sections: 24.11.010 Authority. 24.11.020 Purpose. 24.11.030 Adoption by reference. 24.11.040 Definitions. 24.11.050 General requirements. 24.11.060
How & Where does infiltration work? Context: Summary of Geologic History Constraints/benefits for different geologic units
 Associated Earth Sciences, Inc. Associated Earth Sciences, Inc. Presented by: Matthew A. Miller, PE April 23, 2013 How & Where does infiltration work? Context: Summary of Geologic History Constraints/benefits
Municipal Groundwater Flow Modelling Study. Town of Torbay, NL
 Municipal Groundwater Flow Modelling Study Town of Torbay, NL October 19, 2015 Agenda 1 Purpose 2 What is a Groundwater Model 3 Approach 4 Conceptual Model & GW Flow Model Construction 5 Model Predictions
MEMORANDUM. Kathy Yager USEPA OSRTI Dick Goehlert USEPA Region 1 Darryl Luce USEPA Region 1 Mindy Vanderford, GSI Environmental, Inc.
 MEMORANDUM To: From: Kathy Yager USEPA OSRTI Dick Goehlert USEPA Region 1 Darryl Luce USEPA Region 1 Mindy Vanderford, GSI Environmental, Inc. (GSI) Doug Sutton, GeoTrans, Inc. Rob Greenwald, GeoTrans,
DYNFLOW accepts various types of boundary conditions on the groundwater flow system including:
 Section 6 Groundwater Flow Model A groundwater flow model was developed to evaluate groundwater flow patterns in the site area and to provide a basis for contaminant transport modeling. 6.1 Model Code
Lab 6 - Pumping Test. Pumping Test. Laboratory 6 HWR 431/
 Pumping Test Laboratory 6 HWR 431/531 7-1 Introduction: Aquifer tests are performed to evaluate the capacity of an aquifer to meet municipal or industrial water requirements. Hydraulic characteristics
(this page left intentionally blank)
") 10. Yield Test (this page left intentionally blank) 10. Yield Test Chapter Table of Contents Chapter Table of Contents Chapter Description... 4 Regulatory Requirements Yield Test... 4 Relevant Sections
10. Yield Test (this page left intentionally blank) 10. Yield Test Chapter Table of Contents Chapter Table of Contents Chapter Description... 4 Regulatory Requirements Yield Test... 4 Relevant Sections
Publication No. 26: Private Drinking Water Wells Types of Construction
 PRIVATE DRINKING WATER IN CONNECTICUT Publication No. 26: Private Drinking Water Wells Types of Construction Publication Date: May 2009 When you turn on the faucet to get a drink or to take a shower, do
DEVELOPMENT OF AQUIFER TESTING PLANS. Brent Bauman, P.G. / Erin Lynam, Aquatic Biologist
 DEVELOPMENT OF AQUIFER TESTING PLANS Brent Bauman, P.G. / Erin Lynam, Aquatic Biologist DEVELOPMENT OF AQUIFER TESTING PLANS Goals of Aquifer Testing What questions are we trying to answer Staff review
Groundwater Abstraction
 Groundwater Abstraction This module is designed for users proposing to drill a water borehole for the abstraction of groundwater supplies and/or to inject water into an aquifer. It contains an evaluation
General Groundwater Concepts
 General Groundwater Concepts Hydrologic Cycle All water on the surface of the earth and underground are part of the hydrologic cycle (Figure 1), driven by natural processes that constantly transform water
Groundwater. Importance of Groundwater. The Water Table. Geol 104: Groundwater
 Groundwater Subsurface water contained in soil and bedrock. There is ~ 60 times as much water underground than in freshwater streams and lakes. Source of groundwater is rain and snow. Represents the infiltration
East Maui Watershed Partnership Adapted from Utah State University and University of Wisconsin Ground Water Project Ages 7 th -Adult
 INTRODUCTION What is groundwater? Water contained in saturated soil and rock materials below the surface of the earth. It is not NEW water, but is recycled water through the hydraulic cycle. The source
PROPOSED ONE-STOREY WAREHOUSE BUILDING SITE FOR SLAVKO INC. PART OF BLOCK 6 REGISTERED PLAN 4M-351 GREELY INDUSTRIAL PARK McKEOWN DRIVE
 PROPOSED ONE-STOREY WAREHOUSE BUILDING SITE FOR SLAVKO INC. PART OF BLOCK 6 REGISTERED PLAN 4M-351 GREELY INDUSTRIAL PARK 6828 McKEOWN DRIVE CITY OF OTTAWA SERVICEABILITY REPORT REPORT No. R-812-77A T.
WEEK 9 ACTIVITY. Lecture (3 hours) Self Assessment. 34 slides
 Self Assessment. 34 slides") WEEK 9 ACTIVITY Lecture (3 hours) 34 slides Self Assessment Site Investigation (ECG513) ARM - 2009 LEARNING OUTCOMES Week 9 : (3H) Coverage : Geophysical Methods, Permeability and Ground Stress measurement.
WEEK 9 ACTIVITY Lecture (3 hours) 34 slides Self Assessment Site Investigation (ECG513) ARM - 2009 LEARNING OUTCOMES Week 9 : (3H) Coverage : Geophysical Methods, Permeability and Ground Stress measurement.
PETO MACCALLUM LTD. 16 FRANKLIN STREET SOUTH KITCHENER, ONTARIO N2C 1R4 PHONE: (519) FAX: (519)
 FAX: (519)") HYDROGEOLOGICAL SITE AEMENT FOR SOUTHWOOD 3 AND SOUTHWOOD 4 RESIDENTIAL SUBDIVISION 1143 LISTOWEL ROAD, ELMIRA, ONTARIO for BIRDLAND DEVELOPMENTS LIMITED c/o WALTERFEDY PETO MACCALLUM LTD. 16 FRANKLIN
HYDROGEOLOGICAL SITE AEMENT FOR SOUTHWOOD 3 AND SOUTHWOOD 4 RESIDENTIAL SUBDIVISION 1143 LISTOWEL ROAD, ELMIRA, ONTARIO for BIRDLAND DEVELOPMENTS LIMITED c/o WALTERFEDY PETO MACCALLUM LTD. 16 FRANKLIN
DESIGN PARAMETERS FOR MULTI-PHASE EXTRACTION SYSTEMS USING UNSATURATED AND SATURATED SOIL PROPERTIES
 DESIGN PARAMETERS FOR MULTI-PHASE EXTRACTION SYSTEMS USING UNSATURATED AND SATURATED SOIL PROPERTIES Todd White, M.Sc., P.Geol. and Douglas A. Sweeney, M.Sc., P.Eng. SEACOR Environmental Inc. INTRODUCTION
4. Groundwater Resources
 4. Groundwater Resources 4-1 Majority (97 %) of unfrozen fresh water on earth exists as groundwater. In comparison to surface water, - groundwater is available all year around - groundwater is mostly invisible
TOWNSHIP OF NORTH GLENGARRY MAXVILLE COMMUNAL SEWAGE LAGOONS 2011 GROUNDWATER AND SURFACE WATER MONITORING PROGRAM REF.: FINAL REPORT
 2011 Groundwater and Surface Water Monitoring Program FINAL REPORT TOWNSHIP OF NORTH GLENGARRY MAXVILLE COMMUNAL SEWAGE LAGOONS 2011 GROUNDWATER AND SURFACE WATER MONITORING PROGRAM REF.: 09-511 Submitted:
Groundwater Flow Evaluation and Spatial Geochemical Analysis of the Queen City Aquifer, Texas
 Groundwater Flow Evaluation and Spatial Geochemical Analysis of the Queen City Aquifer, Texas Abstract The Queen City Aquifer is a saturated sandstone unit in the coastal plain of East Texas. The goals
Determining Infiltration Rates: Approaches, Challenges & Lessons Learned
 Determining Infiltration Rates: Approaches, Challenges & Lessons Learned May 16, 2017 Presented by Andrew Austreng, LHG Presentation Outline Overview of Site Characterization & Testing Pilot Infiltration
On-site Systems and Groundwater Washington State Department of Health February 6, 2014
 On-site Systems and Groundwater Washington State Department of Health February 6, 2014 1 Nancy Darling, LHG, CPSS Office of Shellfish and Water Protection Key Groundwater Considerations Type and strength
April 7, Webster Street Sub-Surface Stormwater Storage System Bid No Bid Date: 4/13/17 ADDENDUM NO 1
 PUBLIC WORKS DEPARTMENT David A. Jones, P.E., Director April 7, 2017 Webster Street Sub-Surface Stormwater Storage System Bid No. 2017-022 Bid Date: 4/13/17 ADDENDUM NO 1 Please make the following changes
STORMWATER MANAGEMENT REPORT DRAFT PLAN OF CITY OF GUELPH
 Debrob Investments Limited STORMWATER MANAGEMENT REPORT DRAFT PLAN OF SUBDIVISION, CITYVIEW DRIVE CITY OF GUELPH PRELIMINARY NOVEMBER 2, 2011 I B I G R O U P P R E L I M I N A R Y Debrob Investments Limited
Wastewater Collection System
 WASTEWATER COLLECTION SYSTEM CE 370 1 Wastewater Collection System The function of the collection system is to collect the wastewater from residential, commercial, and industrial areas within the service
November 11, St. Marys Cement Inc. (Canada) 55 Industrial Avenue, Toronto, ON. Attn: Melanie Horton, Lands Manager. Re: Dear Ms.
 55 Industrial Avenue, Toronto, ON. Attn: Melanie Horton, Lands Manager. Re: Dear Ms.") 55 Industrial Avenue, Toronto, ON Attn: Melanie Horton, Lands Manager Address: P.O. Box 325 52 Hunter Street East Peterborough, Ontario Re: Hydrogeological Assessment, for Above and Below-Water Extraction,
55 Industrial Avenue, Toronto, ON Attn: Melanie Horton, Lands Manager Address: P.O. Box 325 52 Hunter Street East Peterborough, Ontario Re: Hydrogeological Assessment, for Above and Below-Water Extraction,
Assessment of the Groundwater Quantity Resulting from Artificial Recharge by Ponds at Ban Nong Na, Phitsanulok Province, Thailand
 Research article erd Assessment of the Groundwater Quantity Resulting from Artificial Recharge by Ponds at Ban Nong Na, Phitsanulok Province, Thailand SIRIRAT UPPASIT* Faculty of Technology, Khon Kaen
Groundwater Protection Plan in Response to Release of Fracking Fluids in Shallow Sandstone
 Groundwater Protection Plan in Response to Release of Fracking Fluids in Shallow Sandstone Presented by: Aziz Shaikh tetratech.com Presentation Outline Fracking Incident Groundwater Protection Plan: Objectives
STANLEY FARM SUBDIVISION
 STANLEY FARM SUBDIVISION SERVICING OPTIONS AND STORMWATER MANAGEMENT REPORT BRIEF CITY OF OTTAWA PREPARED FOR: STANLEY FARM DEVELOPMENTS PREPARED BY: (November 2014 - Revision 0) LOT 9, CONCESSION 5 WATER
SOURCES OF WATER SUPPLY GROUND WATER HYDRAULICS
 SOURCES OF WATER SUPPLY GROUND WATER HYDRAULICS, Zerihun Alemayehu GROUNDWATER Groundwater takes 0.6% of the total water in the hydrosphere 0.31% of the total water in the hydrosphere has depth less than
Source Water Assessment Program (SWAP) Report for Heath Elementary School
 Report for Heath Elementary School") Source Water Assessment Program (SWAP) Report for Heath Elementary School What is SWAP? The Source Water Assessment Program (SWAP), established under the federal Safe Drinking Water Act, requires every
Source Water Assessment Program (SWAP) Report for Heath Elementary School What is SWAP? The Source Water Assessment Program (SWAP), established under the federal Safe Drinking Water Act, requires every
CATEGORY 3 PTTW HYDROGEOLOGIC ASSESSMENT REPORT, HYDRO ONE NETWORKS INC., CLARINGTON TRANSFORMER STATION, CLARINGTON, ONTARIO
 CATEGORY 3 PTTW HYDROGEOLOGIC ASSESSMENT REPORT, CLARINGTON TRANSFORMER STATION, FINAL REPORT Prepared for: Hydro One Networks Inc. 483 Bay Street South Tower, 4th Floor Toronto, ON M5G 2P5 Prepared by:
Our Eastern Shore Groundwater Part IV Groundwater Quality on the Eastern Shore: How safe is our groundwater and are there ways we can protect it?
 Our Eastern Shore Groundwater Part IV Groundwater Quality on the Eastern Shore: How safe is our groundwater and are there ways we can protect it? Britt McMillan, Malcolm Pirnie, Inc. Mercury Venus Mars
Appendix I-2.4 Sub-cell 3 Monitoring Well Details
 Appendix I-2.4 Sub-cell 3 Monitoring Well Details Appendix I-2 Groundwater Monitoring Network 2008/2009 Annual Groundwater Report, Clean Harbors Lambton Facility Landfill Appendix I-2.4 Sub-Cell 3 Monitoring
1. Introduction Site Information Site Characteristics Hydrogeologic Setting... 2
 Table of Contents 1. Introduction... 1 1.1 Site Information... 1 1.2 Site Characteristics... 1 1.3 Hydrogeologic Setting... 2 2. Closure Plan... 5 2.1 Closure Description... 5 2.2 Closure Timeframe...
TROW ASSOCIATES INC.
 WESTERN CATARAQUI REGION GROUNDWATER STUDY Volume I Groundwater Inventory and Findings Prepared for: Cataraqui Region Conservation Authority 1641 Perth Road Kingston, Ontario KOH 1SO TROW ASSOCIATES INC.,rr
GROUNDWATER SUPPLY FEASIBILITY ASSESSMENT Sarah Properties Ltd. Waldemar Residential Development Township of Amaranth, Ontario
 GROUNDWATER SUPPLY FEASIBILITY ASSESSMENT Sarah Properties Ltd. Waldemar Residential Development Township of Amaranth, Ontario SUBMITTED TO: Sarah Properties Ltd. 2 Prince Edward Road Woodstock, ON N4V
HYDROGEOLOGICAL STUDY for CONSTRUCTION DEWATERING Proposed 12-Storey Apartment Building 115 & 117 Erb St. East, Waterloo, Ontario
 HYDROGEOLOGICAL STUDY for CONSTRUCTION DEWATERING Proposed 12-Storey Apartment Building 115 & 117 Erb St. East, Waterloo, Ontario SUBMITTED TO: Mr. Lee Kieswetter 3150 Boomer Line Heidleberg, ON N0B 1YO
Numerical Modeling of Groundwater Flow in the Navajo Sandstone Aquifer at the Tuba City, Arizona, Disposal Site 15167
 Numerical Modeling of Groundwater Flow in the Navajo Sandstone Aquifer at the Tuba City, Arizona, Disposal Site 15167 ABSTRACT Richard Bush*, Timothy Bartlett** *US DOE, Office of Legacy Management **Stoller
CHAPTER 39 REQUIREMENTS FOR PROPERLY PLUGGING ABANDONED WELLS
 IAC 5/12/93, 4/8/98 Environmental Protection[567] Ch 39, p.1 IAC 5/12/93, 4/8/98 CHAPTER 39 REQUIREMENTS FOR PROPERLY PLUGGING ABANDONED WELLS 567 39.1(455B) Purpose. The purpose of this chapter is to
Geotechnical Investigation Long Timber Brewing Building Highway 99 and Kelly Street Monroe, Oregon TABLE OF CONTENTS
 Highway 99 and Kelly Street TABLE OF CONTENTS PROJECT INFORMATION... 1 FIELD EXPLORATION... 1 SITE CONDITIONS... 2 Surface Conditions:... 2 Subsurface Conditions:... 2 FILL.... 2 Topsoil.... 2 Clay Alluvium....
Level II Groundwater Assessment Eastern Portion of PID Old Post Road, Enfield HRM, NS
 Report Level II Groundwater Assessment Eastern Portion of PID 00513788 Old Post Road, Enfield HRM, NS Prepared by: Fracflow Consultants Inc. 2 Fielding Avenue, Suite D Dartmouth, NS B3B 1E1 Submitted to:
Identification. Module 4 Water Well Drilling Agreements
 For more information refer to the Water Wells That Last video series Part I Planning and Construction. + Water Well Drilling Agreements This module outlines a checklist of items that you and your drilling
Chapter 7 Shallow Ground Water Study Team
 Chapter 7 Shallow Ground Water Study Team Objective What are the shallow ground water issues of concern and what needs to be done? Introduction The Shallow Ground Water Study Team (Team) was formed to
MOE 2001 Terms of Reference
 February 17, 2015 Project No. 1405934-201 Mary McCuaig, CAO/Clerk Corporation of the Nation Municipality 958 Road 500 West, R.R. 3 Casselman, Ontario K0A 1M0 GUDI ASSESSMENT OF LIMOGES WELLS #3 AND #4,
CHAPTER 32 - WELL ABANDONMENT ORDINANCE OF DUBUQUE COUNTY, IOWA. Adopted September 5, Part 1 Introduction...2
 CHAPTER 32 - WELL ABANDONMENT ORDINANCE OF DUBUQUE COUNTY, IOWA Adopted September 5, 1989 Table of Contents Page Part 1 Introduction...2 32-1 Purpose...2 32-2 Applicability...2 32-3 Definitions...2 32-4
Groundwater. Groundwater Movement. Groundwater Movement Recharge: the infiltration of water into any subsurface formation.
 On March 22, 2014, a major landslide occurred near Oso, Washington. Death toll currently at 30, with 15 still missing. Groundwater Before and After Swipe http://bit.ly/pen1jt N. Fork Stillaguamish River
T E C H N I C A L M E M O R A N D U M
 INTERA Incorporated 9600 Great Hills Trail, Suite 300W Austin, Texas, USA 78759 512.425.2000 T E C H N I C A L M E M O R A N D U M To: From: Barton Springs/Edwards Aquifer Conservation District Wade Oliver,
Reference: OTCD B 17 September Soil Sampling Program th Line Road, Metcalfe, ON
 Trow Associates Inc. 154 Colonnade Road South Ottawa, Ontario K2E 7J5 Telephone: (613) 225-9940 Facsimile: (613) 225-7337 E-mail: ottawa@trow.com Web Site: www.trow.com Reference: OTCD00019239B 17 September
15A NCAC 02C.0225 GROUNDWATER REMEDIATION WELLS (a) Groundwater Remediation Wells are used to inject additives, treated groundwater, or ambient air
 Groundwater Remediation Wells are used to inject additives, treated groundwater, or ambient air") 15A NCAC 02C.0225 GROUNDWATER REMEDIATION WELLS (a) Groundwater Remediation Wells are used to inject additives, treated groundwater, or ambient air for the treatment of contaminated soil or groundwater.
15A NCAC 02C.0225 GROUNDWATER REMEDIATION WELLS (a) Groundwater Remediation Wells are used to inject additives, treated groundwater, or ambient air for the treatment of contaminated soil or groundwater.
atertech Banff, AB. April 29-May 1, 2009
 DILUTION IS NOT A SALT SOLUTION Case Studies: Assessment, Containment and Recovery of Two Produced Water Spills into Domestic Use Aquifers in Central Alberta 2 AUTHORS Randy Brunatti and Reed Jackson AMEC
Albemarle County Hydrogeologic Assessment Summary Report
 Albemarle County Hydrogeologic Assessment Summary Report Phase II Groundwater Availability and Sensitivity Assessment with Proposed Groundwater Assessment Standards Presented To: County of Albemarle Department
Introduction. Geology and Hydrogeology of the Lynden Area TECHNICAL MEMORANDUM
 TECHNICAL MEMORANDUM Date: June 18, 2008 To: Chris Shrive, City of Hamilton Copies: Gary Scott, GENIVAR From: Alicia Fraser, GENIVAR Project No.: 6333 Subject: Introduction A detailed review of available
To The Applicant For A Small Wastewater System Permit Sheridan County, Wyoming
 To The Applicant For A Small Wastewater System Permit Sheridan County, Wyoming PRIOR TO SUBMITTING APPLICATION 1) Ground water test pit This pit is required to be inspected by a representative of Sheridan
SepticDesign.ca Gunnell Engineering Ltd.
 SepticDesign.ca Gunnell Engineering Ltd. Presentation Summary Best Practices Code Context Prior to Attending the Site When on Site Site Assessment Assessing Existing Sewage Systems The Septic Test Pit
10 LOUISA STREET - THORNBURY
 10 LOUISA STREET - THORNBURY Town of The Blue Mountains Functional Servicing Report prepared by: C.C. Tatham & Associates Ltd. 115 Sandford Fleming Drive, Suite 200 Collingwood, ON L9Y 5A6 Tel: (705) 444-2565
Conceptual Site Models for Environmental Investigations and Remediation
 Remediation Technology Symposium (RemTech) 2012 Conceptual Site Models for Environmental Investigations and Remediation October 18, 2012 Tai T. Wong, P.Eng. Authors and Presenter Authors: James Carss,
Re: OTT D0 Buffer Zone Study Update Ashcroft s Eastboro Phase 2A and 2B Lands Navan Road and Renaud Road Area, Ottawa, Ontario
 November 5, 2013 Ms. May Pham, M.U.P. 18 Antares Drive Ottawa, Ontario K2E 1A9 Email: mpham@ashcroft-homes.com Dear Ms. Pham: Re: Buffer Zone Study Update Ashcroft s Eastboro Phase 2A and 2B Lands Navan