SEMAP 2018 Ozone Projections and Sensitivity to NO x & VOC Emissions
|
|
|
- Prosper Pierce
- 6 years ago
- Views:
Transcription
1 SEMAP 2018 Ozone Projections and Sensitivity to NO x & VOC Emissions Presented by: Jim Boylan - Chair, SEMAP TAWG Prepared by: Jim Boylan (GA EPD), Talat Odman (GT), Yongtao Hu (GT), Zac Adelman (UNC), Uma Shankar (UNC) Presented at: 2014 Midwest and Central States Air Quality Workshop St. Louis, MO - April 23, 2014
2 Project Overview Outline 2007 and 2018 Emission Inventories 2018 Ozone Projections NOx and VOC Sensitivities Absolute Relative Normalized Interstate Contributions Next Steps 2
3 SEMAP Project SouthEastern Modeling, Analysis, and Planning (SEMAP) Project Managed through SESARM Technical Analysis Workgroup, Meteorological Workgroup, Emission Inventory Workgroup, Emissions and Air Quality Modeling Workgroup Special Sub-Groups: Fires, EGUs, MOVES Same group of states that were involved with SAMI, VISTAS, and ASIP AL, FL, GA, KY, MS, NC, SC, TN, VA, WV 3

 Emissions")
")
4 Air Quality Modeling System Meteorology (WRF) Air Quality (CMAQ) Emissions Inventory (NIF) Emissions (SMOKE) MOVES Rates 4
5 Modeling Overview 2007 and 2018 annual modeling with CMAQv km (CONUS) and 12 km grids Updated mixing coefficients Updated land-water interface Acceptable model performance 2018 future year projections with MATS software (RRFs and DVFs) Ozone - presented here PM will be available soon Regional Haze - will be available soon 5

6 SEMAP 12-km Modeling Domain 6
7 2007 Emission Inventory SEMAP Emissions Inventory AMEC/Alpine Point source (EGU and non- EGU), fire, and on-road mobile (MOVES2010a) SC&A, Inc. Area and non-road/mar Actual Emission Inventory (2007) Used for model performance evaluations Typical Emission Inventory ( ) Fires only (not EGUs) Used for RRF calculations Non-SEMAP Emissions Inventory 2007 MARAMA, 2007 LADCO, 2008v2 NEI 7
8 2018 Emission Inventory SEMAP Point, Area, and MAR Applied growth & control factors ( ) SEMAP Non-road Mobile Reran NONROAD model for 2018 SEMAP On-road Mobile Scaled hourly SMOKE-MOVES outputs with 2018/2007 ratios based on 2007 and 2018 inventory mode runs Vary by pollutant, state/county, annual/month, SCC Does not include Tier 3 controls SEMAP Fires Same as 2007 typical Non-SEMAP Emissions 2017 MARAMA (w/ existing controls) 2007 LADCO and 2008v2 NEI for area sources EPA 2017 Projections for point and mobile (on-road and non-road) 8

9 9

10 10
11 Calculation of DVF Ran MATS with 2007 typical as baseline and 2018 base-case as forecast to get RRFs RRF = (2018 base /2007 typ ) DVF = DVC RRF Calculated four different ways: Design Value Current (DVC) 2007 DV ( ) 5-year ( ) weighted average Relative Response Factor (RRF) Monitor (1 x 1) cell 3 x 3 cell maximum
12 DVF RRF Thresholds RRF thresholds based on modeled 2007 baseline daily 8-hour maximum ozone concentration Initial threshold value (ppb) = 75 Minimum number of days in baseline at or above threshold = 10 Minimum allowable threshold value (ppb) = 65 Min number of days at or above minimum allowable threshold = 5 12
13 5-Year Weighted DVC ( ) 13

14 2018 DVFs: 3 3 RRF & 2007 DVC 14
15 2018 DVFs: 1x1 RRF & 2007 DVC 15
16 2018 DVFs: 3 3 RRF & DVC 16
17 2018 DVFs: 1 1 RRF & DVC 17
18 2007 vs. 5-year weighted DVC 18
19 3 3 Max vs. 1 1 Cell RRFs 19
20 2018 Ozone Nonattainment DVF > 75 ppb based DVC 3x3 max and/or 1x1 cell STATE AIRS ID DVC 3x3 MAX 1x1 CELL CT CT GA GA GA GA LA LA LA LA LA LA MI MI MI MO MO MO MO NJ NJ STATE AIRS ID DVC 3x3 MAX 1x1 CELL NY NY NY NY TX TX TX TX TX TX TX TX TX TX TX TX TX TX TX TX TX WI
21 2018 Ozone Maintenance DVF < 75 ppb based DVC DVF > 75 ppb based 2007 DVC 3x3 max and/or 1x1 cell STATE AIRS ID DVC 3x3 MAX 1x1 CELL AL AL AL AR CT CT CT GA IL LA LA LA LA LA LA LA MD MI MI MI STATE AIRS ID DVC 3x3 MAX 1x1 CELL MO MO MO MO MO MO NY NY NY NY NY OH OH OH OH PA PA PA TX TX TX WI
22 Ozone Sensitivities Start with 2018 modeling results Perform emission sensitivity runs Ozone season (5 months) on 12-km grid Statewide 30% emission reductions NO x and VOCs individually Point, area, mobile, NONROAD, MAR 14 geographic regions Ten individual SEMAP states Maryland MANE-VU (minus MD), LADCO, CENRAP 2 precursors x 14 regions = 28 model runs 22
23 VOC/NO x Sensitivity Updates Previous Sensitivity Modeling CMAQv4.4 1-Month summer episode New Sensitivity Modeling CMAQv Month ozone season VISTAS 2009 OTW BaseD SEMAP 2018 SEMAP-wide VOC reductions County/state NO x reductions MOBILE6 Absolute difference >70 ppb cutoff (based on modeled base year values) State-wide VOC reductions State-wide NO x reductions MOVES Absolute difference and RRF approach (MATS) >70 ppb cutoff (based on modeled future year values) 23
24 Calculation of O 3 Absolute Sensitivity Difference of daily max. 8-hr O 3 between 2018 sensitivity case and 2018 base case O 3 = 2018 sens 2018 base Averaged over days with 2018 base daily max. 8-hr O 3 above 70 ppb 24
25 Site-by-Site Absolute Sensitivities For each of the 674 ozone monitoring sites in the domain NO x and VOC sensitivities All days Days above 75 ppb in 2007 Used for 2007 to 2018 projections Days above 70 ppb in 2018 Used for 2018 sensitivities Here: (Confederate Ave., Atlanta, GA) (Baltimore, MD) All other sites: 25
26 (All Days) 26
27 (All Days with 2007 model > 75 ppb) 27
28 (All Days with 2018 model > 70 ppb) 28
29 State Summaries State summaries were created for each of the 31 states in the domain Includes sites with 2018 model days above 70 ppb NO x and VOC sensitivities Absolute Sensitivity O 3 averaged over 2018 days above 70 ppb Relative Sensitivity DVF using MATS (see next slide) Normalized Relative Sensitivity DVF/Emissions (see next section) 29
30 Calculation of DVF Relative Sensitivity Ran MATS 2018 base case as baseline and 2018 sensitivity as forecast Starting DVF based on 5-year weighted average DVC and monitor (1 1) cell RRF Includes sites with at least one 2018 model day above 70 ppb RRF = (2018 sens /2018 base ) DVF = (DVF*RRF) DVF = DVF*(RRF 1) 30
31 DVF RRF Thresholds RRF thresholds based on modeled 2018 baseline daily 8-hour maximum ozone concentration Initial threshold value (ppb) = 75 Minimum number of days in baseline at or above threshold = 10 Minimum allowable threshold value (ppb) = 70 Min number of days at or above minimum allowable threshold = 1 31
")
32 (Absolute Sensitivity) 32
33 (Relative Sensitivity with MATS) 33
34 (Absolute Sensitivity) 34
35 (Relative Sensitivity with MATS) 35
36 (Relative Sensitivity with MATS) 36
37 (Relative Sensitivity with MATS) 37
38 (Relative Sensitivity with MATS) 38
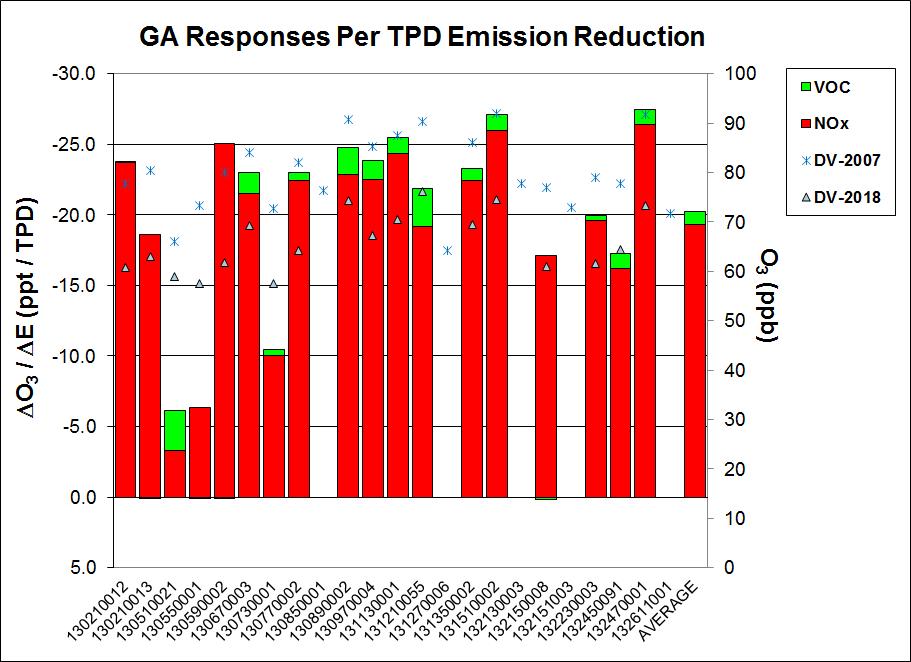
39 Normalized Sensitivities Divided the relative sensitivity from MATS for the home state by the annual average emissions reduction (ppt/tpd) ( DVF NOx x 1000)/TPD NOx ( DVF VOC x 1000)/TPD VOC Created stacked bar charts of normalized NOx and VOC sensitivities for each monitor Calculated state average normalized NOx and VOC sensitivities Calculated ratio of normalized NOx sensitivity to normalized VOC sensitivity for each monitor 39
40 Emission Reductions (30%) NOx (TPD) VOC (TPD) Alabama Florida Georgia Kentucky Mississippi North Carolina South Carolina Tennessee Virginia West Virginia
41 41
42 42

43 43
44 NOx vs. VOC Ratios 44
45 Interstate Contributions Examined state-by-state contributions at downwind sites with DVF > 75 ppb in 2018 Divided state-by-state 30% NOx contributions from MATS by 0.3 to obtain 100% NOx contribution from each state Assumes NOx sensitivities are linear to 100% Removed contributions from non-semap states and from home states Identified SEMAP states that contributed more than various thresholds: 1.0 ppb 0.75 ppb 45
46 (MI, MO, WI) 46
47 (LA and TX) 47
48 NAA State Contributions STATE Site DV-2007 DV-2018 (1x1) AL FL GA KY MS NC SC TN VA WV CT CT GA GA GA GA LA LA LA LA LA LA MI MI MI MO MO MO MO NJ NJ NY NY NY NY TX TX TX TX TX TX TX TX TX TX TX TX TX TX TX TX TX WI
49 MAINT State Contributions STATE Site DV-2007 DV-2018 (1x1) AL FL GA KY MS NC SC TN VA WV AL AL AL AR CT CT CT GA IL LA LA LA LA LA LA LA MD MI MI MI MO MO MO MO MO MO NY NY NY NY NY OH OH OH OH PA PA PA TX TX TX WI
50 Summary In general, absolute sensitivities ( O 3 ) and relative sensitivities ( DVF) are very similar. Anthropogenic NO x emission reductions are much more effective at reducing 8-hour ozone concentrations compared to anthropogenic VOC emission reductions. Some sites in Florida show comparable benefits from VOC and NOx reductions. The home state typically has the largest impact on its own monitors. Neighboring states have the next largest impact. Five of the ten SEMAP states have < 0.75 ppb contribution to monitors with 2018 DVF > 75 ppb. 50
51 Next Steps Run MATS to generate SEMAP 2018 projections for PM 2.5 and Regional Haze Replicate EPA 2011 and 2018 modeling May adjust 2018 EGUs based on ERTAC model May replace SMOKE-MOVES emissions with inventory mode MOVES May adjust VOC emissions from fires May perform NOx emission sensitivities Create 2028 emission inventory and perform 2028 modeling for Regional Haze 51

52 Contact Information Jim Boylan, Ph.D. Georgia Dept. of Natural Resources 4244 International Parkway, Suite 120 Atlanta, GA
53 Appendix (Additional Slides)
54 Atlanta, GA Absolute Sensitivities
 55")
55 (All Days) 55

56 (All Days with 2007 model > 75 ppb) 56

57 (All Days with 2018 model > 70 ppb) 57
58 (All Days) 58

59 (All Days with 2007 model > 75 ppb) 59
60 (All Days with 2018 model > 70 ppb) 60
61 Baltimore, MD Absolute Sensitivities
 62")
62 (All Days) 62

63 (All Days with 2007 model > 75 ppb) 63

64 (All Days with 2018 model > 70 ppb) 64
65 (All Days) 65
66 (All Days with 2007 model > 75 ppb) 66

67 (All Days with 2018 model > 70 ppb) 67
68 Relative Sensitivity State Summary

69 (Relative Sensitivity with MATS) 69
70 (Relative Sensitivity with MATS) 70

71 (Relative Sensitivity with MATS) 71

72 (Relative Sensitivity with MATS) 72

73 (Relative Sensitivity with MATS) 73

74 (Relative Sensitivity with MATS) 74

75 (Relative Sensitivity with MATS) 75

76 (Relative Sensitivity with MATS) 76

77 (Relative Sensitivity with MATS) 77
78 (Relative Sensitivity with MATS) 78

79 (Relative Sensitivity with MATS) 79
80 (Relative Sensitivity with MATS) 80
81 (Relative Sensitivity with MATS) 81
82 (Relative Sensitivity with MATS) 82

83 (Relative Sensitivity with MATS) 83
84 (Relative Sensitivity with MATS) 84

85 (Relative Sensitivity with MATS) 85
86 (Relative Sensitivity with MATS) 86

87 (Relative Sensitivity with MATS) 87

88 (Relative Sensitivity with MATS) 88

89 (Relative Sensitivity with MATS) 89

90 (Relative Sensitivity with MATS) 90
91 Normalized Sensitivity State Summary

92 92

93 93
94 94

95 95
96 96
97 97
98 98

99 99

100 100
101 101
102 Interstate Contributions Bar Charts

103 (GA) 103
 104")
104 (AL and GA) 104
 105")
105 (CT, NJ, NY) 105
")
106 (CT, MD, NY, PA) 106
 107")
107 (MI, MO, WI) 107
108 (IL, MI, MO, OH, WI) 108
 109")
109 (LA and TX) 109
 110")
110 (AR, LA, TX) 110
Permit & Photochemical Modeling Update James W. Boylan Georgia EPD Air Protection Branch Unit Coordinator, Data and Modeling Unit
 Permit & Photochemical Modeling Update James W. Boylan Georgia EPD Air Protection Branch Unit Coordinator, Data and Modeling Unit AWMA Regulatory Update Conference June 6, 2012 Atlanta, GA Data & Modeling
USE OF RPO MODELING TO MEET REGIONAL HAZE AND NAAQS REQUIREMENTS
 USE OF RPO MODELING TO MEET REGIONAL HAZE AND NAAQS REQUIREMENTS James W. Boylan Georgia Department of Natural Resources (Chair for Inter-RPO Modeling Workgroup) 2005 CMAS Models-3 Conference Chapel Hill,
OTC 2007 Modeling Platform
 OTC 2007 Modeling Platform 1 Photochemical Modeling CMAQ4.71 with CB05 chemistry WRF 3.1 (Weather Research Forecast) simulated 2007 Meteorology Modeling domain: 12 km Eastern U.S. Climatological time-invariant
MANE-VU Technical Overview. National Technical RPO Meeting June 9, 2005 Gary Kleiman, NESCAUM
 MANE-VU Technical Overview National Technical RPO Meeting Gary Kleiman, NESCAUM Technical SIP Needs Reasonable Progress Goals Baseline and Natural Visibility Conditions Long Term Strategy (including inventory,
Selection of States for MANE-VU Regional Haze Consultation (2018)
") Selection of States for MANE-VU Regional Haze Consultation (2018) MANE-VU Technical Support Committee 9/5/2017 Introduction Under the Regional Haze Rule 1, States with Class I areas are to consult with
Selection of States for MANE-VU Regional Haze Consultation (2018) MANE-VU Technical Support Committee 9/5/2017 Introduction Under the Regional Haze Rule 1, States with Class I areas are to consult with
RPO Modeling and NAAQS SIP Modeling
 RPO Modeling and NAAQS SIP Modeling James W. Boylan Georgia Department of Natural Resources (Chair for Inter-RPO Modeling Workgroup) 3 rd Particulate Matter/Regional Haze/Ozone Modeling Workshop New Orleans,
USE OF RPO MODELING TO MEET REGIONAL HAZE AND NAAQS REQUIREMENTS
 USE OF RPO MODELING TO MEET REGIONAL HAZE AND NAAQS REQUIREMENTS James W. Boylan* Georgia Department of Natural Resources, Air Protection Branch, Atlanta, GA, USA 1. INTRODUCTION In order to help meet
Comparison of CAIR and CAIR Plus Proposal using the Integrated Planning Model (IPM ) Mid-Atlantic Regional Air Management Association (MARAMA)
 Mid-Atlantic Regional Air Management Association (MARAMA)") Draft Report Comparison of CAIR and CAIR Plus Proposal using the Integrated Planning Model (IPM ) Prepared for Mid-Atlantic Regional Air Management Association (MARAMA) Prepared by ICF Resources, L.L.C.
Draft Report Comparison of CAIR and CAIR Plus Proposal using the Integrated Planning Model (IPM ) Prepared for Mid-Atlantic Regional Air Management Association (MARAMA) Prepared by ICF Resources, L.L.C.
Modeling Committee Update
 Modeling Committee Update OTC Committee and Stakeholder Meeting April 23 rd, 2015 Washington, DC 1 Overview 1. Ozone Designations 2. Photochemical Modeling Update a) Development Plan and Schedule b) Emission
MANE VU Technical Support Committee. OTC/MANE VU Spring Meeting June 6 7, 2018 Baltimore, MD
 MANE VU Technical Support Committee OTC/MANE VU Spring Meeting June 6 7, 218 Baltimore, MD Overview 1. Regional Haze SIPs 2 nd Planning Period Schedule 2. Visibility Report Monitoring Data 3. EI Trends
MANE-VU Technical Support Committee Update. OTC/MANE-VU Fall Meeting: April 10, 2018 Washington, DC
 MANE-VU Technical Support Committee Update OTC/MANE-VU Fall Meeting: April 10, 2018 Washington, DC Overview 1. Action Plan & Schedule Updates 2. Monitoring Data 3. EI Trends Report 4. Consultation/MANE-VU
Modeling Committee Update
 Modeling Committee Update OTC Annual Meeting June 3, 2016 Philadelphia, PA 1 Overview 1. Air Quality Data/Ozone NAAQS 2. Modeling Update a. Emission Inventory b. Episodic Modeling 3. Health Benefits 2
Association of Air Pollution Control Agencies 2019 Spring Meeting Southeastern VISTAS II Regional Haze Analysis Project Update
 Association of Air Pollution Control Agencies 2019 Spring Meeting Southeastern VISTAS II Regional Haze Analysis Project Update March 26, 2019 Outline Southeastern VISTAS II Regional Haze Analysis Project
MANE-VU Technical Support Committee. OTC/MANE-VU Committees Meeting September 21, 2018
 MANE-VU Technical Support Committee OTC/MANE-VU Committees Meeting September 21, 218 Overview 1. Regional Haze SIPs - 2 nd Planning Period Schedule 2. Visibility Report - Monitoring Data 3. EI Trends Report
Air Quality Screening Modeling. Emissions and Photochemical Modeling. OTC Modeling Committee Meeting September 16, 2010 Baltimore, MD
 Air Quality Screening Modeling Emissions and Photochemical Modeling OTC Modeling Committee Meeting September 16, 2010 Baltimore, MD Screening Runs Purpose Investigate the level of emissions reductions
Contributions of Interstate Transport of Air Pollutants to Air Pollution-related Mortality in the Mid-Atlantic U.S.
 Contributions of Interstate Transport of Air Pollutants to Air Pollution-related Mortality in the Mid-Atlantic U.S. Xiangting Hou and Kuo-Jen Liao Department of Environmental Engineering, Texas A&M University-Kingsville
VISTAS Highlights. November 10, 2005
 VISTAS Highlights November 10, 2005 Demonstrating Reasonable Progress For each VISTAS Class I area: 1. Identify pollutants contributing to PM2.5 and visibility 2. Identify probable source areas using back
What Does the Modeling Tell Us About Good Neighbor SIPs and the New EPA Transport Guidance?
 What Does the Modeling Tell Us About Good Neighbor SIPs and the New EPA Transport Guidance? Before After 2011 2018 Tad Aburn, Air Director, MDE EPA Transport Meeting RTP NC - April 8, 2015 Topics Current
OZONE TRANSPORT COMMISSION
 OTC / MANE-VU Committees Meeting April 17, 2018 OZONE TRANSPORT COMMISSION Francis Steitz, NJ Chair Stationary and Area Sources Committee OZONE TRANSPORT COMMISSION 1 Stationary & Area Sources Committee
Relative Response Factor (RRF) and Modeled Attainment Test
 and Modeled Attainment Test") TSD-1g Relative Response Factor (RRF) and Modeled Attainment Test Bureau of Air Quality Analysis and Research Division of Air Resources New York State Department of Environmental Conservation Albany, NY
TSD-1g Relative Response Factor (RRF) and Modeled Attainment Test Bureau of Air Quality Analysis and Research Division of Air Resources New York State Department of Environmental Conservation Albany, NY
IMPACT OF TEMPORAL FLUCTUATIONS IN POWER PLANT EMISSIONS ON AIR QUALITY FORECASTS
 IMPACT OF TEMPORAL FLUCTUATIONS IN POWER PLANT EMISSIONS ON AIR QUALITY FORECASTS Prakash Doraiswamy 1,*, Christian Hogrefe 1,2, Eric Zalewsky 2, Winston Hao 2, Ken Demerjian 1, J.-Y. Ku 2 and Gopal Sistla
CALPUFF PT-Source Modeling
 CALPUFF PT-Source Modeling VT-MD-NESCAUM / MANE-VU RPO Study Status of VT Modeling effort Paul Wishinski & Dan Riley VTAPCD MANE-VU TSC Meeting Washington, DC September 30, 2004 Purposes of this Modeling
OTC Committees Meeting April 10, 2014 Hall of States Washington, D.C. Ali Mirzakhalili, P.E. Stationary and Area Source Committee Update
 OTC Committees Meeting April 10, 2014 Hall of States Washington, D.C. OZONE TRANSPORT COMMISSION Ali Mirzakhalili, P.E. Stationary and Area Source Committee Update 1 Outline Update on Committee efforts
8-Hour Ozone and PM 2.5 Modeling to Support the Georgia SIP
 8-Hour Ozone and PM 2.5 Modeling to Support the Georgia SIP Amit Marmur, James Boylan, Maudood Khan, and Daniel Cohan Background: Attainment Status in Georgia Certain regions in Georgia are in non-attainment
Modeling Committee Update
 Modeling Committee Update OTC Committee Meeting April 11, 2017 Washington, DC 1 Overview 1. Monitored Results 2. Ozone NAAQS Schedule 3. Enhanced Monitoring Plan (EMP) 4. OTC 2011 Modeling Platform a)
Update on Ozone Air Quality Planning. 14 th Annual Regulatory Update Conference Air & Waste Management Association Trenton, NJ November 20, 2015
 Update on Ozone Air Quality Planning 14 th Annual Regulatory Update Conference Air & Waste Management Association Trenton, NJ November 20, 2015 1 National Ambient Air Quality Standards (NAAQS) Pollutant
The Clean Air Act: Multi-State, Multi-National Air Issues. It s a small multi-pollutant world after all. Jed Anderson The AL Law Group
 The Clean Air Act: Multi-State, It s a small multi-pollutant world after all. Multi-National Air Issues Jed Anderson The AL Law Group UH LAW SCHOOL ENVIRONMENTAL LAW LAW 5390 FALL 2018 Local/State/National/Global
Interstate Transport Modeling for the 2015 Ozone National Ambient Air Quality Standard
 Interstate Transport Modeling for the 2015 Ozone National Ambient Air Quality Standard FINAL Technical Support Document Lake Michigan Air Directors Consortium 9501 W. Devon Ave., Suite 701 Rosemont, IL
Modeling Committee Update
 Modeling Committee Update OTC Fall Meeting November 15, 2017 Washington, DC 1 Overview 1. Ozone Monitoring Update 2. Ozone NAAQS Schedule 3. OTC 2011 Modeling Platform 4. New Modeling Platform Update 5.
CALPUFF Ambient SO4 Modeling
 CALPUFF Ambient SO4 Modeling VT-MD-NESCAUM / MANE-VU RPO Study VT Modeling PHASE II June 2005 - November 2005 Paul Wishinski VTAPCD MANE-VU/MARAMA Science Meeting Baltimore, MD November 9, 2005 Purposes
REGIONAL ENERGY BASELINES AND MEASUREMENT AND VERIFICATION PROTOCOLS
 Total Energy Use per Capita (1 6 Btu) ESL-TR-9-2-1 REGIONAL ENERGY BASELINES AND MEASUREMENT AND VERIFICATION PROTOCOLS Subtask 3.1 for the Southern Energy Efficiency Center Cooperative Agreement #: DE-PS26-7NT43185
Scientific Insight from CMAQ modeling for the MDE SIP
 Scientific Insight from CMAQ modeling for the MDE SIP Hao He, Tim Canty, Dan Goldberg, Tim Vinciguerra, Russ Dickerson, and the UMD RAMMPP group Apr. 23, 2015 OTC Committee Meeting 1 Beta Chemistry Problem
EMISSIONS INVENTORY PREPARATION IN MANE VU
 EMISSIONS INVENTORY PREPARATION IN MANE VU Regional Modeling dl Conference April 30, 2012 Chicago, Illinois Julie McDill, P.E. Senior Engineer, MARAMA 1 TOPICS 1. MARAMA Inventories What have we learned
Processing Mobile Emissions in SMOKE: Is it worth simulating everyday onroad mobile emissions to support 8-hr ozone modeling?
 Processing Mobile Emissions in SMOKE: Is it worth simulating everyday onroad mobile emissions to support 8-hr ozone modeling? Mike Abraczinskas North Carolina Department of Environment and Natural Resources
Modeling Committee Update
 Modeling Committee Update OTC Spring Meeting June 6, 2017 1 Overview 1. Ozone Monitoring Data 2. Enhanced Monitoring Plan (EMP) 3. Ozone NAAQS Schedule 4. OTC 2011 Modeling Platform a) Recent Modeling
II) (80 FR 75706, 12/03/2015) EPA-HQ-OAR
 (80 FR 75706, 12/03/2015) EPA-HQ-OAR") ATTACHMENT Maryland Department of the Environment (MDE) Proposed Rulemaking Comments on: Proposed Cross-State Air Pollution Rule Update (CSAPR II) (80 FR 75706, 12/03/2015) EPA-HQ-OAR-2015-0500 February
ATTACHMENT Maryland Department of the Environment (MDE) Proposed Rulemaking Comments on: Proposed Cross-State Air Pollution Rule Update (CSAPR II) (80 FR 75706, 12/03/2015) EPA-HQ-OAR-2015-0500 February
Contributions to Regional Haze in the Northeast and Mid-Atlantic United States: Preliminary Update Through 2007
 Contributions to Regional Haze in the Northeast and Mid-Atlantic United States: Preliminary Update Through 2007 Mid-Atlantic/Northeast Visibility Union (MANE-VU) Updated Contribution Assessment Prepared
Using the EMF for Development of Temporal Profiles for Non-CAMD EGUs
 Maryland Department of the Environment Using the EMF for Development of Temporal Profiles for Non-CAMD EGUs Hannah Ashenafi MARAMA EMF Peer Workgroup Showcase September 9, 2015 Background There is interest
OZONE TRANSPORT COMMISSION Ali Mirzakhalili, P.E. Stationary and Area Sources Committee OZONE TRANSPORT COMMISSION
 OTC /MANE-VU Committees Meeting April 11, 2017 Washington, DC OZONE TRANSPORT COMMISSION Ali Mirzakhalili, P.E. Stationary and Area Sources Committee OZONE TRANSPORT COMMISSION 1 Stationary and Area Sources
The Role of Interstate Transport of Air Pollutants in Achieving Ozone NAAQS Attainment
 The Role of Interstate Transport of Air Pollutants in Achieving Ozone NAAQS Attainment David M. Flannery Steptoe & Johnson PLLC for the Midwest Ozone Group April 14, 2015 Presented at: New Jersey Clean
The Future of Greenhouse Gas Emissions Trading in North America
 The Future of Greenhouse Gas Emissions Trading in North America 14 th IEA-IETA-EPRI Annual Workshop on Greenhouse Gas Emission Trading Thursday October 9, 2014 Agenda California s AB 32 and Cap-and-Trade
Emissions and Modeling Update
 Emissions and Modeling Update OTC Fall Meeting November 10 th, 2010 Sheraton Hotel Boston, MA 11/10/2010 1 Overview 1. Ozone NAAQS 2. Modeling 3. Emissions Inventory 11/10/2010 2 Ozone NAAQS 2008 NAAQS
Developing a Framework for Integrated Energy Network Planning
 Developing a Framework for Integrated Energy Network Planning Resource Planning for the Next Generation Adam Diamant Technical Executive, Energy & Environmental Analysis Electric Power Research Institute
Southern New Mexico Ozone Modeling Study Summary of Results: Tasks 9 and 10
 Summary of Results: Tasks 9 and 10 Ramboll-Environ (RE) University of North Carolina (UNC-IE) June 3, 2016 SNMOS Background and Objectives The southern Doña Ana County region has the highest ozone levels
Modeling the Clear Skies Act. STAPPA/ALAPCO July 30, 2003
 Modeling the Clear Skies Act STAPPA/ALAPCO July 30, 2003 Topics Overview of analysis and results Years and strategies modeled PM 2.5 and ozone model results Updates and improvements from previous Clear
State of the Air in Arkansas
 State of the Air in Arkansas 2017 2017 State of the Air Report Purpose Acknowledgments Present data about the state of air quality in Arkansas Provide overview of programs implemented by ADEQ Office of
Goal Setting: Nutrient Pollution Standards and Technology. October 29, Ephraim King OST
 Goal Setting: Nutrient Pollution Standards and Technology October 29, 2008 Ephraim King OST Purpose 1. Why are nutrient criteria important? 2. What have we done to date? 3. Where are the States? 4. What
Assessing the Potential Economic and Distributional Impacts of a Tighter Ozone NAAQS
 Assessing the Potential Economic and Distributional Impacts of a Tighter Ozone NAAQS TCEQ Independent Workshop on Ozone NAAQS Science and Policy Austin, TX April 7-9, 2015 Anne E. Smith, Ph.D. NERA Economic
Indiana Energy Status
 Indiana Energy Status presented to Indiana Chamber of Commerce Conference on Energy Management June 19, 2008 presented by Doug Gotham State Utility Forecasting Group Which sector uses the most electricity
STATE LEGISLATIVE ACTION FOR THE DEVELOPMENT OF A HEMP INDUSTRY IN THE U.S. Hawaii Representative Cynthia Henry Thielen
 (AL) Alabama -- -- -- (AK) Alaska -- -- (AZ) Arizona -- (AR) Arkansas -- SR13 (adopted 1999): Requires the University of Arkansas to conduct studies to determine the feasibility of growing hemp as an alternative
Ozone forms from NOX+VOC+Sun. Source:
 1 2 Ozone forms from NOX+VOC+Sun Source: www.montgomerycountymd.gov/dep/resources/images/outreach/air/ozoneformation.jpg 3 4 Tons per day Progress: Reduced in O 3 precursors 600 500 519 400 300 200 351
Analysis of NBI Data for California Bridges
 University of California Center on Economic Competitiveness in Transportation Analysis of NBI Data for California Bridges Rosa Vasconez, Emily Yu California State Polytechnic University, Pomona July 2016
Farm Radio Habits Wave 1, Winter Conducted by Millennium Research, Inc.
 Farm Radio Habits Wave 1, Winter 2015 Conducted by Millennium Research, Inc. TAKE A PICTURE OF THE RADIO YOU LISTEN TO THE MOST OFTEN? 2 Radio Is An Important Part Of Farmers And Ranchers Day I started
The Pyrogeographyof Wildfires in the Western U.S.
 The Pyrogeographyof Wildfires in the Western U.S. Dr. Michael Medler 1 2 3 4 The pumps buy you time, but minutes only. From this moment, no matter what we do, Titanic will founder. But this ship can't
VISTAS Overview. National RPO Meeting Denver, CO
 VISTAS Overview National RPO Meeting Denver, CO Pat Brewer June 9, 2005 Delivered 2004 Visibility & PM2.5 Trends Conceptual Description Characterize Meteorology Emissions Inventories 2002, 2009, 2018 Met,
Pittsburgh Modeling for the PM 2.5 NAAQS EPA Regional/State/Local Modelers Workshop. May 2, 2012
 Pittsburgh Modeling for the PM 2.5 NAAQS 2012 EPA Regional/State/Local Modelers Workshop Chicago, IL May 2, 2012 Jason Maranche Allegheny County Health Department Pittsburgh, PA Nonattainment Areas Before/After
Southern New Mexico Ozone Modeling Study Project Summary
 Project Summary Ramboll-Environ (RE) University of North Carolina (UNC-IE) June 29, 2016 http://www.wrapair2.org/snmos.aspx SNMOS Background and Objectives The southern Doña Ana County region has the highest
Fiscal Year 2010 Drinking Water and Ground Water Statistics
 Fiscal Year 2010 Drinking Water and Ground Water Statistics U.S. Environmental Protection Agency Office of Ground Water and Drinking Water EPA 817K11001 June 2011 Table of Contents Introduction... 4 Acronyms
Indiana Energy Landscape
 Indiana Energy Landscape presented to WIndiana 2008 June 17-18, 2008 presented by David Nderitu / Doug Gotham State Utility Forecasting Group Outline Characteristics of Indiana s existing generation Emissions
The importance of grid and domain size. Comparing 12 km Grid to Counties
 Setting up Regional Air Quality Models Modeling Domain Boundary Conditions Grid Structure Meteorological Model Pre processing/post processing Emissions Inventory 29 The Modeling Domain The size and nature
Small Electric Generating Units in the MARAMA Alpha 2011/2018 Modeling Platform
 Maryland Department of the Environment Small Electric Generating Units in the MARAMA Alpha 2011/2018 Modeling Platform A Methodology to Develop A Consistent Base Year Temporal Profile for Small Non- CAMD
Intermountain West Data Warehouse Western Air Quality Study (IWDW-WAQS) Applicability of the IWDW-WAQS beyond the West
 Applicability of the IWDW-WAQS beyond the West") Intermountain West Data Warehouse Western Air Quality Study (IWDW-WAQS) Applicability of the IWDW-WAQS beyond the West 2 NPS Air Quality Conditions & Trends Tools (nps.gov) Partners: NPS/ARD Databases
Intermountain West Data Warehouse Western Air Quality Study (IWDW-WAQS) Applicability of the IWDW-WAQS beyond the West 2 NPS Air Quality Conditions & Trends Tools (nps.gov) Partners: NPS/ARD Databases
State of the Network. EN2014 February 25, 2014
 State of the Network EN2014 February 25, 2014 Where We ve Been Then In the an beginning, Blueprint Implementation in there 2000was Plan in idea 2002 and a bar napkin Hi there. Use the Internet, data standards
PREMIER USER GUIDE Supplemental Guide to Changing a Rate Plan. Premier and AT&T Small Business Service (SBS) User Guide
 User Guide") Premier and AT&T Small Business Service (SBS) User Guide 2009-2010 AT&T Intellectual Property. All rights reserved. PAGE 1 Table of Contents Introduction Packages and Services What You Need to Know Support
Premier and AT&T Small Business Service (SBS) User Guide 2009-2010 AT&T Intellectual Property. All rights reserved. PAGE 1 Table of Contents Introduction Packages and Services What You Need to Know Support
The Future of Coal-fired Generation: Challenging the EPA
 Association Of Women In Energy Power Matters Conference The Future of Coal-fired Generation: Challenging the EPA MARK OURADA INDEPENDENT CONSULTANT Leadership A Leader is a Dealer in Hope Napoleon Power
Modeling Committee Update
 Modeling Committee Update OTC Stakeholder Meeting September 10, 2015 Washington, DC 1 Overview 1. Ozone Designations and 2015 Data Trajectories 2. Modeling Update a) Model Performance b) Modeling Results
Bridge Management Questionnaire Report
 Bridge Management Questionnaire Report National Bridge Management, Inspection and Preservation Conference (NBMIPC) November 1, 2011 Saint Louis, MO Wade F. Casey, P.E. Bridge Management Engineer Federal
The Discussion. WV s Observations Literature Review. SEAUPG Annual Meeting Williamsburg, VA Thursday, November 19, 2015
 Strength Testing of Tack Coats 21 SEAUPG Annual Meeting John E. Crane P.E. West Virginia DOH Materials Thursday November 19th, 21 The Discussion WV s Observations 213 WVDOH Asphalt Specification Changes
8-Hour Ozone. Implementing Current 2008 Standard Proposed New 2015 Standards. Denver Regional Council of Governments Board Meeting July 15, 2015
 8-Hour Ozone Implementing Current 2008 Standard Proposed New 2015 Standards Denver Regional Council of Governments Board Meeting July 15, 2015 Ken Lloyd Executive Director How Ozone Is Formed Source: www.montgomerycountymd.gov/dep/resources/images/outreach/air/ozoneformation.jpg
Applications of Source Contribution and Emissions Sensitivity Modeling to Assess Transport and Background Ozone Attribution
 Applications of Source Contribution and Emissions Sensitivity Modeling to Assess Transport and Background Ozone Attribution April 2014 Kirk Baker, Norm Possiel, Brian Timin, Pat Dolwick 1 Source Sensitivity
Energy and Water: Emerging Issues and Challenges. Mike Hightower Water for Energy Project Lead Sandia National Laboratories
 Energy and Water: Emerging Issues and Challenges Mike Hightower Water for Energy Project Lead Sandia National Laboratories 2011 Summer Seminar August 1, 2011 Energy and Water are Interdependent Water
The Changing Landscape and Business Case for Water Loss Control
 The Changing Landscape and Business Case for Water Loss Control New Water Technologies Panel April 12, 2016 Presented by: Steve Cavanaugh, P.E. steve.cavanaugh@cavanaughsolutions.com 7000 AWWA Water Loss
PUBLIC POWER = + + LOCAL CONTROL LOW RATES HIGH RELIABILITY
 PUBLIC POWER = + + LOCAL CONTROL LOW RATES HIGH RELIABILITY WHAT IS PUBLIC POWER? Public power utilities are not-for-profit local institutions that provide electricity as an essential public service at
Farm Computer Usage and Ownership
 Washington, D.C. Farm Computer Usage and Ownership Released July, 0, by the National Agricultural Statistics Service (NASS),, U.S. Department of Agriculture. For information on "" call Mark Aitken at ()
Ozone Source Apportionment Modeling to Support Policy Initiatives in the Eastern United States
 Ozone Source Apportionment Modeling to Support Policy Initiatives in the Eastern United States Kenneth Craig, Garnet Erdakos, Lynn Baringer, and Stephen Reid Sonoma Technology, Inc., Petaluma, CA 15 th
2011 State Average Electricity Prices (cents/kwh)
") Retail Rates Indiana has a relative price advantage on electric retail rates. Retail pricing is the average price for all rate classes, including residential, commercial, and industrial customers. Indiana
Retail Rates Indiana has a relative price advantage on electric retail rates. Retail pricing is the average price for all rate classes, including residential, commercial, and industrial customers. Indiana
Solving the Ozone Transport Problem
 Solving the Ozone Transport Problem Some Thoughts from Your Neighbor to the South Let me know what you think are we a Good or Bad Neighbor Tad Aburn, Air Director, MDE New Jersey Clean Air Council Hearing
Southern New Mexico Ozone Modeling Study Task 11: Emission Sensitivity Modeling
 Task 11: Emission Sensitivity Modeling Ramboll-Environ (RE) University of North Carolina (UNC-IE) August 11, 2016 SNMOS Background and Objectives The southern Doña Ana County region has the highest ozone
2002 FIRE INVENTORY VISTAS States
 2002 FIRE INVENTORY VISTAS States First Draft Oct 2003 National RPO meeting Nov 5, 2003 2002 Fire Inventory Requested data spring 2003 from State agencies for state and private lands Requested data from
Non-Ambulatory Cattle and Calves
 Washington, D.C. Non-Ambulatory Cattle and Calves Released May 5, 2005, by the National Agricultural Statistics Service (NASS),, U.S. Department of Agriculture. For information on Non-ambulatory Cattle
Infrared Technology: Its Application and Benefit
 Infrared Technology: Its Application and Benefit Joseph Reiter, P.E. March 2, 2017 CA AZ CO NM TX OK AR LA MO KY AL GA FL VA OH MI VT AK MT NV ME WA OR UT KS ID WY ND SD MN NE WI IA IL IN MS TN SC NC WV
The Bee Informed Partnership Management Survey Results (2011) Respondent Profile. BeeInformed.org
 Respondent Profile. BeeInformed.org") The Bee Informed Partnership Management Survey Results (2011) Respondent Profile BeeInformed.org Release Date: March 1, 2012 Losses suffered by all respondent beekeepers over the season. Over All Report
The Bee Informed Partnership Management Survey Results (2011) Respondent Profile BeeInformed.org Release Date: March 1, 2012 Losses suffered by all respondent beekeepers over the season. Over All Report
April 1, Dear Acting Regional Administrator Pavlou:
 DEPARTMENT OF ENVIRONMENTAL PROTECTION JON S. CORZINE P.O. BOX 402 MARK N. MAURIELLO Governor Trenton, NJ 08625-0402 Acting Commissioner Phone: (609) 292-2885 Fax: (609) 292-7695 April 1, 2009 The Honorable
OZONE TRANSPORT COMMISSION Ali Mirzakhalili, P.E. Stationary and Area Sources Committee OZONE TRANSPORT COMMISSION
 OTC /MANE-VU Spring Meeting June 6, 2017 Saratoga Springs, NY OZONE TRANSPORT COMMISSION Ali Mirzakhalili, P.E. Stationary and Area Sources Committee OZONE TRANSPORT COMMISSION 1 Stationary and Area Sources
MIDWEST OZONE GROUP ASSESSMENT OF 176A PETITION
 MIDWEST OZONE GROUP ASSESSMENT OF 176A PETITION Prepared by: David M. Flannery Steptoe & Johnson PLLC Gregory Stella Alpine Geophysics LLC February 2014 1990 Amendments to CAA The 1990 Amendments specifically
EPA Regional Modeling for National Rules (and Beyond) CAIR/ CAMR / BART
 CAIR/ CAMR / BART") EPA Regional Modeling for National Rules (and Beyond) CAIR/ CAMR / BART 1 Emissions & Modeling Contacts Pat Dolwick Meteorology and Episodic Ozone Modeling Brian Timin Speciated Modeled Attainment Test
EPA Regional Modeling for National Rules (and Beyond) CAIR/ CAMR / BART 1 Emissions & Modeling Contacts Pat Dolwick Meteorology and Episodic Ozone Modeling Brian Timin Speciated Modeled Attainment Test
Transportation Worker Identification Credential (TWIC) Program. American Association of Port Authorities 2013 Security Seminar July 17, 2013
 Program. American Association of Port Authorities 2013 Security Seminar July 17, 2013") Transportation Worker Identification Credential (TWIC) Program American Association of Port Authorities 2013 Security Seminar July 17, 2013 Current Program Statistics 2.6M. Total Enrollments 2.4M. Total
Transportation Worker Identification Credential (TWIC) Program American Association of Port Authorities 2013 Security Seminar July 17, 2013 Current Program Statistics 2.6M. Total Enrollments 2.4M. Total
Born on a Bike, Kitchen Crafted, Family and Employee-owned BRUCE LYMBURN GENERAL COUNSEL AND SECRETARY
 Born on a Bike, Kitchen Crafted, Family and Employee-owned BRUCE LYMBURN GENERAL COUNSEL AND SECRETARY Origins of Clif Bar & Company In 1990 Gary Erickson was living in a garage in Emeryville, working
A Comparison of In-Service Statistical Test Programs
 A Comparison of In-Service Statistical Test Programs North Carolina Electric Meter School & Conference June 30, 2004 1 Program Background Advent Design Corporation has conducted numerous studies of in-service
U.S. General Services Administration. General Services Administration
 U.S. General Services Administration General Services Administration Presented By: GSA Region 4 April 19, 2011 Topics Quick Look at GSA Southeast Sunbelt Region Typical Projects in Southeast American Reinvestment
Presidential Commission on Election Administration & Voter Registration. Future of California Elections Los Angeles, CA February 25,2016
 Presidential Commission on Election Administration & Voter Registration Future of California Elections Los Angeles, CA February 25,2016 General Election 2012: According to survey data, although most voters
Risk Mitigation Benefits of Energy Efficiency
 Risk Mitigation Benefits of Energy Efficiency 2013 ACEEE Conference on Energy Efficiency as a Resource Dan Bakal, Ceres Sept 24, 2013 Nashville, TN Ceres " Ceres mobilizes a powerful network of investors,
Rate Design: Basics and What s Possible
 Rate Design: Basics and What s Possible Northeast Regional Meeting National Association of State Energy Officials April 12, 2018 Synapse Energy Economics Founded in 1996 by CEO Bruce Biewald Based in Cambridge,
Farms and Land in Farms
 United States Department of Agriculture National Agricultural Statistics Service Farms and Land in Farms February 2003 Sp Sy 3 (03) Up Slightly in 2002 The number of farms in the United States in 2002
The American Clean Energy Security Act (ACES) Creates More American Jobs and Saves Americans Money
 Creates More American Jobs and Saves Americans Money") The American Clean Energy Security Act (ACES) Creates More American Jobs and Saves Americans Money State-by-state figures on job creation, electric bill reductions, and transportation savings from the
The American Clean Energy Security Act (ACES) Creates More American Jobs and Saves Americans Money State-by-state figures on job creation, electric bill reductions, and transportation savings from the
FINAL. Revision to the North Carolina State Implementation Plan
 FINAL Revision to the North Carolina State Implementation Plan Demonstration that North Carolina Complies with the Good Neighbor Requirements of Clean Air Act Section 110(a)(2)(D)(i)(I) for the 2008 Ozone
The Oklahoma First Energy Plan: A Pragmatic Path Forward
 Office of the Oklahoma Secretary of Energy The Oklahoma First Energy Plan: A Pragmatic Path Forward C. Michael Ming Secretary of Energy State of Oklahoma Southern States Energy Board Washington, DC February
M. Talat Odman, Yongtao Hu and Armistead G. Russell School of Civil and Environmental Engineering Georgia Institute of Technology
 M. Talat Odman, Yongtao Hu and Armistead G. Russell School of Civil and Environmental Engineering Georgia Institute of Technology AQAST 10 at EPA Research Triangle Park, NC January 5, 2016 Prescribed
Washington Update. Mary Miller Chief Administrative Officer Edison Electric Institute. Western LAMPAC Spring Meeting April 2015
 Washington Update Mary Miller Chief Administrative Officer Edison Electric Institute Western LAMPAC Spring Meeting April 2015 OSHA Settlement Settlement agreement reached with OSHA, resolving challenge