Sources and pathways of nutrients to the Baltic Sea
|
|
|
- Roberta Fitzgerald
- 5 years ago
- Views:
Transcription

1 Baltic Sea Environment Proceedings No. 153 Baltic Marine Environment Protection Commission Sources and pathways of nutrients to the Baltic Sea HELCOM PLC-6
2 Published by: Helsinki Commission Katajanokanlaituri 6 B FI Helsinki, Finland Authors: Lars Sonesten (SLU, Sweden), Lars M. Svendsen (DCE, Denmark), Henrik Tornbjerg (DCE, Denmark), Bo Gustafsson (BNI, Sweden), Dmitry Frank-Kamenetsky and Juuso Haapaniemi (HELCOM). Contributors, HELCOM PLC-6 project members: Wera Leujak (UBA, Germany), Peeter Ennet (EEA, Estonia), Seppo Knuuttila (SYKE, Finland), Antti Räike (SYKE, Finland), Dietmar Koch (UBA, Germany), Ilga Kokorite (LEGMC, Latvia), Svajunas Plunge (EPA, Lithuania), Weronika Brynska (NWMA, Poland), Natalia Oblomkova (Institute for Engineering and Environmental Problems in Agricultural Production, Russia), Helene Ejhed (IVL, Sweden), Julia Hytteborn (Statistics Sweden). Acknowledgements: Personal thanks to Jerzy Bartnicki (W-MSC EMEP, Norway) for the contribution to the publication with regard to information on the sources of atmospheric deposition of nitrogen. The PLC-project team and authors thank Pekka Kotilainen (SYKE, Finland) and Alexander Sokolov (BNI, Sweden) for data processing, elaboration and maintenance of the data reporting and handling tools for the HELCOM PLC water database. The document was reviewed, commented and endorsed by HELCOM Working Group on Reduction of Pressures from the Baltic Sea Catchment Area (PRESSURE). For bibliographic purposes this document should be cited as: HELCOM, Sources and pathways of nutrients to the Baltic Sea. Baltic Sea Environment Proceedings No. 153 Information included in this publication or extracts thereof is free for citing on the condition that the complete reference of the publication is given as stated above. Copyright 2018 by the Baltic Marine Environment Protection Commission Helsinki Commission Design and layout: Yksinolla Branding, Helsinki, Finland Language check: Kate Ravilious Cover photo: Rodion Kutsaev, Unsplash.com Number of pages: 48 ISSN
3 Preface Eutrophication caused by oversupply of the Baltic Sea by nutrients remains the major environmental pressure on the marine ecosystem. In order to mitigate eutrophication, HELCOM countries have agreed on a joint effort to reduce nutrient load on the marine ecosystem, reflected in the HELCOM Baltic Sea Action Plan as a nutrient input reduction scheme. Compilations of pollution load data, designed to follow up on the implementation of the scheme, have been an integral part of the HELCOM assessment system since This assessment of major sources and pathways of nitrogen and phosphorus into the marine environment is a vital part of the HELCOM Pollution Load Compilation (PLC) and one of the main products of the HELCOM Sixth Pollution Load Compilation project (PLC-6). The product includes an assessment of three major pathways of nutrients riverine, airborne and via direct sources and more detailed assessment of sources of riverine load. The previous (PLC-5) assessment, published in 2013, was based on the data on nutrient inputs in Current assessment illustrates the contribution of various sources of nitrogen and phosphorus into total loads in 2014 (2012 for Germany and Poland). The assessment also illustrates changes in proportion of different pathways since Contents Changes in the main nitrogen sources and pathways 4 Changes in the main pathways of nitrogen input 4 Changes in the main pathways of phosphorus input 10 Sources of riverine nitrogen and phosphorus to the Baltic Sea 17 Sources of riverine nutrient loads in the Baltic Sea area 17 Country-wise distribution of sources of nutrient loads 21 Area-specific losses and retention 26 3
4 Changes in the main nitrogen sources and pathways Changes in total nitrogen and phosphorus inputs into the Baltic Sea, as well as the proportion of the major pathways have been evaluated for the years 1995, 2000, 2006 and The reported major pathways include riverine loads, direct point-sources and, for nitrogen, atmospheric deposition. The results are illustrated as pie charts in Figures 1 to 34, where Figures 1 and 18 show the changes in nitrogen and phosphorus inputs to the entire Baltic Sea, respectively. Figures 2 to 8 and 19 to 25 show the nitrogen and phosphorus input changes to the different Baltic Sea basins, and Figures 9 to 17 and 26 to 34 show the nitrogen and phosphorus input changes attributed to the different HELCOM countries. Changes in the main pathways of nitrogen input For the entire Baltic Sea, the total nitrogen inputs fall during the recorded period, with the share of direct point-sources experiencing greatest change (Figure 1). This pattern of nitrogen inputs reduction is in common for all basins in the Southern part of the Baltic Sea, (the Baltic Proper, Danish Straits, and Kattegat) (Figures 6-8) and correlates with falling inputs from Denmark, Germany, Poland and Sweden; the countries that dominate nitrogen input to these basins (Figures 9, 12, 15, and 17). A similar tendency is indicated for nitrogen inputs to the Gulf of Finland (Figure 4), and corresponds with falling nitrogen input from Finland and Russia; the two countries responsible for the majority of input to the Gulf of Finland (Figures 11 and 16). However large total input in 2006 partly obscures this trend. Total nitrogen inputs to the Gulf of Riga decrease over time (Figure 5), but in this case the countries that discharge into the Gulf - Estonia and Latvia - possess variable total inputs for the evaluated period (Figures 10 and 13). However, there is a tendency for the share of the direct point-sources to decrease over time. Lithuania, discharging into the Baltic Proper, displays variable nitrogen inputs over time (Figure 14). For the two remaining basins, Bothnian Bay and Bothnian Sea, the total inputs do not show any strong tendencies, although the inputs in 2014 appear to be lower than in earlier years (Figures 2-3). Since the inter-annual variability appears to be substantial, it is hard to detect any trends in the share of different nitrogen pathways. 4
5 5
6 6
7 7
8 Figure 9 Figure 10 Figure 10 Figure 11 8
9 Figure 12 Figure 13 Figure 14 9
10 10
11 Changes in the main pathways of phosphorus input The overall pattern for both total phosphorus load as well as share of different pathways is quite different from the patterns observed for nitrogen. Nonetheless total average inputs for both phosphorus and nitrogen for the entire Baltic Sea have reduced over time (Figures 1 and 18). The differences stand out when observing the inputs to the different basins, and the share contributed by the different countries. The differences are mainly because the long-term focus to reduce nutrient load has been on phosphorus, as the main regulating nutrient for eutrophication in the Baltic Sea (except from the more saline waters in the Danish Straits and Kattegat for example). Meanwhile, less attention has been given to nitrogen, until more recently. Although there has been a focus to reduce phosphorus loads for quite a substantial time, the reduction measures have been implemented over different time periods in different countries, which is evident when comparing the total phosphorus loads, as well as the shares of the pathways (Figures 18-34). Denmark, Finland, Germany, and Sweden started to implement measures to reduce the impact from point-sources (direct and inland sources) before HELCOM measurements began, by improving waste water treatment plants. This means that these early reductions and the effect on the phosphorus loads to the Baltic Sea cannot be seen in the HELCOM data. In these countries, measures are now more oriented to diffuse sources like agricultural losses and scattered dwellings, as the possibility for further reduction of emissions from waste water treatment plants are comparatively small and quite expensive. The main tendencies revealed over the evaluated period show that for the whole Baltic Sea, as well as for the majority of its basins, there is a decrease in the total phosphorus load over time (Figure 18-25). For the Bothnian Sea and the Gulf of Finland the main reduction appears in 2014 (Figures 20-21). The only basin without any obvious reduction in the total phosphorus load is the Gulf of Riga (Figures 22). More or less the same picture is given for the country-wise phosphorus loads, with a general decrease for Estonia, Germany, Poland, and Sweden (Figures 27, 29, 32, and 34), an early decrease (in 1995) for Denmark (Figure 26), and a late decrease for Finland, Lithuania, and Russia (Figures 28, 31, and 33). No clear trends can be seen for Latvia (Figure 30). For the changes in proportions of the different pathways most countries show a decrease in their share of direct point-sources over time. The main difference between countries is how large the change is and when it occurs (Figures 26-33). The only country that does not have any clear trend in changed pathways is Sweden (Figure 34). Consequently, the share of the direct point-sources for most basins as well as for the whole Baltic Sea is decreasing over the period evaluated (Figures 18-25). The only exception to this general tendency is the Bothnian Bay, where there is no clear trend (Figure 19). 11
12 12
13 13
14 14
15 Figure 26 Figure 27 Figure 28 15
16 Figure 29 16
17 17
18 Sources of riverine nitrogen and phosphorus to the Baltic Sea Source apportionment of riverine loads can be used as an instrument to estimate the contributions of different diffuse and point sources, to total riverine nitrogen and phosphorus loads entering the Baltic Sea. It is used to assess the importance of different anthropogenic sources and the contribution of natural background losses. Source apportionment can be performed using one of two approaches, either based on loads to inland waters (source approach or gross load) or at the river mouth (load approach or net load) (see also HELCOM 2015). Generally, these two approaches give different results because the retention is normally lower for sources situated close to the coast, as well as in large rivers, whereas the retention is higher for upland areas since the water travels a longer route before it enters the sea (see also nutrient retention in inland surface waters). Another reason for differing results may be because different methodologies are used to estimate diffuse sources for the two approaches. The results presented below, and in Figures 35-69, all derive from the load-oriented approach, meaning that they refer to net loads to the Baltic Sea, that take the retention in the catchment areas into account. Note that in this assessment all source-apportionment data from Germany and Poland refer to the originally agreed assessment year 2012, whereas all other countries refer to 2014, which was later decided to be the assessment year. As Germany and Poland had already started their data collection when the year was changed, it was decided that they would continue their work using the original year for the assessment. Sources of riverine nutrient loads in the Baltic Sea area Natural background loads of nitrogen and phosphorus make up around one third of the total load of nutrients to the Baltic Sea (Figure 35). This is about twice as large a proportion compared to the estimates in PLC5 (HELCOM 2011). The reason for this large difference is probably due to changed estimates of background loads in the present assessment. However, there are large differences in the proportion of natural background loads for the different Baltic Sea basins (Figures 36-42). The largest proportion of natural load occurs in the Gulf of Finland (68% for nitrogen, and 59% for phosphorus), and Bothnian Bay (65% for both nitrogen and phosphorus), whereas the lowest proportions are in the Gulf of Riga (12% for nitrogen, and 11% for phosphorus). Among the anthropogenic sources, the diffuse sources (mainly from agricultural activities) constitute the major part, making up 46% of the total riverine nitrogen load and 36% of the total riverine phosphorus load to the Baltic Sea (Figure 35). The large differences in the amount of land utilised for agriculture (see also Figure 58), as well as agricultural practices over the Baltic Sea catchment, are reflected by the varying contributions that diffuse sources make to total nutrient load (Figures 36-42). High impact is found in the Gulf of Riga (57% for nitrogen, and 42% for phosphorus), and for nitrogen also in the Danish Straits (68% for nitrogen), and Kattegat (59% for nitrogen). Point-sources are important for riverine nutrient loads to the Baltic Sea, and constitute 12% of the total nitrogen load and 24% of the total phosphorus load (Figure 35). The variability in importance of point-sources is even greater than for the other nutrient sources (Figures 36-42). The lowest impact from point-sources is found in the Gulf of Riga (1% for nitrogen, and 4% for phosphorus), but there are also other basins where the proportion for nitrogen is lower than 10%, including Bothnian Bay (6-7%), the Gulf of Finland and Kattegat (8%). High impact from point-sources is found in the Baltic Proper (18% for nitrogen, 33% for phosphorus), and in the Danish Straits (43% for phosphorus). However, some caution needs to be taken when assessing the various riverine nutrient sources to the Gulf of Riga, as it has not been possible to allocate any specific sources to a large proportion of the nutrient load. These loads are classified as trans-boundary as they originate in upstream countries, mainly Belarus (Figure 39). In total, the trans-boundary load to the Gulf is 30% for nitrogen, and 42% for phosphorus. This increases uncertainty in source apportionments substantially for this basin. Substantial trans-boundary loads are also found for the Baltic Proper with 10 to 11% of the nutrient loads originating in countries upstream of the HELCOM countries (Figure 40). 18
19 Riverine load in 2014 to BALTIC SEA Riverine load in 2014 to BALTIC SEA TN (529,583 tonnes) TP (22,273 tonnes) Riverine load in 2014 to BOB TN (42,922 tonnes) TP (2,133 tonnes) Riverine load in 2014 to BOS TN (37,698 tonnes) TP (1,455 tonnes) 19
20 Riverine load in 2014 to GUF TN (84,295 tonnes) TP (3,707 tonnes) Riverine load in 2014 to GUR TN (65,288 tonnes) TP (1,660 tonnes) Riverine load in 2014 to BAP TN (220,414 tonnes) TP (10,733 tonnes) 20
21 Riverine load in 2014 to DS TN (28,251 tonnes) TP (1,130 tonnes) Riverine load in 2014 to KAT TN (50,713 tonnes) TP (1,455 tonnes) 21
22 Country-wise distribution of sources of nutrient loads It is only with great caution that the source apportionment may be assessed at country or basin-wise level, especially since the nutrient allocation modelling may vary from country to country, and does not always follow the HELCOM PLC-Water guidelines (HELCOM 2016). Detailed information on the nutrient sources, including nutrient loss from agriculture and atmospheric deposition on inland water surfaces, has only been given by Germany, Denmark, Finland, Lithuania, Poland, and Sweden, whereas the other HELCOM countries have reported a more generalised source apportionment. It should also be noted that some of the minor point sources (for example storm water effluent and scattered dwellings) are handled differently by different contracting parties, and they may be included in the diffuse sources or in point sources. Also, the definition of scattered dwelling can be rather different in different countries. For example, in Denmark it is less than 30 PE, whereas in some CP s less than 300 PE. The most important German nutrient source for the Baltic Sea is agricultural activity, which makes up 78% of the nitrogen load, and 51% of the phosphorus load (Figure 46). Other important anthropogenic sources, especially for phosphorus, are point-sources (20%) and urban areas (22%), whereas they are less important for nitrogen (9% and 4% respectively). The atmospheric deposition is limited to 9% for nitrogen, and 8% for phosphorus. Note that these data are based on the German MSFD reporting and differ from PLC reporting. For MSFD, Germany does not report on natural background losses and uses aggregated data from 2012 to The nutrient riverine inputs from Denmark are to a large extent dominated by agriculture (Figure 43). For Nitrogen, the diffuse loads constitute 74% of the total load, while for phosphorus they make up 38% of the load. The natural background constitutes 19% for nitrogen, and 29% for phosphorus. Point-sources are very important for the phosphorus loads (33%), but less important for nitrogen (6%). The contribution of atmospheric deposition is very minor (1% for nitrogen, 0.1% for phosphorus), due to the very limited amount of lake surface areas. Diffuse sources are the main contributor to the Estonian riverine nutrient load (Figure 44). Most likely, the main diffuse source is agriculture in this case. For nitrogen diffuse sources constitute 64% of the load, whereas the corresponding proportion for phosphorus is 75%. The natural background losses are substantial (34% for nitrogen, and 21% for phosphorus). On the other hand, point-sources are less important for the total loads (2% for nitrogen, and 4% for phosphorus). No information has been reported on the importance of atmospheric deposition. For Finland the natural background loads are very important and make up some 44% and 34% of the total loads for nitrogen and phosphorus, respectively (Figure 45). Also, the losses from agriculture are notable with 38% for nitrogen, and 53% for phosphorus. The point-sources constitute some 10% of the loads, and atmospheric deposition is quite significant, especially for nitrogen (8%), and slightly less for phosphorus (3%). The comparatively high proportion for deposition is due to the relatively high amount of lake surface area in Finland. The riverine nutrient loads travelling via Latvia to the Baltic Sea is heavily influenced by trans-boundary loads from upstream countries, (mainly Belarus), and constitute some 37% of the total nitrogen, and 46% of the total phosphorus loads, respectively (Figure 47). It has not been possible to allocate these loads to any specific sources, but it is likely that agricultural activities and point-sources are important in these upstream countries, as is the case in the HELCOM countries. Of the Latvian nutrient sources, the diffuse sources are heavily dominating (53% for nitrogen and 40% for phosphorus). Point-sources only make up a small share of the total riverine loads (0.5% for nitrogen, 2% for phosphorus). No information has been reported on the importance of atmospheric deposition. The trans-boundary loads are a very important part of the Lithuanian total nutrient loads to the Baltic Sea (Figure 48), and similar to Latvia, with Belarus as an important source outside the HELCOM 22
23 countries. Trans-boundary nitrogen loads constitute 25% of the total load via Lithuania, and the corresponding proportion for phosphorus is 34%. Also in this case it has been impossible to allocate these loads to any specific sources, but again it is likely that agricultural activities and point-sources are important in these upstream countries, as is the case with the HELCOM countries. Agricultural activities are the major nutrient source for the total Lithuanian loads with 56% for nitrogen, and 42% for phosphorus. The natural background levels are 12% for nitrogen, and 11% for phosphorus, whereas point-sources represent 4% of the nitrogen load and 13% of the phosphorus load. Atmospheric deposition only constitutes a small fraction of the total nutrient load (2% for nitrogen). The nutrient loads from Poland are characterised by comparatively large proportions from agriculture and from point-sources (Figure 49). For phosphorus, the point-sources share is even larger than the agricultural share (42%, and 34%, respectively). For nitrogen, the contrary occurs with 31% from pointsources, and 45% from agricultural activities. The natural background is 16% for nitrogen, and 18% for phosphorus, and the proportion of atmospheric deposition is quite small (3% for nitrogen, 1% for phosphorus). A rather small fraction of the total loads originates in upstream countries, and these trans-boundary loads constitute 4-5% of the total loads that reach the Baltic Sea via Poland. The Russian riverine nutrient loads to the Baltic Sea have been reported to mainly consist of natural background losses (Figure 50). In total 83% of the nitrogen loads are considered to have a natural origin, and the corresponding proportion for phosphorus is 65%. Of the anthropogenic sources, diffuse sources dominate with 10% for nitrogen, and 21% for phosphorus, whereas point-sources constitute 6% of the nitrogen loads, and 14% of the phosphorus loads. No information has been reported on the importance of atmospheric deposition. The nutrient loads from Sweden are to a large degree characterised by a significant proportion of natural background losses (Figure 51), accounting for around 54% of the total nitrogen load, and 66% of the total phosphorus load. Of the anthropogenic nutrient sources, agriculture and point-sources constitute 25% and 11% for the total nitrogen load, and 14%, and 16% respectively for the total phosphorus load. Atmospheric deposition is important in comparison to most other HELCOM countries, especially for nitrogen (10% of total loads), but also for phosphorus (4%). The comparatively large impact of atmospheric deposition is due to the high share of lake surface area in Sweden (approximately 10% of the total land area). Recent national studies estimate that the background nutrient losses from agricultural land in Sweden is in the order of half of the losses reported in the present publication. The anthropogenic impact is correspondingly higher with the same absolute amount. These new findings will be taken into account in future assessments. 23
24 Riverine load in 2014 from DENMARK TN (41,820 tonnes) TP (1,580 tonnes) Figure 43 Riverine load in 2014 from ESTONIA TN (15,883 tonnes) TP (292 tonnes) Figure 44 Riverine load in 2014 from FINLAND TN (69,080 tonnes) TP (2,789 tonnes) Figure 45 24
25 TN riverine load in 2012 from GERMANY (16,593 tonnes) TP riverine load in 2012 from GERMANY (767 tonnes) Riverine load in 2012 from GERMANY TN (16,593 tonnes) TP (767 tonnes) Atmospheric 9,1% Point-sources 9,1% Urban areas 3,8% Point-sources 19,8% Urban areas 21,5% Atmospheric 7,5% Urban areas Point-sources Atmospheric Agriculture Urban areas Point sources Atmospheric Agriculture Urban areas Agriculture 77,9% Urban areas Agriculture 51,2% Figure 46 Note! The data from MSFD reporting were used. In the MSFD reporting Germany did not estimate any natural background losses. Riverine load in 2014 from LATVIA TN (50,074 tonnes) TP (1,500 tonnes) Riverine load in 2014 from LITHUANIA TN (79,633 tonnes) TP (2,374 tonnes) 25
26 Riverine load in 2012 from POLAND TN (107,647 tonnes) TP (6,863 tonnes) Riverine load in 2014 from RUSSIA TN (61,103 tonnes) TP (3,317 tonnes) Riverine load in 2014 from SWEDEN TN (87,751 tonnes) TP (2,792 tonnes) 26
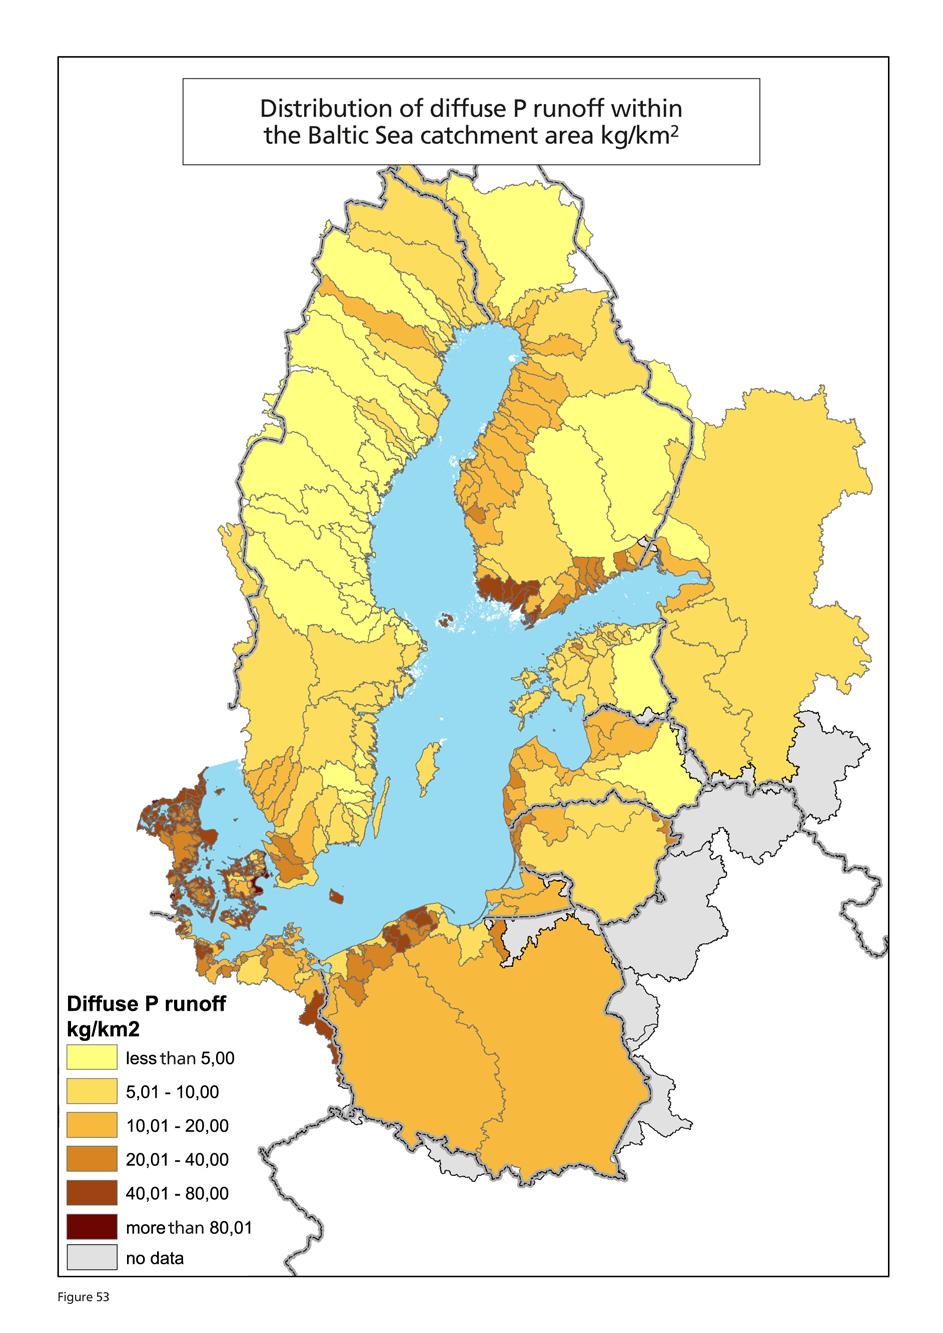
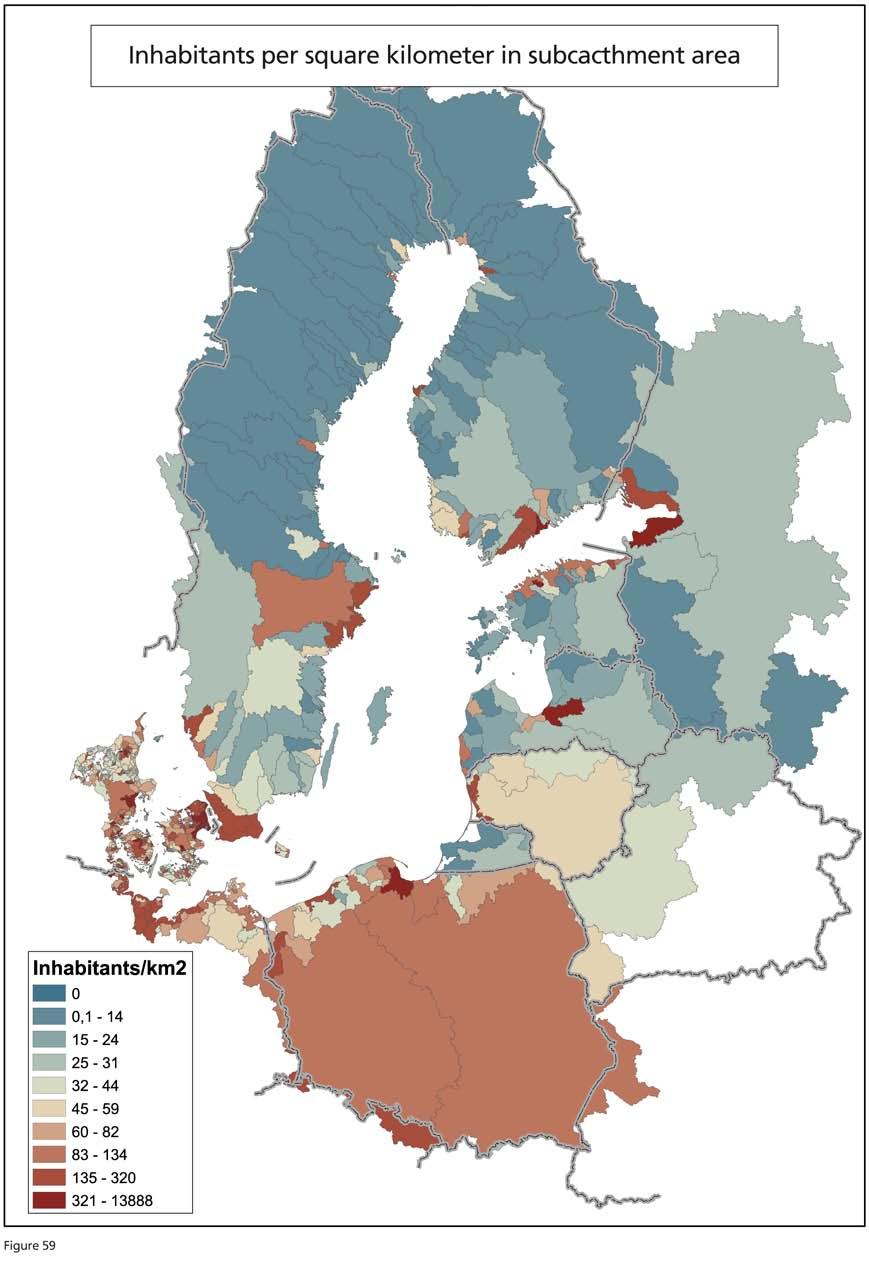
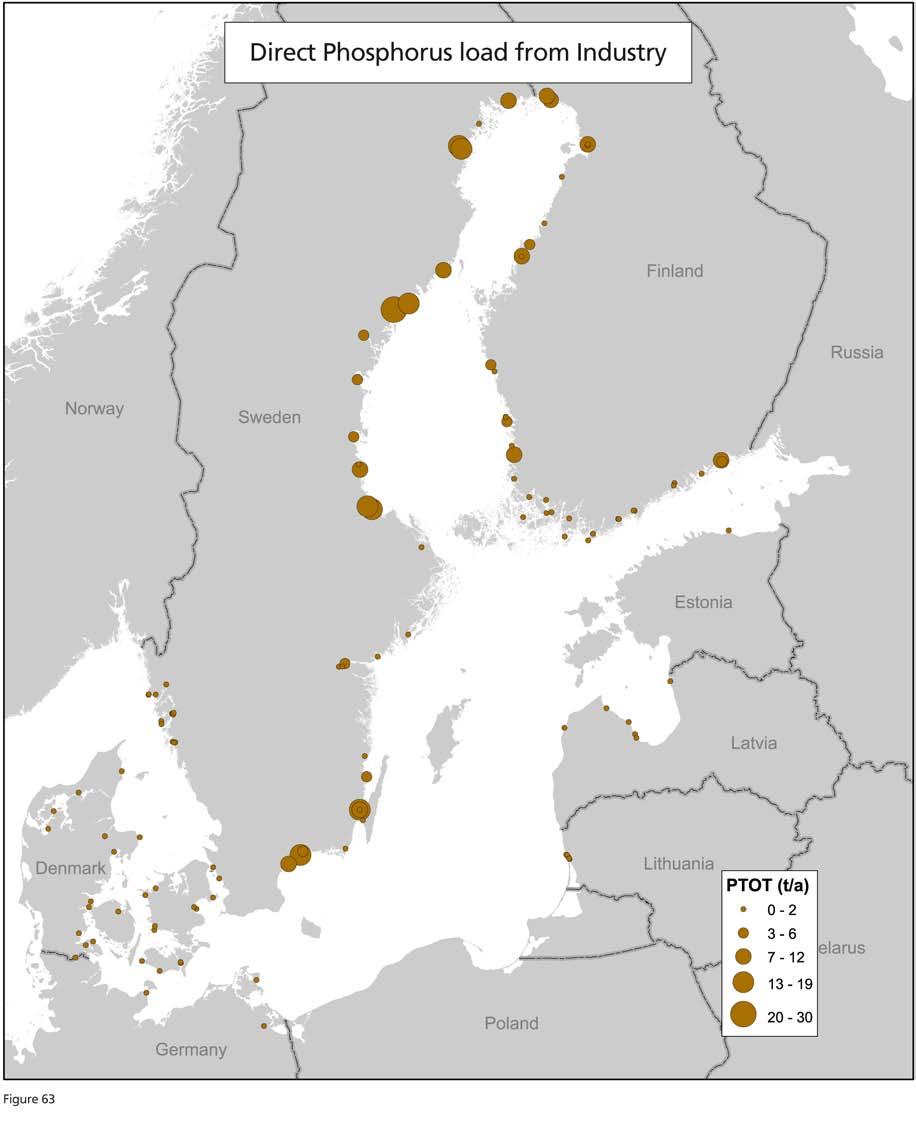
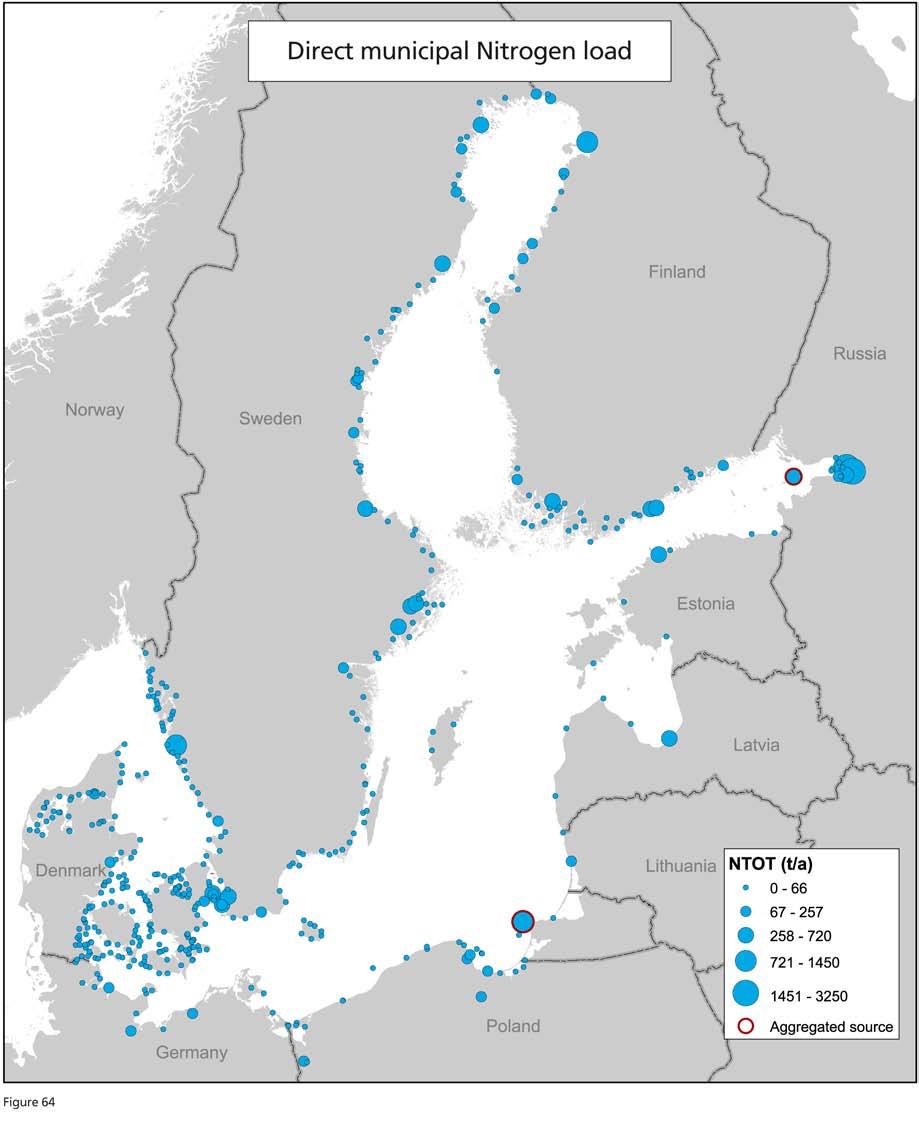
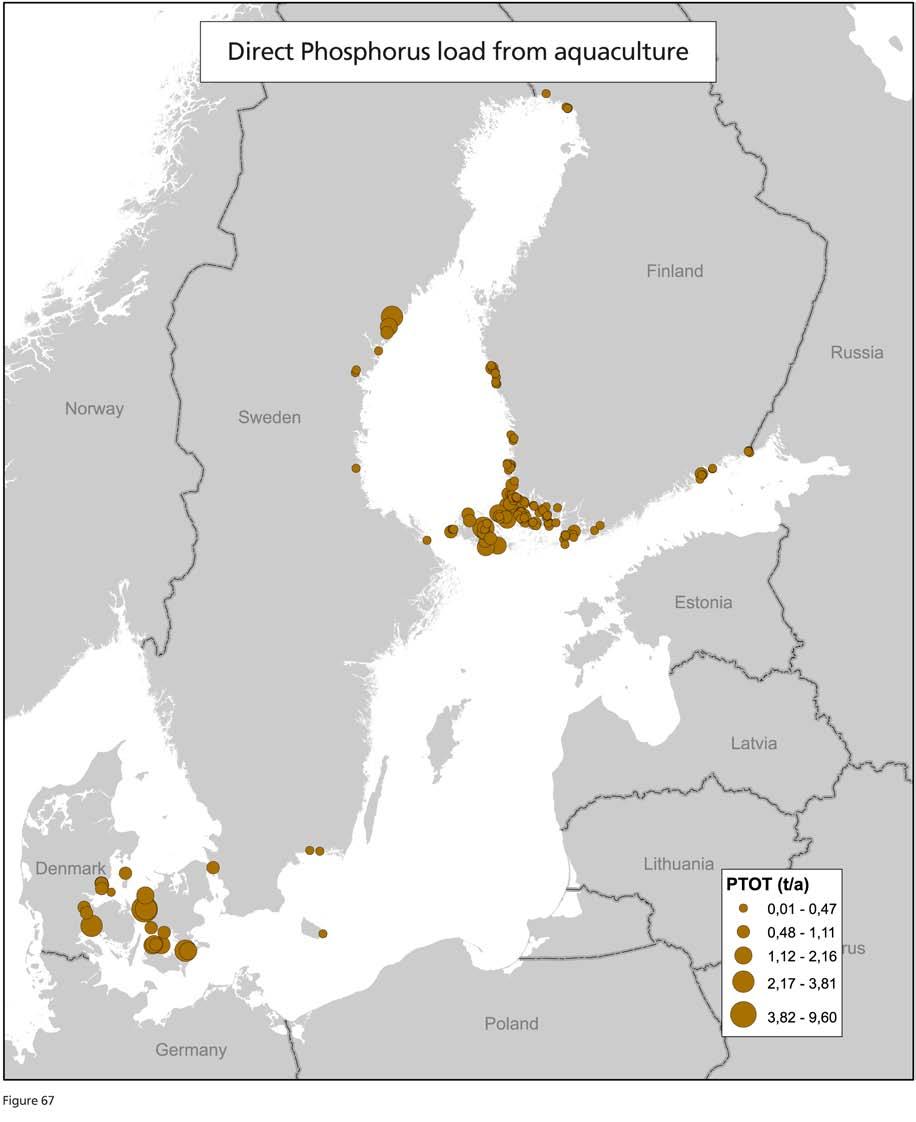
27 Area-specific losses and retention The dominant source of riverine nutrients to the Baltic Sea are the diffuse sources. Since these sources are to a large degree dominated by agricultural nutrient losses, there is a large similarity in the geographical distribution of area-specific 1 nitrogen and phosphorus losses from diffuse sources and agriculture (Figures 52-55), as well as concerning the total riverine area-specific losses (Figures 56-57). In addition, there is also a good agreement between the areas with high diffuse losses as well as agricultural nutrient losses, and the proportion of land used for agriculture (Figure 58). There is also a comparatively good relationship between the diffuse nutrient losses and the number of inhabitants per unit catchment area (Figure 59). The highest area-specific losses are found in the South-Southwestern part of the Baltic Proper, to the Kattegat, as well as in the Eastern part of the Baltic Proper, to the Gulf of Riga and Gulf of Finland (Figures 52-57). Also, the comparatively small Finnish rivers draining into the Bothnian Sea and Bothnian Bay constitute rather high area-specific losses. However, when comparing spatial distributions of area-specific losses, it is necessary to bear in mind that the size of the catchment area is important, since eventual hot-spots in large water systems may be diluted if they are incorporated into large areas with less nutrient input. This is quite evident when comparing the Finnish rivers draining westwards (into the Bothnian Bay and Bothnian Sea) and the small rivers draining into the Gulf of Finland with larger river systems draining to the Gulf of Finland. Also, this could at least partly explain higher areaspecific losses associated with Finish rivers draining into the Bothnian Bay and the Bothnian Sea than the corresponding losses from the considerably larger Swedish rivers draining to the same basins that, like the Finnish rivers systems, are dominated by nutrient loads from large forested areas considered to be close to natural background levels (Figures 60-61). The nutrient loads from direct point-sources are to a large degree dominated by municipal waste water treatment plants (MWWTs), although rather large industrial point-sources exist, especially along the Swedish coast, and to some degree along the Finnish coast (Figures 62-65). Comparatively many smaller MWWTs are found along the Finnish, Swedish and Danish coastlines, whilst the other HELCOM countries mostly have a few larger plants in connection with large coastal cities (Figures 64-65). Nutrient loads from sea-based aquaculture activities mainly have an impact in Finland (Archipelago Sea), Denmark, and to some extent in Sweden (Figures 66-67). Retention of nutrients is defined as the removal or transformation of phosphorus and nitrogen species in surface waters of river systems, including adjoining lakes and during river valley floods. Estimates of retention is necessary for the quantification of nutrient losses, taking into account removal of nutrients on the way form land-based sources to marine environment. Moreover, the retention information may be used to estimate the effect of remedial measures on inland sources that aim to reduce nutrient loads to the sea. Retention is to a large degree influenced by the residence time of the inland water systems. Hence, factors like percentage of surface freshwater and wetlands, and topography, highly influence retention. For example, especially large and deep lakes increase phosphorus removal due to sedimentation. Meanwhile, for nitrogen various kinds of wetlands and periodically flooded areas may influence the de-nitrification, producing nitrogen gas that departs to the atmosphere. The opposite may also occur, especially for phosphorus where the sediments in highly eutrophic lakes may act as an internal phosphorus source. However, in general the longer the water and the nutrients are retained in a water system, the larger the nutrient retention will be, meaning that long river systems often promote higher retention. The factors that affect the retention vary across the Baltic Sea catchment area, which makes it difficult to fully harmonize the methods of calculating nutrient retention in inland surface waters. Hence, the estimated retentions are to be regarded as approximate estimates. Note that the nutrient inputs to the Baltic Sea given by according to the load-oriented approach earlier has already taken the inland retention in freshwater into account as these inputs are the estimated net inputs to the Sea. 1 Area-specific nutrient losses are defined as the amount of nutrients lost or transported per unit area (generally in kg/km2 or formerly kg/ha). It is mainly used to compare nutrient loads from different areas. 27
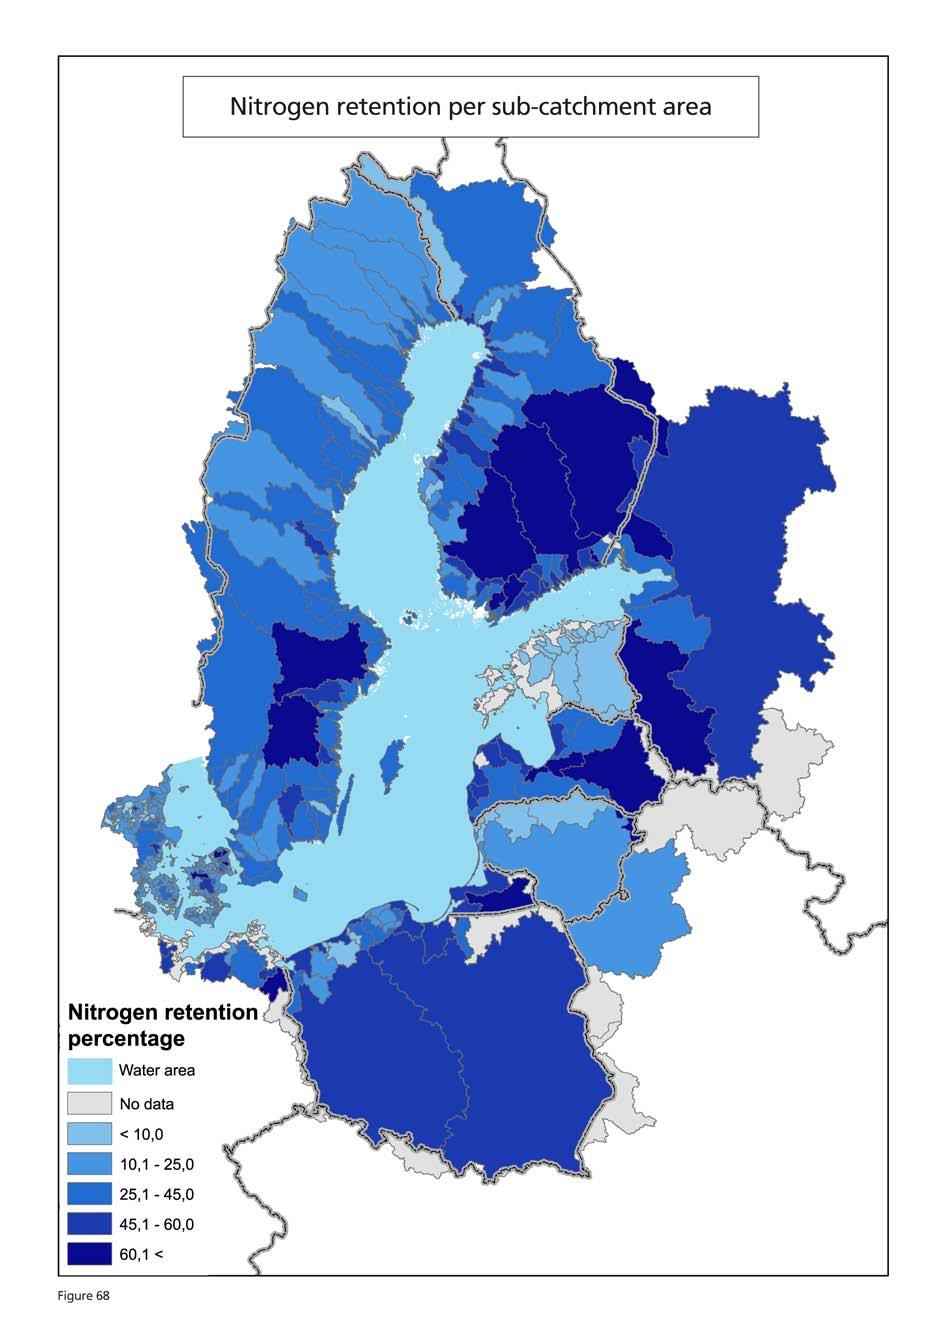
28 The largest proportion of total nitrogen and phosphorus retention in the total river system catchments in 2014 (2012 in Germany and Poland) have been reported for the catchments draining into the Gulf of Finland, as well as from Poland, and some areas in the Southern part of Sweden (Figures 68 and 69, respectively). In addition, for some smaller catchments in Latvia, the Kaliningrad area of Russia, as well as Germany and Denmark both the nitrogen and phosphorus retention has been reported to be high (45 to 88%). For phosphorus, retention in the same range is also reported for Lithuania, and the central part of Sweden (Figure 69). The lowest nutrient retention has been reported for Estonia. However, this low figure is probably not realistic, and more likely due to methodological issues (retention data is lacking from this area), as there is no reason to believe that the nutrient retention in one country or area draining to the Baltic Sea would be just a fraction of the retention in neighboring areas. Also, there are some considerable differences in retention for trans-boundary river systems that probably also result from differences in methodology and/or data availability. An example of this is the Belarusian trans-boundary rivers entering Lithuania, Latvia, and Poland (Figures 68 and 69). 28
29 29
30 30
31 31
32 32
33 33
34 34
35 Agricultural land by subcatchment area (%) Figure 58 35
36 36
37 37
38 38
39 39
40 40
41 41
42 NOTE! Only municipal waste water treatment plants larger than 2000 PE were reported by Estonia. 42
43 43
44 44
45 45
46 46
47 47
48 48
waterborne pollution inputs to the Baltic Sea (PLC-Water)
") PLC-Water HELCOM Guidelines for the annual and periodical compilation and reporting of waterborne pollution inputs to the Baltic Sea (PLC-Water) Baltic Marine Environment Protection Commission Monitoring
PLC-Water HELCOM Guidelines for the annual and periodical compilation and reporting of waterborne pollution inputs to the Baltic Sea (PLC-Water) Baltic Marine Environment Protection Commission Monitoring
pollution load compilation
 RESSURE The sixth pollution load compilation Baltic Marine Environment rotection Commission Monitoring & assessment Document code Date helcom.fi ublished by: Helsinki Commission Katajanokanlaituri 6 B
Fifth Baltic Sea Pollution Load Compilation (PLC-5) An Executive Summary
 An Executive Summary") Baltic Sea Environment Proceedings No. 128A Fifth Baltic Sea Pollution Load Compilation (PLC-5) An Executive Summary Helsinki Commission Baltic Marine Environment Protection Commission Baltic Sea Environment
Baltic Sea Environment Proceedings No. 128A Fifth Baltic Sea Pollution Load Compilation (PLC-5) An Executive Summary Helsinki Commission Baltic Marine Environment Protection Commission Baltic Sea Environment
Outcome of HELCOM Workshop on transboundary inputs and retention
 Baltic Marine Environment Protection Commission HELCOM Workshop on transboundary inputs and retention Uppsala, Sweden, 19 May 2015 Outcome of HELCOM Workshop on transboundary inputs and retention Introduction
Inputs of hazardous substances to the Baltic Sea
 PLC-6 Inputs of hazardous substances to the Baltic Sea Hazardous substances helcom.fi Baltic Marine Environment Protection Commission Baltic Sea Environment Proceedings 162 Published by: Helsinki Commission
HELCOM ENVIRONMENT FOCAL POINT INFORMATION
 HELCOM ENVIRONMENT FOCAL POINT INFORMATION Estimation of atmospheric nitrogen deposition to the Baltic Sea in 2010 based on agreed emission ceilings under the EU NEC Directive and the Gothenburg Protocol:
Baltic Marine Environment Protection Commission
 Baltic Marine Environment Protection Commission Expert Group on follow-up of national progress towards reaching BSAP nutrient reduction targets Riga,Latvia, 12-14 March 2014 Document title Monitoring progress
HELCOM VIEWS ON THE ENVIRONMENTAL STATE OF THE BALTIC SEA. Taking action to combat eutrophication in the Baltic
 HELCOM VIEWS ON THE ENVIRONMENTAL STATE OF THE BALTIC SEA Taking action to combat eutrophication in the Baltic Arturas Daubaras Chairman of the Helsinki Commission at CCB Annual Conference 2005 27-29 May
The seven biggest rivers in the Baltic Sea region
 PLC-6 The seven biggest rivers in the Baltic Marine Environment Protection Commission Nutrient inputs Baltic Sea Environment Proceedings 163 helcom.fi Published by: Helsinki Commission Katajanokanlaituri
Evaluation of transboundary pollution loads
 HELCOM ENVIRONMENTAL FOCAL POINT INFORMATION Evaluation of transboundary pollution loads Helsinki Commission Baltic Marine Environment Protection Commission Contents Abstract..............................................
BALTIC SEA ENVIRONMENT PROCEEDINGS
 4 BALTIC SEA ENVIRONMENT PROCEEDINGS No. 89 THE REVIEW OF MORE SPECIFIC TARGETS TO REACH THE GOAL SET UP IN THE 1988/1998 MINISTERIAL DECLARATIONS REGARDING NUTRIENTS HELSINKI COMMISSION Baltic Marine
Appendix C: Baltic Sea Environment Fact Sheets
 Appendix C: Baltic Sea Environment Fact Sheets Here we present the Baltic Sea Environment Fact Sheets which later on will be available on HELCOM web pages: Nitrogen emissions Nitrogen depositions: Heavy
Baltic Marine Environment Protection Commission
 Baltic Marine Environment Protection Commission 12th Meeting of the Sixth Baltic Sea Pollution Load Compilation Project (PLC-6) Helsinki, Finland, 14-16 September 2016 PLC-6 12-2016 Document title Status
Appendix C: Baltic Sea Environment Fact Sheets
 Appendix C: Baltic Sea Environment Fact Sheets Here we present the Baltic Sea Environment Fact Sheets which later on will be available on HELCOM web pages: Nitrogen emissions Nitrogen depositions Heavy
Estimation of atmospheric nitrogen deposition to the Baltic Sea in the periods and
 Estimation of atmospheric nitrogen deposition to the Baltic Sea in the periods 1997-23 and 2-26 Summary Report for HELCOM Jerzy Bartnicki and Semeena Valiyaveetil Meteorological Synthesizing Centre-West
HELSINKI COMMISSION Baltic Marine Environment Protection Commission
 HELSINKI COMMISSION Baltic Marine Environment Protection Commission Arturas Daubaras Chairman of HELCOM COALITION CLEAN BALTIC - ANNUAL CONFERENCE 2005 KALININGRAD, RUSSIA, 27-29 MAY 2005 HELCOM VIEWS
FINMARINET results in the Baltic context. Maria Laamanen, HELCOM Professional Secretary FINMARINET final conference 10 April 2013, Helsinki, Finland
 FINMARINET results in the Baltic context Maria Laamanen, HELCOM Professional Secretary FINMARINET final conference 10 April 2013, Helsinki, Finland FINMARINET Has increased the data and information as
How the combat against eutrophication has progressed? and what should we do next?
 How the combat against eutrophication has progressed? and what should we do next? Samuli Korpinen Finnish Environment Institute Photo: Riku Lumiaro The latest state of eutrophication BENTHIC FAUNA Offshore
HELSINKI COMMISSION HELCOM MONAS INDICATOR WORKSHOP 1/2004 Monitoring and Assessment Group First Meeting Helsinki, Finland, May 2004
 HELSINKI COMMISSION HELCOM MONAS INDICATOR WORKSHOP 1/2004 Monitoring and Assessment Group First Meeting Helsinki, Finland, 12-14 May 2004 Agenda Item 2 HELCOM indicators Document code: 2/16 Date: 10.5.2004
Baltic Sea Catchment Modelling
 Baltic Sea Catchment Modelling BNI Catchment characteristics and threads CSIM model Modelling eutrophication issues and N and P fluxes Isotope studies in AMBER Christoph Humborg, Carl-Magnus Mörth, Erik
Baltic Marine Environment Protection Commission
 Baltic Marine Environment Protection Commission 16 th Meeting of the Sixth Baltic Sea Pollution Load Compilation Project (PLC-6) Tallinn, Estonia, 18-20 September 2017 PLC-6 16-2017 Document title Status
Costs of nutrient reductions to the Baltic Sea- technical report.
 Costs of nutrient reductions to the Baltic Sea- technical report. Ing-Marie Gren, Ylva Jonzon, Martin Lindqvist Swedish University of Agricultural Sciences (SLU) Working Paper Series 2008:1 Department
3. Atmospheric Supply of Nitrogen to the Baltic Sea in 2015
 3. Atmospheric Supply of Nitrogen to the Baltic Sea in 2015 In this chapter we present the results of the model simulation of atmospheric transport and deposition of nitrogen to the Baltic Sea for the
Indicator Fact Sheet (WEU7) Source apportionment and loads (riverine and direct) of nutrients to coastal waters
 Source apportionment and loads (riverine and direct) of nutrients to coastal waters") Indicator Fact Sheet (WEU7) Source apportionment and loads (riverine and direct) of nutrients to coastal waters Authors: Gunni Ærtebjerg (NERI) and Steve Nixon (WRc) EEA project manager: Niels Thyssen
Indicator Fact Sheet (WEU7) Source apportionment and loads (riverine and direct) of nutrients to coastal waters Authors: Gunni Ærtebjerg (NERI) and Steve Nixon (WRc) EEA project manager: Niels Thyssen
The national-level nutrient loading estimation tool for Finland: Watershed Simulation and Forecasting System WSFS-Vemala
 The national-level nutrient loading estimation tool for Finland: Watershed Simulation and Forecasting System WSFS-Vemala Markus Huttunen, Finnish Environment Institute SYKE, HELCOM workshop on transboundary
DESCRIPTION OF THE SIXTH BALTIC SEA POLLUTION LOAD COMPILATION (PLC-6) PROJECT
 PROJECT") PLC6 assessment: Collecting information allowing for an evaluation of the effect off measures taken on nitrogen and phosphorus inputs to the Baltic Sea According the PROJECT DESCRIPTION OF THE SIXTH BALTIC
PLC6 assessment: Collecting information allowing for an evaluation of the effect off measures taken on nitrogen and phosphorus inputs to the Baltic Sea According the PROJECT DESCRIPTION OF THE SIXTH BALTIC
Nya beting för Baltic Sea Action Plan. Bo Gustafsson och medarbetare på BNI
 Nya beting för Baltic Sea Action Plan Bo Gustafsson och medarbetare på BNI ü Klart va(en ü Närsaltkoncentra1oner nära naturliga nivåer ü Naturlig omfa(ning av algblomningar ü Naturliga fördelningar av
8. Atmospheric Supply of Lindane to the Baltic Sea in 2002
 8. Atmospheric Supply of Lindane to the Baltic Sea in 22 This chapter presents a short description of model evaluation of lindane atmospheric input to the Baltic Sea, its sub-basins and catchment area
3. Atmospheric Supply of Nitrogen to the Baltic Sea in 2010
 3. Atmospheric Supply of Nitrogen to the Baltic Sea in 2010 Nitrogen emission data, as well as the model results presented here have been approved by the 36 th Session of the Steering Body of EMEP in Geneva
Baltic Marine Environment Protection Commission
 Baltic Marine Environment Protection Commission Fourth Meeting of the Working Group on Reduction of Pressures from the Baltic Sea Catchment Area Gothenburg, Sweden, 19-21 April 2016 PRESSURE 4-2016 Document
The Baltic Sea circumstances significant for its critical infrastructure networks
 BogaleckaMagda Kołowrocki Krzysztof Maritime University, Gdynia, Poland Journal of Polish Safety and Reliability Association Summer Safety and Reliability Seminars, Volume 7, Number 2, 2016 The Baltic
4. Spatial and temporal coverage of data
 4. Spatial and temporal coverage of data Monitoring is a prerequisite to assess the state of the environment. Measurements for such an assessment are subject to uncertainty, due to natural variability
Protection of the Baltic Sea - From the programmes to the actions
 Protection of the Baltic Sea - From the programmes to the actions Saara Bäck Ministry of the Environment 1 The Baltic Sea 90 million people living in the catchment area (14 states, 4 times bigger than
Climate change and its implications on Baltic Sea marine environment and HELCOM work
 Climate change and its implications on Baltic Sea marine environment and HELCOM work Maria Laamanen, HELCOM Professional Secretary 2nd Policy Forum Climate Change Adaptation in the Baltic Sea Region 10-11
Project Integrated Nitrogen Management System for the Gulf of Riga (GURINIMAS): Introduction to Project
: Introduction to Project") Project Integrated Nitrogen Management System for the Gulf of Riga (GURINIMAS): Introduction to Project Tanel Mätlik, Project Manager, Gravitas Consult LLC Background Stringent environmental legislation
Project Integrated Nitrogen Management System for the Gulf of Riga (GURINIMAS): Introduction to Project Tanel Mätlik, Project Manager, Gravitas Consult LLC Background Stringent environmental legislation
ECGS-501 Management of environmental problems in aquatic ecosystems
 ECGS-501 Management of environmental problems in aquatic ecosystems LECTURE 9 Cost-efficient nutrient abatement, cost-benefit analysis, Kari Hyytiäinen Past nutrient loading NITROGEN PHOSPHORUS 1400000
Trends in arrival of new non-indigenous species
 Authors Manfred Rolke, Monika Michalek, Malin Werner, Maiju Lehtiniemi, Solvita Strake, Alexander Antsulevich & Anastasija Zaiko. Acknowledged persons Paulina Brzeska, Elena Gorokhova, Bożenna Kaczmaruk
Spatial Distribution of the Winter Nutrient Pool
 Spatial Distribution of the Winter Nutrient Pool Author: Philip Axe, Swedish Meteorological and Hydrological Institute Key message Good news: DIN concentrations remain below those observed in the 1990s,
HELCOM workshop on status of nutrient bookkeeping in the Baltic Sea countries April, Oldenburg, Germany
 HELCOM workshop on status of nutrient bookkeeping in the Baltic Sea countries 28-29 April, Oldenburg, Germany Introduction HELCOM workshop on status of nutrient bookkeeping in the Baltic Sea countries:
HELCOM Baltic Sea Impact Index and its use in Maritime Spatial Planning
 Baltic Marine Environment Protection Commission Report by HELCOM Secretariat, HASPS 2 project July 2018 HELCOM Baltic Sea Impact Index and its use in Maritime Spatial Planning Introduction HELCOM (Baltic
Marginal benefits of reducing nutrient loads to the Baltic Sea
 Marginal benefits of reducing nutrient loads to the Baltic Sea Lassi Ahlvik* and Heini Ahtiainen MTT Agrifood Research Finland Latokartanonkaari 9 00790 Helsinki * Corresponding author, lassi.ahlvik@mtt.fi
The Nitrates Directive Implementation
 The Nitrates Directive Implementation Marco Bonetti DG Environment, European Commission ENV B1-Agriculture, Forests & Soil BFFE Conference on Agricultural Water Protection and Sustainable Food Production
Baltic Marine Environment Protection Commission
 Baltic Marine Environment Protection Commission Project for the development of the second holistic assessment of the Baltic Sea Helsinki, Finland, 26-28 April 2016 HOLAS II 5-2016 Document title Proposal
AMENDMENTS TO ANNEX III OF THE HELSINKI CONVENTION CONCERNING REGULATIONS ON PREVENTION OF POLLUTION FROM AGRICULTURE
 CONVENTION ON THE PROTECTION OF THE MARINE ENVIRONMENT OF THE BALTIC SEA AREA HELSINKI COMMISSION - Baltic Marine HELCOM 19/98 Environment Protection Commission 15/1 Annex 16 19th Meeting Helsinki, 23-27
Outcome of HELCOM SPICE workshop on eutrophication assessment
 Baltic Marine Environment Protection Commission HELCOM SPICE Workshop on eutrophication assessment Helsinki, Finland, 14 March 2017 Document title Outcome of the HELCOM SPICE Workshop on eutrophication
Agricultural phosphorus losses and eutrophication in Nordic-Baltic countries
 Agricultural phosphorus losses and eutrophication in Nordic-Baltic countries Petri Ekholm Finnish Environment Institute (SYKE) NJF 401: Phosphorus management in Nordic-Baltic agriculture - reconciling
The HELCOM Working Group on Agriculture (WGA)
") E. Schnug, R. Sparovek, W. Storck, A. Jering and U. Volkgenannt / Landbauforschung Völkenrode 1/2(51):5-9 5 The HELCOM Working Group on Agriculture (WGA) Ewald Schnug *, Roberta Sparovek *, Wolfgang Storck
E. Schnug, R. Sparovek, W. Storck, A. Jering and U. Volkgenannt / Landbauforschung Völkenrode 1/2(51):5-9 5 The HELCOM Working Group on Agriculture (WGA) Ewald Schnug *, Roberta Sparovek *, Wolfgang Storck
Status of Nemunas catchment area in Lithuania
 «Improving water quality in the Neman catchment area through rewetting, wise wetland and river basin management» Status of Nemunas catchment area in Lithuania Ricardas Paskauskas, Nature Research Centre,
B A L T I C S E A E N V I R O N M E N T P R O C E E D I N G S
 B A L T I C S E A E N V I R O N M E N T P R O C E E D I N G S No. 70 THE THIRD BALTIC SEA POLLUTION LOAD COMPILATION (PLC 3) HELSINKI COMMISSION Baltic Marine Environment Protection Commission 1998 1 For
Balt-HYPE: a tool for high resolution hydrological modelling of the Baltic basin
 Balt-HYPE: a tool for high resolution hydrological modelling of the Baltic basin Assoc. Prof., Dr. Berit Arheimer Head of Hydrological Research Swedish Meteorological and Hydrological Institute (SMHI)
Atmospheric emissions of PCB-153 in the Baltic Sea region
 Atmospheric emissions of PCB-153 in the Baltic Sea region Author: Alexey Gusev, EMEP MSC-E Key Message Annual emissions of PCB-153 in HELCOM countries have decreased during the period from 1990 to 2016
Dissolved inorganic nitrogen (DIN)
") Dissolved inorganic nitrogen (DIN) Key Message HELCOM core indicator report July 2017 The core indicator evaluates average dissolved inorganic nitrogen concentration in the surface (0 10 m) during winter
Dissolved inorganic nitrogen (DIN) Key Message HELCOM core indicator report July 2017 The core indicator evaluates average dissolved inorganic nitrogen concentration in the surface (0 10 m) during winter
Water clarity. Key Message
 Water clarity Key Message HELCOM core indicator report July 2018 This core indicator evaluates water clarity based on average Secchi depth during summer (June September) during the assessment period 2011-2016.
Baltic Marine Environment Protection Commission
 Baltic Marine Environment Protection Commission HELCOM SPICE Workshop on hazardous substances assessment Helsinki, Finland, 16 March 2017 Document title CHASE on assessment unit scale 3 Code Document 5
Progress on the update of the State of the Baltic Sea report
 Progress on the update of the State of the Baltic Sea report Work still planned 2 General HOLAS II 9-2018 recommended changing the name of the supplementary reports to thematic assessments. State of the
High resolution water quality monitoring data for evaluating process-based models (?)
") High resolution water quality monitoring data for evaluating process-based models (?) Temporal high resolution water quality monitoring and analysis workshop 21.-22. July 2014, Magdeburg, Germany René
High resolution water quality monitoring data for evaluating process-based models (?) Temporal high resolution water quality monitoring and analysis workshop 21.-22. July 2014, Magdeburg, Germany René
Draft HELCOM Recommendation on sewage sludge handling. Dmitry Frank-Kamenetsky HELCOM
 Draft HELCOM Recommendation on sewage sludge handling Dmitry Frank-Kamenetsky HELCOM Total sludge volumes in tonnes of dry solids per year (tds/a) of different countries of the Baltic Sea Region reported
Improving manure recycling in agriculture an important step towards closing the phosphorus cycle
 1 (7) Improving manure recycling in agriculture an important step towards closing the phosphorus cycle Phosphorus is a finite resource; efficient usage and recycling are essential. Recycling human sewage
What should be done to heal the Baltic Sea?
 What should be done to heal the Baltic Sea? Mr. Mikhail Durkin, HELCOM Professional Secretary Towards a cleaner and healthier Baltic Sea Public hearing of the Committee on the Environment, Public Health
Executive summary - International evaluation of the Danish marine models
 Miljø- og Fødevareudvalget 2017-18 MOF Alm.del Bilag 35 Offentligt Executive summary - International evaluation of the Danish marine models To be published after the hearing of the evaluation report 10.
Baltic Sea Region Climate Change Adaptation Strategy
 Baltic Sea Region Climate Change Adaptation Strategy Project type: EU INTERREG IV B project Period: 36 months Kick-off meeting: 10-12 January 2011 HELCOM HABITAT meeting 24 May 2012 Susanne Altvater Ecologic
CAP CONTEXT INDICATORS
 CAP CONTEXT INDICATORS 2014-2020 40. WATER QUALITY 2017 update CONTEXT INDICATOR 40: WATER QUALITY Water quality is assessed through the Gross Nutrient Balance and nitrates in freshwater The nitrogen surplus
Executive summary. Pressures
 6 Groundwater quality and quantity in Europe Executive summary Groundwater is a major source of drinking water all over Europe, and thus the state of groundwater in terms of quality and quantity is of
Photo: Jukka Nurminen
 Photo: Jukka Nurminen John Nurminen Foundation originates from the John Nurminen family company, which started as a trading house and shipping company in Rauma in 1886. established in 1992 on the initiative
Manual for Marine Monitoring in the COMBINE. Programme of HELCOM. Part C Programme for monitoring of eutrophication and its effects
 Manual for Marine Monitoring in the COMBINE Programme of HELCOM Part C Programme for monitoring of eutrophication and its effects Last updated: 31.03.2006 PART C PROGRAMME FOR MONITORING OF EUTROPHICATION
Activities of relevant HELCOM projects or processes
 HELSINKI COMMISSION HELCOM GEAR 2/2012 HELCOM Group for the Implementation of the Ecosystem Approach Second Meeting Gothenburg, Sweden, 22-24 October 2012 Agenda Item 3 Activities of relevant HELCOM projects
PC.DEL/858/07 7 September 2007
 Organization for Security and Co-operation in Europe Secretariat PC.DEL/858/07 7 September 2007 ENGLISH Original: RUSSIAN Conference Services Please find attached the presentation by Mr. Aliaksandr Stankevich,
Baltic farmers admit water pollution by agriculture but expect improved evidence
 POLICY BRIEF Baltic farmers admit water pollution by agriculture but expect improved evidence One of the goals of the report The Role of River Basin Management Plans in 5 Baltic Sea countries in addressing
LNG fuel distribution strategy for the BSR v5
 LNG fuel distribution strategy for the BSR v5 Introduction The land-based and the maritime LNG market will be closely connected in the future. With stricter emission restrictions, more ships will be built
HELSINKI COMMISSION HELCOM MONAS 8/2005 Monitoring and Assessment Group Eighth Meeting Riga, Latvia, November 2005
 HELSINKI COMMISSION HELCOM MONAS 8/2005 Monitoring and Assessment Group Eighth Meeting Riga, Latvia, 21-25 November 2005 Agenda Item 7 HELCOM projects under HELCOM MONAS Document code: 7/6 Date: 14.11.2005
Implementing the Water Framework a Finnish View. Antton Keto EPA National Water Event th June 2013
 Implementing the Water Framework a Finnish View Antton Keto EPA National Water Event 2013 12-13 th June 2013 Environmental Administration Finland s environmental administration The Ministry of the Environment
Ex-Post Evaluation - INTERREG III PROGRAMME: INTERREG III B Baltic Sea
 Ex-Post Evaluation - INTERREG III 2000-2006 PROGRAMME: INTERREG III B Baltic Sea TRABANT - Transnational River Basin Districts on the Eastern Side of the Baltic Sea Network Project Good Practice Study
Introduction for the VillageWaters workshop. Kati Räsänen Natural Resources Institute Finland, Luke
 Introduction for the VillageWaters workshop Kati Räsänen Natural Resources Institute Finland, Luke VillageWaters benchmarking session between pilots, period 5 Riga, Latvia 14th of March 2018 VillageWaters
Measures to Restore and Protect the Baltic Sea Environment
 Limnologica 29 (1999) 212-217 LIMNOLO GICA http://www.urbanfischer.de/j ournals/limno by Urban & Fischer Verlag Helsinki Commission - Baltic Marine Environment Protection Commission, Executive Secretary,
1(14) London group Viveka Palm Marianne Eriksson
 London group Viveka Palm Marianne Eriksson") Date 22 09 2004 1(14) London group Viveka Palm Marianne Eriksson Water accounts by water district Key-words: water use, water emissions, costs, disaggregation to water districts, driving forces, regional
Date 22 09 2004 1(14) London group Viveka Palm Marianne Eriksson Water accounts by water district Key-words: water use, water emissions, costs, disaggregation to water districts, driving forces, regional
Where and why did it start, what are we aiming for?
 Where and why did it start, what are we aiming for? BEST Better Efficiency for Industrial Sewage Treatment Kajsa Rosqvist, Project Manager City of Helsinki Environment Services Kick off 6.2.2018, Helsinki
COMMISSION OF THE EUROPEAN COMMUNITIES COMMISSION STAFF WORKING DOCUMENT. Annex to the
 COMMISSION OF THE EUROPEAN COMMUNITIES Brussels, 22.3.2007 SEC(2007) 363 COMMISSION STAFF WORKING DOCUMENT Annex to the COMMUNICATION FROM THE COMMISSION TO THE EUROPEAN PARLIAMENT AND THE COUNCIL 'Towards
ATOMIC BALTIC. Atomic Threats In The Baltic Sea Region. Turku, January 16, 2015
 ATOMIC BALTIC Atomic Threats In The Baltic Sea Region Turku, January 16, 2015 Contents 1. Baltic Sea A unique community 2. Aspects of radioactive threats 3. New construction overview 4. Atomic policies
Experiences from Union of Baltic Cities. Jarkko Virtanen
 20 years of regional cooperation! Experiences from Union of Baltic Cities Jarkko Virtanen Deputy Mayor, City of Turku Vice President, Unio on of the Baltic Cities Union of the Baltic Cities UBC Founded
ATOMIC BALTIC. Atomic Threats In The Baltic Sea Region. Mielno, January 26, 2015
 ATOMIC BALTIC Atomic Threats In The Baltic Sea Region Mielno, January 26, 2015 Contents 1. Baltic Sea A unique community 2. Aspects of radioactive threats 3. New construction overview 4. Atomic policies
ATOMIC BALTIC. Atomic Threats In The Baltic Sea Region. Amsterdam, De Peper, October 1, 2014
 ATOMIC BALTIC Atomic Threats In The Baltic Sea Region Amsterdam, De Peper, October 1, 2014 Contents 1. Baltic Sea A unique community 2. Aspects of radioactive threats 3. New construction overview 4. Atomic
THE INTEGRATED ASSESSMENT OF EUTROPHICATION
 THE INTEGRATED ASSESSMENT OF EUTROPHICATION TO BE UPDATED IN 2018 -Supplementary Report to the First Version of the 'State of the Baltic Sea' Report 2017 HELCOM BALTIC MARINE ENVIRONMENT PROTECTION COMMISSION
ATOMIC BALTIC. Atomic Threats In The Baltic Sea Region. Amsterdam, De Peper, October 1, 2014
 ATOMIC BALTIC Atomic Threats In The Baltic Sea Region Amsterdam, De Peper, October 1, 2014 Contents 1. Baltic Sea A unique community 2. Aspects of radioactive threats 3. New construction overview 4. Atomic
SPEEDING UP THE ECOLOGICAL RECOVERY OF THE BALTIC SEA
 SPEEDING UP THE ECOLOGICAL RECOVERY OF THE BALTIC SEA Esa Salminen, Ph.D. Vahanen Environment Oy Photograph: Janne Gröning SPEEDING UP THE ECOLOGICAL RECOVERY OF THE BALTIC SEA Assessment of: 1. the contribution
BALTIC SEA ENVIRONMENT PROCEEDINGS. No. 88 THE BALTIC SEA JOINT COMPREHENSIVE ENVIRONMENTAL ACTION PROGRAMME (JCP) - TEN YEARS OF IMPLEMENTATION -
 - TEN YEARS OF IMPLEMENTATION -") BALTIC SEA ENVIRONMENT PROCEEDINGS No. 88 THE BALTIC SEA JOINT COMPREHENSIVE ENVIRONMENTAL ACTION PROGRAMME (JCP) - TEN YEARS OF IMPLEMENTATION - HELSINKI COMMISSION Baltic Marine Environment Protection
BALTIC SEA ENVIRONMENT PROCEEDINGS No. 88 THE BALTIC SEA JOINT COMPREHENSIVE ENVIRONMENTAL ACTION PROGRAMME (JCP) - TEN YEARS OF IMPLEMENTATION - HELSINKI COMMISSION Baltic Marine Environment Protection
3. Atmospheric Supply of Nitrogen to the Baltic Sea in 2013
 3. Atmospheric Supply of Nitrogen to the Baltic Sea in 2013 All nitrogen depositions have been calculated for the year 2013 with the EMEP MSC-W model, based on the latest emission data submitted to CEIP
AMENDMENTS TO ANNEX III CRITERIA AND MEASURES CONCERNING THE PREVENTION OF POLLUTION FROM LAND-BASED SOURCES OF THE 1992 HELSINKI CONVENTION
 CONVENTION ON THE PROTECTION OF THE MARINE ENVIRONMENT OF THE BALTIC SEA AREA HELSINKI COMMISSION - Baltic Marine HELCOM 21/2000 Environment Protection Commission Minutes of the Meeting 21st Meeting Annex
ECONOMIC AND SOCIAL ANALYSES IN THE BALTIC SEA REGION
 ECONOMIC AND SOCIAL ANALYSES IN THE BALTIC SEA REGION to be updated in 2018 -Supplementary Report to the First Version of the HELCOM State of the Baltic Sea report 2017 HELCOM BALTIC MARINE ENVIRONMENT
Swedish experiences on the importance of N and P
 Danish Coastal Eutrophication Conference Copenhagen 213-6-19 Swedish experiences on the importance of N and P Ragnar Elmgren & Ulf Larsson Dept. Ecology, Environment & Plant Sciences Stockholm University
Proposal by Lithuania for deletion of the Hot Spot No. 41 Šiauliai WWTP
 Proposal by Lithuania for deletion of the Hot Spot No. 41 Šiauliai WWTP 1. Name of the Hot Spot Šiauliai wastewater treatment plant. 2. No. of the Hot Spot 41 3. Location Šiauliai, Lithuania 4. Reason
The Baltic Marine Environment
 Baltic Sea Environment Proceedings No. 87 The Baltic Marine Environment 1999 22 Helsinki Commission Baltic Marine Environment Protection Commission 23 The Baltic Marine Environment 1999 22 Helsinki Commission
Table of Contents Foreword Climate Change, Adaptation and the Baltic Sea Coastal Regions and Climate Change European Union Adaptation Policy
 Foreword In light of projected climate change impacts in the Baltic Sea region, there is a strong need for enhanced understanding about adaptation needs. In this regard, the role of local level decision
20 YEARS OF EIB FINANCING FOR A CLEANER BALTIC SEA
 20 YEARS OF EIB FINANCING FOR A CLEANER BALTIC SEA Marco Beros Projects Directorate EUROPEAN INVESTMENT BANK PURE FINAL CONFERENCE IN GDANSK Gdansk, October 16, 2012 1 CONTENTS 1. Brief Presentation of
Assessment of water quality for European water bodies
 Assessment of water quality for European water bodies Bouraoui F., Grizzetti B., Malago A., Vigiak O., Pastori M., A. Udias, Karabulut A., Aloe A., Bidoglio G. Water Resources Unit European Commission
Assessment of water quality for European water bodies
 Assessment of water quality for European water bodies Bouraoui F., Grizzetti B., Malago A., Vigiak O., Pastori M., A. Udias, Karabulut A., Aloe A., Bidoglio G. Water Resources Unit European Commission
Transboundary pollution generated by industrial animal production in the Baltic Sea Region
 Transboundary pollution generated by industrial animal production in the Baltic Sea Region Jakub Skorupski GREEN FEDERATION GAJA 2012 Definitions Industrial animal production intensive rearing, maintenance
Implementing the European Water Framework Directive at local to regional level
 INSTITUTIONEN FÖR NATURGEOGRAFI OCH KVARTÄRGEOLOGI Implementing the European Water Framework Directive at local to regional level Case Study Northern Baltic Sea River Basin District, Sweden Ingela Andersson
Baltic Marine Environment Protection Commission
 Baltic Marine Environment Protection Commission HELCOM RECOMMENDATION 37/3 Adopted 11 March 2016, having regard to Article 20, Paragraph 1 b) of the Helsinki Convention SUSTAINABLE AQUACULTURE IN THE BALTIC
Indicator Fact Sheet (WEU13) Chlorophyll-a concentrations in transitional, coastal and marine waters
 Chlorophyll-a concentrations in transitional, coastal and marine waters") Indicator Fact Sheet (WEU13) Chlorophyll-a concentrations in transitional, coastal and marine waters Authors: Gunni Ærtebjerg and Jacob Carstensen (NERI) EEA project manager: Niels Thyssen Indicator code
Indicator Fact Sheet (WEU13) Chlorophyll-a concentrations in transitional, coastal and marine waters Authors: Gunni Ærtebjerg and Jacob Carstensen (NERI) EEA project manager: Niels Thyssen Indicator code
Regional variation in N vs. P limitation in the Baltic Sea the role of sediment mineralisation processes
 Regional variation in N vs. P limitation in the Baltic Sea the role of sediment mineralisation processes Petri Ekholm & Jouni Lehtoranta Finnish Environment Institute (SYKE) COST869 Mitigation options