Thompson Nicola Regional District. Thompson-Nicola Regional District Draft Solid Waste Management Plan August 31 st 2017
|
|
|
- Mabel Payne
- 5 years ago
- Views:
Transcription


1 Thompson Nicola Regional District ThompsonNicola Regional District Draft Solid Waste Management Plan August 31 st 2017
2 CONFIDENTIALITY AND COPYRIGHT This document is for the sole use of the addressee and Sperling Hansen Associates Inc. The document contains proprietary and confidential information that shall not be reproduced in any manner or disclosed to or discussed with any other parties without the express written permission of Sperling Hansen Associates Inc. Information in the document is to be considered the intellectual property of Sperling Hansen Associates Inc. in accordance with Canadian copyright law. This report was prepared by Sperling Hansen Associates Inc. for the account of Thompson Nicola Regional District. The material in it reflects the best judgment of Sperling Hansen Associates Inc. in the light of the information available to it, at the time of preparation. Any use which a third party makes of this report, or any reliance on or decisions to be made based on it, are the responsibility of such third parties. Sperling Hansen Associates Inc. accepts no responsibility for damages, if any, suffered by third party as a result of decisions made or actions based on this report.
3 Landfill Engineering Landfill Gas Management Solid Waste Planning Environmental Monitoring Landfill Fire Control August 31 st, 2017 SHA PRJ16048 Mr. Jake Devlin, P.Eng Director of Environmental Services ThompsonNicola Regional District RE: Thompson Nicola Regional District Solid Waste Management Plan Review Draft Solid Waste Management Plan Dear Jake This document presents a DRAFT Solid Waste Management Plan that has been completed by Sperling Hansen Associates (SHA), together with Maura Walker Associates (MWA) and Jan Enns Communications (JEC). This plan has been completed in accordance with the Ministry of Environment s A Guide to Solid Waste Management Planning. This report is organized into six sections as follows: 1) Introduction and Overview, 2) Background, 3) Goals, Strategies and Actions, 4) Finance and Administration, 5) Plan Implementation, and 6) Plan Schedules. The Draft Plan has been completed based on Regional Advisory Committee meetings, Steering Committee meetings, and work carried out by SHA and MWA between November 2016 and August We trust this report covers the requirements for your Solid Waste Management Plan. Please contact us if you have any questions about this report. Yours truly, SPERLING HANSEN ASSOCIATES Dr. Tony Sperling, P.Eng. President North Vancouver Office East Keith Road, North Vancouver, British Columbia, V7J 1J3 Phone (604) Fax (604) Kamloops Office 1332 McGill Road, Kamloops, British Columbia, V2C 6N6 Phone (778) Fax (778)


4 Contents 1. INTRODUCTION Guiding Principles Pollution Prevention Hierarchy and Targets Updating the Plan Key Drivers Background Plan Area Population Plan History Existing System Roles and Responsibilities Existing System Programs and Facilities Cache Creek Landfill Future Strategies and Ongoing Solutions Waste Generation and Characterization Goals, Strategies and Actions Increase Recycling in the ICI Sector Increase Diversion of waste generated by Construction and Demolition Activities Reduce the amount of Organic Waste Landfilled Increase Promotion and Education Increase and Maintain awareness to and participation in Extended Producer Responsibility Programs Encourage Proper disposal of Household Hazardous Waste Improve Effectiveness of Existing Bylaws Reduce prevalence of Illegal Dumping Increase Efficiency of Residual Waste Management in the TNRD Pursue Future Strategies and Ongoing Solutions Ensure Ongoing Monitoring and Measurement Resulting Diversion Potential Finance and Administration Plan Implementation Implementation Schedule Annual Reporting Five Year Effectiveness Review Plan Amendments Plan Schedules Schedule A: Plan Reports & Consultation Report i
5 Figure 11 Pollution Prevention Hierarchy... 4 Figure 12 Plan Review Process... 6 Figure 21 Map of the ThompsonNicola Regional District... 9 Figure Regional District Disposal Rates (as per Environmental Reporting BC) Figure 23 Disposal Rate and Density in Adjacent Regional Districts Figure 24 TNRD Waste composition proportions from Waste Naught BC waste characterization study (2011) Table 11 TNRD Guiding Principles... 3 Table 21 TNRD Population Data (2016 Census) Table 22 Guiding Principles in the 2008 RSMWP Table 23 Roles and Responsibilities in thetnrd Solid Waste System Table 24 Waste Diversion Programs in the TNRD and City of Kamloops Table 25 TNRD Operated Facilities and Locations Table Per Capita Disposal Rate Table 31 Estimated Diversion Potential Table 41 Estimated New Expenditures for the TNRD Solid Waste Management System Table 42 TNRD Financial Plan Table 43 Estimated New Solid Waste Management Expenditures for the City of Kamloops Table 44 City of Kamloops Financial Plan Table 51 Implementation Schedule ii
6 1. INTRODUCTION In British Columbia, regional districts develop solid waste management plans under the provincial Environmental Management Act that are long term visions of how the regional district would like to manage its solid wastes in accordance with the pollution prevention (5 R) hierarchy. This plan will be renewed on a 10 year cycle to ensure that it reflects the current needs of the regional district, as well as current market conditions, technologies and regulations. The ThompsonNicola Regional District (TNRD) initiated an update of its 2008 Regional Solid Waste Management Plan (RSWMP or Plan) in This document is a revised version of the original plan approved by the province in The history of the planning process is discussed further in Section 1.3. This draft document represents the most recent amendment of the TNRD s Regional solid waste management plan and once approved by the Province (along with any approval conditions), becomes a regulatory document for solid waste management and serves to guide solid waste management related activities and policy development in the TNRD. In conjunction with regulations and operational certificates that may apply, this plan regulates the operation of sites and facilities that make up the region s waste management system (Section 2.5 covers Existing Facilities in the Region). 1.1 Guiding Principles The principles guiding the development and implementation of this plan are illustrated in Table 1 1.: Table 11 TNRD Guiding Principles 1. Promote zero waste approaches and support a circular economy 2. Promote the first 3 Rs (Reduce, Reuse and Recycle) 3. Maximize beneficial use of waste materials and manage residuals appropriately to the region. 4. Individuals and firms are enabled to make environmentally sound choices about the generation and management of solid waste through provision of appropriate information, including userpay and marketbased incentives wherever possible 5. Prevent organics and recyclables from going into the garbage wherever practical 6. Collaborate with other regional districts wherever practical 7. Develop collaborative partnerships with interested and affected parties to achieve regional targets set in plans 8. Level the playing field within regions for private and public solid waste management facilities 3 ThompsonNicola Regional District Regional PRJ DRAFT PLAN
 at their first meeting held on February")

.")
7 These guiding principles are based on those established by the Province in the new Guide to Solid Waste Management Planning (September 2016), except for revisions adopted by the Regional Solid Waste Management Plan Review Advisory Committee (RAC) at their first meeting held on February 14, The RAC added to the Region to the end of the 3 rd guiding principle to add stronger language to the need to manage residuals appropriately based on the resources available; expanded the 4 th guiding principle, and adjusted the 7 th guiding principle to add affected parties. 1.2 Pollution Prevention Hierarchy and Targets This plan adopts the 5 R pollution prevention hierarchy (see Figure 11 below). Strategies to address each tier in the hierarchy are laid out in Section 3 below. Figure 11 Pollution Prevention Hierarchy 4 ThompsonNicola Regional District Regional PRJ DRAFT PLAN
8 The Plan s proposed strategies and actions are laid out in Section 3, and are divided into diversion initiatives (reduce, reuse, recycle) and residual management initiatives. Based on the anticipated implementation schedule (Schedule B) and estimates for the how these initiatives will reduce the amount of municipal solid waste (MSW) sent to landfill, the following targets were established: Implementation of the Plan over its 10year timeframe is expected to reduce the TNRD s annual per capita disposal rate from 623 kg in 2016 to: 560 kg per person by 2023 (5 years into the plan) 500 kg per person by 2028 (10 years into the plan) 1.3 Updating the Plan The current planning process was initiated in Schedule A includes the planning technical reports and the public consultation report. Participants in the planning process included: Plan team: TNRD staff, City of Kamloops staff and consultants Sperling Hansen Associates, Maura Walker and Associates, and Jan Enns Communications coordinated the planning process, participated directly in the development of technical reports and conducted the consultation with interested parties. TNRD Steering Committee: reviewed documents that resulted from the planning process, and provided direction to staff and consultants. Public and Technical Advisory Committee(s): were combined early in the planning process to create a Review Advisory Committee (RAC) which reviewed information associated with the planning process and provided input to staff and the Board. The RAC committee included members of the public, industry stakeholders, and First Nations. Interested parties (including the public): were kept informed during the plan development and participated in consultation opportunities to provide input to the plan team and Board. The process to review the plan has been conducted in three phases as indicated in Figure 12 below. The first phase consisted of the establishment of the Regional RSWMP Review Advisory Committee (RAC) as well as an assessment of the current solid waste management system and a status report on the implementation of the 2008 Plan. Phase 1 also included a concurrent communication and consultation program consisting of a community survey and RSWMP web page. 5 ThompsonNicola Regional District Regional PRJ DRAFT PLAN

 and are attached in Schedule A.")
9 The second phase consisted of a review of options to address the region s future solid waste management needs and the selection of preferred options as well as a financial analysis. Throughout all phases, stakeholder consultation and communication was carried out. The third phase will be completed once input on the Draft plan is received and the plan is finalized. Figure 12 Plan Review Process Several reports, as listed below, were prepared by the consultants to assist the RSWMP Advisory Committee with their discussions and workshops. These documents are available on the solid waste management page of the TNRD website ( and are attached in Schedule A. Stage 1 Report (Existing System) Opportunities for Waste Reduction and Diversion Residual Waste Management TNRD Landfill Economic Analysis Solid Waste Policies, Bylaws and Enforcement Financial Implications of Proposed Solid Waste Management System Changes to the TRND and City of Kamloops 1.4 Key Drivers The key drivers for developing this plan were identified as part of the Phase 1 Existing System Assessment and reviewed and confirmed with the RSWMP Review Advisory Committee at their first meeting on February 14, The key drivers were: Opportunities to increase waste diversion in the ICI (industrial, commercial, institutional) sector 6 ThompsonNicola Regional District Regional PRJ DRAFT PLAN
10 Opportunities to increase diversion from the Construction and Demolition sector (C&D) Opportunities to increase organic waste diversion Opportunities to support waste diversion through education, communication and consultation These diversion opportunities are regarded as opportunities to reduce the amount of waste going to landfill (thereby extending the life of the landfills in the TNRD), as well as opportunities to develop new, local economic activity that can take advantage of the secondary resources made available through the actions listed in this Plan. 2. BACKGROUND 2.1 Plan Area The TNRD is located in the southern central interior of British Columbia. It is bound by the Columbia Shuswap, North Okanagan, and Central Okanagan regional districts to the east, the Okanagan Similkameen and Fraser Valley regional districts to the south, the SquamishLillooet Regional District to the west, and the Cariboo and FraserFort George regional districts to the north. The district covers approximately 45,000 square kilometers (which makes it the 8 th largest regional district in BC) and consists of eleven municipalities and ten electoral areas as indicated in Figure Population Every regional district in BC has unique characteristics and the TNRD is no exception. The TNRD covers a large geographic area with a population density of 3 people per square kilometre. 83% of the population resides within incorporated municipalities, 12% in electoral areas and 5% in First Nation land reserves, as seen in Table 21. The population data shown in Table 21 is based on the 2016; in the table, R represents rural communities (unincorporated) or electoral areas, U represents the urban population in incorporated communities and municipalities, and FN represents First Nation populations. By far, the greatest number of people reside in the municipality of Kamloops with 90,000 residents (68% of the total population), which is also the main business centre of the area. Given that garbage generation is a function of population, geography and level of economic activity, the TNRD may be described as having two distinct waste sheds Kamloops with its growing urban population, high level of economic activity and consequently higher garbage generation rate, and the rest of the region with a stable, more rural population, less economic activity and consequently a lower rate of garbage generation. This geographic, population and economic distribution has influenced the structure of the municipal solid waste management system in the TNRD. Although the TNRD is mandated by the province to develop a 7 ThompsonNicola Regional District Regional PRJ DRAFT PLAN
11 solid waste management plan for the entire regional district, plan implementation is primarily the responsibility of the TNRD and the City of Kamloops, with lesser involvement by the smaller municipalities through curbside collection programs. 8 ThompsonNicola Regional District Regional PRJ DRAFT PLAN


12 Figure 21 Map of the ThompsonNicola Regional District 9 ThompsonNicola Regional District Regional PRJ DRAFT PLAN
13 Table 21 TNRD Population Data (2016 Census) Population Statistics in ThompsonNicola Regional District Source: Statistics Canada Community Sq. Km. Homes (occupied) People per home Population 2016 ThompsonNicola Regional District 44, , ,663 % of Total Electoral Area A R Wells Gray Country ,493 1% U Clearwater , ,331 2% Total Area A 3,824 3% Electoral Area B R Thompson Headwaters % Total Area B 233 0% Electoral Area E R Bonaparte Plateau ,094 1% U Clinton % Total Area E 1,735 1% Electoral Area I R Blue Sky Country 5, ,262 1% U Ashcroft ,558 1% U Cache Creek % U Lytton % FN Skeetchestn % FN Bonaparte % FN Kanaka Bar % FN Siska % FN Skuppah % FN Lytton % FN Cooks Ferry N/A FN Shackan FN Nicomen % Total Area I 4,749 4% Electoral Area J R Copper Desert Country 3, ,580 1% U Logan Lake ,993 2% Total Area J 3,573 3% Electoral Area L R Electoral Area L 1, ,955 2% FN Adams Lake % FN Neskonlith % Total Area L 3,677 3% Electoral Area M R ThompsonNicola M 3, ,598 1% U Merritt ,139 5% FN Lower Nicola % FN Coldwater % Total Area M 9,727 7% Electoral Area N R ThompsonNicola N 2, % FN Nooaitch % FN Upper Nicola % Total Area N 1,206 1% Electoral Area O R ThompsonNicola O 5, ,323 1% U Barriere ,713 1% FN Simpcw First Nation N/A N/A N/A 243 0% Total Area O 3,279 2% Electoral Area P R ThompsonNicola P ,672 3% U Chase ,286 2% U Sun Peaks % U Kamloops ,280 68% FN Tk'emlups te Secwepemc* ,021 2% FN Whispering Pines/Clinton % Total Area P 99,934 75% Total Urban Population 109,769 83% Total Rural 15,972 12% Total First Nations 6,196 5% Other First Nations 726 1% Total RD * 132,663 *Note: The population presented is based on data available from the 2016 Census. The Tk'emlups te Secwepemc First Nation manages waste at the Mt. Paul landfill. The TNRD has MTSA's with 17 First Nation Communities, as outlined in the table above. Population data for additional First Nations communities in the TNRD is not specifically outlined in the above table, but is estimated in the section "other First Nations". ThompsonNicola Regional District PRJ DRAFT PLAN
14 2.3 Plan History The TNRD s original Regional Solid Waste Management Plan was approved by the Province in 1995 and was last updated in The waste management strategy adopted in the 2008 Plan combined waste diversion, residuals management and policies to effectively manage solid waste within the region, in support of the 30% waste reduction goal (compared to 2004 levels) adopted by the TNRD Board of Directors as part of the 2008 Plan. The guiding principles adopted in the 2008 Plan are illustrated in Table 22. Table 22 Guiding Principles in the 2008 RSMWP 1. Support the goal of 30% waste reduction in the next 5 years measured against 2004 levels 2. Programs will follow the 5Rs hierarchy reduce, reuse, recycle, recovery and residual management 3. Commit to education and social marketing programs 4. Adoption of a Zero Waste philosophy 5. Support for Product Stewardship Programs and Extended Producer Responsibility 6. Establish a UserPay approach to program funding 7. Carry out Ongoing Evaluation of New Programs 8. Use Local Government Policies and Enforcement to increase waste diversion 9. Implement Criteria for New Programs to ensure any program that is implemented will be technically sound, economically feasible and acceptable to the public 10. Support Cooperation Opportunities with Member Municipalities, other Regional Districts, First Nations, and Private Sector as appropriate Based on these principles, the 2008 Plan included policies that should be implemented to encourage participation in waste diversion programs. These included disposal bans, variable tipping fees and user pay fee structures to be implemented by the TNRD and participating municipalities and businesses. Plan implementation was divided into three phases: Phase 1 (one to three years after Plan adoption) consisted of 20 separate actions that involved initiation of 3Rs services as well as implementation of changes to the current residual waste management system; phase 2 (four to seven years after Plan adoption) consisted of 7 programs offering increased levels of collection service for recyclables and the addition of yard waste dropoff sites in the City of Kamloops; and phase 3 (seven to ten years after Plan ThompsonNicola Regional District PRJ DRAFT PLAN
15 adoption) which involved the continuation of programs initiated in earlier phases, as well as development of new waste disposal capacity for the region. The 2008 Plan also recognized that the residual management system at the time did not provide the necessary framework to implement and enforce the various policies and guiding principles adopted in the Plan. Specifically, at the time of plan development there was no ability to: Prevent the uncontrolled use of unattended TNRD (rural) transfer stations from within and outside of the TNRD; Manage environmental risks and liabilities that could result from the use of facilities for the disposal of prohibited or banned materials/substances; Encourage recycling and other waste reduction policies, such as paybyweight policy (which requires scales); Efficiently manage the collection and hauling of waste from transfer stations to disposal facilities, particularly in the case of rolloff bin transfer stations; Manage solid waste management costs on a financially sustainable basis; and, Achieve the 30% waste reduction goal adopted by the Board of Directors. These inefficiencies in the residual management system, particularly the lack of scales at all sites, prevented the TNRD from measuring their 30% waste reduction goal from 2004 levels due to the absence of accurate waste disposal data at that time. Consequently, improving the existing network of transfer stations and landfills became a top priority of the 2008 Plan. The following is a summary of the implementation status of the 2008 Plan. Reduction A user pay system has been adopted with tipping fee levels set sufficiently high to encourage diversion practices, especially for clean wood and asphalt roofing. Although material bans have been adopted in TNRD s Bylaw 2465, full implementation and a rollout of an education and enforcement program has not been completed to date. This has been identified as a high priority for the TNRD as a next step towards waste reduction. ThompsonNicola Regional District PRJ DRAFT PLAN
16 Diversion / Recycling Numerous municipalities in the TNRD have adopted the highly efficient single stream blue bag system for recyclable material diversion at the curb including the City of Kamloops. In communities without curbside collection, single stream recycling is offered at all transfer stations in the Regional District. Stewardship services engagement was a high priority in the 2008 RSWMP. Currently, the TNRD has succeeded in partnering with 12 of 13 Stewardship agencies at its EcoDepots. These stewardship partnerships provide TNRD residents with widespread opportunities to divert materials in a convenient onestopdrop setup. The only stewardship program that is currently not engaged at the TNRD s EcoDepots is Recycle BC. In early 2017, Recycle BC announced that it will be supporting the City of Kamloops residential recycling program. The TNRD and its member municipalities are currently in discussions with Recycle BC with the intent (subject to Board review and approval) of also becoming part of the Provincial program which provides financial support for packaging and printed paper recycling. Residuals Management Following the 2008 plan, the closure of three smaller landfills and numerous small transfer stations has resulted in a more efficient system for the TNRD. In total, the TNRD operates 28 facilities where residents can take their municipal solid waste, including full service EcoDepots, smaller transfer stations, and two MSW landfills. This does not include the City of Kamloops operated landfills (three), yard waste dropoffs (three) or recycling depots (three). Scales have been installed at all major EcoDepot sites and landfills, with the exception of Blue River. 2.4 Existing System Roles and Responsibilities Table 23 illustrates the organizations in the TNRD that contribute to municipal solid waste management. As discussed in Section 2.2, the two major system operators are the City of Kamloops and the TNRD for the rural areas of the region, with lesser involvement by smaller municipalities through curbside collection programs. 2.5 Existing System Programs and Facilities Diversion Programs Table 24 provides an overview of the current waste diversion system operated by the City of Kamloops and the TNRD for residential, Industrial, Commercial, Institutional (ICI) and Construction and Demolition (C&D) wastes in the regional district. As shown, the TNRD and the City of Kamloops successfully provide widespread opportunities for diversion and recycling to residents in the Region. ThompsonNicola Regional District PRJ DRAFT PLAN
17 As mentioned previously, Recycle BC.(formerly MultiMaterial BC or MMBC) announced in February 2017 that it will be supporting the City of Kamloops residential recycling program for printed paper and packaging (PPP). This will include payment made to the City for the curbside collection program of PPP. Additionally, Recycle BC will take over responsibility for processing the recyclables. Table 23 Roles and Responsibilities in thetnrd Solid Waste System Who Roles in Solid Waste Management Federal government Provides waste management assistance to First Nations through Indian and Northern Affairs Canada (INAC) Provincial government Various ministries have regulatory authority related to waste management Regional district (Board and staff) Develops plan to provide big picture oversight of waste management in the region Through plans and plan implementation (including bylaws), works to meet waste disposal goals and targets and ensures that communities have access to waste management services that are environmentally sound and cost effective Ensures that legislative and policy requirements are followed, including monitoring and reporting Operates rural TNRD landfills and provides collection services to some municipalities and electoral areas Supports Product Stewardship programs in jurisdiction Municipalities (council Provide collection services for solid waste and recycling and staff) Make bylaws dealing with waste collection Municipal enforcement officers part of enforcement team First Nations Provide waste management services Many participate in TNRD waste management services through Municipal Type Service Agreements. Product stewardship Ensure reasonable and free consumer access to collection facilities producers and agencies Collect / process stewarded products Coordinate local government delivery as a service provider where applicable Provide and / or fund education and marketing Provide deposit refunds to consumers (where applicable) Monitor / report on key performance indicators such as recovery rates Private sector involved Provide recycling and waste management services and own / operate facilities in waste management (e.g., haulers, facility operators, contractors) Service multifamily residential buildings, commercial and institutional sources, and construction, demolition and land clearing sectors Residents and businesses Responsible for carrying out proper waste reduction, recycling and disposal activities ThompsonNicola Regional District PRJ DRAFT PLAN
18 Table 24 Waste Diversion Programs in the TNRD and City of Kamloops Residential Waste ICI Waste C& D Waste City of Kamloops System City of Kamloops System City of Kamloops System Single stream (mixed) automated curbside collection of recyclables for all single family and 95% of multifamily households C&D waste accepted at disposal sites Ban on grass clippings in curbside garbage Yard waste dropoff sites Stewardship materials and yard waste are accepted at most City disposal sites TNRD Operated System All residents have access to single stream recycling; either through curbside collection (provided by municipalities) or at a recycling depot. In addition, Blue bag / blue bin recyclables, stewardship materials and yard waste are accepted at most TNRD facilities. Disposal ban on cardboard, glass, mixed waste paper, containers, plastic packaging, product stewardship material, scrap metal (currently not enforced). Private collection services available for the collection of cardboard. The City provides cardboard collection service for roughly 25% of business sector Recyclables accepted at disposal sites No disposal bans on ICI paper and cardboard No disposal bans on yard waste at disposal facilities TNRD Operated System Disposal ban on cardboard, glass, mixed waste paper, containers, plastic packaging, product stewardship materials, scrap metal (currently not enforced) Differential tipping fees to encourage source separation of metal, wood, drywall, concrete and asphalt shingles. No disposal bans TNRD Operated System C&D waste accepted at disposal sites Differential tipping fees to encourage source separation of metal, wood, drywall, concrete and asphalt shingles Disposal ban on cardboard and metal not enforced ThompsonNicola Regional District PRJ DRAFT PLAN
19 Residual Management As discussed in Section 2.3, improving the existing network of transfer stations and landfills was a top priority of the 2008 Plan. This has been the focus of plan implementation since adoption in Municipal solid waste in the region can be directed for management to any authorized site or facility identified in the plan. TNRD operated sites or facilities are listed in Table 25. The TNRD operates 10 EcoDepots, 18 Transfer Stations and 2 Landfills. Additionally, the City of Kamloops owns and operates three landfills, while two additional private landfills and one First Nations controlled landfill exist within the region. A list of landfill facilities within the TNRD include: Lower Nicola Landfill (TNRD owned and operated) Heffley Creek Landfill (TNRD owned and operated) Mission Flats Landfill (City of Kamloops owned and operated) Kamloops Resource Recovery Center (City of Kamloops owned and operated) Barnhartvale Landfill (City of Kamloops owned and operated) Blackwell Dairy Landfill (Privately owned and operated) Tk emlups te Secwepemc Landfill (First Nations Landfill) Cache Creek Landfill (Wastech Services Ltd.) Closed as of December 2016 Cache Creek Landfill Extension (Belkorp Environmental Services) Under Construction. ThompsonNicola Regional District PRJ DRAFT PLAN

20 Table 25 TNRD Operated Facilities and Locations Facility Name / Location Facility Type Location Agate Bay Transfer Station 5505 Adams West FSR Aspen Grove Transfer Station 7925 Merritt Princeton HWY 5A Black Pines Transfer Station 8900 Westsyde Rd. Blue River EcoDepot 5889 Blueberry Rd. Brookmere Transfer Station Exit 256 off Coquilhalla at Coldwater interchange Clearwater EcoDepot EcoDepot 290 Clearwater 100 mile FSR Clinton EcoDepot EcoDepot 5 Boyd Pit Rd. Cache Creek Transfer Station 882 Campell Dr. W Eagan Lake Transfer Station 8385 Eagan Lake Rd. Heffley Creek EcoDepot EcoDepot and Landfill 7381 Sullivan Valley Rd. Knutsford Transfer Station 1590 Beresford Rd. Lac Le Jeune Transfer Station 5445 Meadow Creek Rd. Little Fort Transfer Station 4580 Sandhill Rd. Logan Lake EcoDepot 9261 Highway 97C Loon Lake Transfer Station 1691 Loon Lake Rd. Lower Nicola EcoDepot EcoDepot and Landfill 2348 Woodward Rd. Louis Creek EcoDepot EcoDepot 4077 Agate Bay Rd. Lytton EcoDepot 2040 LyttonLillooet Rd. Paul Lake Transfer Station 1945 PinantanPritchard Rd. Pritchard / South Thompson EcoDepot 1595 Martin Prairie Rd. EcoDepot Savona Transfer Station 1320 Industrial Way Spences Bridge Transfer Station 9549 Hwy 8 Sun Peaks Transfer Station 1320 Industrial Way Tranquille valley Transfer Station Tranquille Criss Creek Rd. Vavenby Transfer Station 3125 Allingham Rd. Westwold Transfer Station 6365 Westwold Station Rd. 70 Mile EcoDepot EcoDepot 3061N Bonaparte Rd. Ashcroft Recycling Depot Recycling Depot Railway Ave. Cache Creek Recycling Depot Recycling Depot 1125 Old Cariboo Rd. Chase Recycling Depot Recycling Depot Art Holding Memorial Arena Merritt Recycling Depot Recycling Depot Main St. ThompsonNicola Regional District PRJ DRAFT PLAN
21 2.6 Cache Creek Landfill Municipal solid waste in the region may be directed for management to any new site or facility contemplated by this plan. The Cache Creek Landfill Extension is included in this plan and will be considered as a disposal location for the TNRD once it is operational. Up until the landfill s closure, TNRD hauled waste from its western electoral areas to the Cache Creek Landfill. As of December 2016, the landfill has been closed and no longer accepts waste. A new landfill, located adjacent to the existing/closed Cache Creek Landfill, has received all of its necessary approvals and operating authority and is under construction; this landfill is currently called the Cache Creek Landfill Extension. An Operational Certificate was issued to Belkorp Environmental Services in late 2016 for the Cache Creek Landfill Extension, however at this time construction of the Extension is not yet complete. The new landfill is anticipated to open in The TNRD intends to begin negotiations with Belkorp Environmental Services during fall of 2017 for use of the Cache Creek Landfill. The negotiations will determine the amount of waste, and from which areas in TNRD waste will be sent to the Cache Creek Landfill. 2.7 Future Strategies and Ongoing Solutions SRM Management Facility As further discussed in the Financial Memorandum a Specified Risk Material (SRM) Management facility may also be considered. Specified Risk Material is defined as the cattle tissue that can harbor the infective agent known as prion which causes Bovine Spongiform Encephalopathy (BSE or Mad Cow Disease). Currently there are no practical disposal options for abattoir / slaughter waste in the TNRD. It is the TNRD s intent to support industry efforts to develop a strategy for dealing with abattoir, and in turn SRM waste. This may include industry efforts to establish a SRM management facility in the region, or other possible solutions. Agricultural Plastic Recycling During public consultation, some interest was expressed in developing a strategy to deal with agricultural plastics such as silage bags and bale wrap. The TNRD will work with industry stakeholders to determine if there is a market available for the plastic film and if a centralized collection facility would be feasible. Additionally, the TNRD may consult with neighbouring regional districts to develop a management strategy for the waste. Economic Development The TNRD will continue to encourage economic opportunities and development in the Solid Waste Management sector. ThompsonNicola Regional District PRJ DRAFT PLAN
22 2.8 Waste Generation and Characterization Provincial Target The Ministry of Environment measures regional district solid waste management system performance in terms of disposal rate and not diversion. Measuring waste diversion has been problematic given the variability between regional districts regarding the definition and measurement of diverted materials. In 2013, the Ministry of Environment (MOE) developed the BC Waste Disposal Calculator to provide more reliable and consistent data on MSW disposal by regional districts, and to assist in determining the Province s progress toward zero waste. As stated in Section 1.2, the MOE has established a target to lower the provincial MSW disposal rate to 350 kilogram per person per year by Regional Performance Based on disposal data reported by the TNRD, a total of 80,520 tonnes of MSW was disposed in the TNRD in This includes waste from all TNRD, municipal and private landfills except for the Mt. Paul Landfill which services the Tk emlups te Secwepemc First Nation as well as residents in the community of Sun Rivers (Kamloops). The 2016 waste disposal rate for the TNRD, calculated from the aforementioned tonnage and population data from the 2016 Census is 621 kg per capita. This represents the average disposal rate for the entire TNRD. The waste disposal rate has been broken down further into the City of Kamloops managed system and the remainder of the TNRD system (rural TNRD), as seen in Table 26. The rural TNRD disposal rate is lower (437 kg per capita) than the disposal rate for the City of Kamloops (702 kg per capita). Because the City of Kamloops makes up nearly 70% of the Region s population and has a notably higher disposal rate, there is greater potential to divert waste away from disposal (and thereby reduce per capita disposal rates) in the City as compared to the rest of the regional district. Table Per Capita Disposal Rate 2016 Population Waste Disposed (MT) Waste Disposal TNRD Only System (Excluding TteS) 39,362 17, CoK Only System 90,280 63, Total TNRD System (Excluding TteS) 129,642 80, ThompsonNicola Regional District PRJ DRAFT PLAN

23 The Province provides per capita disposal data for each BC regional district, with the most recent data being provided for This comparative data is provided in Figure 22. As shown, the disposal rate for the TNRD is greater than the provincial average disposal rate. However, as indicated in Figure 23, when compared to adjacent regional districts, per capita disposal rate in the TNRD is not outofline with regional districts with similar geography and population density. Figure Regional District Disposal Rates (as per Environmental Reporting BC) ThompsonNicola Regional District PRJ DRAFT PLAN
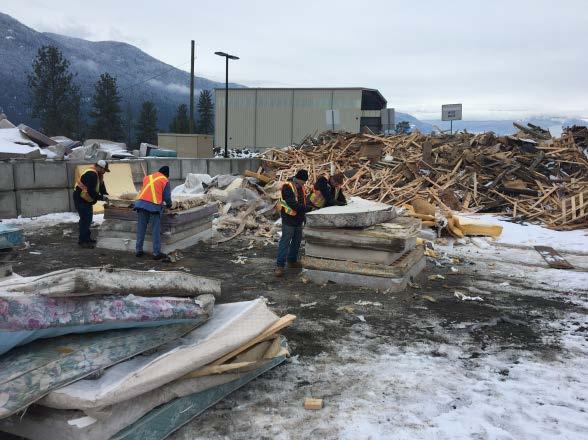
24 kg/capita Disposal Rate BC Average Disposal Rate Density CSRD RDNO CORD RDOS TNRD FVRD SLRD CRD RDFFG # of people Figure 23 Disposal Rate and Density in Adjacent Regional Districts Waste Characterization The most recent waste characterization study completed for the TNRD was in 2011 and consisted of six landfills and two transfer stations. The piechart shown in Figure 24 illustrates the estimated proportion of the various waste materials landfilled. The data from this study indicates that the category with the highest composition is organic food waste, which accounted for more than a quarter of the total waste stream by weight. The wood category represented the next largest category of waste, representing 18% of the waste stream. The third highest contributor to the waste stream was Paper Products and Paper Packaging, accounting for 15%. Demolition and construction waste (DLC) accounted for 12% and plastic packaging accounted for 7%. The remaining materials represented less than a quarter of the overall waste stream. Although the data is slightly outdated, at over five years old, the results of this study indicate that a significant amount of what is currently landfilled could potentially be composted, recycled, or managed through Extended Producer Responsibility programs. ThompsonNicola Regional District PRJ DRAFT PLAN

 sector Opportunities")

25 Figure 24 TNRD Waste composition proportions from Waste Naught BC waste characterization study (2011). This waste characterization data, combined with waste disposal rates, informed the development of the key drivers for plan development as discussed in Section 1.4. Again, the key drivers were: Opportunities to increase waste diversion in the ICI (industrial, commercial, institutional) sector Opportunities to increase organic waste diversion Opportunities to increase diversion from the Construction and Demolition (C&D) Opportunities to support waste diversion through education, communication and consultation Addressing these key drivers are the goals of this solid waste management plan. The strategies and actions identified to address these goals are discussed in the following Section 3. ThompsonNicola Regional District PRJ DRAFT PLAN
26 3. GOALS, STRATEGIES AND ACTIONS To address the goals and strategies outlined in the planning process, a number of proposed action items were considered and consulted on. The action items were divided into two main categories: Diversion Initiatives and Residual Waste Management Initiatives. Additionally, future strategies to provide waste management solutions have been considered. Within these categories, solid waste management system changes that are addressed include: Diversion Initiatives: ICI Diversion Construction and Demolition Waste Diversion Organic Waste Diversion Promotion and Education Extended Producer Responsibility Household Hazardous Waste Collection Bylaws Illegal Dumping Residual Waste Management Initiatives: Conversion of Heffley Creek Landfill to Construction and Demolition only landfill Closure of Barnhartvale Landfill Future Strategies and Solutions Establish Specified Risk Material Management Strategy Agricultural Plastic Waste Action items associated with the above mentioned categories are outlined in the following section, as well as cost estimates for implementing each action item. The cost estimates do not include the cost of additional staffing requirements; however, any additional staffing requirements required to implement the Plan s actions are outlined in the Financial Implications memorandum included in Schedule A and are summarized in Section 4. The cost estimates are based on best available cost information and are shown in 2017 dollar values (i.e. they do not incorporate inflation). As indicated in the Implementation Schedule section, the timeline of implementation, and priority of initiatives has been developed as follows: first priority increase ICI diversion ( ), second priority increase Construction and Demolition waste diversion ( ), third priority increase organic waste diversion ( ). ThompsonNicola Regional District PRJ DRAFT PLAN
27 As discussed throughout this report, while all goals of the RSWMP apply to all municipalities within the ThompsonNicola Regional District, some of the action items outlined in the following sections apply only to the City of Kamloops or are shared responsibilities between the City of Kamloops and the Regional District to maximize effectiveness and efficiency of the plan. Many of the initiatives will have the greatest effect in the City of Kamloops due to the large population base that lives in the City. Further, as outlined by the disposal data, the City has the largest opportunity to increase diversion and decrease disposal rates. 3.1 Increase Recycling in the ICI Sector Action items that will achieve diversion goals in relation to increasing recycling in the ICI sector are outlined in the table below. Further, a cost estimate is shown. Actions Cost Estimate 1. Continue to apply differential tipping fees to encourage source separation of recyclable/recoverable components of the waste stream. No New Cost 2. Implement disposal bans on recyclable materials. It is recommended that the TNRD and City of Kamloops develop a coordinated approach to implementing disposal bans on recyclable materials utilizing the following 4 steps: I. Regulate update facilities bylaw to include disposal bans on recyclable materials in the garbage stream: It is recommended that the first phase of disposal bans include: recyclable cardboard, paper, metal, and products and packaging regulated under the BC Recycling Regulation (i.e. EPR products) The next phase of disposal bans may include: yard waste, clean wood waste, asphalt shingles, mattresses Recyclable material bans should only apply to facilities where recycling options are locally available II. Collaborate meet with stakeholders (haulers, processors and generators) to define the timeline for implementation, enforcement protocols, tolerance levels (of banned material in a load) and support requirements (i.e. education and communication). III. IV. Educate create and implement a communications plan for informing all potentially affected stakeholders. Potential tools include: Mail out to generators Advertising Media materials Brochures/posters/flyers Infraction Notices Enforce Establish enforcement mechanisms, train all affected staff, establish mechanism for infraction tracking and follow up. TNRD $10,000 per year for two years City of Kamloops $10,000 per year for two years ThompsonNicola Regional District PRJ DRAFT PLAN
28 3. Assist haulers to encourage more/better recycling by their customers Develop consistent signage and messaging for use on collection containers. It is recommended the TNRD will take the lead on this initiative, which will benefit all relevant member municipalities (including the City of Kamloops). 4. Require recycling collection services at all ICI locations To reinforce the disposal bans, municipalities can enact a bylaw that requires all business that generate recyclable materials to have an inhouse recycling program. This would require ICI generators to have a recycling collection service, or that they selfhaul their recycling to a recycling facility. The City of Kamloops has a similar requirement already in place for multifamily buildings. TNRD $14,000 over 5 years City of Kamloops $10,000 It is proposed that City of Kamloops implement this requirement and their bylaw and approach could be a model for other municipalities in the TNRD to consider. The TNRD would promote this approach to other member municipalities (as appropriate). 5. Space allocation in ICI and multifamily developments The City of Kamloops applies space allocation guidelines for garbage and recycling collection containers to proposed new multifamily developments to ensure that recycling is considered in the design of new buildings and property. The City is looking to establish a similar space allocation requirements for ICI developments. Like the above recommendation, these City requirements can be a model for other TNRD municipalities to consider and the TNRD could promote these space guidelines to the other member municipalities (as appropriate). 6. Increase ICI sector awareness of diversion opportunities To ensure that businesses are aware of local diversion opportunities, disposal bans and any local mandatory recycling requirements, the TNRD and City of Kamloops will endeavor to spread the word utilizing online tools and liaising with the ICI sector at events and/or business association meetings. Again, it is assumed the TNRD will take the lead in developing branding and communication materials, which will benefit all relevant municipalities No New Cost TNRD Develop communication materials $20,000 Ongoing Communication $5,000 annually ThompsonNicola Regional District PRJ DRAFT PLAN
29 3.2 Increase Diversion of waste generated by Construction and Demolition Activities Action items and cost estimates to achieve diversion goals relating to Construction and Demolition (C&D) waste are outlined in the table below: Actions 1. Develop a C&D Waste Diversion Strategy It is recommended that the TNRD develop a C&D waste diversion strategy in consultation with industry stakeholders including the construction and demolition industry, haulers of C&D waste and municipal staff in the waste management and permitting departments. Approaches and tools to be considered include: a. Reviewing tipping fee structures to ensure that the fees are effective at encouraging source separation of recyclable and recoverable materials b. Implementing disposal bans on recyclable and recoverable materials c. Developing consistent signage on collection bins d. Mandatory solid waste management plans for large projects e. Variable permit fees that strongly favor deconstruction over demolition f. Encourage green/leed developments, which minimize waste during construction, by offering discounted development fees g. Consider accepting source separated materials only at specific waste management sites in the Kamloops area h. Communicate with C&D waste generators in regards to the benefits of source separation of wood waste and other recyclable materials, and where these materials can be delivered i. Collectively issuing a request for services such as wood waste grinding or for end users (like cogeneration) to see if the provision of larger volumes can reduce the per tonne cost Cost Estimate TNRD $10,000 per year for two years City of Kamloops $10,000 per year for two years 2. Develop a C&D Waste Management Toolkit It is recommended that the TNRD develop a C&D Waste management toolkit for construction, demolition and renovation projects that would: a. Provide information on local waste management requirements and available services and facilities b. Help contractors identify which waste materials can be diverted c. Provided as a handout as part of getting a building permit d. Made available for DoItYourselfers(online, at building supply stores, at building permit desks, at disposal facilities) TNRD Develop Toolkit: $5,000 Update Toolkit: $2,500 every three years ThompsonNicola Regional District PRJ DRAFT PLAN
30 3. City of Kamloops Wood Waste Diversion One of the key opportunities to explore for a C&D waste management strategy is wood waste diversion in the City of Kamloops. With an enhanced focus on wood waste diversion, it is anticipated that about 5,000 tonnes of clean wood waste could be diverted from the City of Kamloops Landfills annually. Avenues and markets that may be explored for beneficial use of wood waste, including composting, use at local industrial sites, and energy recovery through a biomass burner. One option would be for the City to chip and haul wood waste to Atlantic Power in Williams Lake. City of Kamloops Estimated Annual Cost $300, Reduce the amount of Organic Waste Landfilled Action items that will achieve diversion goals in relation to organic waste diversion are outlined in the table below: Actions Cost Estimate 1. Outside the City of Kamloops, prioritize organic (biodegradable) waste reduction over collection and centralized processing through employing some or all of the TNRD following tools: Encourage athome organic waste management through: Backyard composting Digesters Grasscycling TNRD will establish a pilot project with one municipality or community to test the effectiveness of reduction as a tool to reduce organic waste disposal. Based on the outcomes of the pilot, TNRD and City of Kamloops (CoK) will promote the most effective tools regionally. All municipalities will be encouraged to review curbside collection requirements to ensure that they encourage minimal disposal of divertible organic waste (curbside container limits, restrictions on yard waste). The promotion of onsite management of organic waste will be linked with WildSafeBC education initiatives. 2. Develop food waste processing capacity in Kamloops Pilot Program $10,00 per year for two years Region Wide Reduction Campaign $25,000 per year for two years City of Kamloops Unknown Cost ThompsonNicola Regional District PRJ DRAFT PLAN
31 3. Assuming organic waste processing capacity is established for Kamloops, the proposed actions to be taken to ensure the composting facility receives organic waste feedstocks are as follows: a) Establish a residential organic waste collection service for the City of Kamloops b) Encourage ICI organic waste diversion in Kamloops The ICI sector is potentially the largest source of organic waste and the City will need to ensure that tools are employed to drive ICIgenerated organic waste to the facility rather than to the landfill as garbage. The possible tools to be employed include: Implementing disposal bans Offering cartbased collection service for small ICI generators Establishing a mandatory organic waste collection requirement for ICI generators of organic waste Promotion c) Developing consistent signage for use by haulers and generators 4. Consider processing and collection options for Sun Peaks It is proposed that the TNRD look into options for the management of organic waste generated at Sun Peaks. This includes the potential use of Kamloops processing capacity (if in place) or development of lowtech composting at Heffley Creek landfill. This process would include consultation with local area businesses and resident associations City of Kamloops Collection and Processing $650,000 per year City of Kamloops $10,000 per year for two years TNRD Composting Feasibility Study and Community Consultation $15,000 ThompsonNicola Regional District PRJ DRAFT PLAN
32 3.4 Increase Promotion and Education Most of the above noted new initiatives will require significant engagement with participating stakeholders to ensure the new program, policy or service is a success. The action items and cost estimates to achieve these goals are outlined in the table below. Actions Cost Estimate 1. Increase the TNRD s capacity to undertake promotion and education The need to increase TNRD s staff capacity to undertake solid wasterelated TNRD communication and education was identified early in the planning process. It is recommended that one fulltime person be hired to focus on solid waste managementrelated promotion and education (P&E). This person s role would be to: staff person One fulltime Undertake general communications regarding waste reduction and reuse for required. No the region additional Educate residents and businesses in regards to TNRD s current waste program costs management services required. Develop and implement the promotion and education associated with ICI diversion, C&D waste diversion and organic waste diversion Manage the zero waste education program for schools Liaise with member municipalities in regards to their promotion and education efforts and needs, aiming to improve effectiveness and costefficiency across the region. Similar promotion and education efforts will be needed in the City of Kamloops to undertake the initiatives listed in this Plan. Existing staff with public education duties will fulfill this role on behalf of the City. 2. Coordinate and collaborate with other local governments (Municipalities, First Nations) for promotion and education The TNRD will aim to engage member municipalities and First Nations in a process of coordinating solid waste related P&E to improve effectiveness and costefficiency of P&E efforts across the region. These engagement efforts will be an opportunity to share ideas, discuss outreach tools, and become informed on regional and local initiatives (e.g. disposal bans) that will need to be communicated to the public. 3. Develop annual P&E plans It is recommended that TNRD and the City of Kamloops prepare annual promotion and education plans for solid waste management that support existing programs, policies and services. These plans will be integral to the launch of new initiatives. The development of an annual plan will ensure adequate resources are allocated throughout the year to undertake critical initiatives. Additional staffing (included above) TNRD $5,000 Annually City of Kamloops 5,000 Annually ThompsonNicola Regional District PRJ DRAFT PLAN
33 4. Establish a Zero Waste Education Program for Schools The TNRD will establish a Zero Waste Education Program for Schools in the TNRD. It is anticipated this service would be contracted out and made available to schools throughout the TNRD. Program materials prepared by other regional districts could be used to develop program content for the TNRD. TNRD 20 Workshops $10, Increase and Maintain awareness to and participation in Extended Producer Responsibility Programs Action items to achieve these goals relating to maintaining and increasing awareness to and participation in Extended Producer Responsibility programs are outlined in the table below. Actions The TNRD and City will continue to provide EPR collection services at many of their waste management sites to provide a convenient one stop drop for residents. Note that not all EPR programs will be available at all TNRD and City sites. Private sector collection sites, such as bottle depots and returntoretail, will continue to play a critical role in the collection of EPRdesignated products. Cost Estimate No New Cost The following additional actions to encourage improved and expanded EPR services in the TNRD are also recommended: Lobby the provincial government and BC Producer Responsibility Organizations (stewardship agencies) to financially compensate collectors to a level that is commensurate with the level of service provided. Currently, a number of programs underfund or provide no funding to collectors. Support EPR initiatives that encourage or regulate manufacturers to use recyclable and recycled packaging materials and discourage excessive packaging. Lobby senior levels of government to expand EPR, particularly for the ICI component of packaging and printed paper (PPP). Continue to participate in the BC Product Stewardship Council: Encourage the Council to provide an annual report to the Province and Union of BC Municipalities, which will provide a report card on all aspects of EPR pertaining to servicing the interior and northern regional districts, along with recommendations for improvement. ThompsonNicola Regional District PRJ DRAFT PLAN
34 3.6 Encourage Proper disposal of Household Hazardous Waste To encourage proper disposal of Household Hazardous Waste (HHW), the City of Kamloops and TNRD will participate in the following actions: Actions It is recommended that the City and TNRD create a permanent HHW drop off depot in Kamloops to replace annual collection events in this area. This will ensure yearround access to proper disposal of nonepr HHW and will increase the convenience of disposal of these products (thereby decreasing the likelihood of them ending up in the garbage) for the largest population centre in the regional district. Collection events will continue to be held in areas where EPR collection sites for HHW are not available. Cost Estimate New Operating TNRD $100,000 City of Kamloops $100, Improve Effectiveness of Existing Bylaws The TNRD and the City of Kamloops both have bylaws in place pertaining to solid waste management, including disposal bans. To improve the effectiveness of these bylaws, the following action items are suggested: Actions To improve the effectiveness of solid waste bylaws, it is recommended that the TNRD and member municipalities review and update their solid waste bylaws with an aim to create consistency in terminology and to reflect the intentions in the updated solid waste management plan. In the vicinity of Kamloops, the bylaws governing the TNRD and City facilities should aim for consistency regarding disposal bans and tipping fees. Cost Estimate No New Cost It is recommended that the TNRD, in consultation with member municipalities, consider the need for waste stream management licensing or codes of practice bylaws once disposal bans and other diversion initiatives are in place. No New Cost ThompsonNicola Regional District PRJ DRAFT PLAN
35 3.8 Reduce prevalence of Illegal Dumping TNRD and many other local organizations have been actively tackling illegal dumping for several years. To continue to reduce the prevalence of illegal dumping, the following actions are recommended: Actions Continue to support community cleanup efforts through waiving of tipping fees. Continue to clean up illegal dump site and forward reports of illegal dumping to the Ministry of Environment. Collaborate with the Ministry of Environment to develop a regionwide illegal dumping strategy that can better harness the collective resources available in the region. This strategy may include the following actions: o Conduct a survey to determine the most common materials illegally discarded and the most frequent locations, providing a basis for types of materials and hot spots on which to build an awareness campaign and cleanup initiatives; o Conduct targeted outreach campaigns if/when specific problem groups can be identified; o Establish a reporting mechanism where residents and outdoor groups can report dumping location, to be targeted for contracted / volunteer cleanup; o Establish local area task forces to deal with problem areas; o Post signs at frequent illegal dumping sites to inform area users about reporting and prosecuting dumpers; and o Post cameras at frequent illegal dumping sites with an aim to provide evidence of dumping perpetrators; o Establish enforcement capacity. Cost Estimate No New Cost No New Cost No New Cost for strategy development o Establish a bylaw putting the onus for proper disposal on the municipal solid waste generator. In order to develop an effective illegal dumping strategy, the TNRD will engage with affected stakeholders including: Municipalities Forestry companies First Nations BC Hydro Utility Companies Backcountry user groups (mountain bikers, fishermen, etc.) ThompsonNicola Regional District PRJ DRAFT PLAN
36 3.9 Increase Efficiency of Residual Waste Management in the TNRD Three main changes to the Residuals Management System are recommended: Conversion of Heffley Creek Landfill to a C & D only site Closure of Barnhartvale Landfill. Development of Specified Risk Material Strategy The action items and costs associated with the above mentioned changes are outlined in the table below. A detailed cost analysis for the changes to the residuals system was presented in the April 7 th 2017 Residual Waste Management TNRD Landfill Economic Analysis memo seen in Schedule A. Actions Cost Estimate Convert Heffley Creek Landfill to DLC only site: It is recommended the Heffley Creek Landfill be converted to a TNRD Construction and Demolition only landfill site in At that time, Annual Cost Savings Municipal Solid Waste will continue to be accepted at all transfer $106,000 stations and EcoDepots; however no MSW will be landfilled at the Heffley Creek site. MSW previously destined for Heffley Creek will be hauled to Mission Flats instead. Prior to conversion of the site, Regional District staff should consult with large commercial customers, such as the Sun Peaks Grand Hotel, who have historically discharged waste at the site to discuss the implications of this change. The change to C &D only will reduce annual tonnage at the site and drastically reduce annual costs to the TNRD, while maintaining landfill airspace for the future. Accept increased MSW Tonnages from TNRD at Mission Flats Landfill The City of Kamloops will likely incur increased Capital and Operating costs due to receiving additional tonnage at the Mission Flats Landfill; however this will be offset by increased tipping fee revenue. Close Barnhartvale Landfill The landfill facility is costly to operate, and is nearing capacity. Closure of the site will reduce financial and environmental liability to the City of Kamloops Greater environmental controls are in place at Mission Flats landfill than at Barnhartvale landfill The small amount of waste previously landfilled at the site is expected to be disposed of at other local facilities. Curbside waste collection services will remain in place City of Kamloops Annual Cost Savings $287,000 City of Kamloops Closure Cost $1,350,000 Net Annual Post Closure Savings $181,000 ThompsonNicola Regional District PRJ DRAFT PLAN
37 3.10 Pursue Future Strategies and Ongoing Solutions The TNRD will support industry efforts to develop solutions to waste disposal and recycling needs. Some of the strategies and solutions considered include: Actions Specified Risk Material Management Strategy TNRD will work with industry representatives and other agencies and stakeholders to develop an industry strategy for dealing with SRM waste. The intent is to support industry efforts to establish a SRM management facility within the region, or other possible solution(s). Agricultural Plastic Recycling The TNRD will work with industry stakeholders to determine if there is a market available for agricultural plastics, such as silage bags and bale wrap, and if a centralized collection facility would be feasible. Cost Estimate No New Cost No New Cost Economic Development The TNRD will continue to encourage economic opportunities and development in the Solid Waste Management sector. No New Cost ThompsonNicola Regional District PRJ DRAFT PLAN
38 3.11 Ensure Ongoing Monitoring and Measurement It is recommended that the TNRD establish a Plan Monitoring Advisory Committee with a mandate to monitor the implementation of the Plan, evaluate its effectiveness, and advise the regional district regarding the Plan s ongoing implementation. On an annual basis, Regional District staff would compile data that reflects the status of the Plan s implementation and progress toward waste reduction targets. This data would be provided to the Plan Monitoring Advisory Committee. Actions Establish a Plan Monitoring Advisory Committee with a mandate to monitor the implementation of the plan, evaluate its effectiveness, and advise the regional district regarding the Plan s ongoing implementation. Cost Estimate No New Cost Continue to compile data annually on all of the residual disposal activities in the regional district, including residual waste handled by the public sector and the private sector, for reporting to the BC Ministry of Environment s online disposal calculator. Five years into the implementation of the Plan (in 2024), the TNRD should carry out a review of the plan s implementation and effectiveness. It is proposed that a multiseason waste composition study on the residual waste management stream be conducted at year 5. The Cost will be shared between TNRD and City of Kamloops No New Cost TNRD $20,000 TNRD $20,000 City of Kamloops $20, Resulting Diversion Potential The recommended actions have the potential reduce the amount of solid waste disposed in the TNRD by approximately 15,000 to 21,000 tonnes per year, as shown in Table 31 Estimated Diversion Potential. This would reduce the quantity of waste landfilled by 19 to 27% and reduce the per capita amount of waste landfilled from 621 kg per year to between 455 to 505 kg per year. These numbers represent an overall estimate for the entire region. Diversion estimates are seen in Table 31 Estimated Diversion Potential. ThompsonNicola Regional District PRJ DRAFT PLAN
39 Table 31 Estimated Diversion Potential ICI Diversion C&D Waste Diversion Organic Waste Diversion Total Estimated Disposal Reduction Potential 2,984 4,177 tonnes 5,010 7,013 tonnes 7,299 10,219 tonnes 15,292 21,409 tonnes This diversion will largely be derived from: Diverting commercially generated cardboard and paper to recycling through the implementation and enforcement of disposal bans Diverting wood waste to alternative markets Implementing collection of residential food waste in Kamloops Establishing mechanisms to drive commercial organic waste generated in the Kamloops area to an organic waste processing facility (once the facility is operational). It s recognized that even the most effective programs do not achieve 100% diversion of targeted waste materials (e.g. commercial cardboard, residential food waste), consequently, the diversion estimates reflect a potential capture rate of 5070% of the estimated quantity of the waste materials that are targeted for diversion in this plan. 4. FINANCE AND ADMINISTRATION As reflected throughout this plan, financial implications of the proposed solid waste management programs have been outlined for both the TNRD and the City of Kamloops. Funding to implement the actions identified in this RSMP is provided by residents and businesses through municipal taxes and tipping fees. The following breakdown is based on best available information at the time of the RSMP s development. Table 41 below, outlines the expenditures associated with each new program, as well as an implementation schedule (seen as highlighted cells) for the TNRD. Staffing implications for each of the action categories have also been included as the number of full time equivalents (FTE) required. The total estimated new staffing requirements for the TNRD, as shown in Table 41 range from 23 FTE s. Because the TNRD has the capacity to fund approximately 1.5 FTE s within the existing budget, the average additional staffing requirement between 2018 and 2028 will be 0.88 FTE s. The annual financial costs for implementing the RSWMP s action items and the additional staffing requirements for the TNRD range from a cost savings of $106,600 to a maximum expenditure of $139,600 between 2018 and The net ThompsonNicola Regional District PRJ DRAFT PLAN
40 average annual expenditure for the TNRD is $91,660 per year. The total 11 year expenditure is approximately $1,008,000. The total annual expenditures from these programs have been incorporated into the TNRD s Financial Plan, as seen in Table 42 TNRD Financial Plan below. As shown, existing annual expenditures for the TNRD s solid waste system are between 10.7 and 13.5 million dollars per year. The TNRD s solid waste system is funded mostly through taxes. Because of this, the implications of the RSWMP will be seen as a difference to the requisition required each year. Table 43 outlines the financial implications of the actions identified in this RSWMP to the City of Kamloops. As shown, the annual costs range from a cost savings of $287,000 to an annual cost of $696,148. It is important to note that the residual management expenditures in 2019/2020 which will be incurred during the closure of the Barnhartvale landfill already exist in a Closure Fund for the landfill; therefore, this expenditure will not result in increased tax requisition form Kamloops residents. The closure expense has been distributed over two years. The net average additional annual cost for the City of Kamloops is $385,500 with an approximate total expenditure of $4,225,000 between 2018 and These costs include the salary costs for the average annual additional FTE requirement (0.88 FTE per year). Additionally, between 2018 and 2024, the maximum total additional annual cost (excluding landfill closure) for the City of Kamloops is $45,000. Greater financial implications are seen in 2024 with the implementation of organics collection in the City. The capital costs for developing food waste management capacity in Kamloops have not been included as this cost is unknown. The financial implications from Table 43 have been inserted into the City of Kamloops Financial Plan, as shown in Table 44. For the purpose of this RSWMP, the revenues shown are assumed to be the same as 2017 revenues; future revenue projections are not available due to recent changes in the City of Kamloops rate structure and the acquisition of the KRRC. As shown, existing annual expenditures for the City of Kamloops Solid Waste Collection are between 9.8 and 11.6 million dollars. As seen in Table 44, The City of Kamloops solid waste system is more heavily funded on tipping fees than is the TNRD system. The estimated additional revenue that will be received from the TNRD s tipping fees is reflected in the costs for Residuals Management category. ThompsonNicola Regional District PRJ DRAFT PLAN
 2018 2019 2020 2021 2022 2023 2024 2025 2026 2027 2028 DIVERSION INITIATIVES ICI Diversion (top priority) 1. Continue to apply differential tipping fees $ $ $ $ $ $ $ $ $ $ 2.")

 0.50 0.50 0.50 0.25 0.")
41 Table 41 Estimated New Expenditures for the TNRD Solid Waste Management System Estimated NEW Solid Waste Management Expeditures for the TNRD Proposed Change Cost and Implementation Year (Action shown by highlighted cell) DIVERSION INITIATIVES ICI Diversion (top priority) 1. Continue to apply differential tipping fees $ $ $ $ $ $ $ $ $ $ 2. Implement disposal bans on recyclable materials $ 10,000 $ 10,000 $ $ $ $ $ $ $ $ 3. Assist haulers to encourage recycling by their customers $ 8,000 $ 4,000 $ 2, TNRD to encourage munis to implement mandatory ICI recycling $ 5. TNRD to encourage recycling space allocation in ICI and multifamily developments $ 6. Promote ICI diversion opportunities $ 20,000 $ 5,000 $ 5,000 $ 5,000 $ 5,000 $ 5,000 $ 5,000 $ 5,000 $ 5,000 New Staffing Requirements (FTE) CD Diversion (second priority) 1. Develop a CD waste diversion strategy Consult $ 10,000 $ 10, Create CD waste management toolkits for contractors and DIYers $ 5,000 $ 2,500 $ 2,500 New Staffing Requirements (FTE) Organic Waste (third priority) 1. Promote organic waste reduction $ 25,000 $ 25,000 (a) Establish a pilot project with one community Design $ 10,000 $ 10, Consider processing and collection options for Sun Peaks $ 15,000 New Staffing Requirements (FTE) Promotion and Education (key component of above priorities) 1. Increase Capacity to undertake P& E $ $ $ $ $ $ $ $ $ $ 2. Coordinate and collaborate with other local governments for P&E $ $ $ $ $ $ $ $ $ 3. Develop annual P&E plans $ 5,000 $ 5,000 $ 5,000 $ 5,000 $ 5,000 $ 5,000 $ 5,000 $ 5,000 $ 5,000 $ 5, Establish a Zero Waste Education Program for Schools $ 10,000 $ 10,000 $ 10,000 $ 10,000 $ 10,000 $ 10,000 $ 10,000 $ 10,000 $ 10,000 New Staffing Requirements (FTE) EPR 1. Encourage improved and expanded EPR services $ $ $ $ $ $ $ $ $ $ New Staffing Requirements (FTE) HHW 1. Establish permanent HHW depots $ 100,000 $ 100,000 $ 100,000 $ 100,000 $ 100,000 $ 100,000 $ 100,000 $ 100,000 $ 100,000 $ 100,000 New Staffing Requirements (FTE) Bylaws 1. Update solid waste bylaws with an aim for consistency (focus on Kamloops area) $ 2. Assess the need for facility licensing or codes of practice bylaws $ New Staffing Requirements (FTE) Illegal Dumping 1. Continue cleanups and supporting community initiatives $ $ $ $ $ $ $ $ $ $ 2. Establish a regionwide illegal dumping strategy $ $ $ $ $ $ $ $ $ $ New Staffing Requirements (FTE) Summary of Diversion Initiatives Total Estimated New Costs for Diversion Initiatives $ $ 115,000 $ 153,000 $ 120,000 $ 139,000 $ 130,000 $ 147,000 $ 132,500 $ 145,000 $ 145,000 $ 122,500 Total Estimated New Staffing Requirements for Diversion Initiatives RESIDUAL WASTE MANAGEMENT INITIATIVES Residuals Management 1. Convert Heffley Creek into DLC only Landfill Site $ 106,606 $ 106,606 $ 106,606 $ 106,606 $ 106,606 $ 106,606 $ 106,606 $ 106,606 $ 106,606 $ 106,606 $ 106, Develop SRM Management Strategy $ $ $ $ $ $ $ $ $ $ 4. Develop Agricultural Plastic Strategy $ $ $ $ $ $ $ $ $ $ New Staffing Requirements (FTE) Summary of Residual Waste Initiatives Total Estimated New Costs for Residuals Management $ 106,606 $ 106,606 $ 106,606 $ 106,606 $ 106,606 $ 106,606 $ 106,606 $ 106,606 $ 106,606 $ 106,606 $ 106,606 Total Estimated New Staffing Requirements for Residuals Management PLAN MONITORING AND MEASUREMENT 1. Establish Plan Monitoring Advisory Committee $ $ $ $ $ $ $ $ $ $ 2. Report annually to the BC Disposal Calculator $ $ $ $ $ $ $ $ $ $ 3. FiveYear Plan Effectiveness Review $ 20, Waste Composition Study $ 20,000 New Staffing Requirements (FTE) Summary of Plan Monitoring and Measurement Total Estimated New Costs for Plan Monitoring and Measurement $ $ $ $ $ $ 20,000 $ 20,000 $ $ $ $ Total Estimated New Staffing Requirements for Plan Monitoring and Measurement STAFFING IMPLICATIONS Total Estimated New Staffing Requirements (A): New staffing portion that can be funded from existing program budgets (B): New staffing portion that can requires operating budget increase (AB): Average 10year staffing requirement Summary of Staffing Implications Annual Cost for 0.88 FTE $ 79,200 $ 79,200 $ 79,200 $ 79,200 $ 79,200 $ 79,200 $ 79,200 $ 79,200 $ 79,200 $ 79,200 FINANCIAL IMPLICATIONS OF ALL Total Estimated New Costs for Diversion Initiatives $ $ 115,000 $ 153,000 $ 120,000 $ 139,000 $ 130,000 $ 147,000 $ 132,500 $ 145,000 $ 145,000 $ 122,500 Total Estimated New Costs for Residuals Management $ 106,606 $ 106,606 $ 106,606 $ 106,606 $ 106,606 $ 106,606 $ 106,606 $ 106,606 $ 106,606 $ 106,606 $ 106,606 Total Estimated New Costs for Plan Monitoring and Measurement $ $ $ $ $ $ 20,000 $ 20,000 $ $ $ $ Cost Implications of Staff Requirement $ $ 79,200 $ 79,200 $ 79,200 $ 79,200 $ 79,200 $ 79,200 $ 79,200 $ 79,200 $ 79,200 $ 79,200 TOTAL $ 106,606 $ 87,594 $ 125,594 $ 92,594 $ 111,594 $ 122,594 $ 139,594 $ 105,094 $ 117,594 $ 117,594 $ 95,094 NetAverage Annual Expenditure $ 91, year Expenditure $ 1,008,339 ThompsonNicola Regional District PRJ DRAFT PLAN


42 Table 42 TNRD Financial Plan TNRD Financial Plan Solid Waste Management Existing Program Expenditures Salaries $ 770, $ 781, $ 793, $ 809, $ 825, $ 842, Employee benefits $ 193, $ 185, $ 188, $ 191, $ 195, $ 199, Staff Development $ 26, $ 26, $ 26, $ 26, $ 26, $ 26, Furniture, equipment & vehicles $ 72, $ 72, $ 72, $ 72, $ 72, $ 72, Maintenance operating Landfills $ 1,150, $ 1,216, $ 1,451, $ 1,463, $ 1,486, $ 1,539, Maintenance ecodepots $ 5,199, $ 6,267, $ 6,217, $ 6,337, $ 6,458, $ 6,583, Improvements operating landfills $ 494, $ 544, $ 469, $ 469, $ 469, $ 829, Improvements Transfer stations $ 820, $ 708, $ 510, $ 240, $ 215, $ 215, Closed Landfill $ 900, $ 240, $ 140, $ 140, $ 140, $ 140, Waste reduction/education $ 350, $ 300, $ 300, $ 300, $ 300, $ 300, Advertising $ 7, $ 7, $ 7, $ 7, $ 7, $ 7, General $ 59, $ 59, $ 59, $ 59, $ 59, $ 59, Insurance $ 40, $ 32, $ 32, $ 32, $ 32, $ 32, Office Travel $ 61, $ 61, $ 61, $ 61, $ 61, $ 61, Outside office costs $ 26, $ 26, $ 26, $ 26, $ 26, $ 26, Debt payments Transfer to Operating Reserve $ 3,167, $ 2,397, Amortization Administration charge $ 251, $ 319, $ 480, $ 485, $ 493, $ 506, Total Existing Expenditures $ 13,591, $ 13,247, $ 10,837, $ 10,724, $ 10,871, $ 11,441, New Program Expenditures Total Estimated New Costs for Diversion Initiatives $ $ 115,000 $ 153,000 $ 120,000 Total Estimated New Costs for Residuals Management $ 106,606 $ 106,606 $ 106,606 $ 106,606 Total Estimated New Costs for Plan Monitoring and Measurement $ $ $ $ Cost Implications of Staff Requirement $ $ 79,200 $ 79,200 $ 79,200 Total New Expenditures $ 106,606 $ 87,594 $ 125,594 $ 92,594 Grand Total Expenditures $ 13,591, $ 13,247, $ 10,731,141 $ 10,811,861 $ 10,997,205 $ 11,534,492 Revenue Requisition $ 7,725, $ 7,725, $ 7,725, $ 7,725, $ 7,725, $ 7,725, Contracts/Tipping Fees $ 2,386, $ 2,440, $ 2,340, $ 2,375, $ 2,525, $ 2,525, Grants/Gas tax funds Interest revenue $ 7, $ 7, $ 7, $ 7, $ 7, $ 7, Misc Revenue/Op. Reserve $ 765, $ 616, $ 614, $ 1,184, Transfer from TCA surplus Prior year's surplus $ 3,471, $ 3,074, Total Revenue $ 13,591, $ 13,247, $ 10,837, $ 10,724, $ 10,871, $ 11,441, NET Cost Implications $ $ $ 106, $ 87, $ 125, $ 92, ThompsonNicola Regional District PRJ DRAFT PLAN
 2018 2019 2020 2021 2022 2023 2024 2025 2026 2027 2028 DIVERSION INITIATIVES ICI Diversion (top priority) 1.")
43 Table 43 Estimated New Solid Waste Management Expenditures for the City of Kamloops Estimated NEW Solid Waste Management Expeditures for the City of Kamloops Proposed Change Cost and Implementation Year (Action shown by highlighted cell) DIVERSION INITIATIVES ICI Diversion (top priority) 1. Continue to apply differential tipping fees $ $ $ $ $ $ $ $ $ $ 2. Implement disposal bans on recyclable materials $ 10,000 $ 10, Require recycling collection services at all ICI locations $ 10,000 $ $ $ $ $ $ $ $ 5. Establish mandatory space allocation in ICI and multifamily developments $ $ $ $ $ $ $ $ $ $ New Staffing Requirements (FTE) CD Diversion (second priority) 1. Develop a CD waste diversion strategy Consult $ 10,000 $ 10, Continue to distribute a CD waste management toolkit to contractors $ $ $ $ $ $ $ $ $ $ 3. City of Kamloops Wood waste Diversion to Cogen Facility $ 300,000 $ 300,000 $ 300,000 $ 300,000 $ 300,000 $ 300,000 $ 300,000 $ 300,000 $ 300,000 New Staffing Requirements (FTE) Organic Waste (third priority) 1. Promote organic waste reduction (through TNRD) $ $ 2. Develop food waste composting capacity in Kamloops Unknown 3. Once composting capacity is established for Kamloops: a) Establish a collection service for the City of Kamloops Design $ 650,000 $ 650,000 $ 650,000 $ 650,000 $ 650,000 b) Encourage ICI organic waste diversion in Kamloops $ 10,000 $ 10,000 New Staffing Requirements (FTE) Promotion and Education (key component of above priorities) 2. Collaborate with other local governments for P&E $ $ $ $ $ $ $ $ $ $ 3. Develop annual P&E plans $ 5,000 $ 5,000 $ 5,000 $ 5,000 $ 5,000 $ 5,000 $ 5,000 $ 5,000 $ 5,000 $ 5,000 New Staffing Requirements (FTE) HHW 1. Establish permanent HHW depots $ 100,000 $ 100,000 $ 100,000 $ 100,000 $ 100,000 $ 100,000 $ 100,000 $ 100,000 $ 100,000 $ 100,000 New Staffing Requirements (FTE) Bylaws 1. Update solid waste bylaws $ $ New Staffing Requirements (FTE) Illegal Dumping 1. Participate in the development of a regional illegal dumping strategy $ $ $ $ $ $ $ $ $ $ New Staffing Requirements (FTE) Summary of Diversion Initiatives Total Estimated New Costs for Diversion Initiatives $ $ 115,000 $ 425,000 $ 405,000 $ 415,000 $ 415,000 $ 1,065,000 $ 1,065,000 $ 1,055,000 $ 1,055,000 $ 1,055,000 Total Estimated New Staffing Requirements for Diversion Initiatives RESIDUAL WASTE MANAGEMENT INITIATIVES Residuals Management 1. Convert Heffley Creek into DLC only Landfill Site (Revenue from Tipping) $ 287,211 $ 287,211 $ 287,211 $ 287,211 $ 287,211 $ 287,211 $ 287,211 $ 287,211 $ 287,211 $ 287,211 $ 287, Close Barnhartvale Landfill $ 479,159 $ 479,159 $ 181,841 $ 181,841 $ 181,841 $ 181,841 $ 181,841 $ 181,841 $ 181,841 $ 181,841 New Staffing Requirements (FTE) Summary of Residual Waste Initiatives Total Estimated New Costs for Residuals Management $ 287,211 $ 191,948 $ 191,948 $ 469,052 $ 469,052 $ 469,052 $ 469,052 $ 469,052 $ 469,052 $ 469,052 $ 469,052 Total Estimated New Staffing Requirements for Residuals Management PLAN MONITORING AND MEASUREMENT 1. Participate on the Plan Monitoring Advisory Committee $ $ $ $ $ $ $ $ $ $ 2. Report annually to the BC Disposal Calculator (via TNRD) $ $ $ $ $ $ $ $ $ $ 3. FiveYear Plan Effectiveness Review (in collaboration with TNRD) $ 4. Waste Composition Study (in collaboration with TNRD) $ 20,000 New Staffing Requirements (FTE) Summary of Plan Monitoring and Measurement Total Estimated New Costs for Plan Monitoring and Measurement $ $ $ $ $ $ 20,000 $ $ $ $ $ otal Estimated New Staffing Requirements for Plan Monitoring and Measurement STAFFING IMPLICATIONS Total Estimated New Staffing Requirements Average 10year staffing requirement 0.88 Summary of Staffing Implications Annual Cost for 0.88 FTE $ 79,200 $ 79,200 $ 79,200 $ 79,200 $ 79,200 $ 79,200 $ 79,200 $ 79,200 $ 79,200 $ 79,200 FINANCIAL IMPLICATIONS OF ALL Total Estimated New Costs for Diversion Initiatives $ $ 115,000 $ 425,000 $ 405,000 $ 415,000 $ 415,000 $ 1,065,000 $ 1,065,000 $ 1,055,000 $ 1,055,000 $ 1,055,000 Total Estimated New Costs for Residuals Management $ 287,211 $ 191,948 $ 191,948 $ 469,052 $ 469,052 $ 469,052 $ 469,052 $ 469,052 $ 469,052 $ 469,052 $ 469,052 Total Estimated New Costs for Plan Monitoring and Measurement $ $ $ $ $ $ 20,000 $ $ $ $ $ Cost Implications of Staff Requirement $ $ 79,200 $ 79,200 $ 79,200 $ 79,200 $ 79,200 $ 79,200 $ 79,200 $ 79,200 $ 79,200 $ 79,200 TOTAL $ 287,211 $ 386,148 $ 696,148 $ 15,148 $ 25,148 $ 45,148 $ 675,148 $ 675,148 $ 665,148 $ 665,148 $ 665,148 NetAverage Annual Expenditure $ 384, year Expenditure $ 4,226,273 ThompsonNicola Regional District PRJ DRAFT PLAN


44 Table 44 City of Kamloops Financial Plan City of Kamloops Financial Plan Solid Waste Collection and Disposal Existing Program Expenditures Salaries, Wages and benefits $ 2,327, $ 2,350, $ 2,397, $ 2,445, $ 2,493, $ 2,543, Personnel expenses $ 9, $ 12, $ 12, $ 12, $ 12, $ 13, Contractual Services $ 3,958, $ 4,133, $ 4,216, $ 4,300, $ 4,386, $ 4,474, Supplies and other Expenses $ 664, $ 643, $ 646, $ 650, $ 654, $ 658, Transfers from other functions $ 6,078, $ 6,084, $ 6,845, $ 7,032, $ 7,046, $ 7,060, Transfers to other functions $ 3,178, $ 3,191, $ 3,191, $ 3,191, $ 3,191, $ 3,191, Total Existing Expenditures $ 9,861, $ 10,032, $ 10,926, $ 11,249, $ 11,402, $ 11,558, New Program Expenditures Total Estimated New Costs for Diversion Initiatives $ $ 115, $ 425, $ 405, Total Estimated New Costs for Residuals Management $ 287, $ 191, $ 191, $ 469, Total Estimated New Costs for Plan Monitoring and Measurement $ $ $ $ Cost Implications of Staff Requirement $ $ 79, $ 79, $ 79, Total New Program Expenditures $ 287, $ 386, $ 696, $ 15, Grand Total Expenditure $ 9,861, $ 10,032, $ 10,639, $ 11,635, $ 12,098, $ 11,573, Revenue Fees, rate, and sales of service $ 10,201, $ 10,811, $ 10,811, $ 10,811, $ 10,811, $ 10,811, Total Revenue Generated $ 10,201, $ 10,811, $ 10,811, $ 10,811, $ 10,811, $ 10,811, Net Cost Implications $ 339, $ 778, $ 171, $ 824, $ 1,287, $ 762, ThompsonNicola Regional District PRJ DRAFT PLAN
45 5. PLAN IMPLEMENTATION 5.1 Implementation Schedule A timeframe for implementing each plan strategy and action is shown through highlighted cells in Table 41 and Table 43 above. Further, the implementation schedule is summarized in Table 51. Proposed implementation dates will be contingent upon the timing of the plan s approval by the Ministry of Environment and the amount of resources available for the implementation of the strategies. The implementation schedule will be reviewed in line with the TNRD and City of Kamloops annual budget cycle. The plan monitoring advisory committee will provide input into any amendments to this schedule and the TNRD will notify all affected parties on amendments to the schedule. 5.2 Annual Reporting It is recommended that TNRD continue to compile data annually on all of the residual disposal activities in the regional district, including residual waste handled by the public sector and the private sector, for reporting to the BC Ministry of Environment s online disposal calculator. In addition, the TNRD will prepare an annual report to the Regional District Board and provide links on the TNRD website to reports provided to the Board in relation to the Plan. Topics that will be included in the report include: Programs delivered each year and how they support the waste management hierarchy, especially the first three Rs (reduce, reuse, recycle) Economic development related to solid waste management in the region Challenges or opportunities identified by the plan monitoring advisory committee Monitoring data for closed sites Compliance activities Landfill gas capture and reuse Spills, leaks and leachate collected at facilities Wildlife interactions and control measures 5.3 Five Year Effectiveness Review As discussed in Section 3.11, the TNRD will carry out a review and report on the Plan s implementation and effectiveness in A link to the report will be provided on the TNRD s website. The review may include: Overview of all programs or actions undertaken in first five years to support the Plan goals and targets, including status and implementation costs for each. Description and forecasted budget for programs or actions not yet started and status, including explanations for delays or cancellations of Plan components. 42 ThompsonNicola Regional District Regional PRJ DRAFT PLAN
46 Fiveyear trend information for waste disposal per person. Fiveyear trend of greenhouse gases emitted and avoided, if available. Any significant changes that might impact the solid waste management system over the next five years. In advance of the 5year review noted above, it is proposed that a multiseason waste composition study on the residual waste management stream be conducted at year 5. If appropriate, the waste composition study should be conducted again, in advance of the next RSWMP update to assess the success of current waste diversion programs and policies and identify opportunities for additional diversion. 5.4 Plan Amendments This plan represents the current understanding and approach to the solid waste management challenges being faced by the TNRD. The plan is a living document that may be amended to reflect new considerations, technologies and issues, should they arise. Due to changing circumstances and priorities that may evolve over time, and with the input of the plan monitoring advisory committee and interested parties, all major actions identified in the Plan will be reviewed for appropriateness before implementation. This will generally occur on an annual basis. The Plan s implementation schedule will be flexible enough to reflect the availability of technologies that may arise over time, as well as the potential changes in regional issues and priorities. In addition, it will also take into account the financial priorities of the TNRD its member municipalities and other partners, the availability of funding to undertake Plan activities, and the availability of contractors and service providers. 43 ThompsonNicola Regional District Regional PRJ DRAFT PLAN
47 TNRD and City of Kamloops: Table 51 Implementation Schedule Implement disposal bans on recyclable materials Develop an annual promotion / education plan, and coordinate/collaborate with other local governments Establish permanent HHW depots Update bylaws with an aim for consistency in the Kamloops area TNRD: Promote ICI diversion opportunities Assist haulers to encourage recycling by their customers Establish a zero waste education program for schools Convert Heffley Creek to C & D Only Site Establish a Plan Monitoring Committee Begin working on a regionwide illegal dumping strategy City of Kamloops: Require recycling collection at all ICI locations Close Barnhartvale Landfill TNRD and City of Kamloops: Establish mandatory space allocation in ICI and multifamily developments Begin development of a C & D waste diversion strategy Begin working on a regionwide illegal dumping strategy TNRD: Encourage municipalities to implement mandatory ICI recycling Encourage recycling space allocation in ICI and multifamily developments Create C & D waste management toolkits for contractors and DIYers Establish a Plan Monitoring Committee TNRD and City of Kamloops: Conduct a waste composition study Prepare a Fiveyear Plan Effectiveness Review TNRD: Design and implement an organic waste reduction pilot project Assess the need for facility licensing or codes of practice bylaws Develop food waste processing capacity TNRD and City of Kamloops: Promote organic waste reduction Consider organic waste processing and collection options for Sun Peaks City of Kamloops: Design and implement organic waste collection service Encourage ICI organic waste diversion 44 ThompsonNicola Regional District Regional PRJ DRAFT PLAN

48 6. PLAN SCHEDULES Schedule A: Plan Reports & Consultation Report Provides links to planning technical reports and the public consultation report. 45 ThompsonNicola Regional District Regional PRJ DRAFT PLAN
49 Schedule A
50 TABLE OF CONTENTS RSWMP STAGE 1 CHARACTERIZATION OF EXISTING SYSTEM REPORT...3 TECHNICAL MEMORANDUM RESIDUAL WASTE MANAGEMENT TECHNICAL MEMORANDUM SOLID WASTE POLICIES, BYLAWS & ENFORCEMENT TECHNICAL MEMORANDUM FINANCIAL IMPLICATIONS ThompsonNicola Regional District Regional PRJ16048 i
51 Thompson Nicola Regional District Regional Solid Waste Management Plan Review STAGE 1 Characterization of Existing System Report
52 CONFIDENTIALITY AND COPYRIGHT This document is for the sole use of the addressee and Sperling Hansen Associates Inc. The document contains proprietary and confidential information that shall not be reproduced in any manner or disclosed to or discussed with any other parties without the express written permission of Sperling Hansen Associates Inc. Information in the document is to be considered the intellectual property of Sperling Hansen Associates Inc. in accordance with Canadian copyright law. This report was prepared by Sperling Hansen Associates Inc. for the account of Thompson Nicola Regional District. The material in it reflects the best judgment of Sperling Hansen Associates Inc. in the light of the information available to it, at the time of preparation. Any use which a third party makes of this report, or any reliance on or decisions to be made based on it, are the responsibility of such third parties. Sperling Hansen Associates Inc. accepts no responsibility for damages, if any, suffered by third party as a result of decisions made or actions based on this report.
53 Landfill Engineering Landfill Gas Management Solid Waste Planning Environmental Monitoring Landfill Fire Control February 3 rd, 2017 SHA PRJ16048 Mr. Jamie Vieira, BNRS, P.Ag. Manager of Environmental Services ThompsonNicola Regional District RE: Thompson Nicola Regional District Solid Waste Management Plan Review Stage 1 Characterization of Existing System Report Dear Jamie: This document presents a compilation of the Stage 1 Review of your Solid Waste Management Plan that has been completed by Sperling Hansen Associates (SHA), together with Maura Walker Associates (MWA) and Jan Enns Communications (JEC). The purpose of Stage 1 of the plan was to fully understand and quantify the existing system. Work is also ongoing on our initial Public Consultation, but the results of the initial survey will be submitted a few weeks later. The goal of the survey is to obtain input from the public on their level of satisfaction with the existing system and where the Thompson Nicola Regional District (TNRD) should be focusing future resources to further improve service delivery and make the program more sustainable. This report is organized into six sections as follows: 1) Introduction and Overview, 2) Describing the Solid Waste System, 3) Quantifying the Solid Waste System, 4) Understanding System Costs, 5) Benchmarking Comparison, and 6) Review of Bylaws and Regulations. The Stage 1 work was carried out between November 21 st, 2016 and February 3 rd, A two day site visit by key project staff was conducted on Jan. 25 th and 26 th, We trust this report will provide the Technical Advisory Committee, the Public Advisory Committee and the TNRD Board with a solid information base to move into the Stage 2 Assessment of options. Please contact us if you have any questions about this report. Yours truly, SPERLING HANSEN ASSOCIATES Dr. Tony Sperling, P.Eng. President February 3 rd, 2017 North Vancouver Office East Keith Road, North Vancouver, British Columbia, V7J 1J3 Phone (604) Fax (604) Kamloops Office 1332 McGill Road, Kamloops, British Columbia, V2C 6N6 Phone (778) Fax (778)
54 TABLE OF CONTENTS EXECUTIVE SUMMARY GLOSSARY 1. INTRODUCTION 1.1 OBJECTIVES IMPLEMENTATION OF 2008 SWMP OVERVIEW OF TNRD FACILITIES OVERVIEW OF COST RECOVERY DESCRIBING THE SYSTEM 2.1 GEOGRAPHIC SETTING POPULATION MUNICIPALITIES AND FIRST NATIONS CURRENT WASTE SYSTEM EXTENDED PRODUCER RESPONSIBILITY PROGRAMS REDUCTION AND REUSE PROGRAMS RECYCLING PROGRAMS CURBSIDE RESIDENTIAL RECYCLING ICI RECYCLING RECYCLING AT TNRD ECODEPOTS AND RESIDENTIAL SERVICE SITES ThompsonNicola Regional District i Characterization of Existing System Report PRJ16048 STAGE 1 REPORT
55 TNRD ECODEPOTS RESIDENTIAL SERVICE SITES PLUS RESIDENTIAL SERVICE SITES RECYCLING AT STEWARDSHIP FUNDED PRIVATE SECTOR DEPOT CENTRALIZED COMPOSTING BACK YARD COMPOSTING DIVERSION OF DLC WASTE WOOD WASTE DIVERSION ROOFING SHINGLE DIVERSION BROKEN CONCRETE DIVERSION CONTAMINATED SOIL DIVERSION COLLECTION PROGRAMS CURBSIDE COLLECTION OF RESIDENTIAL MSW AND RECYCLABLES COLLECTION OF COMMERCIAL SOLID WASTE LANDFILLS LOWER NICOLA LANDFILL HEFFLEY CREEK LANDFILL BARRIERE LANDFILL CLEARWATER LANDFILL CHASE LANDFILL ThompsonNicola Regional District ii Characterization of Existing System Report PRJ16048 STAGE 1 REPORT
56 MISSION FLATS LANDFILL KAMLOOPS RESOURCE RECOVERY LANDFILL BARNHARTVALE LANDFILL CACHE CREEK LANDFILLEXTENSION BLACKWELL DAIRY LANDFILL MOUNT PAUL LANDFILL EDUCATION PROGRAMS ILLEGAL DUMPING PREVENTION ADMINISTRATION OF SYSTEM GHG REDUCTIONS INTERREGIONAL COLLABORATION QUANTIFYING THE SYSTEM 3.1 WASTE DEFINITIONS SOURCE IN INCOMING WASTE SOLID WASTE TONNAGES RECYCLING TONNAGES STEWARDSHIP PER CAPITA WASTE GENERATION PER CAPITA WASTE DISPOSAL WASTE COMPOSITION ThompsonNicola Regional District iii Characterization of Existing System Report PRJ16048 STAGE 1 REPORT
57 3.8 TEMPORAL CHANGES, ACHIEVING SWMP GOALS SYSTEM COSTS 4.1 TOTAL SYSTEM COST COST OF ECODEPOTS COST OF RECYCLING DEPOTS COST OF TRANSFER STATIONS COST OF RECYCLING REGIONAL LANDFILLS COST OF CITY OF KAMLOOPS LANDFILLS LANDFILL CLOSURES COST OF CINNAMON RIDGE COMPOSTING FACILITY COST OF WOOD DIVERSION COST OF MUNICIPAL WASTE COLLECTION BENCHMARKING COMPARISON 5.1 OVERVIEW OF REGIONAL DISTRICTS RESULTS OF BENCHMARKING ANALYSIS BYLAWS AND REGULATIONS 6.1 REGIONAL AND MUNICIPAL BYLAWS THOMPSONNICOLA REGIONAL DISTRICT ThompsonNicola Regional District iv Characterization of Existing System Report PRJ16048 STAGE 1 REPORT
58 CITY OF KAMLOOPS CITY OF MERRITT VILLAGE OF CACHE CREEK VILLAGE OF ASHCROFT PROVINCIAL POLICIES AND LEGISLATION ENVIRONMENTAL MANAGEMENT ACT RECYCLING REGULATION OPEN BURNING SMOKE CONTROL REGULATION ORGANIC MATTER RECYCLING REGULATION (OMRR) LANDFILL CRITERIA FOR MUNICIPAL SOLID WASTE GUIDELINES FOR ENVIRONMENTAL MONITORING AT MSW LANDFILLS LANDFILL GAS MANAGEMENT REGULATION ThompsonNicola Regional District v Characterization of Existing System Report PRJ16048 STAGE 1 REPORT
59 EXECUTIVE SUMMARY The ThompsonNicola Regional District (TNRD) is responsible for coordinating and administering the solid waste management function in the ThompsonNicola region including the operation of 29 attended depots, two landfills, a limited curbside collection program and shared operation of four unattended recycling depots. As well, the TNRD manages diversion of wood waste, large appliances, scrap metal, broken concrete and asphalt shingles with private contractors and partners with 12 of 13 active Stewardship programs in B.C. to maximize diversion of solid waste from landfills. Objectives: The purpose of this Stage 1 report is to characterize the current TNRD Solid Waste System and the many initiatives that have been implemented by the TNRD since 2008, when the first Regional Solid Waste Management Plan (SWMP) was adopted, and to flag potential opportunities for improvements to the system. Implementation of 2008 SWMP: Since the previous SWMP was adopted in 2008, the TNRD has achieved most of the goals laid out in that plan. The Diversion goal of 30% relative to 2004 has been exceeded. It is estimated that today, the TNRD managed system has reduced the amount of waste landfilled by 64% percent relative to 2004 levels. Closure of three smaller landfills and numerous small transfer stations has resulted in a more efficient system. Ten new full service EcoDepots have been established, including the Big Five EcoDepots at Heffley Creek, Lower Nicola, South Thompson (at Pritchard), Louis Creek and Clearwater. User pay has been adopted with tipping fee levels set sufficiently high to encourage diversion practices, especially for clean wood and asphalt roofing. Although material bans have been adopted in TNRD s Bylaw 2465, full implementation and a rollout of an education and enforcement program has not been completed to date. This has been identified as a high priority for the TNRD as a next step towards waste reduction. Numerous municipalities in the TNRD have adopted the highly efficient single stream blue bag system for recyclable material diversion at the curb including the City of Kamloops. Stewardship services engagement was a high priority in the 2008 SWMP. The TNRD has succeeded in partnering with 12 of 13 Stewardship agencies at its Eco Depots. The only stewardship program that is currently not engaged at the TNRD s Eco Depots is Recycle BC, formerly Multi Material B.C. Recycle BC has recently announced that it will be supporting the City of Kamloops residential recycling program. TNRD is currently seeking financial support from Recycle BC for residential recycling services offered at the Eco Depot and transfer stations.. Population: The TNRD covers over 44,000 square kilometers. As such, it is one of the largest regional districts in B.C. The current TNRD population, based on the 2016 census, is 132,663 residents, comprised of 109,769 residents in the eleven municipalities (urban), 15,972 residents residing in rural Electoral Areas, and 6,922 residents on First Nations Reserves ThompsonNicola Regional District i Characterization of Existing System Report PRJ16048 STAGE 1 REPORT
60 Recycling Programs: The TNRD has fully embraced the principles of the 5R s: Reduce, Reuse, Recycle, Recover and Residuals management. The following recycling programs have been implemented: Curbside Residential Recycling ICI Recycling Recycling at TNRD Eco Depots and Residential Service Sites Recycling at Stewardship Funded Depots Centralized Yard Waste Composting Back Yard Composting Wood Waste Diversion Asphalt Roofing Shingle Diversion Broken Concrete Diversion Contaminated Soil Diversion Deconstruction of mattresses The majority of diversion activity is achieved at the TNRD s 10 Eco Depots. These facilities accept the following recyclables free of charge: Green waste including yard waste and brush Cooling Appliances (fridges, freezers, AC units) Clean dimensional lumber and pallets Electronics Propane bottles and canisters Blue bag recyclables Non refrigerated appliances and scrap metal Batteries Tires Household hazardous waste and paints As well, the EcoDepots provide a one stop shop where residents and commercial haulers can drop of garbage, construction, renovation and demolitions wastes, roofing shingles, broken concrete, clean and contaminated wood waste and mattresses. Variable tipping fees apply to these materials. TNRD has recently implemented a successful diversion program for wood waste whereby that material is chipped and diverted for energy recovery. Currently, that material is hauled to the Atlantic Power biomass cogen facility in Williams Lake. The City of Kamloops operates an automated single stream curbside collection program for blue bag recyclables as well at their recycling facilities at the Mission Flats and Barnhartvale landfills. The City recently purchased Owl Road Landfill and is repurposing that facility to the Kamloops Resource Recovery Centre (KRRC). As well, the City operates a large scale yard waste composting operation at Cinnamon Ridge. Collection Programs: Collection of garbage has remained a municipal responsibility. The major municipalities, including the City of Kamloops, Merritt, Chase, Logan Lake, Barriere and Blue River, support curbside collection programs for garbage and recyclables. The City of Kamloops hauls its recyclables directly to Emterra s baling facility in Valleyview, and all other municipalities consolidate ThompsonNicola Regional District ii Characterization of Existing System Report PRJ16048 STAGE 1 REPORT
61 their recyclables at nearby TNRD Eco Depots. Starting April 1, 2017 the City of Kamloops blue bag program will be funded by Recycle BC. Landfills: Currently there are eight active landfills within the TNRD and three landfills which have been closed since the latest RSWMP was adopted in The TNRD operates two sites, one in Lower Nicola and the other in Heffley Creek. The City of Kamloops operates three sites, one along the South Thompson River in Mission Flats, one in Barnhartvale and the recently purchased site in Valleyview which has been renamed the Kamloops Resource Recovery Center. There are two privately owned landfills, one located in Cache Creek operated in partnership between Belkorp Environmental Services (BESI) and the Village of Cache Creek and the other owned and operated by Blackwell Dairy in Barnhartvale. The Tk emlups Indian Band also owns and operates a small landfill facility along the east side of Hwy #5 near the Paul Lake Rd. interchange. The Cache Creek Landfill closed to out of region waste on July 31 st, 2016 and to TNRD waste on December 15 th, BESI s Cache Creek Landfill Extension has been approved as a new landfill as per an Environmental Certificate issued in January The Extension received it s Operating Certificate in late 2016 and is permitted to landfill 750,000 tonnes of municipal solid waste (MSW) per year. The landfill is under construction and is scheduled to begin receiving waste in Solid Waste Tonnages: Since scales were implemented at most TNRD landfills and EcoDepots, the TNRD has been accurately tracking incoming waste and recyclables. Three full years of accurate data have now been compiled for 2014, 2015 and The total tonnes of MSW processed by the TNRD managed system were 29,178 tonnes, 31,372 tonnes, and 26,825 tonnes respectively. The total tonnage of waste generated by the City of Kamloops was 93,480.9 tonnes in Waste Diversion: Waste diversion levels in the TNRD have increased steadily from 21% in 2014, to 29% in 2015 and 36% in Diversion rates of about 50% could achieved on full implementation of material recycling bans, particularly in the ICI sector. Diversion of about 70% could be realized with implementation of an aggressive organics diversion program including banning organic waste from disposal as garbage. Waste Generation and Disposal: On a per capita basis, residents participating in the TNRD managed system have achieved a per capita waste generation rate of 681 Kg/person per year and residuals landfilled rate of 437 Kg/person per year in The TNRD waste disposal rate is better than the provincial average which was 497 kg per capita in The waste generation rate for the City of Kamloops was 1,035 Kg/person per year and the residuals landfilled rate was 702 Kg/person per year. Combining the 2016 statistics for the entire regional system, including both TNRD and City of Kamloops programs, the regional waste generation rate was 928 Kg/person and a landfilled rate of 621 Kg/person. Table 1 provides a convenient comparative reference to the above statistics. ThompsonNicola Regional District iii Characterization of Existing System Report PRJ16048 STAGE 1 REPORT
62 Table Waste generation and disposal rate estimates in the TNRD. Population Total MSW Generated (Tonnes) Waste Generation Rate (kg/person/ Yr) Total MSW Landfilled (Tonnes) Waste Disposal Rate (kg/pers on/yr) TNRD Only System (Excluding Tk'emlups te Secwepemc) 39,362 26, , CoK Only System 90,280 93,481 1,035 63, Total TNRD System (Excluding Tk'emlups te Secwepemc) 129, , , *Note Tk emlups te Secwepemc First Nation population data is excluded as their waste is managed at the Mt. Paul Landfill and is not represented in the above recorded tonnage. Waste Characterization: In 2011, the TNRD conducted a waste characterization study at six landfills and two transfer stations in the TNRD to provide an indication of what types of waste continue to be landfilled and by whom. The pie chart below shows the proportion of the various waste materials being landfilled, based on weight. The results of this study indicate that about three quarters of the waste stream can be composted, recycled, or managed through Extended Producer Responsibility programs. A key conclusion of the waste composition study is that diversion of organic waste including food waste, yard and garden waste and wood would be the single program that could result in substantial further reductions in the amount of waste going to landfill. Organics diversion could target nearly 50% of materials in the waste stream. ThompsonNicola Regional District iv Characterization of Existing System Report PRJ16048 STAGE 1 REPORT
63 System Costs: The 2016 budget for management of the TNRD operated solid waste system is $10.4 million. This translates to a per capita cost of $388 per tonne. Actual 2016 expenditures were $7.8 million, equating to $291/tonne. Operation of the TNRD s 10 Eco Depots consumes almost half of the costs allocated to solid waste management, $3.5 million. The average cost of Eco Depot operation is $ per tonne. This cost includes the operation of the transfer station itself, hauling of collected recyclables to Emterra s recycling facility in Kamloops and paying a handling fee for baling and transport. The handling fee for blue bag recyclables was $75/tonne. The TNRD continues to lobby MMBC to rightfully assume responsibility for the costs of the residential PPP recycling program. Operation of TNRD s smaller transfer stations costs $882,000 per year, ranging between $300 tonne for the larger transfer stations to $2,500 per tonne for Eagan Lake. There exist large economies of scale in solid waste management. The cost of large facilities is generally much cheaper to operate than small facilities, be they transfer stations, recycling plants or landfills. Operation of TNRD s recycling depots costs $164,000 per year, ranging from $247 per tonne for the large recycling depot in Merritt to $628 per tonne for the smaller recycling depot in Cache Creek. The cost of recycling varies depending on whether the recyclable material is transferred through an ecodepot, transfer station, or recycling depot. The cost per tonne of recycling averaged across ecodepots, transfer stations, and recycling depots is $233 per tonne. The City of Kamloops has curbside collection of recyclables which is hauled directly to Emterra and for this reason their recycling costs are lower, at $201 per tonne. ThompsonNicola Regional District v Characterization of Existing System Report PRJ16048 STAGE 1 REPORT
64 The TNRD landfills cost $1.2 million to operate. Heffley Creek Landfill cost $69 per tonne and Lower Nicola Landfill cost $88 per tonne. Total revenues allocated to the TNRD Solid Waste System were $9.9 million. About 80% of revenue was derived from taxation and 20% from tipping fees. The cost to operate and maintain the City of Kamloops landfills is not included in the TNRD budget. The cost to operate the City of Kamloops landfills was $2,621,426. The average per tonne cost across these facilities is estimated to be $41.39/tonne. Composting operations at the city s Cinnamon Ridge composting facility cost $109/tonne. Benchmarking Analysis: To assess how the TNRD solid waste program compares to other typical rural / urban regional districts in B.C., SHA undertook a benchmarking survey of seven other regional districts that included Columbia Shuswap, Fraser Fort George, District of Squamish, Peace River, Kitimat Stikine, Nanaimo and Mount Waddington. The per capita waste generation rate ranges from a low of 725 Kg per person in the Regional District of Nanaimo to a high of 1,726 Kg per person in the District of Squamish. The TNRD per capita waste generation rate is 928 Kg/person/tonne. Disposal rates for landfilled residuals ranged from 341 Kg per person in the Regional District of Nanaimo to 848 Kg/person in the Peace River Regional District. The TNRD disposal rate was 621 Kg/person. Solid waste management system costs ranged from $89 per tonne for the Regional District of Mount Waddington to $193/tonne for the Peace River Regional District. The TNRD s system cost was $147 per tonne. In the comparative analysis unit costs were broken out for both the TNRD managed system and the City of Kamloops system. As expected, the TNRD s costs were much higher on a per tonne basis because of the economy of scale and the large transportation costs that are incurred in transferring collected materials to landfills and recycling facilities. Key Considerations: Although the TNRD has implemented material bans for recyclable materials such as cardboard, the bans are not being enforced. Large loads of commercial cardboard are routinely disposed of at the active face of TNRD landfills. Enforcement of a cardboard ban should be considered a top priority as this material has high value when diverted and is relatively easy to source separate by both residents and the Industrial/Commercial/Institutional (ICI) sector. Promotion of diversion in the ICI sector. Although separation and diversion of recyclable materials appear to be mainstream in the residential sector, the same is not true in the ICI sector in the TNRD. Many businesses do not have separate bins for cardboard and other recyclable materials. Promotion of ICI diversion, followed by active enforcement of bans would help to boost the ICI diversion rate, especially in the City of Kamloops. ThompsonNicola Regional District vi Characterization of Existing System Report PRJ16048 STAGE 1 REPORT
65 Management of blue bag waste in the TNRD Eco Depot system is expensive. SHA estimates that the cost of EcoDepot management, transport, and processing is in excess of $200/tonne. Consequently, negotiations should continue with Recycle BC to fund the TNRD residential recycling program. Although more expensive than the City of Kamloops program due to economies of scale, the program provides significant cost efficiencies as it is shared with other functions at the Eco Depots and transfer stations. At an average cost of $192/tonne, the TNRD s wood chip program is one of the lower cost diversion options available to TNRD. This program should be fully maximized and expanded to the City of Kamloops, if possible. Diversion of wood waste to cogen is preferred to chipping of the wood waste and using it for cover material according to the 5R s hierarchy. Organic waste is the single largest component (by weight) of what is currently landfilled in the TNRD. It therefore represents a significant new opportunity to reduce the amount of waste sent to landfill. Diverting this waste stream to composting would also reduce landfillrelated challenges such as the production of landfill gas and the attraction of vectors (e.g. birds). Collection systems and composting infrastructure that can support diversion of food scraps will be required in order to take advantage of this diversion opportunity. As TNRD and member municipalities continue to look at ways to reduce the amount of waste sent to landfill, it will be important to structure cost recovery strategies in a way that will avoid the death spiral whereby increased diversion rates lead to an increase in waste management system costs and a decrease in system revenues. ThompsonNicola Regional District vii Characterization of Existing System Report PRJ16048 STAGE 1 REPORT
66 GLOSSARY Disposal Diversion DLC EPR Generation GHG HHW ICI MMBC MOE MRF ODS Landfilling Activities that divert waste materials away from disposal as garbage to alternatives such as recycling or composting. Does not include combustion of garbage to produce energy. Demolition, landclearing and construction Extended producer responsibility The sum of all materials discarded that require management as solid waste, including garbage, recycling and composting. Does not include organic waste composted at home. Greenhouse gas Household hazardous waste Industrial, commercial and institutional (does not include heavy industry) MultiMaterial BC (residential recycling product stewardship organization) BC Ministry of Environment Material recycling facility (recycling processor) Ozone depleting substance (e.g. CFCs) Organic Waste Kitchen scraps, food waste, yard and garden waste Plan PPP TNRD RSWMP Regional Solid Waste Management Plan Printed Paper and Packaging Thompson Nicola Regional District Regional Solid Waste Management Plan ThompsonNicola Regional District Characterization of Existing System Report PRJ16048 STAGE 1 REPORT
67 1. INTRODUCTION The ThompsonNicola Regional District (TNRD) is responsible for coordinating and administering the solid waste management function in the ThompsonNicola region. The Regional District consists of ten electoral areas, eleven municipalities and numerous First Nations communities. The system is managed by the Environmental Health Services department, with the exception of Mission Flats and Barnhartvale Landfills, Kamloops Resource Recovery Centre, and Cinnamon Ridge Composting Facility (City of Kamloops); the closed Cache Creek Landfill and new Cache Creek Landfill Extension (Belkorp Environmental Services Inc.); the Tk'emlups te Secwepemc (First Nation) Mount Paul Landfill; and the Blackwell Dairy s Landfill and Biosolids Management Facility. The TNRD waste management system consists of transfer stations, EcoDepots, recycling depots, and two Landfills (Heffley Creek and Lower Nicola). Numerous industry stewardship programs operate in the TNRD, including: Electr O Recycle small appliances and power tools LightRecycle light bulbs, lamps and fixtures Product Care paint, household chemicals, gasoline, pesticides Encorp Return It Beverage Containers Encorp Return It Electronics computers, TV s, Electronics B.C. Used Oil Management Association Used Oil Filters and Containers Call 2 Recycle Batteries Tire Stewardship B.C. Tires Multi Material BC (MMBC) Printed Paper and Packaging 1.1 Objectives The purpose of this Stage 1 report is to characterize the current TNRD Solid Waste System and the many initiatives that have been implemented by the TNRD since 2008, when the first Regional Solid Waste Management Plan (SWMP) was adopted. This report also flags potential opportunities for improvements to the system, be they changes that result in higher rates of diversion, increased efficiencies, or reduced costs. The report has been prepared in accordance with the Guide to the Preparation of Regional Solid Waste Management Plans. 1.2 Implementation of 2008 SWMP The existing SWMP was developed by the TNRD and EarthTech in November The plan included the following guiding principles: 1. Support 30% Waste Reduction in the next five years compared to 2004 levels. 2. Follow the 5R Hierarchy (Reduce, Reuse, Recycle, Recovery and Residual Management). 3. Commit to Education and Social Marketing programs. 4. Adoption of a Zero Waste philosophy. ThompsonNicola Regional District 11 Characterization of Existing System Report PRJ16048 STAGE 1 REPORT
68 5. Support Product Stewardship Programs and Extended Producer Responsibility. 6. Establish UserPay approach to program funding. 7. Carry out ongoing evaluation of new programs. 8. Use local government policies and enforcement to increase waste diversion. 9. Implement criteria for new programs to ensure any program that is implemented will be technically sound, economically feasible and acceptable to the public. 10. Support cooperation opportunities with member municipalities, other Regional Districts, First Nations and Private sector as appropriate. It should be noted that although the plan cited a Waste Reduction goal related to 2004 levels, no baseline levels were recorded in the plan. SHA was able to compare current levels with 2004 annual report data from the TNRD landfills, this is discussed later in Section 3.8. The following ten policies were listed as forming the basis of implementation of the RSWMP: 1. Establish a UserPay System Policy Structure. 2. Standardization of Disposal Tipping fees. 3. Differential tipping fee structure. 4. Identify Materials prohibited from landfill disposal. 5. Implement Disposal Bans on Recyclable materials. 6. Initiate Waste Stream Management Licensing. 7. Minimum Operating requirements for Waste Management Facilities. 8. Importation of Waste will be allowed with an importation levy. 9. Establishment of New Facilities and Services. 10. Plan Amendment Process. The 2008 SWMP recommended implementation of the Plan in three Phases. Phase 1 was identified as being short term, i.e. one to three years after Plan adoption, and involved the initiation of basic 3Rs services representing the best value programs, as well as the initiation of changes to the solid waste management system. The following bullets provide a summary of the implementation status of each recommendation: Establish Waste Reduction & Education Function in TNRD: New position initiated. Capacity of education coordinator progressively consumed with operations issues over time. Development of Reuse Promotion Program. Completed. Diversion brochure published and on web site. Establishment of Differential Tipping Fees & Eventual Disposal Ban on DLC Waste. Completed. Differential tipping fees implemented. Separation of DLC driven by high tipping fees. ThompsonNicola Regional District 12 Characterization of Existing System Report PRJ16048 STAGE 1 REPORT
69 Disposal Ban on ICI Paper and Cardboard: Completed. Ban on cardboard implemented in TNRD Bylaw 2465 (2014). Schedule C of the Bylaw lists the following banned recyclables: 1. Corrugated Cardboard 2. Glass Containers 3. Mixed Waste Paper 4. Metal Containers 5. Plastic Packaging 6. Product Stewardship Material 7. Scrap Metal The bans are not being enforced at present as MMBC, the primary stewardship agency responsible for managing most of the above banned materials is not fully engaged in the TNRD at this time. Yard and garden waste ban in the City of Kamloops: Partially Completed. The City of Kamloops has banned grass clippings and sod from its curbside waste collection program. Single Stream Curbside Collection of Recyclables in City of Kamloops. Completed. The City of Kamloops has implemented a weekly singlestream curbside program supported by a fleet of automated split packer trucks. Single Stream Recyclables Collection from MultiFamily Units in City of Kamloops (if feasible). Completed. Collection of blue bag recyclables is being undertaken by City of Kamloops and private haulers. Support for Back Yard Composting and Vermicomposting. Completed. Promotional and education programs organized and back yard composters distributed. Expansion of Recycling System to increase availability to all TNRD residents. Completed. Curbside collection of blue bag recyclables available in most municipalities in TNRD. Ten full service EcoDepots that accept full range of stewardship recyclables established. Blue Bag recycling, glass and household batteries accepted at 18 additional Residential Service Sites. Collection of Hazardous Materials through periodic events. Completed. Stewardship programs including Product Care, ReGeneration, and B.C. Used Oil established at TNRD Eco Depots to manage hazardous materials. ThompsonNicola Regional District 13 Characterization of Existing System Report PRJ16048 STAGE 1 REPORT

70 Photo 1.1 New Split Packer Operated by City of Kamloops Develop New Yard Waste Drop off Facility in Kamloops. Completed. New depot established on McGill Road. Three locations now available to manage yard waste in City of Kamloops. 1. Barnhartvale end of Eliza Rd 2. Cinnamon Ridge 4.5km west of airport 3. McGill Road end of Bunker Rd Develop Waste Management System Optimization Plan. Completed. TNRD staff continuously optimizing solid waste management system. Hauling optimization study currently under way. Manage Environmental Risk by Reducing Number of Landfill sites. Completed. Closed landfill sites at Barriere, Chase, Clearwater, Blue River since Manage Financial and Environmental Liability by reducing number of Transfer Stations. Partially completed. Small transfer sites at Black Pines, Tranquille Valley, Lac le Jeune and Brookmere converted to Residential Service Sites funded by separate Electoral Area service. Develop and implement a user pay based system and tipping fees at all sites for waste disposal. Completed. Tipping fees now charged at all transfer stations and Eco Depots. Convenient Eco Card program implemented to provide simple, safe and convenient payment method. Develop Transfer Stations to Replace Closed Landfills. Completed. New Eco Depots developed at Blue River, Clearwater, Louis Creek and Pritchard to replace closed landfills in those communities. ThompsonNicola Regional District 14 Characterization of Existing System Report PRJ16048 STAGE 1 REPORT
71 Improvements to selected Transfer Stations to improve service levels and efficiencies. Completed. Ten transfer sites established or upgrades to full service Eco Depots. Seven sites upgraded to Residential Service Sites PLUS. Consider implementation of Curbside Collection in some areas. Completed. Curbside collection of MSW and blue bag recyclables now supported in City of Kamloops, Merritt, Logan Lake, Barriere, Clearwater, Chase, Cache Creek (MSW Only), Aschroft (MSW Only), Savona, Cherry Creek, Blue River, and Avola. Develop Soil Bioremediation facility at TNRD Landfill. Completed. Soil bioremediation facilities have been established at Heffley Creek and Lower Nicola Landfills. The Heffley Creek site is operated by Tervita while the Lower Nicola facility is currently being tendered. After care of Closed Landfill Sites: Completed. TNRD continues to maintain and monitor closed landfill sites. Pilot biowindow programs have been undertaken to assess opportunities for GHG emission reduction. Phase 2, targeted for 4 7 years following Final Plan adoption included programs to increase the levels of collection service for recyclables and target the yard waste component of the disposed waste stream. Programs identified for Phase 2 are as follows: Disposal Ban on ICI yard waste. Not Completed. Blue Bag (single stream) collection of Recyclables in Municipalities & Electoral Areas: Partially completed. Service remains to be implemented in Cache Creek and Ashcroft. Yard Waste Dropoff & Composting depots in TNRD: Completed. Yard waste and brush is collected at all TNRD Eco Depots and at most Residential Service Sites PLUS. Brush and yard waste are currently chipped and incorporated into operational cover for dust control, and revegetation purposes. Disposal ban on remaining ICI recyclables: Not Completed. Ongoing Improvements to selected Transfer Stations and closure of some transfer stations and landfills, continued from Phase 1: Completed. Service upgrades are ongoing. Aftercare of Landfill Sites Closed in Phase 1. Completed. Phase 3 was intended for implementation 7 10 years after Plan adoption involved the continuation of programs initiated in earlier phases, as well as the potential development of new disposal capacity: Disposal Ban on ICI Food Waste: Not completed. ThompsonNicola Regional District 15 Characterization of Existing System Report PRJ16048 STAGE 1 REPORT
72 Construction of Disposal Capacity: Partially completed; ongoing. The City of Kamloops has recently purchased the Owl Road Landfill and is converting it to a Resource Recovery Centre for DLC waste. Berm supported expansion of capacity at Kamloops Mission Flats Landfill is under consideration. Construction of a new landfill, the Cache Creek Landfill Extension, is under way in Cache Creek. 1.3 Overview of TNRD Facilities Full service EcoDepots, (the big five), were developed at Heffley Creek, Louis Creek, Pritchard, Clearwater and Lower Nicola. Slightly smaller EcoDepots that provide a slightly reduced amount of of diversion services (compared to full service sites) are operated at Clinton, Logan Lake, Lytton, 70 Mile House and Blue River. Transfer stations that still provide a broad range of diversion opportunities, known as Residential Service Sites PLUS, are located at Westwold, Savona, Spences Bridge, Logan Lake, Paul Lake, Knutsford and Vavenby. Transfer stations for MSW that provide only basic diversion opportunities for blue bag recycling, glass containers and household batteries are located at Sun Peaks, Little Fort, Brookmere, Eagan Lake, Agate Bay, Aspen Grove, Tranquille Valley, Lac Le Jeune, Black Pines, Chu Chua and Upper Nicola. As part of the RSWMP, the TNRD proceeded to close small landfills and transfer stations to consolidate resources. Four facilities were intended for closure but have instead been converted to transfer stations which are funded by a separate electoral area service meaning they are funded through the general Solid Waste Service provided by the TNRD. These sites include: Black Pines, Tranquille Valley, Lac Le Jeune, and Brookmere. All TNRD transfer stations and Eco Depots are operated by an attendant and have specified operating hours. ThompsonNicola Regional District 16 Characterization of Existing System Report PRJ16048 STAGE 1 REPORT

73 Photo 12. Typical Full Service Eco Depot at Pritchard 1.4 Overview of Cost Recovery As of 2009, region wide tipping fees were introduced thus satisfying the user pay goal outlined in the 2008 RSWMP. Tipping fees were initially paid on a per volume basis, weight based fees have been in place at the region s Eco Depots as of Tipping fees in the TNRD have been standardized to match tipping fees paid at City of Kamloops facilities. Residents of Ashcroft and Cache Creek who previously did not pay tipping fees to the Cache Creek Landfill have begun paying TNRD tipping fees as of January 2017 with the implementation of new TNRD transfer station to replace the public drop off for the now closed Cache Creek Landfill. A differential rate structure has also been implemented as per TNRD bylaw Bylaw 2465 also includes materials which are prohibited from Landfill disposal. Disposal Bans have been outlined in the bylaw (for recyclable materials), however, these bans are not enforced due to limited staff resources. Currently, approximately 80% of solid waste function costs are funded by taxation and 20% are recovered from tipping fees. Policy item six listed in the RSWMP (Waste Stream Management Licensing) has not been implemented due to limited staff resources. Discussions with the TNRD indicate they do not intend to ThompsonNicola Regional District 17 Characterization of Existing System Report PRJ16048 STAGE 1 REPORT
74 pursue this policy item for the upcoming RSWMP update as they do not see a need for this policy item. A letter of understanding exists for an importation levy between Belkorp Environmental Services Inc. (BESI) and the TNRD for the Cache Creek Landfill Extension. ThompsonNicola Regional District 18 Characterization of Existing System Report PRJ16048 STAGE 1 REPORT

75 2. DESCRIBING THE SYSTEM 2.1 Geographic Setting The ThompsonNicola Regional District area is shown in Figure 21. The district covers over 44,000 square kilometers from Wells Gray Park in the North, to the Coquihalla Summit to the South. The North and South Thompson rivers converge in Kamloops while the confluence of the Thompson and Fraser rivers occurs in Lytton. The City of Kamloops is the largest center in the region, with other communities connected through Highways 1, 5, and 97. The ThompsonNicola region is situated mostly in the Interior Plateau, however the Cariboo and Monashee Mountain ranges are prominent features in the North. The area is rich in diversity. Biogeoclimatic zones within the TNRD include: Bunch Grass, Ponderosa Pine, Interior Douglasfir, Interior CedarHemlock, Montane Spruce, and Engelmann Spruce Subalpine Fir. 2.2 Population Based on 2016 Census data, the population for the TNRD is 132,663 residents, comprised of 109,769 residents in the eleven municipalities (urban), 15,972 residents residing in rural Electoral Areas, and 6,922 residents on First Nations Reserves. Table 21 presents the population distribution as reported in the Canadian Census for 2011 and 2006; urban populations (municipalities) are indicated with a U, rural populations are indicated with an R, and First Nations populations are indicated with FN. As seen in Table 21 the Population of the TNRD is distributed between 83% urban, 12% rural and 6% First Nation land reserves. Approximately 2.3 residents reside in each household in the TNRD. As shown in Table 21 the City of Kamloops makes up nearly 70% of the Region s total population. Photo 21. Canada Day Celebration in Downtown Kamloops ThompsonNicola Regional District 21 Characterization of Existing System Report PRJ16048 STAGE 1 REPORT
76 Table 21 Population Statistics in ThompsonNicola Regional District Source: Statistics Canada Homes People Population Community Sq. Km. (occupied) per home 2016 ThompsonNicola Regional District 44, , ,663 % of Total Electoral Area A R Wells Gray Country ,493 1% U Clearwater , ,331 2% Total Area A 3,824 3% Electoral Area B R Thompson Headwaters % Total Area B 233 0% Electoral Area E R Bonaparte Plateau ,094 1% U Clinton % Total Area E 1,735 1% Electoral Area I R Blue Sky Country 5, ,262 1% U Ashcroft ,558 1% U Cache Creek % U Lytton % FN Skeetchestn % FN Bonaparte % FN Kanaka Bar % FN Siska % FN Skuppah % FN Lytton % FN Cooks Ferry N/A FN Shackan FN Nicomen % Total Area I 4,749 4% Electoral Area J R Copper Desert Country 3, ,580 1% U Logan Lake ,993 2% Total Area J 3,573 3% Electoral Area L R Electoral Area L 1, ,955 2% FN Adams Lake % FN Neskonlith % Total Area L 3,677 3% Electoral Area M R ThompsonNicola M 3, ,598 1% U Merritt ,139 5% FN Lower Nicola % FN Coldwater % Total Area M 9,727 7% Electoral Area N R ThompsonNicola N 2, % FN Nooaitch % FN Upper Nicola % Total Area N 1,206 1% Electoral Area O R ThompsonNicola O 5, ,323 1% U Barriere ,713 1% FN Simpcw First Nation N/A N/A N/A 243 0% Total Area O 3,279 2% Electoral Area P R ThompsonNicola P ,672 3% U Chase ,286 2% U Sun Peaks % U Kamloops ,280 68% FN Tk'emlups te Secwepemc* ,021 2% FN Whispering Pines/Clinton % Total Area P 99,934 75% Total Urban Population 109,769 83% Total Rural 15,972 12% Total First Nations 6,196 5% Other First Nations 726 1% Total RD * 132,663 *Note: The population presented is based on data available from the 2016 Census. The Tk'emlups te Secwepemc First Nation manages waste at the Mt. Paul landfill. The TNRD has MTSA's with 17 First Nation Communities, as outlined in the table above. Population data for additional First Nations communities in the TNRD is not specifically outlined in the above table, but is estimated in the section "other First Nations". ThompsonNicola Regional District 22 Characterization of Existing System Report PRJ16048 STAGE 1 REPORT

77 2.3 Municipalities and First Nations Most of the larger municipalities in the TNRD, including Kamloops, Merritt, Cache Creek, Clinton, Barriere and Chase, control and fund their own garbage and recycling collection. All of the municipal waste that is collected is ultimately hauled to TNRD Eco Depots or Transfer Stations, with the exception of the City of Kamloops, which operates its own landfill facilities within city limits. Residents in rural areas generally do not receive curbside collection services. Instead they have access to 22 Eco Depots and Residential Service Sites that are strategically located throughout the TNRD. The TNRD also provides solid waste services to most of the area s First Nations communities. Typically, First Nations Bands provide garbage collection services to Band members using smaller garbage trucks or flat decks. Collected solid waste is hauled to TNRD transfer stations. Photo 22. Skeetchestn Band Automated Garbage Truck Seventeen of the First Nations have service agreements with the TNRD that are partially funded by Indigenous and Northern Affairs Canada (INAC) through Municipal Type Service Agreements (MTSA s). A substantive number of smaller First Nations Bands do not have such agreements in place. It is assumed that these bands haul their solid waste to the TNRD transfer stations and pay only tipping fees at the closest disposal facility. An exception to this is the Tk emlups te Secwepemc First Nation, which operates their own landfill, the Mount Paul Landfill, near Kamloops. ThompsonNicola Regional District 23 Characterization of Existing System Report PRJ16048 STAGE 1 REPORT

78 2.4 Current Waste System Since 2008 the solid waste management system in the TNRD has undergone a major restructuring, converting from a residuals management system centered on landfills at Heffley Creek, Chase, Barriere, Clearwater, Blue River, Cache Creek and Lower Nicola to a modern system that is based on the 5R s hierarchy, as illustrated in Figure 22. Reduce: Today s system involves extensive education on reducing the toxicity of material that enters the waste stream through promotion and support of stewardship diversion programs for items like light bulbs that contain mercury and cell phone batteries that contain lithium. Reuse: Promotion or reuse activities, back yard composting and grass cycling of organics, and support of thrift stores are core components of the TNRD reuse program. Figure 22. 5R s Waste Management Hierarchy adopted by TNRD Recycle: As outlined in the 2008 SWMP, the TNRD recycling program has expanded from a program that focused on recycling of scrap metal and open burning of wood waste to a program that has ThompsonNicola Regional District 24 Characterization of Existing System Report PRJ16048 STAGE 1 REPORT
79 embraced partnerships with all available stewardship programs, with the exception of Recycle BC. Diversion of white goods (large appliances) and other scrap metal continues to be a major program. As well, a successful new program has been introduced to recycle roofing shingles for asphalt applications. Recovery: Recovery of material and energy has also become a priority. Most clean dry wood waste collected in the TNRD is now chipped and trucked to Williams Lake where it is used as fuel in Atlantic Power s cogen facility. As well, the City of Kamloops is diverting all incoming broken concrete, crushing that material and reusing it as a road base aggregate product. Residuals Management: The number of landfills in the TNRD has been reduced from 12 in 2008 to eight today. Existing landfills are being upgraded to make them safer, more efficient and more protective of the environment. This has been achieved by adding EcoDepots and residential dropoff facilities at Heffley Creek, Lower Nicola and Mission Flats landfills. Landfill Gas (LFG) controls have also been added to oxidize methane and reduce greenhouse gas (GHG) emissions. Closure of the small landfills at Barnhartvale and the Tk emlups te Secwepemc Mount Paul will be evaluated in consultation with stakeholders as part of this RSWMP update. The following sections document the advances that have been made by the TNRD to fully embrace the 5R s and to minimize the per capita residual generation rate across the TNRD. 2.5 Extended Producer Responsibility Programs Extended Producer Responsibility (EPR) is a provincial policy tool that aims to shift the responsibility for endoflife management of products (physically and economically) to the producer and away from local governments. This policy is intended to create an incentive for producers to include environmental considerations in design of products. EPR programs in BC are mandated by Recycling Regulation 449/2004, under the Environmental Management Act. The regulation requires producers of the designated products to develop a program for their endoflife collection and recovery of materials and to consult stakeholders (including local governments) when developing their plans. TNRD is a member of the BC Product Stewardship Council, a body that advocates on behalf of local government for effective product stewardship programs. TNRD staff has also engaged in consultation and discussions with stewardship agencies in their program development process. The range of products managed through EPR programs has expanded significantly in the last decade and especially through TNRD depots. Of note, the only major stewardship program that is currently not supported at TNRD facilities is Recycle BC, formerly MultiMaterial BC (MMBC). Recycle BC is a nonprofit organization responsible for residential packaging and printed paper (PPP) recycling throughout BC. Currently, Recycle BC provides funding to a small number of private depots in the TNRD and as of January 2017, they are providing financial incentives to the City of Kamloops to provide residential curbside collection and multifamily buildings collection of packaging and printed paper (typical household recyclables). ThompsonNicola Regional District 25 Characterization of Existing System Report PRJ16048 STAGE 1 REPORT
80 2.6 Reduction And Reuse Programs The TNRD has established a comprehensive online guide on the TNRD website that provides tips on solid waste reduction at the source. The site features tips of composting, grass cycling, garage sales, and green gift ideas. The site also promotes sharing of resources through programs such as NeighborGoods (for seldom used tools and other items), Little Free Library, BookMooch and Freecycle. Reduction of waste toxicity is being realized through partnerships with stewardship programs and industry. Call2Recycle is diverting batteries that contain toxic metals such as lithium and lead. LightRecycle is diverting bulbs and light fixtures that contain mercury and copper. AlarmRecycle is diverting smoke alarms that contain small amounts of the radioactive element Americium241. Some TNRD facilities such as Lower Nicola, South Thompson, Heffley Creek, Sun Peaks, Louis Creek, and Clearwater offer clothing donation bins for the Big Brothers and Big Sisters of Kamloops and area. In 2016, 1,048 bags were donated, translating into 6,986 kilograms of clothing. Most TNRD communities are serviced with one or more thrift shops operated by social service organizations that receive and sell gently used goods. 2.7 Recycling Programs The TNRD and the City of Kamloops has put in place one of the best full service recycling programs in B.C. particularly through its extensive network of Eco Depots and Residential Service Sites. The recycling program is comprised of the following elements: Curbside Residential Recycling and Multifamily recycling (provided by the City of Kamloops) ICI Recycling Recycling at TNRD Eco Depots and Residential Service Sites Collection of Stewardship Program materials Centralized Composting Back Yard Composting Wood Waste Diversion Asphalt Roofing Shingle Diversion Broken Concrete Diversion Contaminated Soil Diversion Curbside Residential Recycling Blue Bag recycling programs have been implemented by a number of TNRD municipalities including the City of Kamloops, Merritt, Chase, and Logan Lake. Recyclables collected in Kamloops automated curbside collection system are hauled directly to Emterra Environmental in Valleyview at a tipping fee of $80/tonne. Although it has been mandated that in B.C. management of printed paper and packaging is a stewardship responsibility that is being funded by all consumers, currently Recycle BC is not paying TNRD for this important diversion activity. ThompsonNicola Regional District 26 Characterization of Existing System Report PRJ16048 STAGE 1 REPORT

81 Other municipalities that collect recyclables curbside, including Logan Lake, Merritt and Chase deliver the blue bag recyclables to roll off bins in the TNRD Eco Depots. From there Belkorp hauls the bins to Emterra. Hauling and processing recyclables from EcoDepots and Transfer stations is approximately $75 per tonne. Considering that Eco Depots cost an average of $ per tonne to operate, the complete system is currently costing the public about a considerable amount of money, a cost that should be borne by Recycle BC Industrial, Commercial and Institutional (ICI) Recycling Although some businesses in the TNRD do recycle, diversion on cardboard, printed paper and packaging and organic waste is not mainstream. Most businesses still have only one commercial bin for garbage. With the exception of Kamloops, where commercial collectors haul recyclables directly to Emterra, in all other TNRD municipalities, commercial cardboard and recyclables are delivered by haulers or self hauled by businesses to the TNRD EcoDepots. Photo 23 Self Hauled Commercial Cardboard at TNRD in Merritt Transfer Station When responsibility for residential PPP is rightfully assumed by Recycle BC, it will be necessary to separate out, or track the commercial recyclables separately as management of these materials is not a Recycle BC mandate (they are only responsible for recyclables generated in homes) Recycling at TNRD Eco Depots and Residential Service Sites The TNRD operates 28 Service Sites across the region, including 10 full service EcoDepots, seven Residential Service Sites PLUS and 11 Residential Service Sites. The services that are delivered at each Service Site are summarized in Table 22. In addition, the TNRD supports collection of MSW and recyclables from municipal transfer stations in Merritt, Cache Creek and Ashcroft. The locations of all of the service sites are shown on Figure 21. ThompsonNicola Regional District 27 Characterization of Existing System Report PRJ16048 STAGE 1 REPORT

82 Table 22. Summary of Recyclable Materials Accepted at TNRD Service Sites TNRD EcoDepots The TNRD EcoDepots are full service transfer stations and recycling facilities that were constructed in 2014 with a Building Canada Grant. The EcoDepots have been configured to promote diversion. Facilities for diversion of materials included in Stewardship programs are typically set up in front of the scale. These materials are received free of charge. They include: Green waste including yard waste and brush Cooling Appliances (fridges, freezers, AC units) Clean dimensional lumber and pallets Electronics Propane bottles and canisters Blue bag recyclables Non refrigerated appliances and scrap metal Batteries Tires Household hazardous waste and paints Blue bag recyclables are received in an open steel framed building. Loads are tipped on the floor and then pushed into a walking floor transfer trailer with a backhoe. Consolidated loads are typically hauled once or twice a week to Emterra s baling facility in Kamloops. ThompsonNicola Regional District 28 Characterization of Existing System Report PRJ16048 STAGE 1 REPORT


83 Photo 24. Lower Nicola Blue Bag Recycling Building Photo 25. Pritchard Eco Depot Paint Plus and Used Oil Collection Area ThompsonNicola Regional District 29 Characterization of Existing System Report PRJ16048 STAGE 1 REPORT


84 Photo 26 Pritchard Full Service EcoDepot Behind the Stewardship recycle area, each EcoDepot has one or two 40 scales which are used to weigh in all incoming materials to which tipping fees are applied. Tipping fees are collected via credit or debit card, or via the very convenient ECOCARD punch cards that can be purchased at 49 distributors across the TNRD. Photo 27. Paying for Waste with Convenient EcoCard Punch Card ThompsonNicola Regional District 210 Characterization of Existing System Report PRJ16048 STAGE 1 REPORT

85 Those facilities not located adjacent to a landfill include a 3 bay steel framed building for transferring MSW waste into walking floor BTrains (at Clearwater, Pritchard and Louis Creek). The buildings are open to all MSW haulers, including municipal and commercial trucks, and self hauls. The smaller EcoDepots at Logan Lake, Clinton, Lytton, 70 Mile House and Blue River have Z wall style residential dropoff facilities instead of an enclosed building. The Heffley Creek and Lower Nicola EcoDepots also have residential dropoff areas comprised of Z walls because they are situated at landfills where commercial haulers go directly to the active face. Materials that are received on the Pay side of the facilities include: Municipal Solid Waste (MSW) (in covered building) Demolition, Land clearing and Construction (DLC) (into rolloff bin) Roofing Shingles (into rolloff bin) Broken concrete (in U bay) Wood waste (in U bay) Mattresses (in U bay) Residential Service Sites PLUS These facilities have been developed by the TNRD to provide garbage and recycling services in less populated areas. The attended facilities are typically open two days per week. The TNRD provides one or two rolloff bins for MSW, a bin for blue bag recyclables, a mega bag for glass containers and jars, a box for batteries, and storage areas for automotive batteries, tires, scrap metal, used oil, propane tanks, cooling appliances and DLC waste. Photo 28. Blue Bag Bin at Residential Service Site PLUS in Knutsford ThompsonNicola Regional District 211 Characterization of Existing System Report PRJ16048 STAGE 1 REPORT

86 2.7.6 Residential Service Sites These facilities are situated in small population centers serving less than 200 residents. The facilities are attended transfer stations providing limited services for MSW disposal, blue bag recycling, a mega bag for glass and a box for household batteries. They are generally open half days one or two days per week. Four of the Residential Service Sites at Brookmere, Tranquille Valley, Lac Le Jeune and Black Pines are Special Service Areas where operations are funded from local taxation of residents living in those areas only. The 2008 SWMP recommended that these facilities be closed due to the very limited use that they receive. However, local residents wanted to see them stay open for convenience, so the Special Service Area funding model was developed. Photo 29. Lac Le Jeune Residential Service Site Recycling at Stewardship Funded Private Sector Depots Private Sector Recycling Depots play an important role in the TNRD recycling program, particularly in the diversion of refundable beverage containers. ENCORP ReturnIt: 12 ENCORP ReturnIt bottle depots have been established in the TNRD, including seven in Kamloops, and one each in Ashcroft, Barriere, Chase, Logan Lake and Merritt. In addition to beverage containers, most of the depots also accept electronic products. ThompsonNicola Regional District 212 Characterization of Existing System Report PRJ16048 STAGE 1 REPORT
87 Photo 210. General Grant s Recycling Depot, McGill St. Kamloops ReGeneration: This is a stewardship program for special waste recycling operated by Product Care. Recycling of Fire Alarms is a primary objective of this program. There are six ReGeneration Depots in the TNRD including seven in 70 Mile House, and one each in Ashcroft, Kamloops and Merritt. ElectroRecycle: Small appliances and power tools are recycled in this stewardship program. There are 17 locations that support this program including 9 TNRD Eco Depots and seven private sector recycling depots. Light Recycle: This program targets light fixtures, light bulbs and ballasts including fluorescent tubes that contain mercury. There are 20 service providers in the TNRD including numerous hardware stores. Three TNRD EcoDepots support this stewardship program. Major Appliances and Scrap Metal: Major appliances and scrap metal are accepted at all 10 TNRD Eco Depots. The stewardship program, operated by Major Appliance Recycling Roundtable (MARR) exists but provides no funding to any collector and is considered to be an ineffective program. Cooling appliances that contain Freon or ammonia refrigerants are initially separated so that the refrigerant can be safely drained from the appliance. ThompsonNicola Regional District 213 Characterization of Existing System Report PRJ16048 STAGE 1 REPORT
: This stewardship program manages lawn mowers and all other related power tools such as chain saws, edgers, trimmers, etc.")
88 Photo 211. Scrap Metal Pile at Pritchard Eco Depot Outdoor Power Equipment (OPE): This stewardship program manages lawn mowers and all other related power tools such as chain saws, edgers, trimmers, etc. Only two private sector depots support this program in the TNRD, one in 70 Mile House, the other in Kamloops. Product Care: This stewardship program collects paints, stains, and other household chemicals. There are 23 Product Care Depots in the TNRD, including all 10 TNRD EcoDepot locations. Paint Plus: This stewardship program, operated by Product Care targets pesticides and flammable liquids. In addition to all 10 TNRD EcoDepots, this stewardship program is offered at the City of Kamloops Barnhartvale and Mission Flats Landfills and two private businesses. Multi Material BC: Mandated to collect packaging and printed paper (PPP) from residential sources, this program was supported until January 2017 by only two private sector recycling depots in Kamloops, collecting only 176 tonnes of PPP per year. ENCORP ReturnIt Electronics: This program targets televisions, computers, audiovisual equipment and electronic toys. It is delivered at 18 locations. The program is supported by four private sector bottle depots, several electronics distributors and all 10 TNRD Eco Depots. Milk and Plastic Cartons: Not covered by a stewardship program, these containers can be deposited curbside into the blue bag program or dropped off at any TNRD EcoDepot or Residential Service Site. Printer Cartridges: Spent cartridges can be dropped off at two retail stores in Kamloops or mailed back to distributors. ThompsonNicola Regional District 214 Characterization of Existing System Report PRJ16048 STAGE 1 REPORT
89 B.C. Used Oil Management Association: This stewardship program collects used motor oil, filters and containers for recycling. It is a very active program that is available at 35 locations in the TNRD including numerous automobile dealers and service providers. All 10 TNRD Eco Depots also participate in this program. Antifreeze: Spent antifreeze and antifreeze containers can also be collected through B.C. Used Oil Management Association and can be recycled at 28 locations including numerous autoservice dealers and all 10 TNRD EcoDepots. Call2Recycle: This program targets all batteries, other than the large lead acid automotive batteries, including alkaline, sealed lead acid, and lithium ion batteries. The program also targets cell phones. The Call2Recycle program is supported at 43 locations in the TNRD, including numerous retail stores, several municipal offices and all 10 TNRD EcoDepots as well. Tire Stewardship B.C. Tire recycling is an effective stewardship program supported primarily by tire retail stores throughout the TNRD. 49 locations offer this program in the TNRD. The 10 TNRD Eco Depots participate, but limit the program to passenger tires, small RV and light truck tires only Centralized Composting The City of Kamloops operates a large yard waste composting facility at the Cinnamon Ridge site. The facility accepts residential and commercial green waste including grass clippings, leaves and brush. The organics are chipped and then windrow composted by a City contractor over a period of 8 months. Finished compost is sold at the Cinnamon Ridge facility and utilized by City of Kamloops internally for landscape projects Back Yard Composting The TNRD and the City of Kamloops both promote back yard composting as a primary activity to reduce the amount of solid waste that needs to be managed at the curb. In addition to information on the TNRD web site, the TNRD sells a range of back yard composters as a subsidized rate of $25 per unit. The City of Kamloops has developed an environmental education resource package for teachers that is being used to disseminate composting knowhow into the community. In 2015 the TNRD sold 143 back yard composters and smaller numbers of green cone digesters and worm composters Diversion of DLC Waste DLC waste is accepted at all of the EcoDepots and at Westwold, Savona, Spences Bridge, Loon Lake, Paul Lake, Knutsford and Vavenby transfer stations and all three City of Kamloops landfills. At the TNRD Service Sites DLC waste is received in rolloff bins that are then transferred for disposal at Heffley Ck. or Lower Nicola landfills. Many components of DLC waste are diverted from the waste stream at TNRD and City of Kamloops facilities. Diverted materials include wood waste, yard waste, concrete, asphalt shingles, and soil. Wood waste and asphalt shingles are recycled and shipped offsite for beneficial use by contractors whereas concrete, soil and yard waste are beneficially utilized at the various landfill sites. ThompsonNicola Regional District 215 Characterization of Existing System Report PRJ16048 STAGE 1 REPORT

90 Wood Waste Diversion Diversion of clean wood waste is promoted in the TNRD by differential tipping fees. To encourage separation of DLC waste into materials that can be diverted at the source, the tipping fee for commingled DLC waste is double the tipping fee for separated shingles, wood waste etc. Mixed DLC loads are currently charged $160/tonne whereas segregated wood is charged $100/tonne. This tipping fee provides a strong incentive for builders to segregate their waste. As a result, large volumes of clean and dirty wood are received at the TNRD Eco Depots and the City of Kamloops Landfill annually. Photo 212. Clean and Dirty Wood Waste Piles, Mission Flats Landfill The wood waste is chipped once or twice a year. A five year contract for this service has recently been awarded to Fraser Excavation. The scope of their contract includes grinding the waste and hauling it away for beneficial use. Concerns about potential contamination at the Domtar pulp mill and the recent closure of the Lafarge Cement Plant east of Kamloops have curtailed the opportunity for using wood waste as a biofuel within the TNRD. However, the large Atlantic Power biomass cogeneration plant in Williams Lake consumes about 200,000 tonnes of biofuel annually and recognizes wood waste from the TNRD as an excellent high BTU fuel source. Currently, all clean wood waste collected at the TNRD facilities is being hauled to Atlantic Power. The program is not a revenue generator as the cost of the haul outweighs the tipping fee received by the contractor. Even though there is a cost associated with this diversion, additional benefits are realized from the diversion of organic material from landfill which reduces GHG emissions and saves landfill space. ThompsonNicola Regional District 216 Characterization of Existing System Report PRJ16048 STAGE 1 REPORT

91 Photo 213 Atlantic Power Cogen Facility, Williams Lake Asphalt Roofing Shingle Diversion The asphalt roofing shingle diversion program has proven very successful in the TNRD. Roofing contractors are delivering a very clean roofing shingle product to the TNRD Eco Depots. The roofing material is consolidated in rolloff bins and periodically hauled to Intercity Recycling in Knutsford. The shingles are ground up and blended into pavement aggregate Broken Concrete Diversion Broken concrete is received at all TNRD Eco Depots and landfills, and at the City of Kamloops Mission Flats Landfill. Broken concrete is beneficially utilized for road base and other aggregate applications Contaminated Soil Diversion Contaminated soil is not accepted and managed by the TNRD at their waste facilities. However, the TNRD partners with private sector contractors to operate contaminated soil biocells at Heffley Ck. and Lower Nicola Landfills to remediate the contaminated soils of VOCs and PAHs. Currently, Tervita is operating the Heffley Ck. Biocell. The Lower Nicola Biocell is being tendered. 2.8 Collection Programs Curbside collection of residential garbage and recyclables is conducted by most member municipalities in the TNRD. The TNRD is responsible for curbside collection in the following communities: Blue River and Avola; Savona and Cherry Creek. Municipalities which offer curbside pickup of garbage and recycling include: Kamloops, Merritt, Logan Lake, Barriere and Chase. Ashcroft, and Cache Creek have collection programs for garbage only. Residents in Clearwater have the option to subscribe to a private service for curbside collection. Lytton and Clinton do not have curbside collection programs. Table 23 provides an overview of collection programs. ThompsonNicola Regional District 217 Characterization of Existing System Report PRJ16048 STAGE 1 REPORT
92 Table 23. Overview of Garbage and Recycling Curbside Collection Programs in TNRD Area Curbside Collection Service Provider Type Frequency Recycling Garbage Ashcroft N Y Ashcroft automated cart weekly District of Y Y Barriere Barriere manual weekly Blue River Y Y TNRD semiannual weekly Cache Creek Chase Clearwater Clinton Kamloops Logan Lake Lytton Merritt Savona/Cherry Creek Sun Peaks N Y Y Y N N n/a N N n/a Y Y Y Y N N n/a Y Y Village of Cache Creek Village of Chase City of Kamloops District of Logan Lake City of Merritt rolling out automated cart automated cart self haul to eco depot selfhaul to TNRD transfer station automated cart automated cart selfhaul to TNRD transfer station automated cart weekly n/a n/a weekly weekly n/a weekly Y Y TNRD automated cart weekly N N n/a selfhaul to TNRD transfer station n/a Curbside Collection of Residential MSW and Recyclables The largest curbside collection program is operated by the City of Kamloops. Curbside garbage and recyclables are collected once a week using an automated split packer truck. Single family residences have the option of selecting a tote size that is appropriate for their level of waste generation, with totes of 120L, 180L, 245L and 360L available. Annual collection fees vary by container size from $85 to $220/year. All residences must also have a recycling cart. All recycling carts are 245 L. Collection of blue bag recyclables costs $50/year. Collected waste is hauled to Mission Flats Landfill and collected recyclables are hauled to Emterra s recycling plant in Valleyview. ThompsonNicola Regional District 218 Characterization of Existing System Report PRJ16048 STAGE 1 REPORT
93 Providing collection of garbage and recyclables from multifamily homes is the responsibility of the landlord. Landlords must provide bins for both MSW and blue bag recyclables. Collection services can be contracted to the private sector or obtained from the City of Kamloops. Automated weekly collection services are of garbage and recyclables using the Cart system are also provided in Chase, Merritt and Logan Lake Collection of Commercial Solid Waste Collection of garbage generated by the commercial sector is conducted by a number of local garbage hauling contractors in each community. Progressive Waste Services, Waste Management and Super Save and the most active commercial haulers in the region. The City of Kamloops also provides front load packer services for commercial accounts as an extension of their packer service for multifamily residences. However, the City of Kamloops does not actively market their service. Commercial collection of recyclables is offered by a limited number of commercial haulers. Some large businesses backhaul their own recyclables (primarily cardboard) to the Lower Mainland. 2.9 Landfills Currently there are eight active landfills within the TNRD and four landfills which have been closed since the latest RSWMP was adopted in The TNRD operates two sites, one in Lower Nicola and the other in Heffley Creek. The City of Kamloops operates three sites, one along the South Thompson River in Mission Flats, one in Barnhartvale and the recently purchased site in Valleyview which has been renamed the Kamloops Resource Recovery Center. There is one privately owned landfills owned and operated by Blackwell Dairy in Barnhartvale. The Tk emlups te Secwepemc also owns and operates a small landfill facility along the east side of Hwy #5 near the Paul Lake Rd. interchange. The Cache Creek Landfill has ceased accepting waste and is closed; an Environmental Certificate and Operational Certificate have been issued to Belkorp Environmental Services for a new landfill located in Cache Creek, the Cache Creek Landfill Extension. Below is a description of each facility, site characteristics and how they operate and contribute to waste management within the Regional District Lower Nicola Landfill The Lower Nicola Landfill is located 2 km west of Lower Nicola on Highway #8. The site serves the City of Merritt and surrounding rural areas and also accepts refuse from the Thompson Nicola Regional District (TNRD) transfer stations in Aspen Grove, Brookmere, Logan Lake, Upper Nicola and surrounding First Nation communities. The landfill footprint, Lot B which encompasses approximately 16 HA, is surrounded by the TNRD controlled crown land lease titled District Lot 4553 of approximately 25 HA. The Lower Nicola Landfill was originally permitted as a waste management site in September, 1976 for the disposal of municipal refuse from Merritt, Lower Nicola and surrounding rural areas. Historically, waste filling activities at the Lower Nicola Landfill have been in the central and southern portions of the site and have been completed using a combination of the trench and ramp methods. ThompsonNicola Regional District 219 Characterization of Existing System Report PRJ16048 STAGE 1 REPORT
94 In 2013, the site was upgraded with the construction of scale facilities, Z wall styled residential drop off facility and bins as well as a covered metal clad receiving shed with tipping floor for blue bag recyclables. In 2016, the site disposed approximately 6,502 tonnes of MSW and DLC waste. The site also operates a contaminated soil receiving and remediation cell operated by Sumas Environmental. A detailed filling plan was completed for the site in 2013 by SHA which included a final contour design and phasing plan. Currently, waste is being landfilled in the Phase 2 area. A total of six phases are planned for the site. The latest lifespan projection for the site is approximately 88 years with a total available airspace of approximately 1.35 million cubic meters Heffley Creek Landfill The Heffley Creek Landfill is located approximately 5 km east of Heffley Creek and Highway 5 on Todd Mountain Road, then 700 m north into the site (7381 Sullivan Valley Rd). The landfill footprint, which encompasses slightly more than 13 HA, is surrounded by TNRD land currently under a grazing permit to a local cattle rancher. The Heffley Creek landfill was originally permitted as a waste management site in 1974 for the disposal of municipal refuse from the Heffley Creek and Rayleigh areas. Originally, the landfill operated under a Waste Management Permit (PR3447), but has since been converted into an Operational Certificate. With the recent and ongoing closures of three TNRD landfills (Chase, Barriere and Clearwater sites), the Heffley Creek site now accepts waste from the abovementioned sites including Agate Bay Transfer Station, Black Pines Transfer Station, Blue River Transfer Station, Clearwater ecodepot, Eagan Lake Transfer Station, Knutsford Transfer Station, Lac Le Jeune Transfer Station, Little Fort Transfer Station, Louis Creek EcoDepot, Paul Lake Transfer Station, South Thompson EcoDepot, Sun Peaks Transfer Station, Tranquille Valley Transfer Station, Vavenby Transfer Station and Westwold Transfer Station. In addition, since the closure of the Cache Creek Landfill in late 2016, Heffley Creek also accepts all waste from the western portion of the TNRD including Cache Creek Transfer Station, Clinton EcoDepot, Loon Lake Transfer Station, Lytton EcoDepot, Savona Transfer Station, 70 Mile EcoDepot and Spences Bridge Transfer Station. In 2016, the site disposed approximately 9,061 tonnes of MSW and DLC waste. The site also operates a contaminated soil receiving and remediation cell operated by Tervita. A detailed filling plan was completed for the site in 2013 by SHA which included a final contour design and phasing plan. Currently, waste is being landfilled in the Phase A area. A total of five phases are planned for the site. The latest lifespan projection for the site is approximately 87 years with a total available airspace of approximately 1.52 million cubic meters Barriere Landfill The Barriere Landfill began progressive closure in 2012 and closure construction was completed in The TNRD constructed the Louis Creek EcoDepot to continue to serve the local population in and around municipality of Barriere. ThompsonNicola Regional District 220 Characterization of Existing System Report PRJ16048 STAGE 1 REPORT

95 2.9.4 Clearwater Landfill The Clearwater Landfill began progressive closure in 2012 and closure construction was completed in The TNRD constructed the Clearwater EcoDepot to continue to serve the local population in and around municipality of Clearwater Chase Landfill The Chase Landfill began progressive closure in 2012 and closure construction was completed in The TNRD constructed the South Thompson EcoDepot in Pritchard to continue to serve the local population in the eastern corridor of the region Mission Flats Landfill The Mission Flats Landfill is located in Kamloops, BC, approximately 8 km west of the city center. Operational Certificate MR3328 was issued in 2002 to regulate activities at the site under the Environmental Management Act (EMA). Landfill operations are contracted out by the City. The site is currently situated on a parcel of land approximately 40 ha in size. The City is looking to expand the landfill to the south onto an adjacent property of equal size that was recently purchased to accommodate the expansion. The site has recently undergone progressive closure of the northern slopes and inactive areas of the site. A compacted clay cover was constructed along with an active Landfill Gas Collection and Treatment System consisting of 30 vertical extraction wells and a series of lateral collection pipes. The collected landfill gas is treated at the onsite Blower and Flare Station where in 2016 approximately tonnes of methane were destructed. Additionally, a blended biocover topsoil material was applied to the final cover system to mitigate fugitive methane emitted through the landfill cap. Photo 214. Active Face at Mission Flats Landfill ThompsonNicola Regional District 221 Characterization of Existing System Report PRJ16048 STAGE 1 REPORT
96 With the City of Kamloops (CoK s) recent purchase of the former Owl Road Landfill from Valleyview Enterprises, now the Kamloops Resource Recovery Center (KRRC), the CoK plans to divert all MSW waste to the Mission Flats site and all DLC waste to the KRRC landfill. The City of Kamloops also operates a full service residential drop off at the site that is comparable to the full Service Eco Depots operated by the TNRD. In 2016, the site disposed of approximately 50,022 tonnes of MSW and DLC waste Kamloops Resource Recovery Landfill The KRRC landfill (formerly Owl Road Landfill) is located within the City of Kamloops about 3 km east of the town center in the Valleyview area. The site is situated on the lower slopes of terraced bench lands along the south side of the south Thompson River Valley. The subject property occupies approximately 37 HA, of which approximately 9 HA have been used for waste disposal. The City of Kamloops accepts DLC at all Landfill facilities, however the KRRC is a landfill designated DLC only. The CoK has plans to divert all DLC waste generated within the CoK to the KRRC site and all MSW waste to the Mission Flats Landfill. It is the City's vision that KRRC will over time be transformed into DLC materials recovery facility (MRF) where DLC waste can be sorted into reusable and recyclable components, with the residual waste landfilled. Materials generated at the facility are expected to be clean wood waste, asphalt shingles, broken concrete, remediated contaminated soil, scrap metal, and dry wall. Since taking over the site in 2015, the CoK has began upgrading the site to current landfill standards and regulations. The improvements include the demolition of old / unsafe bunker buildings, updated scale facilities and offices, entrance and perimeter fencing, slope stability investigations and surface water controls. The CoK has also developed an interim filling plan for the site in preparation for the completion of a Design, Operations and Closure Plan (DOCP) scheduled for In 2016, approximately 10,976 tonnes of waste were disposed of at the facility Barnhartvale Landfill The Barnhartvale Landfill site is situated on a bench between the communities of Dallas and Barnhartvale. As the site is located on a bench above relatively steep gullies dropping down 20 to 30 m, the soil consists of well draining silty sand and no visible water courses are present. Historically, operational cover soil and road base materials have been sourced from the southern slope, where sandy gravel material is available. Based on previous annual reports completed by SHA for the CoK, this soil source is close to being exhausted. There is no weigh scale in place to properly track and record incoming tonnages at the facility. Presently, incoming tonnages are being tracked via load counts, population contributors and tipping fees. In 2016, the disposed tonnage at the site, including MSW and DLC waste, was approximated at 2,337 tonnes. The site also operates a yard and garden and green waste diversion area where all imported materials are transferred to Cinnamon Ridge for processing. ThompsonNicola Regional District 222 Characterization of Existing System Report PRJ16048 STAGE 1 REPORT
97 Based on the costs of continuing operations for a small landfill such as Barnhartvale, versus the cost and ease of access to both KRRC and Mission Flats locations, SHA feels that the closure of this landfill should be recommended. The closure along with incorporating an evaporative cover system would provide the most cost effective option available to the CoK Cache Creek LandfillExtension The Cache Creek Landfill Extension (The Extension) is located approximately 1 km south of the Village of Cache Creek along Hwy 1 and is immediately west and adjacent to the existing Cache Creek Landfill authorized under Operational Certificate The (now closed) Cache Creek Landfill has operated by the Village of Cache Creek and Wastech Services Ltd. (a subsidiary of Belkorp Environmental Services Inc.) since Wastech halted landfilling operations in late 2016 and completed final closure activities for the site in December In 2016, approximately 130,416 tonnes of waste were disposed of at the site of which approximately 128,563 tonnes were imported from the Lower Mainland and 1,619 tonnes were generated from the western corridor of the TNRD. This number does include curbside collection and public drop off from the Village of Cache Creek and Ashcroft, as 2016 data was not available at the time of the report. The Cache Creek Landfill Extension received and Environmental Certificate in 2010, and an Operational Certificate in late The Extension is scheduled to being receiving waste in 2018 and will operate under the Operational Certificate , registered to both Belkorp Environmental Services Inc. (BESI) and the Village of Cache Creek. A few highlights of the certificate include: The maximum rate of discharge is 750,000 tonnes per year. MSW must originate from within the province of BC. The discharge to ground is authorized by the ThompsonNicola Regional District's approved Solid Waste Management Plan and must satisfy the requirements of the ThompsonNicola Regional District Solid Waste Management Plan. Waste discharged to this landfill must not contravene or circumvent disposal bans established in the Regional District from which the waste originated. BESI has reached out the TNRD with interest in receiving waste generated from within the regional district. Currently, the landfill extension is not prepared to accept waste until basal liner construction is completed (scheduled for 2018) Blackwell Dairy Landfill The Blackwell Dairy Landfill is a privatelyowned landfill located in the Barnhartvale area of Kamloops, approximately 3 km east of the CoK s Barnhartvale facility. There are two (2) active permits for the site which are both held by E.J Blackwell Holdings Ltd., one for DLC and one for farm waste. Permit PR12290 authorizes discharge of various forest product manufacturing operations and demolition projects such as log yard refuse, log trim ends, waste hardwood veneer, asphalt cement and concrete. The maximum authorized rate of discharge is 2,200 tonnes /year. ThompsonNicola Regional District 223 Characterization of Existing System Report PRJ16048 STAGE 1 REPORT
98 Permit PR11198 authorizes discharge of refuse from a dairy farm located at Barnhartvale, in Kamloops. The rate at which refuse may be discharged is 500 cubic meters per year of industrial type waste. The components of the refuse which may be discharged are; 1) Paper and Wood 95%, and 2) Household Refuse 5% Mount Paul Landfill ( Tk emlups Indian Band) The Mount Paul Landfill is located within a ravine on the north side of Paul Lake Road approximately 1 km east of the Yellowhead Highway (No.5) in Kamloops, BC. It is situated on the Tk emlups Indian Band (TIB) Reserve #1. The landfill site has been in operation for more than 20 years; however there are signs of waste being managed onsite dating back to the 1950 s. The total fenced area of the landfill is approximately 21 HA, while the landfill footprint area is approximately 6 HA. By area, one half of the landfill has been filled with municipal solid waste, while the remaining half is filled with construction and demolition waste. There is no weigh scale facility at the site and no records of load counts or incoming tonnes. Copies of the abovementioned landfill operational certificates are available in Appendix A Education Programs The 2008 SWMP recommended that a full time Waste Reduction Coordinator was hired to support diversion efforts in the TNRD. The position was created; however, over time, additional waste system administration duties were assigned to the individual so today, Waste Reduction represents only 10% of the job. Education outreach that is being undertaken includes participation at 10 to 20 community events annually such as Canada Day and Farmer s Markets. This activity typically involving the setting up of a TNRD booth and engaging with the public. School outreach programs are conducted at the request of teachers, with programs on composting and recycling delivered to elementary and high school students. As well, the TNRD has developed several informative brochures that are available at TNRD and municipal offices as well as online on the TNRD web site. Education was also undertaken through education campaigns on Radio and Newspapers. The City of Kamloops is also active in education outreach with a full time Waste Reduction Coordinator position. Another important aspect of waste education is the essential Bear Aware Program. Each year, both the TNRD and the City of Kamloops hire a Wild Safe Coordinator that undertakes community education on reducing bear and wildlife interaction Illegal Dumping Prevention Illegal dumping of garbage is discouraged in the TNRD. A Community Clean Up program has been initiated to clean up illegal dump sites. The TNRD provides support by providing garbage bags and waiving tipping fees for waste collected from illegal dumpsites by community groups. Enforcement of illegal dumping is done by provincial Conservation Officers. ThompsonNicola Regional District 224 Characterization of Existing System Report PRJ16048 STAGE 1 REPORT

99 Photo 215. Community Clean Up Team in Action 2.12 Administration of System The TNRD Solid Waste System is administered by a dedicated team of six full time staff that coordinate a number of programs delivered by independent contractors. The team includes: Jamie Manager of Environmental Services Dennis Solid Waste Supervisor Martin Operations Contracts, Diversion Program Development, EPR Coordination Graham Transfer Stations Operations Kory Landfill Technician, Contract Management Adriana Environmental Services Technologist II Scales, Billing, Data Management Dennise Program Assistant The team administers numerous operations contract including the Belkorp Environmental Services Inc. Contract for operation of all TNRD Eco Depots and transfer stations and hauling of collected waste and recyclables, the operations contracts for the Heffley Creek and Lower Nicola Landfills and coordination of the numerous stewardship programs that are operated by TNRD at the Eco Depots and Residential Service Sites GHG Reductions The TNRD and the City of Kamloops have taken substantive steps to reduce carbon emissions from solid waste facilities. Foremost, in 2015 the City of Kamloops invested over $2 million in a LFG well field and flaring system at Mission Flats Landfill. The new system has reduced GHG emissions from the facility by 4,500 tonnes in The TNRD has also focused on reducing GHG emissions from four of its closed landfill sites including Clearwater, Barriere, Logan Lake and Chase using methane oxidation bed technology. In 2015, these beds were responsible for a reduction of 682 tco2e of GHG emissions. ThompsonNicola Regional District 225 Characterization of Existing System Report PRJ16048 STAGE 1 REPORT

100 As well, aggressive diversion of wood waste to CoGen and yard waste to composting facilities and back yard composting programs is also reducing the carbon footprint of the TNRD. Photo 216. Mission Flats Landfill LFG Flare 2.14 InterRegional Collaboration The TNRD is active in collaborating with neighbouring Regional Districts. Each year, staff meet at the annual Southern Interior Waste Managers Conference (SIWMA) to share information and discuss opportunities for realizing improved diversion. In 2015 and 2016 the TNRD supported the Regional District of Kitimat Stikine in developing their new transfer station, scales and hauling system. The TNRD hosted site visits for RDKS staff and consultants to their transfer stations and landfills, shared sample contract information and Jamie Vieira conducted a two day expert review of the RDKS system design. The RDKS reciprocated with funding of SWANA training opportunities for TNRD Staff. ThompsonNicola Regional District 226 Characterization of Existing System Report PRJ16048 STAGE 1 REPORT
101 Jamie Manager of Environmental Services Dennis Solid Waste Supervisor Martin Operations Contracts, Diversion Program Development, EPR Coordination Graham Transfer Stations Operations Kory Landfill Technician, Contract Management Adriana Environmental Services Technologist II Scales, Billing, Data Management Dennise Program Assistant The team administers numerous operations contract including the Belkorp Environmental Services Inc. Contract for operation of all TNRD Eco Depots and transfer stations and hauling of collected waste and recyclables, the operations contracts for the Heffley Creek and Lower Nicola Landfills and coordination of the numerous stewardship programs that are operated by TNRD at the Eco Depots and Residential Service Sites GHG Reductions The TNRD and the City of Kamloops have taken substantive steps to reduce carbon emissions from solid waste facilities. Foremost, in 2015 the City of Kamloops invested over $2 million in a LFG well field and flaring system at Mission Flats Landfill. The new system has reduced GHG emissions from the facility by 4,500 tonnes in The TNRD has also focused on reducing GHG emissions from four of its closed landfill sites including Clearwater, Barriere, Logan Lake and Chase using methane oxidation bed technology. In 2015, these beds were responsible for a reduction of 682 tco2e of GHG emissions. As well, aggressive diversion of wood waste to CoGen and yard waste to composting facilities and back yard composting programs is also reducing the carbon footprint of the TNRD. ThompsonNicola Regional District 227 Characterization of Existing System Report PRJ16048 STAGE 1 REPORT
102 Photo 216. Mission Flats Landfill LFG Flare 2.14 InterRegional Collaboration The TNRD is active in collaborating with neighbouring Regional Districts. Each year, staff meet at the annual Southern Interior Waste Managers Conference (SIWMA) to share information and discuss opportunities for realizing improved diversion. In 2015 and 2016 the TNRD supported the Regional District of Kitimat Stikine in developing their new transfer station, scales and hauling system. The TNRD hosted site visits for RDKS staff and consultants to their transfer stations and landfills, shared sample contract information and Jamie Vieira conducted a two day expert review of the RDKS system design. The RDKS reciprocated with funding of SWANA training opportunities for TNRD Staff. ThompsonNicola Regional District 228 Characterization of Existing System Report PRJ16048 STAGE 1 REPORT
103 3. QUANTIFYING THE SYSTEM This chapter presents a broad overview of the quantities of solid waste managed by the TNRD and partner municipalities. Garbage and Recycling tonnages, disposal and diversion rates, and Waste Composition are discussed in detail, along with an analysis of how the TNRD is meeting waste reduction goals established in the 2008 RSWMP. 3.1 Waste Definitions Solid Waste is regulated through Bylaw 2506 for the TNRD and Bylaw 4050 in the City of Kamloops. Regulations and bylaws are discussed in detail in Chapter 6. The various classes of waste are defined in the bylaws as follows: Municipal Solid Waste Municipal solid waste (MSW) is waste derived from residential, commercial, and institutional sources. The definition of MSW includes garbage and recyclable material. As per Bylaw 2506, waste derived from demolition and land clearing is also included in MSW. All TNRD transfer stations, EcoDepots and Landfills handle MSW. Demolition Construction Waste Demolition, Land clearing and Construction waste (DLC) is defined in Bylaw 2506 as inert solid waste resulting from the construction, remodeling, repair, demolition of structures, roads, sidewalks, and utilities and vegetation from land clearing. Examples of DLC waste include: broken asphalt, bricks, concrete, roofing materials, soil, wood, gypsum, electrical fixtures and insulation. DLC waste does not include contaminated soil. Controlled Waste Controlled waste is waste that requires special handling and disposal practices to reduce human health and environmental hazards. Examples of controlled waste include: Asbestos, animal feces, bulky waste, noxious weeds, small dead animals, creosote wood, contaminated soil, and large bulky furniture. Further, there are site specific controls on the acceptance of clean fill and concrete. Permission to bury offensive waste, as defined by the City of Kamloops, is to be requested 48 hours prior to disposal at City sites to allow for preparation of the cell. Prohibited Waste Prohibited waste as per the TNRD Bylaw 2506 includes: agricultural waste, auto hulks, biomedical waste, biosolids, contaminated soil, free liquids, hazardous waste, industrial waste, large dead animals, PCBs, waste on Fire, and waste not defined as Municipal Solid Waste. During 2017 site visits, TNRD personnel indicated Hazardous materials that are not accepted, are still dropped off by the public at EcoDepots. This results in safety concerns for staff and site attendants as the facilities are not equipped with adequate Personal Protective Equipment and safety training to manage certain Prohibited Wastes. ThompsonNicola Regional District 31 Characterization of Existing System Report PRJ16048 STAGE 1 REPORT

104 Photo 31. Household hazardous waste diversion area at South Thompson EcoDepot. In the TNRD, banned recyclable materials include: corrugated cardboard, glass containers, mixed waste paper, metal containers, plastic packaging, product stewardship material and scrap metal. However, to date these bans are not enforced. As per discussions with the TNRD and the City of Kamloops, corrugated cardboard is often present in the waste stream, especially from commercial sources. 3.2 Source of Incoming Waste Recyclables diverted from the TNRD waste stream end up in one of the stewardship programs or recycled through diversion programs contracted by the TNRD (wood waste, scrap metal, PPP). MSW residuals consolidated at 24 TNRD EcoDepots and Residential Service Sites, and municipal collection programs in the regional district are managed at eight landfills: Mission Flats Landfill, KRCC, Barnhartvale Landfill, Cache Creek Landfill, Heffley Creek Landfill, Lower Nicola Landfill, Blackwell Dairy Landfill and the Mount Paul Landfill. Mission Flats Landfill: Mission Flats Landfill receives the vast majority of MSW generated in the City of Kamloops. As well, a small portion of TNRD waste, generated in the Cherry Creek/Tobiano area is sent to nearby Mission Flats landfill. This is the only portion of TNRD waste that is managed at a City of Kamloops Facility. The reason for managing waste there is due to hauling logistics. KRRC: The City of Kamloops operates the DLC landfill (KRRC) which receives primarily commercial DLC and ICI waste from the City of Kamloops. ThompsonNicola Regional District 32 Characterization of Existing System Report PRJ16048 STAGE 1 REPORT

105 Photo 32. City of Kamloops packer truck depositing waste at the active face of Mission Flats Landfill Barnhartvale Landfill: This small facility is used mainly by residents of the Barnhartvale area. Commercial haulers are not allowed to use this facility. Cache Creek Landfill: Waste from the Western portion of the TNRD has historically been managed at the Cache Creek Landfill. This included communities such as: Ashcroft, Cache Creek, Clinton, Lytton, 70 Mile, Loon Lake and Savona. As of December 15th 2016, the Cache Creek Landfill is no longer accepting waste and has been closed. TNRD waste previously sent to the Cache Creek Landfill is currently sent to the Heffley Creek Landfill. A new Landfill, the Cache Creek Landfill Extension, is currently under construction and expected to begin landfilling waste in It is anticipated that MSW from the transfer stations outlined in Table 31 will be hauled to Cache Creek upon completion of the extension liner system. Heffley Creek Landfill: The majority of waste generated within the TNRD is hauled to and managed at the Heffley Creek Landfill. This includes MSW and DLC waste. Lower Nicola Landfill: Waste originating in the Southern Portion of the TNRD, including Logan Lake, is managed at the Lower Nicola Landfill. Blackwell Dairy Landfill: Blackwell Dairy is permitted to operate a small tonnage DLC landfill east of Kamloops. The site is permitted for 2,200 tonnes of log yard refuse, log trim ends, waste hardwood veneer, asphalt cement and concrete. The amount of waste actually received at this site in 2016 is not known. Mount Paul Landfill: This small landfill receives only MSW generated by 3,021 residents of the Tk emlups te Secwepemc First Nation community. ThompsonNicola Regional District 33 Characterization of Existing System Report PRJ16048 STAGE 1 REPORT
106 Table 31 outlines the contributing transfer stations and EcoDepots for the above mentioned MSW landfills for which data was available for this plan. Table 31. Landfills and Contributing Facilities and Regions. Landfill Contributing Facility Agate Bay Louis Creek Black Pines Paul Lake Blue River South Thompson Heffley Creek Landfill Eagan Lake Sun Peaks Heffley Creek (RDO) Tranquille Valley Knutsford Vavenby Lac le Jeune Westwold Little Fort Lower Nicola Landfill Aspen Grove Logan Lake Brookemere Lower Nicola Aschroft (Village) Lytton Cache Creek Landfill Cache Creek (Village) Savona Clinton 70 Mile Loon Lake Spences Bridge Mission Flats Landfill Tobiano (Curbside pickup) Cherry Creek (Curbside pickup) 3.3 Solid Waste Tonnages Tonnage data for each of the TNRD facilities was provided by the Regional District, including tonnages for landfilled waste and for diverted/recycled materials for 2014, 2015 and For the data that was received by the TNRD, each material was provided in either weights (Kilograms (Kgs) or Tonnes) or by number of units, drums, litres, bags, pallets or cubic metres (m 3 ) disposed that year. The materials that are tabulated on a per unit, per drum, per litre, per bag, per pallet or per m 3 basis are as follows: Automotive Batteries (Per Unit) Used Oil (Per Litre) Tires (Per Unit) Mattresses/Bulky Furniture (Per Unit) Oil Filters (Per Drum) Light Bulbs (Per Unit) Light Tubing (Per Unit) CFC Appliances (Per Unit) Yard Waste (Per m 3 ) ThompsonNicola Regional District 34 Characterization of Existing System Report PRJ16048 STAGE 1 REPORT
107 Glycol/Antifreeze (Per Litre, Per Drum) Electronics (Per Pallet) Electronics (Per Bag) Paint (Per Litre) NonProgram HHW (Per Drum) To obtain an overall annual tonnage of waste generated, a weight was assumed for each of the aforementioned materials as outlined in Table 32. From the associated weights presented in Table 32, annual tonnage values were calculated for each TNRD facility (Eco Depot s and Transfer Stations) for 2014, 2015 and 2016 as shown in Table 33. Categories of solid waste that are generated within the TNRD system consist of: MSW DLC Blue Bag Recycling Cardboard Asbestos Wood Waste Concrete and Asphalt Asphalt Shingles Scrap Metal Consumer and Automotive Batteries Used Oil Tires Mattresses/Bulky Furniture Oil Filters Light Bulbs Light Tubing CFC Appliances Yard Waste Glycol/Antifreeze Electronics Electronics Paint NonProgram HHW Table 33 below summarizes the annual MSW tonnages generated in the TNRD. Approximately 29,178 tonnes, 31,372 tonnes, and 26,825 tonnes of material were generated within the Thompson Nicola Regional District in 2014, 2015 and 2016, respectively, excluding City of Kamloops and Kamloops Indian Band service areas that are tracked separately. ThompsonNicola Regional District 35 Characterization of Existing System Report PRJ16048 STAGE 1 REPORT
108 TABLE 3 2. Weight Assumptions for Materials Generated within the TNRD Light Bulbs CFC Applicances Light Tubing Yard Waste Glycol/Antifreez e Electronics (Bags) Electronics (Pallets) Paint Non Program HHW Unit of Bags Material Weight Unit Reference maintenance/car battery weight 50.0 lbs/batt Automotive Batteries average weight expectations for popular models 22.7 Kg/batt Used Oil 7. pounds/gallon sinabarrelofoil.aspx 2 3. litres/gallon 81. lbs/litre 90.9 Kg/litre Passenger Tires 22.0 lbs/unit Truck tires 35.0 lbs/unit Semi Tires lbs/unit Agricultural lbs/unit % of Tires based on BC Tire Stewardship AnnualReport2014.pdf Tires Passenger Tires 0. Truck tires 50. Semi Tires 50. Agricultural 0. Weighted Average lbs/unit Weighted Average 14.4 Kg/unit us/articles/ How much 45.0 Twin (lbs) does the mattress weigh 50.0 Twin in Box (lbs) 48.0 Twin XL (lbs) 53.0 Twin XL in Box (lbs) 56.0 Full (lbs) 61.0 Full in Box (lbs) 71.0 Queen (lbs) 76.0 Queen in Box (lbs) 90.0 King (lbs) Mattresses/Bulky Furniture 96.0 King in Box (lbs) Average weight (Mattress) 64.6 lb/mattress Average weight (Mattress) 29.3 Kg/mattress guides/how much does a sofa Three Seater lbs/unit weigh.html Four Piece Sectional lbs/unit Five Piece Sectional lbs/unit Loveseat lbs/unit Futon lbs/unit Average Weight (Bulky Furniture) lbs/unit Average Weight (Bulky Furniture) Kg/unit Oil Filters Mattress/Bulky Furniture Avg Kg/unit Kg/Drum 07CRAFilterReport.pdf consumption andenvironmental impact of light bulbs.htm Incandescent 0. Kg/bulb CFLs 0. 0 Kg/bulb LED 10. Kg/bulb Average Kg/bulb is the average Fridge lbs/unit refrigerator weight Dehumidifiers lbs/unit (average) faqs/ 15 cu ft Chest Freezerin White WZC3115DW/ Stand Alone Freezer lbs/unit Venting Cooling Air Window AC unit lbs/unit Conditioners Coolers/N 5yc1vZc4me Portable AC unit 80.0 lbs/unit Through the wall ac unit 82.0 lbs/unit Whole House AC units lbs/unit Average AC unit weight lbs/unit Average CFC Appliance Weight lbs/unit Average CFC Appliance Weight 82.0 Kg/unit Average Weight 6. pounds/linear foot Kg/linear foot lbs/yard lbs/m Kg/m3 1.1 Kg/litre antifreeze/ 45 Gallon Drum Kg/Drum bags Kg 2016 CESA Collection Volumes from TNRD 2016 CESA Collection Volumes from TNRD Kg/Bag 37.0 Pallets Kg 2016 CESA Collection Volumes from TNRD 2016 CESA Collection Volumes from TNRD Kg/Pallet 10.0 lbs/gallon 3. litres/gallon 82. lbs/litre 61.2 Kg/Litre 0. tonnes/m 3 Assumed based on SHA's Experience Kg/drum All Bags were assumed to be 10 Kg excluding electronics. ThompsonNicola Regional District 36 Characterization of Existing System Report PRJ16048 STAGE 1 REPORT
109 Table 33. Annual Waste Generation, Recycling and Disposal Rates for the TNRD and COK Facility Facility TOTAL Diverted Disposed TOTAL Diverted Disposed TOTAL Diverted Disposed Location Type (MT) (MT) (MT) (MT) (MT) (MT) (MT) (MT) (MT) Agate Bay Transfer Station Ashcroft Recycling Depot Aspen Grove Transfer Station Black Pines Transfer Station Blue River Transfer Station Brookmere Transfer Station Cache Creek Transfer Station Cache Creek Recycling Depot Chase Recycling Depot Clearwater Eco Depot 1, , , , , Clinton Eco Depot Eagan Lake Transfer Station Heffley Creek Eco Depot 4, , , , , , Knutsford Transfer Station Lac Le Jeune Transfer Station Little Fort Transfer Station Logan Lake Eco Depot 1, , , Loon Lake Transfer Station Louis Creek Eco Depot 1, , , , , ,232.2 Lower Nicola Eco Depot 9, , , , , , , , ,368.2 Lytton Eco Depot Merritt Recycling Depot Paul Lake Transfer Station Savona Transfer Station Mile Eco Depot South Thompson Eco Depot 2, , , , , , ,728.3 Spences Bridge Transfer Station Sun Peaks Transfer Station Tranquille Valley Transfer Station Vavenby Transfer Station Westwold Transfer Station McLure Transfer Station Upper Nicola Transfer Station Neskonlith Transfer Station Monte Lake Transfer Station Barriere Depot Cache Creek Public Drop Off 4, , , , TOTAL (TNRD) 29, , , , , , , , ,183.4 Mission Flats Landfill n/a n/a n/a 56, , , , , ,022.8 Barnhartvale Landfill n/a n/a n/a n/a n/a n/a 2, ,337.0 KRRC Landfill n/a n/a n/a n/a n/a n/a 10, ,976.3 Emterra PPP Emterra n/a n/a n/a n/a n/a n/a 6, , Composting Cinnamon Ridge Facility 12, , , , , , TOTAL (CoK) N/A N/A N/A N/A N/A N/A 93, , ,336.1 TOTAL (TNRD SYSTEM) N/A N/A N/A N/A N/A N/A 120, , ,519.5 Diversion Summary Diverted Landfilled Diverted Landfilled Diverted Landfilled TNRD Managed System 21% 79% 29% 71% 36% 64% City of Kamloops System 32% 68% Combined TNRD System 33% 67% ThompsonNicola Regional District 37 Characterization of Existing System Report PRJ16048 STAGE 1 REPORT
110 Out of the waste generated, the following materials are currently disposed of in the Regions Landfills: MSW, DLC waste and Asbestos waste. Materials which are diverted but used on site include: shredded yard and garden waste which is blended with onsite and imported soil and beneficially utilized for operational cover; and broken concrete which is beneficially utilized to augment imported aggregate. For the purpose of this report, contaminated soil and clean fill tonnage data were removed from all analyses as this data would skew the waste generation and waste disposal rates as this material comes from various land reclamation projects that have large volumes of material disposed at sporadic times and therefore will not produce a realistic waste generation or disposal rate. Imported contaminated soil and clean fill are used as cover material which is not considered as a disposed material at most landfills; rather, it is substituted for operational cover material. As summarized near the bottom of Table 33 the annual tonnages of residual waste landfilled (disposed) within the TNRD managed system totaled 23,175 tonnes, 22,295 tonnes, and 17,183 tonnes in 2014, 2015 and 2016, respectively, excluding the City of Kamloops waste system and Mt. Paul landfill tonnages. MSW from Kamloops residents (CoK) as well as Tobiano and Cherry Creek residents (TNRD) is received at City of Kamloops Landfills (Mission Flats, Barnhartvale and KRRC). Tonnage data for City of Kamloops MSW including waste, recycling, and yard waste was provided by the City of Kamloops (CoK) for Mission Flats Landfill, Kamloops Resource Recovery Centre, and Barnhartvale Landfill for 2016 and the Cinnamon Ridge Compost Facility for 2015, as summarized in Table 34 below. The annual tonnage of material generated within the City of Kamloops is approximately 93,480.9 tonnes. Table 34: Annual Generated Waste Tonnages for CoK City of Kamloops Disposal Facilities Total Tonnage Generated (2016) Mission Flats Landfill 60,002.5 Barnhartvale Landfill 2,706.1 KRRC 10,976.3 Cinnamon Ridge Composting Facility 13,537.0 Emterra PPP 6,259.0 TOTAL 93,480.9 Approximately 32.2% of MSW within the CoK system is diverted and 67.7% is disposed of in one of the City s landfills. Table 33 above outlines the tonnage of material that was disposed within the City of Kamloops. Diversion statistics for the entire TNRD system, including the City of Kamloops and the TNRD managed system is essentially the same: 39,786.7 tonnes of MSW were diverted(representing 33% of the total MSW in the system) and 80,519.5 tonnes were landfilled (representing 67%). ThompsonNicola Regional District 38 Characterization of Existing System Report PRJ16048 STAGE 1 REPORT
111 The Tk emlups te Secwepemc population and tonnage information has been excluded from waste generation statistics as this waste is managed at the Mount Paul Landfill and no information on tonnage of material landfilled at that facility was available at the time of this report. 3.4 Recycling Tonnages As described in Chapter 2, PPP is diverted curbside in a number of residential collection programs. The City of Kamloops PPP is shipped directly to Emterra while blue bag materials collected in the other municipal collection programs and ICI PPP is consolidated in TNRD Eco Depots and then trucked to Emterra in rolloff bins. Out of the total MSW materials generated within the TNRD as outlined above in Section 33 the following materials are currently diverted out of the waste stream: Blue Bag Recycling Cardboard Wood Waste Asphalt Shingles Scrap Metal Consumer and Automotive Batteries Used Oil Tires Mattresses/Bulky Furniture Oil Filters Light Bulbs Light Tubing CFC Appliances Glycol/Antifreeze Electronics Electronics Paint NonProgram HHW Table 33 compiled the annual tonnage of diverted material at each facility within the TNRD for 2014, 2015, and Approximately 6,003.2 tonnes, 9,077.7 tonnes, and 9,641.9 tonnes of material were diverted within the Thompson Nicola Regional District in 2014, 2015 and 2016, respectively, indicating a steadily increasing trend in diversion levels. The 9,641.9 tonnes of MSW that were diverted from the TNRD managed recycling program in 2016 represents 36% of the total tonnage in the TNRD managed MSW waste stream, while 64% were landfilled. ThompsonNicola Regional District 39 Characterization of Existing System Report PRJ16048 STAGE 1 REPORT
112 Based on the data received by the City of Kamloops presented in Table 33 and discussed in Section 3.1, the materials that are currently diverted include: Mattresses Tires Batteries Cardboard Mixed Recycling Electronics Paint Metal Propane Tanks CFC Appliances Yard and Garden Waste (Cinnamon Ridge Composting Facility) Hog Fuel (Cinnamon Ridge Composting Facility) Table 35 below outlines the tonnage of material that was recycled curbside, diverted at the Mission Flats Landfill, Barnhartvale Landfill, KRRC and the Cinnamon Ridge Composting Facility. The annual tonnage of material currently diverted within the City of Kamloops is approximately 14,299 tonnes Stewardship Table 35: Annual Diverted Waste Tonnages for CoK City of Kamloops Disposal Facilities Total Tonnage Diverted (2016) Mission Flats Landfill 9,979.8 Barnhartvale Landfill KRRC 0 Emterra PPP 6,259.0 Cinnamon Ridge Composting Facility 13,357.0 TOTAL 14,298.6 Table 36 provides a list of the products currently covered by an EPR program and the estimated quantities collected by each program in TNRD in 2015 (the most recent year for which data is available). This data has been extracted from annual reports developed by the various stewardship organizations. The TNRD collection rate per capita and the provincial average per capita collection rate were calculated and are shown in Table 36 as a comparison. For the most part, the TNRD collection rates are below the provincial average. ThompsonNicola Regional District 310 Characterization of Existing System Report PRJ16048 STAGE 1 REPORT
113 EPR Category Table 36 Regulated EPR Programs in the TNRD Stewardship Program Estimated Collected in TNRD in TNRD Collection Rate Per Capita in 2015 Provincial Average Per Capita Collection Rate in 2015 Tires Tire Stewardship BC 3253 tonnes kg/person/year Smoke Alarms and Carbon Monoxide Alarms Small Appliance and Power Tools ReGeneration 645 units unit/person/year ElectroRecycle 108 tonnes kg/person/year Lights LightRecycle units unit/person/year Electronics Electronic Products Recycling Association (EPRA) Rate 433 tonnes kg/person/year Batteries Call2Recycle 7.8 tonnes kg/person/year Outdoor Power Equipment Major Appliances Outdoor Power Equipment Institute of Canada (OPEIC) Major Appliance Recycling Roundtable (MARR) no data no data no data no data no data no data Packaging and Printed Paper Multi Material BC (MMBC) 176 tonnes kg/person/year Used Oil/Filters/Containers /Antifreeze Paint Plus Beverage Containers BC Used Oil Management Association Oil litres l/person/year Filters units unit/person/year Containers 71 tonnes kg/person/year Antifreeze litres l/person/year PaintRecycle Paint 601 units unit/person/year Aerosols 34 units unit/person/year Solvents 9 units unit/person/year Pesticides 2 units unit/person/year Other aerosols 2 units unit/person/year Encorp Return It Aluminum tonnes kg/person/year Plastic tonnes kg/person/year Glass tonnes kg/person/year Polycoat 55 tonnes kg/person/year Other 23.9 tonnes kg/person/year Total tonnes kg/person/year 1 Estimates developed from 2015 annual reports submitted by each of the stewardship organizations to the Ministry of Environment. 2 units in tubskids (4'x4'x3' plastic boxes used for the collection of paint, paint aerosols, flammable liquids, and pesticides) ThompsonNicola Regional District 311 Characterization of Existing System Report PRJ16048 STAGE 1 REPORT
114 3.5 Per Capita Waste Generation Population data from the 2016 Census presented in Table 21 was used to calculate per capita waste generation and disposal rates as outlined in Chapter 2. The waste generation analysis has been conducted separately for the EcoDepot and Service Site system operated by the TNRD and for the City of Kamloops. A combined region wide analysis for the entire TNRD is also shown. The T`Kemlups Secwepemc First Nation populations have been removed from the total TNRD population for these calculations as the waste material that is generated by the T`Kemlups Secwepemc First Nations is managed at the Mount Paul Landfill. Furthermore, it is assumed that waste from all other First Nations communities is deposited into the TNRD Eco Depot and Service Sites and managed by TNRD facilities regardless of whether the community has a Municipal Type Service Agreement (MTSA) or not. A list of First Nations with MTSA s is compiled in Appendix B. Table 37 summarizes the results of the analysis. For the purpose of better understanding the system, the TNRD managed system (which represents the rural population) has been separated from the City of Kamloops managed system (which represents nearly 70% of the urban population). The per capita MSW generation rate for the TNRD managed system is 681 Kg/person per year while the per capita waste generation rate for the City of Kamloops is 1,035 Kg/person per year. The average per capita waste generation rate for the entire TNRD is 928 Kg/person per year. Table 37. Per Capita MSW Generated and Residuals Landfilled in 2016 Waste Generation Total MSW Population Rate Generated (Tonnes) (kg/person/ Yr) TNRD Only System (Excluding Tk'emlups te Secwepemc) Total MSW Landfilled (Tonnes) Waste Disposal Rate (kg/pers on/yr) 39,362 26, , CoK Only System 90,280 93,481 1,035 63, Total TNRD System (Excluding Tk'emlups te Secwepemc) 129, , , Per Capita Waste Disposal More important than the per capita waste generation rate is the amount of residual waste landfilled per person. The goal is to have that rate as low as possible, and ultimately at zero when true Zero Waste would be achieved. In 2016 the per capita residuals landfill rate for the TNRD managed system was 437 Kg/person per year. For the City of Kamloops the per capita residual landfill rate was 702 Kg/person per year and for the entire TNRD it was 621 Kg/person per year. In 2015, the Ministry of Environment estimated waste disposal rates for the TNRD were 538 Kg/person/year. As seen in Table 37 above, the per capita waste disposal rate for the entire TNRD system (City of Kamloops and TNRD facilities) was calculated to be 621kg/person/year. The reason ThompsonNicola Regional District 312 Characterization of Existing System Report PRJ16048 STAGE 1 REPORT
115 for the increase is due to the increase in tonnage from the Kamloops Resource Recover Center which was previously not reported. As the City of Kamloops is the main commercial hub in the TNRD and because commercial diversion programs in the City of Kamloops are not well developed, one would expect that the per capita waste generation rates within the City would be higher than outlying areas. A lot of commercial packaging, restaurant waste, expired food and the like that originates from out of town residents visiting or shopping within city limits ends up in the City of Kamloops waste system and inflating the City s statistics. Using data from 2014, 2015 and 2016 it clear that the TNRD managed system continues to achieve progressively higher diversion rates, increasing from 21% in 2014 to 29% in 2015 and 36% in A diversion rate of about 50% will be achievable with full implementation of bans on residential and commercial PPP and a diversion rate of 65 to 70% would be achievable if an aggressive organics diversion program is implemented, targeting both food waste and yard and garden waste. Also of interest, there has been a 15% drop in the total amount of waste generated in the TNRD managed system between 2015 and 2016, possibly indicating a slowdown in the amount of development and renovation projects being undertaken. Based on the waste generation rates presented in Table 32, the TNRD has seen an overall decrease in waste generation from 2014 and a significant increase in diversion rates. These trends suggest that the public is becoming more focused on waste reduction and that the Ecodepot/Transfer Station system, combined with a substantial increase in tipping fees has been gradually improving diversion rates within the system. 3.7 Waste Composition In 2011, the TNRD hired Waste Naught BC to conduct a waste characterization study at six landfills and two transfer stations in the TNRD. The study provides an indication of what types of waste are produced by residential, industrial/commercial/institutional (ICI), and demolition/landclearing/construction (DLC) sources. The piechart in Figure 31 shows the estimated proportion of the various waste materials. The data from this study indicates that the category with the highest composition is organic food waste, which accounted for more than a quarter of the total waste stream. The wood category represented the next largest category of waste, representing 18% of the waste stream. The third highest contributor to the waste stream was Paper Products and Paper Packaging, accounting for 15%. DLC, accounted for 12% and Plastic packaging accounted for 7%. The remaining materials represented less than a quarter of the overall waste stream.the results of this study indicate that about three quarters of the waste stream can be composted, recycled, or managed through Extended Producer Responsibility programs. ThompsonNicola Regional District 313 Characterization of Existing System Report PRJ16048 STAGE 1 REPORT
116 Figure 31 Waste composition proportions from Waste Naught BC waste characterization study. The Columbia Shuswap Regional District (CSRD) performed a similar but smallerscale waste composition study in 2013 and the results from this study provide a good comparison to the TNRD. The study was completed at the Sicamous Refuse Disposal Site (RDS), which services approximately 3,500 residents in Sicamous and the surrounding area. Consistent to the TNRD study, analysis of the overall waste composition coming into the Sicamous RDS indicated that organic waste made up the largest portion of the waste at over a quarter of the total waste stream. The pie chart in Figure 32 shows the estimated proportion of the various waste materials found at the Sicamous RDS. The CSRD includes wood waste in their compostable organics category and thus has a total organics composition of 36%. If the TNRD were to similarly include wood in their organics category it would make up a total organics composition of 44%. ThompsonNicola Regional District 314 Characterization of Existing System Report PRJ16048 STAGE 1 REPORT

117 Figure 32 Waste composition proportions from 2013 CSRD waste characterization study. 3.8 Temporal Changes, Achieving SWMP Goals As per the 2008 Solid Waste Management Plan, the TNRD Board of Directors adopted a goal to reduce the per capita waste disposal rate in the TNRD by 30%. The 30% reduction goal was to be based relative to 2004 disposal data. As the TNRD did not have scales in place in 2008, the 2008 RSWMP did not include baseline data for which the 30% reduction was to be calculated from. To determine baseline data, we reviewed historic volumetric consumption analyses completed by SHA between 2003 to 2005 for the following landfills: Heffley Creek, Barriere, Lower Nicola, Chase, and Clearwater. The tonnage data provided in these annual reports was based off bin counts, load counts and estimated waste densities. As of 2013, all Eco Depot and Landfill facilities in the TNRD have been equipped with scales which make incoming tonnage tracking much more accurate. The City of Kamloops was not included in this analysis because historic tonnage data for the City of Kamloops was not available. Compiled tonnages are seen in Table 3 8. ThompsonNicola Regional District 315 Characterization of Existing System Report PRJ16048 STAGE 1 REPORT

118 Photo 33 Weigh Scale at South Thompson EcoDepot. Total Regional waste tonnages (including MSW and DLC) increased for each year between Overall, Heffley Creek, Lower Nicola and Clearwater landfills received higher waste volumes than Barriere and Chase. Between , the total waste disposed in the region was 31,997 tonnes with MSW accounting for 21,227 tonnes and DLC accounting for 3,044 tonnes. Between total regional waste disposed was 46,988 tonnes comprised of: 35,506 tonnes MSW and 4,363 tonnes DLC. Between Total waste disposed in the region was 55,546 tonnes, comprised of: 42,400 tonnes MSW and 3,289 tonnes DLC. Table 38 Disposal rates for and Year Total Waste Disposed (Tonnes) Population ThompsonNicola Regional District 316 Characterization of Existing System Report PRJ16048 STAGE 1 REPORT Waste Disposal Rate (kg/person/yr) ,997 40, ,988 40,271 1, ,549 40,172 1,383 Scale Data ,175 39, ,294 39, ,183 39, Census data for the TNRD region was compiled for the years 2001 and Annual populations were estimated by multiplying the population by a population growth factor to account for population growth and decline between the years. City of Kamloops and Kamloops Indian Band populations were removed from the per capita waste disposal calculations as to better reflect the service population for
119 the TNRD landfills to which the data set applies. As seen in Table 3 8, Waste disposal rate (kg per Capita) is estimated to be 793 Kg/person per year in 2003, 1,167 Kg/person per year in 2004 and 1,383 K/person per year in 2005 for the ThompsonNicola Regional Districts landfills. As determined in Table 37, the 2016 per capita landfilled residuals rate was 437 Kg/person. In comparison, the 2004 per capita waste disposal rate was 1,167 Kg/person per year. Thus, relative to 2004, the TNRD managed system has achieved a 63% reduction in per capita waste disposal, exceeding the 30% reduction goal set in the previous RSWMP. ThompsonNicola Regional District 317 Characterization of Existing System Report PRJ16048 STAGE 1 REPORT
120 4. SYSTEM COSTS This Chapter outlines the Thompson Nicola Regional District (TNRD) costs associated with management of solid waste. The TNRD Solid Waste Management Program operates 29 attended Eco Depots and Service Sites, four unattended recycling depots in partnership with municipalities and two landfills. The service extends to all electoral areas and municipalities with the exception of the City of Kamloops which funds its own program. Key TNRD services include: curbside residential collection of garbage and recyclables in limited areas; waste minimization and avoidance; operation of transfer stations and EcoDepots; operation of the Heffley Creek Regional Landfill and the Lower Nicola Regional Landfill; and, monitoring and maintenance of closed landfill sites. 4.1 Total System Cost The Solid Waste Financial Plan projected that the total system cost for the TNRD in 2016 would be $10.4 million. Actual annual expenditures for the various cost categories tracked in this study were $7.8 million. SHA s analysis may not have captured all 2016 costs as data was still being compiled. Table 41 provides a comparative summary of budget and actual. Given a total system tonnage of 26,825 tonnes in 2016, the total system costs work range between $291 and $388/tonne. Table 41 TNRD SOLID WASTE MANAGEMENT Financial Plan Category Budget Actual Difference administration charge $289,772 $64,046 $225,726 advertising $7,790 $0 $7,790 closed landfills $900,173 $900,173 $0 Employee benefits $182,000 $133,788 $48,212 furniture, equipment & vehicles $72,980 $11,133 $61,847 general $59,040 $3,926 $55,114 improvement transfer stations $820,000 $4,632,007 maintenance transfer stations and eco depots $5,199,531 $1,387,524 improvement operating landfills $494,000 $132,108 $361,892 maintenance operating landfills $1,150,631 $1,063,262 $87,369 insurance $40,000 $29,753 $10,247 outside office costs $26,650 $28,246 $1,596 Salaries $743,000 $629,643 $113,357 staff development $26,240 $6,361 $19,879 transfer to operating reserve $2,379,408 $0 $2,379,408 travel $61,828 $33,466 $28,362 waste reduction/education $350,000 $130,160 $219,840 EXPENDITURE TOTAL $12,803,043 EXPENDITURE TOTAL (without operating reserve) $10,423,635 $7,798,072 $2,625,563 ThompsonNicola Regional District 41 Characterization of Existing System Report PRJ16048 STAGE 1 REPORT
121 The City of Kamloops total costs in 2016 were $9.97 million including Yard Waste Costs, Cart Service Costs, Bin Service Costs and Landfill costs. The City of Kamloops system processed 93,481 tonnes, thus the city s per tonne costs were $ per tonne. 4.2 Cost of Eco Depots The 2016 cost of maintenance and improvement for all Eco Depots is $3,495,014, which is almost half of the total system cost. The cost of Eco Depots on a per tonne basis is $150.25/tonne, these costs include the hauling and processing of recyclables at $75/tonne. Figure 42 provides a comparative summary of each ecodepot and their respective tonnages and costs in As seen in Figure 42, ecodepots costs are largely affected by economies of scale. For example, a low tonnage ecodepot such as the Logan Lake EcoDepot costs as high as $ per tonne whereas the Lower Nicola EcoDepot costs are as low as $61.52 per tonne. Table EcoDepot Costs Annual Facility Tonnage Total cost Cost per Tonne Logan Lake $378,146 $ Mile $195,770 $ Clinton $248,373 $ Lytton $229,331 $ Louis Creek $453,529 $ Clearwater $568,955 $ South Thompson $522,965 $ Heffley $282,937 $80.30 Lower Nicola $615,008 $61.52 TOTAL $3,495,014 $ Cost of Recycling Depots The 2016 cost of maintenance and improvement for all Recycling Depots is $164,978, which on a per tonne basis is $293.93/tonne. These costs include the hauling and processing of recyclables at $75/tonne. Table 43 provides a summary of each recycling depot and their respective tonnages and costs for Table Recycling Depot Costs Annual Tonnage Annual Cost ThompsonNicola Regional District 42 Characterization of Existing System Report PRJ16048 STAGE 1 REPORT Cost per tonne Facility Cache Creek $36,007 $ Chase $33,877 $ Ashcroft $31,016 $ Merritt $64,078 $ TOTAL $164,978 $293.93
122 4.4 Cost of Transfer Stations The cost of maintenance and improvement for all transfer stations is $882,240, which is about oneeighth of the total system cost. These costs also include the processing of recyclables at $75/tonne. The costs of rural transfer station operations are very high on a per tonne basis. Including transfer station and haul, the costs often exceed $300/tonne and are estimated to be as high as $2,590.04/tonne at Eagan Lake. Table Transfer Station Costs Facility Annual Tonnage Annual Cost Cost per tonne Upper Nicola $18,000 $6, Eagan Lake 6.83 $17,690 $2, Brookmere Aspen Grove $10,772 $ Agate Bay $14,766 $ Tranquille Little Fort $26,431 $ Cache Creek $36,007 $ Black Pines Lac Le Jeune Spences Bridge $38,443 $ Vavenby $41,800 $ Loon Lake $51,700 $ Knutsford $64,917 $ Westwold $69,101 $ Blue River $95,216 $ Paul/Pinantan $110,965 $ Savona $111,662 $ Sun Peaks $174,770 $ TOTAL $882,240 $ Cost of Recycling The cost of recycling varies depending on whether the recyclable material is transferred through an ecodepot, transfer station, or recycling depot. The recyclable material considered in this analysis is blue bag recyclables and corrugated cardboard, which get hauled to Emterra for processing. Table 45 outlines the costs of recycling for the various facilities. These costs include the operation of the facility itself, hauling of collected recyclables to Emterra s recycling facility in Kamloops, and paying a handling fee for baling and transport. The City of Kamloops has curbside collection of recyclables which is hauled directly to Emterra and for this reason, their recycling costs are lower than the TNRD. 1 Most recent tonnage data is from 2014 ThompsonNicola Regional District 43 Characterization of Existing System Report PRJ16048 STAGE 1 REPORT
123 Table 45 Cost Per Tonne of Recycling Cost Per Tonne of Facility Recycling Ecodepots $ Transfer Stations $ Recycling Depots $ City of Kamloops $ Cost of Regional Landfills The total cost for the improvements and maintenance of the Heffley Creek and Lower Nicola landfills in the TNRD for 2016 was $1,195,370, which is only about one sixth of the total cost of the system. Heffley Creek is estimated to cost $68.63/tonne and Lower Nicola is estimated to cost $88.20/tonne. 4.7 Cost of City of Kamloops Landfills The cost to operate and maintain the City of Kamloops landfills is not included in the TNRD budget as the City administers their own waste collection and disposal systems. The City of Kamloops operates the Mission Flats and Barnhartvale Landfills as well as the Kamloops Resource Recovery Centre (KRRC) and the total cost for the operation and maintenance of these facilities in 2016 was $2,621,426. The average per tonne cost across these facilities is estimated to be $41.39/tonne, which is slightly lower than the Heffley Creek and Lower Nicola per tonne landfill costs. This cost difference is most likely due to economies of scale as the Kamloops landfills handle roughly four times the amount of waste as TNRD s regional landfills. 4.8 Landfill Closures The budget estimated a cost of $900,173 for landfill closures in Details on capital costs actually expended in 2016 have not been finalized. 4.9 Cost of Cinnamon Ridge Composting facility The cost of composting yard waste at the Cinnamon Ridge composting facility is estimated to be $1,399,725 in 2016, which on a per tonne basis is equivalent to $103.40/tonne Cost of Wood Diversion The TNRD has recently entered into a five year contract to chip and divert clean wood waste for beneficial use. The contract value is estimated at $200,000 per year. The total amount of wood waste diverted in 2016 was 1,038 tonnes. Thus the cost of this program is about $192/tonne Cost of Municipal Waste Collection The TNRD funds curbside collection programs in Savona, Cherry Creek Blue River and Avola. The cost of that program in Savona and Cherry Creek is $83,332. The service area has an estimated 430 homes on the route. Thus the annual service cost is $193/year per household. Costs were not provided for the program in Blue River and Avola. ThompsonNicola Regional District 44 Characterization of Existing System Report PRJ16048 STAGE 1 REPORT
124 The City of Kamloops reports that their curbside Cart collection costs were $4.40 million in Based on approximately 36,000 households in the City, the average curbside collection cost was $126 per residence per year based on weekly pick up of two totes. The City of Kamloops collection costs are cheaper than TNRD s because the city s service area has a higher density and the centroid of homes served is much closer to the ultimate disposal site, Mission Flats Landfill. ThompsonNicola Regional District 45 Characterization of Existing System Report PRJ16048 STAGE 1 REPORT
125 5. BENCHMARKING COMPARISON To assess how the TNRD solid waste program compares to other typical rural / urban regional districts in B.C., SHA undertook a benchmarking survey. This involved analyzing cost and performance data from seven regional districts. These included: Columbia Shuswap Regional District Regional District of Fraser Fort George District of Squamish Peace River Regional District Regional District of Kitimat Stikine Regional District of Nanaimo Regional District of Mount Waddington Section 5.1 discusses some of the unique attributes utilized in each of the above regional districts to manage solid waste. The benchmarking analysis presented in Section 5.2 identified the following metrics for each of the above regional districts/municipalities: Service Population Population Density Total MSW Tonnage Total Tonnage Landfilled Total Tonnage Recycled Total Tonnage Organics Diverted Per Capita MSW Generation Rate Per Capita Disposal Rate Per Capita Recycling Rate Total System Cost per Tonne Total System Cost per Person Landfill Cost Per Tonne Landfilled Recycling Cost Per Tonne Recycled Composting Cost per Tonne Composted Management Cost per Tonne MSW Tipping Fees The cost information was generally obtained from the fiveyear budgets, using 2016 actual costs whenever possible. Unit costs were then obtained for each benchmarking index by dividing the annual cost for that service by the total tonnes processed through the system, be it landfill, recycled, composted etc. Per capita costs were obtained by dividing by the current service population, usually obtained from the BC Statistics 2016 population estimates. ThompsonNicola Regional District 51 Characterization of Existing System Report PRJ16048 STAGE 1 REPORT
126 5.1 Overview of Regional Districts Columbia Shuswap Regional District: The Columbia Shuswap Regional District (CSRD) operates a number of regional landfills at Salmon Arm, Revelstoke, Golden and Sicamous. Similar to the TNRD, these landfills receive waste from the host communities as well as a number of satellite transfer stations. Transfer stations are located in Seymour Arm, Scotch Creek, Skimilkin (Tappen), Glenemma, Falkland, Malakwa, Trout Lake and Parson. The CSRD conducted a review of its SWMP in 2014 and was completed in The review was intended to build on the 2009 SWMP, which mainly targeted organic waste diversion. There is an existing private sector invessel composting facility in Salmon Arm and private collection of ICI organic waste is currently in place. The CSRD developed an organics diversion strategy in 2015 which includes plans for curbside collection of residential organics in Salmon Arm by Other municipalities are to have organics collection at a later date. The 2016 per capita disposal rate in the CSRD was 595 kg. Regional District of Nanaimo: The Regional District of Nanaimo (RDN) operates a Regional Landfill with is located about 5 km south of downtown Nanaimo, which has been receiving waste from the Regional District of Nanaimo since The site accepts both commercial and selfhaulers. Wood waste, yard, garden waste and controlled waste are deposited separately from regular garbage as yard waste, clean wood waste, scrap metal, cardboard, and paper are hauled to third party recycling facilities for processing. The RDN also operates the Church Road Transfer Station (CRTS), which is located about four km southwest of downtown Parksville. The facility opened in 1991, and is approximately two hectares in size. CRTS receives garbage, yard waste, wood waste, construction/demolition waste, and recyclables from communities in the northern portion of the Regional District of Nanaimo. Garbage brought to the CRTS is transferred to the Regional Landfill. Recyclables are transferred to the Vancouver Island Recycling Centre in Nanaimo, and food waste, kitchen waste, and yard waste are transferred to the Nanaimo Organic Waste Composting Facility in South Nanaimo. The RDN Solid Waste Management Plan (SWMP) is currently under review, with the most recent plan amendment occurring in The RDN has met its SWMP target of 70% diversion and is considering an 80% diversion target. The RDN implemented an organic diversion strategy that included a disposal ban on commercial organics in Regionwide curbside singlefamily residential collection program was implemented in 2010/2011. RDN bans the following materials from disposal: gypsum, land clearing waste, corrugated cardboard, recyclable paper, scrap metal, tires, commercial organic waste, garden waste, wood waste, stewardship materials, household plastic containers, metal food and beverage containers. The RDN per capita disposal rate as of 2016 was one of the lowest in B.C. at 341 kg. Peace River Regional District: The Peace River Regional District (PRRD) operates a large network of landfills and transfer stations. The PRRD system is based around three natural controlled landfill sites at Fort St. John, Dawson Creek (Bessborough) and Chetwynd. The PRRD also operates a series of transfer stations to service the rural areas. ThompsonNicola Regional District 52 Characterization of Existing System Report PRJ16048 STAGE 1 REPORT
127 The PRRD SWMP was reviewed in 2008 and approved by the MOE in The plan targets to reduce disposal by 26% to 42% over three phases. Phase 1 focuses on upgrading transfer stations to offer more services like recycling, yard waste, and bulky items. In addition, planned diversion initiatives such as a recycling program to divert multimaterials from landfills and development of a wood waste management plan with pilot composting project are to be implemented. The PRRD currently diverts yard waste and wood waste and is considering composting yard waste and biosolids to produce cover material. Consideration of a food waste collection service will not be considered for several years. The PRRD disposal rate as of 2016 was the highest of the seven regional districts at 848 kg per capita. It must be kept in mind that a large proportion of waste in the PRRD is from the oil and gas sector and consequently residential diversion has minimal impact on overall disposal. The PRRD aims to reach a disposal rate of 716 kg per capita. Regional District of Kitimat Stikine: The RDKS operates 6 landfills: Hazleton, Kitwanga, Stewart, Mezidian, Iskut, and Forceman. Thornhill landfill was recently closed and the RDKS now operates a transfer station at the site. Other area landfills include Terrace, Kitimat, and Stewart landfills which are overseen by the respective member municipalities. The RDKS SWMP was completed in RDKS currently provides curbside collection of garbage and recyclables for the region. There is currently only residential collection of organics in the Terrace area. RDKS has banned organic waste in the Forceman Ridge Landfill and operates a composting facility at the site. The per capita disposal rate in the RDKS in 2016 was estimated to be 613 kg. Regional District of Fraser Fort George: The Regional District of Fraser Fort George (RDFFG) operates two municipal solid waste landfills and one select waste landfill. The Foothills Boulevard Regional Landfill in Prince George currently receives 96% of the municipal solid waste disposed of in the RDFFG. The Mackenzie Regional Landfill provides disposal services to the northern part of the region and also offers marshalling areas for tires, fridges/freezers, metal, oil & filters, and antifreeze. The Legrand Select Waste Landfill accepts select inert waste from both private and public sectors. Inert waste includes demolition, landclearing debris and construction waste. The RDFFG operates 18 regional transfer stations and most transfer stations provide opportunities for recycling, centralized composting of yard and garden waste, "Swap shed" waste exchange areas, residential waste disposal by way of onsite transfer stations and limited commercial waste disposal. Some sites take oil, antifreeze, batteries, propane cylinders, tires, refrigerators and scrap metal. Municipal garbage collection is provided by all municipalities and in addition to RDFFG services, MMBC provides residential curbside recycling in the City of Prince George. Various private sector recycling companies also operate in the Prince George area and EPR programs have been established in Prince George and to a limited extent in other municipalities. A largescale yard waste composting facility is operational at the Foothills Boulevard landfill. Yard waste is being diverted at Mackenzie and Valemount waste management facilities. ThompsonNicola Regional District 53 Characterization of Existing System Report PRJ16048 STAGE 1 REPORT
128 During 2015, the RDFFG conducted a review of the 2008 SWMP. The 2008 Plan identified a target of 50% diversion of waste from landfilling and this target remains relevant for the 2015 Plan. To achieve 50% diversion, the 2015 Plan aims to achieve a per capita disposal rate of 570 kg by The 2016 per capita disposal rate in the RDFFG was estimated to be 840 kg. District of Squamish: The District of Squamish (DoS) operates a very well integrated solid waste management system operated by their contractor, Carney s Waste Systems. Residuals are landfilled at Squamish s engineered landfill, which underwent a $6 million upgrade in The District of Squamish (DoS) provides biweekly residential curbside garbage and recycling collection through a contract with Carney's Waste Systems. In addition, the DoS currently provides biweekly residential curbside organics collection for singlefamily homes, duplexes and some townhouses. The Yard waste collection program was replaced by the totebased organics (yard waste + food scraps) collection program in Organics totes are collected by trucks with autoload arms operated by a single driver. These trucks are lower cost to operate but cannot collect yard waste bags, bins or bundles only totes. Organic waste from curbside collection is brought to Sea to Sky Soils composting facility. In addition, residents can drop off recycling and compost free of charge at either the landfill or the Carney s depot on Queens Way. Townhouse and apartment complexes that receive commercial waste collection can contact their provider to discuss options for organics collection. The 2016 per capita disposal rate in the DoS was 734 kg. Regional District of Mount Waddington: The Regional District of Mount Waddington (RDMW) operates the 7 Mile Landfill & Recycling Facility in Port McNeill. The site acts as a dropoff facility for product stewardship programs such as used oil, paint, household and hazardous waste, electronics, car tires, and old batteries. The RDMW also operates 2 transfer stations: Malcom Island transfer station and Woss transfer station. The RDMW SWMP was last prepared in 1996 and the Stage 1 Plan review was completed in The plan targets a 50% diversion rate. The RDMW is currently composting clean wood and garden waste mixed with biosolids. The compost is used as a biocover at 7 Mile landfill. There are no immediate plans to collect/compost food waste. The 2016 per capita disposal rate in the RDMW was 692 kg. 5.2 Results of Benchmarking Analysis The results of the benchmarking analysis are tabulated in Table 51. The following paragraphs discuss each of the comparative parameters. Population: The Regional Districts / Populations considered ranged in size from 11,500 people in the Regional District of Mount Waddington to 157,599 people in the Regional District of Nanaimo. The service population for the TNRD is 129,642. ThompsonNicola Regional District 54 Characterization of Existing System Report PRJ16048 STAGE 1 REPORT
129 Table 51. Results of 2017 Solid Waste Benchmarking Analysis Regional District of Nanaimo Peace River Regional District Columbia Shuswap Regional District Service Population persons 157,599 66,504 51,572 20,120 95,216 19,067 11, ,642 39,362 90,280 Density persons/km Total MSW Tonnage tonnes/yr 114,266 62,903 57,876 20, ,074 32,908 11, ,306 26,825 93,481 Total Tonnage Landfilled tonnes/yr 53,764 56,425 30,698 12,325 80,005 13,987 7,959 80,520 17,183 63,336 Total Tonnage Recycled tonnes/yr 46,328 6,478 17,822 4,274 28,765 16,020 1,145 40,327 9,642 30,685 Total Tonnage Organics Diverted tonnes/yr 14,174 n/a 9,356 3,521 6,304 2,901 2,161 13,537 n/a 13,537 Per Capita MSW Generation Rate kg/person/yr ,067 1,000 1,209 1, ,035 Per Capita Disposal Rate kg/person/yr Per Capita Recycling Rate kg/person/yr Total System Cost $ $15,652,000 $9,023,743 $4,500,000 $3,077,696 $19,329,630 $2,992,368 $1,002,881 $17,765, $7,798,072 $9,966,952 Total System Cost Per Tonne MSW $/tonne $ $ $92.75 $ $ $90.93 $89.03 $ $ $ Total System Cost Per Person $/person/yr $ $ $86.89 $ $ $ $87.21 $ $ $ Landfill Cost Per Tonne Landfilled $/tonne $ $59.25 $65.15 $42.99 $ $97.17 $71.26 $47.40 $69.57 $41.39 Recycling Cost Per Tonne Recycled $/tonne $ $76.39 no data $27.81 $72 $130 $ $ $ Composting Cost Per Tonne Composted $/tonne $47 $127 n/a $6.41 $ $76.59 $ $39.71 $ n/a $ Management Costs Per Tonne MSW $/tonne $10.97 $22.88 no data $9.83 no data no data no data $39.91 Regional District of KitimatStikine Regional Disrict of Fraser Fort George District of Squamish Regional District of Mount Waddington ThompsonNicola Regional District ThompsonNicola Regional District (excluding Kamloops) City of Kamloops ThompsonNicola Regional District 55 Characterization of Existing System Report PRJ16048 STAGE 1 REPORT
130 Population Density: Population density is a measure of how many people there are per unit area. Population density ranged from a low of 0.4 persons/km 2 in the Regional District of Kitimat Stikine to a highly dense area such as the District of Squamish with persons/km 2. The TNRD had a population density of 2.9 persons/km 2. This is a useful metric because it gives an indication of the transportation distances and number of facilities required to service a region. As expected, a lowdensity area would require greater hauling distances and more facilities to service the region. Total MSW Tonnage: The total tonnes of MSW produced, including residuals, recyclables and organics ranged from 11,265 in the Regional District of Mount Waddington to 120,306 tonnes in the TNRD. Total Tonnage Landfilled: The total tonnes of landfilled waste ranged from 7,959 in Mount Waddington to 80,520 tonnes in the TNRD. Total Tonnage Recycled: The tonnages recycled ranged from 1,145 tonnes in the Regional District of Mount Waddington to 46,328 tonnes in the Regional District of Nanaimo. The TNRD has the second highest tonnage recycled at 40,327 tonnes. Total Tonnage Organics Diverted: The total tonnage of organics diverted ranged from none in the Peace River Regional District to 14,174 tonnes in the District of Nanaimo. The City of Kamloops currently diverts all yard waste organics to the Cinnamon Ridge composting facility, which managed 13,537 tonnes of organics in Per Capita MSW Generation Rate: The per capita waste generation rate ranges from a low of 682 kg per person in the Regional District of Nanaimo to a high of 1,726 kg per person in the District of Squamish. The TNRD per capita waste generation rate is the second lowest in the study area at 928 kg/person/tonne. The Rural TNRD has the lowest per capita waste generation rate in the 8 studied, at 682 kg per capita. This may be due to waste generation being a function of geography, population, and economic activity. Per Capita Disposal Rate: This metric measures the amount of garbage disposed of in landfill. In SHA s opinion, it is the best metric of how wasteful a society is. Disposal rates reported here include waste from the residential sector, institutional, commercial, and light industrial sources as well as waste from construction, demolition and renovation activities. Waste that is reused or recycled is not included. The Ministry of Environment s Municipal Solid Waste Disposal in B.C. reports the estimated amount of municipal solid waste disposed per person from each regional district and for British Columbia. The most recent data is from 2015 indicated that the per capita disposal rate range from 314 kg /person/year in the District of Nanaimo to 922 kg/person per year in the Peace River Regional District. The TNRD was the second least wasteful jurisdiction of the eight surveyed with a disposal rate of 538 kg/person/year in 2015, as reported by the Ministry of Environment, see Figure 51. The MOE does not provide a per capita disposal rate for the District of Squamish and therefore it is excluded from Figure 51. ThompsonNicola Regional District 56 Characterization of Existing System Report PRJ16048 STAGE 1 REPORT
131 Per Capita Disposal Rates 900 Disposal Rate (kg/person/year) Regional District of Nanaimo Thompson Nicola Regional District Regional District of Mount Waddington Columbia Shuswap Regional District Regional District of Kitimat Stikine Regional District of Fraser Fort George Peace River Regional District Figure 51: 2015 Per Capita Disposal Rates Since the MOE has not published results for 2016, SHA performed an analysis with 2016 tonnage and population data to estimate the 2016 per capita disposal rates. As seen in Figure 52, the TNRD has the fourth highest disposal rate of the eight surveyed. It is not necessarily true that the TNRD is disposing of more waste. Rather, the TNRD now has a better data collection system in place and is therefore tracking more waste than before. The TNRD disposal rate in 2016 was 621 kg/person/year as compared to 538 kg/person/year in It must be kept in mind that the methodology employed by SHA is different than the methodology employed by the MOE in calculating waste generation and disposal. For example, SHA removed the approximately 3,000 people from the population who are served by the Mt. Paul Landfill and are not represented in the reported disposal data. Furthermore, the City of Kamloops recently acquired the Owl Road/Kamloops Resource Recovery Center (DLC landfill) which increases the amount of overall waste reported in the system. As well, each Regional District tracks disposal tonnages differently and thus the 2016 disposal rates are estimates only. ThompsonNicola Regional District 57 Characterization of Existing System Report PRJ16048 STAGE 1 REPORT
132 Per Capita Disposal Rates 800 Disposal Rate (kg/person/year) Regional District of Nanaimo Columbia Shuswap Regional District Regional District of Kitimat Stikine Thompson Nicola Regional District Regional District of Mount Waddington District of Squamish Regional District of Fraser Fort George Peace River Regional District Figure 52: 2016 Per Capita Disposal Rates Per Capita Recycling Rate: The recycling rate ranged from 75 kg/person/year in the Regional District of Kitimat Stikine to 840 kg/person per year in the District of Squamish. The TNRD recycling rate was the third highest at 311 kg/person/year, see Figure 53. As one would expect, the regional districts with very low waste generation rates also had low per capita recycling rates. This shows that the metric of waste diversion is misleading because it is dependent on the amount of solid waste generated. A much better metric to use in evaluating environmental sustainability is per capita disposal rate (i.e. the amount of garbage not recycled). ThompsonNicola Regional District 58 Characterization of Existing System Report PRJ16048 STAGE 1 REPORT

133 Per Capita Recycling Rates Recycling Rate (kg/person/year) Regional District of Kitimat Stikine Peace River Regional District Regional District of Mount Waddington Regional District of Nanaimo Regional District of Fraser Fort George Thompson Nicola Regional District Columbia Shuswap Regional District District of Squamish Figure 53: 2016 Per Capita Recycling Rates A comparison of TNRD s per capita MSW generation rate, disposal rate, and recycling rate to other regional districts is shown in Figure 54. Figure 54: Comparison of TNRD s Waste Generation Rates to Other Regional Districts ThompsonNicola Regional District 59 Characterization of Existing System Report PRJ16048 STAGE 1 REPORT
134 Total System Cost: In itself, total system cost is not a useful metric as it is population dependent. It does emphasize the fact that management of solid waste is a very costly service, costing most regional districts millions of dollars each year. Total System Cost Per Tonne: This system cost measures the overall cost of the waste management system including transfer station operation, hauling, recycling and landfill. System costs range from a low $89.03/tonne for the Regional District of Mount Waddington to $192.67/tonne for the Peace River Regional District. System costs are strongly affected by economies of scale. Also a factor is the haul distance that waste has to be hauled. Regional districts with large travel distances between transfer stations and landfills and large haul distances for recyclables to market experience higher system costs. The TNRD total system cost per tonne is $ This is the fifth highest unit cost in the study area, i.e. in the middle of the pack. Total System Cost per Person: From a tax payers perspective, the total system cost per person is undoubtedly the most important metric because it measures how much money a household has to pay for solid waste disposal each year, either through taxation, tipping fees or both. The per person costs range from a low of $86.89 per person for Columbia Shuswap Regional District to $ for the Regional District of Fraser Fort George. The TNRD per person cost is in the middle at $ Landfill Cost per Tonne Landfilled: The per tonne cost to operate and maintain landfill facilities ranges from a low of $42.99 in the Regional District of Kitimat Stikine to $ in the Regional District of Fraser Fort George. The cost of landfill operations is primarily a function of whether the facility is natural control or engineered, and in part a function of economy of scale. Because the TNRD operates two relatively large natural control landfills, costs can be minimized through economy of scale. The TNRD landfill cost per tonne landfilled is $ Recycling Cost per Tonne Recycled: This metric measures the unit expenditures on recycling programs. The costs range from a low of $27.81/tonne in the Regional District of Fraser Fort George to $306.60/tonne in the Peace River Regional District. The cost to recycle one tonne of recycling in the TNRD is $ One of the biggest factors is the method of material collection. For instance, the Regional District of Fraser Fort George has no curbside collection and thus has a much lower recycling cost per tonne than the TNRD. Recycling cost per tonne is also a function of the processing costs, distance and shipping costs to market. Composting Cost per Tonne Composted: Composting costs can vary depending on a number of factors including what materials are being composted, operational costs,hauling costs, and economies of scale. Of the regional districts studied, the composting cost per tonne composted ranged from $6.41 in the Columbia Shuswap Regional District to maximum of $127 in the regional District of Nanaimo. The TNRD composting cost per tonne composted is $ Management Cost per Tonne: This metric tracks administration costs. The Regional District of Nanaimo, Peace River Regional District, and the Regional District of Kitimat Stikine were compared to the TNRD for this metric, as data was unavailable from the other regional districts. The lowest management cost was for the RDKS at $9.83/tonne. The TNRD (excluding Kamloops) had the highest cost in the study area at $39.91/tonne. ThompsonNicola Regional District 510 Characterization of Existing System Report PRJ16048 STAGE 1 REPORT

135 Tipping Fees:A tipping fee is a charge levied for disposal of waste and is based on weight and type of material. Differential tipping fees have been in place in most regional districts for quite some time. The fees are consistent with the user pay strategy for refuse disposal and allow for incentives (decreased disposal fees) for taking the time to separate recyclable waste from the garbage. Likewise, there are disincentives (increased disposal fees) for disposing of recyclables mixed with refuse at a disposal facility. Table 52 lists the tipping fees for each material in each regional district. As seen in Table 52, the District of Squamish has some of the highest tipping fees for MSW, but low or no charge for recyclable/diverted materials such as organics, yard and garden waste, cardboard, asphalt shingles, and metals. This tipping fee structure has evidently helped to divert recyclables from the waste stream as the District of Squamish has the highest percentage of waste diverted out of the regional districts evaluated. The Thompson Nicola Regional District has the third lowest tipping fee for MSW at $80/tonne. Table 52: Tipping Fees District of Squamish Regional District of Nanaimo Regional District of Mount Waddington Regional District of Kitimat Stikine Material Units MSW sorted $/tonne $150 $125 $125 $110 $82 $80 $80 $70 $55 MSW double see see unsorted 1 $/tonne $320 $250 $82 user fee footnote 2 footnote 3 $110 DLC $/tonne $150 $125 $125 $110 $82 $160 $160 $35 $110 cost of Asbestos $/tonne n/a $500 $325 volume based 4 $301 disposal + user fee $180 $210 $150 Organic waste (food) Regional District of Fraser Fort George ThompsonNicola Regional District City of Kamloops Columbia Shuswap Regional District no charge $110 $99 $55 $/tonne Yard and Garden no no no waste $/tonne charge $55 charge $99 charge $35 $35 $110 Wood waste $/tonne $65 $250 $99 $100 $100 $35 $55 Corrugated no Cardboard $/tonne charge $55 no charge $250 Mattresses $/mattress $15 $6 $11 $5 $10 $15 $7 Asphalt Shingles $/tonne no charge $125 $100 $100 $140 Metals $/tonne no charge $55 $55 no charge $35 $55 Peace River Regional District 1 ex. containing recyclables 2 mixed loads are charger at a higher rate based on the refuse type 3 double the charge of the highest charged component of the load 4 $41.25 per cubic meter ThompsonNicola Regional District 511 Characterization of Existing System Report PRJ16048 STAGE 1 REPORT
136 6. BYLAWS AND REGULATIONS 6.1 Regional and Municipal Bylaws This section outlines the current regional and municipal bylaws related to solid waste management within the ThompsonNicola Regional District Thompson Nicola Regional District Under the Environmental Management Act, Regional Districts have the authority to control how solid waste is managed within their boundaries. The following is a brief overview of the existing bylaws which are in place within the TNRD. ThompsonNicola Regional District Municipal Solid Waste Disposal and Recycling Facilities Bylaw (No. 2465) In 2014 the TNRD put in place the current Solid Waste Management Facilities Bylaw 2465 that defines the various types of solid waste, describes how each solid waste and recyclable material is to be managed in the regional district and sets tipping fees that are to be charged for services. This bylaw outlines that every person disposing of MSW at a Facility must pay user fees, no prohibited waste shall be deposited, no customer, visitor, site operator, Regional District Personnel or officer shall be verbally abused of threatened. This bylaw also outlines penalty fees, load inspections, appeals and repeals. Materials that are banned from the solid waste stream include: 1. Corrugated Cardboard 2. Glass Containers 3. Mixed Waste Paper 4. Metal Containers 5. Plastic Packaging 6. Product Stewardship Material 7. Scrap Metal Materials covered under stewardship programs, yard waste and scrap metal are accepted free of charge. TNRD Solid Waste Management Facilities Amendment Bylaw (No. 2506) In 2015 Bylaw 2465 was amended. Tipping fees for MSW were increased to $80/tonne. Tipping fees for sorted construction materials were increased to $100/tonne and fees for comingled DLC were increased to $160/tonne. As well the amendment makes allowance for the imposition of fines for violations of Bylaw ThompsonNicola Regional District 61 Characterization of Existing System Report PRJ16048 STAGE 1 REPORT
137 6.1.2 City of Kamloops Solid Waste and Recyclables Bylaw (No. 4059) This bylaw establishes a system for the collection, removal and disposal of solid waste and recyclables. The bylaw requires all residences within a specified service area to participate in the solid waste and recycling collection service and that all private waste collectors comply with the requirements laid out in the bylaw. It outlines collection container specifications, cart leasing fees, location and timing of placement, acceptable types of material, and weight of each collection containers. It also outlines the roles and responsibilities of property owners and the City to minimize risks, maximize safety and efficiency in waste collection. The bylaw requires that single family properties as well as multifamily properties participate in recycling programs and that recycling services must be provided starting April 1, To minimize attracting bears, the bylaw states that Between April 1 and November 30, no owner or occupier of real property shall cause or permit to be placed any recyclables out for pickup by the cart collection service prior to 4:00 am of the collection day. The bylaw also includes amendments for rate changes and landfill tipping fee and illegal deposit of refuse on public lands. The bylaw states no person may deposit in any solid waste or recycling container any of the following items: Hot ashes Liquid wastes Bulk chemical composition waste Animal cuttings or waste of dead animals Tires, oil, fuel, and other equipment lubricant filters, Hazardous waste Offensive waste Where city recycling collection is available at a particular property, no person may deposit inot any solid waste container: grass clippings, cardboard, or newspapers. These bans do not extend to disposal of those materials as MSW at transfer stations and landfills. ThompsonNicola Regional District 62 Characterization of Existing System Report PRJ16048 STAGE 1 REPORT
 This bylaw outlines all that all waste collectors comply with the requirements laid out in the bylaw.")
138 6.1.3 City of Merritt Photo 61. Load of Carboard being dumped at MSW Active Face Collection, Disposal and Control of Solid Waste Bylaw (Nos and 2015) This bylaw outlines all that all waste collectors comply with the requirements laid out in the bylaw. It also outlines collection cart container specifications, location and timing of placement, acceptable types of material, and capacity of collection containers. It also outlines payment of fees and penalties. The bylaw does not identify any banned recyclables, nor does it require that residential, multiresidential, nor commercial properties participate in recycling programs Village of Cache Creek Garbage Collection, Disposal and Rates Bylaw (No. 458) This bylaw outlines solid waste collection services for single family dwellings, apartment houses, trade premises and buildings in which more than two families dwell and describes the requirements associated with the service. It outlines prohibited waste materials, collection times, fees and penalties. The bylaw, promulgated in 1992 does not discuss recycling requirements, nor does it identify any material bans. Garbage rates are defined in Schedule A as annual taxation rates that are a function of the size of premises. ThompsonNicola Regional District 63 Characterization of Existing System Report PRJ16048 STAGE 1 REPORT
139 6.1.5 Village of Ashcroft Solid Waste Removal Bylaw (No. 785) This bylaw outlines collection requirements, number of collection carts permitted, location and time of pickup, prohibited waste, fees and penalties. It also outlines the roles and responsibilities of property owners and the City to minimize risks, maximize safety and efficiency in waste collection. 6.2 Provincial Policies and Legislation Solid waste management is regulated by the Province of BC Environmental Management Act The Environmental Management Act governs the management of waste in British Columbia. The act provides the authority for introducing wastes into the environment in a manner that protects human health and the environment. The act enables the use of permits, regulations and codes of practice to authorize discharges to the environment and enforcement options to encourage compliance Recycling Regulation This regulation requires producers of the designated products to develop a program for their endoflife collection and recovery of materials and to consult stakeholders when developing their plans. The current list of designated products currently includes most beverage containers, most household hazardous waste, and household goods powered by electricity and batteries Open Burning Smoke Control Regulation This regulation applies to fires for purposes such as land clearing, silviculture, forestry, wildlife habitat enhancement, and domestic range improvement. The intent of the regulation is to reduce smoke emissions and impacts without requiring an Air Emission Permit from the BC Government. The regulation outlines when and how open burning can occur. This regulation is currently under review Organic Matter Recycling Regulation (OMRR) The Organic Matter Recycling Regulation of B.C. (OMRR) governs the production, quality and land application of certain types of organic matter. It provides guidance for compost producers on composting requirements to ensure the protection of soil quality and drinking water sources. This regulation was updated in Landfill Criteria for Municipal Solid Waste BC s Landfill Criteria for Municipal Solid Waste applies to all new landfills and both lateral and vertical expansions of existing landfills, designed and constructed for the disposal of MSW. The criteria were updated in ThompsonNicola Regional District 64 Characterization of Existing System Report PRJ16048 STAGE 1 REPORT
140 6.2.6 Guidelines for Environmental Monitoring at Municipal Solid Waste Landfills These guidelines are intended to assist landfill owners and operators to design and implement an environmental monitoring program for groundwater and surface water as required by the Landfill Criteria for Municipal Solid Waste, Second Edition Landfill Gas Management Regulation The Landfill Gas Management Regulation applies to all regulated landfill sites that: Have 100,000 tonnes or more of municipal solid waste in place, or Receive 10,000 or more tonnes of municipal solid waste for disposal into the landfill site in any calendar year after This regulation requires owners of applicable landfills to conducts an initial landfill gas (LFG) generation assessment. Based on the outcome of that assessment, a landfill gas management design plan may be required for the landfill site. Once the design plan is accepted by the Province, the owner of the landfill is required to install the appropriate landfill gas management facilities. ThompsonNicola Regional District 65 Characterization of Existing System Report PRJ16048 STAGE 1 REPORT
141 APPENDICES
142 The appendices for the TNRD RSWMP Stage 1 report can be found at the following link:


143 ThompsonNicola Regional District Solid Waste Management and Resource Recovery Plan Update Opportunities for Waste Reduction and Diversion Draft for Discussion Prepared by: Maura Walker & Associates In collaboration with Carey McIver & Associates Ltd., Jan Enns Communications, and Date: March 6, 2017
144 March 6, 2017 Mr. Jake Devlin Director of Environmental Services ThompsonNicola Regional District Victoria St Kamloops, BC Canada, V2C 2A9 Dear Jake, Re: TNRD Solid Waste Management Plan Review Waste Reduction and Diversion Opportunities We are pleased to submit our Waste Reduction and Diversion Opportunities report that describes a range of possible approaches to reducing the amount of waste sent to landfill. The information contained in this report will be presented to the Review Advisory Committee and is intended to generate a dialogue regarding which options to reduce the amount of solid waste disposed should be considered for the TNRD s updated Regional Solid Waste Management Plan. Yours truly, Maura Walker, President Maura Walker and Associates Maura Walker & Associates Ph
145 TNRD SWMP Review Options for Waste Reduction and Diversion Table of Contents 1 Introduction Provincial Direction for Solid Waste Management in BC Current Diversion System in the TNRD Description System Performance Key Opportunities for Waste Diversion ICI Waste Diversion Opportunities What does the SWMP say about ICI Waste? What is being done now in regards to ICI waste diversion? What other optional are available for ICI waste diversion? Organic Waste Diversion Opportunities Reduction Residential Collection of Organics Participation by the Industrial, Commercial and Institutional (ICI) Sector in Organic Waste Diversion Organic Waste Processing Transfer and Processing Options Demolition, Renovation and Construction (DRC) Waste Diversion Opportunities What is being done now regarding DRC waste diversion? What other options are available for DRC waste diversion? Promotion, Education and Consultation What does the RSWMP say for promotion, education and consultation? What is being done now regarding promotion and education? What other options are available for promotion and education? Waste Reduction and Diversion Potential List of Figures Figure 11: Plan Review Process... 4 Figure 21: Pollution Prevention Hierarchy... 5 Figure 31: Regional District Disposal Rates Figure 32: Disposal Rate vs. Tipping Fee in Comparable Regional Districts Figure 33: Overall Waste Stream Composition Figure 34: Waste Disposal by Source Page ii
146 TNRD SWMP Review Options for Waste Reduction and Diversion List of Tables Table 21: Provincial Guiding Principles... 5 Table 31: Overview of Waste Diversion Programs in the TNRD... 7 Table 32: Disposal Rates in Comparable Regional Districts Table 33. Sources of Landfilled Waste Table 51: Sample of BC Organic Waste Curbside Collection Programs Table 81: Target Waste Materials Table 82: Estimated Diversion Potential Page iii
147 TNRD SWMP Review Options for Waste Reduction and Diversion 1 Introduction The ThompsonNicola Regional District (TNRD) is currently updating its 2008 Solid Waste Management Plan (SWMP). This is a revised version of the original plan approved by the province in The process to review the plan is being conducted in three phases as indicated in Figure 11. The first phase, which is complete, consisted of the establishment of the Regional SWMP Review Advisory Committee (RAC) as well as an assessment of the current solid waste management system and a status report on the implementation of the 2008 Plan. Phase 1 also included a concurrent communication and consultation program consisting of a community survey and SWMP web page. The second phase entails a review of options to address the region s future waste solid waste management needs and the selection of preferred options. Phase 2 will also include a concurrent communication process as well as establishing a comprehensive community and stakeholder consultation process. The third phase will consist of a community and stakeholder consultation process to obtain input on the selected options. The planning process is currently in the second phase. Figure 11: Plan Review Process Phase1 Phase 2 Phase 3 Establish RSWMP Review Advisory Committee Consider options for the future: Waste Diversion Residual waste Policy & Regulations Financing Obtain community feedback on preferred options Assess existing system Community Survey SWMP Web Page Update information Establish tools for community access and input Finalize plan update This report addresses opportunities to minimize the amount of waste that is sent to landfill in the TNRD through reduction and diversion. The report is structured as follows: Section 2 summarizes provincial direction for solid waste management in BC; Section 3 summarizes the current system for waste reduction and diversion in the TNRD, the effectiveness of this system and key opportunities for improvement; Section 4 identifies opportunities to increase waste diversion in the ICI (industrial, commercial, institutional) sector; Section 5 identifies opportunities to increase organic waste diversion; Section 6 identifies opportunities to increase waste diversion from the demolition, renovation and construction (DRC) sector; Section 7 identifies opportunities to support waste diversion through education and communication activities; and Section 8 summarizes the waste diversion potential associated with the above opportunities. Page 4 March 2017
 under the provincial Environmental Management Act.")
, not only recommends that plans be developed in accordance with the")
148 TNRD SWMP Review Options for Waste Reduction and Diversion 2 Provincial Direction for Solid Waste Management in BC In British Columbia, regional districts develop municipal solid waste management plans (SWMP) under the provincial Environmental Management Act. These plans are long term visions of how each regional district would like to manage its solid wastes in accordance with the pollution prevention hierarchy as illustrated in Figure 21. Figure 21: Pollution Prevention Hierarchy The new provincial Guide to Solid Waste Management Planning September 2016 (the Guide), not only recommends that plans be developed in accordance with the pollution prevention hierarchy but also that plans be guided by the eight principles which were reviewed and amended by the advisory committees at their first meeting. The resultant guiding principles are outlined in Table 21. Table 21: Provincial Guiding Principles 1. Promote zero waste approaches and support a circular economy 2. Promote the first 3 Rs (Reduce, Reuse and Recycle) 3. Maximize beneficial use of waste materials and manage residuals appropriately to the Region 4. Individuals and firms are enabled to make environmentally sound choices about the generation and management of solid waste through provision of appropriate information, including userpay and marketbased incentives wherever possible. 5. Prevent organics and recyclables from going into the garbage wherever practical 6. Collaborate with other regional districts wherever practical Page 5 March 2017
149 TNRD SWMP Review Options for Waste Reduction and Diversion 7. Develop collaborative partnerships with interested /affected parties to achieve regional targets set in plans 8. Level the playing field within regions for private and public solid waste management facilities Under the Environmental Management Act municipal solid waste(msw) is defined as waste from residential, commercial, institutional, demolition, land clearing or construction sources. The new Guide establishes provincial MSW management targets to set a direction for regional districts to follow and allow for performance measurement at the provincial level. As of 2013, the Ministry of Environment (the MOE) has set two provincial targets for They are: Lower BC s municipal solid waste disposal rate to 350 kg per person per year Have 75% of BC s population covered by organic waste disposal restrictions. These targets were developed after the ministry reviewed provincial disposal data from 2012 and 2013 to see current state and general trend. Through an analysis of current solid waste management plans in BC and consideration of future targets set in plans, the ministry determined that these provincial targets are achievable. Regional districts may set locally relevant targets, including regional municipal solid waste disposal rates. The above provincial principles and targets are provided to inform the following discussion of current system performance and opportunities for improvement. 3 Current Diversion System in the TNRD 3.1 Description Every regional district in BC has unique characteristics and the TNRD is no exception. As discussed in the Stage 1 Report, although the TNRD covers a large geographic area, 82% of the population resides in urban areas, 13% in rural electoral areas and 5% in First Nation reserves. However, within the urban population, there are only two cities with populations greater than 5,000 people Kamloops with 90,000 residents and Merritt with 7,000 residents. The remaining urban population lives in district municipalities and villages with populations ranging from 2,300 in Clearwater to 250 in Lytton. Given that garbage generation is a function of population, geography and level of economic activity, the TNRD may be described as having two distinct waste sheds: (1) Kamloops with its growing urban population, high level of economic activity and consequently high garbage generation rate, and (2) the rest of the region with a stable rural population, less economic activity and consequently a lower rate of garbage generation. This geographic, population and economic distribution has informed the structure of the MSW management system in the TNRD. Although the TNRD is mandated by the province to develop a solid waste management plan for the entire regional district, plan implementation is primarily the responsibility of the two major system operators, the City of Kamloops and the TNRD for rural areas of the region, with lesser involvement by the smaller municipalities through curbside collection programs. Page 6 March 2017
150 TNRD SWMP Review Options for Waste Reduction and Diversion The following Table 31 provides an overview of the current waste diversion system operated by the City of Kamloops and the TNRD for residential, Industrial, Commercial, Institutional (ICI) and Demolition, Renovation and Construction (DRC) wastes in the regional district. Table 31: Overview of Waste Diversion Programs in the TNRD Residential Waste ICI Waste DRC Waste City of Kamloops System Single stream automated curbside collection of recyclables for all single family and 95% of multifamily households Ban on cardboard, newspaper and grass clippings in curbside garbage Yard waste dropoff sites Recyclables accepted at disposal sites City of Kamloops System Private collection services available for the collection of cardboard. The City provides cardboard collection service for roughly 25% of business sector Recyclables accepted at disposal sites No disposal bans on ICI paper and cardboard No disposal bans on yard waste at disposal facilities City of Kamloops System DRC waste accepted at disposal sites Differential tipping fees to encourage source separation of metal, wood and asphalt shingles. No disposal bans TNRD Operated System Single stream blue bag curbside collection recyclables for all single family households in Barriere, Clearwater, Savona, Cherry Creek, Blue River and Avola as well as municipal collection in Merritt, Chase and Logan Lake Blue Bag recyclables and stewardship materials accepted at Full Service Eco Depots and Residential Sites Yard waste dropoff at all Eco Depots and most Residential PLUS Sites Disposal ban on cardboard, glass, mixed waste paper, containers, plastic packaging, product stewardship material, scrap metal (currently not enforced) TNRD Operated System Disposal ban on cardboard, glass, mixed waste paper, containers, plastic packaging, product stewardship materials, scrap metal (currently not enforced) TNRD Operated System DRC waste accepted at disposal sites Differential tipping fees to encourage source separation of metal, wood and asphalt shingles. Disposal ban on cardboard and metal not enforced Page 7 March 2017
151 TNRD SWMP Review Options for Waste Reduction and Diversion The City of Kamloops and the TNRD also provide education and communication programs as well as support for backyard composting. More detail is provided in the Stage 1 Report. 3.2 System Performance As stated in Section 2, the MOE has established a target to lower the provincial MSW disposal rate to 350 kilogram per person per year by This means that the MOE measures regional district solid waste management system performance in terms of disposal rate and not diversion. This is because measuring waste diversion has been problematic given the variability between regional districts regarding the definition and measurement of diverted materials. In 2013, the MOE developed the BC Waste Disposal Calculator to provide more reliable and consistent data on MSW disposal by regional districts, and to assist in determining the Province s progress toward zero waste. This reporting tool is now available online and disposal data has been submitted by regional districts for 2012, 2013, 2014 and Based on disposal data provided in the Stage 1 Report, as well as data reported, in 2015 a total of 79,367 tonnes of MSW was disposed in the TNRD, including TNRD, municipal and private landfills. As per the BC Waste Disposal Calculator methodology, this equates to disposal rate of 596 kilograms per capita. For 2016, 80,520 tonnes of waste was disposed which also equates to a disposal rate of 621 kilograms per capita. This rate differs from that presented in the Stage 1 Report due to the use of different in population estimates. While the Stage 2 Report used the 2011 Census data to calculate a 2016 disposal rate of 640 kilograms per capita, the BC Waste Disposal Calculator uses regional district population estimates prepared by BC Stats on an annual basis. The following Figure 31 provides a comparison of regional districts disposal rates for the 2015 reporting period. Page 8 March 2017

152 TNRD SWMP Review Options for Waste Reduction and Diversion Figure 31: Regional District Disposal Rates 2015 As indicated in Figure 31, in 2015 regional district disposal rates ranged from 297 kilograms per capita in the Cowichan Valley Regional District, to 922 kilograms per capita in the Peace River Regional District. The provincial average disposal rate was 498 kilogram per capita. At 596 kilograms per capita (2015 disposal rate), the TNRD sits at roughly 20% above the provincial rate. However, although the data reported in the BC Waste Disposal Calculator is comparable between regional districts, it is more appropriate to compare disposal rates between regional districts with comparable geography, population and level of economic activity. The following Figure 32 provides a comparison of disposal rates for regional districts that are comparable to the TNRD with respect to population and level of economic activity. Page 9 March 2017
 and the Regional District of Nanaimo (RDN) have disposal rates that are significantly lower than the provincial average of 498 kilograms per capita and the TNRD rate")
153 TNRD SWMP Review Options for Waste Reduction and Diversion Table 32: Disposal Rates in Comparable Regional Districts 2015 As indicated in Table 32, at roughly 300 kilograms per capita the Cowichan Valley Regional District (CVRD) and the Regional District of Nanaimo (RDN) have disposal rates that are significantly lower than the provincial average of 498 kilograms per capita and the TNRD rate of 596 kilograms per capita. However the TNRD has a disposal rate that is less than the Central Okanagan Regional District at 649 kilograms per capita and the Regional District of FraserFort George at 833 kilograms per capita. This variation in disposal rates can be explained by the difference in waste diversion programs implemented in each of these regional districts. Both the CVRD and the RDN have implemented ambitious waste diversion programs that address recycling and organics (food and yard waste) diversion programs for the residential, ICI and DRC sectors that include disposal bans on ICI recyclables and organic waste as well as DRC wood waste. In both regional districts, the motivation to aggressively pursue waste diversion was a lack of local landfill capacity. The regional districts of North Okanagan (RDNO), OkanaganSimilkameen (RDOS), ComoxStrathcona (CSRD) and Central Okanagan (CORD) have all implemented a full range of residential recycling programs as well as variable disposal rates and/or disposal bans on ICI recyclables and DRC wood wastes. Although some of these regional districts have banned yard waste from disposal and even collect yard waste at the curb, none have yet to implement food waste composting programs like those in the CVRD and RDN. In the Regional District of FraserFort George, curbside recycling was only implemented in the City of Prince George in Although the regional district has recycling opportunities at most of their rural Page 10 March 2017


154 TNRD SWMP Review Options for Waste Reduction and Diversion ecodepots and transfer stations, most of the diversion potential is in the City of Prince George, a growing urban commercial centre with a population of roughly 70,000. Consequently the 2016 SWMP for the RDFFG identifies a range of waste diversion programs for the ICI and DRC sectors including disposal bans. What is clear from the above review of disposal rates between comparable regional districts is that significant waste diversion is possible. Both the CVRD and RDN were faced with a waste disposal capacity crisis which in turn set the stage for effective waste diversion programs. In particular, as shown in Figure 33, the tipping fees in these two regions are higher than in the other regional districts with higher disposal rates. These high tipping fees plus disposal bans have allowed the private sector to invest in local recycling infrastructure that provides an alternative to disposal. Figure 32: Disposal Rate vs. Tipping Fee in Comparable Regional Districts 2015 While it is clear that the TNRD solid waste management system is not performing as well as some regional districts, TNRD and the member municipalities have made great progress since the adoption of the 2008 SWMP, particularly with respect to residential recycling and the provision of EPR collection service. The TNRD has also improved the recycling and disposal system in the TNRDoperated rural system. Moving forward the TNRD must address opportunities for waste diversion in the ICI and DRC sectors to achieve reduce its waste disposal rate any further. 3.3 Key Opportunities for Waste Diversion In February 2017 the SWMP Review Advisory Committee (RAC) was presented with key considerations for the 2017 SWMP update. With respect to improving waste diversion and hence reducing waste disposal, the three key considerations were related to improving ICI recycling, improving organics Page 11 March 2017
155 TNRD SWMP Review Options for Waste Reduction and Diversion diversion by considering opportunities for food and yard waste composting and improving diversion in the DRC sector by considering opportunities for wood waste recovery. These considerations were informed by reviewing the waste characterization study undertaken by the TNRD in As shown in Figure 33, organics, including food waste and yard and garden waste, represents the largest component of waste disposed in the TNRD and hence provides the greatest opportunity for additional diversion. Wood, DLC (demolition, land clearing and construction waste) and metal also represents a significant proportion of the overall waste stream (roughly 34% combined). Although by 2016 the proportion of paper products and packaging would likely be less than 2011, based on waste composition studies completed more recently in similar regional districts, this still represents a significant diversion potential, particularly in the ICI sector. Figure 33: Overall Waste Stream Composition 2011 Glass, 2.1% Plastic Products, 3.5% Metals, 4.0% Electronic Waste, 1.8% Hazardous Waste, 1.5% Rubber, 0.8% Organics, 26.3% Residuals, 4.3% Textiles, 4.6% Plastic Packaging, 7.0% Paper Packaging, 7.1% Wood, 17.7% Paper Products, 7.6% DRC, 11.7% Page 12 March 2017

 TNRD landfills (t)* Total landfilled (t) Amount Contributed by Source Residential Curbside 16,101 5,155")
,")

156 TNRD SWMP Review Options for Waste Reduction and Diversion Another indicator of potential opportunities for additional waste diversion comes from examining the source of waste being disposed at the landfills. Table 33 and Figure 34 show that the largest contributors to the waste landfilled come from the residential and ICI sectors. Table 33. Sources of Landfilled Waste Source City of Kamloops landfills (t) TNRD landfills (t)* Total landfilled (t) Amount Contributed by Source Residential Curbside 16,101 5,155 21,256 26% Commercial (ICI) 28,291 5,155 33,446 42% DRC 16,130 1,718 17,848 22% SelfHaul 2,813 5,155 7,968 10% Total 63,335 17,184 80, % * Source of waste estimated Figure 34: Waste Disposal by Source SelfHaul 10% Residential Curbside 26% Demo/ Reno/ Construction 22% Commerical 42% Using these 2 sources of data (composition and source), plus the review of the existing system (as described in the Stage 1 report), the most significant opportunities to reduce the amount of waste landfilled in the TNRD include: 1. ICI waste: Waste reduction and diversion initiatives have not yet targeted this sector. Given its large contribution to the waste disposed, the amount of recyclable materials still being disposed, and the availability of local collection and recycling companies to service this sector, the ICI sector represents low hanging fruit for waste diversion. Page 13 March 2017
157 TNRD SWMP Review Options for Waste Reduction and Diversion 2. Organic waste: As the single largest component of the waste disposed and the biggest contributor to the generation of landfill gas (a powerful greenhouse gas), targeting this type of waste also represents a large opportunity to decrease the amount of waste landfilled. Because there are currently limited services and infrastructure to manage this particular waste stream in the TNRD, tackling this waste stream will be more challenging than for ICI recyclables. 3. DRC waste: Much of the demolition, renovation and construction waste received contains materials that are recyclable (cardboard, metal, concrete), usable as an energy source (wood waste) or reusable (windows, doors, beams). These components have established markets and also represent a significant opportunity to reduce the quantity of waste landfilled. 4. Promotion and Education: The key to successful diversion comes through ensuring that waste generators (residents, businesses, institutions, DRC projects) are fully informed and able to engage in desired waste management behaviours. Even wellestablished programs such as residential recycling need to be back stopped by ongoing promotion and education efforts to ensure that these programs are maximized. Hence this report describes options to take advantage of these opportunities in the following sections: Section 4: Opportunities to increase waste diversion in the ICI (industrial, commercial, institutional) sector; Section 5: Opportunities to increase organic waste diversion; Section 6: Opportunities to increase waste diversion from the demolition, renovation and construction (DRC) sector; and Section 7: Opportunities to support waste diversion through education, and communication consultation. Page 14 March 2017
158 TNRD SWMP Review Options for Waste Reduction and Diversion 4 ICI Waste Diversion Opportunities 4.1 What does the SWMP say about ICI Waste? To encourage businesses to engage in recycling, the current RSWMP includes the introduction of bans on recyclable materials in the garbage (enforced at manned transfer stations and landfills) and an associated promotion and education program targeting businesses. 4.2 What is being done now in regards to ICI waste diversion? Apply differential tipping fees to encourage source separation. Differential tipping fees apply different per tonne charges to the various categories of waste materials delivered to a transfer station or landfill. Differential fees can be used encourage commercial waste generators and haulers to sourceseparate their waste materials for diversion. The table below is an example of how City of Kamloops Mission Flats Landfill s variable tipping fees can be varied to support waste diversion objectives. Source: 1 Demolition, Land Clearing and Construction Waste (DLC) Unseparated* Tonnes $160 Source Separated DLC Wood Waste Tonnes $100 Gypsum Tonnes $100 Asphalt Roofing Tonnes $100 Crushable Aggregate (concrete, asphalt, etc.) Tonnes $ What other optional are available for ICI waste diversion? a) Implement disposal bans. To encourage sourceseparation and diversion, many regional districts and municipalities implement disposal bans on recyclable and compostable materials. This is a lowcost policy tool used to signal to waste generators and waste collection companies that they are expected to separate and recycle/compost specific materials for which alternatives are readily available (e.g. cardboard, metal, yard waste). Disposal bans are enforced at the point of disposal (i.e. at transfer stations and landfills) through the application of significant surcharges on garbage found to contain banned materials. To ensure sustained success, disposal bans require the local government to work closely with ICI waste generators and particularly commercial waste haulers in the design, start up and ongoing maintenance of this policy. The Regional District of Nanaimo, whose disposal ban on cardboard was implemented in 1992, has a consistent approach whenever they introduce a new disposal ban: 1 Source: Page 15 March 2017
 Educate (make sure all haulers and waste generators are aware of the")
159 TNRD SWMP Review Options for Waste Reduction and Diversion I. Regulate (decide to ban a waste stream with a readily available alternative to landfilling) II. III. IV. Collaborate (work with affected stakeholders to determine the timing of implementation and the ramp up of enforcement measures) Educate (make sure all haulers and waste generators are aware of the upcoming new disposal ban, and plan to communicate regularly) Enforce (enforce the disposal ban at the point of disposal). b) Assist private collectors to encourage more/better recycling by the ICI sector. This could be achieved through the development and distribution of consistent signage and messaging for use on collection containers and within the workplace, such as those shown below. Consistency within the region should result in better participation in recycling and lower contamination of the recyclables. Metro Vancouver provides free artwork of what is recyclable/compostable for any hauler, business or building manager to download and print. c) Require recycling collection services at all ICI locations. In addition to disposal bans enforced at the point of disposal, bylaws can also require all businesses to have recycling collection. This service can either be provided by commercial haulers, or businesses can selfhaul their recycling to a nearby recycling depot. This approach builds on the City of Kamloops bylaw that requires all multifamily buildings to have a recycling collection service. The Resort Municipality of Whistler requires all businesses and multifamily buildings to have onsite collection of recyclables and food scraps. Page 16 March 2017

160 TNRD SWMP Review Options for Waste Reduction and Diversion d) Increase awareness of waste diversion opportunities. Develop a campaign that would increase the awareness of local recycling and composting services and the advantages of utilizing those services. An awareness campaign could also include a recognition program for businesses that actively participate in waste diversion. For example, Boulder, Colorado s Ecocycle provides window stickers for businesses that have committed to zero waste. e) Mandatory space allocation. One of the most common barriers to establishing recycling in multifamily and ICI buildings is the lack of available space for collection containers. To mitigate this barrier, many municipalities in North America are including mandatory space allocations in their building requirements for both new developments and significant redevelopments and renovations. For example, in September 2013, Pitt Meadows council adopted Policy No.C060: Specifications for Garbage, Organics, and Recycling Storage Space in New MultiFamily Residential and Mixed Use Developments. Pitt Meadows based their specifications on a model bylaw developed by Metro Vancouver in consultation with the municipalities and the development community. The model is intended to create consistency within Metro Vancouver on space allocation, as well as reduce the amount of legwork each municipality would have to undertake to prepare their own policy. The City of Kamloops zoning bylaw also requires commercial multifamily developments to provide space for both garbage and recycling. Page 17 March 2017
161 TNRD SWMP Review Options for Waste Reduction and Diversion 5 Organic Waste Diversion Opportunities Diverting organic waste from landfill disposal has become a significant solid waste management issue in BC. This is because organic waste, comprised primarily of food waste, yard & garden waste, and clean wood waste, not only represents the largest component of landfilled waste (3540%), but also generates methane, a potent greenhouse gas, during decomposition in a landfill. For this reason several regional districts in BC (Regional District of Nanaimo, Capital Regional District, Cowichan Valley Regional District and Metro Vancouver) have implemented organic waste disposal bans to preserve landfill capacity, reduce greenhouse gas emissions and create compost for beneficial use in their communities. As a result, 66% of the population of BC lives in regional districts with organics disposal bans. Organic waste diversion is also essential to meeting the new goals set by the BC Ministry of Environment (MOE): to lower the provincial municipal solid waste disposal rate from 570 to 350 kilograms per person annually and to have 75% of the BC s population covered by organic waste disposal bans. To meet these goals the MOE is proposing that regional districts, as part of their solid waste management planning process, adopt as a guiding principle the separation organics and recyclables out of the solid waste stream wherever practical. To take advantage of this significant waste diversion opportunity, TNRD, along with the City of Kamloops, will need to develop an organic waste management strategy that may include some or all of the following elements: Source reduction Residential collection Multifamily participation ICI participation Processing 5.1 Reduction To avoid the costs associated with the collection and processing of organics many communities encourage reduction initiatives such as backyard composting and food waste avoidance programs. TNRD already promotes backyard composting by offering residents backyard composters at a subsidized rate and having compostrelated educational materials available on their website. Other potential initiatives include: a) Food waste reduction campaigns Based on research in Europe and North America, residents may be wasting about 25 percent of all the food and drinks that they purchase. Metro Vancouver s Love Food Hate Waste Program aims to change this behavior through educating consumers about meal planning, and careful cooking and storage, so that consumers can enjoy eating over half of the food that they currently end up throwing away. Metro Vancouver has stated publicly that they are willing to share this program with other regional districts. The BC Ministry of Environment also provides the US EPAdeveloped Food Too Good to Waste toolkit to regional districts at no charge. The TNRD could implement either one of these programs at a relatively low cost. Page 18 March 2017
 which helps UK households tackle food waste.")
 to develop campaigns and tools for specific audiences to change behaviour to")

162 TNRD SWMP Review Options for Waste Reduction and Diversion Case Study: Love Food, Hate Waste. In 2007, an organization called WRAP started Love Food Hate Waste (LFHW) which helps UK households tackle food waste. The program is designed to reduce the 7 million tonnes of food waste generated annually (60% which could have been eaten and over half of which is generated by households). LFHW partners with different groups (retailers and brands, local authorities, businesses, community and campaign groups) to develop campaigns and tools for specific audiences to change behaviour to reduce food waste. These campaigns focus on food waste thrown away by households. Strategies focus on why food is thrown away at different stages: planning, buying, storage, preparation and use different communications channels, either directly or through partners, to encourage behaviour change. Following a Love Food Hate Waste campaign in West London, avoidable food waste decreased by 14% in just six months. Additionally, for every 1 invested the municipality estimated that it saved up to 8 in avoided waste management costs (i.e. collection and composting). b) Promote other approaches to selfmanagement of organic waste which can accommodate broader range of organic wastes than backyard composters, e.g. Green Cone Digesters, Bokashi (pictured below). The Victoria Compost Education Centre promotes digesters as a means of onsite management of pet waste. They provide workshops and online resources on how to use Digesters. The Powell River Community Compost Centre gives free workshops on using Bokashi as a means of turning food scraps into a soil fertilizer. Green Cone Digester Bokashi Page 19 March 2017
 Information booths at farmers markets, home shows and other appropriate venues Case Study: Compost Coaching.")
163 TNRD SWMP Review Options for Waste Reduction and Diversion c) Enhance education / outreach on selfmanagement of organic waste, e.g.: At home Compost Coaching (see Case Study) Information booths at farmers markets, home shows and other appropriate venues Case Study: Compost Coaching. The former North Shore Recycling Program focuses on waste reduction, recycling and composting for three municipalities on the North Shore. In 2007 they developed a Compost Coaching program to reduce the organics in the collected garbage. Using a CommunityBased Social Marketing (CBSM) approach, in the first year they worked with 156 local residents at their homes to improve their composting through hands on coaching at their residences. Intended to be fun, informal and based on the residents needs, the coach would base the conversation on participants questions, level of knowledge and condition of their compost bin. The 3045 minute session would cover basic composting as well as tips for coexisting with bears. This coaching resulted in an additional 36 kg of organic material composted on site per capita for households that were already composting, and 190 kg per capita for households that had not composted before. d) Promote xeriscaping and grasscycling which reduce plant waste and reduce the need for watering e) Provide incentives for people to xeriscape such as rebate programs like those offered for lowflow toilets or homeenergy retrofits f) Fruit tree gleaning programs (typically a volunteerrun effort where homeowners allow the volunteers to harvest of excess fruit and vegetables for redistribution to the community, including food banks) g) Link the promotion of onsite management of organic waste with WildSafeBC education initiatives. 5.2 Residential Collection of Organics Once local processing capacity for organic waste is available, local governments can provide organic waste collection services for their residents. For example, the City provides curbside and depotbased collection of yard waste that is processed (composted) at their Cinnamon Ridge composting facility. Residential collection opportunities include: a) Adding food waste to the City of Kamloops s current residential curbside yard waste program (requires that a facility that can compost the food waste is in place). Refer to the Case Study for Port Coquitlam on page 21 as an example of a similar approach). Page 20 March 2017

164 TNRD SWMP Review Options for Waste Reduction and Diversion b) Adding organic waste to existing curbside collection services that are within proximity of a composting facility. The targeted organic waste may be yard waste only, food waste only, or combined food and yard waste, depending on the type of composting facility available. c) Establishing dropoff depots for residents without curbside collection when the community is within reasonable transportation distance to a composting facility. d) For multifamily homes, the City of Kamloops could amend its Bylaw 4059 to require all property owners of multifamily properties to provide organic waste collection services. The current bylaw, under section 412, requires All property owners of multifamily properties must provide recycling services, at a level of frequency which is equivalent to or exceeds the recycling collection service provided for by the City This service may be obtained either through the City of Kamloops or through contract with a private service provider, at the discretion of the owner. Associated with this bylaw amendment would be offering multifamily buildings an organic waste collection service provided by the City (the same cartbased service provided to single family homes). o A similar bylaw requirement could also be applied to Sun Peaks. Case Study: Port Coquitlam Yard Waste and Food Scraps Collection Program The City of Port Coquitlam provides fully automated waste collection services to over 11,500 residential properties throughout the City. The City provides specially designed 240 litre green waste carts to all properties that receive the service. Organics are collected weekly (May to December) and biweekly the rest of the year. Garbage is collected biweekly yearround. Port Coquitlam residents currently divert 63% of their household waste away from the landfill (through recycling and organics diversion) saving tens of thousands in disposal fees each year. The combined fee for the organics and garbage service is $ per annum. The organics portion (separate cart for organics) is estimated in the range of $77 to $80 per household per annum. Table 1, on the next page, provides some examples of organic waste curbside collection services in other BC jurisdictions. Residential curbside programs that collect recycling and food waste typically find that 6065% of the total amount waste set out by homes is diverted (i.e. only one third is garbage). Page 21 March 2017
165 TNRD SWMP Review Options for Waste Reduction and Diversion Table 51: Sample of BC Organic Waste Curbside Collection Programs District of Squamish 6,500 homes City of Nanaimo 27,000 homes Township of Langley 22,000 homes City of Terrace 3,500 homes Town of Comox 4,450 homes District of North Cowichan 12,000 homes Organic waste streams collected Commingled food and yard waste Frequency of collection Biweekly (Weekly in summer) Collection Container 246L cart for SF homes; 120L cart available to townhouses only Food waste only Weekly 34L green bin (switching to 120L automated carts) Commingled food and yard waste Commingled food and yard waste; plus yard waste only (April to Nov) Commingled food and yard waste Weekly 240L semiautomated cart + yard waste in kraft bags or garbage cans labelled "green can" Organics banned from garbage? Ban will be in place in 2017 Only ICI organics banned from the regional landfill Yes Bags allowed? Paper only Compostable plastic and paper Paper only Weekly 120L fully automated carts Yes Paper only Weekly Residents supply their own cans (max 77L) with a sticker supplied by the Town Yard waste only Paper only Food waste only Weekly 34L green bin Yes Compostable plastic and paper 5.3 Participation by the Industrial, Commercial and Institutional (ICI) Sector in Organic Waste Diversion Typically, organics collection programs for the ICI sector are operated by private hauling companies and are limited to food waste only. Depending on the quantity of food waste, generators use plastic garbage cans to collect food waste from kitchens while private haulers utilize plastic carts and metal bins to collect food waste outside of commercial establishments. Disposal bans on organic waste have driven strong participation in these collection programs in the Regional District of Nanaimo, Cowichan Valley Regional District, Capital Regional District and Metro Vancouver. Opportunities to drive ICI participation in organic waste diversion (once composting capacity is in place) are described below. Page 22 March 2017

166 TNRD SWMP Review Options for Waste Reduction and Diversion a) Support private collection through the application and enforcement of a disposal ban on organic waste. Once a local composting facility was established that could receive food waste, the Regional District of Nanaimo, to support their local privately built and operated composting facilities, banned ICI food waste from their landfill in 2005, which served as a key driver for the waste collection industry to provide organic waste collection service to businesses and institutions in the area. b) Establish a collection service for small ICI locations. In areas where residential curbside collection of organics is established, the same service can be offered to small ICI locations such as coffee shops, offices and churches. By allowing ICI locations to participate in a municipal collection services, the costs to have organics collection are likely to be more affordable and therefore encourage more small businesses to participate. c) Amend the City of Kamloops Bylaw 4059 to require that ICI generators of organic waste to have an organic waste collection service in place. The Resort Municipality of Whistler has a similar bylaw that requires all multifamily buildings and all commercial establishments to have both recycling and organic waste collection services. 5.4 Organic Waste Processing Options to divert organic waste (yard waste and food scraps) from the residential and ICI sectors are described above. The approaches, however, can only be accomplished if there is the capacity to process the collected materials. Decisions regarding the collection of organics from the residential and ICI sectors will impact the type and design capacity of any associated processing facility(ies), and vice versa. There are typically seven types of composting systems that utilize active aeration: aerated static pile, enclosed aerated static pile (tunnel), static containers, agitated containers, channel, agitated bed and rotating drum. There are many subtle variations in the design of composting systems, and system designers and vendors use these variations to provide a balance between processing control and capital costs (generally, the more control you want to have over processing, the greater the cost). The selection of processing technology will be largely affected by: Anticipated feedstocks; Amount and location of available land; Surrounding and uses available buffers; Budget; and Anticipated end markets for the compost product. Page 23 March 2017
 Establish a composting facility in the City of Kamloops that can manage food waste: Because of the potential for odours associated with food waste and the need to")
167 TNRD SWMP Review Options for Waste Reduction and Diversion Transfer and Processing Options a) Establish a composting facility in the City of Kamloops that can manage food waste: Because of the potential for odours associated with food waste and the need to achieve composting temperatures that will kill pathogens, food waste composting facilities tend to be higher tech than yard waste composting facilities. Midscale composting facilities for food waste typically operate at a cost of $120 $180 per tonne, compared to yard waste composting facilities that tend to operate at a cost of $30 $60 per tonne. o To improve the economy of scale, consider the cost benefits of developing a composting facility that can also handle biosolids o Assess opportunities for internal use of the end product (parks, roadways, landscaping, final cover at landfill, etc.) as well as the capacity of external markets (soil blenders, home gardeners) when developing operating cost estimates b) Consider establishing organic waste transfer at existing solid waste management facilities for communities that currently (or in the future) send their garbage to Kamloops for disposal. This was done by the Regional District of Nanaimo in response to the development of a composting facility. They redesigned their transfer station to accommodate delivery of food waste from municipal and commercial waste collection vehicles. In other areas (e.g. Cowichan Valley Regional District, District of Squamish and the Resort Municipality of Whistler), transfer stations and recycling depots have collection bins for dropoff of food waste by residents and small businesses. c) For other areas, assess the potential for establishing local composting facilities for yard waste, or commingled food and yard waste. Associated with this would be to undertake a needs assessment on a community by community basis. It is common for municipalities to collect yard waste and then static pile compost the material in their municipal works yard or park facilities (e.g. City of Terrace). In recent years, the Regional District of Kootenay Boundary has set up a small windrow composting facility (low tech) at their Grand Forks landfill for food waste and yard waste. Community composting sites are also used as small scale options for food waste diversion. In the City of Powell River, the local composting demonstration garden (pictured right) receives food scraps from residents and small businesses for composting in one of their many demonstration compost bins. The garden is also used to provide free workshops on the many options for home management of organic waste. Page 24 March 2017
168 TNRD SWMP Review Options for Waste Reduction and Diversion 6 Demolition, Renovation and Construction (DRC) Waste Diversion Opportunities DRC waste is typically 1525% of landfilled waste, often varying with the amount of economic activity in any given year. The TNRD defines DRC waste as any waste materials that was part of, or designed to be part of a house or building. Much of this waste is recyclable or could be used as a fuel, including cardboard, metal and wood, and therefore this waste stream can represent a significant waste diversion opportunity. 6.1 What is being done now regarding DRC waste diversion? Currently, TNRD operated waste management facilities use their tipping fee structure to encourage generators of construction and demolition waste to source separate the following materials for recycling or energy recovery: Structural wood (chipped and used as a fuel resource) Asphalt shingles (recycled) Metal (recycled) Cardboard Storage areas for these sourceseparated materials are available at TNRD s full scale Eco Depots. The City of Kamloops also use their tipping fee structure to encourage generators of construction and demolition waste to source separate asphalt shingles, metal and cardboard. One of the actions in the 2008 Solid Waste Management Plan that was not completed was a ban on the disposal of recyclable/recoverable (for energy) DRC waste as garbage. Although TNRD s Solid Waste Bylaw was updated in 2014 to ban the disposal of cardboard and scrap metal, this ban is not currently enforced. The City of Kamloops does not have disposal bans Outside the purview local government, the Habitat for Humanity ReStore in Kamloops receives new and used building materials donated by homeowners, contractors, retailers and manufacturers, and sells them to the public at low prices to fund building homes for local families in need. 6.2 What other options are available for DRC waste diversion? The following options could further reduce the amount of DRC waste disposed of in landfills. 1. Minimize wood waste in the landfill. Because wood waste in landfill contributes to leachate and gas generation and consumes landfill space, TNRD and City of Kamloops landfills should continue to pursue alternate uses for this material including using wood waste as a fuel source and as compost amendment. 2. Expand disposal bans to include clean wood waste and asphalt shingles, and implement enforcement procedures. Consult with local construction associations and waste haulers to develop a workable implementation timeframe and enforcement procedures. Page 25 March 2017

169 TNRD SWMP Review Options for Waste Reduction and Diversion 3. Enact and enforce similar bylaw requirements for all City of Kamloops landfills (where the majority of DRC waste is currently landfilled). 4. Require waste management plans for large construction, demolition and renovation projects. These plans would require contractors to preplan for how they will manage the wastes generated at the project site, and may require that specific materials are reused or recycled as a condition of building/demolition permits. Contractors must prepare a waste management plan and track materials throughout the project. An example of this approach is Port Moody, as described in the case study below. Case Study: Port Moody mandatory solid waste management plans Port Moody Waste Management Bylaw No.2822 regulates the amount of waste generated by new construction or demolition of structures sent to the landfill. A waste management plan is required for every building permit application. In addition to submitting a waste management plan in order to get a permit, contractors must pay a fee, like a deposit, that is refunded once the contractor has demonstrated that they implemented their plan. A Compliance Report must be submitted to the Building Official with attached receipts from recycling facilities and landfills indicating the amounts of each material recycled and disposed of. The following types of projects are exempt: Small renovations to Single Family Dwellings. Buildings under 50 square meters in area. Additions under 20 square meters in area. Buildings certified to LEED standard This bylaw was the basis for a model bylaw developed by Metro Vancouver that was subsequently adopted by other member municipalities. 5. Restructure permit fees to encourage house moving (reuse of full structure) and building deconstruction (to maximize the recovery of reusable and recyclable components) over demolition. This may also require a review of current building and development permit requirements to address any barriers to the reuse of houses and building deconstruction. 6. Establish DRC Recycling Facility at the City of Kamloops s DRC Waste Landfill. A facility to mechanically and manually sort mixed loads of DRC waste could be established at the Kamloops Resource Recovery Centre, the City s only dedicated landfill for DRC waste. The City has plans to divert all DRC waste generated within the City to the KRRC site which will be transformed over time into DRC materials recovery facility (MRF) where DRC waste can be sorted stockpiled and processed for recycling reuse. The Regional District of OkanaganSimilkameen has a recovery and recycling operation in place at their DRC landfill in Okanagan Falls; see the case study below for additional information. Page 26 March 2017
170 TNRD SWMP Review Options for Waste Reduction and Diversion Case Study: Regional District of OkanaganSimilkameen DRC Waste Recovery and Recycling: In the RDOS, they use tipping fees to encourage all loads of mixed DRC waste to be delivered to their DRC landfill in Okanagan Falls. All mixed loads must clear a hazardous materials assessment to be accepted. This ensures that the workers are safe. Assessed mixed loads are charged $200 per tonne. Unassessed loads, which must be landfilled directly, are charge $500 per tonne. (Unassessed loads showing up at other RDOS landfills are charged $700 per tonne.) The cleared loads are stored on site for subsequent sorting into recyclable and recoverable components (wood waste used as a fuel source). The sorting of the materials is contracted out. RDOS estimates that 50% or more of the materials are diverted to recycling and 20% are set aside to be used for cover material, with the remaining 30% landfilled onsite. Additionally, a social service organization works on the site to recover reusable materials from loads of DRC waste and uses the materials to manufacture salable goods (sheds, composters, etc.), although the amount managed in this manner is less than 1% of the material received at the site. 7. Set the tone for private sector DRC waste recycling capacity to be developed, which could include: Supporting policies (disposal restrictions, tipping fees, a bylaw requiring all DRC waste to go to a processor prior to disposal as residue) Provision of a put or pay contract (guaranteed provision of a certain amount of DRC waste to be delivered to the private processor) Collection (e.g. at major landfills and transfer sites) Establish waste stream management licensing to protect private sector investment 8. Provide a DRC waste management information, including information on recycling and reuse options, as well tipping fees and disposal bans, to all persons applying for a building permit. This same information could also be posted on the regional district and municipal websites and hard copies could be available at building material suppliers and hardware stores. Page 27 March 2017
171 TNRD SWMP Review Options for Waste Reduction and Diversion 7 Promotion, Education and Consultation The success of waste management programs and policies requires that people know and understand why and how to effectively participate. Promotion and education, therefore, are critical to all components of the solid waste management system, including those focused on waste reduction and diversion. In addition, introducing new services or changes to existing ones may also require a level of community consultation to ensure a smooth implementation. These three facets of solid waste communications can be described as follows: Promotion or outreach information intended to inform the target audiences about waste reduction in general. For example, where to buy EcoCards, waste collection days or transfer station hours. Education information, similar to promotion, with a more specific purpose such as a desired longterm behaviour change component. For example, increasing backyard composting, reducing the amount of contaminants in blue bag and reducing food wastage. Specific communication and consultation activities and campaigns linked to the launch of a new program or service. For example, the TNRD has undertaken community consultation when replacing older landfills with Eco Depots and soliciting feedback from residents on transfer station hours. Consultation is specific, purposedriven with goals that can include informing to soliciting feedback that will better inform the development and implementation of a specific initiative. While these three areas may overlap, each of these are integral to the maintenance of existing solid waste programs as well as the launch of new ones. As much of the intended changes in the solid waste plan require an increase in awareness, participation and ultimately behaviour changes, promotion, education and consultation are key drivers for success. 7.1 What does the RSWMP say for promotion, education and consultation? There are several specific actions identified in the current RSWMP. Guiding Principles: Commit to Education and social marketing [behaviour change] programs. Adoption of a Zero Waste philosophy. Implement criteria for new programs to ensure any program that is implemented will be technically sound, economical feasible and acceptable to the public. Policies: Policies recognize / identify the need for education and awareness to accompany implementation of new programs, such as disposal bans Phase 1 (Short Term) Recommended Programs included: Support the numerous initiatives in the current solid waste plan by establishing a Waste Reduction and Education Function in TNRD. Page 28 March 2017
172 TNRD SWMP Review Options for Waste Reduction and Diversion Develop educational activities that focus on promoting reuse, composting education and composter sales, schools, smart shopper and business waste reduction education programs and community clean up (illegal dumping) programs Provide ongoing print materials including a biannual newsletter, paid advertising, brochures and recycling directory Increase waste reduction presence with displays at community events. Increase in providing online access to information via the website including a reuse and recycling directory. 7.2 What is being done now regarding promotion and education? The TNRD established a fulltime position for waste reduction education at the outset of their current plan. This position was critical in supporting a range of programs, including the promotion and education regarding the new EcoCard programs, development, advertising and promotion of waste reduction materials, for residents, schools and businesses and attending community events. Also included was the intensive promotion, education and consultation required to implement the key projects in the current plan including expanding the transition of landfills to transfer stations and the introduction of attended transfer stations. However, over time, these waste reduction activities were scaled back to accommodate additional waste system administration duties that were assigned to the individual hired to undertake waste reduction. As a result, Waste Reduction represents only 10% of the job, curtailing the ability of staff to deliver the waste reduction education programs in the current plan. Current resources to deliver these programs include the 10% FTE supported by the Communications Coordinator for updating the website and posting to social media as well as providing information for the WildSafe (formerly Bear Aware) summer student coordinator and the Invasive Plant and Mosquito contractors to share at their events and outreach activities. The TNRD also works collaboratively with the City of Kamloops staff to coordinate and leverage resources for some joint activities such as composter sales and household hazardous waste events. Despite the reduced capacity of staff to undertake direct education activities, TNRD does have waste reduction information available and undertakes a variety of promotion and education initiatives, primarily in response to requests. These include: o waste management information on their website, including a comprehensive online Recycling and Disposal Directory that offers detailed information on hours, tip fees and payment choices, composting and illegal dumping, as well as recycling and disposal options across the region. The website also hosts an online plugin that residents can sign up for to provide push notifications for waste collection events. In February, there were 602 users and more than 10,000 interactions. o waste reduction activities are promoted using news releases hosted on the website home page and on the TNRD s Facebook and Twitter pages o hard copies of the Recycling and Disposal Directory are provided at all TNRD sites, member municipalities, participating First Nations and TNRD libraries. o Posters for specific events, such as a composting workshop are also posted on the TNRD Facebook page, printed and posted locally and at EcoCard retailers where appropriate o Reuse Guide (underway) Page 29 March 2017
173 TNRD SWMP Review Options for Waste Reduction and Diversion o Regularly scheduled interviewstyle advertising on the radio, as well as advertising in the local newspapers and responds to media requests o Participate in community events by request only and based on availability of staff (down to six in 2016) o An illegal dumping, Community Clean Up advertising campaign in 2014 o Backyard composting workshops and include worm composting education o Promotes annual Household Hazardous Waste collection events, collaborating with the City of Kamloops o Developed a school curriculum in 2010 yet unable to promote and deliver o Limited waste reduction educationfocused events such as holiday disposal guide o Supports the promotion, education and necessary consultation for the operations of the EcoDepots, Residential Services Sites and the EcoCard program. All of the municipalities provide information to residents and businesses regarding their waste management services as applicable. 7.3 What other options are available for promotion and education? In addition to the waste reduction education activities already underway in the TNRD and its member municipalities, the following offers some strategic options for consideration. 1. Increase promotion and education programming for the residential sector, including staffing to support these programs. Residential waste accounts for almost 30% of the waste in TNRD landfills. This represents a significant opportunity to expand waste reduction promotion and education to increase participation and reduce contamination. This would include education programs to support recommended diversion strategies such as increasing backyard composting by hosting workshops and continuing to see backyard composters and / or outreach to the commercial sector to engage with haulers, contractors and businesses. To do this, as well as the key strategic options described below would require resources to develop and implement promotion and education activities that are not currently available. At a minimum, one fulltime position is recommended to maintain, implement and monitor waste related promotion and education programming. 2. Leverage collaboration and coordination with member municipalities and First Nations. Working collaboratively with other key stakeholders provides the opportunity to benefit from economies of scale and better leveraging of public dollars. It can support municipalities and First Nations without dedicated solid waste or communications staff, and provide a more consistent message and brand identity for use by all parties. Increasing this collaboration can also help with communication and program delivery by taking advantage the closer relationships that may be had at the local level between municipalities/first Nations and their constituents. 3. Annually develop a planning calendar to identify the promotion, education and any necessary consultation for waste management initiatives. The planning calendar would be used to identify key initiatives and promotional opportunities and proactively plan for implementation of waste Page 30 March 2017
174 TNRD SWMP Review Options for Waste Reduction and Diversion reductions initiatives. It would align the local promotions to provincewide campaigns, such as Waste Reduction Month. It would identify opportunities for shared messaging with member municipalities, particularly in shared media markets. It would also identify opportunities for crosspromotion, coordination and / or collaboration with interested member municipalities and First Nations. This could include timing of common initiatives such as advertising and promotion of disposal bans, composter sales and workshops, household hazardous waste events, business initiatives, school programs or sharing relevant waste reduction information and materials. For example, the Squamish Lillooet Regional District uses a planning calendar to map their major initiatives, as well as the tasks that need to be completed, as well as works with interested member municipalities and local First Nations in the development of the calendar. 4. Develop communication plans to optimize resources. Developing simple communication plans for major new initiatives will ensure best use of resources, coordination of implementation and improve opportunities to identify and manage issues. A simple planning template can be used to identify purpose, objectives, audience, message, tactics for delivery such as increasing the social media presence, use of video and leveraging media coverage. The plan can also be used to identify what tools can be applied to influence behaviour change. It can also be used to further identify the necessary resources to implement specific campaigns and opportunities for cross promotion, collaboration and consistent messaging with member municipalities such as the City of Kamloops and their WildSafe and EcoSmart teams. 5. Maximize the use of electronic notification apps such as the MyWaste app or plugin on the TNRD website, to send waste management related information directly to residents via or text. The MyWaste app has proven its effectiveness in reaching individual residents with important and relevant waste management information on their waste management services. These type of apps, such as MyWaste or Recollect, provide information such as waste and recycling collection reminders, advisories on service delays (due to weather, traffic delays, etc.), transfer station hours, and event information directly to an individual s smart phone or tablet. Maximizing the promotion of the plugin (access via the TNRD website as is currently done) and /or a specific branded app will help to achieve the goal to ensure residents and businesses have greater access to relevant information at their finger tips. According to a recent report by the Canadian Radiotelevision and Telecommunications Commission (CRTC), two thirds of Canadians own a smartphone and almost half own a tablet computer. And access to cellular coverage and higher speed internet is also growing. Page 31 March 2017

175 TNRD SWMP Review Options for Waste Reduction and Diversion Case Study: RDCO My Waste App: Currently the Regional District of Central Okanagan boasts 8,202 users who receive relevant information pushed directly to their mobile device or . This includes reminders for ongoing services like waste, recycling and yard waste collection weeks as well as special events such as composter sale, repair cafes and trunk (reuse) sale. It is also used to report illegal dumping. In the past month, there were 26,000 interactions via the app including approximately 4,000 website page visits. 6. Apply community based social marketing as a method to develop new and / or build on existing waste reduction and diversion programs and campaigns. Communitybased social marketing (CBSM) is an approach to program promotion and education that encourages high rates of effective participation and longterm behavior change. The communitybased social marketing process centres on uncovering barriers that inhibit individuals from engaging in sustainable behaviours, identifying tools that have been effective in fostering and maintaining behaviour change, then piloting takes place on a small portion of the community followed by ongoing evaluation once the program has been implemented communitywide. Therefore, as new behaviours are identified as desirable to achieve waste reduction objectives, CBSM should be employed and should include: o Identification of existing barriers to desired behaviours o Research on successful approaches in other jurisdictions o Undertake pilot projects to confirm that a selected approach will be effective in the TNRD o Monitor and measure to confirm that objectives are being met. This approach can be applied to campaigns for general waste reduction education including increasing recycling rates and reducing illegal dumping, to help achieve longerterm behaviour changes. 7. Establish a Zero Waste Education Program for Schools. This would include being proactive in providing waste reduction information for teachers, information about ongoing initiatives in the community and awareness of waste management practices. It would include actively promoting the availability of the materials, delivering presentations and support for teachers and school administration. Targeting students can influence longerterm effectiveness as students bring home new ideas and practices that can impact others in the household. For example, Regional District s such as the Fraser Fort George Regional District, Regional District of Nanaimo and the Powell River Regional District contract with individuals or nonprofit organizations to provide teachers with curriculumbased materials and to deliver classroom presentations on zero waste, recycling, composting, hazardous wastes and more. Page 32 March 2017
176 TNRD SWMP Review Options for Waste Reduction and Diversion 8 Waste Reduction and Diversion Potential Taking advantage of the key opportunities described in this report has the potential to reduce the amount of waste disposed. Table 81 lists the materials that would most likely be affected by the diversion and reduction activities described and the respective amount of each material in the waste currently landfilled in the TNRD. Waste Category Table 81: Target Waste Materials Proportion of waste landfilled Estimated Tonnes Disposed Current Disposal Rate kg/cap/year Organics 26.3% 21, Wood 17.7% 14, DLC 11.7% 9, Paper Products 7.6% 6, Paper Packaging 7.1% 5, Plastic Packaging 7.0% 5, Metals 4.0% 3, TOTAL 81.4% 65, Table 82 uses the data from Table 81 to estimate the impact of the key opportunities on the amount of waste disposed per capita under 3 scenarios: low, medium and high diversion. The amount of anticipated diversion is largely affected by the extent of diversion activities implemented, but can also be affected by market variability for recycled/recovered materials. Accordingly, there is the potential to reduce the amount of waste sent to landfill from the 2015 rate of 596 kg per capita to between 256 and 450 kg per capita. Table 82: Estimated Diversion Potential Diversion Potential Diversion Potential Diversion Potential Low Estimate Med. Estimate High Estimate 2015 disposal rate (kg per capita) Estimated kg diverted per capita Estimated future disposal rate Page 33 March 2017

177 April 7 th, 2017 PRJ Thompson Nicola Regional District Victoria St. Kamloops, B.C. V2C 2A9 Attn: Jamie Vieira Residual Waste Management TNRD Landfill Economic Analysis SUMMARY An economic review of five Landfills in the TNRD was conducted to explore five scenarios for the future operation of the landfills; (1) Current system of landfilling waste at Heffley Creek, Lower Nicola, Kamloops Resource Recovery Centre (KRRC), Mission Flats, and Barnhartvale, (2) cease all landfill operations at Barnhartvale, (3) cease all landfill operations at Barnhartvale and Heffley Creek, (4) convert Heffley Creek to Demolition, Land clearing, and Construction waste (DLC)only landfill, (5) cease landfill operations at Barnhartvale and convert Heffley Creek to DLConly landfill. Annual costs over a tenyear period were used to evaluate each scenario. Customer service impacts were also considered. A review of other waste management options such as waste to energy was conducted. It was concluded that Scenario #5 (cease landfill operations at Barnhartvale and convert Heffley to DLC only landfill) is the most economical scenario. Further research and consultation with stakeholders should take place before any changes are implemented. In the future, the feasibility of converting the Tk emlups Landfill into a transfer station should be assessed. SHA and the TNRD reached out to the Tk emlups Indian Band and reviewed with them the current SWMP update process, but they are not ready at this time to undertake an assessment of their facility. 1. BACKGROUND Currently, the TNRD has ample landfill capacity between the six active landfills in the region. Of these landfills, the TNRD operates two sites, the City of Kamloops operates three sites, and the Tk emlups First Nation operate the sixth facility: 1. Heffley Creek TNRD 2. Lower Nicola TNRD 3. Mission Flats City of Kamloops 4. Kamloops Resource Recovery Centre City of Kamloops 5. Barnhartvale City of Kamloops 6. Tk emlups Tk emlups First Nation The TNRD could benefit from consolidation of landfills as a way to streamline operations and take advantage of economies of scale.
178 SPERLING HANSEN ASSOCIATES Page 2 Thompson Nicola Regional District April 7 th, 2017 Currently, the Heffley Creek Landfill receives both household and DLC waste from all TNRD transfer stations and EcoDepots in the north Thompson and eastern TNRD region. The Lower Nicola Landfill site serves the City of Merritt and surrounding rural areas and accepts refuse from the TNRD transfer stations in Aspen Grove, Brookemere, Logan Lake, Upper Nicola and surrounding First Nation communities. The Mission Flats Landfill is located in the City of Kamloops and receives the majority of curbside and commercial waste generated in the City of Kamloops as well as garbage from curbside pickup programs in Tobiano and Cherry Creek. Mission Flats receives the largest annual amount of waste in the TNRD by far. The Kamloops Resource Recovery Centre (formerly Owl Road Landfill) is located within the City of Kamloops and is designated as a DLConly landfill, although historically the facility also received a substantial amount of commercial waste. The Barnhartvale Landfill is situated between the communities of Dallas and Barnhartvale and operates as a selfhaul landfill for residents of the area. The 2016 annual tonnage, remaining airspace, and estimated lifespan for the above landfills is presented in Table 1 below. Table 1 Annual Tonnage and Lifespan Remaining Landfill Annual Tonnage Remaining Airspace (m 3 ) Lifespan (years) Heffley Creek 9,061 1,512, Lower Nicola 6,503 1,337, KRRC (Owl Road) 6, , Mission Flats 50,023 2,317, Barnhartvale 2,337 86, Tk'emlups N/A N/A N/A Due to the small amount of waste received directly from customers and the sufficient capacity available at other landfills in the Kamloops area, an evaluation of the viability of the Barnhartvale landfill was conducted. Similarly, an evaluation of the viability of the Heffley Creek landfill as a either a DLConly or closed landfill was conducted and summarized in this report. Five scenarios were considered for this analysis: 1) Current system All landfills remain open with waste continuing to be landfilled at Heffley Creek, Lower Nicola, Mission Flats, KRRC, and Barnhartvale. 2) Barnhartvale cease all landfill operations Final closure of the Barnhartvale landfill with all household waste from the site diverted by selfhaul to Mission Flats Landfill and all green waste/yard waste diverted by selfhaul to the Blackwell Dairy Landfill.
179 SPERLING HANSEN ASSOCIATES Page 3 Thompson Nicola Regional District April 7 th, ) Barnhartvale and Heffley Creek cease all landfill operations Final closure of the Barnhartvale landfill with all household waste from the site diverted by selfhaul to Mission Flats Landfill and all green waste/yard waste diverted by selfhaul to the Blackwell Dairy Landfill. Final closure of the Heffley Creek landfill with all household garbage from north and east TNRD facilities hauled to Mission Flats Landfill and all DLC waste to KRRC. 4) Heffley Creek DLC landfill only operate the Heffley Creek Landfill as DLC only and haul all household garbage from north and east TNRD facilities to Mission Flats Landfill. 5) Barnhartvale cease all landfill operations and Heffley Creek become a DLC landfill only Final closure of the Barnhartvale landfill with all household waste from the site diverted by selfhaul to Mission Flats Landfill and all green waste/yard waste diverted by selfhaul to the Blackwell Dairy Landfill. Operate the Heffley Creek Landfill as DLC only and haul all household garbage from north and east TNRD facilities to Mission Flats Landfill. 2. DISCUSSION Sperling Hansen Associates (SHA) conducted a costing review of the Heffley Creek, Lower Nicola, Mission Flats, KRRC, and Barnhartvale landfills including all operational considerations of the five scenarios. Much of the data used in this report was provided by TNRD and City of Kamloops staff. Otherwise, assumptions were made based on data derived from SHA s Heffley Creek and Lower Nicola 2016 Costing Review and SHA s Design & Operations Plan for Mission Flats Landfill (2007). Annual Landfill Costs Annual costs were evaluated for all five scenarios for a tenyear period from 2018 to This includes Landfill Operations, Capital Works, Closure, and PostClosure Costs. Landfill. Operations looks at the associated costs of operating the landfills under the different scenarios. This includes contractor costs, engineering, maintenance work, and monitoring costs. Closure looks at the costs associated with closing a landfill including the final cover system and landfill gas system. PostClosure looks at the associated costs a landfill incurs after final closure is complete, including environmental controls, maintenance, monitoring and reporting, and administration. Hauling costs were excluded from this analysis as the hauling costs from North Thompson and South Thompson to Kamloops versus Heffley Creek are very similar distances. Capital costs at the Barnhartvale landfill have been considered minimal in recent years and therefore are not shown. The annual operations, capital, closure and postclosure costs for each landfill are presented in Table 2 below.
180 SPERLING HANSEN ASSOCIATES Page 4 Thompson Nicola Regional District April 7 th, 2017 Landfill Annual Operations Cost Table 2 Annual Landfill Costs Operations Cost ($/tonne) Annual Capital Cost Capital Cost ($/tonne) Total Closure Cost Closure Cost ($/tonne) Annual Post Closure Cost Heffley Creek $ 901,526 $ 99.5 $ 26,420 $ 2.9 $ 3,139,914 $ 2.2 $ 91,140 Lower Nicola $ 855,606 $ $ 14,456 $ 2.2 $ 4,683,340 $ 3.8 $ 98,066 KRRC (Owl Road) $ 839,695 $ $ 63,000 $ 10.0 $ 4,050,000 $ 12.8 $ 66,500 Mission Flats $ 1,284,424 $ 25.7 $ 710,327 $ 14.2 $ 20,310,000 $ 11.8 $ 220,000 Barnhartvale $ 198,341 $ 84.9 $ $ $ 1,350,000 $ 15.3 $ 14,000 For the five different scenarios, annual costs were evaluated across a 10 year period. Tables 3a to 3e at the end of this report show the annual costs for each landfill from 2018 to 2028 for every scenario. In order to assess the scenarios to determine the most economical option, costs incurred over 10 years were summed and compared for every landfill and scenario. Table 4 below presents a summary of the cumulative 10year costs incurred by each landfill for all five scenarios. Table 4 Cumulative costs for a 10year period from 2018 to 2028 Heffley Creek Lower Nicola KRRC Mission Flats Barnhartvale TNRD System 10 Year Cost 10 Year Cost 10 Year Cost 10 Year Cost 10 Year Cost 10 year Cost Scenario 1 All Landfills Open $ 10,207,415 $ 9,570,691 $ 9,929,645 $ 21,942,257 $ 2,181,751 $ 53,831,758 Scenario 2 Close Barnhartvale $ 10,207,415 $ 9,570,691 $ 9,929,645 $ 22,454,811 $ 1,490,000 $ 53,652,562 Scenario 3 Close Barnhartvale and Heffley Creek $ 4,051,314 $ 9,570,691 $ 12,919,238 $ 25,594,704 $ 1,490,000 $ 53,625,947 Scenario 4 Heffley Creek becomes a DLC only Landfill $ 2,143,557 $ 9,570,691 $ 9,929,645 $ 25,082,149 $ 2,181,751 $ 48,907,793 Scenario 5 Close Barnhartvale and Heffley Creek becomes a DLConly landfill $ 2,143,557 $ 9,570,691 $ 9,929,645 $ 25,082,149 $ 1,490,000 $ 48,216,042 As seen in Table 4, TNRD system costs in scenario 1 are the highest of the five scenarios. Scenario 2 sees cost savings of close to one million dollars across the entire system compared to Scenario 1. Costs for Scenario 3 are only slightly lower than Scenario 2. Converting Heffley Creek into a DLConly landfill in Scenario 4 sees cost savings close to five million dollars compared to the current scenario. Scenario 5 sees the highest cost savings of 5.6 million dollars for the entire TNRD system compared to the current scenario.
181 SPERLING HANSEN ASSOCIATES Page 5 Thompson Nicola Regional District April 7 th, 2017 It is evident that Scenario 5, closing Barnhartvale and operating Heffley Creek as a DLConly landfill, is the most economical option for the City of Kamloops and the TNRD. This is mainly due to the fact that Barnhartvale and Heffley Creek have high operating costs per tonne compared to Mission Flats. By diverting household garbage from these sites to Mission Flats, cost savings can be realized by taking advantage of Mission Flat s low operating costs per tonne thanks to economies of scale. While this scenario is the most economical for the entire TNRD system, one must consider the fees the TNRD would incur by paying tipping fees for garbage disposed of at Mission Flats. If the TNRD were to pay the posted tipping fee of $80 per tonne for Scenario 5, total annual tipping fees would be $572,655, which is equal to $5.7 million over a 10year period. Even with tipping fees included in Scenario 5, the TNRD sees 10year cost savings of $2.3 million dollars compared to the current scenario. The estimated 10year net revenue for the City of Kamloops based on this scenario is 3.2 million dollars. Evidently, this scenario is beneficial for both parties, as the City of Kamloops will have increased tipping fee revenues and the TNRD achieves significant cost savings in their residual waste management system. Furthermore, the City of Kamloops could see future reduced operating costs due to increased economies of scale. Customer Service Considerations Ceasing all operations at Barnhartvale would result in possible upset for the Barnhartvale and Dallas communities. It is likely that complaints would come from residents arguing that they have to drive further to dispose of waste however there are many potential disposal facilities available such as Blackwell Dairy, Kamloops Resource Recover Centre, the South Thompson EcoDepot or Mission Flats. Barnhartvale currently receives curbside garbage collection service and therefore, complaints would come mostly from selfhauler residential customers. Converting Heffley Creek to a DLConly landfill would not be noticed by the majority of customers. The Heffley Creek EcoDepot receives household waste, the majority of which is from selfhauler residential customers from the Heffley Creek, Vinsula, and Raleigh areas. These customers already dump into the bins at the EcoDepot and do not enter the landfill. This would be easily managed with the bin capacity at the current site. The amount of household garbage received at Heffley Creek is comparable to the amount received at the Sun Peaks transfer station which has only 3 roll off bins, the Heffley Creek EcoDepot has capacity for 7 bins. The Heffley EcoDepot is also designed to accommodate selfdumping trailers and small dump boxes. The only loads diverted to Mission Flats would be large garbage compactors of household waste. The Sun Peaks Grand hotel is the only customer with this type of bin which we could not accommodate currently at the EcoDepot. There are a few other commercial customers who currently dump at the active landfill face who might complain of slower unloading time at the Ecodepot, however staff are confident that the TNRD could accept their material at the EcoDepot without issue. At present time, Heffley occasionally receives insurance claim loads of spoiled product from transport truck accidents (brought in by tow truck companies). These loads would likely also need to be diverted to Kamloops facilities.
182 SPERLING HANSEN ASSOCIATES Page 6 Thompson Nicola Regional District April 7 th, 2017 The Cache Creek Factor So far this review only considered the Mission Flats Landfill as an alternative to Heffley Creek and Barnhartvale. However, the MOE issued an operational certificate for the Cache Creek Landfill Extension on December 15 th 2016 and when the landfill opens it will provide another option for TNRD waste. Hauling costs from all north and eastern TNRD sites to Cache Creek would be considerably higher than hauling to Mission Flats. However, it should be noted the historic tipping fee the TNRD paid Wastech under the comprehensive agreement was $40/tonne half of the TNRD and City of Kamloops fees. The low tipping fee was realized because the Cache Creek Landfill experienced large economies of scale by codisposing the TNRD waste with several hundred thousand tonnes of MSW from Metro Vancouver. Once the extension opens, Belkorp may be open to a reduced fee for TNRD waste but the discount will depend on the global tonnage of MSW that Belkorp will be able to secure from Metro Vancouver or other regional districts. Due to major expansion in organics waste diversion and stewardship diversion programs, there is adequate capacity in the Metro Vancouver system without waste export. Construction of the Cache Creek Landfill Extension is anticipated to begin in spring 2017 and if that is the case, the extension could be open by Since details regarding the landfill s opening date and client(s) are still unclear, sufficient data to conduct an assessment of this option was not available. Waste to Energy Three alternate energy production technologies, namely pyrolysis, gasification, and anaerobic digestion, can be used to deal with residual waste. Anaerobic digestion is the biological conversion of refuse using heat and bugs in a controlled atmosphere (similar to the digestion of sewage sludge at a waste water treatment plant). Pyrolysis and gasification, similar to incineration, are thermal conversion processes (i.e. heat is used to convert solids to gases); however, the main difference between these thermal technologies is the amount of oxygen present when the refuse is converted. With pyrolysis, there is a total lack of oxygen, whereas with gasification, an oxygen starved rather than an oxygen void atmosphere is maintained. Both technologies produce syngas, which is usually used for electrical power generation or for onsite heat generation. When considering waste to energy technologies, an accurate cost estimate for this system must be compared to the current costs of solid waste management. This mainly includes capital and operating costs of the technology. Generally, capital costs for gasification and pyrolysis technologies are quite high and usually some sort of preprocessing of solid waste is required before it can be fed into the system. Other things to consider are the characteristics of the feedstock and air quality emissions. Generally, the high capital costs and feedstock preprocessing required make the technology considerably more expensive than those of landfilling, especially at the relatively small scale of the TNRD/Kamloops system. Therefore, in order for a waste to energy facility to be viable, the revenue generated from energy sales derived from the process must be sufficient to finance the operations. If waste to energy as a residual waste


183 SPERLING HANSEN ASSOCIATES Page 7 Thompson Nicola Regional District April 7 th, 2017 management option is to be considered, a thorough review of site specific technologies for the TNRD would have to be performed. 3. CONCLUSION Based on the data, it is evident Scenario #1, the current system of operating the TNRD landfills for all waste types, is the most costly option for the TNRD. The current landfill operations contract expires September 2017 and as the TNRD undertakes the Solid Waste Management Plan Review, this is an excellent opportunity to consider changes in how the TNRD Landfills operate. Scenario #5 of closing Barnhartvale and operating Heffley as a DLC only landfill has three clear advantages: 1. Lowest cost The 10year costs of scenario #5 are estimated at 5.6 million dollars less than the current scenario. 2. Maintain current level of service Operating a DLC only landfill at Heffley Creek will have a very minimal impact to the service currently provided to TNRD residents and businesses. The vast majority of customers to the Heffley Creek Ecodepot will likely not even notice the change if household garbage is trucked off site. 3. Potential for revenue generation The City of Kamloops would see increased revenue at Mission Flats landfill and future improvements to the economy of scale. However, further research and consultation with stakeholders will need to be conducted before Scenario 5 could be implemented. Stakeholder consultation could include further discussions with the City of Kamloops as well as Belkorp Environmental Services regarding tipping fees and operational considerations. Staff should also discuss potential impacts with large commercial garbage customers such as the Sun Peaks Grand Hotel. Lastly, a feasibility study of converting the Tk emlups (Mount Paul) Landfill to an EcoDepot style transfer station should be undertaken. Sincerely, SPERLING HANSEN ASSOCIATES Report Prepared By: Report Reviewed by: TS Carly Wolfe, E.I.T. Bioresource Engineer April 7, 2017 Dr. Tony Sperling, P.Eng. SHA President
184 Table 3a Scenario 1 Current Scenario: All Landfills Open Heffley Creek Lower Nicola KRRC (Owl Road) Mission Flats Barnhartvale Tonnage 9,061 9,061 9,061 9,061 9,061 9,061 9,061 9,061 9,061 9,061 9,061 Operations $ 901,526 $ 901,526 $ 901,526 $ 901,526 $ 901,526 $ 901,526 $ 901,526 $ 901,526 $ 901,526 $ 901,526 $ 901,526 Capital $ 26,420 $ 26,420 $ 26,420 $ 26,420 $ 26,420 $ 26,420 $ 26,420 $ 26,420 $ 26,420 $ 26,420 $ 26,420 Closure $ $ $ $ $ $ $ $ $ $ $ Post Closure $ $ $ $ $ $ $ $ $ $ $ Tonnage 6,503 6,503 6,503 6,503 6,503 6,503 6,503 6,503 6,503 6,503 6,503 Operations $ 855,606 $ 855,606 $ 855,606 $ 855,606 $ 855,606 $ 855,606 $ 855,606 $ 855,606 $ 855,606 $ 855,606 $ 855,606 Capital $ 14,456 $ 14,456 $ 14,456 $ 14,456 $ 14,456 $ 14,456 $ 14,456 $ 14,456 $ 14,456 $ 14,456 $ 14,456 Closure $ $ $ $ $ $ $ $ $ $ $ Post Closure $ $ $ $ $ $ $ $ $ $ $ Tonnage 6,320 6,320 6,320 6,320 6,320 6,320 6,320 6,320 6,320 6,320 6,320 Operations $ 839, $ 839,695 $ 839,695 $ 839,695 $ 839,695 $ 839,695 $ 839,695 $ 839,695 $ 839,695 $ 839,695 $ 839,695 Capital $ 63, $ 63,000 $ 63,000 $ 63,000 $ 63,000 $ 63,000 $ 63,000 $ 63,000 $ 63,000 $ 63,000 $ 63,000 Closure $ $ $ $ $ $ $ $ $ $ $ Post Closure $ $ $ $ $ $ $ $ $ $ $ Tonnage 50,023 50,023 50,023 50,023 50,023 50,023 50,023 50,023 50,023 50,023 50,023 Operations $ 1,284,424 $ 1,284,424 $ 1,284,424 $ 1,284,424 $ 1,284,424 1,284,424 $ 1,284,424 $ 1,284,424 $ 1,284,424 $ 1,284,424 $ 1,284,424 Capital $ 710,327 $ 710,327 $ 710,327 $ 710,327 $ 710, ,327 $ 710,327 $ 710,327 $ 710,327 $ 710,327 $ 710,327 Closure $ $ $ $ $ 0 $ $ $ $ $ Post Closure $ $ $ $ $ 0 $ $ $ $ $ Tonnage 2,337 2,337 2,337 2,337 2,337 2,337 2,337 2,337 2,337 2,337 2,337 Operations $ 198, ,341 $ 198,341 $ 198,341 $ 198,341 $ 198,341 $ 198,341 $ 198,341 $ 198,341 $ 198,341 $ 198,341 Capital $ $ $ $ $ $ $ $ $ $ $ Closure $ $ $ $ $ $ $ $ $ $ $ Post Closure $ $ $ $ $ $ $ $ $ $ $ 10Year Costs TNRD Costs $ 19,778,106 City of Kamloops Costs $ 34,053,653 Total System Costs $ 53,831,758 Tipping Fees Annual Tonnage transferred to City of Kamloops 0 Annual TNRD tipping fees paid to City of 80$/tonne $ 10Year Costs including Tipping Fees TNRD Costs $ 19,778,106 City of Kamloops Costs (including tipping fees revenue) $ 34,053,653
185 Table 3b Scenario 2 Close Barnhartvale Heffley Creek Lower Nicola KRRC (Owl Road) Mission Flats Barnhartvale Tonnage 9,061 9,061 9,061 9,061 9,061 9,061 9,061 9,061 9,061 9,061 9,061 Operations $ 901,526 $ 901,526 $ 901,526 $ 901,526 $ 901,526 $ 901,526 $ 901,526 $ 901,526 $ 901,526 $ 901,526 $ 901,526 Capital $ 26,420 $ 26,420 $ 26,420 $ 26,420 $ 26,420 $ 26,420 $ 26,420 $ 26,420 $ 26,420 $ 26,420 $ 26,420 Closure $ $ $ $ $ $ $ $ $ $ $ Post Closure $ $ $ $ $ $ $ $ $ $ $ Tonnage 6,503 6,503 6,503 6,503 6,503 6,503 6,503 6,503 6,503 6,503 6,503 Operations $ 855,606 $ 855,606 $ 855,606 $ 855,606 $ 855,606 $ 855,606 $ 855,606 $ 855,606 $ 855,606 $ 855,606 $ 855,606 Capital $ 14,456 $ 14,456 $ 14,456 $ 14,456 $ 14,456 $ 14,456 $ 14,456 $ 14,456 $ 14,456 $ 14,456 $ 14,456 Closure $ $ $ $ $ $ $ $ $ $ $ Post Closure $ $ $ $ $ $ $ $ $ $ $ Tonnage 6,320 6,320 6,320 6,320 6,320 6,320 6,320 6,320 6,320 6,320 6,320 Operations $ 839, $ 839,695 $ 839,695 $ 839,695 $ 839,695 $ 839,695 $ 839,695 $ 839,695 $ 839,695 $ 839,695 $ 839,695 Capital $ 63, $ 63,000 $ 63,000 $ 63,000 $ 63,000 $ 63,000 $ 63,000 $ 63,000 $ 63,000 $ 63,000 $ 63,000 Closure $ $ $ $ $ $ $ $ $ $ $ Post Closure $ $ $ $ $ $ $ $ $ $ $ Tonnage 51,192 51,192 51,192 51,192 51,192 51,192 51,192 51,192 51,192 51,192 51,192 Operations $ 1,314,427 $ 1,314,427 $ 1,314,427 $ 1,314,427 $ 1,314,427 1,314,427 $ 1,314,427 $ 1,314,427 $ 1,314,427 $ 1,314,427 $ 1,314,427 Capital $ 726,919 $ 726,919 $ 726,919 $ 726,919 $ 726, ,919 $ 726,919 $ 726,919 $ 726,919 $ 726,919 $ 726,919 Closure $ $ $ $ $ 0 $ $ $ $ $ Post Closure $ $ $ $ $ 0 $ $ $ $ $ Tonnage Operations $ $ $ $ $ $ $ Capital $ $ $ $ $ $ $ $ $ $ $ Closure $ 1,350,000 $ $ $ $ $ $ $ $ $ $ Post Closure $ $ 14,000 $ 14,000 $ 14,000 $ 14,000 $ 14,000 $ 14,000 $ 14,000 $ 14,000 $ 14,000 $ 14,000 10Year Costs TNRD Costs $ 19,778,106 City of Kamloops Costs $ 33,874,456 Total System Costs $ 53,652,562 Tipping Fees Annual Tonnage transferred to City of Kamloops 0 Annual TNRD tipping fees paid to City of 80$/tonne $ 10Year Costs including Tipping Fees TNRD Costs $ 19,778,106 City of Kamloops Costs (including tipping fees revenue) $ 33,874,456
186 Table 3c Scenario 3 Close Barnhartvale and Heffley Creek Heffley Creek Lower Nicola KRRC (Owl Road) Mission Flats Barnhartvale Tonnage Operations $ $ $ $ $ $ $ $ $ $ $ Capital $ $ $ $ $ $ $ $ $ $ $ Closure $ 3,139,914 $ $ $ $ $ $ $ $ $ $ Post Closure $ $ 91,140 $ 91,140 $ 91,140 $ 91,140 $ 91,140 $ 91,140 $ 91,140 $ 91,140 $ 91,140 $ 91,140 Tonnage 6,503 6,503 6,503 6,503 6,503 6,503 6,503 6,503 6,503 6,503 6,503 Operations $ 855,606 $ 855,606 $ 855,606 $ 855,606 $ 855,606 $ 855,606 $ 855,606 $ 855,606 $ 855,606 $ 855,606 $ 855,606 Capital $ 14,456 $ 14,456 $ 14,456 $ 14,456 $ 14,456 $ 14,456 $ 14,456 $ 14,456 $ 14,456 $ 14,456 $ 14,456 Closure $ $ $ $ $ $ $ $ $ $ $ Post Closure $ $ $ $ $ $ $ $ $ $ $ Tonnage 8,223 8,223 8,223 8,223 8,223 8,223 8,223 8,223 8,223 8,223 8,223 Operations $ 1,092, $ 1,092,508 $ 1,092,508 $ 1,092,508 $ 1,092,508 $ 1,092,508 $ 1,092,508 $ 1,092,508 $ 1,092,508 $ 1,092,508 $ 1,092,508 Capital $ 81, $ 81,968 $ 81,968 $ 81,968 $ 81,968 $ 81,968 $ 81,968 $ 81,968 $ 81,968 $ 81,968 $ 81,968 Closure $ $ $ $ $ $ $ $ $ $ $ Post Closure $ $ $ $ $ $ $ $ $ $ $ Tonnage 58,350 58,350 58,350 58,350 58,350 58,350 58,350 58,350 58,350 58,350 58,350 Operations $ 1,498,226 $ 1,498,226 $ 1,498,226 $ 1,498,226 $ 1,498,226 1,498,226 $ 1,498,226 $ 1,498,226 $ 1,498,226 $ 1,498,226 $ 1,498,226 Capital $ 828,566 $ 828,566 $ 828,566 $ 828,566 $ 828, ,566 $ 828,566 $ 828,566 $ 828,566 $ 828,566 $ 828,566 Closure $ $ $ $ $ 0 $ $ $ $ $ Post Closure $ $ $ $ $ 0 $ $ $ $ $ Tonnage Operations $ $ $ $ $ $ $ $ $ $ Capital $ $ $ $ $ $ $ $ $ $ $ Closure $ 1,350,000 $ $ $ $ $ $ $ $ $ $ Post Closure $ $ 14,000 $ 14,000 $ 14,000 $ 14,000 $ 14,000 $ 14,000 $ 14,000 $ 14,000 $ 14,000 $ 14,000 10Year Costs TNRD Costs $ 13,622,005 City of Kamloops Costs $ 40,003,942 Total System Costs $ 53,625,947 Tipping Fees Annual Tonnage transferred to City of Kamloops 9,061 Annual TNRD tipping fees paid to City of 80$/tonne $ 724,880 10Year Costs including Tipping Fees TNRD Costs $ 20,870, City of Kamloops Costs (including tipping fees revenue) $ 32,755,141.85
187 Table 3d Scenario 4 Heffley Creek becomes a DLConly Landfill Heffley Creek Lower Nicola KRRC (Owl Road) Mission Flats Barnhartvale Tonnage 1,903 1,903 1,903 1,903 1,903 1,903 1,903 1,903 1,903 1,903 1,903 Operations $ 189,321 $ 189,321 $ 189,321 $ 189,321 $ 189,321 $ 189,321 $ 189,321 $ 189,321 $ 189,321 $ 189,321 $ 189,321 Capital $ 5,548 $ 5,548 $ 5,548 $ 5,548 $ 5,548 $ 5,548 $ 5,548 $ 5,548 $ 5,548 $ 5,548 $ 5,548 Closure $ $ $ $ $ $ $ $ $ $ $ Post Closure $ $ $ $ $ $ $ $ $ $ $ Tonnage 6,503 6,503 6,503 6,503 6,503 6,503 6,503 6,503 6,503 6,503 6,503 Operations $ 855,606 $ 855,606 $ 855,606 $ 855,606 $ 855,606 $ 855,606 $ 855,606 $ 855,606 $ 855,606 $ 855,606 $ 855,606 Capital $ 14,456 $ 14,456 $ 14,456 $ 14,456 $ 14,456 $ 14,456 $ 14,456 $ 14,456 $ 14,456 $ 14,456 $ 14,456 Closure $ $ $ $ $ $ $ $ $ $ $ Post Closure $ $ $ $ $ $ $ $ $ $ $ Tonnage 6,320 6,320 6,320 6,320 6,320 6,320 6,320 6,320 6,320 6,320 6,320 Operations $ 839, $ 839,695 $ 839,695 $ 839,695 $ 839,695 $ 839,695 $ 839,695 $ 839,695 $ 839,695 $ 839,695 $ 839,695 Capital $ 63, $ 63,000 $ 63,000 $ 63,000 $ 63,000 $ 63,000 $ 63,000 $ 63,000 $ 63,000 $ 63,000 $ 63,000 Closure $ $ $ $ $ $ $ $ $ $ $ Post Closure $ $ $ $ $ $ $ $ $ $ $ Tonnage 57,181 57,181 57,181 57,181 57,181 57,181 57,181 57,181 57,181 57,181 57,181 Operations $ 1,468,222 $ 1,468,222 $ 1,468,222 $ 1,468,222 $ 1,468,222 1,468,222 $ 1,468,222 $ 1,468,222 $ 1,468,222 $ 1,468,222 $ 1,468,222 Capital $ 811,973 $ 811,973 $ 811,973 $ 811,973 $ 811, ,973 $ 811,973 $ 811,973 $ 811,973 $ 811,973 $ 811,973 Closure $ $ $ $ $ 0 $ $ $ $ $ Post Closure $ $ $ $ $ 0 $ $ $ $ $ Tonnage 2,337 2,337 2,337 2,337 2,337 2,337 2,337 2,337 2,337 2,337 2,337 Operations $ 198, ,341 $ 198,341 $ 198,341 $ 198,341 $ 198,341 $ 198,341 $ 198,341 $ 198,341 $ 198,341 $ 198,341 Capital $ $ $ $ $ $ $ $ $ $ $ Closure $ $ $ $ $ $ $ $ $ $ $ Post Closure $ $ $ $ $ $ $ $ $ $ $ 10Year Costs TNRD Costs $ 11,714,248 City of Kamloops Costs $ 37,193,545 Total System Costs $ 48,907,793 Tipping Fees Annual Tonnage transferred to City of Kamloops 7,158 Annual TNRD tipping fees paid to City of 80$/tonne $ 572,655 10Year Costs including Tipping Fees TNRD Costs $ 17,440, City of Kamloops Costs (including tipping fees revenue) $ 31,466,993.08
188 Table 3e Scenario 5 Close Barnhartvale and Heffley Creek becomes a DLConly landfill Heffley Creek Lower Nicola KRRC (Owl Road) Mission Flats Barnhartvale Tonnage 1,903 1,903 1,903 1,903 1,903 1,903 1,903 1,903 1,903 1,903 1,903 Operations $ 189,321 $ 189,321 $ 189,321 $ 189,321 $ 189,321 $ 189,321 $ 189,321 $ 189,321 $ 189,321 $ 189,321 $ 189,321 Capital $ 5,548 $ 5,548 $ 5,548 $ 5,548 $ 5,548 $ 5,548 $ 5,548 $ 5,548 $ 5,548 $ 5,548 $ 5,548 Closure $ $ $ $ $ $ $ $ $ $ $ Post Closure $ $ $ $ $ $ $ $ $ $ $ Tonnage 6,503 6,503 6,503 6,503 6,503 6,503 6,503 6,503 6,503 6,503 6,503 Operations $ 855,606 $ 855,606 $ 855,606 $ 855,606 $ 855,606 $ 855,606 $ 855,606 $ 855,606 $ 855,606 $ 855,606 $ 855,606 Capital $ 14,456 $ 14,456 $ 14,456 $ 14,456 $ 14,456 $ 14,456 $ 14,456 $ 14,456 $ 14,456 $ 14,456 $ 14,456 Closure $ $ $ $ $ $ $ $ $ $ $ Post Closure $ $ $ $ $ $ $ $ $ $ $ Tonnage 6,320 6,320 6,320 6,320 6,320 6,320 6,320 6,320 6,320 6,320 6,320 Operations $ 839, $ 839,695 $ 839,695 $ 839,695 $ 839,695 $ 839,695 $ 839,695 $ 839,695 $ 839,695 $ 839,695 $ 839,695 Capital $ 63, $ 63,000 $ 63,000 $ 63,000 $ 63,000 $ 63,000 $ 63,000 $ 63,000 $ 63,000 $ 63,000 $ 63,000 Closure $ $ $ $ $ $ $ $ $ $ $ Post Closure $ $ $ $ $ $ $ $ $ $ $ Tonnage 58,350 58,350 58,350 58,350 58,350 58,350 58,350 58,350 58,350 58,350 58,350 Operations $ 1,468,222 $ 1,468,222 $ 1,468,222 $ 1,468,222 $ 1,468,222 1,468,222 $ 1,468,222 $ 1,468,222 $ 1,468,222 $ 1,468,222 $ 1,468,222 Capital $ 811,973 $ 811,973 $ 811,973 $ 811,973 $ 811, ,973 $ 811,973 $ 811,973 $ 811,973 $ 811,973 $ 811,973 Closure $ $ $ $ $ 0 $ $ $ $ $ Post Closure $ $ $ $ $ 0 $ $ $ $ $ Tonnage Operations $ $ $ $ $ $ $ Capital $ $ $ $ $ $ $ $ $ $ $ Closure $ 1,350,000 $ $ $ $ $ $ $ $ $ $ Post Closure $ $ 14,000 $ 14,000 $ 14,000 $ 14,000 $ 14,000 $ 14,000 $ 14,000 $ 14,000 $ 14,000 $ 14,000 10Year Costs TNRD Costs $ 11,714,248 City of Kamloops Costs $ 36,501,794 Total System Costs $ 48,216,042 Tipping Fees Annual Tonnage transferred to City of Kamloops 7,158 Annual TNRD tipping fees paid to City of 80$/tonne $ 572,655 10Year Costs including Tipping Fees TNRD Costs $ 17,440, City of Kamloops Costs (including tipping fees revenue) $ 30,775,242.08


189 ThompsonNicola Regional District Solid Waste Management and Resource Recovery Plan Update Solid Waste Policies, Bylaws and Enforcement Prepared by: Maura Walker & Associates In collaboration with Carey McIver & Associates Ltd., Jan Enns Communications, and Date: May 1, 2017
190 May 1, 2017 Mr. Jake Devlin Director of Environmental Services ThompsonNicola Regional District Victoria St Kamloops, BC Canada, V2C 2A9 Dear Jake, Re: TNRD Solid Waste Management Plan Review Solid Waste Policies, Bylaws and Enforcement We are pleased to submit this report that discusses how policies, bylaws and enforcement can contribute to an effective waste management system. The information contained in this report will be presented to the Review Advisory Committee and is intended to seed a discussion regarding the potential application of these ideas to the operation of regional and municipal solid waste operations. Yours truly, Maura Walker, President Maura Walker and Associates Maura Walker & Associates Environmental Consultants Ph
191 TNRD SWMP Review Policies, Bylaws & Enforcement Table of Contents Table of Contents... ii List of Figures... ii 1 Introduction Policies, Bylaws and Waste Diversion Solid Waste Bylaws Tipping Fees Disposal Bans Approaches to Disposal Ban Enforcement Policies and Procedures Waste Stream Management Licensing Examples of Regional Districts with Licensing Bylaws Codes of Practice Bylaws Extended Producer Responsibility (EPR) Recommendations for Consideration List of Figures Figure 11: Plan Review Process... 3 Figure 41: Integrated Disposal Ban Design and Implementation... 9 Figure 42: Metro Vancouver Organics Disposal Ban Phased Implementation Page ii

192 TNRD SWMP Review Policies, Bylaws & Enforcement 1 Introduction The ThompsonNicola Regional District (TNRD) is currently updating its 2008 Regional Solid Waste Management Plan (SWMP), which was an update of the original plan approved by the province in The process to review the plan is being conducted in three phases as indicated in Figure 11. Figure 11: Plan Review Process Phase1 Phase 2 Phase 3 Establish RSWMP Review Advisory Committee Consider options for the future: Waste Diversion Residual waste Policy & Bylaws Financing Obtain community feedback on preferred options Assess existing system Community Survey SWMP Web Page Update information Establish tools for community access and input Finalize plan update The first phase, which is complete, consisted of the establishment of the Regional SWMP Review Advisory Committee (RAC) as well as an assessment of the current solid waste management system and a status report on the implementation of the 2008 Plan. Phase 1 also included a concurrent communication and consultation program consisting of a community survey and SWMP web page. The second phase, the current phase, entails a review of options to address the region s future solid waste management needs and the selection of preferred options. To date, reports and presentations regarding waste diversion options and residual waste management have been prepared and discussed. This memo addresses policies, bylaw and enforcement options that can be the foundation of a successful solid waste management system. The third phase of the planning process will consist of a community and stakeholder consultation process to obtain input on the selected options. This report presents the following policy and bylaw options: Solid waste bylaws (collection service bylaws and facility regulation bylaws) Tipping fees: variable tipping fees and tipping fee uniformity Disposal Bans and Enforcement Options Operational policies and procedures Page 3
193 TNRD SWMP Review Policies, Bylaws & Enforcement Waste Stream Management Licensing and Codes of Practice Bylaws Extended Producer Responsibility Policy 1.1 Policies, Bylaws and Waste Diversion Policies and bylaws define the rules of the road for how solid waste can be managed in the TNRD. They can also be applied to achieving many of the goals identified for this solid waste management plan, including: Improve the level of ICI Recycling, Divert organic waste from disposal (where it is reasonable to do so), Divert wood waste from disposal (where it is reasonable to do so), and Ensure financial sustainability. Policies and bylaws to encourage waste diversion and to achieve the above targets will be integral to the success of the Solid Waste Management Plan. The Waste Diversion Options Report prepared and discussed in March 2017, presented the following options that would be driven by solid waste policy, bylaw and enforcement: 1. To improve the level of ICI Recycling: a. Apply differential tipping fees to encourage source separation b. Implement disposal bans on recyclable wastes like cardboard and metal 2. To divert ICI sector organic waste from disposal: a. Support private collection through the application and enforcement of a disposal ban on organic waste b. Amend the City of Kamloops Bylaw 4063 to require that ICI generators of organic waste to have an organic waste collection service in place. 3. To divert construction and demolition waste: a. Minimize wood waste in the landfill b. Expand disposal bans to include clean wood waste and asphalt shingles c. Enact and enforce similar bylaw requirements for all City of Kamloops landfills d. Require new commercial developments to incorporate space for management of garbage and recycling in their design e. Require waste management plans for large construction, demolition and renovation projects f. Restructure permit fees to promote deconstruction. 2 Solid Waste Bylaws There are typically two types of bylaws that local governments adopt to manage solid waste: collection service bylaws and facility regulation bylaws. Collection service bylaws regulate the curbside collection of garbage, recyclables and organics from primarily single family residential customers, although in some Page 4
194 TNRD SWMP Review Policies, Bylaws & Enforcement cases, such as the City of Kamloops, the curbside collection service is also available to multifamily and ICI customers. Facility regulation bylaws apply to recycling and disposal facilities and establish regulations, conditions of use as well as user fees and penalties. In the City of Kamloops, these two types of bylaws are combined into one the City of Kamloops Solid Waste and Recyclables Bylaw 4063 which provides a system for the collection, removal, and disposal of solid waste and recyclables. As indicated in Table 21, this bylaw is divided into twelve divisions of which most apply to the curbside collection service for garbage and recyclables with only Division Nine applying to disposal facilities. Table 21: City of Kamloops Solid Waste and Recyclables Bylaw 4063 Division Topic Type Division One Definitions and Interpretation Both Division Two Administrative Collection Division Three Solid Waste Disposal Requirements Collection Division Four Recyclable Disposal Requirements Collection Division Five Cart Collection Service of Solid Waste Collection Division Six Cart Collection Service of Recyclables Collection Division Seven Fees, Subsidies and Set Out/Set Back Services Collection Division Eight City Bin Collection Service Solid Waste and Recyclables Collection Division Nine Disposal Sites Facility Division Ten Fees and Charges Collection Division 11 Offences and Penalties Both Division 12 Schedules Both Table 22 outlines the schedules attached to the Bylaw. Schedules A, B, C and D apply to the curbside collection service, Schedule E applies to the Cinnamon Ridge compost facility, Schedules F, G, I and J apply to disposal facilities and Schedule H applies primarily to the curbside service with the exception of illegal dumping at disposal sites. Schedule A Schedule B Schedule C Schedule D Schedule E Schedule F Schedule G Schedule H Schedule I Schedule J Table 22: City of Kamloops Bylaw 4063 Division 12 Schedules Rates for Cart Collection of Solid Waste Rates for Cart Collection of Recyclables Rates for the MultiFamily Bin Collection Service Solid Waste and Recyclables Rates for Commercial Bin Collection Service Rates for the Sale of Compost Rates for the Mission Flats Landfill Rates for the Barnhartvale Landfill Fine Schedule Rates for Kamloops Recovery Centre Solid Waste Materials Accepted at City Landfill Sites Page 5
195 TNRD SWMP Review Policies, Bylaws & Enforcement With respect to meeting the diversion targets discussed in Section 1.1 above, while the City of Kamloops bylaw provides a curbside recycling service and prohibits the disposal of cardboard, newspaper and grass clippings in curbside garbage, there are no similar prohibitions on the disposal of these materials at City disposal facilities. The City is currently reviewing their solid waste bylaw with the objective of bringing it up to date and improving its clarity. The TNRD regulates and sets fees for TNRD municipal solid waste disposal and recycling facilities under Solid Waste Management Facilities Bylaw No. 2465, Table 23 provides an outline of the sections and schedules to this bylaw. Table 23: TNRD Solid Waste Management Facilities Bylaw No. 2465, 2014 Sections Schedules Definitions, Interpretations and Schedules Schedule A User Fees and Penalties Regulations and Conditions of Use Schedule B Controlled Waste Violations and Penalties Schedule C Recyclable Materials Inspections Schedule D Site Regulations Appeal Schedule E Prohibited Waste Repeal Schedule F Customer Accounts As indicated in Table 24 below, TNRD Bylaw 2465 defines certain materials as controlled wastes, prohibited wastes and banned recyclable wastes. Implementing disposal bans on recyclable wastes was identified in the 2008 SWMP. Although the bans are included in the bylaw, the TNRD has not enforced these recyclable material bans due to a lack of staff capacity to undertake the communication and education efforts that would be required to effectively implement the bans. Page 6


196 TNRD SWMP Review Policies, Bylaws & Enforcement Table 24: Controlled, Prohibited and Banned Recyclable Materials in TNRD Bylaw 2465 Controlled Waste Animal Feces Asbestos Friable and Non Bulky Waste Clean Fill Concrete Condemned Foods Contaminated Soil Creosote Treated Wood Small Dead Animals DLC Waste Dusty Material Infested Vegetation Metal Drums and Tanks Noxious Weeds Out of Region Waste Sharps Residential Tree Stumps Prohibited Waste Agricultural Waste Auto hulks Biomedical Wastes Biosolids Contaminated Soil Free Liquids Hazardous Waste Industrial Waste Large dead animals PCBs Waste on fire or smouldering Waste not defined as MSW Banned Recyclable Materials Corrugated cardboard Glass containers Mixed Waste Paper Metal Containers Plastic Packaging Product Stewardship Material Scrap Metal 3 Tipping Fees A tipping fee schedule has a multiple of purposes. Applying tipping fees to incoming waste is how TNRD and the City of Kamloops recover part of the costs of building and operating their solid waste facilities. In addition, through the application of variable rates to the different waste streams, TNRD and the City can influence the behaviour of their customers. For instance, lower rates on recyclable and compostable waste streams than the garbage rate encourages customers to source separate these materials so that their costs are lowered. This is already the case for both the City of Kamloops and the TNRD facility bylaws where commingled Demolition, Land Clearing and Construction Waste (DLC) is charged at $160 per tonne while separated DLC materials such as clean wood waste and asphalt shingles are charged at $100 per tonne. Similarly, tipping fees can be set at a level that encourages waste generators to seek out lowercost private sector alternatives, like a private recycling depot or scrap metal yard, which avoids TNRD or the City having to store and subsequently transport the material to the recycling facility. Another purpose for the tipping fee schedule is to track the quantities of the different categories of waste that are handled at the facilities. Having detailed information on the volumes and revenues associated with each waste stream is invaluable for planning purposes. Page 7
197 TNRD SWMP Review Policies, Bylaws & Enforcement 4 Disposal Bans To encourage even more sourceseparation and diversion than variable tipping fees, many regional districts and municipalities implement disposal bans on recyclable and compostable materials. This is a lowcost policy tool used to signal to waste generators and waste collection companies that they are expected to separate and recycle/compost specific materials for which alternatives are readily available (e.g. cardboard, metal, yard waste). Disposal bans are enforced at the point of disposal (i.e. at transfer stations and landfills) through the application of significant surcharges on garbage found to contain banned materials. To ensure sustained success, disposal bans require the local government to work closely with ICI waste generators and particularly commercial waste haulers in the design, start up and ongoing maintenance of this policy. The Regional District of Nanaimo, whose disposal ban on cardboard was implemented in 1992, has a consistent approach whenever they introduce a new disposal ban: I. Regulate (decide to ban a waste stream with a readily available alternative to landfilling) II. III. IV. Collaborate (work with affected stakeholders to determine the timing of implementation and the ramp up of enforcement measures) Educate (make sure all haulers and waste generators are aware of the upcoming new disposal ban, and plan to communicate regularly) Enforce (enforce the disposal ban at the point of disposal). 4.1 Approaches to Disposal Ban Enforcement The approach to enforcing disposal bans has evolved over the last decade as regional districts have gained more experience with this policy tool. Enforcement is only one component of an integrated approach to implementing a disposal ban. As indicated in Figure 41, collaboration with waste haulers and generators is essential not only during the design of a disposal ban but also during implementation. Many regional districts have discovered that the need to enforce a disposal ban is shortterm and minimal if adequate collaboration with waste haulers, supported by effective education of waste generators, results in diversion becoming businessasusual. In effect, waste haulers become the enforcers of the disposal ban since its implementation provides them with an opportunity to increase their market share if they can provide more costeffective collection options to their customers. Page 8


198 TNRD SWMP Review Policies, Bylaws & Enforcement Figure 41: Integrated Disposal Ban Design and Implementation Collaborate Enforce Diversion Opportunities Regulate Educate Nevertheless, local governments do need to provide some level of enforcement in order for the ban to be effective. With respect to disposal bans on cardboard, mixed waste paper and scrap metal, some local governments such as the Capital Regional District have dedicated bylaw enforcement officers at the landfill inspecting loads at the working face and issuing fines if required. In the Regional District of Nanaimo, bans are enforced at the landfill by the equipment operators who notify a supervisor to inspect the load, take pictures and then advise the scale clerk to apply a surcharge to the load. This information is then passed on the Zero Waste Compliance Officer who follows up with the hauler and generator to educate then on compliance options. It is important to note that the goal of the surcharge is not to make money for the regional district but to provide an opportunity to educate. In most cases the first infraction results in a warning while the second infraction results in a tipping fee surcharge. However based on experience, most infractions occur within the first six to twelve months of ban implementation, after which fines are minimal as waste diversion becomes business as usual. Metro Vancouver refined this approach with the introduction of their food scraps disposal ban in January From Metro planned their organics diversion strategy in collaboration with stakeholders and then released their implementation strategy The strategy was based on a phased implementation approach as illustrated in Figure 42. Although the ban was effective January 2015, the first six months was considered as an education period with no surcharge on tipping fees. However from July to December 2015, if a hauler arrived with a load at a transfer station or disposal Page 9

199 TNRD SWMP Review Policies, Bylaws & Enforcement facility containing more than 25% food scraps, a 50% surcharge was applied to their tipping fee. This 20% threshold was reduced to 10% in 2016 down to 5% in Figure 42: Metro Vancouver Organics Disposal Ban Phased Implementation Although Metro Vancouver hired contracted enforcement staff at their facilities to inspect incoming loads for food waste, most regional districts have used their own staff to enforce disposal bans on a wide range of materials. This is because, as discussed above, enforcement activity is usually shortterm while waste generators and haulers adjust to new waste management behaviours. Metro Vancouver s phased approach was extremely successful and has been adopted by other regional districts as they introduce their own disposal bans. Most recently, in April 2017 the Regional District of FraserFort George approved a commercial cardboard diversion program that will apply phased surcharges and thresholds to loads containing cardboard. This program will be implemented by regional staff. 5 Policies and Procedures Solid waste management facilities are recipients of a wide variety of solid wastes, many of which can pose a health and safety risk to site staff or the environment if it is not properly identified and managed. Consequently, operating policies and procedures are prepared to guide staff and minimize the risks associated with managing solid waste. Typical waste streams that have a policy and procedure include: Asbestos and asbestos containing products Drywall/gypsum (due to the potential for containing asbestos and for creating hydrogen sulfide gas in landfills) Contaminated soil Sharps Medical facility waste Page 10
200 TNRD SWMP Review Policies, Bylaws & Enforcement Currently, Although TNRD does have a policy and procedure for receiving and managing asbestos that this identified as such by the customer, it does not have a protocol in place for screening for waste that might contain asbestos. Many customers are unaware of the broad range of materials, particularly old building materials, which contain asbestos. It s recommended that the TNRD develop appropriate policies, procedures and practices for screening and managing waste with a high risk of containing asbestos, and to share this procedure with member municipalities operating solid waste facilities. Relevant examples of such policies and procedure can be obtained from other BC regional districts. 6 Waste Stream Management Licensing The BC Environmental Management Act (the Act) grants the authority and responsibility to manage all municipal solid waste and recyclables to the province s regional districts. As part of this authority, under Section 24 of the Act, regional districts are responsible for developing and implementing solid waste management plans (SWMP) that provide long term visions for the management of municipal solid waste, including waste diversion and disposal activities. For the purposes of implementing an approved SWMP, Section 25 of the Act contains provisions for the regulation of solid waste management facilities and haulers by regional districts. This tool can be used by regional districts, if they so choose, to regulate their local solid waste industry by achieving operational and administrative control over privatelyowned and publiclyowned facilities and haulers managing recyclable material and municipal solid waste in their region. The Act allows regional districts to create bylaws respecting the following: Page 11 The types and quantities of waste materials managed at a site (facilities); The types and quantities of waste materials transported within the regional district (haulers); The operation, closure and postclosure of a waste management site; The fees and charges applied to waste management activities; The recording and submission of waste management information; The requirement to hold a license; The requirement to comply with a code of practice; and, The requirement for operators of sites to obtain risk insurance or provide some form of security. In particular, the Act allows for the licensing system to establish different prohibitions, conditions, requirements, and exemptions for different classes of sites, operations, activities, waste or recyclables. This means that each license can be case specific. Therefore, waste stream management licensing is another potential tool for TNRD to employ to assert control over the waste management system. This tool was identified in the TNRD s 2008 SWMP but not implemented as it wasn t considered a high priority action. Licenses can be used to administer and enforce any bylaw developed by a regional district under the Act s authority. The Act provides for two types of licenses that a regional district can issue: a waste
201 TNRD SWMP Review Policies, Bylaws & Enforcement stream management license (WSML) issued to the owner or operator of a site that accepts and manages municipal solid waste; and, a hauler license issued to a hauler. Regional Districts may choose to regulate their local solid waste industry for the following reasons: To ensure the diversion of recyclable material; To prevent abandonment of large quantities of solid waste or recyclable material; To track the movement of municipal solid waste and recyclable material; To assist in determining success in meeting waste reduction goals; To establish minimum administrative and operational requirements for facilities; To encourage private sector investment in waste management (through the establishment of a level playing field); and, To protect the public interest by managing the flow of municipal solid waste to regional district facilities to ensure financial sustainability. 6.1 Examples of Regional Districts with Licensing Bylaws Metro Vancouver (MV) introduced a regulatory program to ensure proper management of privately operated municipal solid waste and recycling facilities in their 1995 SWMP. These facilities are regulated by the Municipal Solid Waste and Recyclable Material Regulatory Bylaw which specifies operating requirements so as to protect the environment and public health, protect the region s land base in accordance with the host municipality s zoning and land use policies, ensure that regional, municipal and private facilities operate to equivalent standards, and to achieve the objectives of the MV Integrated Solid Waste and Resource Management Plan. Under the Bylaw, licenses are required for the following types of privately owned facilities: disposal facilities; material recovery facilities, transfer stations, composting facilities, storage facilities and certain types of brokering facilities. In another example, the Regional District of Nanaimo (RDN) and the Cowichan Valley Regional District (CVRD), working in partnership, adopted Waste Stream Management Licensing Bylaws No (RDN) and 2570 (CVRD) in Under these bylaws, the RDN and the CVRD are authorized to license all private or nongovernment operated municipal solid waste diversion and recycling facilities within their respective regions. The bylaws were established under the authority of both the RDN and CVRD SWMPs and were approved by the Ministry of Environment in The bylaws are a response to concerns by the recycling industry in both districts regarding competing businesses that operate with low standards. The photograph below shows one example of an undesirable operation competing with legitimate recycling operations prior to the establishment of a licensing system. Page 12

202 TNRD SWMP Review Policies, Bylaws & Enforcement Pile of waste drywall being stored on private land in the CVRD The bylaws create a level set of standards for the recycling and composting industry that protects private sector investment in local solid waste management infrastructure, and enhances diversion in the regions. They are also intended to shield taxpayers from the risk and expense related to cleanup of poorly operated and/or abandoned facilities. In both the RDN and the CVRD, the WSML bylaws help improve the quality of data received from private diversion and recycling facilities, as they are required to submit monthly material statements to the districts. Improved data reporting allows both the RDN and CVRD to effectively track progress towards their waste reduction goals. In the three regional districts discussed above, the license application process includes a 45day public consultation period for new applications. License applications are reviewed by staff; and if applications are acceptable, staff also issues the license. Any applicant or licensee affected by the staff decision may appeal the decision to the Board. The three regional districts also operate their respective licensing systems on a selffinancing basis, in that license application, amendment and annual administration fees have been designed to pay for the regulatory program. In Metro Vancouver the application fees range from $500 to $5,000 depending on the type of facility, with an annual administration fee of $1,000 for all licensed facilities. In the RDN and CVRD system, license application fees range from $100 to $1,000 depending on the type of facility, with an annual administration fee of $100 $500 depending on the type of facility. WSMLs require staff time to review applications, inspect facilities and enforce license requirements. For the RDN in particular, staff time dedicated to the WSML bylaw, at 1 Fulltime Equivalent (FTE) annually, exceeds the revenue generated by the system. However, the RDN reports that the documented diversion attributed to the WSML system has been worth the expense. Nevertheless, as part of their SWMP Review, the RDN will be reviewing the fee structure contained in their WSML, to determine whether the fees should be adjusted to more accurately reflect costs. Page 13
203 TNRD SWMP Review Policies, Bylaws & Enforcement 6.2 Codes of Practice Bylaws Code of Practice bylaws are another approach to facility regulation, that is similar to waste stream management licensing, but instead of licensing all solid waste management facilities, code of practice bylaws seek to establish operating standard for a specific type of solid waste facility. This is the approach the Capital Regional District (CRD) has undertaken with the development of the Composting Facilities bylaw and the Salt Spring Island Transfer Station bylaw. This approach to facility regulation limits the authority to only those types of facilities that the CRD deemed necessary to assert some level of operating standards. As an example, the CRD implemented the Salt Spring Island Transfer Station Regulation Bylaw 2810 in The purpose of the bylaw is to regulate and license the operation of facilities that are used for the management of municipal solid waste or recyclable material on Salt Spring Island (SSI). Under this bylaw, transfer stations must not contaminate ground or surface water or generate unacceptable levels of odour, vectors, litter or dust. This bylaw also requires performance security. The bylaw was put in place to address the development of private sector transfer stations on Salt Spring Island to ensure that they met minimum desired operating standards and created a level playing field. In summary, adoption of a waste stream management licensing or codes of practice bylaws could provide the TNRD are tools that can provide a level of local government control over the operation of private sector solid waste facilities, and can also be used to diminish the potential for facilities that operate at a low standard. 7 Extended Producer Responsibility (EPR) Extended Producer Responsibility (EPR) is a provincial policy tool that aims to shift the responsibility for endoflife management of products (physically and economically) to their manufacturer and retailers (called producers ) and away from local governments. This policy is intended to create an incentive for producers to include environmental considerations in design of products. As a result of this policy tool, the following products, at the end of their life, are to be managed by their producers: beverage containers residential packaging and printed papers smoke and carbon monoxide alarms tires used oil, oil containers, oil filters antifreeze household batteries and cell phones lead acid batteries small appliances and electrical equipment electronics: computers, televisions, audiovisual, medical equipment, office equipment pharmaceuticals, outdoor power equipment lamps and lighting equipment Page 14
204 TNRD SWMP Review Policies, Bylaws & Enforcement The 2007 TNRD Solid Waste Management Plan states in regards to EPR that TNRD will: Support the continuation and expansion of product stewardship programs implemented Support extended producer responsibility and DesignforEnvironment initiatives that encourage or regulate manufacturers to use recyclable and recycled packaging materials and discourage excessive packaging Lobby senior levels of government to implement policy to expand extended producer responsibility programs within British Columbia and Canada, particularly those that focus on packaging waste Prepare an annual report to the upper levels of government, which will provide a report card like summary on all aspects of EPR pertaining to the TNRD, along with recommendations for improvement Continue to participate in the BC Product Stewardship Council, to provide input to the Ministry of Environment on how regional districts would wish to see stewardship programs developed in the province Until such time as provincially mandated programs are functioning effectively in the region, the TNRD will continue to support recycling events such as Household Hazardous Waste and E Waste Collection events. Since the development of the 2007 Plan, and as reported in the Stage 1 Report on the Existing Solid Waste Management System, EPR plays an increasingly significant role in how solid waste is managed in BC and in the TNRD. The following is an overview of the EPR collection services in the TNRD: 1) The TNRD collects several EPR products at their solid waste facilities on behalf of producers, i.e. the producers pay TNRD to provide collection services or cover the transportation and disposal costs. The following products are collected at all fullservice sites: household batteries, automotive batteries, tires, motor oil and filters, electronics, small appliances, paints, pesticides, fuels and light bulbs. Some of these products are also collected at the residential service sites. 2) The City of Kamloops recently became a collector of residential packaging and printed papers for Recycle BC (formerly MultiMaterial BC), which means that the City s residential curbside and multifamily recycling collection programs are now a Recycle BC service rather than a City service, although City crews continue to provide the collection service. 3) There are several private bottle depots that collect beverage containers and electronics. 4) There are also private collection sites, often located at retailers, for various EPRdesignated products. Additionally, in recent months, the TNRD has begun discussions with Recycle BC in regards to collecting residential packaging and printed papers at TNRD solid waste facilities as part of the Recycle BC program. Page 15
205 TNRD SWMP Review Policies, Bylaws & Enforcement The TNRD and the City of Kamloops has been working towards having one stop drops. However, there hasn t been a formal policy adopted to guide the regional district or the City in how it determines whether or not to provide a collection service on behalf on an EPR program. As EPR becomes an increasingly significant component of BC s waste management system, the TNRD and member municipalities may benefit from determining the extent that they wish to engage in EPRrelated services. In BC, three models of local participation appear to be emerging: i. Provide as broad a range of EPR drop off services at local solid waste facilities as possible (i.e. try to provide one stop drops the current approach by the TNRD and the City of Kamloops) ii. Minimize local government participation or do not participate in EPR programs directly iii. Hybrid: Participate in the collection of specific products and packaging based on some or all of the following: o Available space and resources to manage the EPR program at local government facilities o The current role of the local government in collecting the designated product/package o The level of remuneration offered by EPR organizations for the collection service o The presence of alternative service providers in the area (that may be impacted if another collection site is established). The vast majority of local governments are opting for a hybrid approach but very few have a formal policy to assist staff with determining which EPR programs to engage with. 8 Recommendations for Consideration Based on the above, the following recommendations associated with bylaws, policies and enforcement are provided for consideration: 1. Develop consistent definitions for TNRD and municipal solid waste bylaws. 2. Aim for consistent tipping fee structures and disposal bans for solid waste facilities in and around the City of Kamloops. 3. When implementing new disposal bans (or beginning to enforce existing bans), undertake an integrated implementation process of: regulate, collaborate, educate and enforce. 4. Establish and implement consistent approaches to disposal ban enforcement. 5. Collaborate to develop operational policies and procedures with an aim for consistency with how controlled wastes should be delivered to solid waste facilities. Page 16
206 TNRD SWMP Review Policies, Bylaws & Enforcement 6. Develop clear decisionmaking criteria for determining if, when and where to participate in EPR collection services. 7. Consider the need for waste stream management licensing or codes of practice bylaws once disposal bans and other diversion initiatives are in place. Page 17

207 June 7 th, 2017 PRJ Thompson Nicola Regional District Victoria St. Kamloops, B.C. V2C 2A9 Attn: Jamie Vieira Financial Implications of Proposed Solid Waste Management System Changes to the ThompsonNicola Regional District and City of Kamloops. SUMMARY The purpose of this report is to outline all proposed changes to the ThompsonNicola Regional District s (TNRD) Solid Waste Management system. The proposed changes are a result of consultant research, advisory committee workshops, and regional district and municipality priorities. Sperling Hansen Associates and Maura Walker Associates Environmental Consultants have carefully analyzed each option and identified the financial implications associated with the contemplated capital, operational or staffing changes for the benefit of TNRD staff, advisory committees and the Board. An implementation schedule has been created with the goal of outlining appropriate years to implement the recommended changes to best meet the needs of the public and regional/municipal bodies. As the City of Kamloops has significant influence in the TNRD s Solid Waste System (being the largest municipality and population center), as well as owning and operating their own facilities, financial and staffing implications have been identified for the City as well. Two major categories have been identified: Diversion Initiatives and Residual Waste Management Initiatives. Within these categories, solid waste management system changes that are addressed include: Diversion Initiatives: ICI Diversion Construction and Demo Waste Diversion Organic Waste Diversion Promotion and Education Residual Waste Management Initiatives: Conversion of Heffley Creek Landfill Closure of Barnhartvale Landfill Extended Producer Responsibility Household Hazardous Waste Collection Bylaws Illegal Dumping Establish Specified Risk Material (SRM) Management Strategy Agricultural Plastics Recycling Strategy ThompsonNicola Regional District 1 Financial Implications Report PRJ16048
REGIONAL SOLID WASTE MANAGEMENT PLAN REVIEW
 REGIONAL SOLID WASTE MANAGEMENT PLAN REVIEW February 15, 2017 Meeting #1 Sperling Hansen Associates Tony Sperling Scott Garthwaite Mairi Dalgleish Carly Wolfe 1 MWA Environmental Consultants Maura Walker
THOMPSON-NICOLA REGIONAL DISTRICT. Regional Solid Waste Management Plan - Review Advisory Committee TUESDAY, MARCH 14, 2017 A G E N D A
 THOMPSON-NICOLA REGIONAL DISTRICT Regional Solid Waste Management Plan - Review Advisory Committee TUESDAY, MARCH 14, 2017 A G E N D A Time: 9:30 AM Place: Boardroom 4th Floor 465 Victoria Street Kamloops,
THOMPSON-NICOLA REGIONAL DISTRICT
 THOMPSON-NICOLA REGIONAL DISTRICT Extra Agenda - Thursday, April 17, 2014 A G E N D A Time 1:15 p.m. Place: Board Room 4th Floor 465 Victoria Street Kamloops, BC Page 12 REPORTS and/or INQUIRIES 3-12 12.a
Introduction. Challenges Related to Waste Reduction and Reuse AGENDA ITEM 6
 AGENDA ITEM 6 To: Russ Smith, Senior Manager, Environmental Resource Management From: Maura Walker Date: August 7, 2012 Re: Stage 1 Integrated Solid Waste and Resource Management Plan Issues for Consideration
Metro Vancouver. Recycling and Solid Waste Management 2014 Report
 Metro Vancouver Recycling and Solid Waste Management 2014 Report Metro Vancouver Recycling and Solid Waste Management 2014 Summary Page 1 Metro Vancouver is responsible for the planning and management
TNRD 2017 SWMP UPDATE
 TNRD 2017 SWMP UPDATE Solid Waste Management and Resource Recovery Plan Update TNRD Residual Waste Management Options Dr. Tony Sperling, P.Eng. April 18 th, 2017 Outline Background Landfills Scenarios
REPORT TO THE CHIEF ADMINISTRATIVE OFFICER FROM THE PUBLIC WORKS AND UTILITIES DEPARTMENT PROPOSED LANDFILL TIPPING FEE INCREASES
 July 24, 2014 REPORT TO THE CHIEF ADMINISTRATIVE OFFICER FROM THE PUBLIC WORKS AND UTILITIES DEPARTMENT ON PROPOSED LANDFILL TIPPING FEE INCREASES PURPOSE To seek Council's approval to increase tipping
Thompson-Nicola Regional District. Solid Waste Management and Resource Recovery Plan Update
 Thompson-Nicola Regional District Solid Waste Management and Resource Recovery Plan Update Solid Waste Policies, Bylaws and Enforcement Prepared by: Maura Walker & Associates In collaboration with Carey
EPR The Unintended Consequences Conference on Canadian Stewardship RCA Waste Reduction Conference October 2, 2015
 EPR The Unintended Consequences 2015 Conference on Canadian Stewardship RCA Waste Reduction Conference October 2, 2015 Capital Regional District Capital Regional District CRD 13 Municipalities & 3 Electoral
Northern Rockies Regional Municipality Solid Waste Management Plan Stage 2 Fort Nelson, British Columbia
 Draft for Review Northern Rockies Regional Municipality Solid Waste Management Plan Stage 2 Fort Nelson, British Columbia Northern Rockies Regional Municipality 10271 Shellbridge Way Suite 165 Richmond
Solid Waste and Resource Management Plan Advisory Committee # 4. Other Solid Waste Management Services
 Solid Waste and Resource Management Plan Advisory Committee # 4 Other Solid Waste Management Services Maura Walker, Maura Walker and Associates June 18, 2014 Agenda 1. Construction and demolition waste
City of Red Deer Waste Management Master Plan
 City of Red Deer Waste Management Master Plan Joint Waste Reduction Workshop April 19, 2013 Today s Objectives Waste Management Master Plan Development Recommended Program Elements and Targets Public Consultation
SOLID WASTE MANAGEMENT PLAN DRAFT 2017 UPDATE
 SOLID WASTE MANAGEMENT PLAN DRAFT 2017 UPDATE ISSUED FOR REVIEW FEBRUARY 2018 Tetra Tech Canada Inc. Suite 1000 10th Floor, 885 Dunsmuir Street Vancouver, BC V6C 1N5 CANADA Tel 604.685.0275 Fax 604.684.6241
RESIDENTIAL WASTE DIVERSION STRATEGY November 30, 2015
 RESIDENTIAL WASTE DIVERSION STRATEGY November 30, 2015 Waste & Recycling Services Table of Contents WHY DO WE NEED A STRATEGY?...2 WHAT ARE WE WASTING?...4 WHAT ARE WE DIVERTING?...5 WHAT COULD WE DO
Powell River Regional District. Solid Waste Management and Resource Recovery Plan
 Powell River Regional District Solid Waste Management and Resource Recovery Plan DRAFT FOR DISCUSSION Prepared by: MWA Environmental Consultants Ltd. In collaboration with Carey McIver & Associates Ltd.
Agenda Minutes. Meeting # 1 Outcomes Vision Issues and Priorities. Waste Diversion Options Break Waste Diversion Options (continued) Wrap Up
 Wrap Up") Agenda Minutes Meeting # 1 Outcomes Vision Issues and Priorities Waste Diversion Options Break Waste Diversion Options (continued) Wrap Up SAC Meeting #2, April 23, 2014 Presented by Maura Walker 1 Long
Agenda Minutes Meeting # 1 Outcomes Vision Issues and Priorities Waste Diversion Options Break Waste Diversion Options (continued) Wrap Up SAC Meeting #2, April 23, 2014 Presented by Maura Walker 1 Long
Strategy for Updating the Solid Waste Management Plan
 Strategy for Updating the Solid Waste Management Plan February 2008 (Revised March 15 th, 2008) Discussion Document The purpose of this document is to review the opportunities for diversion of solid waste
T O R O N T O LONG TERM WASTE MANAGEMENT STRATEGY
 T O R O N T O LONG TERM WASTE MANAGEMENT STRATEGY TORONTO S WASTE STRATEGY GUIDING PRINCIPLES Reduce the amount of waste we generate Reuse what we can Recycle and recover the remaining resources to reinvest
Why Plan? Why we need to plan:
 Welcome! We need to hear from you. Please enjoy a walk through our displays and feel free to ask questions. Use your dots red, yellow and green to indicate your level of support for various programs. Select
Vancouver: Zero Waste by 2040
 Vancouver: Zero Waste by 2040 WasteMINZ Conference Nov. 2017 Hamilton, New Zealand Chris Underwood, P.Eng Presentation Overview 1. Background 2. Zero Waste Policy & Progress 3. Zero Waste 2040 Strategy
Central Cariboo/City of Williams Lake JOINT COMMITTEE AGENDA
 Central Cariboo/City of Williams Lake JOINT COMMITTEE AGENDA RICK HANSEN BOARDROOM - CITY OF WILLIAMS LAKE - 450 MART STREET SEPTEMBER 19, 2012 5:00 PM (Dinner at 4:45 PM) Page Call to Order Reminders:
To: Nicole Kohnert, P.Eng Date: March 21, 2018 c: Memo No.: 2 Monica Wallani, MBA, P.Eng. Carey McIver, MA Tamara Shulman, BA, M.Sc.
 TECHNICAL MEMO To: Nicole Kohnert, P.Eng Date: March 21, 2018 c: Memo No.: 2 From: Monica Wallani, MBA, P.Eng. Carey McIver, MA Tamara Shulman, BA, M.Sc. File: SWM.SWOP03478 ISSUED FOR USE Subject: Technical
the Prince George Residential Curbside Solid Waste Stream
 Enhancing Waste Diversion i from the Prince George Residential Curbside Solid Waste Stream October 17, 2011 P t ti t M d C il Presentation to Mayor and Council City of Prince George Outline RSWMP Opportunity
Barriere Area Eco-Depot Siting Analysis. Open House Presentation December 15, 2009
 Barriere Area Eco-Depot Siting Analysis Open House Presentation December 15, 2009 Presentation Outline Introduction Project Background Review of Screening Analysis Identified Sites Next Steps Purpose of
The Waste Strategy Process
 The Waste Strategy Process TORONTO 1 WASTE STRATEGY WHERE ARE WE? 4 The Strategy recommends Review of current waste policies and programs, including management policies, WHAT ARE THE how to manage any
Quatsino Solid Waste Management Plan
 Quatsino Solid Waste Management Plan Addendum to Regional District of Mount Waddington Solid Waste Management Plan Introduction The body of the Regional District of Mount Waddington (RDMW) Solid Waste
Municipal Organic Waste Diversion and Composting in Metro Vancouver
 May 5, 2015 Municipal Organic Waste Diversion and Composting in Metro Vancouver Greenhouse Gas Emission Reductions and Credits for Climate Action Reporting 2014 Reporting Year (Amended Final Report) This
Phase 1 Report Existing Solid Waste Management System
 Phase 1 Report Prepared for Regional District of Fraser-Fort George By MWA Environmental Consultants Ltd. in association with XCG Consultants Ltd. May 19, 2015 May 19, 2015 Rachael Ryder, Waste Diversion
2016 Waste Management Benchmarking and Performance Monitoring Report
 Page 1 2016 Waste Management Benchmarking and Performance Monitoring Report Overview The 2016 Waste Management benchmarking report is comprised of three key areas for performance measurement: Resource
The options are presented in this memo in the following categories:
 To: Merrick Anderson, Electoral Area D Director Sean McGinn, Manager of Community Services, Powell River Regional District Lasqueti Island Solid Waste Advisory Committee From: Maura Walker Date: June 30,
Update: Draft Long Term Waste Management Strategy. Public Works and Infrastructure Committee
 PW11.3 STAFF REPORT ACTION REQUIRED Update: Draft Long Term Waste Management Strategy Date: February 11, 2016 To: From: Wards: Reference Number: Public Works and Infrastructure Committee Acting Deputy
A. THAT Council receive the following report for information regarding the results of the City s green demolition program to date.
 ADMINISTRATIVE REPORT Report Date: November 16, 2015 Contact: Albert Shamess Contact No.: 604.873.7300 RTS No.: 10655 VanRIMS No.: 08-2000-20 Meeting Date: December 16, 2015 TO: FROM: SUBJECT: Standing
Proposed Food and Organic Waste Framework
 Proposed Food and Organic Waste Framework Webinar November 2017 Ministry of the Environment and Climate Change Proposed Food and Organic Waste Framework November 2017 Purpose To provide an overview of:
WHY UPDATE OUR SOLID WASTE MANAGEMENT PLAN?
 WHY UPDATE OUR SOLID WASTE MANAGEMENT PLAN? Provincial regulatory requirement Provides direction for solid waste management for the next 10 years Determines how we will reduce, reuse, recycle and manage
A Waste Recycling Plan for. Municipality of Grey Highlands. Prepared with assistance from CIF & Waste Diversion Ontario And Genivar Consultants
 A Waste Recycling Plan for Municipality of Grey Highlands Prepared with assistance from CIF & Waste Diversion Ontario And Genivar Consultants Table of Contents 1. Introduction...2 2. Overview..3 3. Study
WELCOME. NRRA s Solid Waste Facility Operator 2016 Training Modules
 WELCOME NRRA s Solid Waste Facility Operator 2016 Training Modules About NRRA In 1981, four New Hampshire municipalities founded the Northeast Resource Recovery Association, then called the New Hampshire
Toronto Waste Strategy
 Toronto Waste Strategy (Text-only version) Robyn Shyllit Public Consultation Unit Tel: (416) 392-3760 TTY: (416)-338-0889 wastestrategy@toronto.ca March 29, 2016. Below is the text from the presentation
Municipal Organic Waste Diversion and Composting in Metro Vancouver. Greenhouse Gas Emission Reductions and Credits for 2016 Climate Action Reporting
 Municipal Organic Waste Diversion and Composting in Metro Vancouver Greenhouse Gas Emission Reductions and Credits for 2016 Climate Action Reporting May 23, 2017 This report was prepared by the staff of
Regional District of Nanaimo
 Regional District of Nanaimo Solid Waste Management Plan prepared by: Gartner Lee Limited RDN Solid Waste Department July 2004 Table of Contents Executive Summary Page 1. Background... 1-1 1.1 Guiding
Zero Waste to Residuals
 RDN Solid Waste Management System Overview: Zero Waste to Residuals Regional Solid Waste Advisory Committee May 16, 2013 Presentation Outline 1. RDN System Background System Characteristics System Cost
Development of a Long Range Plan for the SBWMA
 Development of a Long Range Plan for the SBWMA BACKGROUND The South Bayside Waste Management Authority (SBWMA) is embarking on the development of a new Long Range Plan ( Plan ) for the next ten years to
Recycling and Solid Waste Management
 Metro Vancouver Recycling and Solid Waste Management 2017 Report Metro Vancouver Recycling and Solid Waste Management - 2017 Summary Page 1 Metro Vancouver is responsible for the planning and management
2015 Waste Management Benchmarking and Performance Monitoring Report
 Page 1 2015 Waste Management Benchmarking and Performance Monitoring Report Overview The 2015 Waste Management benchmarking report is comprised of three key areas for performance measurement: Resource
THOMPSON-NICOLA REGIONAL DISTRICT. Regional Solid Waste Management Committee - Wednesday, September 17, 2014 A G E N D A
 THOMPSON-NICOLA REGIONAL DISTRICT Regional Solid Waste Management Committee - Wednesday, September 17, 2014 A G E N D A Time 1:30 p.m. Place: Board Room 4th Floor 465 Victoria Street Kamloops, BC Page
Zero Waste Challenge Goals, Strategies, and Actions
 Zero Waste Challenge Goals, Strategies, and Actions www.metrovancouver.org PRINTED IN CANADA ON RECYCLED PAPER Vision Statement Sustainable Region Initiative Metro Vancouver has a vision to achieve what
Powell River Regional District Solid Waste Management and Resource Recovery Plan Prepared by: In collaboration with: Date
 Powell River Regional District Solid Waste Management and Resource Recovery Plan Prepared by: MWA Environmental Consultants Ltd. In collaboration with: Carey McIver & Associates Ltd. Date: November 22,
WELCOME to the Pritchard Eco-Depot Siting Meeting. March 24, 2010 Open House 7 pm Presentation 8 pm Questions and Answers
 WELCOME to the Pritchard Eco-Depot Siting Meeting March 24, 2010 Open House 7 pm Presentation 8 pm Questions and Answers Please complete a comment form before leaving Thank-you Purpose of Open House Review
RECYCLE BC PROGRAM PLAN Steward Consultation Phase II JULY 17, 2018
 RECYCLE BC PROGRAM PLAN Steward Consultation Phase II JULY 17, 2018 1 AGENDA Recycle BC program principles and performance highlights Setting the context Plan updates Next Steps Q&A 2 PROGRAM PRINCIPLES
Saskatchewan Solid Waste Management Strategy
 April/17 Saskatchewan Solid Waste Management Strategy Discussion Paper March 2017 saskatchewan.ca/environment Table of Contents Introduction...........................................................................
RECYCLE BC PROGRAM PLAN Collectors and Local Governments Consultation Phase II JULY 18, 2018
 RECYCLE BC PROGRAM PLAN Collectors and Local Governments Consultation Phase II JULY 18, 2018 1 AGENDA Recycle BC program principles and performance highlights Setting the context Plan updates Next Steps
Agenda. Content of Upcoming Meetings. Minutes of Meeting #2. Backyard Composting
 RDOS Solid Waste Management Plan Technical Advisory Committee Meeting #3 October 13, 2010 Agenda Minutes of Meeting #2 Upcoming Meetings Organics Management ICI Waste Management Disposal Bans Other Initiatives
Carroll County Solid Waste Management Plan
 5.0 SOLID WASTE MANAGEMENT PLAN OF ACTION An integrated Solid Waste Management Plan provides specific management tools to handle various components of the waste stream. Numerous programs, which comprise
Current Solid Waste Management System Report
 Current Solid Waste Management System Report PRESENTED TO Regional District of North Okanagan MARCH 21, 2018 ISSUED FOR USE FILE: SWM.SWOP03478-01 Tetra Tech Canada Inc. Suite 1000 10th Floor, 885 Dunsmuir
Organics Diversion Strategy
 MAPPING THE WAY TO ZERO WASTE Organics Diversion Strategy Why Divert Organics? It s in the Plan When we reduce the amount of waste that goes into the landfill or other disposal sites, we save resources,
RDOS BOARD STAFF REPORT June 21, 2001
 RDOS BOARD STAFF REPORT June 21, 2001 DATE: June 19, 2001 FILE NO.: 5362.14 FROM: RE: OBJECT: David Duckworth, Public Works Manager Gypsum Recycling at the Campbell Mountain Landfill To advise the Board
SLRD SOLID WASTE AND RESOURCE MANAGEMENT PLAN
 SLRD SOLID WASTE AND RESOURCE MANAGEMENT PLAN Submitted to: Squamish-Lillooet Regional District Box 219, 1350 Aster Street Pemberton, BC V0N 2L0 Submitted by: Todd Baker, P.Eng Senior Environmental Engineer
1.0 Explore alternative methods for recovery of designated materials Examine diversion of additional materials at the public drop off depot
 1.0 Explore alternative methods for recovery of designated materials 1.1 City to explore alternative methods to provide recovery service for a range of divertible materials such as construction and demolition
sustainable communities
 Waste partnerships in sustainable communities Presented by: Mirka Januszkiewicz Director, Waste Management Services Regional Municipality of Durham November 2009 What is sustainability Sustainability is
Regional District of Central Kootenay May 2017 Resource Recovery Overview Report
 TABLE OF CONTENTS 1.0 Introduction...1 2.0 Background...2 2.1 HISTORY OF SOLID WASTE MANAGEMENT IN THE RDCK... 2 2.2 RDCK RESOURCE RECOVERY INFORMATION... 4 2.3 ROLES AND RESPONSIBILITIES... 6 3.0 Overview
CYPRESS HILLS WORKSHOP. Sustainable Cost Effective Solid Waste Management
 CYPRESS HILLS WORKSHOP Sustainable Cost Effective Solid Waste Management June 25, 2015 WASTE MANAGEMENT STRATEGY 2012-2022 Integrated: Addresses collection, diversion, landfill, composting and utility
Why is it important that we divert waste? Our landfill is filling up. Every year we are adding almost 100,000 tonnes of garbage.
 Organics Opportunities Report - Frequently Asked Questions What is the City s waste diversion goal? How are we doing? The community set a target of diverting 70% of our waste from the landfill. This means
Thompson-Nicola Regional District. Building Inspection Services
 Thompson-Nicola Regional District Building Inspection Services Building Inspection Department Currently 6 Building Inspectors, 1 Clerk, ½ Steno Divided into 4 inspection areas covering the entire TNRD
2015 SOLID WASTE ANNUAL REPORT
 2015 SOLID WASTE ANNUAL REPORT Executive Summary In 1988, the Illinois Environmental Protection Agency passed the Solid Waste Planning and Recycling Act. The purpose of this Act was to provide incentives
Resource Recovery. 1 P a g e
 Resource Recovery 1 P a g e Resource and Recovery Department 2018-2021 Operating Budget Roll-up 2018 2018 2019 2019 2020 2021 2017 Approved Q2 Approved Proposed Proposed Proposed Actual Budget Forecast
2012 Solid Waste Management Plan
 Environment Comox Strathcona Waste Management 2012 Solid Waste Management Plan Prepared by: AECOM 3292 Production Way, Floor 4 604 444 6400 tel Burnaby, BC, Canada V5A 4R4 604 294 8597 fax www.aecom.com
(S.208) It is hereby enacted by the General Assembly of the State of Vermont: * * * Architectural Waste Recycling * * *
 It is hereby enacted by the General Assembly of the State of Vermont: * * * Architectural Waste Recycling * * *") No. 175. An act relating to solid waste management. (S.208) It is hereby enacted by the General Assembly of the State of Vermont: * * * Architectural Waste Recycling * * * Sec. 1. FINDINGS The General
No. 175. An act relating to solid waste management. (S.208) It is hereby enacted by the General Assembly of the State of Vermont: * * * Architectural Waste Recycling * * * Sec. 1. FINDINGS The General
Re: Item No. 3. Halifax Solid Waste Resource Management System Strategy Review Deferred Items
 Re: Item No. 3 Halifax Solid Waste Resource Management System Strategy Review Deferred Items Origin 14 January 2014 Final Report presented to Regional Council Approved recommendations 1 through 6 Deferred
Report Date: February 22, 2011 Contact: C. Underwood Contact No.: RTS No.: VanRIMS No.: Meeting Date: March 1, 2011
 A6 ADMINISTRATIVE REPORT Report Date: February 22, 2011 Contact: C. Underwood Contact No.: 604.873.7992 RTS No.: 09096 VanRIMS No.: 08-2000-20 Meeting Date: March 1, 2011 TO: FROM: SUBJECT: Vancouver City
There is no such place as away. When we throw anything away, it must go somewhere. - Annie Leonard, The Story of Stuff WASTE
 There is no such place as away. When we throw anything away, it must go somewhere. - Annie Leonard, The Story of Stuff WASTE - 146 - Waste Stream 73% of landfill waste that could have been diverted Curbside
Staff report. R. Dyson
 Staff report DATE: April 11, 2018 FILE: 5360-30 TO: Chair and Directors Comox Valley Regional District () Board FROM: RE: Russell Dyson Chief Administrative Officer Solid Waste Management Plan- Five Year
Regional District of North Okanagan. Organics Management Options Study
 Carey McIver & Associates Ltd. E N V I R O N M E N T A L C O N S U L T A N T S Regional District of North Okanagan Organics Management Options Study Draft for Discussion Prepared by: Carey McIver & Associates
A Waste Management Master Plan for the County of Peterborough
 A Waste Management Master Plan for the County of Peterborough Prepared by Cambium Environmental Inc. Waste Management Master Plan Provides overall direction for the waste management system. Addresses diversion
County of Simcoe. Solid Waste Management Strategy Update Potential Options and Initiatives
 County of Simcoe Solid Waste Management Strategy Update Potential Options and Initiatives December 8, 2015 Today s Objectives 1. Review existing Strategy, current system, and performance; 2. Consider potential
Regional Waste Management/Material Recovery Facility Study Report
 Regional Waste Management/Material Recovery Facility Study Report PRESENTED TO MD of Foothills No. 31 Town of Black Diamond Town of High River Town of Nanton Town of Okotoks Town of Turner Valley MARCH
Mayor and Council Brent Schmitt, Acting Senior Engineer, Water Utilities and Solid Waste Net Zero Waste Contract Amendment
 Co,~~ ABBOTSFORD COUNCIL REPORT Report No. ENG 045-2015 REGULAR COUNCIL Date: November 19, 2015 File No: 5360-50-01 To: From: Subject: Mayor and Council Brent Schmitt, Acting Senior Engineer, Water Utilities
Summary of Key Results
 Attachment 1 Summary of Key Results The 2016 Waste Characterization Study involved an extensive year-long process that produced a precise estimate of waste quantity and waste composition. Methods used
15. Create a Waste Reduction and Reuse Coordinator position within the Solid Waste Management Division
 15. Create a Waste Reduction and Reuse Coordinator position within the Solid Waste Management Division 16. Provide financial support for community waste reduction and reuse initiatives 17. When the Green
Climate Action Revenue Incentive (CARIP) Public Report for 2017
 Public Report for 2017") Climate Action Revenue Incentive (CARIP) Public Report for 2017 Local Government: Thompson Nicola Regional District Report Submitted by: Name: Douglas Rae Role: Director of Finance Email: drae@tnrd.ca
Climate Action Revenue Incentive (CARIP) Public Report for 2017 Local Government: Thompson Nicola Regional District Report Submitted by: Name: Douglas Rae Role: Director of Finance Email: drae@tnrd.ca
From Rubbish to Resource for South Peace. South Peace Regional Solid Waste and Recycling Master Plan
 From Rubbish to Resource - 30+ for South Peace South Peace Regional Solid Waste and Recycling Master Plan December 2011 i EXECUTIVE SUMMARY Scope of work On behalf of City of Grande Prairie (and Aquatera
CREATING A RECYCLING SYSTEM FOR THE FUTURE ALLEN LANGDON, MANAGING DIRECTOR
 CREATING A RECYCLING SYSTEM FOR THE FUTURE ALLEN LANGDON, MANAGING DIRECTOR Who we are Recycle BC is a non-profit organization responsible for residential packaging and printed paper recycling throughout
Re: EBR # Discussion Paper on Addressing Food and Organic Waste in Ontario
 Ian Drew, Senior Policy Advisor Ministry of the Environment and Climate Change Climate Change and Environmental Policy Division Resource Recovery Policy Branch 40 St. Clair Avenue West, Floor 8 Toronto
Part 4: Floodplain, Riparian, & Lakeshore Regulations
 Part 4: Floodplain, Riparian, & Lakeshore Regulations The following additional definitions apply only to Part 4.1 of this Bylaw: DESIGNATED FLOOD means a flood as determined in this Bylaw based on the
Multi-Stream Waste and Recycling Receptacles in Recreation facilities
 Public Report To: From: Report Number: Community Services Committee Ron Diskey, Commissioner, Community Services Department CS-18-59 Date of Report: September 7, 2018 Date of Meeting: September 13, 2018
REPORT TO ENVIRONMENTAL SUSTAINABILITY COMMITTEE MEETING OF WEDNESDAY 22 SEPTEMBER 2010
 Report #ERM 10-80 REPORT TO ENVIRONMENTAL SUSTAINABILITY COMMITTEE MEETING OF WEDNESDAY 22 SEPTEMBER 2010 SUBJECT REQUEST BY THE TOWNSHIP OF ESQUIMALT FOR A MODEL BYLAW TO BAN PLASTIC SHOPPING BAGS ISSUE
3.09. Non-hazardous Waste Disposal and Diversion. Chapter 3 Section. Background. Ministry of the Environment
 Chapter 3 Section 3.09 Ministry of the Environment Non-hazardous Waste Disposal and Diversion Background Non-hazardous waste includes non-recyclable and recyclable materials (for example, paper, plastics,
Waste Management Plan Project. The goals are as follows:
 2016-2020 Waste Management Plan Project There is a lot at stake. The time has come for Gatineau to review its Waste Management Plan (RMMP) for 2016 to 2020 in order to meet the new objectives set by the
On the Road to Zero Waste
 On the Road to Zero Waste RABANCO Operator of the Roosevelt Regional Landfill, Klickitat County Gas-to-Energy System & Recycled Material Recovery Facility Award Winning Gas-to-Energy Plant Rabanco s History
City of Guelph Solid Waste Management Master Plan (SWMMP) Review Open House #2
 Review Open House #2") City of Guelph Solid Waste Management Master Plan (SWMMP) Review Open House #2 February 20, 2014 5 p.m. to 8 p.m. Delta Hotel John McCrae Room 50 Stone Road West Guelph, ON N1G 0A9 Solid Waste Management
City of Guelph Solid Waste Management Master Plan (SWMMP) Review Open House #2 February 20, 2014 5 p.m. to 8 p.m. Delta Hotel John McCrae Room 50 Stone Road West Guelph, ON N1G 0A9 Solid Waste Management
COMPACTOR COST SAVINGS MUNICIPAL CORPORATION OF THE TOWNSHIP OF ARMOUR CIF PROJECT # 1040 FINAL REPORT February 27, 2018
 COMPACTOR COST SAVINGS MUNICIPAL CORPORATION OF THE TOWNSHIP OF ARMOUR CIF PROJECT # 1040 FINAL REPORT February 27, 2018 Prepared for: Resource Productivity and Recovery Authority Continuous Improvement
Waste Packaging and Paper Stewardship Plan. Kindersley Information Session June 11, 2014
 Waste Packaging and Paper Stewardship Plan Kindersley Information Session June 11, 2014 Presentation Overview Background on EPR Multi-Material Stewardship Western Canadian Stewardship Services Alliance
Integrated Solid Waste Management Master Plan (WMMP) The City of Red Deer
 The City of Red Deer") Waste Management Master Plan (WMMP) Final Report The City of Red Deer Integrated Solid Waste Management Master Plan (WMMP) The City of Red Deer i Waste Management Master Plan (WMMP) Final Report The City
Waste Management Master Plan (WMMP) Final Report The City of Red Deer Integrated Solid Waste Management Master Plan (WMMP) The City of Red Deer i Waste Management Master Plan (WMMP) Final Report The City
PROJECT No.: DATE: May 9, 2014
 TECHNICAL MEMORANDUM TO: Brooke Carere, SLRD ACTION BY: FROM: Todd Baker, Morrison Hershfield Email: tbaker@morrisonhershfield.com CC: RE: Maura Walker, Maura Walker and Associates Technical Memo #2 -
Capital Regional Waste Minimization Advisory Committee Integrated Regional Solid Waste Management Strategy
 REQUEST FOR PROPOSAL The purpose of this RFP is to obtain professional services to prepare an Integrated Regional Solid Waste Management Strategy for the Capital Region Waste Minimization Advisory Committee
Multi-Material BC: Developing an EPR System for the Future
 Multi-Material BC: Developing an EPR System for the Future Allen Langdon, Managing Director 8 th Annual Canadian Waste Symposium April 27 th, 2016 About MMBC MMBC is a not-for-profit agency formed under
PPP Stewardship Plan Key Implementation Activities
 PPP Stewardship Plan Key Implementation Activities Presentation to Coast Waste Management Association February 28 th, 2014 Overview Overview of MMBC Recent Developments MMBC s Collection System Results
Recycling and Zero Waste
 Recycling and Zero Waste Decomposition of solid waste is a significant contributor to greenhouse gas emissions. The City of Albuquerque is taking significant steps to reduce its waste through the adoption
Introduction. We are the largest recyclers of Expanded Polystyrene in Canada. Located on United Boulevard in Coquitlam. In operation since 2011
 Introduction We are the largest recyclers of Expanded Polystyrene in Canada. Located on United Boulevard in Coquitlam. In operation since 2011 Expanded Polystyrene (EPS) Styrofoam TM a trade name owned
Technical Memo #1: Solid waste diversion (i.e. the first 3Rs: Reduce, Reuse, Recycle)
") TECHNICAL MEMORANDUM TO: FROM: Rachael Ryder Waste Diversion Program Leader Maura Walker DATE: July 6, 2015 PROJECT: Regional Solid Waste Management Plan SUBJECT: Technical Memo #1: Opportunities to Increase
TECHNICAL MEMORANDUM TO: FROM: Rachael Ryder Waste Diversion Program Leader Maura Walker DATE: July 6, 2015 PROJECT: Regional Solid Waste Management Plan SUBJECT: Technical Memo #1: Opportunities to Increase
To: Nicole Kohnert, P.Eng. Date: March 21, 2018 c: Memo No.: 3 Carey McIver, MA Tamara Shulman, BA, M.Sc.
 TECHNICAL MEMO To: Nicole Kohnert, P.Eng. Date: March 21, 2018 c: Memo No.: 3 From: Carey McIver, MA Tamara Shulman, BA, M.Sc. File: SWM.SWOP03478-01 ISSUED FOR USE Subject: Tech Memo 3 System Recap, Bylaws,
Solid Waste Management Strategy
 APPENDIX A Whistler Solid Waste Management Strategy Solid Waste Management Strategy The Resort Municipality of Whistler July 2, 2013 TABLE OF CONTENTS 1. Executive Summary... 1 1.1. Background... 1 1.2.