CHLORAMINE REPLACEMENT ALTERNATIVE EVALUATION
|
|
|
- Clarence Emil Moody
- 5 years ago
- Views:
Transcription
1 CHLORAMINE REPLACEMENT ALTERNATIVE EVALUATION DRAFT B&V PROJECT NO B&V FILE NO Black & Veatch Holding Company All rights reserved. PREPARED FOR Hannibal Board of Public Works 22 DECEMBER 2017
2 Table of Contents Executive Summary Introduction Project Overview Background Report Methodology List of Abbreviations and Acronymns Existing Facility and Operating Conditions Water Demands Raw Water Quality Raw Water TOC Finished Water Quality Finished Water TOC Existing Treatment Process Description Water Age Treatment Objectives with Free Chlorine Disinfection Target DBP Levels at DBPR Monitoring Locations Target Effluent TOC Treatment Alternatives for Reducing DBP Formation Granular Activated Carbon GAC Adsorption GAC Design Criteria Carbon Reactivation GAC Filter-Adsorbers Post-Filter GAC Contactors GAC Testing GAC Size and Media Life Estimate Reverse Osmosis Enhanced Coagulation Ozone Aeration Combination of Process Optimizations Facility Requirements for Viable Alternatives Alternative 1: Post-Filter GAC Adsorption Site Location Transfer Pumping Modifications GAC System Pressure Vessels Alternative 2: Reverse Osmosis Site Location BLACK & VEATCH Page i
3 5.2.2 Pretreatment Facility Requirements RO System Facility Requirements Post-Treatment Requirements Brine Discharge Considerations Alternative 3: Preozone with Enhanced Coagulation and Aeration Site Location Ozone Facility Requirements Enhanced Coagulation Facility Requirements Aeration Facility Requirements Cost Development Cost Criteria Capital Costs Present Worth Costs Comparision of Alternatives RECOMMENDATIONS Appendix A. Bench-Scale Testing Results GAC Adsorption Testing Rapid Small-Scale Column Testing GAC Filter Pilot Testing Enhanced Coagulation Testing Current Coagulant (DFLOC 3610) High Aluminum PACL (DFLOC 3606) Ozone Testing PreOzone Intermediate Ozone Combination of Process Alternatives Testing LIST OF TABLES Table ES-1 Present Worth Costs... 1 Table 2-1 Design Water Demand... 5 Table 2-2 Raw Water Quality... 6 Table 2-3 Finished Water Quality... 8 Table 3-1. Hannibal WTP Treatment Objectives for Disinfection Byproducts Table 3-2 Additional TOC Removal Table 4-1 Estimated Blended Effluent TOC from GAC System Table 4-2. Matrix of Enhanced Coagulation Alternatives Evaluated Table 4-3. Removal of TTHMs in Aerated Samples from On-Site Pilot Testing Table 5-1 GAC System Design Criteria Pressure Vessels Table 5-2. MF/UF System Design Parameters Table 5-3. Cartridge Filter Design Parameters BLACK & VEATCH Page ii
4 Table 5-4 RO System Design Parameters Table 6-1 Operational Costs Table 6-2 Summary of Capital Costs Table 6-3 Present Worth Costs for DBP Compliance Alternatives Table 6-4 Summary of Advantages and Disadvantages for Each Alternative LIST OF FIGURES Figure 2-1 Historical TOC Data at Hannibal WTP... 7 Figure 2-2 Raw Water TOC Concentrations Figure 2-3 Historical Finished Water TOC Data at Hannibal WTP... 9 Figure 2-4. Raw and Finished Water TOC Concentrations Figure 2-5. Hannibal WTP Process Flow Diagram Figure 2-6 Average Water Age without Ralls County Figure 2-7 Maximum Water Age without Ralls County Figure 3-1 Formation of TTHMs vs Time at Various TOC Concentrations Figure 3-2 Formation of HAA5s vs Time at Various TOC Concentrations Figure 4-1 Activated Carbon Figure 4-2. GAC Pilot Columns Figure 4-3 TOC Removal at Average Flow through One Train (Post Filter GAC) Figure 4-4 DBP Formation from GAC Pilot Plant Figure 4-5. DOC Reduction for Enhanced Coagulation Alternatives, where percent reduction is relative to baseline conditions (40 mg/l DFLOC 3610 and 20 mg/l PAC) Figure 4-6 In-line Aeration (Medora) Figure 4-7. Reduction in DOC for Combinations of Various Process Alternatives. Percentages are relative to baseline DOC of 3.2 mg/l which represents current plant operations Figure 4-8. Reduction in TTHM formation for Combinations of Various Process Alternatives. Percentages are relative to baseline TTHMs of µg/l which represents TTHM formation under current plant operations Figure 5-1. Alternative 1 Process Schematic - Post-Filter GAC Adsorption Figure 5-2. Alternative 1 GAC Site Layout Figure 5-3. Alternative 1 GAC Conceptual Layout Figure 5-4. Alternative 2 Process Schematic Reverse Osmosis Figure 5-5. Alternative 2 RO Site Layout Figure 5-6. Alternative 2 RO Conceptual Layout Figure 5-7. Alternative 3 Process Schematic Preozone, Enhanced Coagulation, Aeration Figure 5-8. Alternative 3 Site Layout BLACK & VEATCH Page iii
5 Figure A-1. TOC Breakthrough Curve for Accelerated Column Test using Filtrasorb400 (F400) and 15-min EBCT (Calgon 2017)... 2 Figure A-2. TOC Breakthrough Curve for Rapid-Scale Simulated Column Test using Filtrasorb400 (F400) and UltraCarb 1240AW with 7.5-min EBCT (October 2017)... 3 Figure A-3 Column 1 Pilot Results at 6.0 minutes EBCT (12 inches of GAC in Filters)... 4 Figure 1-4 Column 2 Pilot Results at 14 minutes EBCT (28 inches of GAC in Filters)... 5 BLACK & VEATCH Page iv
6 Executive Summary The City of Hannibal, Missouri passed an ordinance requiring that the application of chloramines (specifically the use of ammonia) at the City s surface water treatment plant be discontinued by March 31, Chloramine disinfection was implemented at the Hannibal Water Treatment Plant (HWTP) in September 2015 to meet the Environmental Protection Agency s Stage 2 Disinfection Byproduct Rule (State 2 DBPR). This study evaluates treatment alternatives and distribution system modifications that can be implemented to maintain regulatory compliance in the absence of chloramine disinfection. As a goal, treatment objectives will target 80 percent of the maximum contaminant level (MCL) for regulated disinfection byproducts (DBPs). The proposed treatment alternatives focus on the reduction of total organic carbon (TOC), which acts as a DBP precursor. It is estimated than an additional 35 to 53 percent reduction of TOC would be required to meet the treatment objectives. Bench-scale and pilot testing was conducted to evaluate the effectiveness of treatment alternatives to reduce the amount of organic carbon and reduce the formation of regulated disinfection byproducts (total trihalomethanes (TTHMs) and five regulated haloacetic acids (HAA5s)). Treatment alternatives considered under bench-scale testing included enhanced coagulation, ozone, adsorption, aeration, and reverse osmosis. These alternatives were selected as potential viable treatment methods from the results of the July 2017 report titled Chloramine Replacement Alternative Evaluation Initial Findings Report. Of the treatment alternatives available for removing organic precursors and reducing DBPs, the following have been identified as the most effective and viable options for the HWTP. Alternative 1. Post-Filter Granular Activated Carbon (GAC) Adsorption Alternative 2. Reverse Osmosis Alternative 3. Preozone with Enhanced Coagulation and Aeration Table ES-1 summarizes the capital, operational, and present worth costs for each of the alternatives. The capital cost reflects the cost of infrastructure required for the plant s rated capacity of 7.5 million gallons per day (MGD) and the O&M cost reflects the cost of operating the plant at an average flow rate of 2.9 MGD. The present worth cost evaluates the value of each alternative in today s dollars over a 25 year operating period. Description Table ES-1. Present Worth Costs for DBP Compliance Alternatives ALTERNATIVE 1 ALTERNATIVE 2 ALTERNATIVE 3 Granular Activated Carbon Reverse Osmosis Ozone + Aeration + Enhanced Coagulation Project Total w/ Owner s Contingency $14,346,000 $22,197,000 $13,204,000 Annual O&M Costs $691,000 $391,000 $377,000 Present Worth Costs (25 years) $27,837,000 $29,831,000 $20,564,000 While all of the alternatives present viable solutions for meeting DBP compliance, there are drawbacks associated with each alternative such as cost of implementation, annual operational expenses, schedule for implementation and ability to comply with referendum timeline, and limitations in the amount of data available to build confidence in the treatment solution. BLACK & VEATCH Page 1
7 1.0 Introduction 1.1 PROJECT OVERVIEW The City of Hannibal Missouri is evaluating treatment alternatives that will allow chloramines (specifically the use of ammonia) to be discontinued as part of its water treatment process and continue to meet federal drinking water regulations. Chloramine disinfection was implemented at the Hannibal s Water Treatment Plant (HWTP) in September 2015 to meet the Environmental Protection Agency s Stage 2 Disinfection Byproduct Rule (State 2 DBPR). This rule requires that four specific locations within the distribution system achieve local running annual average maximum containment levels (MCL) below 80 µg/l for total trihalomethanes (TTHMs) and 60 µg/l for five regulated haloacetic acids (HAA5s). This study evaluates various options for replacing the chloramine disinfection system with alternative systems that can achieve regulatory compliance. 1.2 BACKGROUND On April 4, 2017, voters in Hannibal passed Proposition 1, requiring the removal of ammonia from the City s drinking water supply within 90 days of adoption (which occurred on May 16, 2017). This established a timeframe for discontinuing the use of ammonia by August 15, Based on this timeframe, the Board of Public Works (BPW) retained Black & Veatch to conduct an initial evaluation of the current treatment process to determine if any feasible treatment modifications could be implemented within the 90-day timeframe to comply with the referendum while also maintaining compliance with the facility s regulatory requirements. The findings of this evaluation are included in the July 2017 report titled Chloramine Replacement Alternative Evaluation Initial Findings Report. The potential solutions evaluated were selected based on the results of the plant assessment, review of historical data, industry standards, and recommendations from previous reports, including the Granular Activated Carbon System Preliminary Engineering Report, dated February 22, 2017, prepared by Jacobs. This study outlined a number of potential alternatives for consideration and served as an initial screening evaluation to identify which treatment alternatives would have the most impact. Treatment alternatives that appeared to be the most viable underwent additional bench-scale and pilot testing needed to validate the effectiveness of the alternatives and to develop capital and operating costs. As part of the initial study, the team conducted meetings with the Missouri Department of Natural Resources (MDNR) to determine the required testing and approval process for implementing any changes to the current treatment process. Ultimately, it was determined that there were no immediate measures that could be implemented within 90 days that would assure that regulatory compliance could be maintained. As such, the City Council reevaluated the timeline in conjunction with other pertinent information presented by BPW and revised the ordinance with a new compliance date (for removal of chloramines) of March 31, BLACK & VEATCH Page 1
8 This preliminary design report expands upon the initial screening evaluation conducted in the previous reports to: Refine the treatment requirements for leading alternatives Develop opinions of probable costs and life cycle cost estimates for each alternative Recommend with the BPW input the most appropriate treatment approach to achieve compliance with the ordinance while meeting the facility s regulatory requirements. Based on the requirements of the revised ordinance, the recommendation from this report must be submitted to MDNR by March 31, REPORT METHODOLOGY Black & Veatch s Initial Findings Study (July 2017) provided an initial review of the City s potential source water alternatives, treatment alternatives, and distribution system modifications to be considered in lieu of chloramine treatment. The report included: Evaluation of alternative coagulants, oxidants and treatment processes to reduce dissolved organic carbon (DOC) and disinfection byproduct (DBP) formation. Analysis of required free chlorine contact times to achieve disinfection compliance. Evaluation of alternative water supplies from nearby aquifers and surface waters. Analysis of distribution system modeling to reduce water age in the system. The results of this initial evaluation provided a basis for recommendations on viable alternatives to be investigated further. Following the initial evaluation, additional bench-scale and pilot testing was conducted to identify viable treatment solutions to control DBP formation without the use of chloramines. As a result, treatment objectives, facility design requirements, and detailed opinion of probable cost estimates were developed for the following alternatives: Alternative 1 Post-filter Granular Activated Carbon (GAC) contactors Alternative 2 Reverse osmosis membranes Alternative 3 - Ozone addition for raw water; in combination with enhanced coagulation treatment, and distribution system aeration It should be noted that the use of chloramine as a secondary disinfectant is an approved method by the United States Environmental Protection Agency (USEPA) for controlling disinfection byproducts. Additionally, many regional utilities similar in size utilize chloramines in treatment. As a result, there is limited performance data for full-scale systems (particularly using the same raw water source) that are using methods other than chloramines to meet disinfection byproduct regulations. The evaluation presented in this report is based on preliminary engineering evaluations and extrapolation of results from bench and pilot-scale testing. Because there is a limited data associated with installations in Missouri where ozone, reverse osmosis, aeration, or GAC are being used for DBP control, there is some inherent risk that additional treatment measures may require further pilot testing to adequately confirm regulatory compliance. As such, schedule and cost data provided are subject to revision as further information becomes available and assessed against regulatory compliance. BLACK & VEATCH Page 2
9 1.4 LIST OF ABBREVIATIONS AND ACRONYMNS AACE Association for the Advancement of Cost Engineering ACT accelerated column test BPW Board of Public Works CT contact time DBP disinfection byproduct DBPR Disinfectant and Disinfection Byproduct Rule DNR Department of Natural Resources DOC dissolved organic carbon EBCT Empty Bed Contact Time GAC granular activated carbon gpm gallons per minute HAA5 - five regulated haloacetic acids HWTP Hannibal Water Treatment Plant MCL maximum containment levels MDNR Missouri Department of Natural Resources MF/UF microfiltration/ultrafiltration MG million gallon(s) mg/l milligrams per liter MGD million gallons per day nm nanometers NOM natural organic matter NPDES National Pollutant Discharge Elimination System PAC powered activated carbon PACl polyaluminum chloride RO reverse osmosis RSSCT rapid small-scale column test SCADA supervisory control and data acquisition SDI silt density index SDS simulated distribution system Stage 1 DBPR Stage 1 Disinfectants and Disinfection Byproduct Rule Stage 2 DBPR Stage 2 Disinfectants and Disinfection Byproduct Rule BLACK & VEATCH Page 3
10 SU standard units TDS total dissolved solids TOC total organic carbon THM- trihalomethanes TTHM total trihalomethanes µg/l micrograms per liter USEPA United States Environmental Protection Agency UV ultraviolet UVA ultraviolet absorbance WTP water treatment plant BLACK & VEATCH Page 4
11 2.0 Existing Facility and Operating Conditions 2.1 WATER DEMANDS Estimated future water demands were determined to establish average treatment plant flow rates for the 25 year project life. The average water demand will be used to determine annual operating costs for the alternatives being evaluated. When estimating future water use, evaluation of the system s historical water use, population projections, major water users, and national trends are considered. In 2013, the City of Hannibal conducted a water demand study (Water System Facility Plan, Horner and Shifrin). The study estimated the 2032 average day demand of approximately 3.3 million gallons per day (MGD), showing very little change in annual water usage. Included in this quantity is wholesale water supplied to Public Water Supply District No. 1 of Ralls County. This wholesale district is in the process of building its own water supply and treatment system and intends to no longer use the Hannibal supply as a wholesale water source. In 2016, the average water supplied to Ralls County was about 0.40 MGD. It is anticipated by the time this project is implemented Ralls County will no longer be served by Hannibal. Therefore, water supply to Ralls County will no longer be considered as part of the overall system requirements. Based on the available information, the design average water demand will be 3.3 MGD minus the 0.4 MGD from Ralls County that is no longer being served. Therefore, the design average flow rate for this evaluation is 2.9 MGD. The water treatment plant currently has a rated capacity of 7.5 MGD. MDNR requires that any new treatment processes be designed to effectively treat the rated capacity of the treatment plant. The BPW could elect to de-rate the capacity of the treatment plant. However, de-rating the treatment plant capacity would require flow restriction devices be implemented at the plant, and could negatively impact fire protection, growth, and system resiliency. Therefore, for the basis of this study it is recommended that each of the proposed treatment alternatives be designed for the plant s rated treatment capacity of 7.5 MGD. Table 2-1 summarizes the design flows considered in this evaluation. Table 2-1 Design Water Demand PARAMETER MINIMUM AVERAGE MAXIMUM Design Plant flow, mgd Average flow does not include Ralls County BLACK & VEATCH Page 5
12 2.2 RAW WATER QUALITY The Mississippi River is the source of supply to the treatment plant. The raw water quality from the Mississippi River can vary throughout the year which impacts the overall treatment process. Any new improvements will need to be robust enough to handle changing raw water conditions. Table 2-2 summarizes general historical raw water data from January 2011 through November Table 2-2 Raw Water Quality PARAMETER UNIT AVERAGE MAXIMUM MINIMUM 90 TH PERCENTILE Turbidity NTU Temperature Degrees F (C) 54.3 (12.4) 96.4 (35.7) 1.0 (-17.2) 78.1 (25.6) ph SU TOC mg/l Alkalinity mg/l CaCO Hardness mg/l CaCO Data from the GAC System Preliminary Report, Jacobs Raw Water TOC Total organic carbon (TOC) present in the raw water supply reacts with chlorine to form DBPs in the distribution system. The current treatment process removes a portion of TOC present in the raw water. Additional removal will be required to meet DBP regulations once chloramines are no longer used as a treatment component. To establish a benchmark for plant performance, the historical raw water TOC was evaluated. Figure 2-1 shows the TOC concentrations of the raw water to the Hannibal WTP since The figure displays variations throughout the year. The variations could be impacted by river flow, agricultural activity, and upstream vegetation. A statistical analysis was performed and the results provided in Figure 2-2. The average raw water TOC was 5.1 mg/l and 95 th percentile was 6.7 mg/l. BLACK & VEATCH Page 6
13 Figure 2-1 Historical TOC Data at Hannibal WTP Figure 2-2 Raw Water TOC Concentrations BLACK & VEATCH Page 7
14 2.3 FINISHED WATER QUALITY Finished water quality for the water treatment plant from January 2011 to November 2016 is summarized in Table 2-3 below. Table 2-3 Finished Water Quality PARAMETER UNIT AVERAGE MAXIMUM MINIMUM 90 TH PERCENTILE ph SU Alkalinity mg/l Hardness mg/l TOC mg/l Data from the GAC System Preliminary Report, Jacobs Finished Water TOC Historical finished water TOC was evaluated to establish a baseline TOC removal across the treatment process. Finished water TOC will be correlated to DBP formation in Section 3 to establish the additional treatment requirements necessary to comply with regulations once chloramines are no longer used. Figure 2-3 illustrates the historical finished water TOC concentrations from January 2005 to October Over this timeframe, finished water produced at the plant had an average TOC of 2.7 mg/l with a 95 th percentile TOC of 3.7 mg/l. The percent TOC removal across the treatment plant (i.e. from raw water to finished water) averaged 47 percent. BLACK & VEATCH Page 8
15 Figure 2-3 Historical Finished Water TOC Data at Hannibal WTP Since 2015, the plant has implemented a number of process changes that have resulted in improved TOC removal. Therefore, the historical finished water TOC since 2005 may not reflect the current treatment capabilities in regards to TOC removal. Plant staff has been collecting daily raw and finished water TOC values since January The daily concentrations are shown in Figure 2-4 below. BLACK & VEATCH Page 9
16 Figure 2-4. Raw and Finished Water TOC Concentrations Review of the 2017 data shows the average finished water TOC is 2.3 mg/l versus the historical average concentration of 2.7 mg/l. The 95 th percentile value for 2017 is 3.4 mg/l versus 3.7 mg/l from the historical information. The average raw water TOC concentration for this period was 5.5 mg/l, resulting in a 58 percent TOC removal was achieved through the plant (11 percent greater than the historical average). 2.4 EXISTING TREATMENT PROCESS DESCRIPTION Raw water is supplied to the treatment plant from the Mississippi River via an intake structure located north of downtown Hannibal. The raw water is treated with permanganate to address taste and odor causing compounds and periodically with an algaecide for algae control. Following chemical addition, the raw water enters a 3.5 million gallon (MG) pre-sedimentation basin. Powdered activated carbon (PAC) and polyaluminum chloride (PACl) coagulant are added in rapid mix chambers upstream of the primary flocculation and settling basin. Clarified water is then delivered to a secondary rapid mix, flocculation and sedimentation basin, where lime can be added for ph adjustment (if required). Additionally, operators have the ability to feed copper sulfate to the secondary basin as needed for algae control. Sodium hypochlorite and fluoride are added in a splitter structure prior to the filter feed basins, which have a total volume of 0.7 MG. The City has the capability to feed filter-aid polymer at this location; however, filter-aid polymer is not being fed at this time. From the filter feed basins, pretreated water is conveyed through four multi-media filters consisting of anthracite and sand BLACK & VEATCH Page 10
17 with a base gravel layer on top of clay tile underdrains. Under current operations, the target residual free chlorine across the filters is 0.2 mg/l. Filter effluent is pumped through ultraviolet (UV) disinfection reactors to an onsite 2.5 MG finished water reservoir. Prior to the reservoir, chlorine is added to boost the chlorine residual and ammonia is added to form chloramines. Finished water from the reservoir is then conveyed either by gravity to the low pressure zone of the system, or through high service pumps to the high pressure zone of the distribution system. The process flow diagram for the Hannibal WTP is presented in Figure 2-5. Figure 2-5. Hannibal WTP Process Flow Diagram 2.5 WATER AGE Removal of chloramines will require the system to convert back to a free chlorine residual throughout the distribution system. The long hydraulic retention time within BPW s distribution system will result in continued formation of DBPs as the water progresses through the system. Distribution system modeling was performed to estimate approximate water age at various locations within the system. The model was calibrated under late fall conditions under several operating conditions that reflect current operational system constraints. Water age was then modeled to determine the impact of removing Ralls County, a wholesale water consumer. Water age was evaluated under average water age conditions and maximum water age. Figure 2-6 and Figure 2-7 illustrate the approximate water age in various pipes throughout the distribution system for both scenarios. BLACK & VEATCH Page 11


18 Figure 2-6 Average Water Age without Ralls County BLACK & VEATCH Page 12

19 Figure 2-7 Maximum Water Age without Ralls County The modeling reveals that a large area of the distribution system has water age less than 1-2 days, even under worst case water age conditions. However, as expected, as the water moves away from the plant, specifically west and southeast, water age significantly increases. Three of the four DBP sample locations are located in high water age locations. The model shows predicted water age of about 7 days at these locations. Therefore, unless distribution modifications are incorporated, such BLACK & VEATCH Page 13
20 as flush hydrants or removal of storage, the treatment plant improvements need to provide adequate DBP precursor removal to account for at least 7 days of distribution residence time. BLACK & VEATCH Page 14
21 3.0 Treatment Objectives with Free Chlorine Disinfection The Hannibal WTP will need to modify their treatment objectives in order to comply with current regulations once free chlorine is applied in lieu of chloramines. According to the Minimum Design Standards for Missouri Community Water Systems (MDNR 2013), Hannibal BPW should maintain a minimum disinfectant residual of 1.0 mg/l leaving the plant and 0.5 mg/l at remote points in the distribution system. To maintain disinfectant residuals above the minimum 0.5 mg/l, the Hannibal WTP will target a chlorine residual of approximately 1.0 mg/l at remote locations in the distribution system. Free chlorine will result in higher DBP formation, and thus require the implementation of water treatment plant process modifications to reduce DBP precursors and/or oxidant demand to comply with regulatory standards. This section establishes the target treatment goals and in-plant treatment objectives for finished water quality within these constraints in order to establish the minimum requirements for viable treatment alternatives in lieu of chloramines. 3.1 TARGET DBP LEVELS AT DBPR MONITORING LOCATIONS The treatment objective for TTHMs and HAA5s has been established as eighty percent of the maximum contaminant levels permitted, as indicated in Table 3-1 (essentially providing a 20% factor of safety to the design criteria). Regulatory compliance requires that each of four monitoring locations maintain an annual running average less than the MCL. Since it is an average of four values taken over the four seasons, summer values may be greater than the MCL and winter conditions lower, which meets compliance so long as the average result is less than the MCL. Table 3-1. Hannibal WTP Treatment Objectives for Disinfection Byproducts PARAMETER TREATMENT OBJECTIVE (80% OF MCL) MCL Total Trihalomethanes (TTHMs) 64 µg/l 80 µg/l Five Regulated Haloacetic Acids (HAA5s) 48 µg/l 60 µg/l 3.2 TARGET EFFLUENT TOC In order to reduce DBP formation to the target levels specified above, a target effluent TOC should be established as a means for managing DBP precursors at the Hannibal WTP. In general, reducing the concentration of TOC or DBP precursors at the point of chlorination reduces the formation of disinfection byproducts in the distribution system. In some cases however, when alternative oxidants are applied, DBP formation can be reduced without necessarily reducing the concentration of TOC. The target effluent TOC (without chloramines) is based partially on historical data collected prior to the implementation of chloramine disinfection in 2015 and bench-scale testing conducted as part of this study. Bench-scale testing included adjusting the TOC concentration of filtered effluent with GAC to achieve TOC concentrations of 1.0, 1.5, 2.0 and 2.9 mg/l. The samples were then chlorinated and held for 3 to 10 days to establish DBP concentrations at various TOC BLACK & VEATCH Page 15
22 concentrations and water age. This hold period is referred to as simulated distribution system (SDS) testing and requires that the samples are held in individual amber bottles, headspace free, at room temperature, and in the dark. Results of this testing for TTHM production is shown in Figure 3-1. Similarly, results from HAA5 testing is shown in Figure 3-2. Figure 3-1 Formation of TTHMs vs Time at Various TOC Concentrations BLACK & VEATCH Page 16
23 Figure 3-2 Formation of HAA5s vs Time at Various TOC Concentrations As discussed in Section 2, the water age in the distribution system at several of the DBP compliance points is estimated to be about 7 days. Reviewing the test results show that finished water TOC of about 1.75 mg/l at 7 days (about half way between the 1.5 mg/l and 2.0 mg/l curves) is required to meet the target TTHM goal of 64 ppb. The testing showed that TOC concentrations below 2.0 mg/l would meet the HAA5 target goal of 48 ppb. Reducing the water age to 5 days lowers the TTHM concentration by about 8 ppb. Therefore, there would be some treatment advantages to install flushing hydrants and eliminating storage in the system to reduce water age. However, the overall impact to performance and treatment would be minimal, and you would most likely not see the benefit from an operational cost standpoint on treatment. In addition, reducing storage in the system impacts fire protection and reliability of the system. Therefore, these measures are not recommended at this time. Based on this information, the additional TOC removal required to meet DBP limits is listed in Table 3-2. This analysis ignores the fraction of TOC removed by the unit process as the yield of DBPs is not purely a function of the TOC. The relationship was developed based on an adsorption technology (PAC/GAC) and therefore is representative of the effluent TOC levels expected to be required by adsorption technologies. Other technologies that utilize pre-oxidation or coagulation may have slightly different outcomes. The 95 th percentile was used as the basis of worst case, maximum treatment conditions. BLACK & VEATCH Page 17
24 Table 3-2 Additional TOC Removal PARAMETER AVERAGE 95 TH PERCENTILE Historical Finished Water TOC, mg/l 2.7 mg/l 3.7 mg/l Target Finished Water TOC, mg/l 1.75 mg/l 1.75 mg/l Additional TOC Removal Required, % 35% 53% The target effluent TOC has been verified through bench-scale testing and distribution system analysis and should enable compliance with MCLs for regulated DBPs after transitioning from chloramines to free chlorine. The target of 1.75 mg/l TOC is based on average flow conditions. The target effluent TOC does not necessarily apply to treatment solutions involving alternative oxidation processes, such as ozone. Since alternative oxidation processes do not directly remove organic precursors and instead convert the organic compounds into those less prone to form DBPs, their performance cannot be measured solely on TOC removal. Therefore, alternative oxidation processes should be evaluated on their ability to meet target DBP levels in the distribution system. BLACK & VEATCH Page 18

25 4.0 Treatment Alternatives for Reducing DBP Formation This section describes the potential treatment alternatives available for reducing the concentration of disinfection byproducts after the Hannibal WTP transitions to free chlorine. The following treatment alternatives are discussed in subsequent sections. Removal of organic precursors and pre-formed DBPs through GAC adsorption. Removal of organic precursors through enhanced coagulation, powdered activated carbon, reverse osmosis and ion exchange resins. Reduction of chlorine demand through the use of alternative oxidants upstream of chlorine disinfection. Removal of THMs at the plant and in the distribution system through aeration. 4.1 GRANULAR ACTIVATED CARBON GAC is a well-known adsorbent for organics and has been widely applied in water treatment. GAC typically has a relatively high adsorptive affinity for taste and odor-causing compounds and DOC, including pre-formed DBPs. A reduction in DOC equates to a decrease in DBP precursors as described in Section GAC Adsorption Activated carbon is typically produced from coal through activation, which converts the carbon into a highly porous, graphite-based media. As shown in Figure 4-1, organic contaminants diffuse through the pores of the carbon matrix until enough adsorption bonds are formed to effectively bind the compound. As organics are adsorbed onto the carbon media, adsorption sites are consumed until the media is exhausted of its adsorption capacity at which point it must be replaced. Figure 4-1 Activated Carbon The rate and capacity of the carbon for adsorption depends on a number of factors, including adsorbent composition, particle size, pore size and the structure and size of the organic molecules targeted for removal. Bench-scale and pilot testing is usually conducted to determine these BLACK & VEATCH Page 19
26 adsorption characteristics and to evaluate the effectiveness of the treatment option for a specific water source. There are two options for integrating GAC adsorption at the Hannibal WTP. Option 1: Conversion of existing granular media filters to GAC filter adsorbers (i.e. GAC filter cap). This would involve removing a portion of the anthracite/sand media and replacing with GAC. Option 2: Installation of post-filter GAC contactors. Each of these approaches, and their applicability with respect to compliance with DBP treatment objectives at the Hannibal WTP are discussed below. It should be noted that both of these approaches would require modifications to current disinfection practices to minimize or eliminate the presence of free chlorine in the water entering the GAC absorbers/contactors GAC Design Criteria In USEPA s definition of best available technology for DBP control, the empty bed contact time (EBCT) is identified as the parameter with the greatest impact on performance for DBP control for GAC system designs. EBCT is equal to the volume of carbon media in the filter or contactor divided by the volumetric rate of flow through the filter or contactor, expressed in minutes. In general, GAC adsorption efficiency for a particular contaminant increases with increasing EBCT. MDNR has limited experience in approving post filter GAC system as they are not widely used in the state. Based on the MDNR Minimum Design Standards for Missouri Community Water System, a GAC system can be implemented after a pilot or full-scale test is conducted. MDNR requires a minimum EBCT of 10 minutes at design capacity (7.5 MGD). Further, the minimum 10 minutes should be met with at least one unit out of service. For any GAC system pilot testing should be completed prior to preparation of plans to develop breakthrough curves; to determine usage rates; to determine the optimum carbon; to confirm the optimum grain size of carbon; and to determine if 10 minute contact time is adequate Carbon Reactivation Carbon can be supplied as new material or regenerated from previously used GAC media. For drinking water applications used GAC material must come from the same treatment process and must follow a rigorous reactivation process to ensure contamination does not occur. The material must be collected at the plant and shipped to a certified regeneration facility. As such, there are limits to the savings realized for using reactivated GAC media. In general, using reactivated GAC has been shown to reduce GAC costs by approximately 20 percent as compared to using virgin GAC. However, potential cost savings are dependent on the size of the water treatment facility (and amount of GAC being regenerated) and the distance of the water treatment plant from the regeneration facility. The closest NSF-certified regeneration facility to the Hannibal WTP is in Ohio GAC Filter-Adsorbers. In addition to providing the capability to remove natural organic matter (NOM) and synthetic organics by adsorption, GAC is also an excellent filter medium for removal of turbidity and BLACK & VEATCH Page 20
27 suspended particles. Filter-adsorbers or GAC filter caps make use of this dual functionality by replacing a portion of the anthracite/sand media in the filter bed with a layer of granular activated carbon. Two options were considered for retrofitting the existing filters with GAC. Option 1 includes removal of the existing 12 inches of anthracite and replacement with GAC. Option 2 includes demolition of the existing underdrains and installation of new low profile (either stainless steel or IMS caps) that don t require support gravel to increase the GAC media depth to 28 inches. For Option 1, at the design average capacity of 2.9 MGD and peak capacity of 7.5 MGD, assuming one filter is off-line for backwashing, the EBCTs would be 6.0 minutes at average flow and 2.3 minutes at peak flow. For option 2 the EBCT increases to 14.0 minutes at average flow and 5.4 minutes at peak flow. Neither of these scenarios meet the minimum MDNR required contact time of 10 minutes Post-Filter GAC Contactors Most utilities that elect to use GAC adsorption to meet the Stage 2 DBPR requirements construct post-filtration GAC contactors in order to achieve EBCTs sufficient to provide efficient removal of DBP precursor compounds while maintaining reasonable GAC replacement intervals. Post-filter GAC can either be installed in steel pressure vessels or concrete structures. Typically, larger facilities will use concrete as it allows for larger individual contactors. For facilities sized similar to Hannibal steel vessels are typically used. GAC contactors, if implemented, would likely be designed to treat the entire filter effluent instead of a side-stream approach. Through a side-stream approach, the capital cost would be lower, but the GAC media would likely have to be replaced frequently in order to maintain the target TOC concentration in the treated water. The side-stream approach would rely on the GAC contactors to maintain a low, constant TOC concentration, resulting in replacement of the media as soon as breakthrough is seen. However, a facility designed for the full flow could still implement sidestream treatment when the media is newer and/or when lower filter effluent TOC concentrations are present. By allowing the ability to both use side-stream and full flow treatment it will lengthen the GAC media life. In any arrangement where GAC contactors are used, it is recommended that a parallel, lead-lag concept be used to treat the entire flow. For example, three parallel GAC trains could be used where one train has new GAC media, the second train is about 50 percent spent, and the third train is about 90 percent spent. The effluent from the three trains would be blended together to achieve the final TOC target in the treated water. In general, the more contactors that are used the longer each vessel can remain in treatment before being exhausted, resulting in lower overall media replacement costs (for example, if six vessels are used and the target TOC removal is 35 percent, Vessel 1 could be operated until it removed only 10 percent, Vessel 2 20%, Vessel 3-30%, and so forth, resulting in blended average of 35 percent. If only 3 vessels are used to achieve the same target removal the oldest vessel would have to be replaced sooner, when it was removing 25 percent of TOC (Vessel 1-25%, Vessel 2 35%, Vessel 3 45%)). BLACK & VEATCH Page 21
28 4.1.6 GAC Testing Bench-scale testing and pilot testing was conducted to evaluate the efficacy of GAC adsorption installed both in the existing filters and downstream of the existing filters. Testing included: Post-filter Accelerated Column Testing (ACT), conducted by Calgon Carbon Post-filter Rapid Small Scale Column Test (RSSCT), conducted by Evoqua Inc Pre-Filter and post-filter on-site pilot testing Accelerated and rapid small-scale column testing (ACT and RSSCT) were initially conducted to determine whether GAC would be a viable treatment alternative. These tests are typically conducted to evaluate GAC performance and establish breakthrough curves used to estimate life cycle costs without waiting for results in real time. Because accelerated column tests are conducted using grab samples, it is not always well-suited for predicting performance in surface water treatment plants where the influent TOC concentration varies seasonally. These tests are also typically performed when schedule does not allow for pilot testing, which can take 3 months to 2 years depending on the time it takes for breakthrough to occur. In the case of Hannibal the implementation schedule was extended with the revised ordinance date, which allowed for on-site pilot testing to be conducted. Therefore, this analysis will use the pilot results as the basis of the life cycle costs. The results of the initial RSSCT and ACT are provided in Appendix A. The results of the RSSCT and ACT showed that GAC adsorption is effective at reducing DBP precursors On-site Pilot Testing On-site pilot testing was conducted to develop a better understanding of GAC performance under varying water quality conditions representative of actual plant operations. Pilot testing was valuable for refining the TOC breakthrough curve and estimating life cycle costs of GAC treatment. Pilot testing began on August 22, 2017 and is continuing to operate. Data through November 18, 2017 is included in this evaluation. In total, four GAC columns were tested: Column 1 replicated 12 inches of GAC media depth in the existing filters with an EBCT of 3.1 minutes. Column 2 replicated 28 inches of GAC media depth in the existing filters with an EBCT of 7.1 minutes. Column 3 replicated GAC contactor downstream of the filters with 7.5 min EBCT Column 4 replicated GAC contactor downstream of the filters with a 15 min EBCT (fed from Column 3 effluent). GAC Filter Cap Pilot Testing (Columns 1 & 2) Pilot testing was conducted to simulate installation of GAC media as a filter cap on the existing filters. Results of pilot testing indicate that TOC breakthrough occurred within 10 Figure 4-2. GAC Pilot Columns BLACK & VEATCH Page 22
29 simulated days for Column 1 and 63 simulated days for Column 2. Due to the frequency of replacement and associated O&M, this alternative is not a sustainable solution for reducing TOC and controlling DBP formation. Full results from the pilot testing are provided in Appendix A. Post-Filter GAC Pilot Testing (Columns 3 & 4) Pilot testing was conducted to replicate installation of GAC in post-filter contactors. The pilot was set up in a lead-lag configuration with each pilot column sized for 7.5 minutes of EBCT. Therefore, the combined EBCT through the entire system was 15 minutes. (Columns 3 and 4) TOC removal data for both pilot columns are shown in Figure 4-5 below. Figure 4-3 TOC Removal at Average Flow through One Train (Post Filter GAC) As described in Section 3.2, the target maximum effluent TOC concentration is 1.75 mg/l. Based on the column 4 effluent TOC values, GAC breakthrough occurred after 52 days if the GAC system was sized for 15 minutes at average flow of 2.9 MGD. At the plant design flow of 7.5 MGD the EBCT would be only 5.8 minutes. Under this condition the EBCT at peak flow would not meet the minimum required contact time by MDNR, and breakthrough would occur much sooner. If the GAC system was sized for 15 minutes of EBCT at peak flow of 7.5 MGD, GAC treatment breakthrough would be expected after around 140 days based on average flow of 2.9 MGD. Since the TOC breakthrough curve was established using a single GAC contactor to treat the filter effluent, BLACK & VEATCH Page 23
30 it does not take into account operational advantages of running multiple vessels in a lead-lag configuration to achieve a blended effluent TOC that meets the treatment objective. Under a leadlag configuration, operators can utilize a staggered GAC replacement plan. With six units, media from a single GAC contactor would be replaced every 50 days, and based on this rotation the full volume of GAC would be replaced every 300 days. Additional discussion on GAC media life and life cycle cost analysis is provided in Section Pilot DBP Formation Testing After the pilot had been in operation for two months, samples from the GAC pilot Column 4 effluent were collected for evaluation of DBP formation potential. GAC effluent samples were dosed with free chlorine and stored in amber bottles for 5 days prior to lab analysis of TTHM and HAA5s. Figure 4-4 summarizes the effluent TOC and DBP formation results of the GAC pilot at 15 minutes EBCT. Figure 4-4 DBP Formation from GAC Pilot Plant There were some inconsistencies in the TTHM formation from the SDS testing which is likely the result of calibration issues with fine-tuning the applied chlorine dose required to meet the target chlorine residual. In particular the 2 nd, 4 th and 5 th data points appear to have inconsistent results for TTHM formation. For example, the data first shows exceedance of the target MCL for TTHMs at about 43 days. However, the chlorine residual after the 5 day hold in that sample was 1.76 mg/l BLACK & VEATCH Page 24
31 which exceeds the target chlorine residual of 0.5 to 1.0 mg/l. Therefore, the high chlorine residual impacted the formation for this sample. The TTHM formation at 57 and 64 simulated days of operation are relatively low compared with the TTHM results for comparable TOC and SDS holds shown in Figure 3-1. These results do not follow the general trend of increasing TTHM formation with increasing TOC and appear to be the result of dosing or measurement error. The blue dashed line illustrates a general trend line to reflect the anticipated TTHM vs time from the pilot. The data shows that at approximately 58 days with 15 minutes of EBCT the target MCL would be exceeded. This is slightly longer than the estimated TOC breakthrough of 52 days shown in Figure 4-3. Because the data represents 5 day SDS and not 7 day, an additional 10 µg/l TTHM formation is estimated to occur. Therefore, the results suggest that GAC performance at approximately 50 days resulted in conditions that formed TTHMs greater than the target goal of 64 ug/l. This outcome is nominally consistent with the TOC breakthrough appearing to be observed at 52 days (7.5 mgd) or 140 days (2.9 mgd) GAC Size and Media Life Estimate To minimize life cycle costs, an analysis was conducted to identify the optimal GAC configuration with respect to capital cost (number of GAC units) and operational costs (GAC media replacement). While installing fewer GAC vessels would reduce capital costs, it requires more frequent media replacement, increasing the annual operating costs. The annual operating costs are primarily driven by the GAC media replacement. Thus, an analysis was conducted to determine the optimal number of GAC units and estimated media replacement rate, based on the goal of maintaining a target TOC of 1.75 mg/l in the blended effluent. GAC performance data from pilot testing was used to determine the required GAC replacement frequency. Since individual contactors will undergo media replacement on a staggered schedule, the analysis takes into account effluent TOC concentrations at different media ages. The evaluation considers that GAC equipment would be sized for the maximum flow of 7.5 mgd, but that the system is operated at the average flow of 2.9 mgd. The results show that with six GAC trains, a unit replacement rate of 50 days would be required to maintain effluent TOC of 1.75 mg/l or lower. The unit replacement rate considers that one out of every six contactor trains will receive new GAC media every 50 days, resulting in full GAC media replacement every 300 days. The analysis considers that each train has two GAC vessels operated in series, sized for 625,000 gal/d with a total EBCT of 15 minutes at peak flow (7.5 minutes EBCT per vessel). If the GAC system were designed to achieve 15 minutes of EBCT under average flow conditions, this would result in a fewer number of GAC vessels and roughly half the GAC media volume. Under this operating scenario, the loading rate on each GAC vessel would increase resulting in the need for more frequent media replacement in order to achieve the same blended effluent TOC concentration. If the system were designed for average flow conditions, one out of every three GAC contactors would require media replacement every 30 days, resulting in full GAC media replacement every 90 days. Table 4-1 illustrates the estimated percent TOC removal for each train based on these two conditions. BLACK & VEATCH Page 25
32 PARAMETER Table 4-1 Estimated Blended Effluent TOC from GAC System 7.5 MGD FACILITY WITH 15 MIN EBCT 2.9 MGD FACILITY WITH 15 MIN EBCT Number of Trains 6 3 Days Between GAC Replacement per Train Estimated TOC with Staggered Replacement Train 1 TOC, mg/l Train 2 TOC, mg/l Train 3 TOC, mg/l Train 4 TOC, mg/l 2.00 Train 5 TOC, mg/l 2.15 Train 6 TOC, mg/l 2.35 Blended Effluent TOC, mg/l A target blended effluent of 1.75 mg/l TOC was used as the basis for estimating lifecycle costs. Both alternatives are based on expected operational performance at average flow rate of 2.9 MGD. Table 4-2 provides a summary of estimated GAC life cycle costs based on the six train configuration installed for a maximum treatment capacity of 7.5 MGD and operated at an average flow of 2.9 mgd, and the three train configuration for 2.9 MGD. PARAMETER Table 4-2 GAC Life Cycle Costs 7.5 MGD AT 15 MIN 2.9 MGD AT 15 MIN Design Flow Rate at 15 min EBCT, mgd Number of GAC Contactor Trains 6 3 Number of GAC Vessels per Train (operated in series) 2 2 Days Between GAC Replacement per Train Total GAC Installed with System, lbs 315, ,000 Estimated Complete Media Replacements per year Total Media Replaced per Year 385, ,000 Total Yearly GAC Media Costs, $ $620,000 $795, Annual media replacement cost is based on average flow rate of 2.9 MGD and GAC unit cost of $1.6 per lb. Although installing fewer units would reduce the initial capital costs, it would result in higher O&M costs due to increased frequency of GAC media replacement. Impacts on overall life cycle costs are BLACK & VEATCH Page 26
33 further discussed in Section 6.0. From a regulatory perspective, MDNR Minimum Design Standards for Missouri Community Water Systems requires at least 10 minutes of EBCT at the plant rated flow (7.5 MGD) for GAC systems being used for control of DBP precursors and DBP formation. If the system were sized for the average capacity of 2.9 MGD rather than the rated capacity of 7.5 MGD, the GAC system may not be able to reliably achieve the blended effluent TOC concentration of 1.75 mg/l under higher flow rates. Thus, it is recommended that the GAC system be designed for six trains with at least 10 minutes EBCT at the plant rated capacity of 7.5 MGD. The actual amount of media in each vessel is somewhat dependent on vessel manufacturers, which typically have vessels incrementally increasing by 10,000 lbs. Further discussion on optimal sizing is included in Section REVERSE OSMOSIS Reverse osmosis (RO) is a highly effective method for removing organic precursor compounds that form regulated disinfection by-products in the presence of free chlorine residual. Reverse osmosis has additional benefits of removing other constituents of concern, including total dissolved solids (TDS), hardness, and taste- and odor-causing compounds. While RO provides significant water quality benefits, there are several drawbacks to using RO membranes which often inhibits the implementation of RO technologies strictly for DBP control. Drawbacks associated with applying RO include the generation of a concentrated brine stream which creates challenges with disposal options, the need for additional pretreatment and chemical dosing, increased operational complexity, and increased energy consumption and operational costs. RO is a process that applies a semi-permeable membrane to remove dissolved inorganic and organic substances from water. Membrane recovery is limited by the concentration of certain sparingly soluble cations (barium, calcium, and silica) and anions (sulfate and bicarbonate) in the concentrate and their solubility products or metal complexes. Typical RO recoveries for surface water treatment plants range from 80 to 90 percent. In other words, 80 to 90 percent of the feed water passes through the RO membrane and is collected as permeate, while the remaining 10 to 20 percent exits the system as waste concentrate. RO membranes typically remove 95 percent to 99 percent of TDS and dissolved organic compounds. In order to meet the treatment objectives for TTHMs and HAA5s, only a portion of the plant flow would need to be treated by reverse osmosis. As part of the initial screenings evaluation, bench-scale testing was conducted to simulate RO applied to 25 percent and 50 percent of the total plant flow. Based on known rejection rates and results of bench-scale testing, it is recommended that the RO system be sized to treat 50 percent of the plant flow to achieve the target TOC and DBP levels. From a regulatory perspective, MDNR may require pilot testing prior to full-scale implementation. Potential impacts of brine discharge on the Hannibal WTP s NPDES permit are discussed in Section ENHANCED COAGULATION Another method for controlling the formation of TTHMs and HAA5s is to reduce the concentration of organic compounds prior to the addition of free chlorine. Currently, the coagulation process at the Hannibal WTP is optimized to yield low settled water turbidity to maintain acceptable filter BLACK & VEATCH Page 27
34 operations and performance. While that provides some degree of TOC removal, additional TOC can be removed from the source water through enhanced coagulation or through the use of alternative coagulants. Since the degree of TOC removal varies by coagulant type and dosage, bench-scale testing was conducted to determine whether the use of alternative coagulants or enhanced coagulation processes could improve the TOC removal efficiency. The coagulation process at the Hannibal WTP currently uses a polyaluminum chloride (PACl) coagulant and achieves about percent removal of DOC. In order to meet the treatment objective, which is 80 percent of the MCL for TTHMs and HAA5s, an additional 35 to 53 percent removal of TOC would be required. Table 4- provides a matrix of the coagulation alternatives that were evaluated through bench-scale testing. Specific details regarding the actual chemical dosages, ph conditions, and testing results are available in 7.0Appendix A. Note that all results from bench-scale testing are indicated in terms of DOC, since settled water samples were filtered through a 0.45 µm filter. TOC consists mostly of dissolved organic compounds, and as such DOC makes up approximately 90 to 99 percent of TOC. Since bench-scale testing was conducted using raw water samples collected in May, July and October 2017, bench-scale testing results provide a good representation of coagulation performance under seasonal raw water quality conditions that demonstrate both typical and challenging TOC conditions. Table 4-3. Matrix of Enhanced Coagulation Alternatives Evaluated COAGULANT Average Dose 1 COAGULANT DOSING SCHEME 1.5x Coagulant Dose 1 2x Coagulant Average Dose + Dose 1 ph Adjustment Current PACL (DFLOC-3610) X X X X High-aluminum PACL (DFLOC-3606) X X X X Ferric Sulfate X X X X 1 Dosing of alternative coagulants was conducted on a metal equivalent basis. Figure 4-5 summarizes the percent reduction in DOC observed from bench-scale testing of enhanced coagulation alternatives. Based on these results, approximately 20% removal of DOC can be achieved by doubling the plant s current coagulant dose. The relative reduction in DOC that can be achieved with the high aluminum PACl (DFLOC 3606) is fairly marginal and does not justify changing coagulants when similar level of performance can be achieved from the plant s current coagulant. BLACK & VEATCH Page 28
35 Figure 4-5. DOC Reduction for Enhanced Coagulation Alternatives, where percent reduction is relative to baseline conditions (40 mg/l DFLOC 3610 and 20 mg/l PAC) Approximately 20 percent reduction in TTHM formation is achieved by doubling the plant s current coagulant dose. An additional 7 percent reduction in TTHM formation can be achieved by changing to the high aluminum PACl with a dose of 64.7 mg/l (metal equivalent to doubling the dose of the plant s current coagulant). The plant has operated with double the coagulant dose in the past and experienced operational issues due to plugging of the filters. If enhanced coagulation is considered for DBP control, impacts on solids loading must be carefully evaluated to minimize impacts to filter operations. Since enhanced coagulation by itself cannot reduce DOC to the required levels, a more robust treatment solution involving pre-ozonation followed by enhanced coagulation was evaluated through bench-scale testing. This combination of process optimizations is described in Section OZONE Ozone is a powerful oxidant, which oxidizes organic and inorganic compounds through two pathways: (1) direct oxidation-reduction reactions with compounds present in the water and (2) spontaneous auto decomposition to form hydroxyl radical followed by oxidation of organic compounds. The organic and inorganic compounds present in the water exert an ozone demand BLACK & VEATCH Page 29
36 that must be satisfied before a residual ozone concentration is established. The rate of ozone decomposition depends on several factors including alkalinity, temperature, and the composition and concentration of NOM. When ozone is applied as a preoxidant it can reduce disinfection byproduct formation by two primary methods: (1) enhancing the removal of DBP precursors during the coagulation process and (2) oxidizing organic and inorganic compounds to reduce the total oxidant demand in primary disinfection. Ozone has additional benefits of removing taste and odor causing compounds and oxidizing iron, manganese, and other reduced inorganic compounds. The ozone demand for the raw water supply to the Hannibal WTP is established though benchscale testing. A ratio between the ozone demand and raw water TOC is used as a basis for estimating the required ozone dose. Based on preliminary bench-scale testing, an ozone demandto-toc ratio of 0.5 mg/l has been established. Since this parameter is critical to the overall facility requirements, should ozone be selected moving forward, additional bench-scale testing is recommended to further refine the required ozone dose. Ozone was tested as a preoxidant upstream of the coagulation process and as an intermediate oxidant upstream of the filter. Preozone was more effective for reducing TTHM formation with reduction rates of 24 to 30 percent, depending on influent TOC conditions and applied ozone dose. Full bench-scale testing parameters and results are provided in Appendix A. At the dosages required for preozonation, bromate formation in bench-scale samples was consistently less than 3 µg/l. Given that the MCL for bromate is 10 µg/l, bromate formation does not appear to be an issue. 4.5 AERATION This alternative considers the volatilization of pre-formed TTHMs by means of spray aerators located in the 2.5 MG finished water tank and in pipelines within the distribution system. Aeration techniques are only effective for removing volatile THMs, primarily chloroform, and are ineffective for removing HAA5s. Since the concentration of THMs in the distribution system is driving the treatment objectives, aeration, combined with another treatment alternative, could be a viable option for the Hannibal WTP. On-site pilot testing was conducted to evaluate aeration performance in the plant s high service pump station discharge. For the on-site aeration testing, a nozzle was used to aerate chloraminated finished water collected from a hydrant in the high service pipeline. Table 4-2 summarizes the percent removal of TTHMs in the aerated finished water samples. Table 4-2. Removal of TTHMs in Aerated Samples from On-Site Pilot Testing SAMPLE PERCENT REMOVAL TTHM, % Aerated Sample 1 31% Aerated Sample 2 52% Aerated Sample 3 32% BLACK & VEATCH Page 30
37 The results of the on-site pilot testing are consistent with published data, which finds that approximately 30 to 50 percent removal of TTHMs is feasible using in-tank and in-line aeration systems. Removal efficiency is dependent on several factors including the flow rate, air-to-water ratio, the water temperature and the concentration of TTHMs. Performance guarantees for TTHM removal rates available from aeration equipment suppliers are expected to range between 20 to 35 percent. MDNR has indicated that the installation of aeration may impact the plant s ability to receive disinfection credits in the plant reservoir due to reduction in contact time. Thus to minimize impacts to contact time, it is recommended that surface aerators be installed in the last two channels of the 2.5 MG reservoir, rather than in the main tank section of the reservoir. Initial discussion with MDNR has indicated this is potentially a viable solution. However, further analysis by MDNR during the pre-design stage would be required to assure separating the tank aeration zones would be acceptable. Should in-tank aeration be selected as one of the alternatives moving forward, a new CT evaluation would be required to confirm disinfection credits can be met with the installed aeration equipment. In addition to the aeration equipment installed at the plant, in-line aeration equipment is recommended to reduce TTHM levels at remote locations in the distribution system. In-line aeration is relatively new. These systems pull water out of a pipeline and use the water to spray into a vessel to release TTHMs before pumping back into the system. Figure 4-6 In-line Aeration (Medora) It is anticipated two of these systems would be required. One system would be installed off the Paris Gravel Booster Station discharge that serves the west high pressure zone, while the other system would be installed off the Southside Booster station. It is anticipated a 30 percent reduction in TTHM could be achieved using these systems. BLACK & VEATCH Page 31
38 Additional distribution system in-tank mixing and aeration are also viable to reduce overall distribution system TTHMs. MDNR review and acceptance for the plant aeration and inline aeration concepts would be required. 4.6 COMBINATION OF PROCESS OPTIMIZATIONS With exception to post-filter GAC adsorption and RO, none of the other individual process alternatives (enhanced coagulation, increased PAC dosing, ozonation or aeration) are capable of reducing TOC and DBP formation to the required levels. While each alternative showed incremental improvements to TOC or DBP formation, no individual treatment alternative was robust enough to meet the treatment objectives. Thus, additional bench-scale testing was conducted to evaluate whether a combination of process optimizations would sufficiently reduce DBP formation. The following describes the findings from bench-scale testing, which compared preozone with enhanced coagulation and preozone with increased PAC dosing. As discussed previously, results from bench-scale testing showed that up to 30 percent reduction in DBP formation could be achieved through the application of ozone upstream of the presedimentation basin. Similarly, results from bench-scale testing showed that up to 20 percent reduction in TOC and nearly 20 percent reduction in DBP formation could be achieved with enhanced coagulation. With this combined treatment approach in mind, additional bench-scale testing was conducted to evaluate treatment performance with preozone followed by enhanced coagulation. Since the addition of ozone does not reduce TOC, the viability of these treatment alternatives is based on their ability to meet the treatment objectives for DBP formation only. The scenarios evaluated for combining ozone with enhanced coagulation included: Baseline (40 mg/l coagulant, 20 mg/l PAC) Ozone (0.5xTOC) + Baseline Ozone + 1.5x baseline coagulant dose Ozone + 2x baseline coagulant dose Ozone + 1.5x baseline PAC dose Ozone + 2x baseline PAC dose Ozone + 2x baseline coagulant dose + 2x baseline PAC dose Based on the cumulative ozone demand testing, an ozone-to-toc ratio of 0.5 has been established for the raw water. Based on raw water TOC of 5.9 mg/l, an ozone dose of 3 mg/l was used for all treatment scenarios. Figure 4-7 summarizes the DOC removal rates for the combination of process improvements described above. The percent removal is relative to the baseline condition, which reflects current plant operations at the plant (average coagulant dose of 40 mg/l and average PAC dose of 20 mg/l). Under bench-scale testing for baseline conditions, the settled water DOC was measured as 3.2 mg/l. This testing showed that, when combined with a preozone dose of 3 mg/l, adjusting the coagulant dose was more effective at removing DOC than adjusting the PAC dose. The BLACK & VEATCH Page 32
39 preferred alternative based on DOC removal would be pre-ozone with double the coagulant dose, which was capable of reducing the DOC concentration by about 22 percent. Figure 4-7. Reduction in DOC for Combinations of Various Process Alternatives. Percentages are relative to baseline DOC of 3.2 mg/l which represents current plant operations. As previously mentioned, DOC reduction does not directly correlate to reduction in TTHM formation when alternative oxidation processes are applied. Therefore, DBP testing for each condition was conducted. Figure 4-8 summarizes the percent reduction in TTHM formation with respect to the baseline conditions. Results from this evaluation show an anticipated reduction in TTHM formation of about 45 percent when pre-ozone is used in conjunction with double the coagulant dose. Increasing the PAC dose beyond 50 percent of the average dose had little impact on DOC removal and TTHM reduction. Although doubling the coagulant dose and PAC dose results in the highest reduction of TTHMs, this alternative is only marginally better than the alternative that doesn t require increased PAC dosing. Thus, preozone combined with doubling of the plant s current coagulant dose is considered most effective for reducing TOC and DBP formation. BLACK & VEATCH Page 33
40 Figure 4-8. Reduction in TTHM formation for Combinations of Various Process Alternatives. Percentages are relative to baseline TTHMs of µg/l which represents TTHM formation under current plant operations. Since neither treatment combination was capable of reducing TTHMs to the target levels, aeration must be considered to provide an additional barrier for TTHM removal under more challenging water quality conditions. Aeration is expected to provide at least 20 percent removal of pre-formed TTHMs. Based on the results for preozone with enhanced coagulation and incorporating the effects of aeration, TTHMs in the range of 55 to 68 µg/l could be expected. Because bench-scale testing of each alternative was conducted over individual grab samples between May and October 2017, there are very few discrete data points from which to draw conclusions about the potential performance and reliability of this alternative under varying source water quality conditions. Additional bench-scale testing is recommended to confirm that this combination of process improvements would sufficiently reduce TTHM formation to meet the treatment objectives on a consistent basis. As mentioned in Section 4.4, it is also recommended that regular ozone bench-scale testing be conducted to develop ozone decay/demand curves and refine the required ozone dose. BLACK & VEATCH Page 34
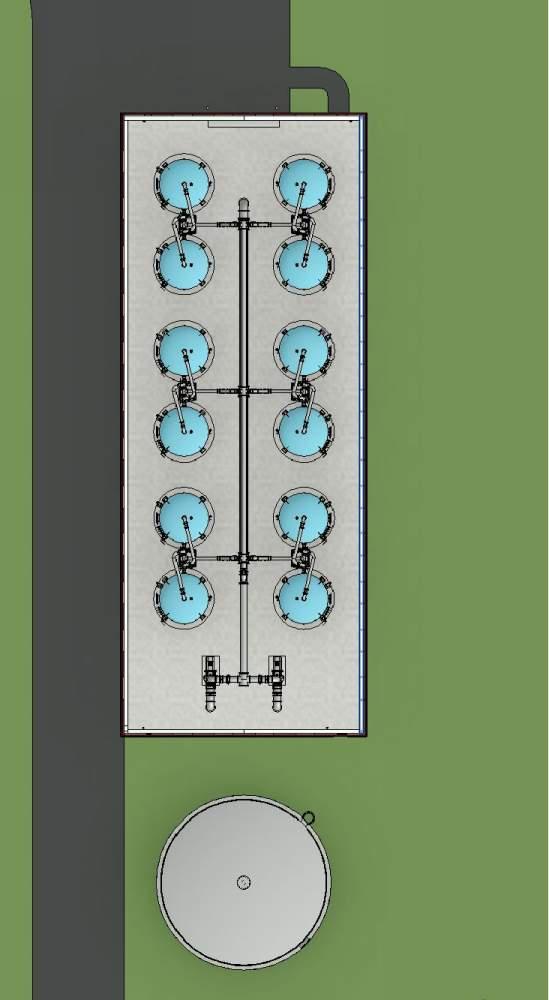
41 5.0 Facility Requirements for Viable Alternatives Of the treatment alternatives available for removing organic precursors and reducing DBPs, the following have been determined to be the most effective and viable options for the Hannibal WTP. Alternative 1. Post-Filter GAC Adsorption Alternative 2. Reverse Osmosis Alternative 3. Preozone with Enhanced Coagulation and Aeration The subsequent sections provide additional detail on the facility requirements for the proposed treatment alternatives. All of the proposed treatment alternatives are designed for average plant capacity of 2.9 MGD and peak plant capacity of 7.5 MGD. 5.1 ALTERNATIVE 1: POST-FILTER GAC ADSORPTION Based on the results of bench-scale and pilot testing, post-filter GAC vessels are a viable treatment alternative for achieving the target TOC and DBP formation with free chlorine. The new GAC system would be installed downstream of the existing transfer pumps, prior to UV disinfection and the finished water reservoir, as shown in Figure Site Location Figure 5-1. Alternative 1 Process Schematic - Post-Filter GAC Adsorption The site location for the new GAC facility would be southwest of the filter building in available area near the new generator and UV facility. This location would have to be filled as it slopes downward from the plant. Alternative locations also considered included an area north of the filter building on park property, and another area that is within the footprint of the abandoned storage reservoir. However, both of these locations appear to pose more challenges from piping and access standpoint. Therefore, these locations are not considered at this time but could be re-evaluated during detailed design to re-assess their feasibility. Refer to Figure 5.2 for location of the proposed GAC facility. BLACK & VEATCH Page 35
42 5-2


43 5-3
44 5.1.2 Transfer Pumping Modifications Currently two (2) 100 horsepower (hp) transfer pumps located in the basement of the filter room pump the filtered water from the transfer well through the UV facility and to the finished water storage reservoir. These pumps are designed specifically to raise the water to the level in the reservoir, which is approximately 50 feet in total lift. Installation of the GAC system downstream of these pumps will require additional pressure to push through the GAC vessels and associated piping. Vessel manufacturers recommend about 30 psi (70 feet) of pressure on the inlet to the vessel to account for pressure loss through the GAC and ensure proper operation, resulting in a need for larger (i.e. higher head) transfer pumps. Replacement of the existing transfer pumps with larger transfer pumps at the same location may not be feasible. The new pumps would weigh substantially more and exceed the capacity of overhead gantry crane. In addition, the pumps are currently located on an elevated slab constructed in the early 1900 s. The slab most likely will not be able to handle the additional weight and vibration of the larger pumps. Overall space and power availability also make replacing these pumps difficult. Therefore, new transfer pumping is required. There are a number of potential approaches to this, as outlined below. One transfer pumping alternative would be to concrete core through the north wall of the transfer well and divert the flow to a new transfer well and pump station. The pump station would be located just north of the new GAC Building. The pipeline and transfer well would have to be about 25 feet below grade to maintain the same hydraulic elevations as the existing transfer well. Another alternative would be to leave the existing transfer pumps where they are and divert the flow to new booster pumps that would raise the pressure adequate to push through the GAC system. Typically, inline pumping where flow goes directly from one pump to another is challenging and not recommended. It can be difficult to maintain set pressures and flow rates, even with variable frequency drives. Therefore, an equalization tank located prior to the new GAC feed pumps is recommended for this alternative. For the basis of this evaluation, the equalization tank and booster pumps will be used given that coring the sidewall of the transfer well poses risks to the structural stability of the existing transfer well. In addition, the plant can only be off-line for a few hours to make the connection. The anticipated cost for this alternative would most likely be more than the booster pumping alternative. The size of the equalization tank is approximately 120,000 gallons to equal one hour of storage at average flow conditions. This tank can also supply the backwash to the GAC system GAC System Pressure Vessels Based on the testing the GAC system will be sized for at least 15 minutes of EBCT at peak flow. This will provide assurance that the target removals can be achieved at peak flow conditions, but also provides greater reliability and flexibility to manage GAC material. For the current plant capacity of 7.5 mgd, post-filter GAC contactors would be done using modular rubber-lined steel GAC vessels. GAC vessels are typically designed to hold at least a full 20,000 lb bulk GAC delivery, and can be larger, typically in 10,000 lb increments, to optimize delivery. In order to achieve an EBCT of 15 minutes at a maximum flow rate of 7.5 MGD, approximately twelve BLACK & VEATCH Page 36
45 GAC steel contactors (each 12 feet in diameter) would be required. A minimum of 26,000 lbs would be required for each vessel. Therefore, 30,000 lb vessels would be required under this condition. Two GAC configurations were considered. One alternative includes larger vessels that run in parallel, each sized for at least 15 minutes of EBCT at peak flow. The other alternative is installing multiple treatment trains with each train consisting of two vessels interconnected in series. The total EBCT of each train would be 15 minutes at peak flow. The advantage of the larger vessels in parallel is primarily construction costs as it requires less vessels, valves, and piping. However, it provides less functionality and flexibility during treatment to target a specific effluent TOC concentration. Therefore, more frequent carbon replacements are required for this alternative. The two vessels in series combination provide additional flexibility for treatment as it allows the first vessel to be exhausted prior to impacting the second vessel. By sampling between the two vessels a lead/lag approach can be used by utilizing the higher performing vessel first. This typically extends the life of the GAC and reduces the risk of breakthrough. Therefore, for the basis of this design concept, a series approach (with two vessels) will be used. An estimate of overall GAC media life based on this configuration is included Section 4.1. Regular backwashing of the GAC contactors is not anticipated due to typically very low turbidity of filtered water. Any small amount of accumulated solids would be removed during routine replacement of spent GAC from the lead GAC contactor. Occasional backwashing of the lead contactor could be performed between media replacement if needed, without dramatically reducing the efficiency of GAC usage in the lead-lag configuration. Typically, the full vessel volume is filled with media. Therefore, installing 12-30,000 lb vessels would actual result in longer EBCT than 15 minutes, approximately 17 minutes at peak flow. Reducing the vessel size to 20,000 lbs could be considered. For 12-20,000 lbs vessels the EBCT at peak flow is about 11.4 minutes. This still meets the minimum MDNR requirement of 10 minutes of EBCT, and would be effective for meeting treatment goals but would require more frequent media replacement. For the basis of this evaluation, the 12-30,000 lb vessels will be used. However, an evaluation to determine possible capital cost savings of reducing the size of the vessels versus long term operational costs and system resiliency should be conducted during detailed design if this alternative is selected. The backwash water will be supplied by the existing backwash tank using a dedicated backwash pump. A second connection to the GAC feed pumps will also be provided if the pump is out of service. Backwash wastewater will be disposed of to the existing backwash drain to the river. A revised NPDES permit will be required to adjust the flow quantities and water characteristics in the existing discharge. The GAC equipment and booster pumps will be housed in a single story building matching the architecture of the plant. A 24 inch influent and effluent header will be installed down the center of the building that will supply each vessel through an 8 inch influent/effluent pipe. A dedicated 8 inch backwash supply and 12 backwash drain pipe header will also be routed down the center of the building. BLACK & VEATCH Page 37
46 The interior of the GAC vessel has a conical shape to facilitate unloading of spent GAC media, which is then hauled away. Replacement GAC is then fed into the steel vessel as a slurry using a plant water supply. Replacement GAC is typically delivered in bulk trailers or hopper trailers, which are operated by GAC supplier staff and fitted with the equipment required for loading a GAC vessel. Table 5-1 summarizes the design parameters for the GAC system. Table 5-1 GAC System Design Criteria Pressure Vessels FACILITY COMPONENT VALUE Number of GAC Trains 6 Treatment Capacity per Train 1.25 MGD GAC Contactor Units per Train 2 Diameter (each) 12 ft Surface Loading Rate Average Maximum Media depth per Contactor Min GAC Media per Contactor (29.5lb/cu-ft) Contactor Size, each 3.0 gpm/sq ft 7.7 gpm/sq ft 92 inches 26,000 lbs 30,000 lbs EBCT, Total per Train Average Maximum Shell Height Approximate Overall Height 38 minutes 15 minutes 108 inches 20 ft Backwash System Backwash Rate (maximum) Flow Rate 15 gpm/sq ft 1700 gpm 5.2 ALTERNATIVE 2: REVERSE OSMOSIS Reverse osmosis would be another viable alternative for DBP reduction. RO systems typically reject percent of the dissolved organic compounds that can form DBPs in the presence of free chlorine residual. Given that the filter effluent TOC at the Hannibal WTP averages 2.7 mg/l with 95 th percentile of 3.7 mg/l, the RO system would need to be sized to treat about 50% of the total finished water flow in order to meet the target TOC of 1.75 mg/l. The RO system would be installed downstream of the gravity filters and would require additional pretreatment and chemical systems to minimize fouling of the RO membranes. Additionally, post- BLACK & VEATCH Page 38
47 treatment chemical addition may be required to stabilize the finished water and avoid corrosive conditions in the distribution system. Figure 5- shows the systems and location for the proposed RO system. Figure 5-4. Alternative 2 Process Schematic - RO System Site Location The site location for the new RO facility would be southwest of the filter building in available area near the new generator and UV facility, similar to the GAC Facility. Refer to Figure 5.5 for location of the proposed RO facility. An equalization tank similar to the GAC system would be recommended prior to the membrane feed pumps to facilitate operational control. BLACK & VEATCH Page 39


48 5-5
49 5-6
50 5.2.3 Pretreatment Facility Requirements A pretreatment system consisting of membrane filtration is recommended upstream of the RO system to improve the quality of the RO feed water. Microfiltration (MF) and ultrafiltration (UF) membrane filters remove colloidal particles from water by straining it through a porous membrane. Both processes are capable of reliably producing filtrate with exceptionally low turbidity and low Silt Density Index (SDI), often below 0.05 NTU and 3, respectively. Maintaining a low SDI value is important for RO operations. Refer to Figure 5-6 for Facility Layout. Design parameters for the proposed MF/UF pretreatment system are summarized in Table 5-2. The size of the MF/UF system will depend on RO recovery, which may range between 80 percent and 90 percent. For estimating the MF/UF system design requirements, an RO recovery of 85 percent is assumed. Table 5-2. MF/UF System Design Parameters PARAMETER VALUE Net Filtrate Total Flow Rate, mgd 4.41 Number of units 3 duty, 1 standby MF/UF Recovery, % 97% Design Flux, gfd 60 Maintenance Wash Chemical Maintenance Wash Frequency CIP Cleaning Regiment CIP Cleaning Frequency Sodium hypochlorite 48 hours Sodium hydroxide, Citric Acid, Sodium Hypochlorite 30 days RO System Facility Requirements Filtrate from the MF/UF system will be conveyed to a new RO Feed Tank. Low pressure RO feed pumps will transport water from the feed tank, through cartridge filters that protect the membrane from accidental small particles, to the suction side of the feed pump on each RO unit. Three RO trains configured in parallel are included in this evaluation. RO feed water will be dosed with sodium metabisulfite to remove any residual free chlorine, which would damage the RO membrane. Additionally, the RO feed water will be dosed with anti-scalant and sulfuric acid to prevent scaling of the RO membranes. New chemical storage and feed systems will be required for sodium metabisulfite, sulfuric acid and anti-scalant, as well as for chemicals periodically used for cleaning of the RO units. BLACK & VEATCH Page 40
51 Table 5-3. Cartridge Filter Design Parameters PARAMETER VALUE Number of Cartridge Filter Units 3 duty Cartridge Filter minimum pore size 5 µm Cartridge Filter loading rate 3 gpm/10 equivalent Expected replacement rate 4-6 months The RO permeate will be blended with effluent from the existing gravity filters. While the average water demand is 2.9 mgd, the Hannibal WTP is designed for a maximum treatment capacity of 7.5 mgd. Since the plant will rarely operate at maximum capacity, the RO system is designed without redundancy. Table 5-4 RO System Design Parameters PARAMETER Total Permeate Flow Number of units Unit Permeate Flow VALUE 3.75 mgd 3 duty 1.25 mgd Estimated RO Recovery, % 85% Design Flux, gfd 12 CIP Cleaning Chemical CIP Cleaning Frequency Citric Acid, Sodium Hydroxide 3-4 months Post-Treatment Requirements While RO provides the benefit of reducing the concentration of total dissolved solids in the finished water, the RO permeate will have a ph of about 5.5 with hardness and alkalinity values of less than 10 mg/l as CaCO 3. To minimize concerns about distribution system water quality and potential for corrosion, the RO permeate must be stabilized. Post-treatment chemicals, such as sodium hydroxide or sodium bicarbonate, may be applied directly to the RO permeate prior to blending with filter effluent or on the blended finished water. Additional water quality data and analysis would be required to refine post-treatment chemical dosing to yield a finished water with corrosion index values that are compatible with historic values in the existing distribution system. Bench-scale testing may also be required by MDNR to confirm the level of corrosion control treatment needed to minimize potential changes to distribution system water quality. BLACK & VEATCH Page 41
52 5.2.6 Brine Discharge Considerations Based on initial mass balance calculations, the RO concentrate flow would be 0.56 mgd at maximum plant capacity and 0.22 mgd at average plant capacity. Assuming 95 percent concentrate and 85 percent recovery, the concentration factor in the RO concentrate stream would be a factor of 6.4, meaning that the concentration of dissolved compounds in the RO concentrate would be 6.4 times the concentration in the RO feed. Based on preliminary discussions with MDNR, it may be feasible to blend the RO concentrate with the existing plant residuals and discharge to the Mississippi River. However, a new degradation study would be required to confirm that the RO concentrate could be discharged to the Mississippi River. The degradation study would consider mixing conditions at the current discharge location to evaluate brine dispersion and determine whether there would be any aquatic species adversely affected. Included with this alternative is a RO concentrate equalization basin to allow the potential blending of backwash and concentrate flow prior to discharging to the river. 5.3 ALTERNATIVE 3: PREOZONE WITH ENHANCED COAGULATION AND AERATION The final alternative involves a multi-treatment approach for meeting the treatment objectives for DBP formation, consisting of pre-ozonation, enhanced coagulation, and aeration in the finished water storage reservoir and distribution system. Figure 5-7 shows the process components impacted by this alternative. Figure 5-7. Alternative 3 Process Schematic - Preozone with Enhanced Coagulation and Aeration Site Location A new ozone generation facility would be constructed east of the presedimentation basin, near the 2.5 MG finished water reservoir. The ozone solution would be dosed into the existing raw water piping, using the existing head structure as an ozone contact basin. Coagulant would continue to be dosed at the Primary Flocculation & Settling Basin using existing chemical storage and feed equipment. New aeration equipment would be installed in the existing finished water storage tank BLACK & VEATCH Page 42


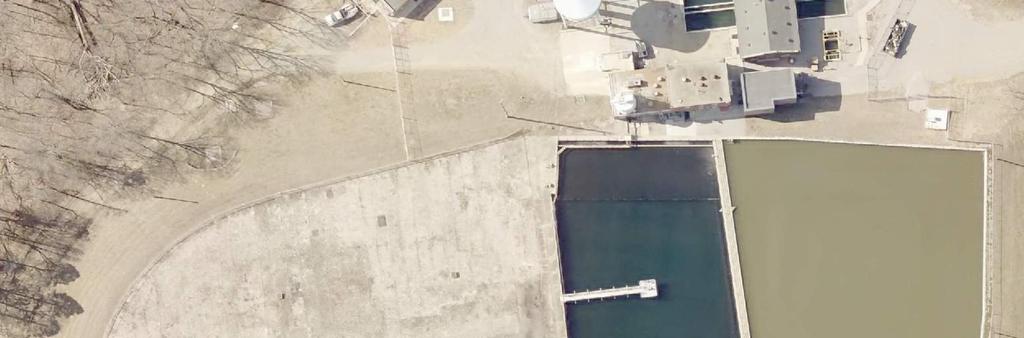

53 5-8
Hannibal Chloramine Replacement Evaluation
 Hannibal Chloramine Replacement Evaluation 19 DECEMBER 2017 Project Update Ben Freese Karen Marie Dietze Agenda Project Timeline DBP Treatment Objectives Recap Initial Findings Report Alternative 1: Granular
ATTACHMENT A TO THE AGREEMENT FOR ENGINEERING SERVICES. Project: Chloramine Replacement Alternative Evaluation
 ATTACHMENT A TO THE AGREEMENT FOR ENGINEERING SERVICES Owner: Board of Public Works, City of Hannibal, Missouri Project: Chloramine Replacement Alternative Evaluation DESCRIPTION OF SCOPE OF SERVICES On
Granular Activated Carbon System
 Granular Activated Carbon System Eliminating Use of Chloramines March 22, 2017 www.jacobs.com worldwide The Jacobs Team Mike McCarty, PE Project Manager Tobin Lichti, PE Water Treatment Engineer Russ Dahmer,
Comparing Carbons for Disinfection Byproduct Control. Maggie H. Pierce, EI Sara N. Gibson, PE Mark M. Bishop, PE David S.
 Comparing Carbons for Disinfection Byproduct Control Maggie H. Pierce, EI Sara N. Gibson, PE Mark M. Bishop, PE David S. Briley, PE Water JAM 2010 Overview Introduction Considerations for Granular Activated
THIS POLICY DOES NOT HAVE THE FORCE OF LAW
 THIS POLICY DOES NOT HAVE THE FORCE OF LAW Guidelines for evaluating granular activated carbon (GAC) for disinfection by-product (DBP) precursor removal Division: DDAGW Number: ENG-09-001 Category: Engineering-
Disinfection By-Products
 Disinfection By-Products Meeting the Challenge of Compliance with USEPA DBPR Stage 2 PA AWWA 64 th Annual Conference May 2-4, 2012 T. Mike Sudman City of Celina Todd W. Hone City of Celina Cheryl L. Green
Comparing the Leopold Clari-DAF System to Upflow Contact Clarification
 JUST ADD WATER Comparing the Leopold Clari-DAF System to Upflow Contact Clarification James E. Farmerie Product Manager The F. B. Leopold Co., Inc. 227 South Division Street Zelienople, Pennsylvania 16063
Process Treatment Selection and. Jeff Macomber, P.E. One Water Conference August 28, 2014
 Process Treatment Selection and Design for the City of Piqua s New WTP Jeff Macomber, P.E. One Water Conference August 28, 2014 Agenda Project Background Water Treatment Goals Process Treatment Alternative
HSGAC: A Site Specific Granular Activated Carbon Model Design Tool
 HSGAC: A Site Specific Granular Activated Carbon Model Design Tool Mark Bishop, PE, Hazen and Sawyer Allison Reinert, EIT, Hazen and Sawyer Erik Rosenfeldt, PE, PhD, Hazen and Sawyer Ben Stanford, PhD,
Expanding Capacity and Treatment. Treatment Plant
 Dublin Road Water Plant Treatment Capacity Increase Project Expanding Capacity and Treatment at an 80 MGD Surface Water Treatment Plant Enoch Nicholson, P.E. S. Dean Ramsey, P.E. CH2M HILL Mark Eppich,
DBP Treatment Strategies. Learning Objectives. DBP Control Options Optimize existing facilities
 DBP Treatment Strategies Workshop developed by RCAP/AWWA and funded by the USEPA Learning Objectives Describe treatment strategies to address DBP formation Evaluate the various strategies to choose the
Mike Nixon, E.I. Phil Locke, P.E.
 First-of-It s Kind Industrial Ion Exchange Process Brings Municipal Potable Water Treatment Facility into Full Regulatory Compliance Mike Nixon, E.I. Phil Locke, P.E. Agenda Background Treatment Alternatives
Treating Cyanotoxins with Granular Activated Carbon
 Treating Cyanotoxins with Granular Activated Carbon Ralph Franco PE Calgon Carbon Corporation Director Municipal Products Kendra Ryan Calgon Carbon Corporation Municipal Applications Engineer Slide 1 Presentation
THM Analysis From Compliance to Optimization
 THM Analysis From Compliance to Optimization Kazi Hassan Ph.D. Senior Engineer (Water) April 20, 2015 Disinfection Byproducts (DBP) Disinfection byproducts are formed when disinfectants used in water treatment
With the deadlines for Stage 2 Disinfectants
 FWRJ Stage 2 DBP Considerations: Comparison of DBP Formation and Treatment Efficiencies for Different Source Waters Stephen Glatthorn, James Christopher, Jonathan Bundy, and Jarrett Kinslow With the deadlines
FROM RAW WATER INTAKE TO DISTRIBUTION NETWORK: THE JOURNEY OF DBP CONTROL
 FROM RAW WATER INTAKE TO DISTRIBUTION NETWORK: THE JOURNEY OF DBP CONTROL Jane Xiaojie Gan, E.I.T., Porter Rivers, P.E. URS, 101 Research Drive, Columbia, SC 29203 ABSTRACT The Chester Metropolitan District
Water distribution systems throughout
 FWRJ Innovative and Cost-Effective Ways to Improve Water Quality Using Distribution System Models Kelcia Mazana and Migdalia Hernandez Water distribution systems throughout Florida are facing distribution
DW Module 23: Organic Removal Answer Key
 DW Module 23: Organic Removal Answer Key EXERCISE UNIT 1: Use the Word Box above to complete questions. Words used twice are indicated with a (2). Word Box Air Stripping (2) Adsorption (2) Boiling Carbon
The U.S Environmental Protection
 FWRJ Distribution System Water Quality Models Support Treatment Process Decisions Brandon Bryant, Michael Harber, and Robert Dehler The U.S Environmental Protection Agency (EPA) has estimated that over
Dipti Shah, Town of Gilbert Tuesday, January 25, 2011
 Dipti Shah, Town of Gilbert Tuesday, January 25, 2011 Background Treatment Plant Water Treatment Process Filter types Experiments Results Review Historical BAF /Non- BAF data Conclusion Recommendation
Side by Side Piloting of Process Alternatives Yields Direct Performance Comparison
 OBG PRESENTS: OBG PRESENTS: Side by Side Piloting of Process Alternatives Yields Direct Performance Comparison LORI W. REID, P.E. New York State AWWA Spring Meeting, April 26, 2017 Outline Background Project
Utility Partner Data Report
 Utility Partner Data Report Project Title: Studying Distribution System Hydraulics and Flow Dynamics to Improve Water Utility Operational Decision Making Water Distribution System: Nicholasville, Kentucky
Innovative Improvements to a 53-Year Old Water Plant for HABs, Crypto, and Whatever Else the Maumee River Brings
 Innovative Improvements to a 53-Year Old Water Plant for HABs, Crypto, and Whatever Else the Maumee River Brings Robert T. Shoaf, P.E., BCEE AECOM (Columbus, Ohio) Scott Hoover, Plant Superintendent Napoleon,
WEFTEC.06. Lake Okeechobee, Actiflo, peroxone, surface water, Cyanobacteria
 FRESH IDEAS FOR FRESH WATER: OKEECHOBEE UTILITY AUTHORITY S SURFACE WATER TREATMENT PLANT USES INNOVATIVE TECHNOLOGY TO ACHIEVE HIGH QUALITY DRINKING WATER FROM LAKE OKEECHOBEE By: Curtis Robinson, E.I.
Aeration Strategies for TTHM Control
 Aeration Strategies for TTHM Control Chad Seidel, Ph.D., P.E. Stephen Acquafredda, P.E. Damon S. Williams Associates, LLC AZWA Water Treatment Committee Seminar Series Water System Optimization Tuesday,
Disinfection By-Products Reduction and SCADA Evaluation and WTP Sludge Removal System and Dewatering Facility
 SOUTH GRANVILLE WATER & SEWER AUTHORITY Disinfection By-Products Reduction and SCADA Evaluation and WTP Sludge Removal System and Dewatering Facility Presentation to the SGWASA Board October 10, 2017 TTHM
Removing Algal Toxins from the Toledo Tap
 Removing Algal Toxins from the Toledo Tap Warren Henry City of Toledo Nick Burns Black & Veatch Agenda Lake Erie, 2011 Background on algal toxins Concerns Treatment Effectiveness Toledo Experience Summary
SYSTEMATIC APPROACH TO WATER TREATMENT PLANT PROCESS OPTIMIZATION
 SYSTEMATIC APPROACH TO WATER TREATMENT PLANT PROCESS OPTIMIZATION Alex Yavich, Ph.D., P.E. Optimization Solutions Environmental, LLC WATERCON 2012 Optimization Solutions Environmental, LLC Water Treatment
Policy and Planning to Address Impacts of Forest Fires to Source Water Quality. Troy Hayes, P.E. Water Services Deputy Director (Water Quality)
") Policy and Planning to Address Impacts of Forest Fires to Source Water Quality City of Phoenix Troy Hayes, P.E. City of Phoenix Water Services Deputy Director (Water Quality) October 28, 2011 Story Table
Policy and Planning to Address Impacts of Forest Fires to Source Water Quality City of Phoenix Troy Hayes, P.E. City of Phoenix Water Services Deputy Director (Water Quality) October 28, 2011 Story Table
TTHM Reduction Corrective Action Update 1 st Progress Meeting October 18, Robert Horvat, P.E x1501
 TTHM Reduction Corrective Action Update 1 st Progress Meeting October 18, 2016 Robert Horvat, P.E. rhorvat@entecheng.com 800 825 1372 x1501 Tri County Joint Municipal Authority background Why are we here?
THE BOSSIER CITY WATER TREATMENT PLANT (Background and Current Process Layout )
") THE BOSSIER CITY WATER TREATMENT PLANT (Background and Current Process Layout - 2018) PLANT HISTORY The Bossier City Water Treatment Plant was built in 1958. The original plant had a treatment capacity
THE BOSSIER CITY WATER TREATMENT PLANT (Background and Current Process Layout - 2018) PLANT HISTORY The Bossier City Water Treatment Plant was built in 1958. The original plant had a treatment capacity
UNIT WELL 15 VOLATILE ORGANIC COMPOUND (VOC) MITIGATION
 MITIGATION") BUILDING A WORLD OF DIFFERENCE UNIT WELL 15 VOLATILE ORGANIC COMPOUND (VOC) MITIGATION Madison Water Utility Madison, Wisconsin Black & Veatch Corporation B&V Project 169092.0800 B&V File 41.0800 Black
BUILDING A WORLD OF DIFFERENCE UNIT WELL 15 VOLATILE ORGANIC COMPOUND (VOC) MITIGATION Madison Water Utility Madison, Wisconsin Black & Veatch Corporation B&V Project 169092.0800 B&V File 41.0800 Black
Disinfection Byproducts in the Drinking Water What Does it Mean and What is Being Done
 Disinfection Byproducts in the Drinking Water What Does it Mean and What is Being Done Existing Water System What Are Disinfection Byproducts (DBPs)? DBPs are formed when disinfectants used in water treatment
Balancing Microbial Control and Stage 2 DBP Rule Compliance (at Ocean City, Maryland)
") Balancing Microbial Control and Stage 2 DBP Rule Compliance (at Ocean City, Maryland) May 4, 2012 Presented by: Earl Swartzendruber, Jr., PE Whitman, Requardt and Associates, LLP Acknowledgements Town
Balancing Microbial Control and Stage 2 DBP Rule Compliance (at Ocean City, Maryland) May 4, 2012 Presented by: Earl Swartzendruber, Jr., PE Whitman, Requardt and Associates, LLP Acknowledgements Town
MAKING THE SWITCH FROM LIME TO MEMBRANE SOFTENING: WHEN IS IT THE RIGHT TIME? Introduction
 MAKING THE SWITCH FROM LIME TO MEMBRANE SOFTENING: WHEN IS IT THE RIGHT TIME? Joseph R. Elarde CH2M HILL 5801 Pelican Bay Blvd., Suite 505 Naples, FL 34108 joe.elarde@ch2m.com 239-431-9225 Jeff Poteet,
Utility Partner Data Report
 Utility Partner Data Report Project Title: Studying Distribution System Hydraulics and Flow Dynamics to Improve Water Utility Operational Decision Making Water Distribution System: Paris, Kentucky Project
UTILIZING AN ON-LINE TTHM ANALYZER TO AID IN COMPLIANCE WITH DBP REGULATIONS
 UTILIZING AN ON-LINE TTHM ANALYZER TO AID IN COMPLIANCE WITH DBP REGULATIONS SHARON FILLMANN OPERATIONS & WATER QUALITY MANAGER MAY 7, 2014 1 Disinfection By-Product Formation DBPs Naturally-Occurring
Online THM Analyzer Integral to City of Benicia s Stage 2 DBPR Compliance Strategy
 Online THM Analyzer Integral to City of Benicia s Stage 2 DBPR Compliance Strategy Author: Scott Rovanpera, Superintendent, City of Benicia Water Treatment Plant, srovanpera@ci.benicia.ca.us or Tel: +1
INITIAL OPERATIONAL EVALUATION REPORT TREATMENT PROCESSES AND FINISHED WATER QUALITY CITY OF TYLER, TEXAS TABLE OF CONTENTS EXECUTIVE SUMMARY...
 INITIAL OPERATIONAL EVALUATION REPORT TREATMENT PROCESSES AND FINISHED WATER QUALITY CITY OF TYLER, TEXAS TABLE OF CONTENTS EXECUTIVE SUMMARY... ES-1 I. OBJECTIVES... 1 II. REGULATORY BACKGROUND... 1 III.
EVALUATING NANOFILTRATION, REVERSE OSMOSIS, AND ION EXCHANGE TO MEET CONSUMPTIVE USE CONSTRAINTS AND FINISHED WATER QUALITY GOALS FOR BROWARD COUNTY
 EVALUATING NANOFILTRATION, REVERSE OSMOSIS, AND ION EXCHANGE TO MEET CONSUMPTIVE USE CONSTRAINTS AND FINISHED WATER QUALITY GOALS FOR BROWARD COUNTY Frank A. Brinson, P.E., DEE, CDM, Fort Lauderdale, FL
Ohio Section AWWA NW District Fall Meeting April 20, City of Delaware Water Plant Improvements
 April 20, 2016 City of Delaware Water Plant Improvements 1 NW District Fall Meeting April 20, 2016 Delaware Water Plant Project Overview Converted 6.0 MGD Lime Softening Plant to 7.2 MGD Ultrafiltration
Village of Skaneateles Cyanotoxin Treatment Evaluation. Edwin C. Tifft Jr. Water Supply Symposium Erica Goldin September 20, 2018
 Village of Skaneateles Cyanotoxin Treatment Evaluation Edwin C. Tifft Jr. Water Supply Symposium Erica Goldin September 20, 2018 Outline 1 2 3 4 5 6 7 Village of Skaneateles Water System Emerging Contaminants
Disinfection By-Products Reduction and SCADA Evaluation and WTP Sludge Removal System and Dewatering Facility
 SOUTH GRANVILLE WATER & SEWER AUTHORITY Disinfection By-Products Reduction and SCADA Evaluation and WTP Sludge Removal System and Dewatering Facility Presentation to the SGWASA Board December 12, 2017
Submerged Membranes to Replace Media Filters to Increase Capacity 4X for a Small Community. Richard Stratton, PE HDR Engineering, Inc.
 Submerged Membranes to Replace Media Filters to Increase Capacity 4X for a Small Community Richard Stratton, PE HDR Engineering, Inc. Main Points of this Presentation Membranes can provide 4 times the
Performance of GAC Filter-Adsorbers for Herbicide and DBP Control at Higginsville,, MO
 Performance of GAC Filter-Adsorbers for Herbicide and DBP Control at Higginsville,, MO Robert L. Segar Jr., Ph.D., P.E. Department of Civil and Environmental Engineering University of Missouri-Columbia
Table of Contents. 0.0 Executive Summary Potable Water Demand Projection Introduction... 35
 Table of Contents 0.0 Executive Summary... 1 1.0 Potable Water Demand Projection... 6 1.1 Introduction... 6 1.2 Service Area... 7 1.2.1 Service Area Development... 7 1.2.2 Service Area Population... 7
Amherst, MA, Drinking Water System
 Amherst, MA, Drinking Water System Atkins Water Treatment Plant Planned by: Ad Hoc Citizen s Advisory Committee, Amherst DPW and Consultant (Tighe & Bond, Inc) Water Source: Atkins Reservoir Design Flow:
WRF Webcast Biofilter Conversion Guidance Manual
 No part of this presentation may be copied, reproduced, or otherwise utilized without permission. WRF Webcast Biofilter Conversion Guidance Manual March 28, 2017 Biofiltration: Defining Benefits and Developing
Treatment Processes for Potable Water
 Treatment Processes for Potable Water Drinking Water Potable water is water that is free of harmful chemicals, microorganisms, and other contaminants and is safe to drink Drinking water also should be
Zero Liquid Discharge Project Extends Potable Water Supplies
 http://dx.doi.org/10.5991/opf.2014.40.0078 Ryan R. Popko, PE, and Phillip J. Locke, PE, are with McKim & Creed (www.mckimcreed.com), Clearwater, Fla. Fred J. Greiner is with the city of Palm Coast, Fla.
Disinfection and Disinfection Byproducts (DBP)
") Disinfection and Disinfection (DBP) 1 Regulatory Requirements for Disinfection By-Product Management & Disinfection By-Product Monitoring for Water Treatment Plants 2 DPB Rule Requirements Rule/Requirement
Disinfection and Disinfection (DBP) 1 Regulatory Requirements for Disinfection By-Product Management & Disinfection By-Product Monitoring for Water Treatment Plants 2 DPB Rule Requirements Rule/Requirement
Table of Contents. LIST OF FIGURES Figure 2-1 Simplified Process Flow Diagram for Sweeney WTP... 3
 Table of Contents Executive Summary... 1 1.0 Introduction... 3 2.0 Background... 3 2.1 Sweeney Water Treatment Plant... 3 2.2 Treatment Goals... 4 3.0 Pilot Testing Summary... 7 4.0 Process Technology
Seasonal Source Water Quality and Treatment Challenges Town of Newburgh s Chadwick Lake Filtration Plant
 Seasonal Source Water Quality and Treatment Challenges Town of Newburgh s Chadwick Lake Filtration Plant Clayton Johnson GHD Kevin Castro GHD James Osborne Town of Newburgh Image placeholder Outline Introduction
ACHIEVING STAGE 2 DBPR COMPLIANCE THROUGH SYSTEM OPTIMIZATION AND EFFICIENT USE OF POST-FILTRATION GAC: A 5 YEAR CASE STUDY
 ACHIEVING STAGE 2 DBPR COMPLIANCE THROUGH SYSTEM OPTIMIZATION AND EFFICIENT USE OF POST-FILTRATION GAC: A 5 YEAR CASE STUDY AMANDA WILLIAMS (CO-WRITER: PETER THOMPSON JR.) WATER QUALITY SUPERVISOR PALMDALE
THIS POLICY DOES NOT HAVE THE FORCE OF LAW
 THIS POLICY DOES NOT HAVE THE FORCE OF LAW GUIDELINES FOR TREATMENT PROCESS Division: DDAGW RATINGS AT PRECIPITATIVE (e.g.,lime) Number: ENG-02-001 SOFTENING GROUND WATER Category: Final TREATMENT PLANTS
St. John the Baptist Parish
 St. John the Baptist Parish Conceptual Engineering of Mississippi River Water Source for LaPlace March 26, 2015 digital engineering 1 Major Water System Components Conceputalized Laplace Water System New
Removal of 1,4-Dioxane from Groundwater Using Advanced Oxidation
 Removal of 1,4-Dioxane from Groundwater Using Advanced Oxidation Lynn Stephens, PE Co-authors: Erin Mackey, PhD, PE Bill Persich, PE Presentation Roadmap What s 1,4-Dioxane? Project Introduction Bench-scale
A SIMPLE METHOD OF REMOVING DISINFECTION BYPRODUCT PRECURSORS IN WATER
 A SIMPLE METHOD OF REMOVING DISINFECTION BYPRODUCT PRECURSORS IN WATER Tony Robles Town of Kirkland Lake WTP roblest@ntl.sympatico.ca Overall Responsible Operator 705-642-5626 Operator-In-Charge Abstract
Drinking Water Treatment Overview Filtration and Disinfection
 Drinking Water Treatment Overview Filtration and Disinfection April 16 th, 2009 Yousry Hamdy, M.Sc., P.Eng Nicolás s Peleato, EIT 1 Table of Contents Introduction Filtration Cartridge filters Chemical
WATER TREATMENT PLANT ALTERNATIVES EVALUATION
 WATER TREATMENT PLANT ALTERNATIVES EVALUATION Final Report B&V PROJECT NO.183262 Black & Veatch Holding Company 2015. All rights reserved. PREPARED FOR City of Ann Arbor 24 AUGUST 2015 City of Ann Arbor
Pilot Testing Reveals Alternative Methods to Meet Wisconsin s Low Level Phosphorus Limits
 Pilot Testing Reveals Alternative Methods to Meet Wisconsin s Low Level Phosphorus Limits Rachel M. Lee 1*, Jane M. Carlson 1, Jeremy Bril 2, Jeremy Cramer 3, Jeff Harenda 4 1 Strand Associates, Inc.,
NJWA Presents DISINFECTION BYPRODUCTS: TREATMENT OPTIONS & CHALLENGES. Stage 2 D/DBPR. Trihalomethanes DISINFECTION BYPRODUCTS.
 NJWA Presents DISINFECTION BYPRODUCTS: TREATMENT OPTIONS & CHALLENGES Donald C. Kucher Chlorinator & Instrument Service, Inc. Hampton, NJ 908-735-2303 email cl2fixd@aol.com www.cl2fixd.com Stage 2 D/DBPR
DBP Reduction and SCADA Improvements at the SGWASA Water Treatment Plant
 To: From: South Granville Water and Sewer Authority Lindsay Mize, Executive Director Fred Dancy, Utilities Director David Briley, PE Gary Iversen, PE Alana Loughlin, PE Dan Edwards, PE DBP Reduction and
Summary of Pilot Plant Results and Preliminary Recommendations
 scwd 2 Desalination Program Informational Meeting Summary of Pilot Plant Results and Preliminary Recommendations Presented by: Paul Meyerhofer, CDM September 24, 2009 Pilot Plant Overview Pilot plant was
Meeting Manganese Removal Goals: A Pilot Study
 Meeting Manganese Removal Goals: A Pilot Study Amy Gao, Russell Ford, David Best and Manthos Tsotsos PA AWWA Annual Conference Thursday, May 12, 2016 Background Oswestry WTW Owned and Operated by United
CEE 371 Water and Wastewater Systems
 Updated: 22 November 2009 CEE 371 Water and Wastewater Systems Print version Lecture #26 Atkins WTP: Plant Tour Reading: Handout (Dumais et al., 1994) David Reckhow CEE 371 L#26 1 Bus to Atkins WTP Pick
A Comprehensive Performance Evaluation (CPE) Approach to Addressing HABs
 Approach to Addressing HABs") A Comprehensive Performance Evaluation (CPE) Approach to Addressing HABs CPE Participants U.S. EPA: Alison Dugan, Tom Waters, Rich Lieberman, Craig Patterson, Val Bosscher Process Applications, Inc.: Larry
A Comprehensive Performance Evaluation (CPE) Approach to Addressing HABs CPE Participants U.S. EPA: Alison Dugan, Tom Waters, Rich Lieberman, Craig Patterson, Val Bosscher Process Applications, Inc.: Larry
Approved Capacity. March 2010
 March 2010 Approved Capacity Planning and Design Criteria for Establishing Approved Capacity for: 1) Surface Water And Ground Water Supply Sources, 2) Drinking Water Treatment Plants (WTPs), and 3) Source/WTP
Avon Lake Corrosion Control Study and Orthophosphate Implementation. Andrew Skeriotis, Stantec Greg Yuronich, Avon Lake Regional Water
 Avon Lake Corrosion Control Study and Orthophosphate Implementation Andrew Skeriotis, Stantec Greg Yuronich, Avon Lake Regional Water Agenda 1 History and Background of Avon Lake 2 Lead and Copper in Water
New England Water Treatment Technology Assistance Center
 New England Water Treatment Technology Assistance Center University of New Hampshire Durham, New Hampshire P R O J E C T S U M M A R Y R E P O R T Assessment of Various Pretreatments and Packaged Construction
Summary of Flint s Implementation of Veolia s Recommendations
 Summary of Flint s Implementation of Veolia s Recommendations A comparison between Veolia s Technical Recommendations vs. EPA Findings On March 12, 2015, Veolia delivered its final report to Emergency
Tiffin Water Treatment Plant. Comprehensive Facility Plan (Audit)
") 2014 HDR Architecture, 2014 2014 HDR, HDR, Inc., all all rights reserved. Tiffin Water Treatment Plant Comprehensive Facility Plan (Audit) May 2016 Jim Welty Aqua Ohio Jill Marie P.E. Rich Atoulikian P.E.
2014 HDR Architecture, 2014 2014 HDR, HDR, Inc., all all rights reserved. Tiffin Water Treatment Plant Comprehensive Facility Plan (Audit) May 2016 Jim Welty Aqua Ohio Jill Marie P.E. Rich Atoulikian P.E.
Improvement of Drinking Water Plant Treatment
 Improvement of Drinking Water Plant Treatment A. ZOUBOULIS 1, *, G. TRASKAS 1 AND P. SAMARAS 2 1 Department of Chemistry, Division of Chemical Technology Aristotle University, Thessaloniki GR-541 24, Greece
City of Woodbury. Red Bank Water Treatment Plant - Treatment Alternatives Analysis November 2016
 City of Woodbury Red Bank Water Treatment Plant - Treatment Alternatives Analysis November 2016 Background Remington & Vernick was authorized to study and design a treatment process for removal of PFC
Water Treatment Overview. Gabe Sasser December 2016
 Water Treatment Overview Gabe Sasser December 2016 Topics of Discussion Source Water Information Treatment Plants (History and Capacity) Water Quality Water Treatment Process Distribution System Conservation
Overcoming Challenges to Achieve Optimization at the Crown Water Treatment Plant. Barbara Martin AWWA Mark Petrie Cleveland Water
 Overcoming Challenges to Achieve Optimization at the Crown Water Treatment Plant Barbara Martin AWWA Mark Petrie Cleveland Water Outline Partnership for Safe Water Background Program Phases Crown Water
Reverse-osmosis membranes were
 Benefits and Limitations of Utilizing A Raw-Water Blend Stream to Meet Production and Quality Goals at a Membrane Facility James E. Christopher Reverse-osmosis membranes were initially applied to the removal
Integrating Ozone and Ion Exchange into a 40 Year Old Lime Softening Plant
 Integrating Ozone and Ion Exchange into a 40 Year Old Lime Softening Plant City of Columbus Division of Water: Matt Steele CH2M HILL: Enoch Nicholson DRWP Source Water and Treatment DRWP Overview Current
Optimizing Filter Conditions for Improved Manganese Control During Conversion To Biofiltration [Project #4448]
![Optimizing Filter Conditions for Improved Manganese Control During Conversion To Biofiltration [Project #4448]](/thumbs/72/67094758.jpg "Optimizing Filter Conditions for Improved Manganese Control During Conversion To Biofiltration [Project #4448]") Optimizing Filter Conditions for Improved Manganese Control During Conversion To Biofiltration [Project #4448] ORDER NUMBER: 4448 DATE AVAILABLE: May 2016 PRINCIPAL INVESTIGATORS: Chance V. Lauderdale,
Optimizing Filter Conditions for Improved Manganese Control During Conversion To Biofiltration [Project #4448] ORDER NUMBER: 4448 DATE AVAILABLE: May 2016 PRINCIPAL INVESTIGATORS: Chance V. Lauderdale,
Online Organics Monitoring for Rapid Process Control of Drinking Water and Wastewater Treatment Operations
 Online Organics Monitoring for Rapid Process Control of Drinking Water and Wastewater Treatment Operations Amanda Scott Suez Water Technologies & Solutions 2018 ISA Water/Wastewater & Automatic Controls
Cary/Apex Water Treatment Facility- Ozone Biofiltration Pilot Study
 Cary/Apex Water Treatment Facility- Ozone Biofiltration Pilot Study March 26, 2018 Judith Labrada Bill Dowbiggin, PE Agenda Project Background Project Drivers Why CAWTF considered a change? What is Ozone
Ready, Set, and Go: Deer Valley WTP East Basins Performance Testing, Start-Up, and Commissioning Toby Teegerstrom Brian Watson
 Ready, Set, and Go: Deer Valley WTP East Basins Performance Testing, Start-Up, and Commissioning Toby Teegerstrom Brian Watson January 25, 2011 Presentation Outline Background Process Overview Start-Up
Controlling Trihalomethanes and the Costs Associated with their Minimization using Automated On-Line Monitoring with the THM-RR system
 Controlling Trihalomethanes and the Costs Associated with their Minimization using Automated On-Line Monitoring with the THM-RR system Gary L. Emmert Professor and Chair Department of Chemistry The THMs
In-Reservoir TTHM Surface Aeration: A year of results, experience and lessons learned
 In-Reservoir TTHM Surface Aeration: A year of results, experience and lessons learned Jeanne M. Jensen, P.E. Steve Acquafredda, P.E. Jacobs Engineering Group, Inc. February 2, 2012 Presentation Outline
AD26 Systems for Iron, Manganese, Sulfide and Arsenic Removal
 AD26 Systems for Iron, Manganese, Sulfide and Arsenic Removal Technical Bulletin 2004-02 rev0707 Q: What is the AdEdge AD26 System? A: The AD26 system is a pre-engineered, packaged treatment system specifically
Renovation of the Filters at the Soldier Canyon Filter Plant in Fort Collins, Colorado
 JUST ADD WATER Renovation of the Filters at the Soldier Canyon Filter Plant in Fort Collins, Colorado Thomas M. Getting, P.E., DEE, Filtration Product Manager John Geibel, P.E., Chief Engineer Michael
Robert T. Shoaf, P.E., BCEE Presented by John Krinks, PE
 Nitrate and/or TOC Removal by RO Membranes, Anion Exchange and GAC Case Studies Robert T. Shoaf, P.E., BCEE Presented by John Krinks, PE 52 nd Annual OTCO Water Workshop Columbus, OH March 4 th -5 th,
2017 Water Quality Report
 217 Water Quality Report PREPARED BY: JEFFREY D. BURKHARD LAKE TOWNSHIP WATER SYSTEM SUPERINTENDENT FEBRUARY 28, 218 LAKE TOWNSHIP WATER SYSTEM PO Box 818 Bridgman, MI 4916 269-465-385 Contents SDWA...
Chromium-6 Drinking Water Regulation Workshop. Presented by: Steve Bigley & Mark Johnson
 Chromium-6 Drinking Water Regulation Workshop Presented by: Steve Bigley & Mark Johnson AGENDA Introductions Chromium-6 New Regulation Compliance Options/Costs Customer Input CHROMIUM (Cr) 21 st most abundant
Hydrogen sulfide (H2S), is now regulated
, is now regulated") FWRJ Seminole County Markham Regional Water Treatment Plant: Regulatory Compliance Considerations, Treatment Challenges, and Solutions Roberto Gonzalez, John Reed, Kevin Friedman, Mike Cliburn, Tim Brodeur,
FWRJ Seminole County Markham Regional Water Treatment Plant: Regulatory Compliance Considerations, Treatment Challenges, and Solutions Roberto Gonzalez, John Reed, Kevin Friedman, Mike Cliburn, Tim Brodeur,
SECTION 6.0 DESIGN CRITERIA, LAYOUTS, & HYDRAULICS
 SECTION 6.0 DESIGN CRITERIA, LAYOUTS, & HYDRAULICS This project focused on evaluating conventional ozone and Peroxone for meeting the Zone 7 T&O destruction goals. Conventional ozone refers to a standard
CITY OF ST. LOUIS Water Quality Report 2016
 CITY OF ST. LOUIS Water Quality Report 2016 In compliance with the Safe Drinking Water Act, the City of St. Louis Water Division is delivering this Water Quality Report to all its customers who receive
Treatability Study and Reverse Osmosis Pilot Study of Industrial Wastewater at a Wood Products Mill
 Treatability Study and Reverse Osmosis Pilot Study of Industrial Wastewater at a Wood Products Mill NC AWWA-WEA 2017 Annual Conference Randall Foulke, PE, BCEE, LEED AP Tracey Daniels, EI November 14,
Pilot Study Report. Z-92 Uranium Treatment Process
 Pilot Study Report for Z-92 Uranium Treatment Process conducted at the Mountain Water & Sanitation District, Conifer, Colorado Revised November 11, 4 Page 2 Executive Summary Mountain Water & Sanitation
Water Treatment Plant Year-end Report for 2014
 Water Treatment Plant Year-end Report for 2014 Water demand The total influent volume of water drawn from the Assiniboine River for treatment was approximately 6.03 % higher in 2014 than in 2013. 2013
LT1ESWTR Disinfection Profiling and Benchmarking
 LT1ESWTR Disinfection Profiling and Benchmarking Technical Guidance Manual Log Inactivation 1.400 1.200 1.000 0.800 0.600 0.400 0.200 0.000 Log Inactivation 0 4 8 12 16 20 24 28 32 36 40 44 48 52 Week
TREATING BRACKISH WATER IN SANDOVAL COUNTY FEBRUARY 19, 2010
 TREATING BRACKISH WATER IN SANDOVAL COUNTY FEBRUARY 19, 2010 Project Background Sandoval County drilled two exploratory wells in 2007 in Rio Puerco Basin/SE portion of San Juan Basin Penetrated brackish
Mitigation of Bromate during Ozonation
 Mitigation of Bromate during Ozonation John C. Crittenden, Ph.D., P.E., N.A.E. Daisuke Minakata Arizona State University Zaid K. Chowdhury A Malcolm Pirnie Perspective 1 Outline Application of ozone to
Optimizing Four-Log Virus Treatment with Chemical Disinfection Relative to the Disinfectants and Disinfection Byproducts Rule
 FWRJ Optimizing Four-Log Virus Treatment with Chemical Disinfection Relative to the Disinfectants and Disinfection Byproducts Rule Frank A. Brinson, Norm Wellings, and Donald Bayler Regulatory Review Stage
REAL WORLD APPLICATIONS OF USING DYNAMIC SIMULATION SOFTWARE TO OPTIMIZE WATER TREATMENT PLANT PROCESS OPERATIONS
 REAL WORLD APPLICATIONS OF USING DYNAMIC SIMULATION SOFTWARE TO OPTIMIZE WATER TREATMENT PLANT PROCESS OPERATIONS (FRIT05) OCTOBER 30, 2015 Authors: Matt Ridens/CH2M, Jason Curl/CH2M Overview Drivers for