Evaluating the impacts of land use changes on hydrologic responses in the agricultural regions of Michigan and Wisconsin
|
|
|
- Irma Harvey
- 5 years ago
- Views:
Transcription
1 Evaluating the impacts of land use changes on hydrologic responses in the agricultural regions of Michigan and Wisconsin A. P. Nejadhashemi 1, B. J. Wardynski 1, J. D. Munoz 2 1 Department of Biosystems & Agricultural Engineering, Michigan State University, East Lansing, MI 48824, U.S.A., 2 Department of Crop and Soil Sciences, Michigan State University, East Lansing, MI 48824, U.S.A. Correspondence to: A. P. Nejadhashemi (pouyan@msu.edu)
2 Abstract. Hydrologic fluxes in the Great Lakes region have been altered relative to pre-settlement conditions in response to major land use changes during the past 150 years. One of the goals of the present work is to develop a baseline scenario relative to which the impacts of land use changes on hydrological and environmental processes can be evaluated. In addition, the study can help in quantifying the potential impacts of future projected changes in land use in order to mitigate the negative impacts of these changes specially in regard to shift towards second generation bioenergy crop production derived from lignocellulosic crops and urbanizations. The present study explores the relationship between land use changes and hydrologic indicators within the agricultural regions of Michigan and Wisconsin. Two sets of land use data, the Circa 1800 County Base and the 01 National Land Cover Dataset, were used to setup the Soil and Water Assessment Tool (SWAT) model. First, sensitivity analyses were performed both based on pre-settlement and current land use scenarios. Results showed that parameter sensitivity analysis may not always explain how the variation in model output can be attributed to different sources of variation in the model input. Therefore, attention should be taken to determine the true importance of sensitive parameters by considering their placement in model algorithms. Then, the model was calibrated against measured daily stream flow data obtained from eight United States Geological Survey gauging stations. The impacts of land use changes were studied at three scales: Subbasin-level, watershed-level, and basin-level. At the subbasin level, most of the hydrologic behavior can be described by percent change in land cover. However, the trend was more apparent for landuse conversion from mixed forest to urban and agriculture lands than other landuse conversions. At the watershed scale, significant differences were observed based on the long-term average hydrologic fluxes under the current and pre-settlement scenarios. In addition, an increase in evapotranspiration (up to 16.5%) and surface runoff (up to 93.9%) contribution to stream flow, decrease in recharge to aquifers (up to %) and baseflow (up to -50.1%), and mixed impacts on water yield were detected (-21.5% to 24.6%). However, at the basin-level, more than 70% of the study area experienced decreased in lateral subsurface flow and recharge to aquifers, while 65% of the area experienced increased overland flow and minor changes in evapotranspiration and water yield.
3 Introduction Land cover plays a key role in controlling the hydrologic response of watersheds in a number of important ways (Schilling et al., 08; Mao and Cherkauer 09; Elfert and Bormann, 10; Elfert et al., 10; and Ghaffari et al., 10). Changes in land cover can lead to significant changes in leaf area index, evapotranspiration (Mao and Cherkauer 09), soil moisture content and infiltration capacity (Fu et al., 00; Costa et al., 03), surface and subsurface flow regimes including baseflow contributions to streams (Tu, 09) and recharge, surface roughness (Feddema et al., 05), runoff (Burch et al., 1987), as well as soil erosion through complex interactions among vegetation, soils, geology, terrain and climate processes. Furthermore, land use modifications can also affect flood frequency and magnitude (Ward et al., 08; Remo et al., 09; Benito et al., 10; Qiu et al., 10) and regional climate (Wang et al., 06; Kueppers et al, 07;Paeth et al., 09). Significant changes in land cover have occurred in the Great Lakes region over the last 150 years including a major decrease in the forest cover and changes in composition from hardwood and conifer types to successional species such as aspen. Considerable progress has already been made in understanding the linkages between climate change and land use changes and their interactions (Copeland et al., 1996). Recently, Mao and Cherkauer (09) examined the effects of land use change on hydrologic responses in the Great Lakes basin using the Variable Infiltration Capacity (VIC) model. They examined the changes in annual average fluxes of evapotranspiration (ET), total runoff, soil moisture and snow water equivalent (SWE) between current and pre-settlement land uses as well as the geographic shifting of center of gravity for each vegetation class. They reported an increase (relative to pre-settlement land use) in total runoff and SWE in more than half of their study area. Since land use and climate change often influence the hydrology in complex ways exhibiting thresholds and positive or negative feedbacks among processes, it may be an insufficient task to study these effects in isolation. Based on a 25-year experiment conducted in small Iowa watersheds with and without conservation tillage, Tomer and Schilling (09) proposed a method to distinguish the hydrologic effects of land use change from climate change. Examining the increasing stream flow trends in the US Midwest watersheds, they conclude that climate change has been the larger of the two drivers since land use changes have plateaued in the agricultural regions of the Midwest since the 1970s. Johnston and Shmagin (08) examined historical stream flow trends in the Great Lakes region using empirical orthogonal functions and principal component and factor analyses and identified five regions of the US Great Lakes basin with statistically distinct stream discharge patterns. One of the five distinct regions identified in their work is the predominantly agricultural region in the lower peninsula of Michigan and northern Wisconsin. Of the five regions, this is the only region that exhibited the consistent trend of increasing annual stream discharges for the period (the period of their study). In view of the importance of the agricultural regions of the Midwest and their role in contributing to the Gulf of Mexico hypoxia, detailed watershed modeling and analysis are needed including an assessment of how land use changes at different scales (e.g., from the hydrologic response unit to the basin scale) have influenced the hydrologic responses in this region. This is one of the objectives of this paper. A careful review of the literature indicated that land use change impact assessments on runoff have mainly been done through small-scale catchment experiments and 3
4 10 40 varying results have been obtained, including opposing findings. For example, opposing results were reported concerning the impacts of deforestation on water yield. While Hibbert (1967) showed significant relationship between deforestation and increased in water yield, Langford (1976) study showed no relationship (Hundecha and Ba rdossy, 04). Relative impacts of different land use types on surface water have not yet been established and quantified, especially for large watersheds (Tong and Chen, 02; Qi et al., 09). Mechanisms underlying the impact of land use/land cover changes on hydrological processes (Wang et al., 07) are not fully understood. Field data and experiments have the potential to demonstrate the consequences of land use change, but modeling studies are more likely to reveal the key mechanisms (Li et al., 07). Few studies regarding hydrologic sensitivity assessments of current and historic land use data at the large scale have been conducted. Therefore, case studies are needed in representative regions to understand the underlying mechanisms and to establish theory regarding the effects of land use and land cover changes on hydrologic processes. The aim of this paper is to examine the effects of land use change on hydrologic fluxes at both local and regional scales, under finer and more detailed resolution then existing studies, such as Mao and Cherkauer (09). In particular, the objectives are to: (a) determine how land use has changed in the agricultural regions of Michigan and Wisconsin area over a period of 0 years (b) perform a hydrologic sensitivity assessment (c) quantify the magnitudes of hydrologic responses to land use changes and (d) test the Soil and Water Assessment Tool (SWAT) for modeling the hydrologic variability within the agricultural regions of Michigan and Wisconsin due to land use change. The results from this study are expected to aid the effort of managing land use changes to achieve sustainable water resources goals. 2. Material and Methods 2.1 Study Region This focus of this paper is on the predominantly agricultural regions of Michigan and Wisconsin. Watersheds in nine accounting units were selected, which include hydrologic unit code (HUC) (Wisconsin), 0401 (Northwestern Lake Michigan), (Southwestern Lake Michigan), 0402 (Fox), (Wisconsin portion of Rock), (Southeastern Lake Michigan), (St. Clair-Detroit), (Southwestern Lake Huron), and (Saginaw). The study area is shown in Fig. 1. The study area covers 122,924 km 2 (Fig. 1), which includes nine HUC 6 digit watersheds (Table 1). Crop production is the main land usage (47.0 percent) for the study area. Forest is the second largest land usage at 23.5 percent. Wetlands, urban, rangeland and water areas constitute the remaining 29.5 percent of land cover (NLCD, 01). Based on pre-settlement land use data obtained from Michigan Natural Features Inventory, Original Vegetation Cover of Wisconsin, and Land Cover of Illinois for the early 1800 s, the area of interest has gone though a significant land use changes in the past 0 years. The forested areas were removed in a massive scale. More than 6.3 million hectares of forest land (51.4% of total area), 0.47 million hectares of wetlands (3.8% of total area), and 0.49 million hectares of rangeland (4.0% of total area) were lost mainly to agricultural production and urbanization (Table 1). 2.2 Model Description SWAT is a physically-based, computationally efficient model that is well-suited for studying the large-scale impacts of land use changes as described in a series of papers based on the LUCHEM 4
5 10 40 (Land Use Change on Hydrology by Ensemble Modeling) project (Breuer et al., 09). SWAT has gained international acceptance as a robust watershed model as evidence by hundreds of peer-reviewed and conference publications. In addition, the model has been widely used by federal and state agencies (Gassman et al., 07). The model was designed to predict the impact of land management practices on water, sediment, and agricultural chemical yields in watersheds with varying soils, land use, and management practices over long time periods. Components of the model include weather, hydrology, soil characteristics, plant growth, nutrients, pesticides, and land management (Gassman et al. 07). In SWAT, a watershed is divided into subbasins, which are further divided into hydrologic response units (HRUs) based on similar land use, soil distribution, and slope. Hydrology components of SWAT include canopy storage, infiltration, redistribution, evapotranspiration, lateral subsurface flow, surface runoff, ponds, tributary channels, and return flow. Based on daily precipitation, runoff, evapotranspiration, percolation, subsurface return flow, groundwater flow, and changes in water storage, a daily water budget in each HRU is calculated (Nelson et al., 06). In the following section, different components of the water budget in the SWAT model will be discussed. Surface Runoff: Two methods for estimating surface runoff are provided in SWAT: The SCS curve number procedure (SCS, 1972) and the Green & Ampt infiltration method (1911). In this study, the SCS method was used. In addition, peak runoff rate is calculated with a modified rational method. The SCS curve number method estimates surface runoff from daily rainfall using initial abstractions (surface storage, interception, and infiltration prior to runoff) and a retention parameter (varies based on changes in soil, land use, management, and slope as well as temporarily due to changes in soil water content). Evapotranspiration: Potential evapotranspiration (PET) is the volume of water that can be evaporated and transpired if enough water is available. SWAT estimates daily PET using one of three methods requiring varying inputs: Penman-Monteith, Hargreaves, or Priestly-Taylor. Daily PET values obtained from monitoring can also be incorporated into the model. However, since observed PET values were not available, daily PET values were estimated using the Penman- Monteith method. After PET is determined, actual evaporation is calculated. Rainfall intercepted by the plant canopy is evaporated first. Next, maximum amount of transpiration and sublimation/soil evaporation will be estimated. Actual amount of sublimation and evaporation from the soil is then calculated. Sublimation occurs if snow is present in an HRU, although nosnow conditions must be in effect for evaporation from the soil to occur (Neitsch et al., 05). Soil Water Relationship: Water that enters the soil may move along various pathways, including: removal from soil by plant uptake or evaporation, percolation past the soil profile to become aquifer recharge, or lateral movement in the profile and contribute to streamflow. SWAT uses a kinematic storage model developed by Sloan et al. (1983) to estimate lateral subsurface flow. This model simulates subsurface flow in a two-dimensional cross section along a flow path down a steep hill slope. SWAT uses storage routing methodology to calculate percolation for each soil layer in the profile. If the soil is frozen during the simulation period, percolation in the soil layer is equal to zero (Neitsch et al., 05). Groundwater: The groundwater system in SWAT consists of shallow and deep aquifers. Shallow aquifer water balance consists of recharge entering the aquifer, groundwater flow, or base flow 5
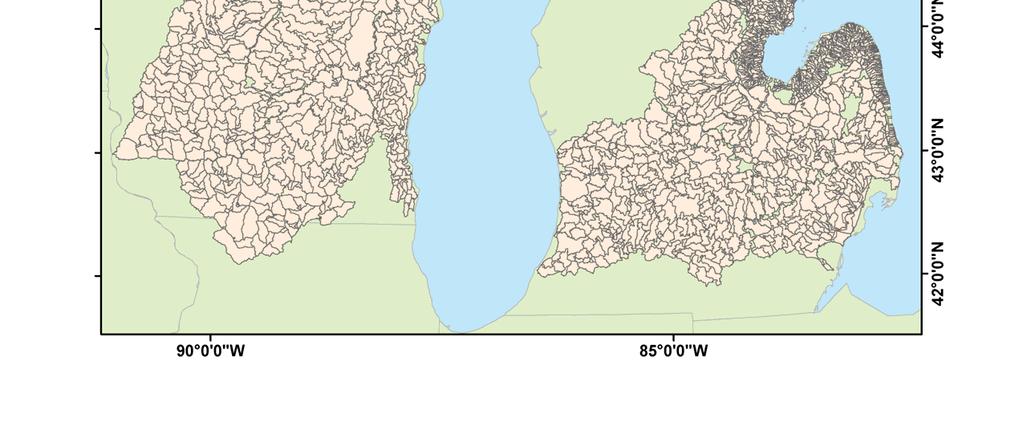
6 into the main channel, the amount of water moving into the soil zone in response to water deficiencies, and the amount of water removed from the shallow aquifer due to pumping. The deep aquifer water balance consists of percolation from the shallow aquifer to the deep aquifer and the amount of water removed from the deep aquifer due to pumping. SWAT uses empirical and analytical techniques to account for the above components (Neitsch et al., 05). Water Routing: In SWAT, water is routed through the channel network using the variable storage routing method (Williams, 1969) or the Muskingum River routing method (Chow et al., 1988). Each routing method is a variation of the kinematic wave mode (Neitsch et al., 05) Data Sources Physiographic characteristics Two main sets of land use/land cover data were used in this study (Fig. 2a and Fig 2b). For the current land use, 01 National Land Cover Data (NLCD 01) was used. NLCD 01 products include 21 classes of land cover at m cell resolution. Pre-settlement land uses are available at the state level; therefore, three different sets of datasets were obtained including 1) Michigan Natural Features Inventory (MNFI) 2) Original Vegetation Cover of Wisconsin 3) Land Cover of Illinois for the early 1800's. The MNFI was developed based on the surveyed performed by the General Land Office in mid The map is called vegetation circa1800 and available through the MNFI website ( /mnfi/data/veg1800.cfm). This dataset contains different landcover classes. The Original Vegetation Cover of Wisconsin was obtained from Wisconsin Department of Natural Resources ( vegetation_cover.pdf) based on the survey performed in mid-1800 ( ). The scale of the original map is 1:500,000 and contains 21 different landcover classes. The Land Cover of Illinois for the early 1800's was obtained from the Institute of Natural Resource Sustainability at the University of Illinois at Urbana-Champaign. Twelve different landcover classes are identified in this map. In the next step, and before introducing the pre-settlement datasets to the watershed model (SWAT), pre-settlement land cover maps were reclassified to the NLCD 01 classes to provide consistency between land cover maps. The reclassified land cover maps were then incorporated into the model for further investigations. USGS 1:250,000-scale Digital Elevation Model Grid (DEMG) at three arc-second (100 m) resolution was obtained for the study area ( This dataset was used to derive the topographic characteristics of the watershed such as watershed boundary, slope, river channel elevation, subbasin area, average watershed elevation, and flow path. Based on the data presented in Table 2, average elevation for the watersheds in Wisconsin is higher than Michigan s watersheds (341.8 m to m respectively). In addition, elevation differences for watersheds in Wisconsin are larger than the ones in Michigan (348.5 m to m. respectively). These differences may have significant impacts on watershed hydrologic responses such as stream flow and evaporation in two regions (Mohamoud, 04). A stream network dataset can be superimposed onto the DEM to define the location of stream network. In this study, river networks for the study areas were obtained from the National Hydrography Dataset (www. horizon-systems.com/nhdplus/). The NHD dataset was used to improve hydrologic segmentation and subwatershed boundary delineation (Winchell et al., 07). In addition, the Natural Resources Conservation Service s State Soil Geographic (STATSGO) database was used in the model. 6
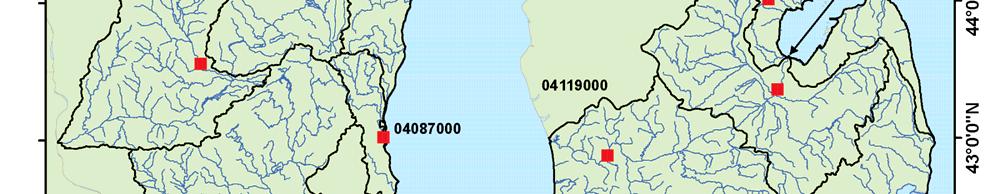
7 Gauging stations Eight different US Geological Survey (USGS) gauging stations were used for the SWAT model calibration and validation. At least nineteen years of daily stream flow records are available for each station (Fig. 3). The stations include USGS gauging station on the Wolf River, USGS gauging station on the Milwaukee River, USGS gauging station on the Grand River, USGS gauging station on the Rifle River, USGS gauging station on the Saginaw River, USGS gauging station on the Huron River, USGS gauging station on the Wisconsin River, and USGS gauging station on the Rock River. Due to similarity in physiographic and climatologic characteristics of watersheds and 0401, only one gauging station ( ) was used for model calibration Weather and climatological datasets Daily precipitation records along with minimum and maximum temperature were acquired from 195 precipitation stations and 158 temperature stations within and around the study area (Fig. 1) for 19 years ( ). The long-term average precipitation within the study area is 962 mm. However, the average precipitation within the study areas in Wisconsin (WI) is 945 mm (spatially varies from 674 mm to 1115 mm) and for Michigan (MI) is 980 mm (spatially varies from 667 mm to 1128 mm). In addition, 13.5 and 15.3 percent of precipitation is in the form of snowfall for WI and MI, respectively. Average long-term maximum temperature varies between 13.3 to 15 ºC for the study area. However, the average long-term minimum temperature varies from ºC for WI part of the study area to ºC for MI part of the study area. 2.4 Sensitivity Analysis Sensitivity analysis is used to explain how the variation in model output can be attributed to different sources of variation in the model input. However, it is important to note that some of the results of sensitivity analysis, depending on their placement in model algorithms, may not in fact have significant physical meaning. In this study the sensitivity analysis concerning daily flow rate was performed on 42 different SWAT parameters. The process was repeated on the nine HUC 6 digit watersheds both based on current and pre-settlement land use maps and results are summarized in Tables 3a and 3b. In these tables, the overall rankings for each watershed parameter were calculated based off the median and mean of individual rankings for all watersheds. Sensitivity analysis helps in identifying a series of parameters for the SWAT model calibration. In addition, performing sensitivity analysis and identifying sensitive parameters can help us to better explain why and how the model algorithm responds to land use change and why some parameters become more sensitive than the others under certain land use scenarios Model Calibration and Validation For most watershed models including SWAT, calibration is an iterative process that compares simulated and observed data of interest (typically streamflow data) through parameter evaluation. The goal of validation is to assess whether the model is able to predict field observations for time periods different from the calibration period (Donigan, 02). As mentioned earlier, eight different USGS gauging stations were used for the SWAT model calibration and validation. Daily streamflow data are available for all of these stations for the period of ( ). Before 7
8 10 performing the calibration and validation processes, one should identify the simulation period in which a broad range of climatological conditions are captured. In the first step, we plotted the average annual precipitation data from 1990 to 08 for the study area. We selected the period of for the model calibration and validation because this period includes dry, wet, and normal climate conditions based on long term average precipitation records. Year 02 was selected as the model warm-up year. The only exception to the above rule is watershed The watershed is unique in the sense that flow is regulated by 24 reservoirs above the station that was used for the model calibration (U.S. Geological Survey gauging station on Wisconsin River near the Wisconsin Dells). Based on the Wisconsin River Reservoir System Operating Plan report (WVIC, 10), maintaining uniform flow on the Wisconsin River and meteorological conditions (volume and timing of precipitation and snowmelt) are the factors considered in the reservoir operation cycle. In July 1996, four particular operating rules for the reservoir system are specified, including 1) maximum and minimum water levels in each reservoir; 2) minimum flow for each reservoir; 3) flow goals; and 4) storage balancing using index levels (WVIC, 10), which alters the flow regime in the Wisconsin River after Therefore, the model was calibrated and validated for the period of , while the year 1991 was selected for the model warm-up. The following parameters were used for the model calibrations in different watersheds: Alpha_Bf (baseflow recession constant), Cn2 (moisture condition II curve number), EPCO (plant uptake compensation factor), ESCO (soil evaporation compensation coefficient), Rchrg_Dp (deep aquifer percolation fraction), Surlag (surface runoff lag coefficient), TIMP (snow coefficient lag factor). Some parameters identified as sensitive (Sol_Z, Sol_Awc, Canmx, Gwqmn, Ch_K2) were not modified during calibration, while others that were not identified during sensitivity analysis were modified during calibration. Parameters that were not identified as sensitive but used in calibration were applied to match the model with naturally occurring processes in the watershed. Additionally, parameters not identified as sensitive in the sensitivity analysis must be adjusted due to error observed in predicted variables. Parameters chosen other than those identified by the sensitivity analysis were based on calibration parameters identified in other published results (White and Chaubey, 05). We evaluated model performance using the Nash Sutcliffe coefficient of efficiency (E NS ). Nash-Sutcliffe coefficient of efficiency (E NS ): Nash-Sutcliffe coefficient of efficiency calculates the normalized relative magnitude of residual variance in comparison with the measured data variance (Moriasi et al., 07): E NS n 2 ( Oi Pi ) i 1 1 (1) n 2 ( O O ) i 1 i 40 The range of E NS lies between 1.0 (perfect fit) and. Since the difference between observed and model results is squared in this method, the impacts of low values in time series (e.g. baseflow or lateral subsurface flow) have little impact to overall E NS. In addition, Nash-Sutcliffe coefficient of efficiency is often not sensitive to over- or under- 8
9 predictions for low flow scenarios (Krause et al., 05). This problem can be detected by comparing predicted and observed values within the period of study (Fig. 4). 10 Moriasi et al. (07) developed general evaluation guidelines based on a model performance rating. Based on these guidelines, a model performance can be evaluated as satisfactory for a monthly time step series if E NS > Guidelines for model evaluation presented above apply to the case of continuous, long-term flow simulation on a monthly time step. Model evaluation guidelines must be adjusted on an application to application basis because of the diversity of modeling uses. Guidelines should be modified based on numerous factors such as single-event simulation, quantity and quality of observed data, model calibration procedures, evaluation time step, and project scope and magnitude (Moriasi et al., 07). In general, shorter time steps have poorer model simulations than longer time steps (Moriasi et al., 07). Performance ratings presented above for E NS statistics are for a monthly time steps and must be modified for a daily time step to be applicable in this study. In order to do so, a series of studies on SWAT model performance on daily basis were reviewed. For example Benham et al. (06) E NS of 0.21 and Coffey et al. (04) reported E NS of 0.15 for satisfactory SWAT calibration. Based on the above studies, a conservative criterion was considered to evaluate satisfactory model performances on daily basis: E NS Further calculations on a monthly basis showed that for all studied watersheds the model performed satisfactory according to Moriasi et al. (07) with an E NS > 0.50). In addition to calibration, uncertainty analysis is important for distributed watershed models such as SWAT. Sources of structural uncertainty for these types of models include unaccounted processes within the model and over-simplification of model processes. However, performing uncertainty analysis is computationally expensive and time consuming for complex hydrological models, and therefore is not within the scope of this research (Yang et al., 08). 40 Since long-term daily precipitation records, minimum and maximum temperature, etc. are not available for the study area during the mid-1800s, it is not possible to precisely calibrate the model or estimate the flow regime under the pre-settlement scenario. However, by setting up the model for pre-settlement scenario based on current climatological variables (e.g. precipitation temperature, etc. for the period of ) we can accurately compare the results of land use changes in the region while eliminating the climatological difference. In addition, the same adjustments were made to the calibration parameters under pre-settlement scenario as they were under current land use scenario. This will allow us to minimize a possible bias caused by calibration process. It is important to note that applying the same calibration parameter values to the presettlement scenario may adversely impact the model results. However, the underlying assumption is that models such as SWAT were developed to evaluate hydrologic and water quality impacts of landuse change without limitation regarding the type, amount, and nature of landuse change. In addition, it is safe to say that as the landuse change from calibrated scenario becomes more drastic, the uncertainty of model predictions is increased. In addition, it is expected that agricultural practices (such as drainage system, irrigation, type of crop, crop rotation, etc.) have impacts on hydrological fluxes (Raymond et al., 08). However, collecting and incorporating this information to the model is very difficult and in some cases 9
10 impossible due to the lack of datasets. Therefore, ignoring some or all of the above practices will increase the level of uncertainty in the model prediction. 3. Results and Discussions In the following section, we will study the hydrologic effects of land use change at both a regional and a local scale by (1) performing a hydrologic sensitivity assessment and quantifying the magnitudes of hydrologic response to possible land use changes and (2) quantifying the magnitudes of hydrologic response to land use changes using the SWAT model Sensitivity Analysis Among the 42 parameters that were used for sensitivity analysis, 15 parameters were selected for further investigation. These parameters directly or indirectly influence the daily flow rate and ranked higher than others. Two criteria (mean ranking and median ranking for each watershed parameter) were selected to identify the most influential parameters, which affect daily flow rates. Mean and median were calculated for the top 15 parameters based on their position in the sensitivity analysis ranking table. In the case that the mean of two watershed parameters rankings are the same, the median value was used in determining the overall ranking. Comparing tables 3a and 3b illustrates significant shifts in overall ranking of some parameters, while ranking of other parameters are slightly sensitive or insensitive to the land use changes. Among the parameters, a significant shift in overall ranking can be observed in Cn2 (initial SCS curve number for moisture condition II), Sol_Z (depth from soil surface to bottom of layer), Rchrg_Dp (deep aquifer percolation fraction), and Canmx (maximum canopy storage). Cn2 and Rchrg_Dp parameters: In general, flow rate is the most sensitive to Cn2 based on current land use map while Rchrg_Dp was the most influential parameter under the presettlement scenario. In SWAT, the upper and lower boundaries for Cn2 can be varied by ± 25% while Rchrg_Dp is substituted by a value between 0 to 1. The aforementioned shift in ranking of Cn2 and Rchrg_Dp parameters can be explained by runoff-curve number values because the SWAT model does not assign different Rchrg_Dp values to different land uses. In SWAT, the assigned curve number values for forested land cover (31-79) is generally smaller than other land use/land cover classes such as croplands (67-89). Therefore, a switch in ranking of CN2 and Rchrg_Dp parameters in the sensitivity table is only caused by the Cn2 parameter resulting in more recharge and less runoff. Canmx parameter: Plant canopy can significantly affect infiltration, surface runoff, and evapotranspiration. In SWAT, the maximum amount of water that can be contained in canopy storage (can day ) varies daily as a function of the leaf area index (LAI). LAI canday canmx (2) LAImx where, LAI max is the maximum leaf area index for a plant. 40 The results of the sensitivity analysis revealed that the Canmx parameter (the maximum amount of water that can be trapped in the canopy when the canopy is fully developed) was dropped from rank four in the pre-settlement scenario to rank eight for the current land use scenario. This drop can be explained by excessive deforestation within the study area (6.3 million hectares of forest land was converted to urban and agricultural lands). In general, a lower Canmx value was 10
11 assigned to agricultural lands (e.g. row crops) in comparison to forest land; therefore affecting overall canopy storage within the study area that alters hydrology in the region Sol_Z parameter: The results of the sensitivity analysis shows that the overall ranking of the Sol_Z was improved from rank nine to rank six. Sol_Z is one of the characteristics of soil type and will not be adjusted by land use change. In SWAT, Sol_Z affects potential water uptake, soil temperature, etc. Potential water uptake (w up,z ) from the soil surface can be estimated using the following Eq.: E t Sol _ Z w up z 1 exp w 1 exp( (3), w zroot where, E t is the maximum plant transpiration on a given day, β w is the water-use distribution parameter, and z root is the depth of root development in the soil. SWAT assumes trees have roots down to the maximum soil depth while annual plants have a simulated root depth that varies linearly form 10 mm to maximum plant rooting depth. In addition, depth of root development (z root ) on agricultural land is smaller than on forest land. As it was discussed above, the Sol_Z parameter is independent of land use changes; however, since z root changes in different land use, the ratio of Sol_Z to z root changes. This affects plant water uptake and ultimately improves the ranking for Sol_Z in the current landuse. In addition to the overall ranking of parameters, some drastic changes also observed at the watershed level. For example, in the Wisconsin portion of Rock watershed (HUC 70900), Rchrg_Dp parameter was ranked third under pre-settlement landuse scenario and it was pushed to rank sixth under current landuse scenario. Closer study of landuse change in this watershed illustrated that this watershed experienced the most extreme expansion of agricultural land within the basin (75.5 % increase in agricultural land), while deforestation resulted in reduction of forested land to less than 10 % of the watershed area (8.9 %). Therefore, it is expected that the overall recharge decrease in this watershed. As demonstrated, parameter sensitivity analysis may not always explain how the variation in model output can be attributed to different sources of variation in the model input. Therefore, attention should be taken to determine the true importance of sensitive parameters by considering their placement in model algorithms, since the most sensitive parameters may not always be appropriate for use in model calibration. It is recommended that in the future versions of SWAT, sensitivity analysis is redesigned to avoid this type of problem. 3.2 Model Calibration and Validation Results Comparisons between the observed (USGS) and simulated streamflows in representative watersheds are shown in Fig. 4 while results obtained from the SWAT model calibration, validation, and combined statistical analysis are summarized in Table 4. From the comparisons and the associated statistics, we note that the model performance in all watersheds can be considered as satisfactory. 3.3 Subbasin-Level Impacts of Land Use Changes The objective of this section is to understand whether land use conversion can explain hydrological behavior at the subbasin level. In order to estimate the percentage of land use conversion within each of the 28 subbasins (Fig. 5), the pre-settlement and current land use 11
12 10 40 maps were intersected. This allows partitioning of the subbasin to smaller units based on intersected area of pre-settlement and current landuse scenarios (Fig. 6). Then the top 14 land use conversion classes were identified and the percentage of landuse conversion within each of the 14 classes to the total subbasin area was calculated for all 28 subbasins. In the next step, the degree of relationship (correlation) between percent of land use conversion within a subbasin and seven different hydrologic characteristics were assessed (actual evapotranspiration, soil water content, water percolation, surface runoff, baseflow, water yield, lateral subsurface flow). As shown in Table 5, changes in hydrologic characteristics are examined by considering the percentage change in a variable relative to its pre-settlement value (P1, P2, P3 etc) as well as the absolute difference in the variable (D1,D2 etc)- therefore a total of 14 variables are listed in Table 5. Since all of the variables involved in this study deviate from normal distribution, nonparametric measures of association were used (Sprent and Smeeton, 00). The Spearman rank-order correlation is a measure of association based on the rank of the data values, and Hoeffding's measure of dependence is a measure of association that detects more general departures from independence and is typically used to infer nonlinear and non-monotonic associations. Fujita et al. (09) recently demonstrated that Hoeffding s method outperforms Pearson s and Spearman s methods in identifying nonlinear associations. The authors also demonstrate that Hoeffding s method is less sensitive to outliers. The null hypothesis in the test of association in both methods assumes no correlation, thus rejecting null hypothesis indicates a significant association. Based on Spearman s method several significant correlations were found even at the 0.01 level (Table 5). Some differences were observed in the correlations expressed as the absolute differences as compared to the percent differences. However, there is a clear correlation between percent change of area and all hydrological properties in land use conversation from mixed forest to urban and agriculture. Meanwhile, the magnitudes of the correlation coefficients were rather low for all correlations (e.g. typically lower than 0.5). Based on Hoeffding s D measure, significant association was observed across all variables and hydrological variables with few exceptions, for example percent change actual evapotranspiration, soil water content, surface runoff and water yield in land use conversion code 53 (evergreen forest to rangeland). Most of the associations expressed a significant level lower than Most of the significant associations were observed in the change from mixed forest to urban, rangeland or agriculture. The lower number of association was observed for the change from evergreen forest to urban, rangeland and agriculture. In general, for all types of landuse conversion, significant changes in one or more hydrological variables were observed under both Spearman and Hoeffding s D methods. However, all hydrological variables were significantly altered by landuse conversion from mixed forest to urban and agriculture lands based on the results of the above methods. 3.4 Watershed-Level Impacts of Land Use Changes A summary of watershed-level impacts of land use change on changes in the hydrologic fluxes is presented in Table 7. The objective in this analysis is to compare hydrological variables in presettlement and current land use at watershed level. The sample size for this analysis is rather low 12
13 10 40 because only the means of eight HUC-6 digit watersheds are available, which makes difficult to test statistical assumptions (i.e. normality). In addition, the eight watersheds used for presettlement and current land use were the same, making this a paired dataset in which independence between subjects (i.e. watershed) is not found. A nonparametric test suitable for paired samples and small sample size is the Wilcoxon Signed Rank Sum, S test (Sprent and Smeeton, 00). This is a nonparametric version of a paired samples t-test that can used when difference between the two variables is not assumed to be normally distributed. The null hypothesis assumes no difference between the samples, thus rejecting null hypothesis implies significant differences in hydrological variables between pre-settlement and current land use. The null hypothesis was rejected for all variables except for water yield (S = -4, p = 0.64). In general, water yield is a function of several complex hydrologic processes, therefore, it is very difficult to explain behavior of water yield with respect to changes in one factor (landuse). Meanwhile, evidence of significant difference between pre-settlement and current land use were observed for: evapotranspiration (S = 16, p = 0.023), recharge (S = -18, p = 7), surface runoff (S = 15, p = 0.039) and baseflow (S = -18, p = 7). Significant differences were also found for the absolute values of evapotranspiration (S = 15, p = 0.04) and surface runoff (S = 14, p = 0.05). Overall, consistent decreases in recharge and baseflow and increases in surface runoff and evapotranspiration were observed, while water yield showed mixed results (Table 6). By studying the percentage of different land coverage (Table 1), it should be noticed that watershed has the highest percentage of urban development (38.1%) among all studied watersheds. In addition, the highest evapotranspiration change is assigned to watershed , which has the greatest percentage of agricultural lands within a watershed (72.5%). All watersheds demonstrated a reduction in recharge potential and groundwater contributions to streamflow (baseflow) relative to the pre-settlement scenario. This can be attributed to the lost of forestlands between 38.6% to 70.4% of total watersheds areas (Table 1), while agricultural lands and urban areas present lower potential for recharge compared to forested lands due to increased runoff. The impact of land use change on overall surface runoff pattern is also presented in table 6. All watersheds except 0402 exhibit an increase in surface runoff generation except HUC This may be caused by a low percentage of urbanization (7.5%), and an overall lower ratio of deforestation to agricultural land expansion compared to other watersheds studied. The last hydrologic characteristic that will be discussed is water yield. Water yield is a summation of surface runoff, lateral subsurface flow, and baseflow minus transmission loss. Therefore, explaining the variation in water yield at a watershed scale is not simple. However, reductions in total water yield were observed in the majority of watersheds, excluding HUCs and A closer examination of model outputs revealed that water yield in agricultural areas are the lowest among all studied land uses, while urban area has the highest median value for water yield. Almost 38% of the area in watershed is in urban, while 33% is under cultivation (Table 1). This is the highest percentage of the developed areas within a single watershed among all studied watersheds. Therefore, the existence of the developed area increases the overall water yield value for this watershed. However, in watershed , the percentage of urban areas is low (8.5%) while percentage of agricultural land is high. However, this watershed had the highest percent of rangeland in mid-1800 (24.8%). Based on the current land use scenario the rangeland was reduced by 93%. The combination of the above factors and 13
14 unique physiographic characteristics may cause the slight increase in long-term average water yield in this watershed Basin-Wide Impacts of Land Use Changes Basin-wide impacts of land use changes on hydrologic characteristics are presented in Fig. 7 through Fig. 10. In general, the basin was divided into to three major classes. 1) positive high: if percent change in hydrologic characteristics is equal or more than 10% of the original value; 2) modest: if percent change in hydrologic characteristics is between -10% to 10% of the original value and; 3) negative high: if percent change in hydrologic characteristics is equal or less than -10% of the original value (Fig. 10). Figures 7a and 10 demonstrate that percent change in evapotranspiration is modest in the majority of the basin, particularly in the northwest region of the study area in which forested lands are generally preserved. In addition, decreases in evapotranspiration can be observed especially in heavily populated areas such as Detroit (MI) and Milwaukee (WI). More than 70% of the study area is classified as negative high with respect to baseflow and recharge to aquifers. This can be attributed to conversion of forestlands to agricultural lands that have lower recharge potentials (Fig. 7b and Fig. 9a). Between the hydrologic parameters that are discussed here, overland flow contribution to streamflow (Surf_Q) was increased in majority of the region in comparison to pre-settlement scenario. In fact, more than 65% of the study area is classified as positive high with respect to overland flow. This can be explained by the vast expansion of agricultural lands in the region. Regarding water yield, the majority of the region experiences modest changes, while about 15% of region is classified as positive high and 24% is classified as negative high. The positive high region mostly corresponds to urbanization and the negative high region is mostly associated to conversion of wetlands, rangeland and forested areas to agricultural production. A closer look at model parameters influencing water yield shows that the leaf area index for the forested lands never reached its maximum value because the optimal temperature for plant growth was not consistently reached during the course of the growing season and period of study. Therefore, lower rates of evapotranspiration were observed in forestlands than agricultural land. This could contribute to the reduction in water yield under deforestation. However, most hydrological behaviors are complex and site specific and for this study the conversion of wetlands, rangeland and forested areas at different level may cause decreases in the water yield. 4. Conclusions The Great Lakes region has been experiencing substantial land use changes from pre-settlement conditions over the past 150 years. This study focused on some of these changes within the agricultural regions of Michigan and Wisconsin including massive deforestation (51% of the total area), loss of wetlands and rangelands (8% of the total area) to agricultural production and urbanization. Several land surface characteristics and processes are greatly affected by land use change, including leaf area, roughness, albedo, soil moisture, and momentum, energy, and water vapor exchange rates. Land use changes such as urbanization, deforestation, and reforestation continue to affect groundwater-surface water interactions including percolation or recharge, groundwater contributions to streams, and soil moisture as summarized in Table 5 as well as water availability influencing ecosystem services. This research examines land use change effects on hydrology at both local and regional scales. 14
15 Pre-settlement land use maps were used to develop a baseline scenario relative to the current landuse map in which the impacts of land use changes on hydrological and environmental processes can be evaluated Sensitivity analysis is one of the tools used to explain how the variation in model output can be caused by model input. However, the results of this study shows that parameter sensitivity analysis may not always explain how the variation in model output can be attributed to different sources of variation in the model input. Therefore, attention should be taken to determine the true importance of sensitive parameters by considering their placement in model algorithms and the most sensitive parameters may not always be appropriate for use in model calibration. White and Chaubey (05) also raised concern about application of relative sensitivity parameter in model evaluation especially concerning the assumption of linearity and lack of correlation between parameters. Regarding the impacts of land use changes, three scales were used: subbasin-level, watershedlevel, and the basin level. At the subbasin level, the result was aggregated from the HRU level to estimate the contribution of all fields in the watershed to the river, yet does not include in-stream routing components. At the watershed level, both contribution from individual HRUs to the subbasins and in-stream routing are considered. And finally at the basin level, the overall results of different hydrological fluxes are averaged. At the subbasin level, based on the results of the statistical analysis, several significant correlations were found between the percentage of landuse change and both absolute and relative differences in hydrological behaviors. Of all land use conversions, only mixed forest to urban and agricultural lands showed significant correlations for all hydrological variables. Concerning watershed scale impacts of land use changes, a Wilcoxon Signed Rank Sum, S test confirmed that the long-term average fluxes under the current and pre-settlement scenarios were not the same. Similar results were reported in many studies such as Matheussen et al, 00; Andreassian, 04; Brown et al., 05; Coe et al., 09. Overall, an increase in evapotranspiration (up to 16.5%) and surface runoff (up to 93.9%) contribution to stream flow, decrease in recharge to aquifers (up to -51.5%) and baseflow (up to -50.1%), and mixed impacts on water yield were detected (-21.5% to 24.6%). Finally, at the basin-level, modest changes in evapotranspiration and water yield, significant increases (65% of study area) in overland flow generation, and significant decreases (70% of the study area) in recharge, baseflow, and lateral subsurface flow in the majority of the basin were observed. The results of this study can be used in quantifying the potential impacts of future projected changes in land use in order to mitigate the negative impacts of these changes. For example, concerns with energy and a shift towards second generation biofuel production derived from lignocellulosic crops has the potential for large scale landuse conversion within the region, which can have significant impacts on hydrologic components (Love and Nejadhashemi, 11). In addition, the results of this study can provide insights into future urbanizations impacts of water resources. However, due to the important role of uncertainty analysis in the decision making process for water resources, it is recommended that future studies be performed to evaluate different sources of uncertainty to increase confidence in the model results. 15
16 5. Acknowledgements The authors would like to acknowledge useful discussions and help from Dr. Chaopeng Shen, Dr. Scott Sowa, Dr. Jon Bartholic, Dr. Yi Shi, Mr. Sean Woznicki, and Mr. Matt Einheuser. Funding for this project was provided by the United State Department of Agriculture Natural Resource Conservation Service as a part of the Conservation Effects Assessment Project References Andreassian, V.: Waters and forests: from historical controversy to scientific debate. J HYDROL 291, 1-27, 04. Benito, G., Rico, M., Sanchez-Moya, Y., Sopeña, A., THorndycraft, V.R., Barriendos, M.: The impact of late Holocene climatic variability and land use change on the flood hydrology of the Guadalentin River, southeast Spain. GLOBAL PLANET CHANGE 70(1-4), Breuer, L., Huisman, J. A., Willems, P., Bormann, H., Bronstert, A., Croke, B F.W., Frede, H.G., Graff, T., Hubrechts, L., Jakeman, A.J., Kite, G., Lanini, J., Leavesley, G., Lettenmaier, D.P., Lindstrom, G., Seibert, J., Sivapalan, M., Viney, N.R.: Assessing the impact of land use change on hydrology by ensemble modeling (LUCHEM). I: Model intercomparison with current land use. ADV WATER RESOUR 32(2), , 09. Brown, A. E., Zhang, L., McMahon, T.A., Westen, A.W., Vertessy, R.A.: A review of paired catchment studies for determining changes in water yield resulting from alterations in vegetation. J HYDROL 310, 28-61, 05. Burch, G.J., Bath, R.K., Moore, I.D., O Loughlin, E.M.: A comparative hydrological behavior of forested and cleared catchments in south eastern Australia. J HYDROL 90, 19-42, Ceo, M.T., Costab, M. H., Soares-Filho, B. S.: The influence of historical and potential future deforestation on the stream flow of the Amazon River Land surface processes and atmospheric feedbacks. J HYDROL 369(1-2): , 09. Chow, V. T., Maidment, D.R., Mays, L.W.: Applied hydrology. McGraw-Hill, Inc., New York. 572 pp Coffey, M.E., Workman, S.R., Taraba, J.L., Fogle, A.W.: Statistical procedures for evaluating daily and monthly hydrologic model predictions. T ASABE 47(1), 59-68, 04. Copeland, J.H., Pielke, R.A., Kittel, T.G.F.: Potential climatic impacts of vegetation change: A regional modeling study. J GEOPHYS RES 101, , Costa, M.H., Botta, A., Cardille, J.A.: Effects of large-scale changes in land cover on the discharge of the Tocantins River, Amazonia. J HYDROL 283, 6-217, 03. Donigian Jr., A.S.: Watershed model calibration and validation: The HSPF experience. National TMDL Science and Policy, Phoenix, AZ. November , 02, 44-73, 02. Elfert, S., Bormann, H.: Simulated impact of past and possible future land use changes on the hydrological response of the Northern German lowland Hunte catchment. J HYDROL 383, , 10. Feddema, J. J., Oleson, K.W., Bonan, G.B., Mearns, L.O., Buja, L.E., Meehl, G.A., Washington, W.M.: The importance of land-cover change in simulating future climates. SCIENCE 310 (5754), , 05. Fu, B., Chen, L., Ma, K., Zhou, H., Wang, J.: The relationships between land use and soil conditions in the hilly area of the loess plateau in northern Shaanxi, China. CATENA 39(1), 69-79, 00. Fujita, A., Sato, J., Demasi, M., Sogayar, M., Ferreira, C., Miyano, S.: Comparing Pearson, Spearman and Hoeffding s D measure for gene expression association analysis. Journal of Bioinformatics and Computational Biology 7, , 09. Gassman, P. W., M. R. Reyes, C. H. Green, and J. G. Arnold: The Soil and Water Assessment Tool: Histological development, applications, and future research directions. T ASABE 50(4): ,
17 Ghaffari, G., Keesstra, S., Ghodousi, J., Ahmadi, H.: SWAT-simulated hydrological impact of land-use change in the Zanjanrood Basin, Northwest Iran. HYDROL PROCESS 24(7), , 10. Green, W.H., and Ampt G.: Studies on soil physics: 1. The flow of air and water through soils. J AGR SCI 4:1 24, Hibbert, A.R., Forest treatment effects on water yield. Aviable at: Hundecha, Y., Ba rdossy, A.: Modeling of the effect of land use changes on the runoff generation of a river basin through parameter regionalization of a watershed model. J HYDROL 292, , 04. Johnston, C.A., Shmagin, B.A.: Regionalization, seasonality, and trends of streamflow in the US Great Lakes Basin, J HYDROL 362, 69 88, 08. Krause, P., Boyle, D.P., Base, F.: Comparison of different efficiency criteria for hydrological model assessment. Advances in Geosciences 5: 89 97, 05. Kueppers, L.M., Snyder, M.A., Sloan, L.C.: Irrigation cooling effect: regional climate forcing by landuse change. GEOPHYS RES LETT 34(3), L03703-L03708, 07. Langford, K.J.: Change in yield of water following a bush fire in a forest of Eucalyptus regnans J HYDROL 29, , Li, K.Y., Coe, M.T., Ramankutty, R., De Jong, R.: Modeling the hydrological impact of land-use change in West Africa. J HYDROL 337, , 07. Love, B.J., Nejadhashemi, A.P.: Water quality impact assessment of large-scale biofuel crops expansion in agricultural regions of Michigan. BIOMASS BIOENERG 35(5), , 11. Matheussen, B., Kirschbaum1, R.L., Goodman, I A., O'Donnell, G. M., Lettenmaier, D. P.: Effects of land cover change on streamflow in the interior Columbia River Basin (USA and Canada), HYDROL PROCESS 14(5), , 00. Mao, D., Cherkauer, K.A.: Impacts of land-use change on hydrologic responses in the Great Lakes region. J HYDROL 374(1-2), 71-82, 09. Mohamoud, Y.: Comparison of hydrologic responses at different watershed scales. USEPA /600/R- 04/103. Athens, Georgia, 04. Moriasi, D. N., Arnold, J.G., Van Liew, M.W., Bingner, R.L., Harmel, R.D., Veith, T.L.: Model evaluation guidelines for systematic quantification of accuracy in watershed simulations. T ASABE 50(3), , 07. National Land Cover Database (NLCD): Multi-resolution land characteristics consortium (MRLC). U.S. Department of the Interior, U.S. Geological Survey, avialble at: Neitsch, S.L., Arnold, J.G., Kiniry, J.R., Williams, J.R.: Soil and water assessment tool theoretical documentation. available at: Nelson, R.G., Ascough II, J.C., Langemeier, M.R.: Environmental and economic analysis of switchgrass production for water quality improvement in northeast Kansas. J ENVIRON MANAGE 79, , 06. Paeth, H., Born, K., Girmes, R., Podzun, R., Jacob, D.: Regional climate change in tropical and Northern Africa due to greenhouse forcing and land use changes. J CLIMATE 22(1), , 09. Qi, S., Sun, G., Wang, Y., McNulty, S.G., Moore Myers, J.A.: Streamflow response to climate and land use changes in a coastal watershed in North Carolina. T ASABE 52(3), , 09. Qiu, Y.Q., Jia, Y.W., Zhao, J.C., Wang, X., Bennett, J., Zhou, Z.: Valuation of flood reductions in the Yellow River Basin under land use change. J WATER RES PL-ASCE 136(1), , 10. Raymond, P.A., Oh, N.H., Turner, R.E., Broussard, W.: Anthropogenetically enhanced fluxes of water and carbon from the Mississippi River. NATURE 451. doi: /nature06505, 08. Remo, J. W. F., Pinter, N., Heine, R.: The use of retro- and scenario-modeling to assess effects of 100+years river of engineering and land-cover change on Middle and Lower Mississippi River flood stages. J HYDROL 376(3-4), ,
18 10 Schilling, K.E., Jha, M.K., Zhang, Y.K., Gassman, P.W., Wolter, C.F.: Impact of land use and land cover change on the water balance of a large agricultural watershed: Historical effects and future directions. WATER RESOUR RES 44, W00A09, 12 pp doi: /07wr006644, 08. Soil Conservation Service. National engineering handbook, Section 4, hydrology, U.S. Department of Agriculture Washington, DC, Sloan, P.G., Morre, I.D., Coltharp, G.B., Eigel, J.D., Modeling surface and subsurface stormflow on steeply-sloping forested watersheds. Water Resources Inst. Report 142. Univ. Kentucky, Lexington: last access 29 July 10. Sprent P., and Smeeton, N.: Applied nonparametric statistical methods (Eds. 3rd). Chapman & Hill/CRC, Wasington D.C., U.S.A., 00. Tomer, M.D., Schilling, K.E.: A simple approach to distinguish land-use and climate-change effects on watershed hydrology. J HYDROL 376, 24-33, 09. Tong, S.T.Y., Chen, W.: Modeling the relationship between land use and surface water quality. J ENVIRON MANAGE 66(4), , 02. Tu, J.: Combined impact of climate and land use changes on streamflow and water quality in eastern Massachusetts, USA. J HYDROL 379, , 09. Wang, G., Liu, J.L., Kubota, J., Chen, L.: Effects of land-use changes on hydrological processes in the middle basin of the Heihe River, northwest China. HYDROL PROCESS 21, , 07. Wang, H. J., Shi, W.L., Chen, X.H.: The statistical significance test of regional climate change caused by land use and land cover variation in West China. Advanced in Atmospheric Sciences. 23(3), , 06. Ward, P.J., Renssen, H., Aerts, J.C.J.H., van Balen, R.T., Vandenberghe, J.: Strong increases in flood frequency and discharge of the River Meuse over the late Holocene: impacts of long-term anthropogenic land use change and climate variability. HYDROL EARTH SYST SC. 12(1), , 08. White, K.L., Chaubey, I.: Sensitivity analysis, calibration, and validation for a multisite and multivariable SWAT model. AM WATER RESOUR AS 41(5), , 05. Williams, J.R.: Flood routing with variable travel time or variable storage coefficients. T ASABE 12(1), , Winchell, M., Srinivasan, R., Di Luzio, M., Arnold, JG.: ArcSWAT interface for SWAT 05: User s guide. Grassland Soil and Water Research Lab, available at: Wisconsin Valley Improvement Company (WVIC): Operations plan: Wisconsin River reservoir system operating plan. available at: Yang, J., Reichert, P., Abbaspour, K.C., Xia, J., Yang, H. :Comparing uncertainty analysis techniques for a SWAT application to the Chaohe Basin in China. J HYDROL 358, 1-23,
19 7. Appendix: 10 Abbreviations. The following symbols are used in this paper: Alpha_BF: Baseflow recession constant Blai: Potential maximum lea index for the plant β w : water-use distribution parameter can day : maximum amount of water that can be held in canopy storage Canmx: Maximum canopy storage Ch_K2: Effective hydraulic conductivity in main channel alluvium Ch_N2: Manning s n value for the main channel Cn2: Initial SCS runoff curve number for moisture condition II E t E NS : Esco: ET: Gwqmn: GW_Q: HRU: LAI LAI max LAT_Q: maximum plant transpiration on a given day Nash Sutcliffe coefficient of efficiency Soil evaporation compensation factor Actual evapotranspiration Threshold depth of water in the shallow aquifer required for return flow to occur Baseflow contribution to streamflow Hydrologic response unit Leaf area index Maximum leaf index for the plant Lateral subsurface flow contribution to streamflow n: Number of samples P: Predicted value PET: Potential evapotranspiration O: Observed value O : R 2 : Rchrg_Dp: RMSE: Slope: Sol_Awc: Sol_K: Sol_Z: Surf_Q: Surlag: Average observed values Coefficient of determination Deep aquifer percolation fraction Root-mean-square error Slope Available water capacity of the soil layer Saturated hydraulic conductivity Depth from soil surface to bottom of layer Overland flow contribution to streamflow Surface runoff lag coefficient 19
20 SWAT: Timp: VIC: w up,z : z root : Soil and Water Assessment Tool Snow pack temperature lag factor Variable infiltration capacity model Potential water uptake Depth of root development in the soil
21 Table 1. Study area land use summary Watershed Area (ha) 0401 & % Area (ha) 0401 & % Area (ha) Current Land Use Total Total % Area (ha) % Area (ha) % Area (ha) % Area (ha) % Area (ha) % Area (ha) % Forest Wetlands Rangeland Water Agriculture Urban Total Pre-settlement Land Use Watershed Area (ha) 0401 & % Area (ha) 0401 & % Area (ha) Total Total % Area (ha) % Area (ha) % Area (ha) % Area (ha) % Area (ha) % Area (ha) % Forest Wetlands Rangeland Water , Agriculture Urban Total
22 Table 2. Physiographic and climatological summary of the study. Watershed (HUC) State Annual Average Rainfall (mm) Annual Average Snowfall (mm) Annual Average Precipitation (mm) Minimum Average Precipitation (mm) Maximum Average Precipitation (mm) Average Elevation (m) Minimum Elevation (m) 0402 WI & WI WI WI MI MI MI MI Maximum Elevation (m) 22
23 Table 3a Sensitivity analysis summary (current land use) Watershed Parameters & WI a WI WI WI MI b MI MI MI Mean Median Cn Rchrg_Dp Esco Alpha_BF Timp Sol_Z Sol_Awc Canmx Gwqmn Ch_K Blai Surlag Ch_N Slope Sol_K Parameters a: WI: Wisconsin b: MI: Michigan Table 3b Sensitivity analysis summary (pre-settlement land use) Watershed & WI a WI WI WI MI b MI MI MI Mean Overall Ranking Median Rchrg_Dp Cn Esco Canmx Alpha_BF Timp Sol_Awc Gwqmn Sol_Z Blai Ch_K Surlag Ch_N Slope Sol_K a: WI: Wisconsin b: MI: Michigan Overall Ranking 23
24 Table 4. Statistical analysis based on daily streamflow SWAT model outputs. Watershed Parameter Uncalibrated Statistics Calibration Statistics (03-05) Validation Statistics (06-07) Overall Statistics (03-07) 0402 NSE & NSE NSE * 0.46 ** 0.45 *** NSE NSE NSE NSE NSE * Period of calibration * * Period of validation ** * Period of overall model performance
25 Table 5. Spearman correlation coefficient and its probabilities (p-value). Correlation between percent of land use conversion within a subbasin and hydrological variable. Red p-value indicates a significant probability at 0.01 level. Green p-value indicates significance at 0.05 level. Pre-settlement Current code (P1) (P2) (P3) (P4) (P5) (P6) (P7) (D1) (D2) (D3) (D4) (D5) (D6) (D7) Rangeland Urban Rangeland Agriculture Deciduous Forest Urban Deciduous Forest Rangeland Deciduous Forest Agriculture Evergreen Forest Urban Evergreen Forest Rangeland Evergreen Forest Agriculture Mixed Forest Urban Mixed Forest Rangeland Mixed Forest Agriculture Woody Wetlands Urban Woody Wetlands Rangeland Woody Wetlands Agriculture (P1): Percent changes in actual evapotranspiration (D1): Differences in actual evapotranspiration (mm) (P2): Percent changes in soil water content (D2): Differences in soil water content (mm) (P3): Percent changes in water percolation (D3): Differences in water percolation (mm) (P4): Percent changes in surface runoff contribution to streamflow (D4): Differences in surface runoff contribution to streamflow (mm) (P5): Percent changes in groundwater contribution to streamflow (D5): Differences in groundwater contribution to streamflow (mm) (P6): Percent changes in water yield (D6): Differences in water yield (mm) (P7): Percent changes in lateral subsurface flow contribution to streamflow (D7): Differences in lateral subsurface flow contribution to streamflow (mm)
26 Table 6. Watershed-level impacts of land use changes (mid-1800 versus current). Watershed (HUC) State Percent Change Evapotranspiration Percent Change Recharge Percent Change Surface Runoff Percent Change Baseflow Percent Change Water Yield 0402 WI & WI WI WI MI MI MI MI
27 Fig. 1. Study area. RNG (precipitation gauging stations) and TMPG (temperature gauging stations) 27
 Current land")

28 Fig. 2. (a) Current land use map, (b) Pre-settlement land use map 28


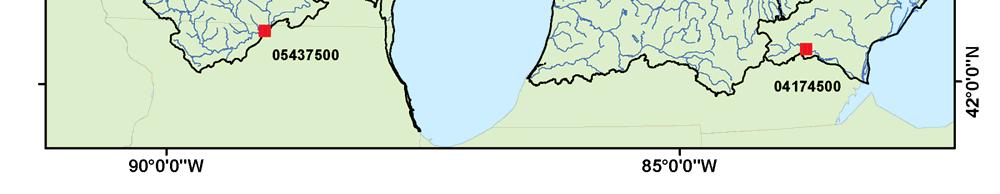
29 Fig. 3. USGS gauging stations 29
 and")
30 Fig. 4. Comparison between observed (USGS) and simulated streamflows for selected watersheds

31 Fig. 5. Subbasin map 31
 Rangeland to Urban; (37) Rangeland to Agriculture; (42) Deciduous Forest to Urban; (43) Deciduous Forest to Rangeland; (47) Deciduous Forest to Agriculture; (52) Evergreen Forest to Urban; (53)")
32 Fig. 6. Spatial variation of land use conversion from mid-1800 to current. (32) Rangeland to Urban; (37) Rangeland to Agriculture; (42) Deciduous Forest to Urban; (43) Deciduous Forest to Rangeland; (47) Deciduous Forest to Agriculture; (52) Evergreen Forest to Urban; (53) Evergreen Forest to Rangeland; (57) Evergreen Forest to Agriculture; (62) Mixed Forest to Urban; (63) Mixed Forest to Rangeland; (67) Mixed Forest to Agriculture; (82) Woody wetlands to Urban; (83)Woody wetlands to Rangeland; and (87) Woody Wetlands to Agriculture. 32
33 Fig. 7. Long-term average impacts of land use change at basin level (a) percent change in actual evapotranspiration; (b) percent change in recharge entering aquifers; 33

34 Fig. 8 (a) percent change in surface runoff; (b) percent change in lateral subsurface flow contribution to streamflow; 34


35 Fig. 9 (a) percent change in groundwater contribution to streamflow; and (b) percent change in water yield 35
 percent change in")
 percent change in lateral subsurface flow contribution to")
36 Fig. 10. Percentage of geographical area under positive high, modest, or negative high classes; (ET) percent change in actual evapotranspiration; (Recharge) percent change in recharge entering aquifers; (Surf_Q) percent change in overland flow contribution to streamflow; (Lat_Q) percent change in lateral subsurface flow contribution to streamflow; (GW_Q) percent change in baseflow contribution to streamflow; and (Water Yield) percent change in water yield 36
Assessing the impact of projected climate changes on small coastal basins of the Western US
 Assessing the impact of projected climate changes on small coastal basins of the Western US William Burke Dr. Darren Ficklin Dept. of Geography, Indiana University Introduction How will climate change
Evaluation of Swat for Modelling the Water Balance and Water Yield in Yerrakalva River Basin, A.P. National Institute of Hydrology, Roorkee
 Evaluation of Swat for Modelling the Water Balance and Water Yield in Yerrakalva River Basin, A.P. By Dr. J.V. Tyagi Dr. Y.R.S. Rao National Institute of Hydrology, Roorkee INTRODUCTION Knowledge of water
Hamid R. Solaymani. A.K.Gosain
 Motivation An integrated management plan is required to prevent the negative impacts of climate change on social- economic and environment aspects Each of these segments is expected to be strongly impacted
1 THE USGS MODULAR MODELING SYSTEM MODEL OF THE UPPER COSUMNES RIVER
 1 THE USGS MODULAR MODELING SYSTEM MODEL OF THE UPPER COSUMNES RIVER 1.1 Introduction The Hydrologic Model of the Upper Cosumnes River Basin (HMCRB) under the USGS Modular Modeling System (MMS) uses a
Watershed Modeling of Haw River Basin using SWAT for Hydrology, Water Quality and Climate Change Study
 Watershed Modeling of Haw River Basin using SWAT for Hydrology, Water Quality and Climate Change Study Somsubhra Chattopadhyay, Graduate Student Manoj K. Jha, Assistant Professor Civil Engineering Department
Institute of Water and Flood Management, BUET, Dhaka. *Corresponding Author, >
 ID: WRE 002 HYDROLOGICAL MODELING FOR THE SEMI UNGAUGED BRAHMAPUTRA RIVER BASIN USING SWAT MODEL S. Paul 1*, A.S. Islam 1, M. A. Hasan 1, G. M.T. Islam 1 & S. K. Bala 1 1 Institute of Water and Flood Management,
Application of a Basin Scale Hydrological Model for Characterizing flow and Drought Trend
 Application of a Basin Scale Hydrological Model for Characterizing flow and Drought Trend 20 July 2012 International SWAT conference, Delhi INDIA TIPAPORN HOMDEE 1 Ph.D candidate Prof. KOBKIAT PONGPUT
Malfunctioning of streamgauge stations in the Chanza and Arochete rivers (Huelva, Spain) detected from hydrological modeling with SWAT.
 detected from hydrological modeling with SWAT.") Malfunctioning of streamgauge stations in the Chanza and Arochete rivers (Huelva, Spain) detected from hydrological modeling with SWAT. L. Galván, M. Olías and A. Van Griensven Introduction The Odiel river
Malfunctioning of streamgauge stations in the Chanza and Arochete rivers (Huelva, Spain) detected from hydrological modeling with SWAT. L. Galván, M. Olías and A. Van Griensven Introduction The Odiel river
Comparative analysis of SWAT model with Coupled SWAT-MODFLOW model for Gibbs Farm Watershed in Georgia
 2018 SWAT INTERNATIONAL CONFERENCE, JAN 10-12, CHENNAI 1 Comparative analysis of SWAT model with Coupled SWAT-MODFLOW model for Gibbs Farm Watershed in Georgia Presented By K.Sangeetha B.Narasimhan D.D.Bosch
A comparison study of multi-gage and single-gage calibration of the SWAT model for runoff simulation in Qingjiang river basin
 A comparison study of multi-gage and single-gage calibration of the SWAT model for runoff simulation in Qingjiang river basin Dan YU, Xiaohua DONG, Lei LI, Sanhong SONG, Zhixiang LV and Ji LIU China Three
EFFECTS OF WATERSHED TOPOGRAPHY, SOILS, LAND USE, AND CLIMATE ON BASEFLOW HYDROLOGY IN HUMID REGIONS: A REVIEW
 PROGRESS IN PHYSICAL GEOGRAPHY EFFECTS OF WATERSHED TOPOGRAPHY, SOILS, LAND USE, AND CLIMATE ON BASEFLOW HYDROLOGY IN HUMID REGIONS: A REVIEW KATIE PRICE 2011 Presented by: Jordan Martin Article Overview
Joint Research Centre (JRC)
") Joint Research Centre (JRC) Marco Pastori and Faycal Bouraoui IES - Institute for Environment and Sustainability Ispra - Italy http://ies.jrc.ec.europa.eu/ http://www.jrc.ec.europa.eu/ CONTENT Introduction
Joint Research Centre (JRC) Marco Pastori and Faycal Bouraoui IES - Institute for Environment and Sustainability Ispra - Italy http://ies.jrc.ec.europa.eu/ http://www.jrc.ec.europa.eu/ CONTENT Introduction
Representing the Integrated Water Cycle in Community Earth System Model
 Representing the Integrated Water Cycle in Community Earth System Model Hong-Yi Li, L. Ruby Leung, Maoyi Huang, Nathalie Voisin, Teklu Tesfa, Mohamad Hejazi, and Lu Liu Pacific Northwest National Laboratory
Regionalization of SWAT Model Parameters for Use in Ungauged Watersheds
 Water 21, 2, 849-871; doi:1.339/w24849 OPEN ACCESS water ISSN 273-4441 www.mdpi.com/journal/water Article Regionalization of SWAT Model Parameters for Use in Ungauged Watersheds Margaret W. Gitau 1, *and
Modelling of the Hydrology, Soil Erosion and Sediment transport processes in the Lake Tana Catchments of Blue Nile River Basin, Ethiopia
 Modelling of the Hydrology, Soil Erosion and Sediment transport processes in the Lake Tana Catchments of Blue Nile River Basin, Ethiopia Combining Field Data, Mathematical Models and Geographic Information
EVALUATION OF ArcSWAT MODEL FOR STREAMFLOW SIMULATION
 EVALUATION OF ArcSWAT MODEL FOR STREAMFLOW SIMULATION 212 International SWAT Conference By Arbind K. Verma 1 and Madan K.Jha 2 1. Assistant Professor, SASRD, Nagaland University, Ngaland (India) 2. Professor,
Application of SWAT for Water Quality Modeling of the Caddo Lake Watershed, TX
 Application of SWAT for Water Quality Modeling of the Caddo Lake Watershed, TX Kendra Riebschleager, M.S., E.I.T. August 5, 2009 Espey Consultants, Inc. 3809 S. 2 nd Street, B-300 Austin, TX 78704 512.326.5659
TECHNICAL NOTE: ESTIMATION OF FRESH WATER INFLOW TO BAYS FROM GAGED AND UNGAGED WATERSHEDS. T. Lee, R. Srinivasan, J. Moon, N.
 TECHNICAL NOTE: ESTIMATION OF FRESH WATER INFLOW TO BAYS FROM GAGED AND UNGAGED WATERSHEDS T. Lee, R. Srinivasan, J. Moon, N. Omani ABSTRACT. The long term estimation of fresh water inflow to coastal bays
The Fourth Assessment of the Intergovernmental
 Hydrologic Characterization of the Koshi Basin and the Impact of Climate Change Luna Bharati, Pabitra Gurung and Priyantha Jayakody Luna Bharati Pabitra Gurung Priyantha Jayakody Abstract: Assessment of
Effects of land use change on the water resources of the Basoda basin using the SWAT model
 INDIAN INSTITUTE OF TECHNOLOGY ROORKEE Effects of land use change on the water resources of the Basoda basin using the SWAT model By Santosh S. Palmate* 1 (Ph.D. Student) Paul D. Wagner 2 (Postdoctoral
The effects of the short-term Brazilian sugarcane expansion in stream flow: Monte Mor basin case study
 The effects of the short-term Brazilian sugarcane expansion in stream flow: Monte Mor basin case study Hernandes, TAD; Scarpare, FV; Seabra, JEA; Duft, DG; Picoli, MCA; Walter, A Overview 12,000,000 10,000,000
Evaluation of future climate change impacts on hydrologic processes in the Peruvian Altiplano region using SWAT
 Evaluation of future climate change impacts on hydrologic processes in the Peruvian Altiplano region using SWAT Carlos Antonio Fernández-palomino (cafpxl@gmail.com) 1,2 ; Fred F. Hattermann 1 ; Waldo S
Water Resources Status in Danube River Basin. SWAT Conference_ Spain, Toledo June 2011
 Water Resources Status in Danube River Basin SWAT Conference_ Spain, Toledo June 2011 Objectives Objectives Building and calibratîng a hydrologic model of Danube Basin Using SWAT and SWAT CUP Quantifying
Cost-effective Allocation of Conservation Practices using Genetic Algorithm with SWAT
 Cost-effective Allocation of Conservation Practices using Genetic Algorithm with SWAT Manoj Jha Sergey Rabotyagov Philip W. Gassman Hongli Feng Todd Campbell Iowa State University, Ames, Iowa, USA Raccoon
GreenPlan Modeling Tool User Guidance
 GreenPlan Modeling Tool User Guidance Prepared by SAN FRANCISCO ESTUARY INSTITUTE 4911 Central Avenue, Richmond, CA 94804 Phone: 510-746-7334 (SFEI) Fax: 510-746-7300 www.sfei.org Table of Contents 1.
Proceedings of ASCE- Environment and Water Resources Institute Conference 2009
 Proceedings of ASCE- Environment and Water Resources Institute Conference 2009 A comparison of a SWAT model for the Cannonsville Watershed with and without Variable Source Area Hydrology Josh Woodbury
Calibrating the Soquel-Aptos PRMS Model to Streamflow Data Using PEST
 Calibrating the Soquel-Aptos PRMS Model to Streamflow Data Using PEST Cameron Tana Georgina King HydroMetrics Water Resources Inc. California Water Environmental and Modeling Forum 2015 Annual Meeting
CONTINUOUS RAINFALL-RUN OFF SIMULATION USING SMA ALGORITHM
 CONTINUOUS RAINFALL-RUN OFF SIMULATION USING SMA ALGORITHM INTRODUCTION Dr. R N Sankhua Director, NWA, CWC, Pune In this continuous rainfall-runoff simulation, we will perform a continuous or long-term
Toward a Great Lakes Watershed Ecological Sustainability Strategy (GLWESS): Modeling Workshop. Lansing, MI May 3, 2012
: Modeling Workshop. Lansing, MI May 3, 2012") Toward a Great Lakes Watershed Ecological Sustainability Strategy (GLWESS): Modeling Workshop Lansing, MI May 3, 2012 Presentation Outline Overview of ecological concerns General modeling overview How
Toward a Great Lakes Watershed Ecological Sustainability Strategy (GLWESS): Modeling Workshop Lansing, MI May 3, 2012 Presentation Outline Overview of ecological concerns General modeling overview How
Development of Urban Modeling Tools in SWAT
 29 International SWAT conference August 5-7 Boulder, CO Development of Urban Modeling Tools in SWAT J. Jeong, N. Kannan, J. G. Arnold, R. Glick, L. Gosselink, R. Srinivasan LOGO Tasks in urban SWAT project
A comparative study of the methods for estimating streamflow at ungauged sites
 22nd International Congress on Modelling and Simulation, Hobart, Tasmania, Australia, 3 to 8 December 2017 mssanz.org.au/modsim2017 A comparative study of the methods for estimating streamflow at ungauged
Model to assess the impacts of external drivers on the hydrology of the Ganges River Basin
 76 Evolving Water Resources Systems: Understanding, Predicting and Managing Water Society Interactions Proceedings of ICWRS2014, Bologna, Italy, June 2014 (IAHS Publ. 364, 2014). Model to assess the impacts
Study of Hydrology based on Climate Changes Simulation Using SWAT Model At Jatiluhur Reservoir Catchment Area
 Study of Hydrology based on Climate Changes Simulation Using SWAT Model At Jatiluhur Reservoir Catchment Area Budi Darmawan Supatmanto 1, Sri Malahayati Yusuf 2, Florentinus Heru Widodo 1, Tri Handoko
Anthropogenic and climate change contributions to uncertainties in hydrological modeling of sustainable water supply
 Anthropogenic and climate change contributions to uncertainties in hydrological modeling of sustainable water supply Roman Corobov The Republic of Moldova Several words about Moldova The Republic of Moldova
Mapping Groundwater Recharge Rates Under Multiple Future Climate Scenarios in Southwest Michigan
 http://mi.water.usgs.gov/reports/images/cover_med01_4227.jpg Mapping Groundwater Recharge Rates Under Multiple Future Climate Scenarios in Southwest Michigan Glenn O Neil Institute of Water Research Michigan
Turbidity Monitoring Under Ice Cover in NYC DEP
 Turbidity Monitoring Under Ice Cover in NYC DEP Reducing equifinality by using spatial wetness information and reducing complexity in the SWAT-Hillslope model Linh Hoang 1,2, Elliot M. Schneiderman 2,
UNCERTAINTY ISSUES IN SWAT MODEL CALIBRATION AT CIRASEA WATERSHED, INDONESIA.
 UNCERTAINTY ISSUES IN SWAT MODEL CALIBRATION AT CIRASEA WATERSHED, INDONESIA. Sri Malahayati Yusuf 1 Kukuh Murtilaksono 2 1 PhD Student of Watershed Management Major, Bogor Agricultural University 2 Department
Parameter Calibration of SWAT Hydrology and Water Quality Focusing on Long-term Drought Periods
 2017 SWAT June 28-30, 2017 Centrum Wodne SGGW, Warsaw, Poland Theme I3 Environmental Applications Room: Assembly Hall 2 2017 International SWAT Conference Parameter Calibration of SWAT Hydrology and Water
Evaluation of climate and land use changes on hydrologic processes in the Salt River Basin, Missouri, United States
 Evaluation of climate and land use changes on hydrologic processes in the Salt River Basin, Missouri, United States Quang Phung a, Thompson Allen a *, Claire Baffaut b, Christine Costello a, John Sadler
The Texas A&M University and U.S. Bureau of Reclamation Hydrologic Modeling Inventory (HMI) Questionnaire
 Questionnaire") The Texas A&M University and U.S. Bureau of Reclamation Hydrologic Modeling Inventory (HMI) Questionnaire May 4, 2010 Name of Model, Date, Version Number Dynamic Watershed Simulation Model (DWSM) 2002
The Texas A&M University and U.S. Bureau of Reclamation Hydrologic Modeling Inventory (HMI) Questionnaire May 4, 2010 Name of Model, Date, Version Number Dynamic Watershed Simulation Model (DWSM) 2002
TMDL Data Requirements for Agricultural Watersheds
 This is not a peer-reviewed article. Pp. 408-415 in Total Maximum Daily Load (TMDL) Environmental Regulations: Proceedings of the March 11-13, 2002 Conference, (Fort Worth, Texas, USA) Publication Date
Assessment of StreamFlow Using SWAT Hydrological Model
 Assessment of StreamFlow Using SWAT Hydrological Model Sreelakshmi C.M. 1 Dr.K.Varija 2 1 M.Tech student, Applied Mechanics and Hydraulics, NITK, Surathkal,India 2 Associate Professor, Department of Applied
SNAMP water research. Topics covered
 SNAMP water research SNAMP water team UC Merced Topics covered Objectives, goals & overview What & why the water component of SNAMP Pre-treatment Observations Water Quality Water Quantity Modeling & Scenarios:
Simulation of stream discharge from an agroforestry catchment in NW Spain using the SWAT model
 Simulation of stream discharge from an agroforestry catchment in NW Spain using the SWAT model Rodríguez-Blanco, M.L. 1, 2, Taboada-Castro, M.M. 1, Arias, R. 1, Taboada-Castro, M.T. 1, Nunes, J.P. 2, Rial-Rivas,
Application of the SWAT Model to the Hii River Basin, Shimane Prefecture, Japan
 Application of the SWAT Model to the Hii River Basin, Shimane Prefecture, Japan H. Somura, I. Takeda, Y. Mori Shimane University D. Hoffman Blackland Research and Extension Center J. Arnold Grassland Soil
Hydrology and Water Management. Dr. Mujahid Khan, UET Peshawar
 Hydrology and Water Management Dr. Mujahid Khan, UET Peshawar Course Outline Hydrologic Cycle and its Processes Water Balance Approach Estimation and Analysis of Precipitation Data Infiltration and Runoff
Protocol for Calibration of River Basins using SWAT
 Improving Life through Science and Technology. Protocol for Calibration of River Basins using SWAT N.Kannan Co authors: M. White, C. Santhi, X. Wang, J.G. Arnold, and M. Di Luzio The Context Insufficient
Hydrologic Modeling of Cedar Creek Watershed using SWAT
 North Central Texas Water Quality Project Hydrologic Modeling of Cedar Creek Watershed using SWAT Balaji Narasimhan, Raghavan Srinivasan, Steve Bernardz and Mark Ernst Cedar Creek Reservoir Total Watershed
Term Project. NFIE-River: Cross section approximations for hydraulic channel routing model in the San Antonio and Guadalupe River Basins.
 Flood Forecasting Spring - 2015 Due Friday 05/08/2015 Alfredo Hijar Term Project NFIE-River: Cross section approximations for hydraulic channel routing model in the San Antonio and Guadalupe River Basins.
Modelling Ecosystem Services in Ontario and Canada Wanhong Yang
 Modelling Ecosystem Services in Ontario and Canada Wanhong Yang November 20, 2014 Wetland Ecological Goods and Services Valuation Project (LSCF Round 4, 2009) Objective: Utilizing the collaborative expertise
Evaluation of Mixed Forest Evapotranspiration and Soil Moisture using Measured and SWAT Simulated Results in a Hillslope Watershed
 KONKUK UNIVERSITY Evaluation of Mixed Forest Evapotranspiration and Soil Moisture using Measured and SWAT Simulated Results in a Hillslope Watershed 5 August 2010 JOH, Hyung-Kyung Graduate Student LEE,
Jian Liu, Tamie L. Veith, Amy S. Collick, Peter J. A. Kleinman, Douglas B. Beegle, and Ray B.
 Jian Liu, Tamie L. Veith, Amy S. Collick, Peter J. A. Kleinman, Douglas B. Beegle, and Ray B. Bryant Seasonal manure application timing and storage effects on field and watershed level phosphorus losses
Event and Continuous Hydrological Modeling with HEC- HMS: A Review Study
 Event and Continuous Hydrological Modeling with HEC- HMS: A Review Study Sonu Duhan *, Mohit Kumar # * M.E (Water Resources Engineering) Civil Engineering Student, PEC University Of Technology, Chandigarh,
APPLICATION OF THE SWAT (SOIL AND WATER ASSESSMENT TOOL) MODEL IN THE RONNEA CATCHMENT OF SWEDEN
 MODEL IN THE RONNEA CATCHMENT OF SWEDEN") Global NEST Journal, Vol 7, No 3, pp 5-57, 5 Copyright 5 Global NEST Printed in Greece. All rights reserved APPLICATION OF THE SWAT (SOIL AND WATER ASSESSMENT TOOL) MODEL IN THE RONNEA CATCHMENT OF SWEDEN
Global NEST Journal, Vol 7, No 3, pp 5-57, 5 Copyright 5 Global NEST Printed in Greece. All rights reserved APPLICATION OF THE SWAT (SOIL AND WATER ASSESSMENT TOOL) MODEL IN THE RONNEA CATCHMENT OF SWEDEN
R. Srinivasan, J.H. Jacobs, J.W. Stuth, J. Angerer, R. Kaithio and N. Clarke
 Impacts of reforestation policy and agro-forestry technology on the environment and food security in the Upper Tana river basin of Kenya R. Srinivasan, J.H. Jacobs, J.W. Stuth, J. Angerer, R. Kaithio and
Estimation of Actual Evapotranspiration at Regional Annual scale using SWAT
 Estimation of Actual Evapotranspiration at Regional Annual scale using SWAT Azizallah Izady Ph.D student of Water Resources Engineering Department of Water Engineering, Faculty of Agriculture, Ferdowsi
Comparative modelling of large watershed responses between Walnut Gulch, Arizona, USA, and Matape, Sonora, Mexico
 Variability in Stream Erosion and Sediment Transport (Proceedings of the Canberra Symposium, December 1994). IAHS Pubi. no. 224, 1994. 351 Comparative modelling of large watershed responses between Walnut
Surface Soil Moisture Assimilation with SWAT
 Surface Soil Moisture Assimilation with SWAT Eunjin Han, Venatesh Merwade School of Civil Engineering, Purdue University, West Lafayette, IN, USA Gary C. Heathman USDA-ARS, National Soil Erosion Research
BAEN 673 / February 18, 2016 Hydrologic Processes
 BAEN 673 / February 18, 2016 Hydrologic Processes Assignment: HW#7 Next class lecture in AEPM 104 Today s topics SWAT exercise #2 The SWAT model review paper Hydrologic processes The Hydrologic Processes
Definitions 3/16/2010. GG22A: GEOSPHERE & HYDROSPHERE Hydrology
 GG22A: GEOSPHERE & HYDROSPHERE Hydrology Definitions Streamflow volume of water in a river passing a defined point over a specific time period = VxA discharge m 3 s -1 Runoff excess precipitation - precipitation
Influence of evapotranspiration estimates on the water balance of sugarcane cropping system in the Hawaiian island of Maui
 Influence of evapotranspiration estimates on the water balance of sugarcane cropping system in the Hawaiian island of Maui Javier Osorio, Jaehak Jeong & Jeff Arnold Presented by: Allan Jones 2013 International
Climate Change and Drought Scenarios for Water Supply Planning
 Climate Change and Drought Scenarios for Water Supply Planning Analyses of the sensitivity of water availability (surface water and groundwater) and water demand to climate change and drought will be conducted
Forests and Water in the Sierra Nevada. Roger Bales, Sierra Nevada Research Institute, UC Merced
 Forests and Water in the Sierra Nevada Roger Bales, Sierra Nevada Research Institute, UC Merced Some motivating points Water is the highest-value ecosystem service associated with Sierra Nevada conifer
Prediction of water resources in the Chao Phraya River Basin, Thailand
 Hydrology in a Changing World: Environmental and Human Dimensions Proceedings of FRIEND-Water 2014, Montpellier, France, October 2014 (IAHS Publ. 363, 2014). 151 Prediction of water resources in the Chao
Inside of forest (for example) Research Flow
 Research Flow") Study on Relationship between Watershed Hydrology and Lake Water Environment by the Soil and Water Assessment Tool (SWAT) Shimane University Hiroaki SOMURA Watershed degradation + Global warming Background
Study on Relationship between Watershed Hydrology and Lake Water Environment by the Soil and Water Assessment Tool (SWAT) Shimane University Hiroaki SOMURA Watershed degradation + Global warming Background
Effect of forest management on water yields & other ecosystem services in Sierra Nevada forests UCB/UC Merced/UCANR project
 Effect of forest management on water yields & other ecosystem services in Sierra Nevada forests UCB/UC Merced/UCANR project Some motivating points Water is the highest-value ecosystem service associated
Water Quality Impacts of Agricultural BMPs in a Suburban Watershed in New Jersey
 Water Quality Impacts of Agricultural BMPs in a Suburban Watershed in New Jersey Zeyuan Qiu Lizhong Wang Department of Chemistry and Environmental Science New Jersey Institute of Technology Newark, NJ
2
 1 2 3 4 5 6 The program is designed for surface water hydrology simulation. It includes components for representing precipitation, evaporation, and snowmelt; the atmospheric conditions over a watershed.
A simple model for low flow forecasting in Mediterranean streams
 European Water 57: 337-343, 2017. 2017 E.W. Publications A simple model for low flow forecasting in Mediterranean streams K. Risva 1, D. Nikolopoulos 2, A. Efstratiadis 2 and I. Nalbantis 1* 1 School of
Parallelizing SWAT Calibration in Windows using SUFI2 Program,
 Parallelizing SWAT Calibration in Windows using SUFI2 Program, Lessons learned from Black Sea Catchment study Elham Rouholahnejad elham.rouholahnejad@eawag.ch 2012 International SWAT Conference July 16-20,
An Assessment of Climate Change Impacts on Streamflows in the Musi Catchment, India
 20th International Congress on Modelling and Simulation, Adelaide, Australia, 1 6 December 2013 www.mssanz.org.au/modsim2013 An Assessment of Climate Change Impacts on Streamflows in the Musi Catchment,
Models Overview: Purposes and Limitations
 Models Overview: Purposes and Limitations Pollutant load originates from: Point-source discharges (NPDES facilities) Info is available on the discharges (DMRs, etc.) Some are steady-flow, others are precip-driven
Estimating Groundwater Recharge within Wisconsin s Central Sands
 Estimating Groundwater Recharge within Wisconsin s Central Sands Adam Freihoefer and Robert Smail Wisconsin Department of Natural Resources [study objective] Identify a defensible approach to quantify
Modeling Sediment and Nutrient Loads Input to Great Lakes and Effects of Agricultural Conservation Practices on Water Quality
 Modeling Sediment and Nutrient Loads Input to Great Lakes and Effects of Agricultural Conservation Practices on Water Quality C. Santhi and CEAP National Assessment Team Texas A&M University System, Temple,
SIMULATING HYDROLOGICAL ALTERATIONS IN THE CONDITIONS OF LIMITED DATA: LESSONS FROM THE WALAWE RIVER BASIN IN SRI LANKA
 SIMULATING HYDROLOGICAL ALTERATIONS IN THE CONDITIONS OF LIMITED DATA: LESSONS FROM THE WALAWE RIVER BASIN IN SRI LANKA Neelanga Weragala 1) and Vladimir Smakhtin 2) International Water Management Institute
What is runoff? Runoff. Runoff is often defined as the portion of rainfall, that runs over and under the soil surface toward the stream
 What is runoff? Runoff Runoff is often defined as the portion of rainfall, that runs over and under the soil surface toward the stream 1 COMPONENTS OF Runoff or STREAM FLOW 2 Cont. The types of runoff
Soil and Water Assessment Tool. R. Srinivasan Texas A&M University
 Soil and Water Assessment Tool R. Srinivasan Texas A&M University Model Philosophy Readily available input Physically based Comprehensive Process Interactions Simulate Management ARS Modeling History Time
CHAPTER ONE : INTRODUCTION
 CHAPTER ONE : INTRODUCTION WHAT IS THE HYDROLOGY? The Hydrology means the science of water. It is the science that deals with the occurrence, circulation and distribution of water of the earth and earth
Topography and the Spatial Distribution of Groundwater Recharge and Evapotranspiration:
 Topography and the Spatial Distribution of Groundwater Recharge and Evapotranspiration: A Need to Revisit Distributed Water Budget Analysis when Assessing Impacts to Ecological Systems. By M.A. Marchildon,
Rapid National Model Assessments to Support US Conservation Policy Planning Mike White
 Rapid National Model Assessments to Support US Conservation Policy Planning Mike White USDA-ARS Grassland, Soil and Water Research Laboratory, Temple, TX 1 Topics Current National Assessments Future National
Uncertainty in Hydrologic Modelling for PMF Estimation
 Uncertainty in Hydrologic Modelling for PMF Estimation Introduction Estimation of the Probable Maximum Flood (PMF) has become a core component of the hydrotechnical design of dam structures 1. There is
TOPMODEL. Download Information Availability: Nonproprietary, (http://www.es.lancs.ac.uk/hfdg/topmodel.html) Cost: None for non-commercial uses.
 Cost: None for non-commercial uses.") TOPMODEL Contact Information Keith Beven Department of Environmental Science Institute of Environmental and Natural Sciences Lancaster University Lancaster LA1 4YQ United Kingdom +44 (0)1524 593892 K.Beven@lancaster.ac.uk
TOPMODEL Contact Information Keith Beven Department of Environmental Science Institute of Environmental and Natural Sciences Lancaster University Lancaster LA1 4YQ United Kingdom +44 (0)1524 593892 K.Beven@lancaster.ac.uk
Calibration and sensitivity analysis of SWAT for a small forested catchment, northcentral
 Calibration and sensitivity analysis of SWAT for a small forested catchment, northcentral Portugal Rial-Rivas, M.E. 1 ; Santos, J. 1 ;Bernard-Jannin L. 1 ; Boulet, A.K. 1 ; Coelho, C.O.A. 1 ; Ferreira,
History of Model Development at Temple, Texas. J. R. Williams and J. G. Arnold
 History of Model Development at Temple, Texas J. R. Williams and J. G. Arnold INTRODUCTION Then Model development at Temple A long history (1937-present) Many scientists participating in: Data collection
WMS Tools For Computing Hydrologic Modeling Parameters
 WMS Tools For Computing Hydrologic Modeling Parameters Lesson 9 9-1 Objectives Use the drainage coverage as a basis for geometric parameters as well as overlaying coverages to compute important hydrologic
Assessment of SWAT Potential Evapotranspiration Options and data-dependence for Estimating Actual Evapotranspiration and Streamflow
 2011 International SWAT Conference Toledo, Spain June 15-17, 2011 Assessment of SWAT Potential Evapotranspiration Options and data-dependence for Estimating Actual Evapotranspiration and Streamflow Aouissi
Toward an Improvement of the Hydrological Performance of the SWAT Model under Snow Cover and during Snowmelt
 Toward an Improvement of the Hydrological Performance of the SWAT Model under Snow Cover and during Snowmelt Étienne Lévesque, Nicolas Beauchamp geau, Université Laval, Québec, Canada Ann van Griensven
National Agricultural Pesticide Risk Assessment (NAPRA) Web
 Web") The NAPRA Program 1 Acushla Antony 2, Indrajeet Chaubey, Bernard Engel, Natalie Carroll 2 Respectively, Graduate student, Professor, Professor and Head, and Professor, Department of Agricultural and Biological
The NAPRA Program 1 Acushla Antony 2, Indrajeet Chaubey, Bernard Engel, Natalie Carroll 2 Respectively, Graduate student, Professor, Professor and Head, and Professor, Department of Agricultural and Biological
Distribution Restriction Statement Approved for public release; distribution is unlimited.
 CECW-EH-Y Regulation No. 1110-2-1464 Department of the Army U.S. Army Corps of Engineers Washington, DC 20314-1000 Engineering and Design HYDROLOGIC ANALYSIS OF WATERSHED RUNOFF Distribution Restriction
SWAT UNGAUGED: HYDROLOGICAL BUDGET
 SWAT UNGAUGED: HYDROLOGICAL BUDGET AND CROP YIELD PREDICTIONS IN THE UPPER MISSISSIPPI RIVER BASIN R. Srinivasan, X. Zhang, J. Arnold ABSTRACT. Physically based, distributed hydrologic models are increasingly
M.L. Kavvas, Z. Q. Chen, M. Anderson, L. Liang, N. Ohara Hydrologic Research Laboratory, Civil and Environmental Engineering, UC Davis
 Assessment of the Restoration Activities on Water Balance and Water Quality at Last Chance Creek Watershed Using Watershed Environmental Hydrology (WEHY) Model M.L. Kavvas, Z. Q. Chen, M. Anderson, L.
Watershed Modeling and Landuse Change: A new approach. Chris Duffy Lele Shu Penn State University
 Watershed Modeling and Landuse Change: A new approach Chris Duffy Lele Shu Penn State University Issues Goals of the Study-> Watershed Context for LUC Develop a high resolution integrated hydrologic and
MODELING SEDIMENT AND PHOSPHORUS YIELDS USING THE HSPF MODEL IN THE DEEP HOLLOW WATERSHED, MISSISSIPPI
 MODELING SEDIMENT AND PHOSPHORUS YIELDS USING THE HSPF MODEL IN THE DEEP HOLLOW WATERSHED, MISSISSIPPI Jairo Diaz-Ramirez, James Martin, William McAnally, and Richard A. Rebich Outline Background Objectives
CHAPTER 4 DISCUSSION. Total Flow. For the study watershed, the water budget equation is defined as inflow equals
 CHAPTER 4 DISCUSSION Total Flow For the study watershed, the water budget equation is defined as inflow equals outflow minus any losses. Inflow consists of precipitation. Outflow consists of stream flow
Hydrological Modelling of Narmada basin in Central India using Soil and Water Assessment Tool (SWAT)
") Hydrological Modelling of Narmada basin in Central India using Soil and Water Assessment Tool (SWAT) T. Thomas, N. C. Ghosh, K. P. Sudheer National Institute of Hydrology, Roorkee (A Govt. of India Society
Hydrological Modelling of Narmada basin in Central India using Soil and Water Assessment Tool (SWAT) T. Thomas, N. C. Ghosh, K. P. Sudheer National Institute of Hydrology, Roorkee (A Govt. of India Society
Effects of climate, objective function and sample size on global sensitivity in a SWAT Model
 21st International Congress on Modelling and Simulation, Gold Coast, Australia, 29 Nov to 4 Dec 2015 www.mssanz.org.au/modsim2015 Effects of climate, objective function and sample size on global sensitivity
DEPARTMENT OF GEOGRAPHY POST GRADUATE GOVT. COLLEGE FOR GIRLS.SECTOR-11 CHANDIGARH CLASS-B.A.II PAPER-A RESOURCES AND ENVIRONMENT: WORLD PATTERNS
 DEPARTMENT OF GEOGRAPHY POST GRADUATE GOVT. COLLEGE FOR GIRLS.SECTOR-11 CHANDIGARH CLASS-B.A.II PAPER-A RESOURCES AND ENVIRONMENT: WORLD PATTERNS Hydrological cycle The sun, which drives the water cycle,
Retrospective analysis of hydrologic impacts in the Chesapeake Bay watershed
 Retrospective analysis of hydrologic impacts in the Chesapeake Bay watershed Harsh Beria1,3, Rob Burgholzer2, Venkat Sridhar3 Indian Institute of Technology Kharagpur, India & Summer intern Virginia Department
Ag Drainage Design Protocols and Current Technology
 Department of Agricultural and Biosystems Engineering Ag Drainage Design Protocols and Current Technology Matthew Helmers Dean s Professor, College of Ag. & Life Sciences Associate Professor, Dept. of
Simulation of Basin Runoff due to Rainfall and Snowmelt
 Simulation of Basin Runoff due to Rainfall and Snowmelt Zeinivand, H. 1, 2, F. De Smedt 1 and A. Bahremand 3 1 Department of Hydrology and Hydraulic Engineering, Vrije Universiteit Brussel, Brussels, Belgium